
Advanced Fusion and Empirical Mode Decomposition-Based Filtering Methods for Breathing Rate Estimation from Seismocardiogram Signals


Abstract
:1. Introduction
2. Database Used
3. SCG-Derived Respiration: Standard Methods
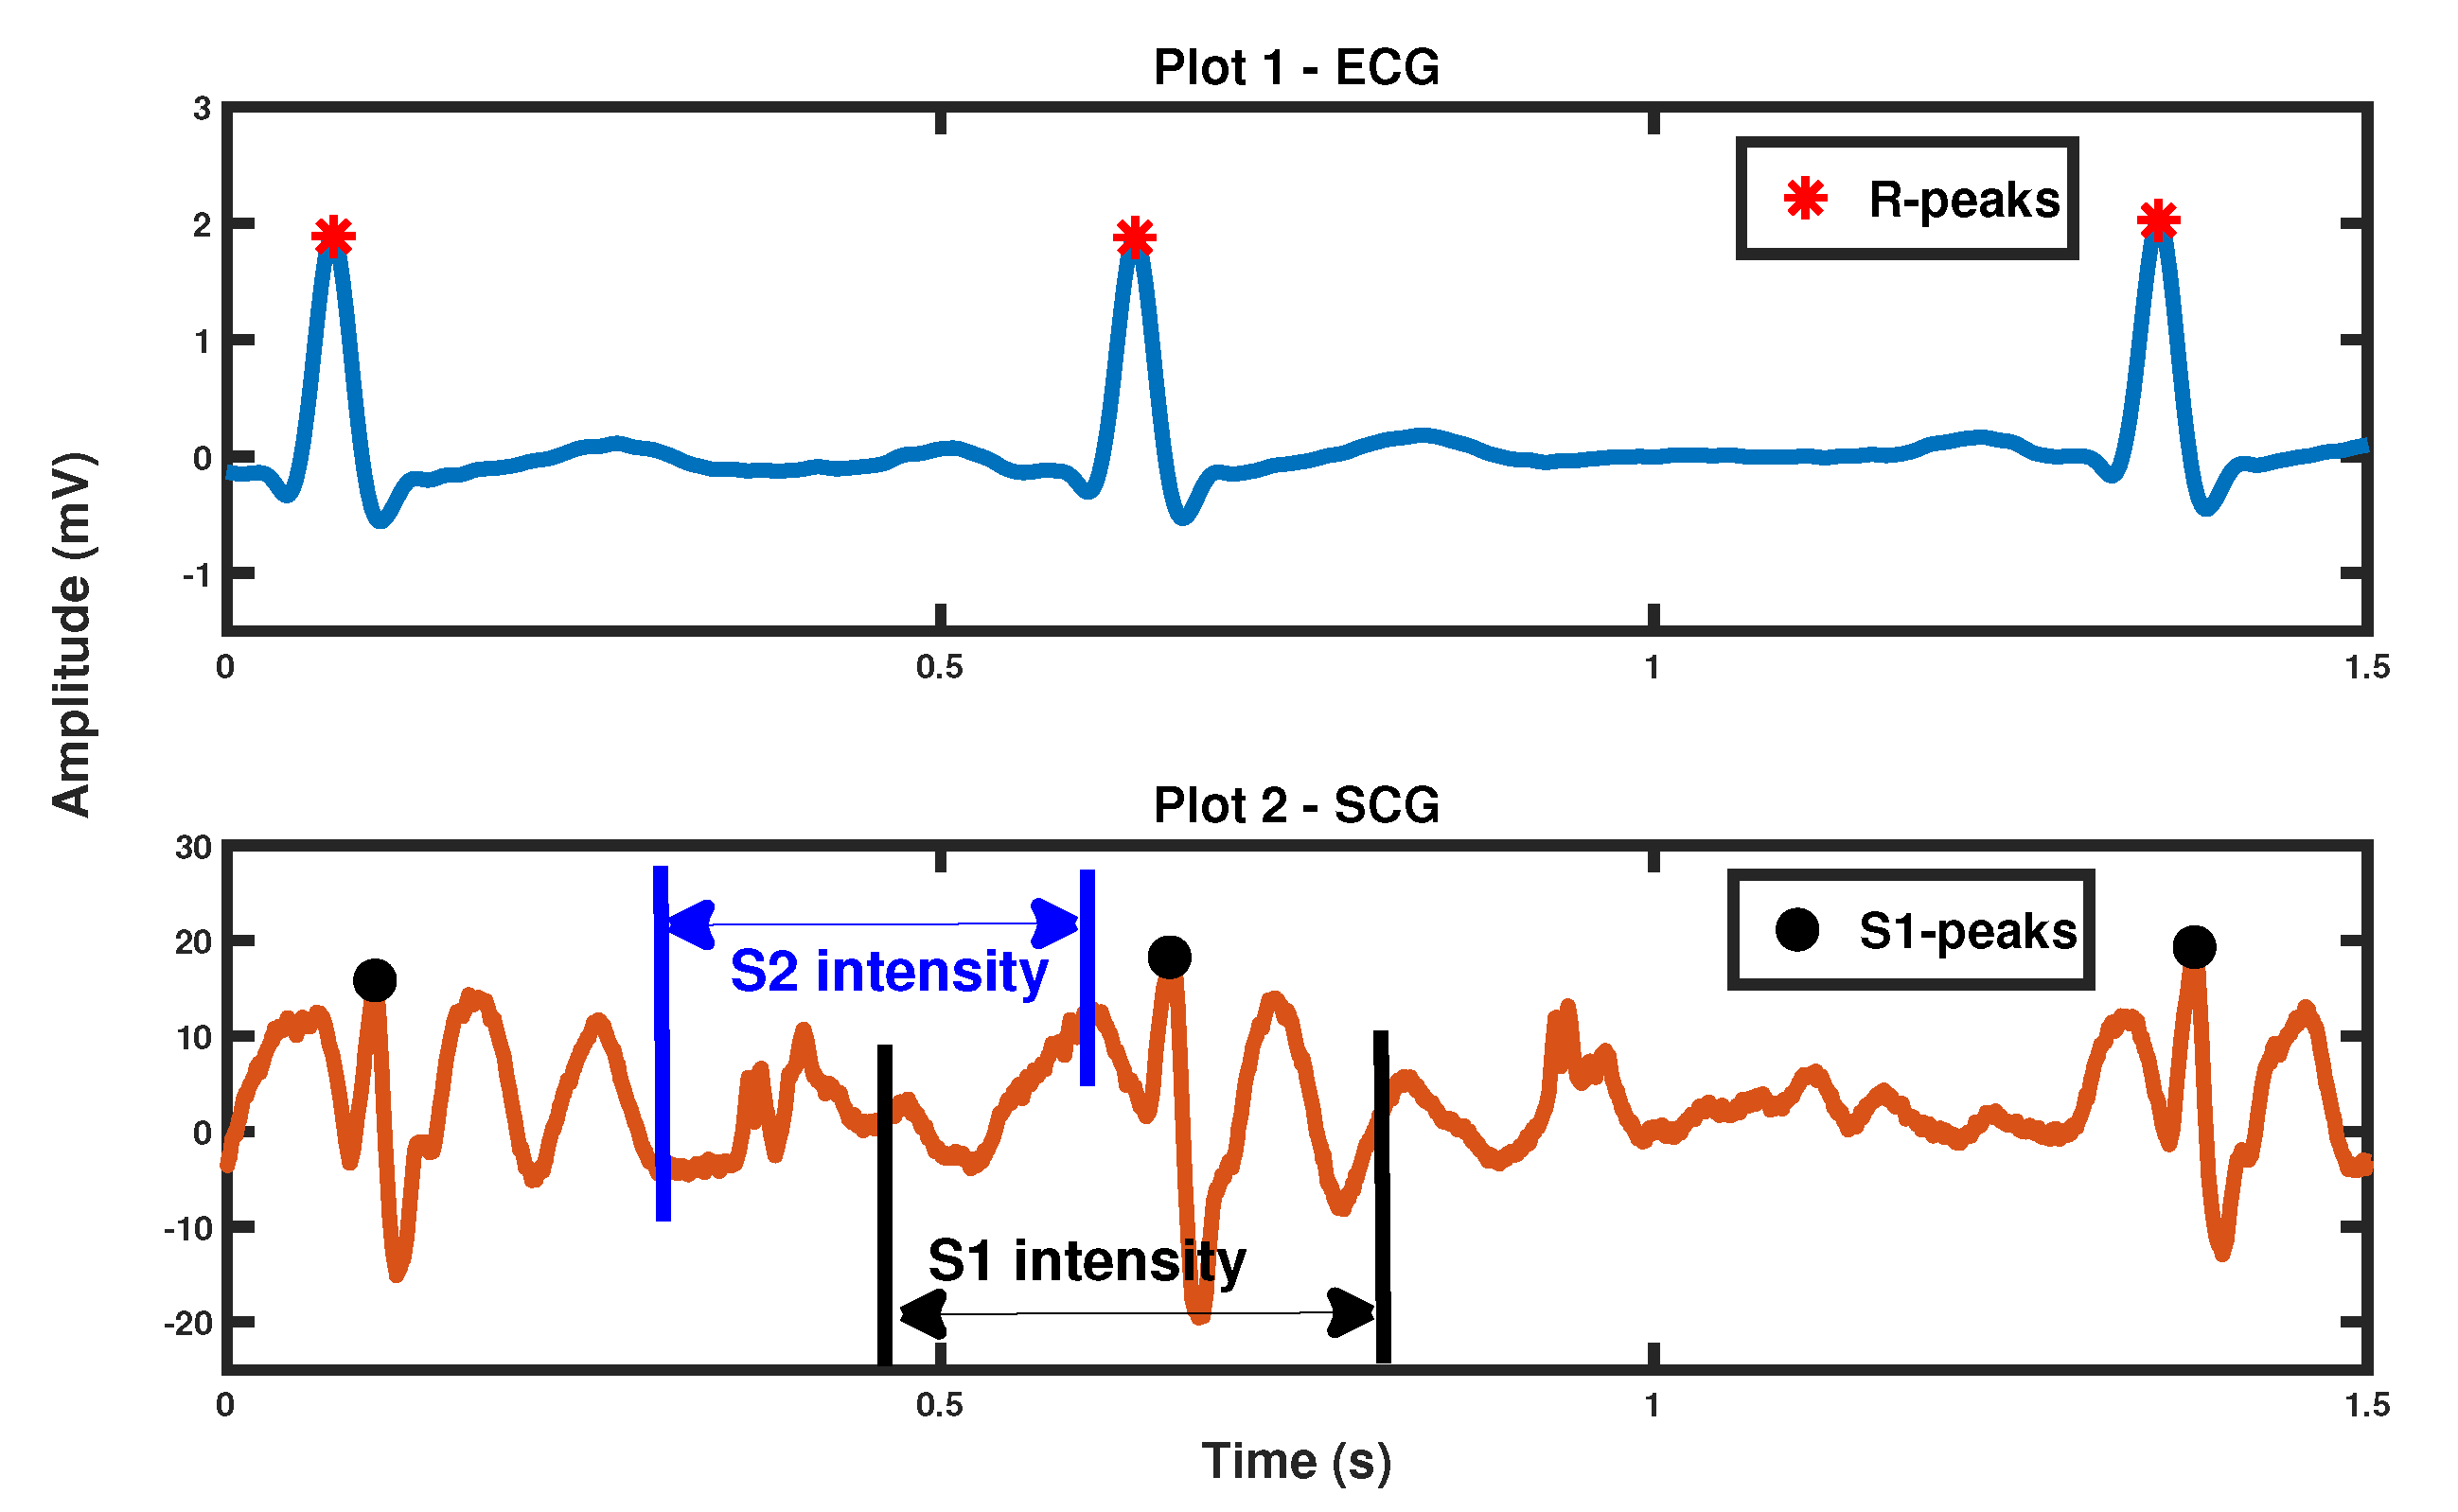
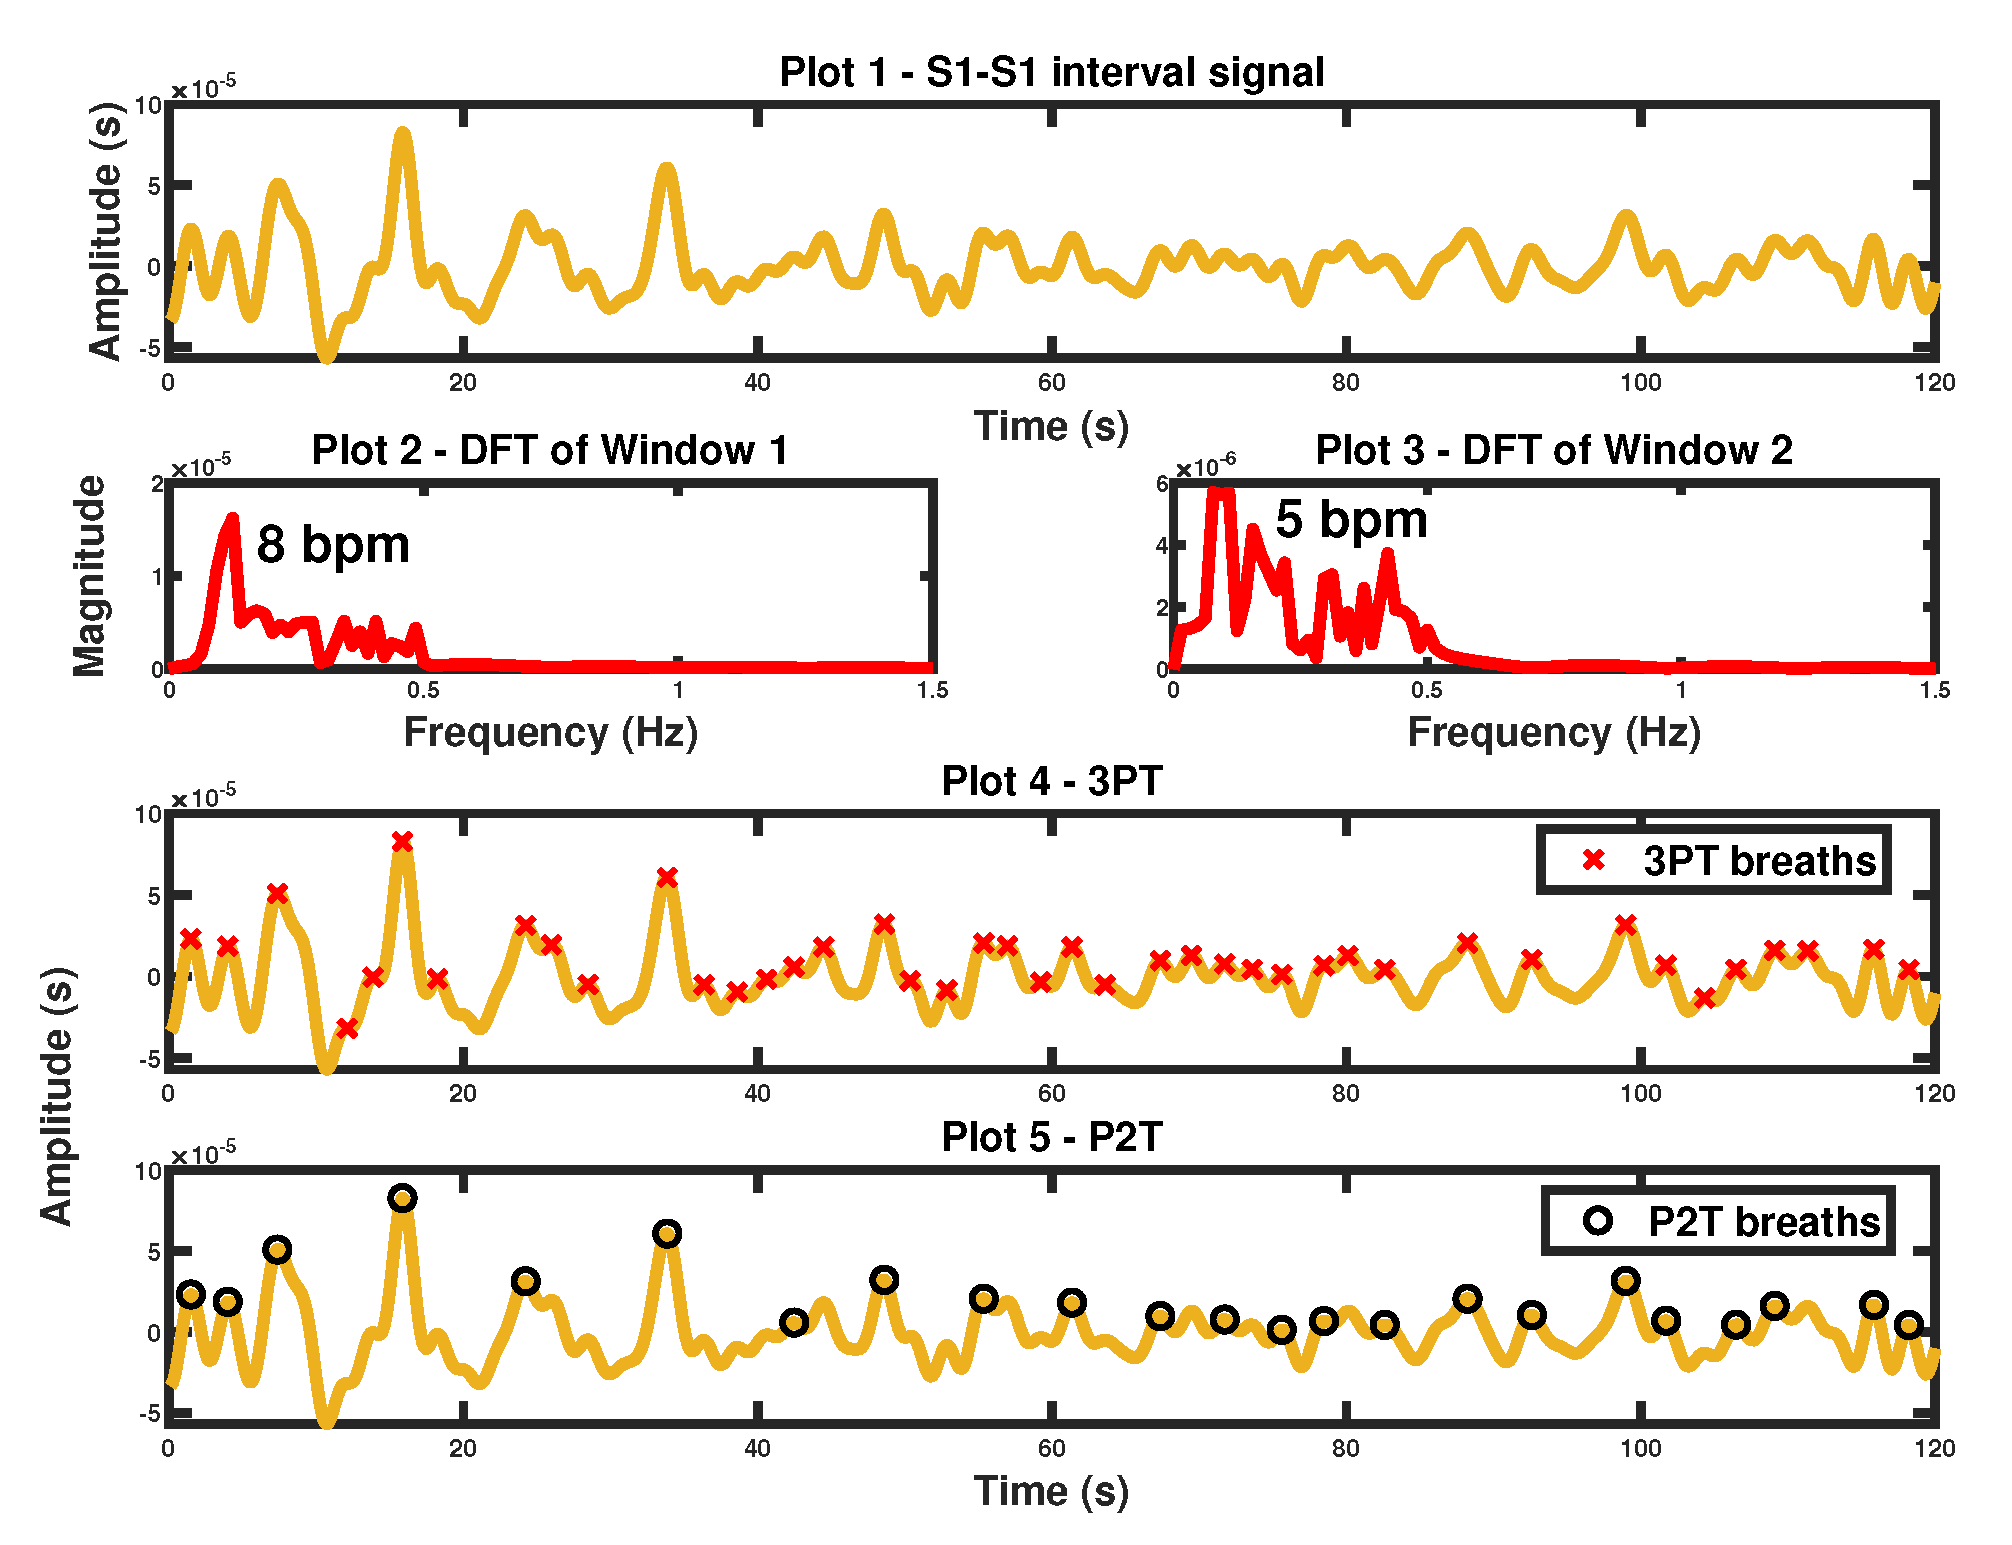
3.1. S1-S1 Interval Derived Respiratory Signal
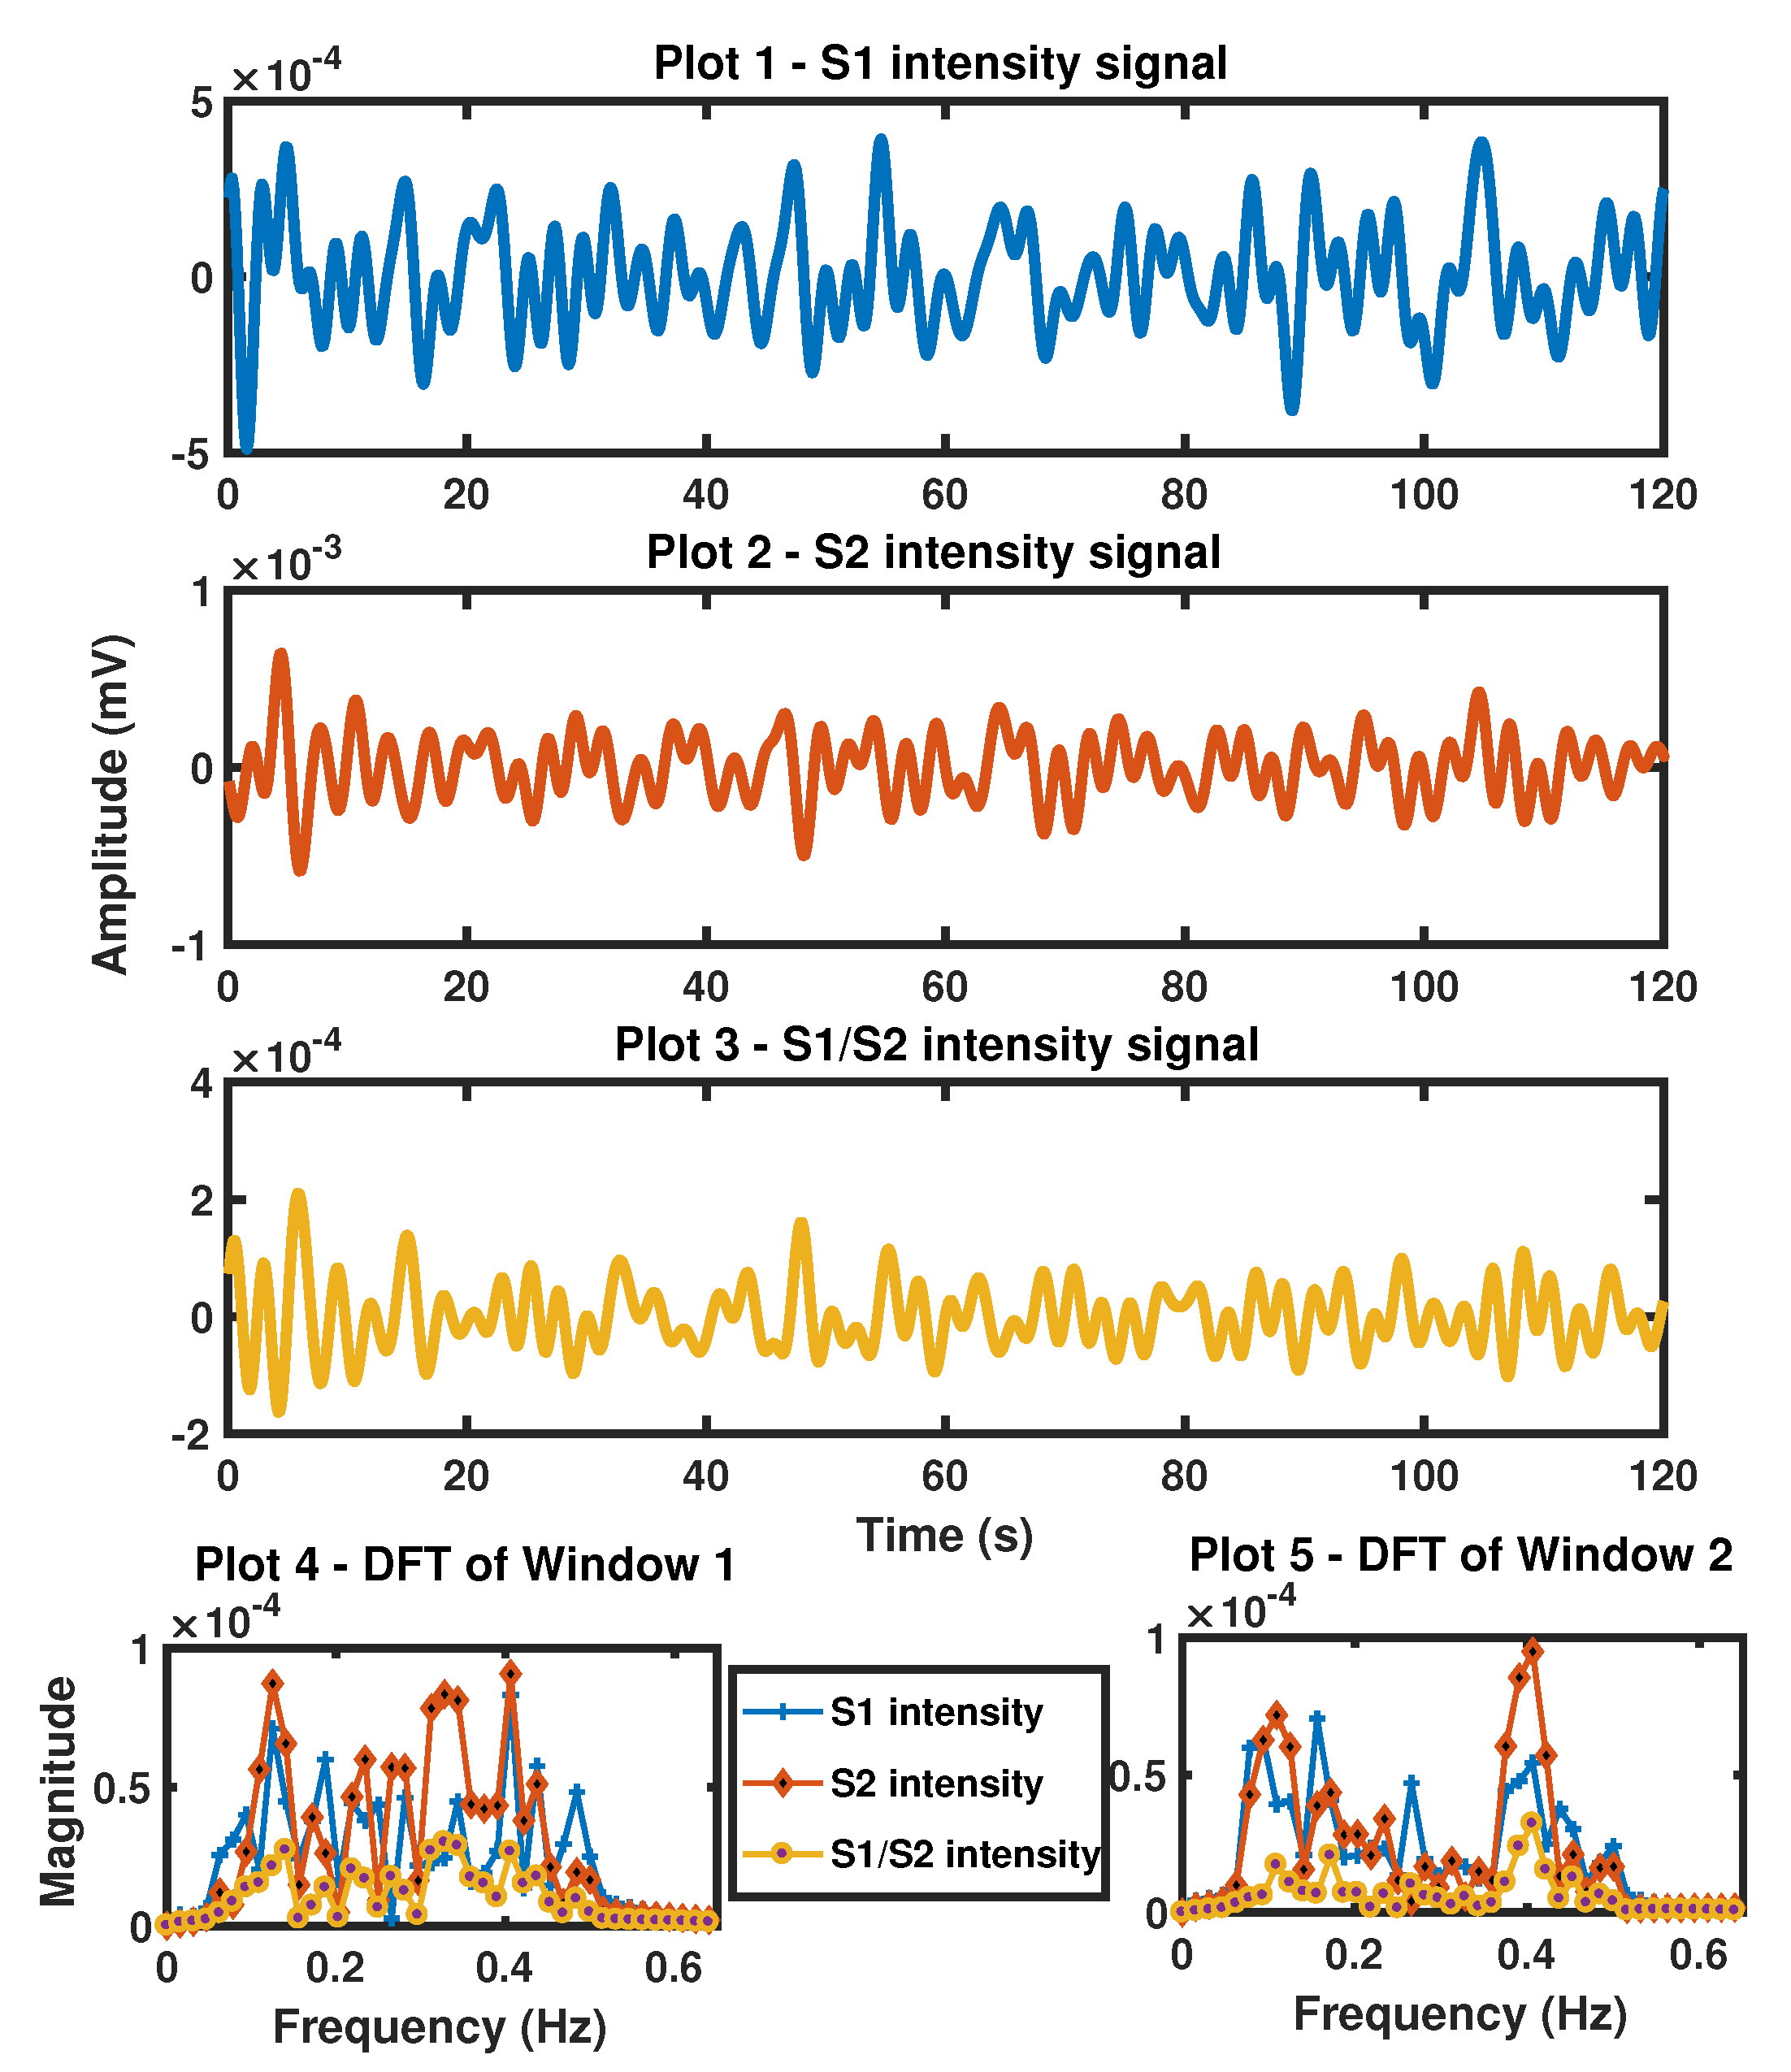
3.2. S1 Intensity, S2 Intensity Derived Respiratory Signal
4. SCG-Derived Respiratory Signal: Proposed Advanced Methods
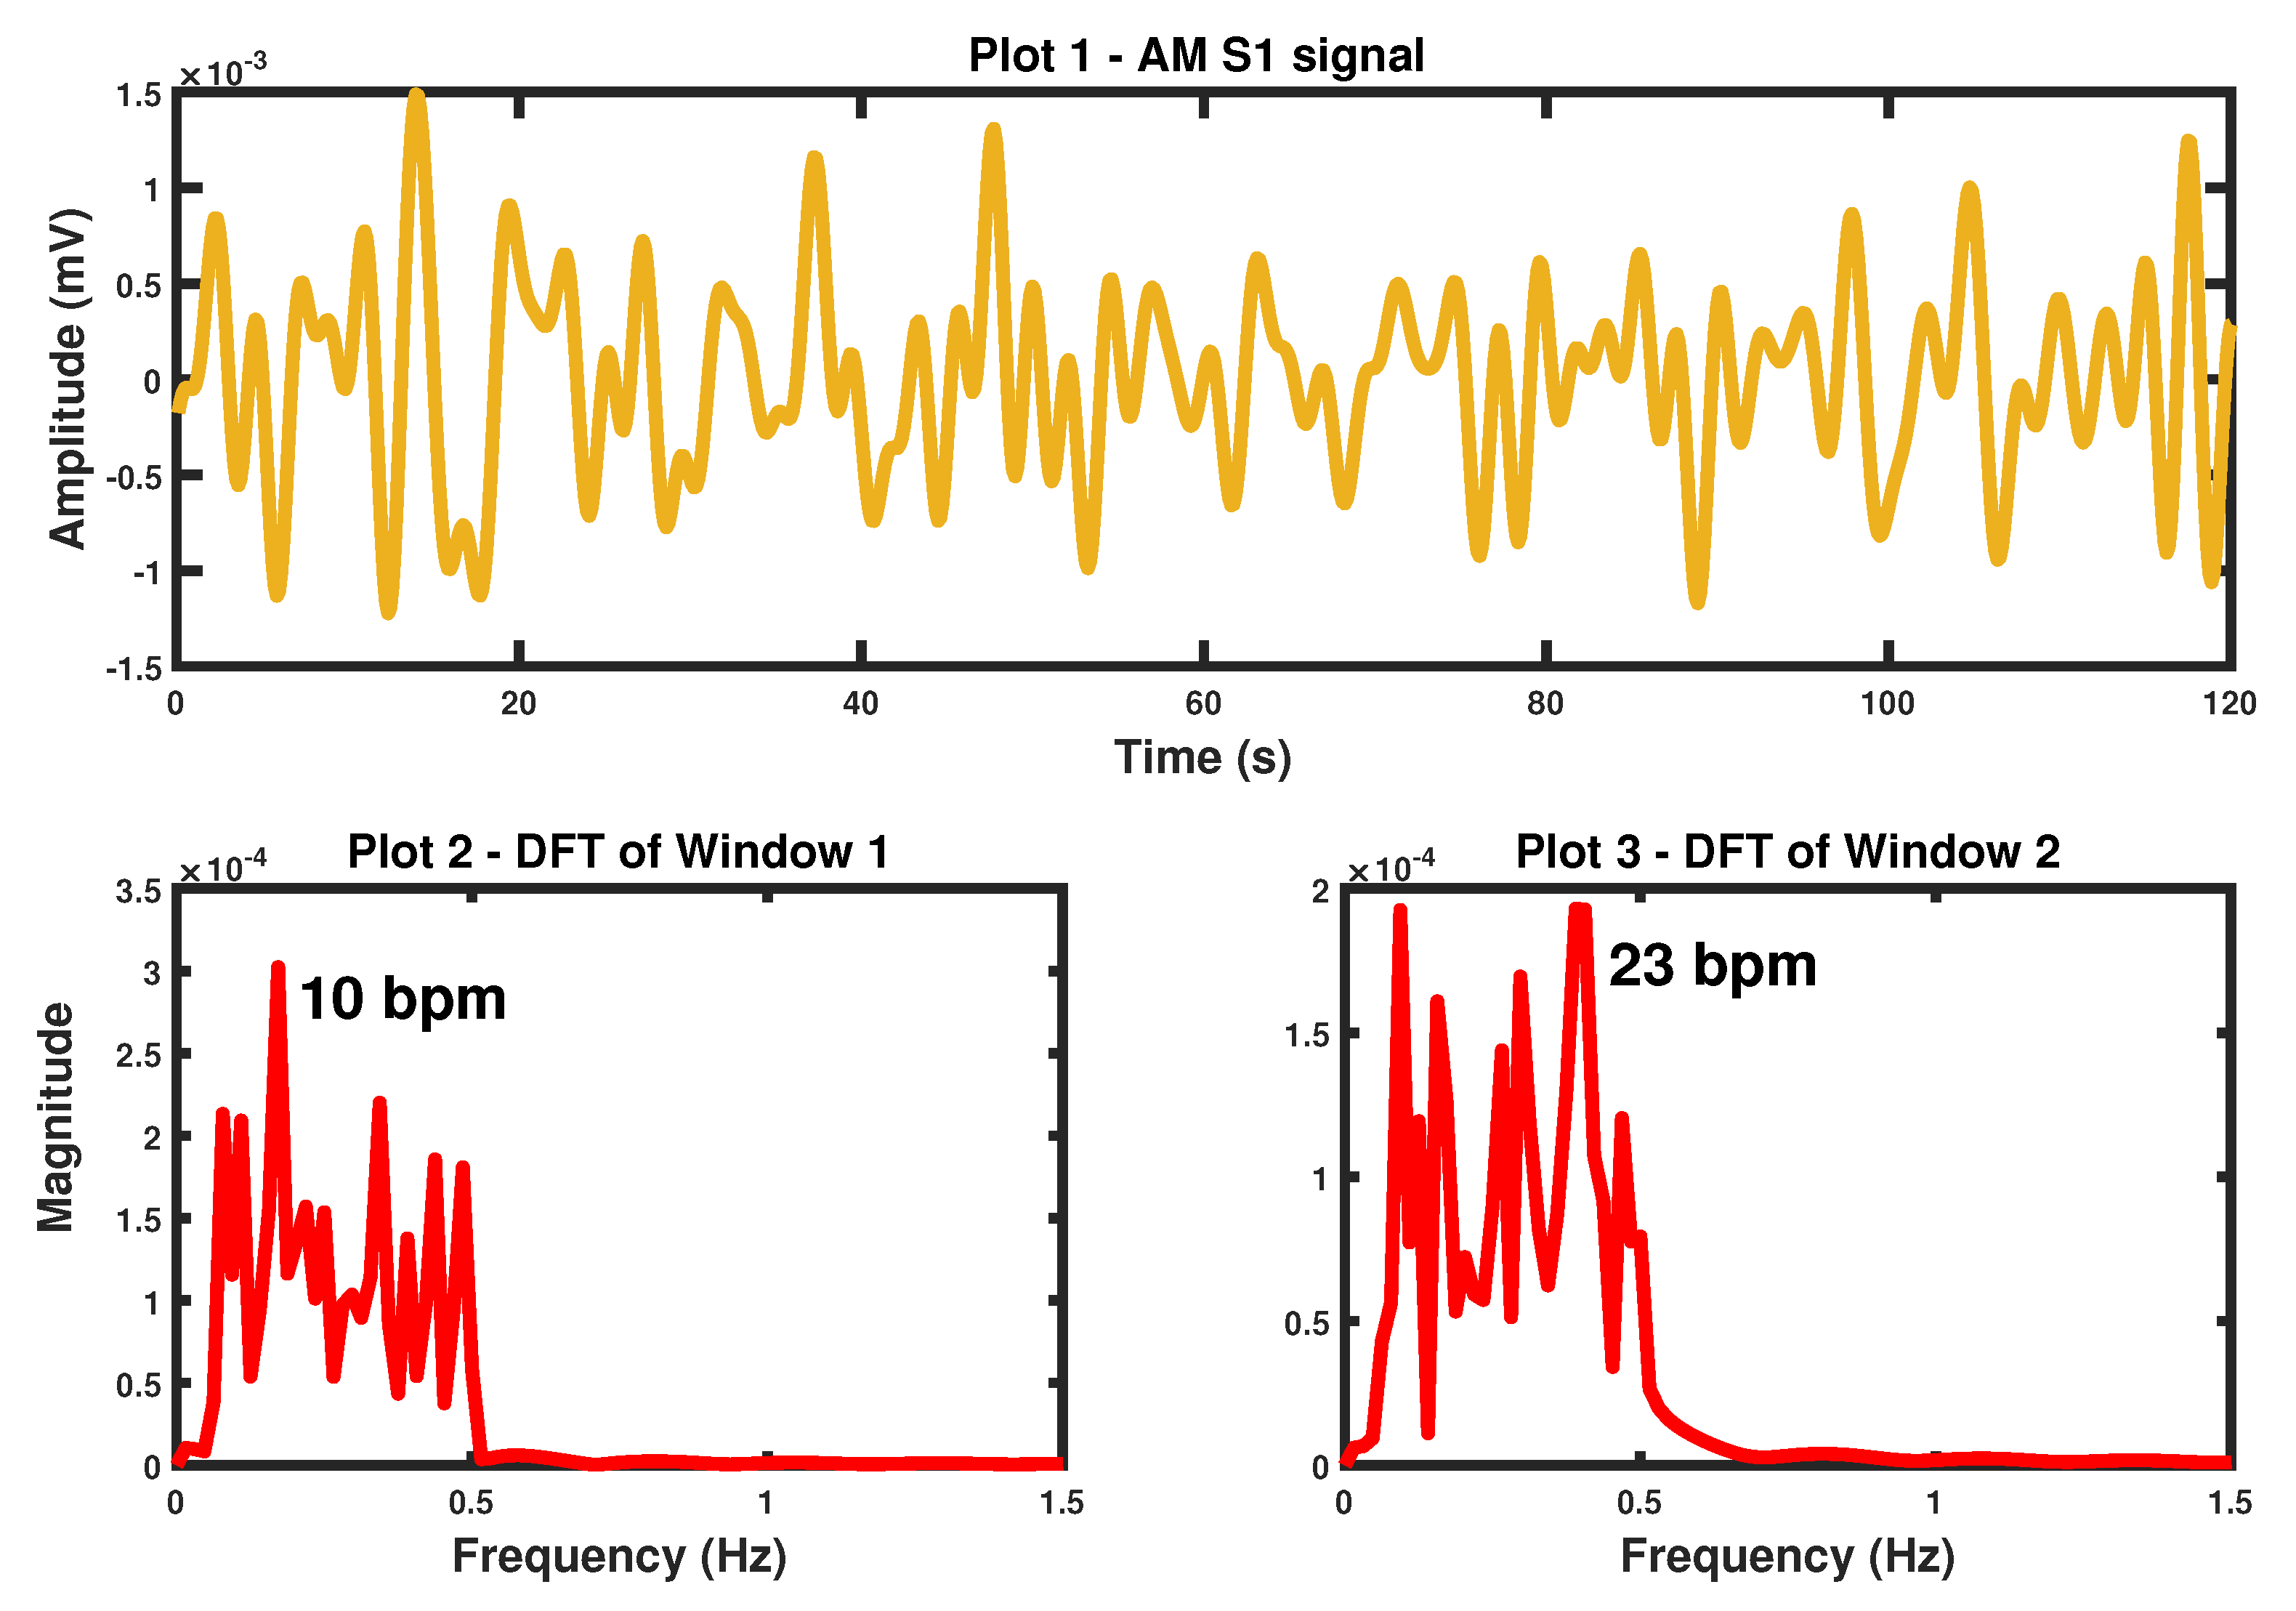
4.1. S1 Peak Amplitude Modulation Derived Respiratory Signal
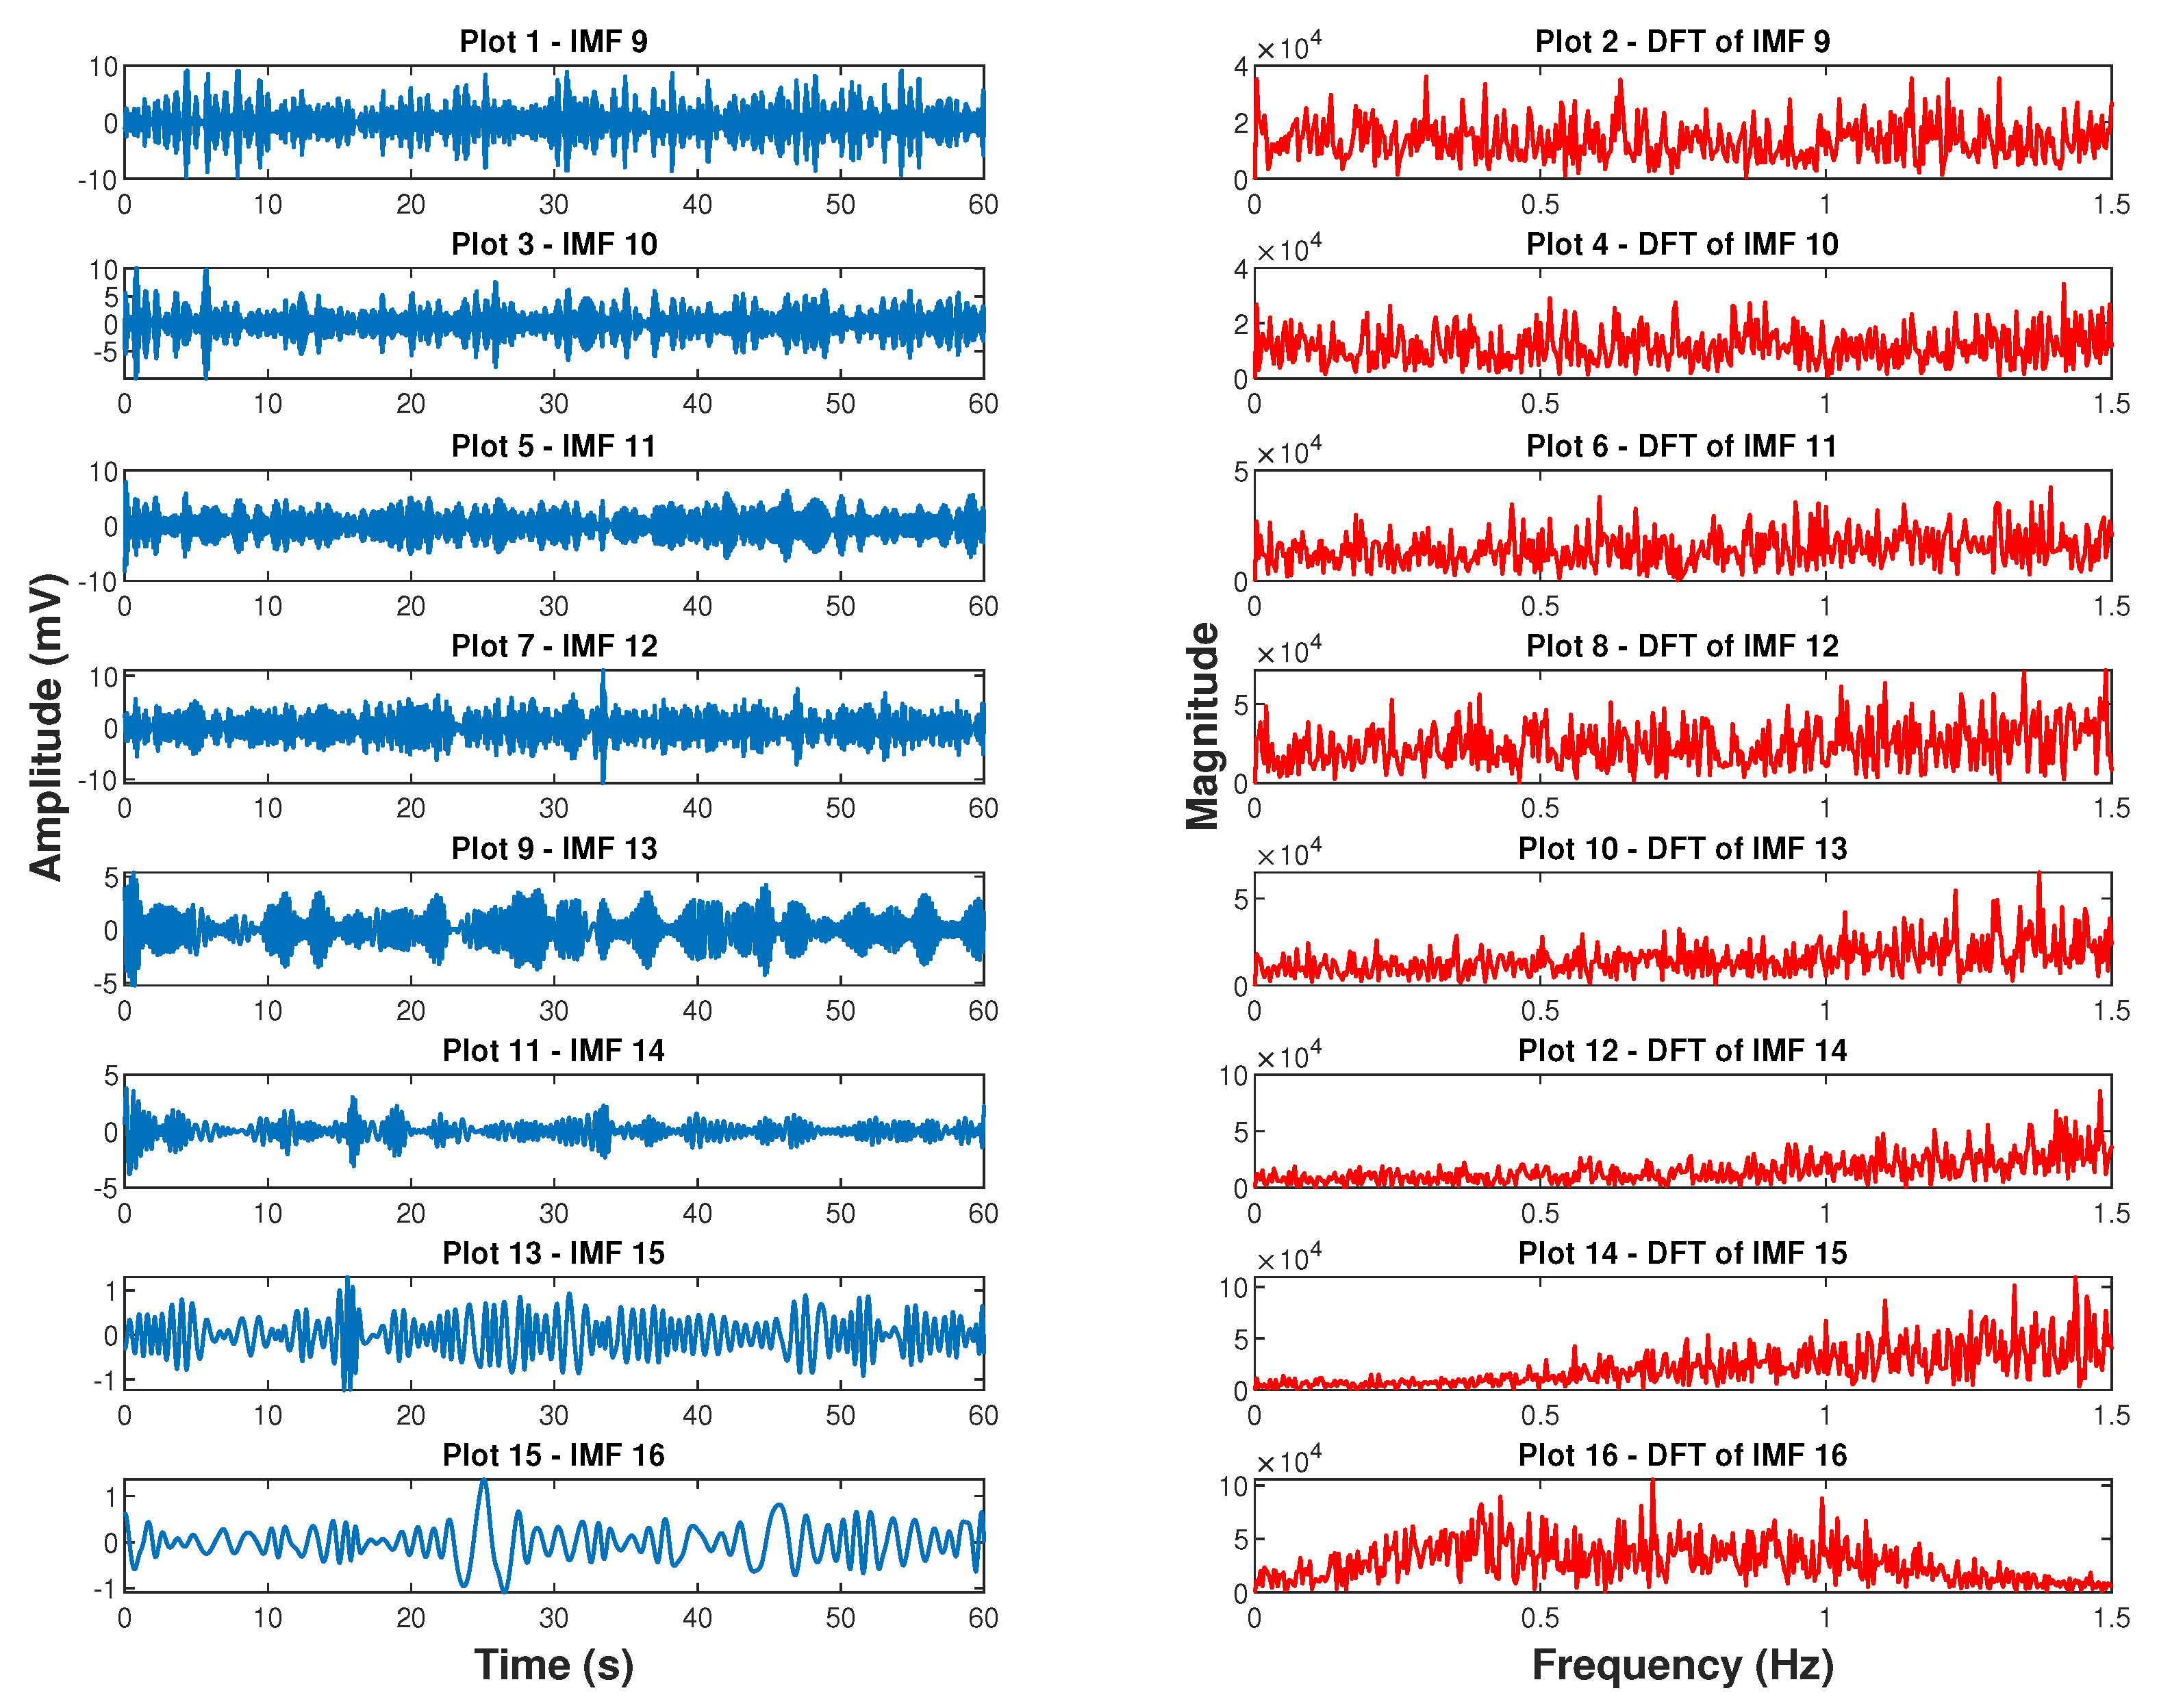
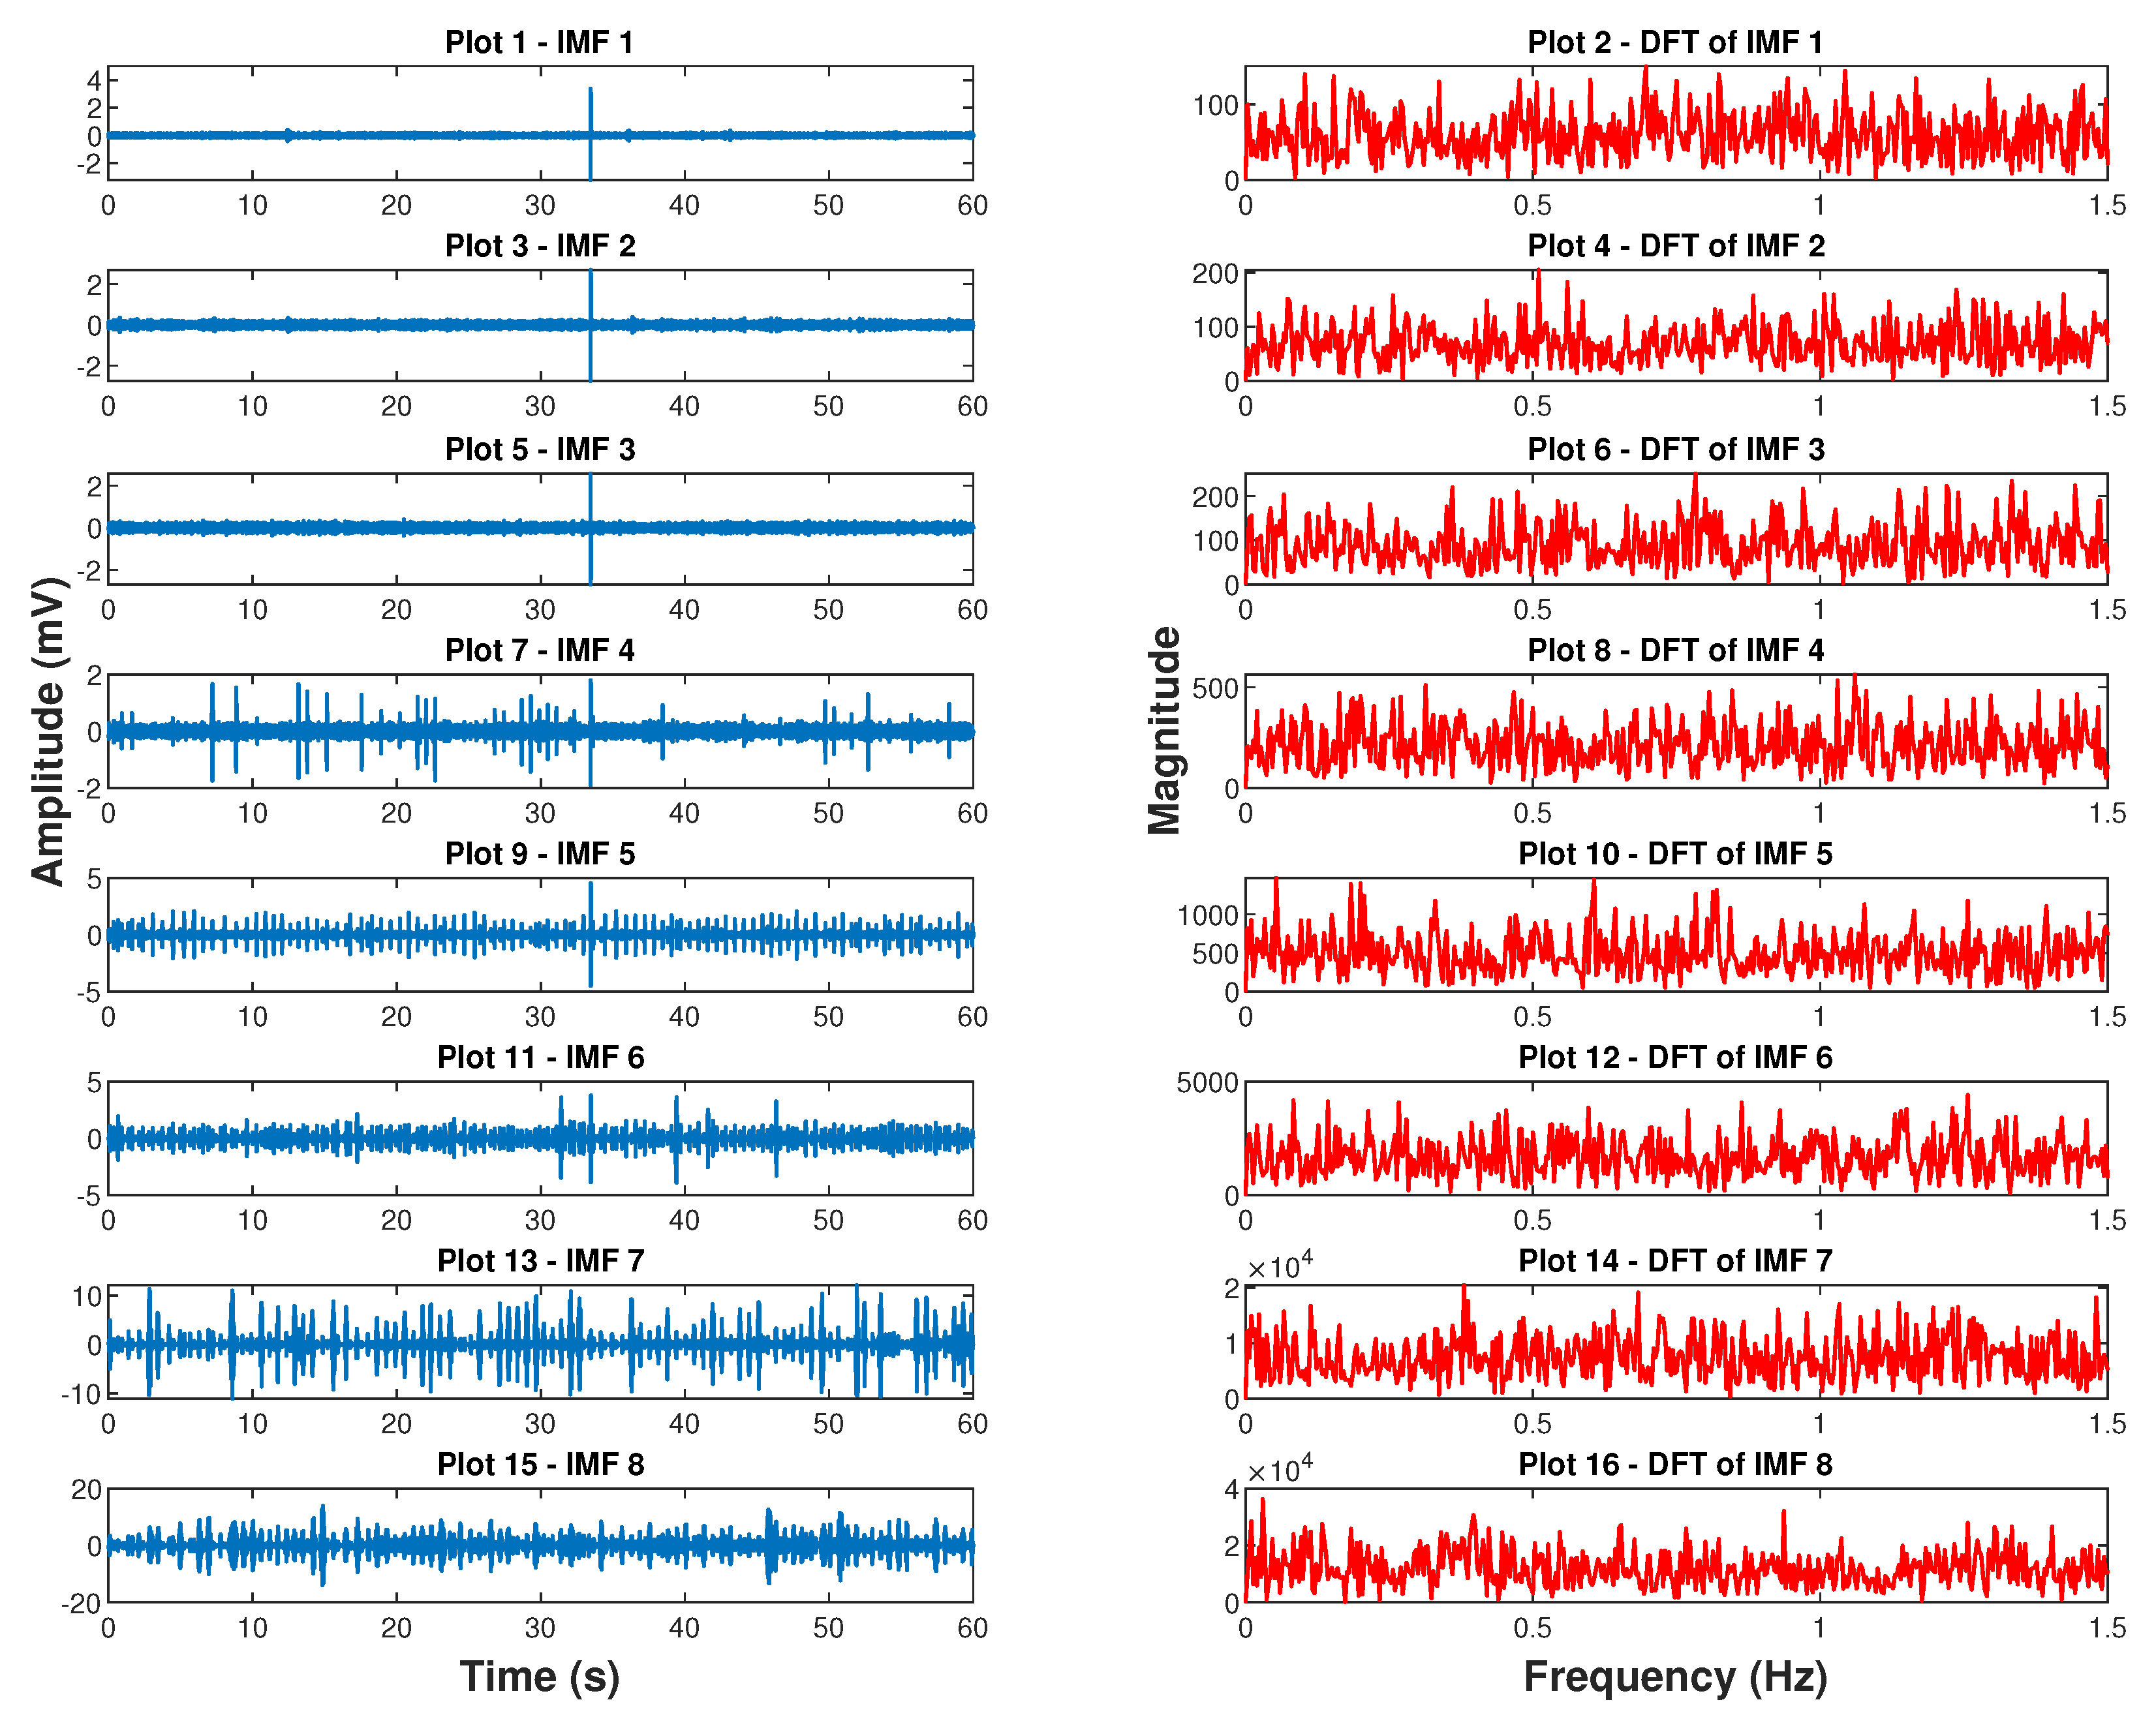
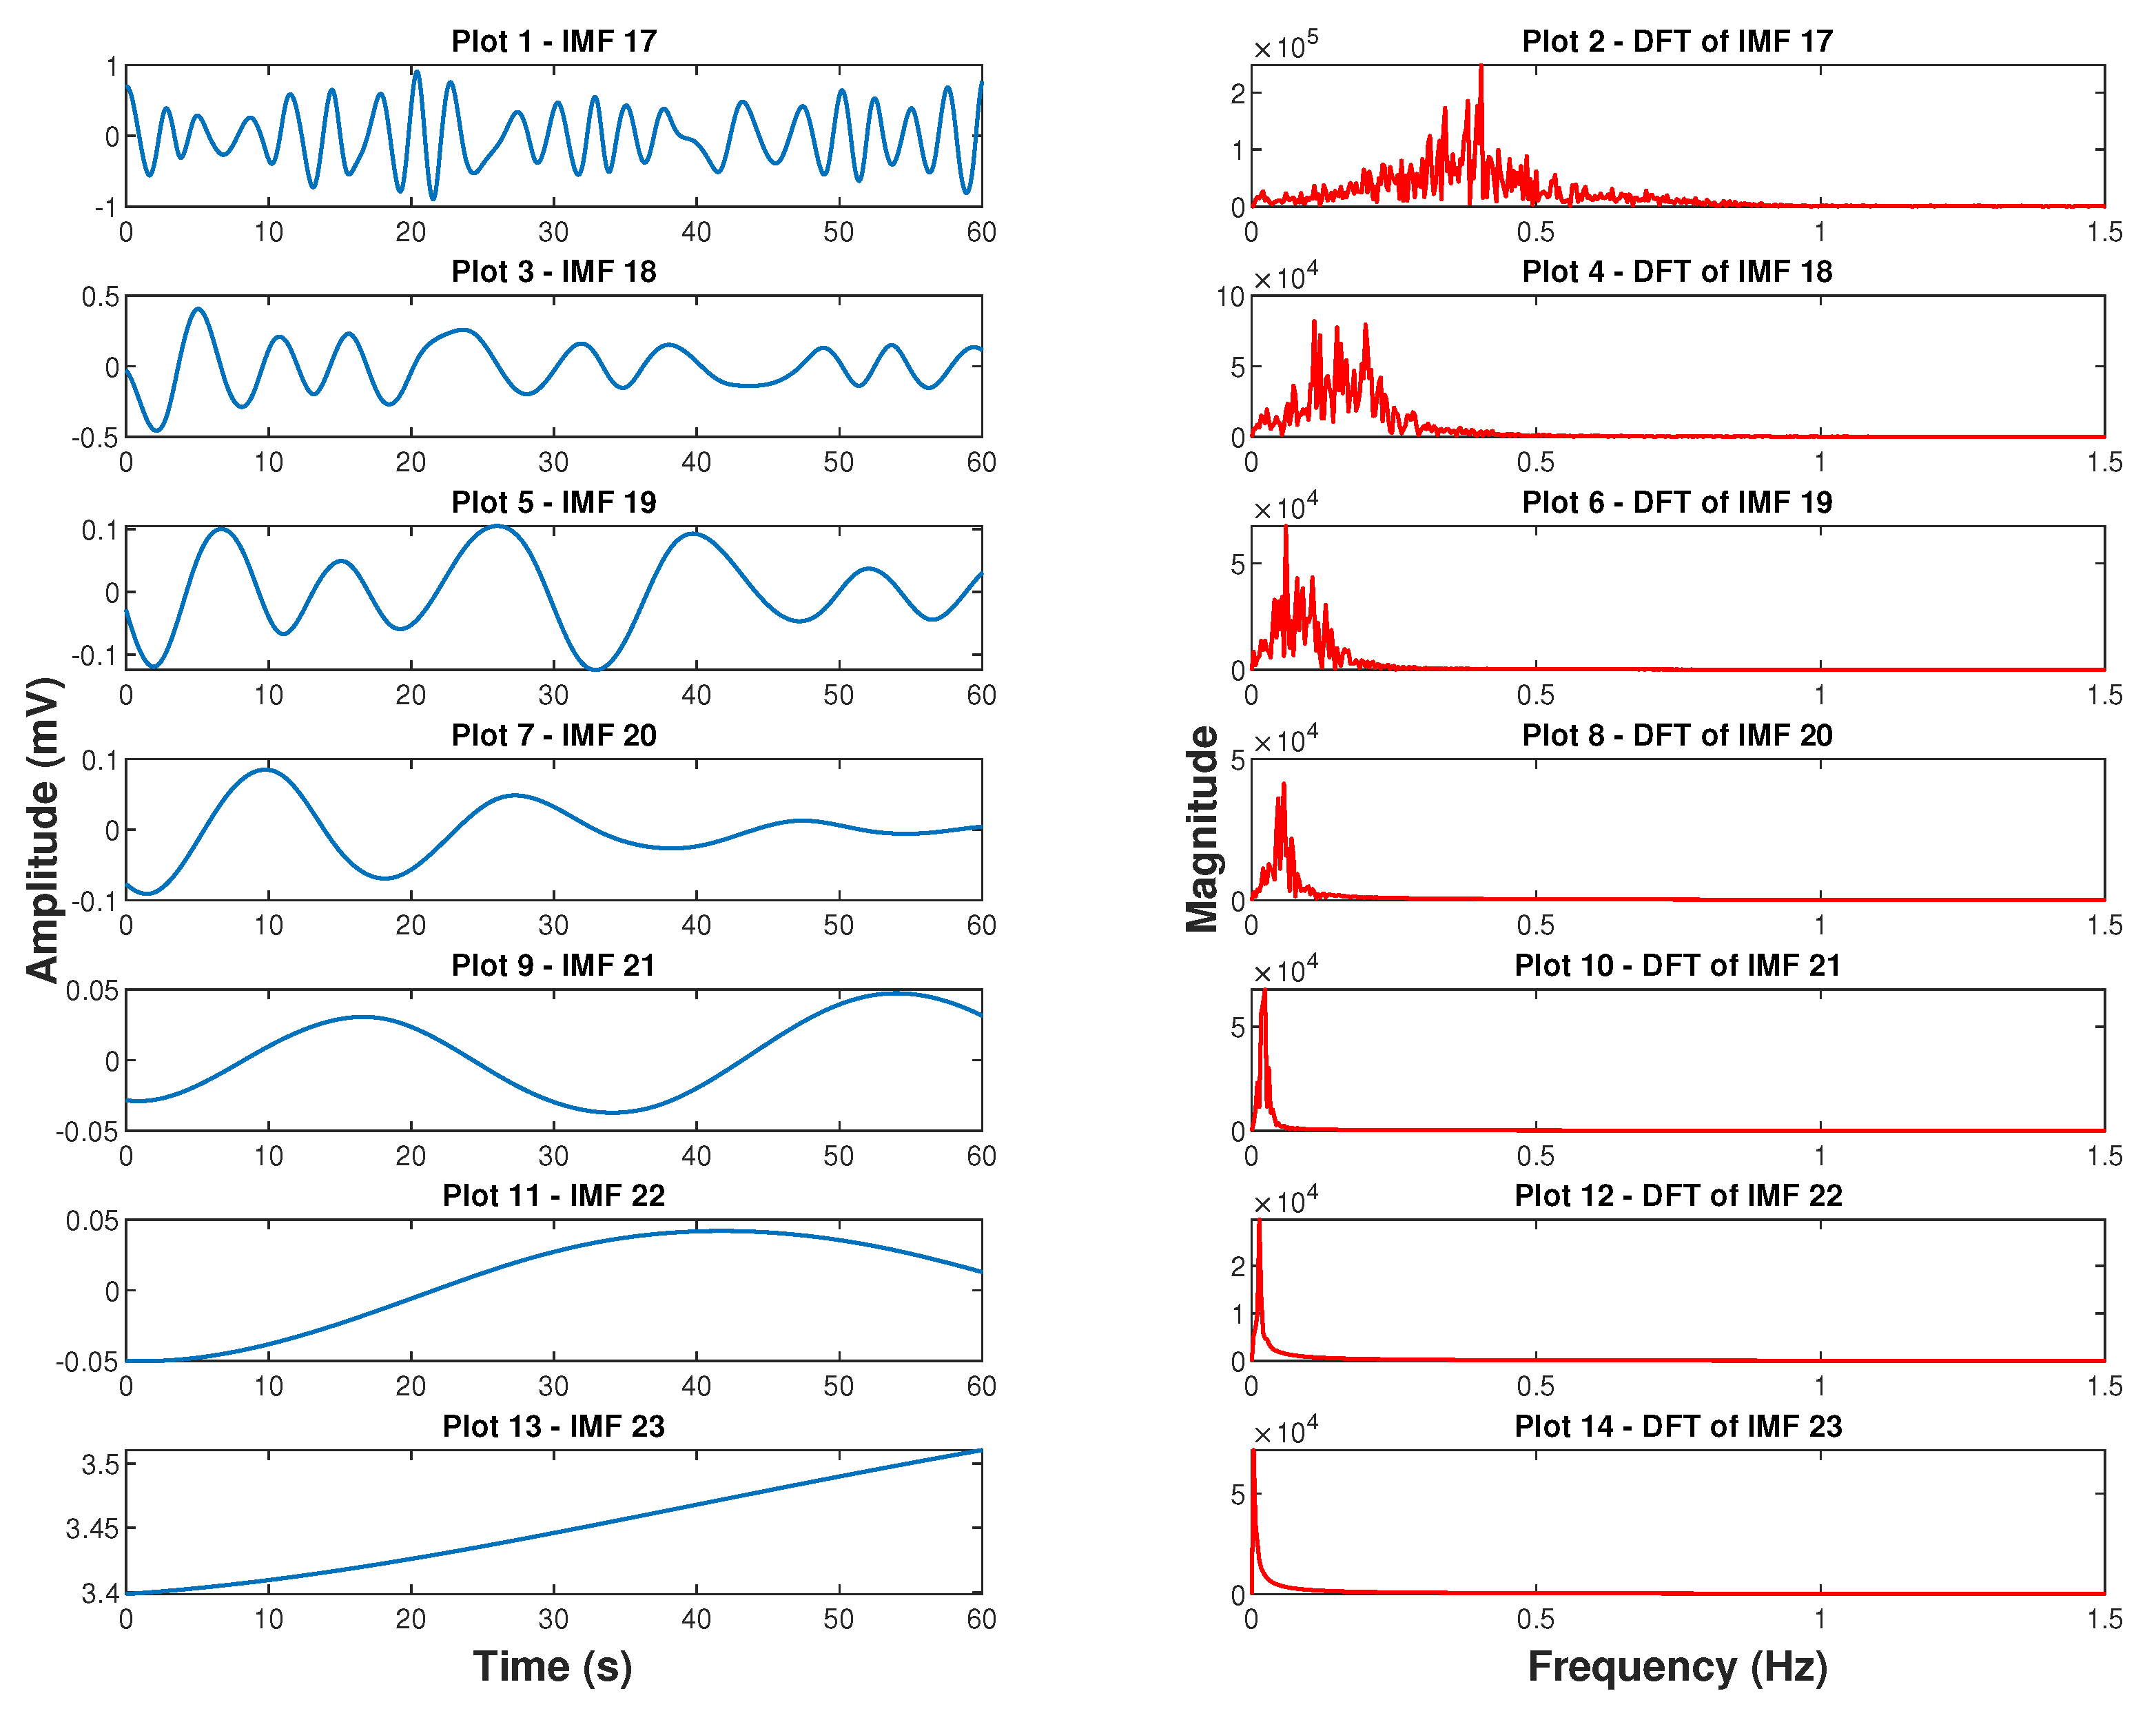
4.2. Empirical Mode Decomposition Derived Respiratory Signal
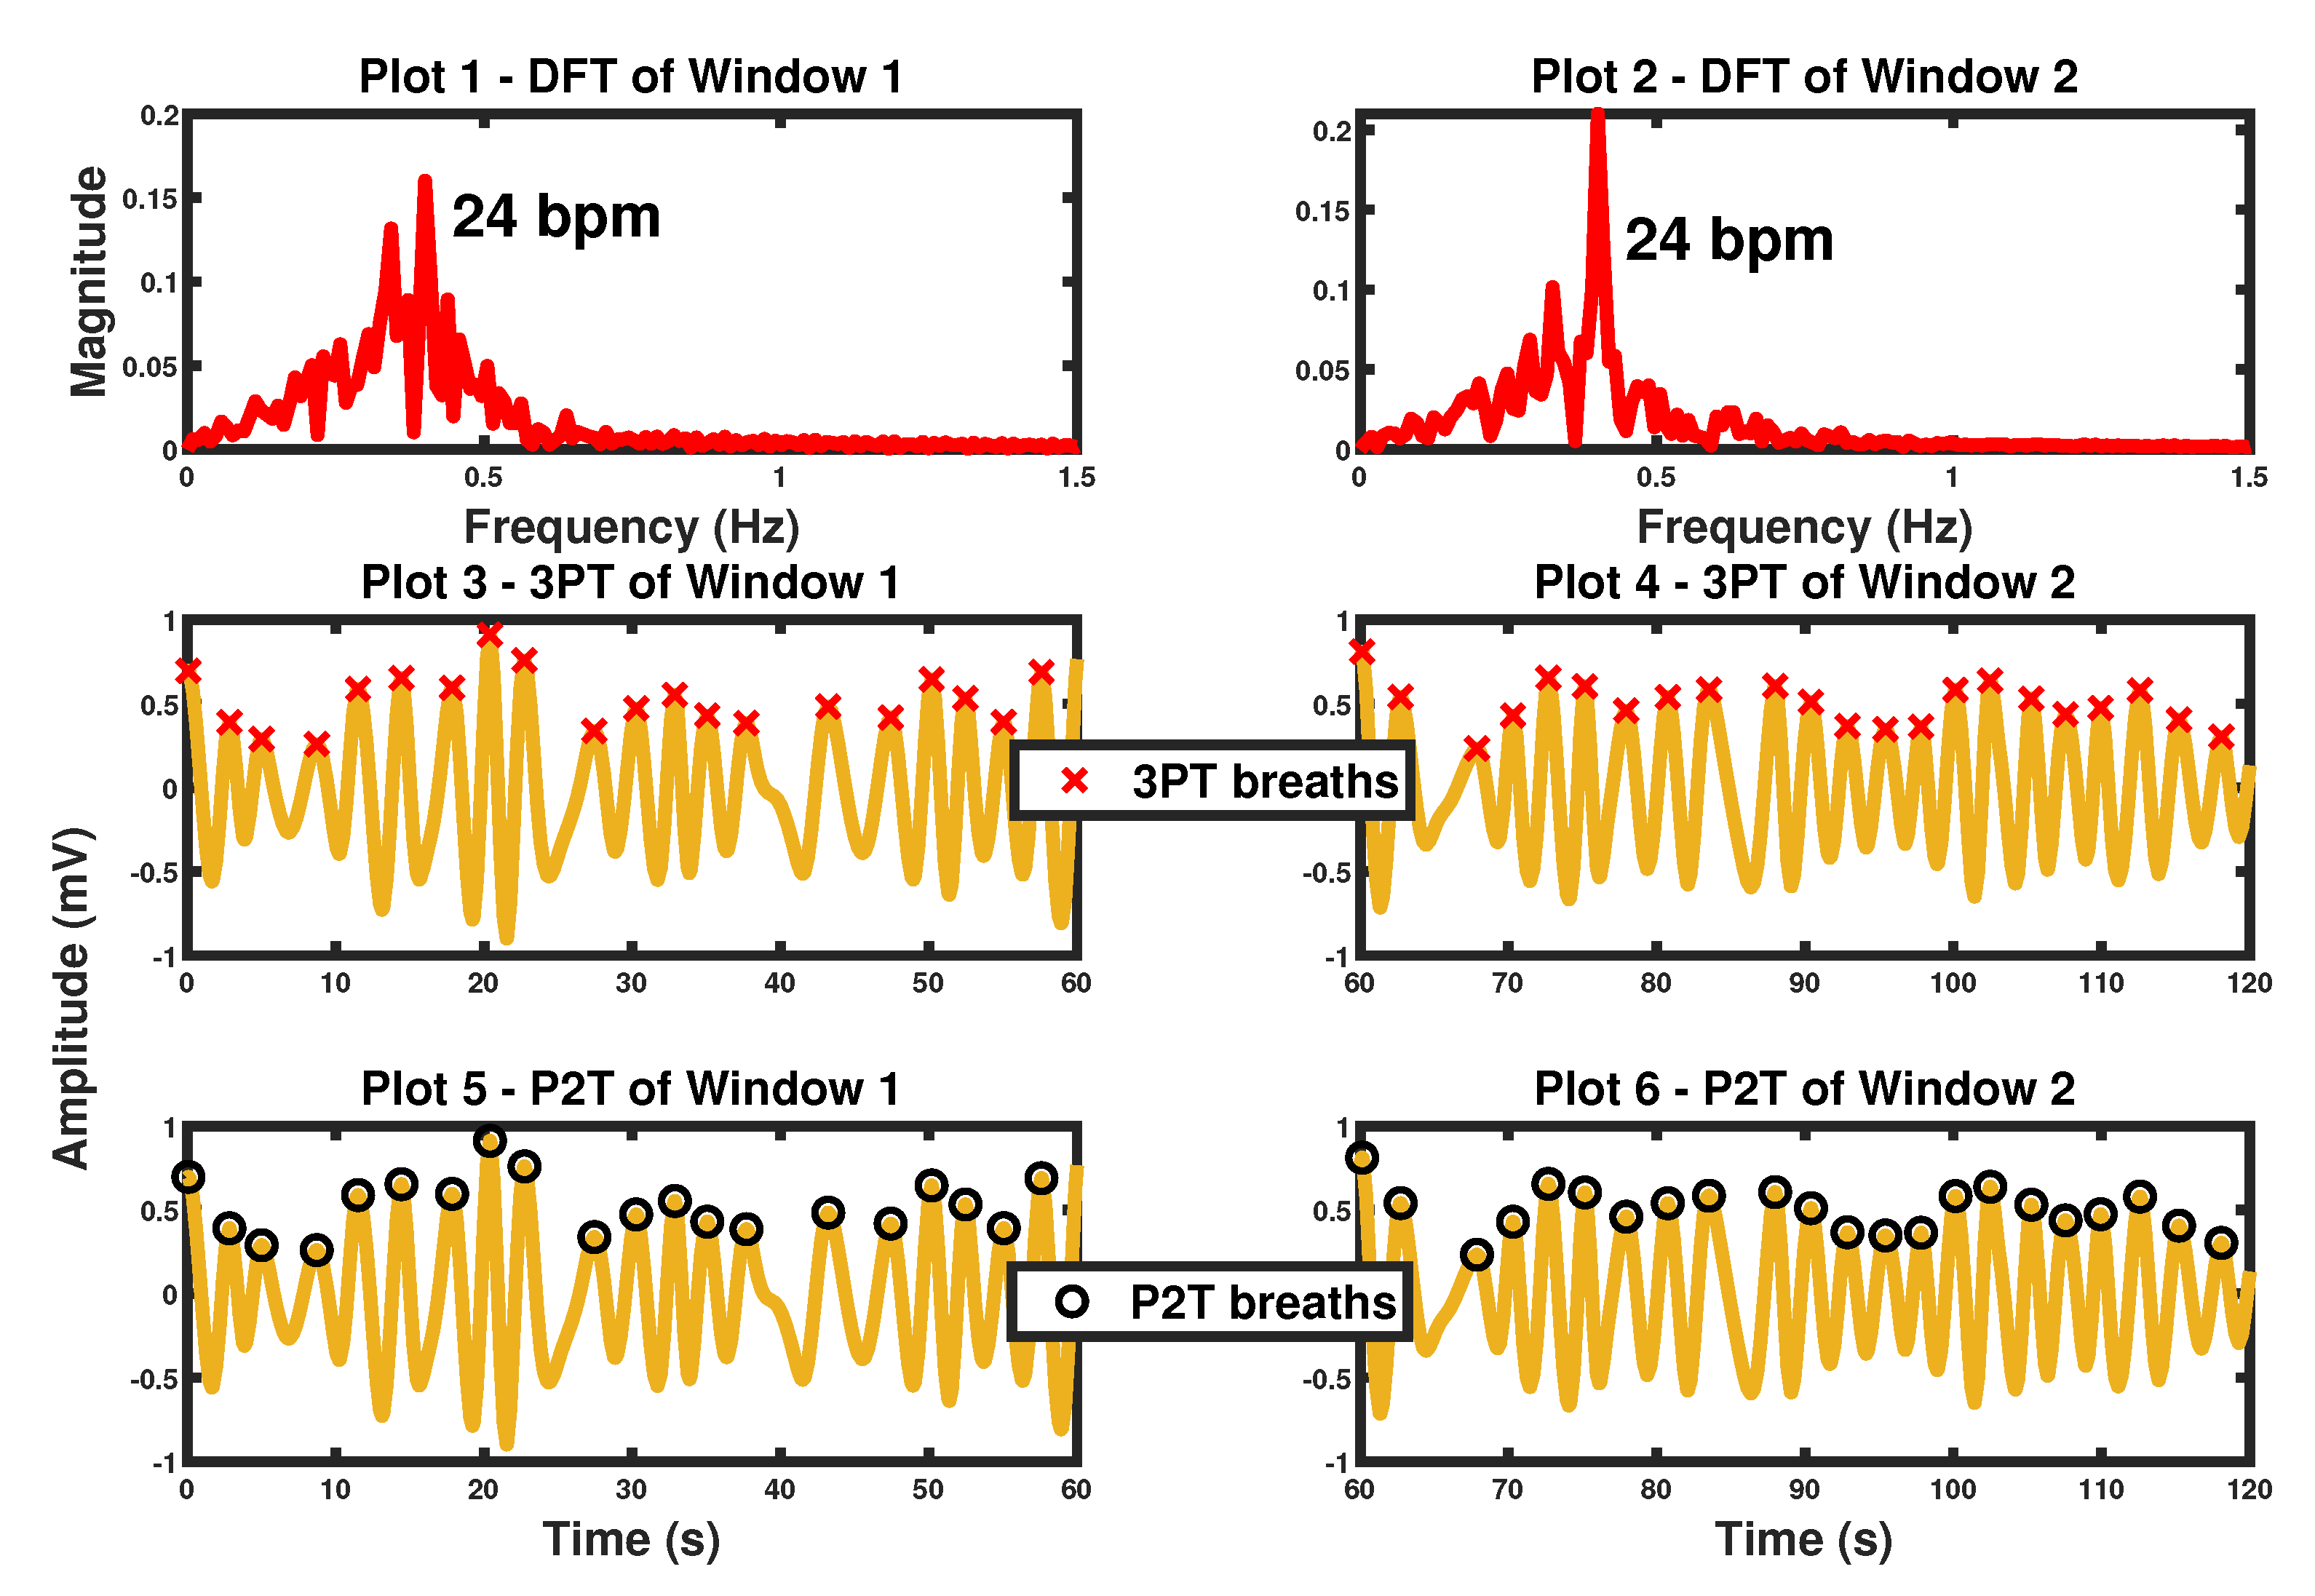
5. Time and Frequency Domain Analysis of Respiration Signals
5.1. Frequency Domain Analysis
5.2. Time Domain Analysis
| Algorithm 1: Three-point (3PT) [29] |
 |
- a.
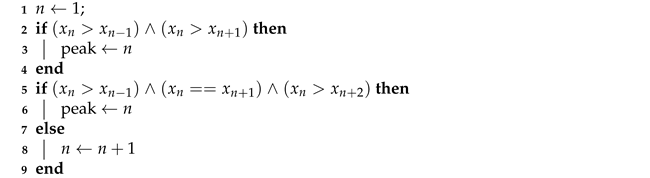
- A point is considered a peak if the gradient change is from positive to negative or a trough if the gradient change is from negative to positive,
- b.
- A peak must be followed by a trough and vice versa,
- c.
- The amplitude of a peak should be above the mean of the respiration signal and the amplitude of a trough should be below the mean,
- d.
- The peak-to-peak or trough-to-trough interval should be greater than 0.5 s,
6. Methods Evaluation
7. Results
7.1. SCG-Derived BR: Standard Methods
7.1.1. S1-S1 Interval Derived BR
7.1.2. S1 Intensity and S2 Intensity Derived BR
7.2. SCG-Derived BR: Proposed Advanced Methods
7.2.1. S1 Peak Amplitude Modulation Derived BR
7.2.2. Empirical Mode Decomposition Derived BR
8. Proposed Method Fusion and Results
| Algorithm 2: Improved Pole Magnitude and Phase Angle Criterion |
| 1 Estimate model order : ; 2 Model respiratory signal: AR(); 3 Calculate phase angles: ; 4 Keep respiratory poles: ; 5 Calculate pole magnitudes: ; 6 Find highest magnitude: ; 7 Find candidate BR poles: ; 8 Select BR pole: ; |
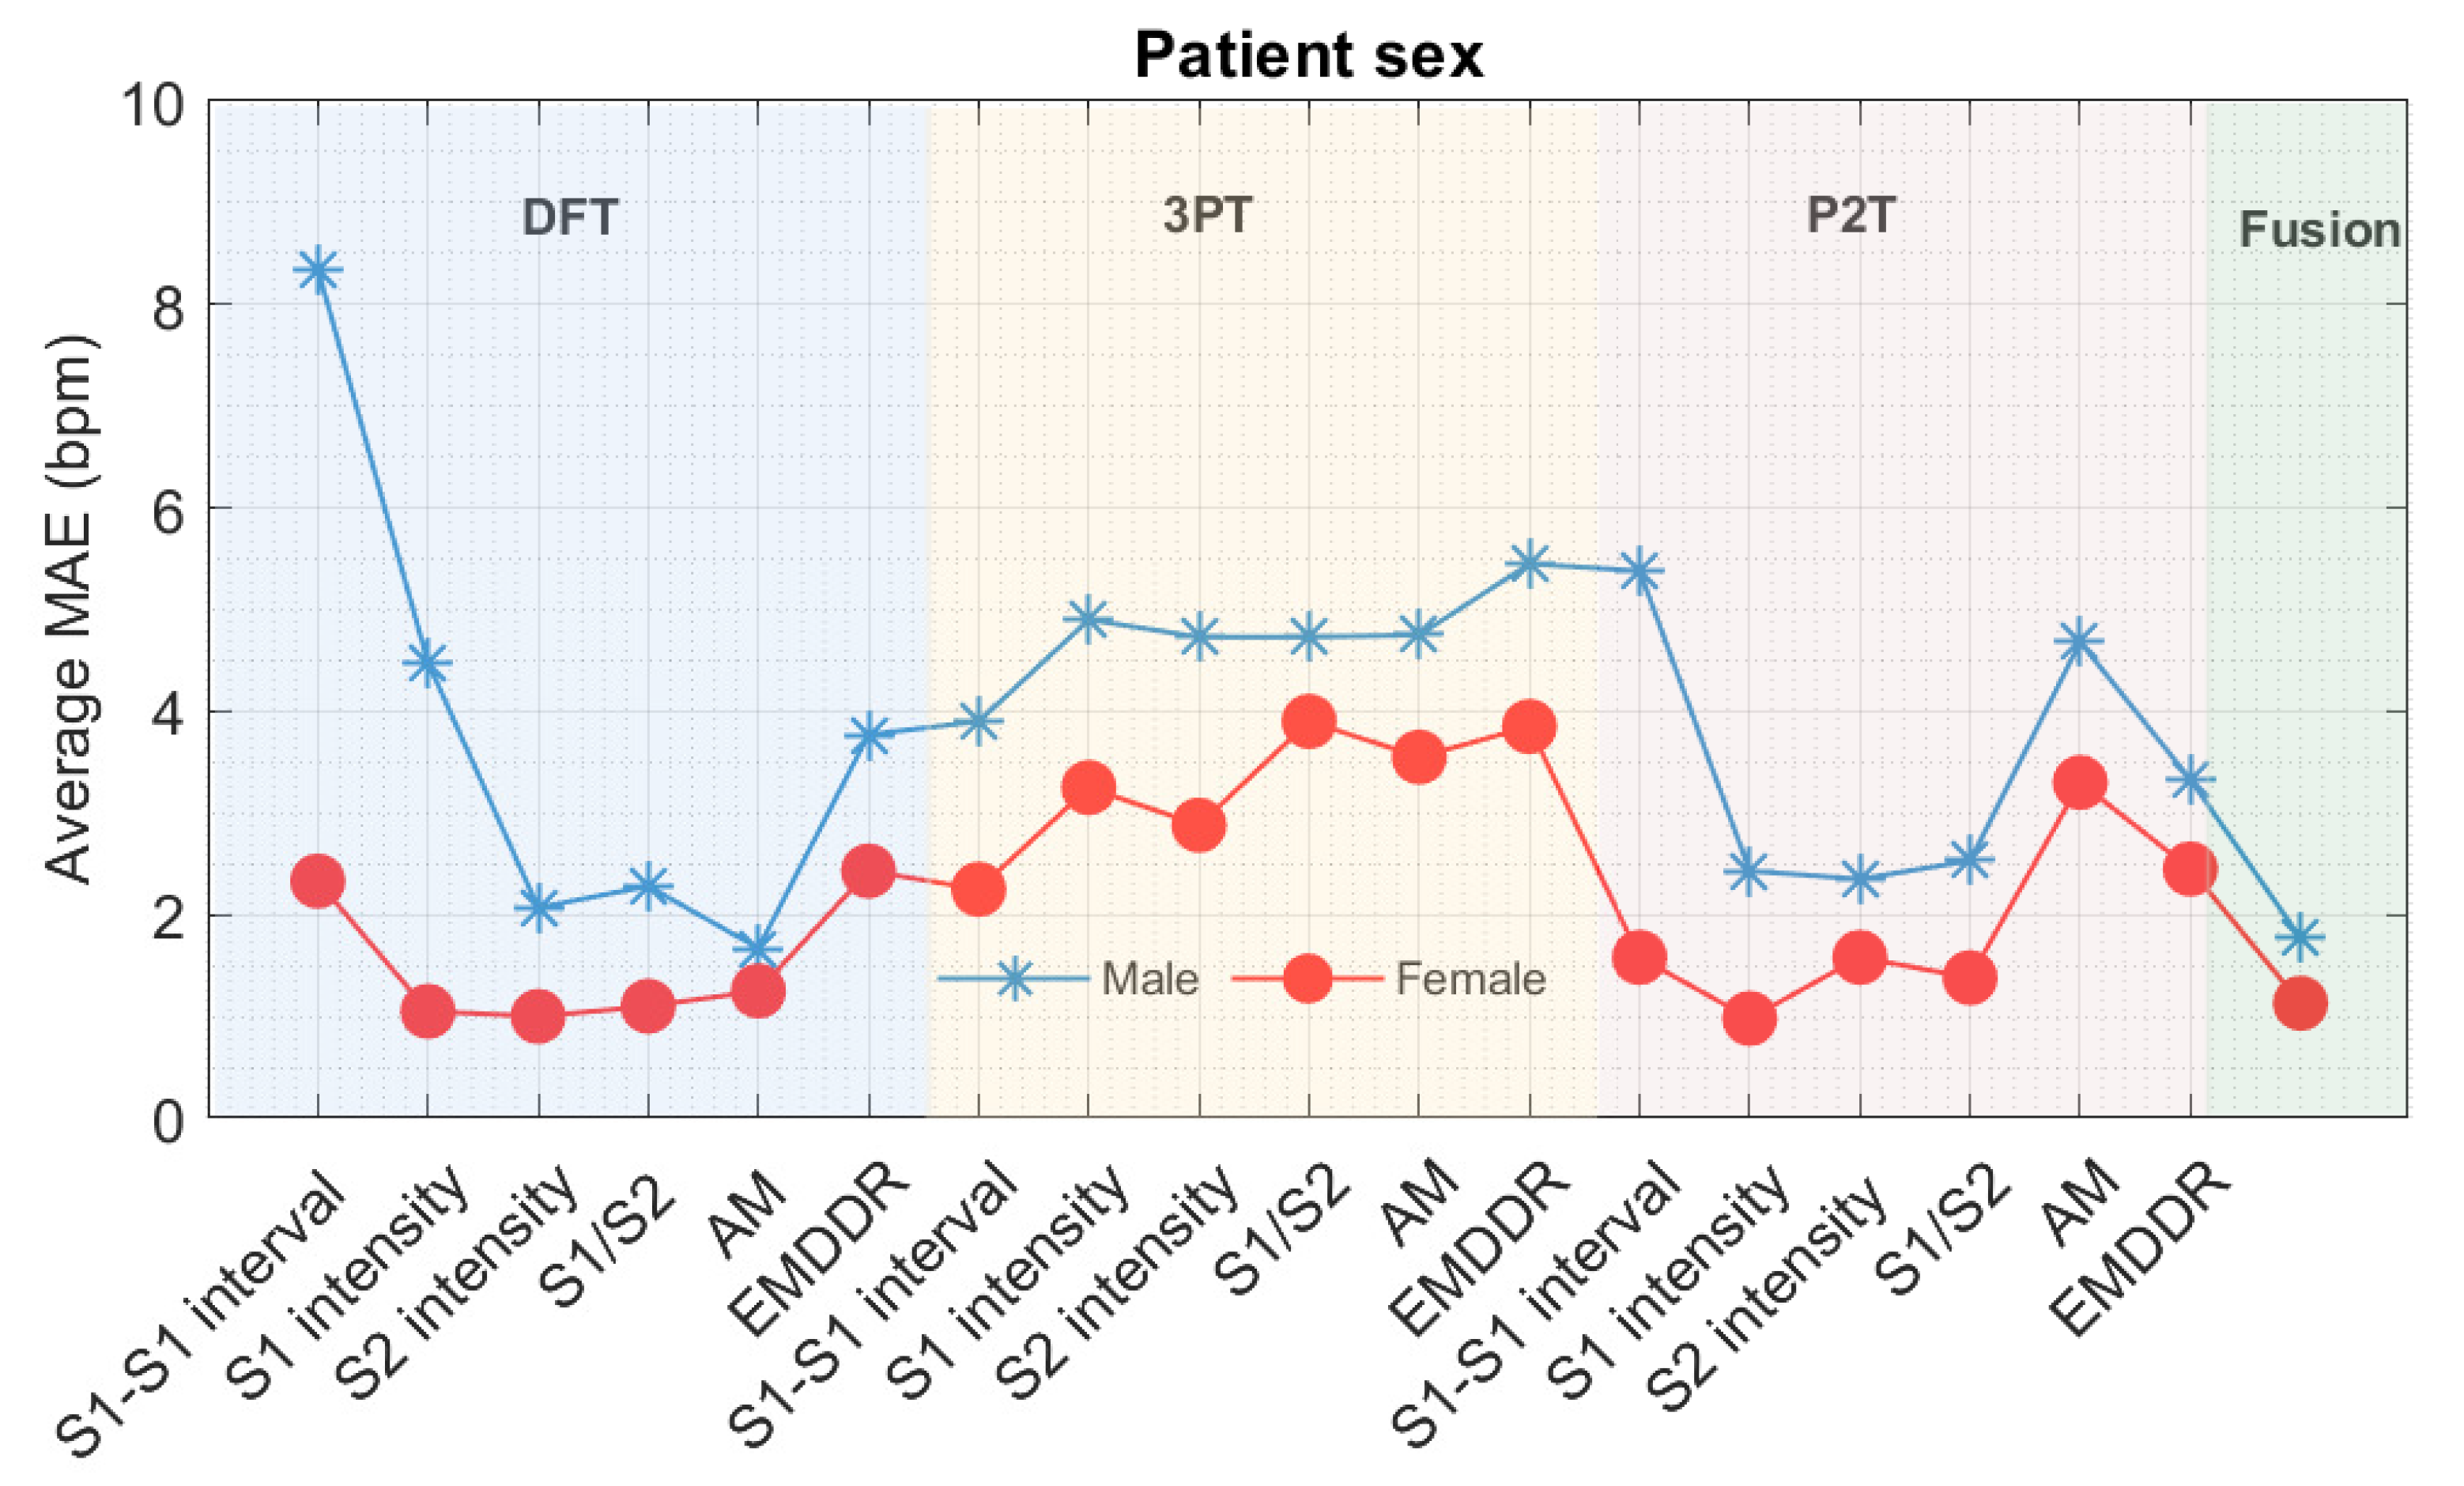
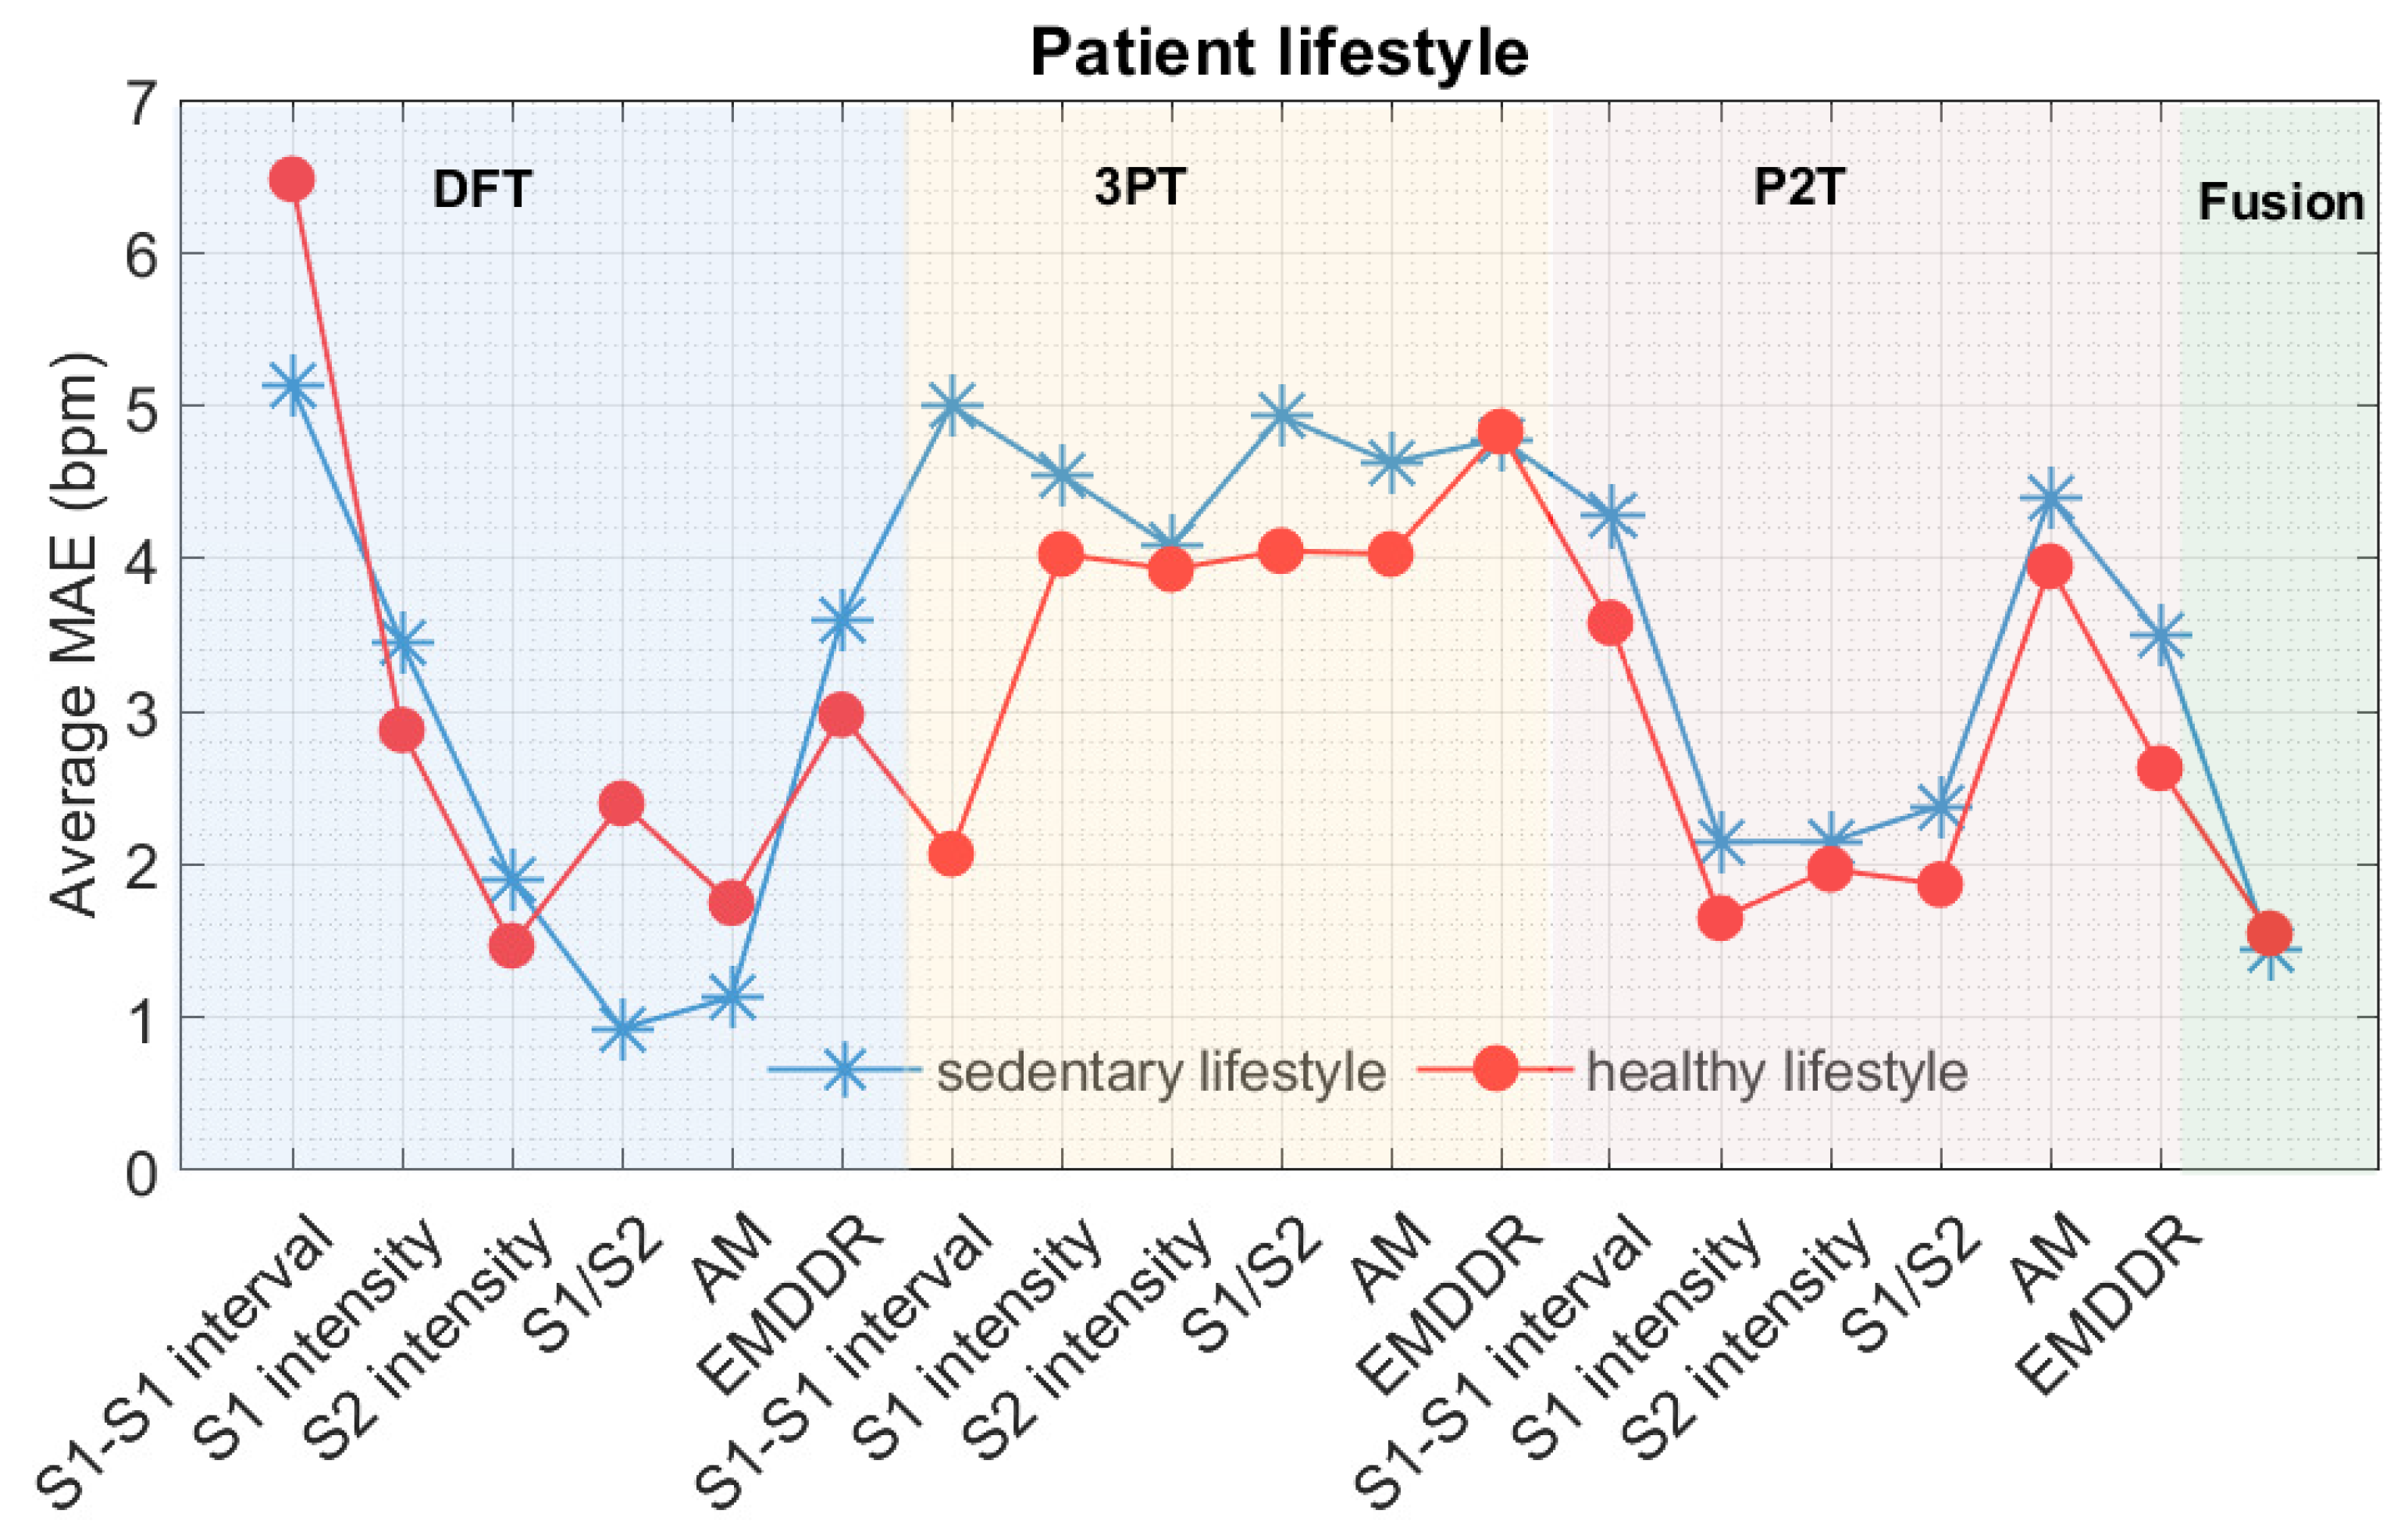
9. Further Analysis
9.1. Errors Associated with Gender and Differences in Lifestyle
9.2. Errors Associated with Different Respiratory Rates
10. Discussion
Author Contributions
Funding
Institutional Review Board Statement
Informed Consent Statement
Data Availability Statement
Conflicts of Interest
References
- Kelly, C. Respiratory Rate 1: Why measurement and recording are crucial. Nursing Times, 2 April 2018; 23–24. [Google Scholar]
- Cretikos, M.A.; Bellomo, R.; Hillman, K.; Chen, J.; Finfer, S.; Flabouris, A. Respiratory Rate: The neglected vital sign. Med. J. Aust. 2008, 188, 657–659. [Google Scholar] [CrossRef] [PubMed]
- Fieselmann, J.F.; Hendryx, M.S.; Helms, C.M.; Wakefield, D.S. Respiratory Rate Predicts Cardiopulmonary Arrest for Internal Medicine Inpatients. J. Gen. Intern. Med. 1993, 8, 354–360. [Google Scholar] [CrossRef]
- Goldhill, D.R.; McNarry, A.F.; Mandersloot, G.; McGinley, A. A Physiologically-based Early Warning Score for Ward Patients: The Association Between Score and Outcome. Anaesthesia 2005, 60, 547–553. [Google Scholar] [CrossRef] [PubMed]
- Elliott, M. Why is Respiratory Rate the Neglected Vital Sign? A Narrative Review. Int. Arch. Nurs. Health Care 2016, 2, 50. [Google Scholar] [CrossRef]
- Mlgaard, R.R.; Larsen, P.; Håkonsen, S.J. Effectiveness of Respiratory Rates in Determining Clinical Deterioration: A Systematic Review Protocol. JBI Database Syst. Rev. Implement. Rep. 2016, 14, 19–27. [Google Scholar] [CrossRef] [PubMed]
- Charlton, P.H. Continuous Respiratory Rate Monitoring to Detect Clinical Deteriorations Using Wearable Sensors. Ph.D. Thesis, King’s College London, London, UK, 2017. [Google Scholar]
- Nayan, A.; Risman, N.; Jaafar, R. Breathing Rate Estimation from a Single-lead Electrocardiogram Acquisition System. Int. J. Appl. Eng. Res. 2015, 10, 38154–38158. [Google Scholar]
- Charlton, P.H.; Bonnici, T.; Tarassenko, L.; Clifton, D.A.; Beale, R.; Watkinson, P.J. An assessment of algorithms to estimate respiratory rate from the Electrocardiogram and Photoplethysmogram. Physiol. Meas. 2016, 37, 610. [Google Scholar] [CrossRef]
- Zakeri, V.; Akhbardeh, A.; Alamdari, N.; Fazel-Rezai, R.; Paukkunen, M.; Tavakolian, K. Analyzing Seismocardiogram cycles to identify the respiratory phases. IEEE Trans. Biomed. Eng. 2016, 64, 1786–1792. [Google Scholar] [CrossRef]
- Haescher, M.; Matthies, D.J.C.; Trimpop, J.; Urban, B. A study on measuring heart-and respiration-rate via wrist-worn accelerometer-based seismocardiography (SCG) in comparison to commonly applied technologies. In Proceedings of the 2nd International Workshop on Sensor-based Activity Recognition and Interaction, Rostock, Germany, 25–26 June; Bodo Urban, Thomas Kirste, Association for Computing Machinery: New York, NY, USA, 2015; p. 2. [Google Scholar]
- Tadi, M.J.; Koivisto, T.; Pänkäälä, M.; Paasio, A. Accelerometer-based method for extracting respiratory and cardiac gating information for dual gating during nuclear medicine imaging. J. Biomed. Imaging. 2014. [Google Scholar] [CrossRef]
- Pandia, K.; Inan, O.T.; Kovacs, G.T.A. A frequency domain analysis of respiratory variations in the Seismocardiogram signal. In Proceedings of the 35th Annual International Conference of the IEEE Engineering in Medicine and Biology Society (EMBC), Osaka, Japan, 2–7 July 2013; pp. 6881–6884. [Google Scholar]
- Pandia, K.; Inan, O.T.; Kovacs, G.T.A.; Giovangrandi, L. Extracting respiratory information from Seismocardiogram signals acquired on the chest using a miniature accelerometer. Physiol. Meas. 2012, 33, 1643. [Google Scholar] [CrossRef]
- Reinvuo, T.; Hannula, M.; Sorvoja, H.; Alasaarela, E.; Myllyla, R. Measurement of respiratory rate with high-resolution accelerometer and EMFit pressure sensor. In Proceedings of the 2006 IEEE Sensors Applications Symposium, Houston, TX, USA, 7–9 February 2006; pp. 192–195. [Google Scholar]
- Inan, O.T.; Migeotte, P.F.; Park, K.S.; Etemadi, M.; Tavakolian, K.; Casanella, R.; Zanetti, J.; Tank, J.; Funtova, I.; Prisk, G.K.; et al. Ballistocardiography and Seismocardiography: A review of recent advances. IEEE J. Biomed. Health Inform. 2014, 19, 1414–1427. [Google Scholar] [CrossRef] [Green Version]
- Zanetti, J.M.; Salerno, D.M. Seismocardiography: A technique for recording precordial acceleration. In Proceedings of the Fourth Annual IEEE Symposium on Computer-Based Medical Systems, Baltimore, MD, USA, 12–14 May 1991; pp. 4–9. [Google Scholar]
- Castiglioni, P.; Faini, A.; Parati, G.; Di Rienzo, M. Wearable Seismocardiography. In Proceedings of the 29th Annual International Conference of the IEEE Engineering in Medicine and Biology Society, Lyon, France, 23–26 August 2007; pp. 3954–3957. [Google Scholar]
- Karagiannis, A.; Constantinou, P. Noise components identification in biomedical signals based on Empirical Mode Decomposition. In Proceedings of the 9th International Conference on Information Technology and Applications in Biomedicine, Larnaca, Cyprus, 5–7 November 2009; pp. 1–4. [Google Scholar]
- Civera, M.; Filosi, C.M.; Pugno, N.M.; Silvestrini, M.; Surace, C.; Worden, K. Assessment of vocal cord nodules: A case study in speech processing by using Hilbert-Huang Transform. J. Phys. Conf. Ser. 2017, 842, 012025. [Google Scholar] [CrossRef] [Green Version]
- Civera, M.; Filosi, C.M.; Pugno, N.M.; Silvestrini, M.; Surace, C.; Worden, K. Using Wavelet Level Variance and the Discrete Wavelet Transform to Monitor Postoperative Healing of Vocal Cords. In Proceedings of the 9th European Workshop on Structural Health Monitoring (EWSHM 2018), Manchester, UK, 10–13 July 2018. [Google Scholar]
- Rizi, F.Y. A Review of Notable Studies on Using Empirical Mode Decomposition for Biomedical Signal and Image Processing. Signal Process. Renew. Energy 2019, 3, 89–113. [Google Scholar]
- Orphanidou, C.; Fleming, S.; Shah, S.A.; Tarassenko, L. Data fusion for estimating respiratory rate from a single-lead ECG. Biomed. Signal Process. Control. 2013, 8, 98–105. [Google Scholar] [CrossRef]
- García-González, M.A.; Argelagós-Palau, A. ; Fernández-Chimeno. M.; Ramos-Castro, J. A comparison of heartbeat detectors for the Seismocardiogram. In Proceedings of the Computing in Cardiology, Zaragosa, Spain, 22–25 September 2013; Alan Murray, IEEE: Piscataway, NJ, USA, 2013; pp. 461–464. [Google Scholar]
- Goldberger, A.; Amaral, L.; Glass, L.; Hausdorff, J.; Ivanov, P.C.; Mark, R.; Mietus, J.E.; Moody, G.B.; Peng, C.K.; Stanley, H.E. PhysioBank, PhysioToolkit, and PhysioNet: Components of a new research resource for complex physiologic signals. Circulation [Online] 2000, 101, e215–e220. [Google Scholar] [CrossRef] [PubMed] [Green Version]
- Kozia, C.; Herzallah, R.; Lowe, D. Adaptive R-peak Detection Using Empirical Mode Decomposition. In Proceedings of the International Conference on Time Series and Forecasting, ITISE 2018, Granada, Spain, 19–21 September 2018. [Google Scholar]
- Kozia, C.; Herzallah, R.; Lowe, D. ECG-Derived Respiration Using a Real-Time QRS Detector Based on Empirical Mode Decomposition. In Proceedings of the 12th International Conference on Signal Processing and Communication Systems (ICSPCS), Cairns, Australia, 17–19 December 2018; pp. 1–8. [Google Scholar]
- Kozia, C.; Herzallah, R.; Lowe, D. ICA-Derived Respiration Using an Adaptive R-Peak Detector. In Proceedings of the International Conference on Time Series and Forecasting, ITISE 2018, Granada, Spain, 19–21 September 2018; pp. 363–377. [Google Scholar]
- Shah, S.A. Vital Sign Monitoring and Data Fusion for Paediatric Triage. Ph.D. Thesis, Oxford University, Oxford, UK, 2012. [Google Scholar]
- Fleming, S. Measurement and Fusion of Non-Invasive Vital Signs for Routine Triage of Acute Paediatric Illness. Ph.D. Thesis, Oxford University, Oxford, UK, 2010. [Google Scholar]
- Orphanidou, C. Derivation of respiration rate from ambulatory ECG and PPG using Ensemble Empirical Mode Decomposition: Comparison and Fusion. Comput. Biol. Med. 2017, 81, 45–54. [Google Scholar] [CrossRef] [PubMed]
- Sobron, A.; Romero, I.; Lopetegi, T. Evaluation of methods for estimation of respiratory frequency from the ECG. In Proceedings of the Computing in Cardiology CinC 2010, Belfast, UK, 26–29 September 2010; pp. 513–516. [Google Scholar]
- Nemati, S.; Malhotra, A.; Clifford, G.D. Data fusion for improved respiration rate estimation. EURASIP J. Adv. Signal Process. 2010. [Google Scholar] [CrossRef] [PubMed] [Green Version]
- Fleming, S.G.; Tarassenko, L. A comparison of signal processing techniques for the extraction of breathing rate from the photoplethysmogram. Int. J. Biol. Med. Sci. 2007, 2, 232–236. [Google Scholar]
- Proakis, J.G.; Manolakis, D.G. Digital Signal Processing: Principles, Algorithms, and Applications, 3rd ed.; Prentice-Hall, Inc.: Upper Saddle River, NJ, USA, 1996; p. 855. [Google Scholar]
- Burke, O. Statistical Methods. Autocorrelation, Decomposition and Smoothing; Michaelmas Term. Department of Statistics: Oxford, UK, 2011. [Google Scholar]
- Wu, Z.; Huang, N.E. Ensemble empirical mode decomposition: A noise-assisted data analysis method. Adv. Adapt. Data Anal. 2009, 1, 1–41. [Google Scholar] [CrossRef]
- Yeh, J.R.; Shieh, J.S.; Huang, N.E. Complementary ensemble empirical mode decomposition: A novel noise enhanced data analysis method. Adv. Adapt. Data Anal. 2010, 2, 135–156. [Google Scholar] [CrossRef]
- Zheng, J.; Cheng, J.; Yang, Y. Partly ensemble empirical mode decomposition: An improved noise-assisted method for eliminating mode mixing. Signal Process. 2014, 96, 362–374. [Google Scholar] [CrossRef]


| Record | MAE (bpm) | MAE (bpm) | MAE (bpm) |
|---|---|---|---|
| b001 | 16.8 | 3 | 10.2 |
| b002 | 6.2 | 0.6 | 2.2 |
| b003 | 0.0 | 1.0 | 0.0 |
| b004 | 7.8 | 5.4 | 4.4 |
| b005 | 0.0 | 2.4 | 0.6 |
| b006 | 3.0 | 1.8 | 1.4 |
| b007 | 1.4 | 10.2 | 5.6 |
| b008 | 16.8 | 3 | 10.2 |
| b009 | 1.2 | 6.8 | 1.4 |
| b010 | 1.4 | 0.8 | 0.4 |
| b011 | 0.8 | 0.6 | 1.4 |
| b012 | 17 | 1.2 | 10.4 |
| b013 | 14.6 | 2.2 | 8.8 |
| b014 | 7.2 | 0.8 | 1.4 |
| b015 | 11.0 | 2.2 | 6.4 |
| b016 | 5.2 | 2.0 | 3.0 |
| b017 | 2.4 | 0.4 | 1.8 |
| b018 | 2.0 | 9.4 | 4.0 |
| b019 | 2.6 | 0.6 | 1.4 |
| b020 | 1.4 | 10.4 | 2.2 |
| Average | 5.9 | 3.2 | 3.9 |
| CI | ±12.1 | ±6.7 | ±7.0 |
| Record | MAE (bpm) | MAE(bpm) | MAE (bpm) |
|---|---|---|---|
| b001 | 10.0 | 1.8 | 3.4 |
| b002 | 0.6 | 2.4 | 1.0 |
| b003 | 0.0 | 0.6 | 0.2 |
| b004 | 2.2 | 7.0 | 2.2 |
| b005 | 0.0 | 2.8 | 0.8 |
| b006 | 3.0 | 6.2 | 1.8 |
| b007 | 1.6 | 6.6 | 3.2 |
| b008 | 10 | 1.8 | 3.4 |
| b009 | 1.2 | 12.0 | 2.4 |
| b010 | 1.8 | 6.0 | 1.2 |
| b011 | 0.2 | 4.4 | 1.0 |
| b012 | 15.6 | 1.2 | 4.8 |
| b013 | 2.6 | 0.6 | 0.6 |
| b014 | 0.4 | 2.4 | 1.2 |
| b015 | 1.0 | 0.4 | 0.8 |
| b016 | 5.8 | 5.4 | 2.0 |
| b017 | 0.3 | 0.4 | 0.8 |
| b018 | 4.4 | 12.8 | 4.2 |
| b019 | 1.0 | 1.0 | 0.6 |
| b020 | 0.6 | 9.0 | 1.4 |
| Average | 3.1 | 4.2 | 1.9 |
| CI | ±8.4 | ±7.6 | ±2.6 |
| Record | MAE (bpm) | MAE (bpm) | MAE (bpm) |
|---|---|---|---|
| b001 | 3.2 | 1.4 | 2.2 |
| b002 | 0.4 | 2.0 | 0.6 |
| b003 | 1.6 | 4.2 | 1.8 |
| b004 | 0.2 | 6.0 | 2.0 |
| b005 | 0.0 | 1.0 | 0.6 |
| b006 | 1.4 | 6.6 | 2.4 |
| b007 | 1.4 | 6.0 | 2.4 |
| b008 | 3.2 | 1.2 | 2.2 |
| b009 | 6.0 | 15.6 | 7.2 |
| b010 | 1.0 | 4.6 | 1.0 |
| b011 | 0.0 | 1.8 | 0.6 |
| b012 | 2.2 | 0.6 | 3.0 |
| b013 | 0.6 | 0.8 | 0.8 |
| b014 | 1.2 | 3.4 | 1.4 |
| b015 | 1.0 | 0.6 | 0.6 |
| b016 | 3.4 | 4.8 | 3.4 |
| b017 | 0.2 | 0.4 | 0.6 |
| b018 | 3.4 | 10.0 | 3.0 |
| b019 | 1.6 | 0.8 | 0.6 |
| b020 | 0.8 | 8.0 | 4.4 |
| Average | 1.6 | 4.0 | 2.0 |
| CI | ±3.1 | ±7.8 | ±3.3 |
| Record | MAE (bpm) | MAE (bpm) | MAE (bpm) |
|---|---|---|---|
| b001 | 1.6 | 1.8 | 2.6 |
| b002 | 1.2 | 2.8 | 0.8 |
| b003 | 0.2 | 3.6 | 1.2 |
| b004 | 3.0 | 6.8 | 1.4 |
| b005 | 0.0 | 2.8 | 1.0 |
| b006 | 2.4 | 5.4 | 1.8 |
| b007 | 0.4 | 6.0 | 2.0 |
| b008 | 1.6 | 1.8 | 2.4 |
| b009 | 1.6 | 13.4 | 4.6 |
| b010 | 1.6 | 3.4 | 1.8 |
| b011 | 0.4 | 3.6 | 1.0 |
| b012 | 6.6 | 1.0 | 4.8 |
| b013 | 2.6 | 0.6 | 0.6 |
| b014 | 3.6 | 4.0 | 1.8 |
| b015 | 0.8 | 1.0 | 0.8 |
| b016 | 4.8 | 6.0 | 2.6 |
| b017 | 0.2 | 0.6 | 0.4 |
| b018 | 1.6 | 11.6 | 5.8 |
| b019 | 1.8 | 1.6 | 1.0 |
| b020 | 0.2 | 10.2 | 3.0 |
| Average | 1.8 | 4.4 | 2.1 |
| CI | ±3.4 | ±7.4 | ±3.0 |
| Record | MAE (bpm) | MAE (bpm) | MAE (bpm) |
|---|---|---|---|
| b001 | 4.4 | 1.4 | 4.8 |
| b002 | 1.2 | 5.0 | 1.8 |
| b003 | 0.0 | 0.2 | 0.2 |
| b004 | 6.8 | 8.4 | 2.2 |
| b005 | 8.6 | 6.6 | 2.8 |
| b006 | 5.4 | 7.6 | 2.8 |
| b007 | 1.6 | 7.8 | 3.2 |
| b008 | 4.4 | 1.4 | 4.6 |
| b009 | 4.2 | 13.8 | 5.6 |
| b010 | 1.6 | 7.2 | 2.6 |
| b011 | 0.4 | 3.0 | 3.2 |
| b012 | 3.6 | 1.6 | 3.2 |
| b013 | 8.4 | 1.0 | 3.8 |
| b014 | 1.4 | 2.0 | 0.8 |
| b015 | 1.0 | 2.6 | 1.0 |
| b016 | 1.6 | 5.2 | 3.8 |
| b017 | 0.2 | 0.6 | 0.8 |
| b018 | 2.4 | 10.6 | 5.4 |
| b019 | 6.0 | 1.0 | 2.8 |
| b020 | 1.4 | 9.2 | 4.2 |
| Average | 3.2 | 4.8 | 3.9 |
| CI | ±5.4 | ±7.8 | ±3.1 |
| Record | MAE (bpm) | MAE (bpm) | MAE (bpm) |
|---|---|---|---|
| b001 | 0.6 | 2.6 | 2.6 |
| b002 | 1.2 | 1.6 | 1.6 |
| b003 | 0.2 | 7.6 | 6.2 |
| b004 | 1.6 | 2.6 | 2.4 |
| b005 | 0.6 | 2.0 | 2.0 |
| b006 | 2.2 | 21.4 | 21.4 |
| b007 | 2.4 | 9.0 | 9.0 |
| b008 | 0.6 | 2.6 | 2.6 |
| b009 | 0.8 | 1.0 | 0.8 |
| b010 | 1.6 | 1.8 | 1.4 |
| b011 | 2.6 | 3.0 | 3.0 |
| b012 | 3.4 | 3.4 | 3.4 |
| b013 | 1.4 | 3.8 | 3.8 |
| b014 | 0.2 | 2.8 | 2.8 |
| b015 | 1.6 | 2.0 | 2.0 |
| b016 | 4.4 | 4.0 | 3.8 |
| b017 | 0.0 | 1.0 | 1.0 |
| b018 | 3.6 | 4.0 | 4.0 |
| b019 | 0.2 | 4.2 | 4.2 |
| b020 | 0.8 | 5.0 | 4.6 |
| Average | 1.5 | 4.3 | 4.1 |
| CI | ±2.5 | ±9.0 | ±9.0 |
| Record | MAE (bpm) |
|---|---|
| b001 | 2.4 |
| b002 | 1.6 |
| b003 | 0.2 |
| b004 | 1.2 |
| b005 | 0.4 |
| b006 | 2.4 |
| b007 | 1.2 |
| b008 | 2.4 |
| b009 | 1.4 |
| b010 | 0.8 |
| b011 | 0.6 |
| b012 | 1.4 |
| b013 | 2.4 |
| b014 | 1.8 |
| b015 | 1.0 |
| b016 | 3.4 |
| b017 | 0.6 |
| b018 | 2.8 |
| b019 | 1.2 |
| b020 | 0.6 |
| Average | 1.5 |
| CI | ±1.8 |
| Range of Reference BR | S1-S1 Interval | S1 Intensity | S2 Intensity | S1/S2 | EMDDR | AM |
|---|---|---|---|---|---|---|
| MAE (CI) | MAE (CI) | MAE (CI) | MAE (CI) | MAE (CI) | MAE (CI) | |
| ≤12 bpm | 1.40 () | 1.73 () | 2.53 () | 1.47 () | 1.80 () | 2.93 () |
| 12–16 bpm | 3.22 () | 1.39 () | 1.29 () | 1.54 () | 1.51 () | 2.83 () |
| 16–20 bpm | 7.18 () | 2.55 () | 0.82 () | 1.27 () | 0.64 () | 2.77 () |
| ≥20 bpm | 13.41 () | 7.82 () | 2.59 () | 3.41 () | 1.73 () | 4.91 () |
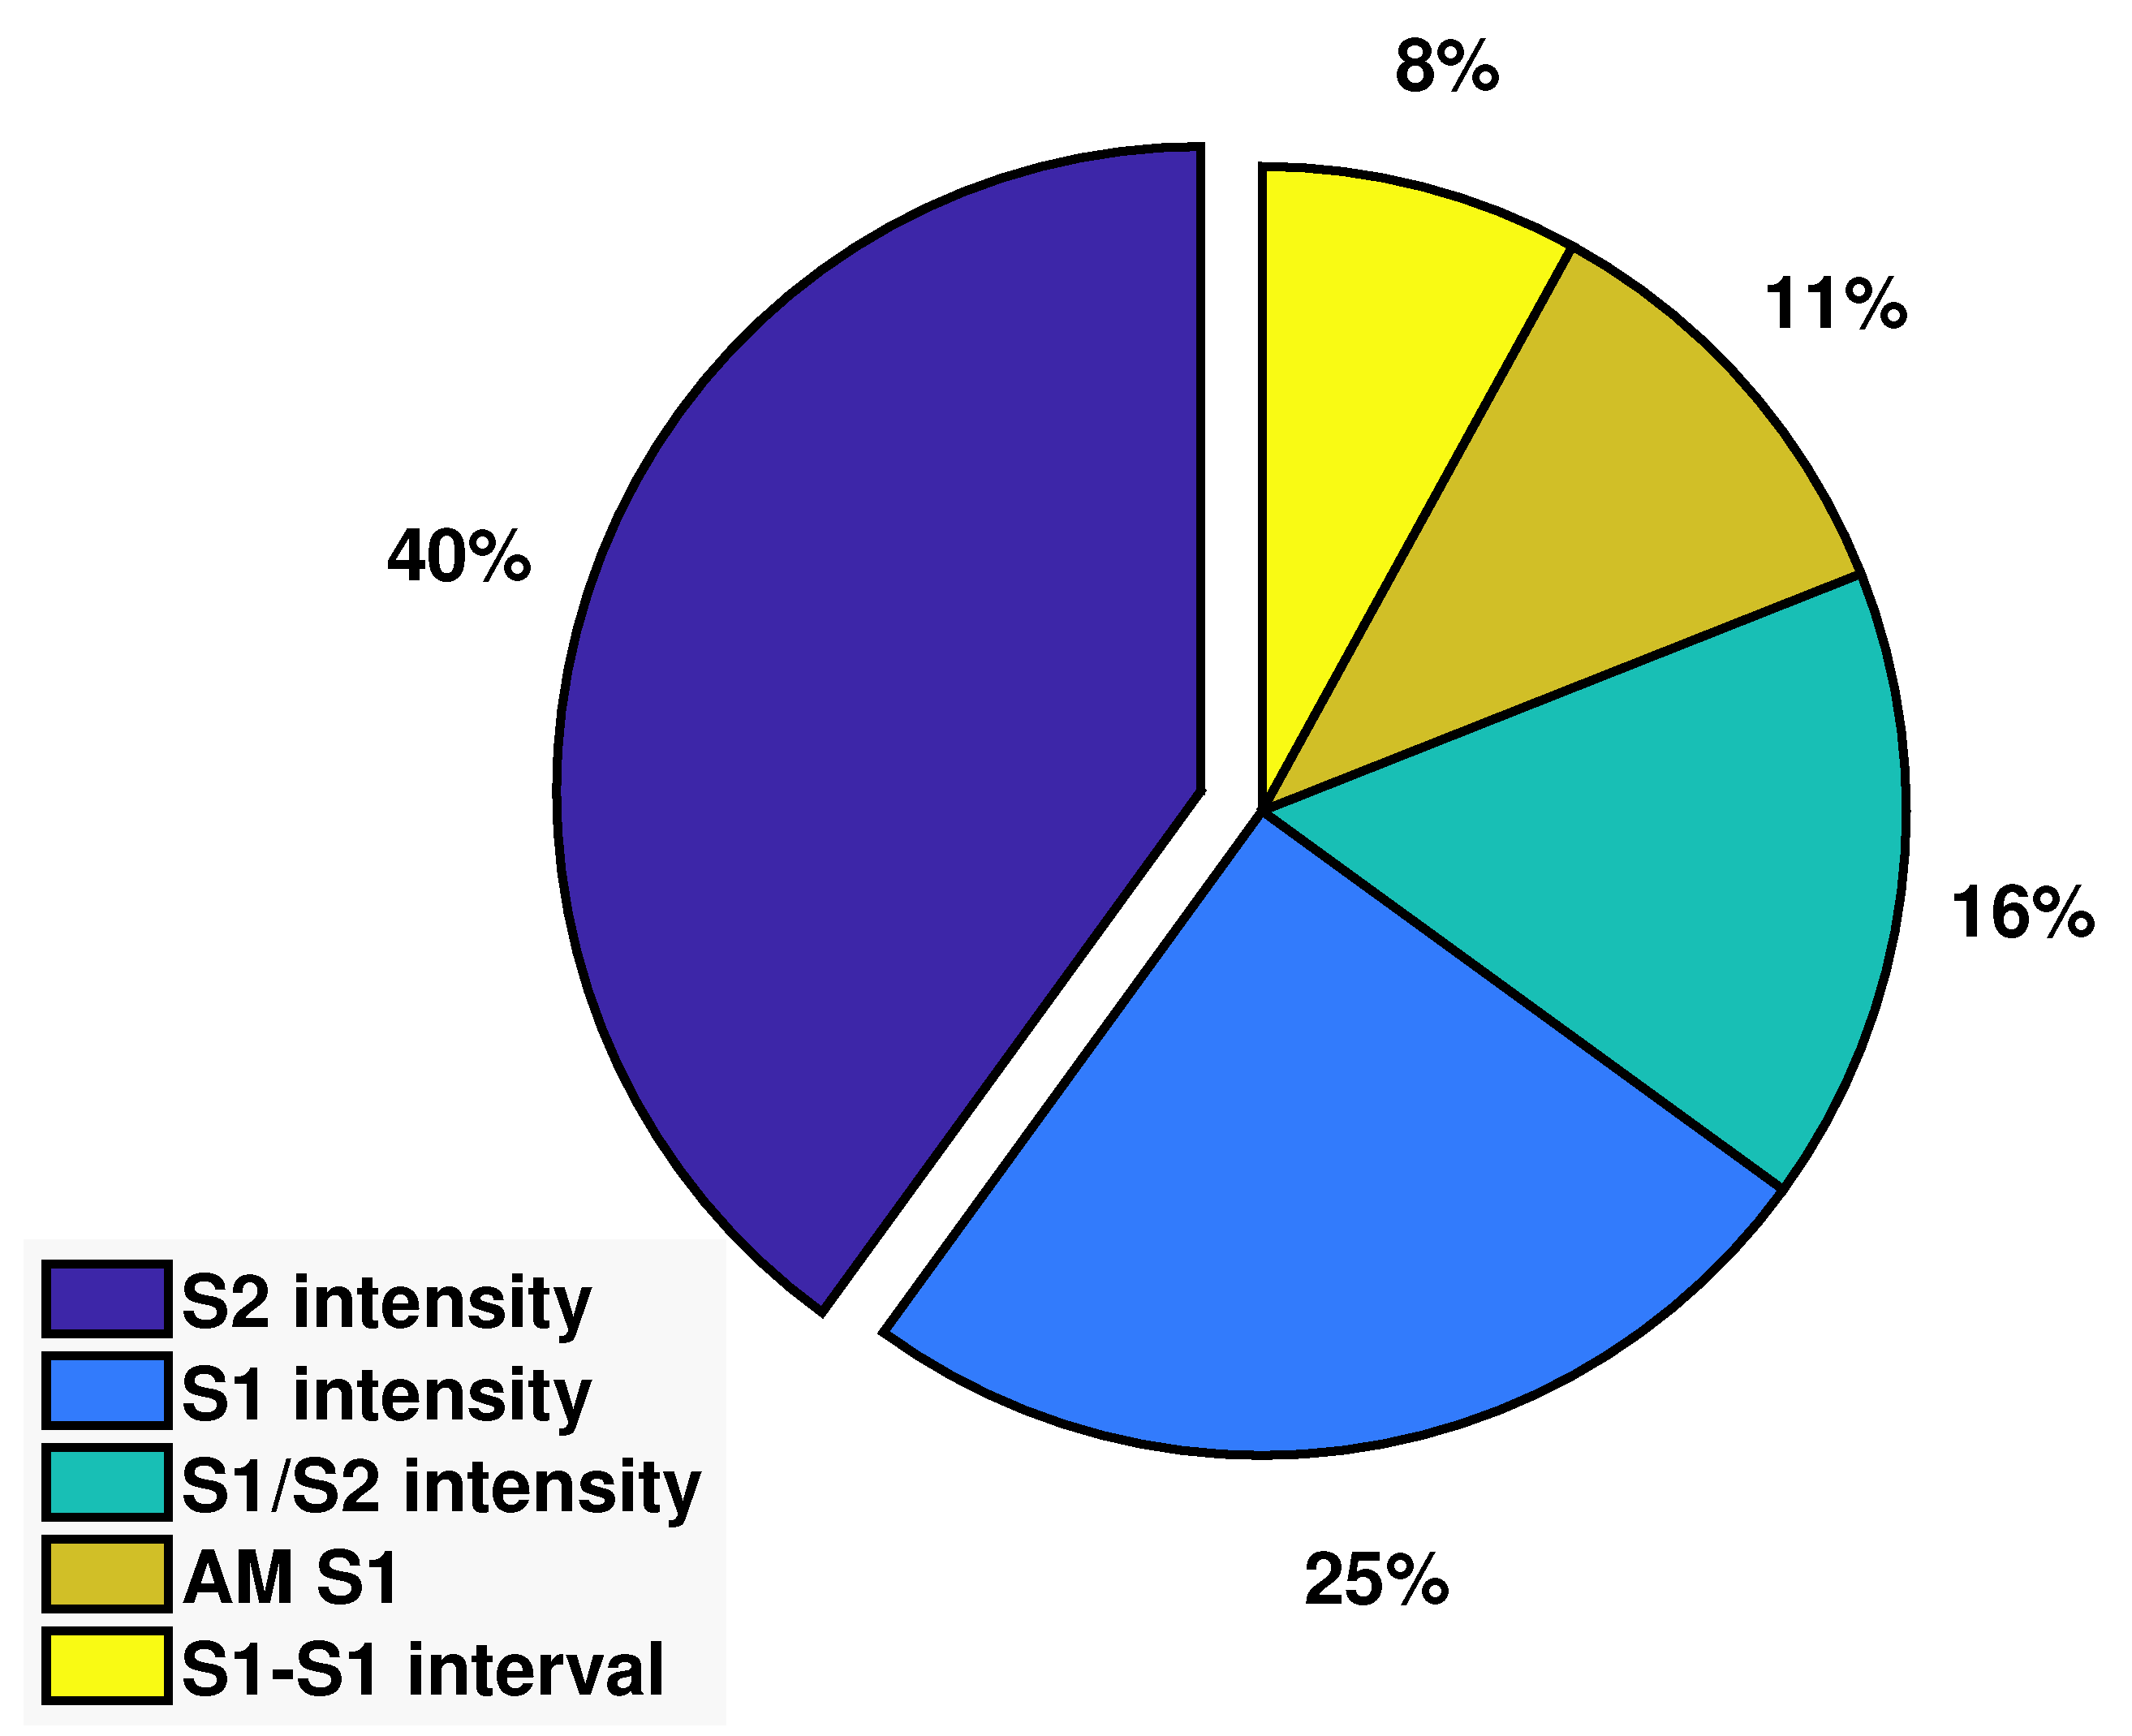
| Range of Reference BR | S1-S1 Interval (%) | S1 Intensity (%) | S2 Intensity (%) | S1/S2 (%) | AM (%) |
|---|---|---|---|---|---|
| ≤12 bpm | 18.75 | 37.50 | 18.75 | 18.75 | 6.25 |
| 12–16 bpm | 12.20 | 19.51 | 34.15 | 14.63 | 19.51 |
| 16–20 bpm | - | 36.36 | 50.00 | 9.09 | 4.55 |
| ≥20 bpm | - | 14.29 | 52.83 | 23.81 | 9.52 |
Publisher’s Note: MDPI stays neutral with regard to jurisdictional claims in published maps and institutional affiliations. |
© 2021 by the authors. Licensee MDPI, Basel, Switzerland. This article is an open access article distributed under the terms and conditions of the Creative Commons Attribution (CC BY) license (https://creativecommons.org/licenses/by/4.0/).
Share and Cite
Kozia, C.; Herzallah, R. Advanced Fusion and Empirical Mode Decomposition-Based Filtering Methods for Breathing Rate Estimation from Seismocardiogram Signals. Information 2021, 12, 368. https://doi.org/10.3390/info12090368
Kozia C, Herzallah R. Advanced Fusion and Empirical Mode Decomposition-Based Filtering Methods for Breathing Rate Estimation from Seismocardiogram Signals. Information. 2021; 12(9):368. https://doi.org/10.3390/info12090368
Chicago/Turabian StyleKozia, Christina, and Randa Herzallah. 2021. "Advanced Fusion and Empirical Mode Decomposition-Based Filtering Methods for Breathing Rate Estimation from Seismocardiogram Signals" Information 12, no. 9: 368. https://doi.org/10.3390/info12090368
APA StyleKozia, C., & Herzallah, R. (2021). Advanced Fusion and Empirical Mode Decomposition-Based Filtering Methods for Breathing Rate Estimation from Seismocardiogram Signals. Information, 12(9), 368. https://doi.org/10.3390/info12090368