Article

Product Customer Satisfaction Measurement Based on Multiple Online Consumer Review Features

1
College of Information and Electrical Engineering, China Agricultural University, Beijing 100083, China
2
School of Finance, Nankai University, Tianjin 300350, China
3
Nankai Business School, Nankai University, Tianjin 300071, China
*
Author to whom correspondence should be addressed.
Information 2021, 12(6), 234; https://doi.org/10.3390/info12060234
Submission received: 17 April 2021 / Revised: 21 May 2021 / Accepted: 26 May 2021 / Published: 29 May 2021
(This article belongs to the Special Issue Personalized Visual Recommendation for E-Commerce)

Abstract

:
With the development of the e-commerce industry, various brands of products with different qualities and functions continuously emerge, and the number of online shopping users is increasing every year. After purchase, users always leave product comments on the platform, which can be used to help consumers choose commodities and help the e-commerce companies better understand the popularity of their goods. At present, the e-commerce platform lacks an effective way to measure customer satisfaction based on various customer comments features. In this paper, our goal is to build a product customer satisfaction measurement by analyzing the relationship between the important attributes of reviews and star ratings. We first use an improved information gain algorithm to analyze the historical reviews and star rating data to find out the most informative words that the purchasers care about. Then, we make hypotheses about the relevant factors of the usefulness of reviews and verify them using linear regression. We finally establish a customer satisfaction measurement based on different review features. We conduct our experiments based on three products with different brands chosen from the Amazon online store. Based on our experiments, we discover that features such as length and extremeness of the comments will affect the review usefulness, and the consumer satisfaction measurement constructed using the exponential moving average method can effectively reflect the trend of user satisfaction over time. Our work can help companies acquire valuable suggestions to improve product features, increase sales, and help customers make wise purchases.

1. Introduction

The popularization of the Internet brings the development of e-commerce [1]. E-commerce is an online business such as online retail, stock trading, or real estate [2]. A recent statistical report shows that more and more consumers prefer online shopping from e-commerce platforms such as Amazon, Taobao, and eBay [3].
Online consumer reviews (OCRs) are what consumers post on company websites or third-party websites after buying products or services. They are the consumer expressions of products, which directly reflect the customer’s satisfaction with the commodities [4]. It has been proved that consumers read consumer reviews carefully before shopping. As a result, these comments have a significant impact on product sales and consumers’ shopping decisions.
Customer satisfaction reflected in OCRs is one of the crucial factors to improve product quality in an aggressive marketplace. Extensive research on product and service quality began in the early 1980s. Early studies determined customer satisfaction degree based on the data collected in questionnaires [5,6], interviews [7], etc. These methods sometimes have limitations on data collection and cannot truly reflect purchasers’ satisfaction degree of the products. With the development of e-commerce, more and more online shopping platforms with a large number of online consumer reviews appear. Many products on the e-commerce platform may have tens of thousands of customer reviews, which is impossible for the consumers and companies to read through [8]. Some studies apply natural language processing technology to analyze the review text and measure the user’s satisfaction degree [9,10]. As we know, users only comment on the features they care about by the review text. It is not enough to measure customer satisfaction only from the content of the text. In practical applications, it is necessary to integrate the various features of reviews for analyzing the satisfactory degree.
In online stores such as Amazon, customers can give star ratings and text reviews of the products they bought. Star ratings allow purchasers to express their satisfaction level on a scale of 1 (low rated, low satisfaction) to 5 (highly rated, high satisfaction). Text reviews allow purchasers to express further opinions and information about the product. Furthermore, some platforms have made efforts to distinguish the validity of comments. For instance, Yelp deletes fake reviews; Amazon sorts the reviews based on their helpfulness votes [11]. In this way, other customers can decide whether they will buy the product based on these data and submit helpfulness ratings to show how valuable these reviews are for making their own purchasing decisions [12]. Manufacturers can use these data to gain insights into the markets they participate in, and the potential success of a certain product design [13]. As a result, how to define customer satisfaction degree from combined review features, such as review content, review time, and reviewers, has become an important issue.
In this paper, we integrate multiple review features to determine the customer satisfaction degree, including text review content, star rating, review helpfulness votes, comment time, and reviewers. First, we propose an improved information gain model to find the most informative words under each star rating. Then, we make some assumptions to investigate what factors affect the usefulness of comments. To verify these assumptions, we construct a simple comment usefulness index based on helpfulness votes. Then, we use linear regression to see the significance of these factors. Finally, we establish a customer satisfaction measurement to quantify customer satisfaction degree. In our experiments, we choose three kinds of products in the Amazon online store: microwave ovens, baby pacifiers, and hair dryers. Based on our customer satisfaction measurement, we get the customer satisfaction curves of different brands over time, which can help to identify the best and the worst products.
The novelty of this paper lies in three aspects: (1) To extract better feature terms, we improve the information gain mode using the mutual information calculation, which considers the absolute number of times each word appears. (2) We take advantage of the EMA method to obtain a stable time-varying rolling evaluation curve. (3) To solve the problem of data missing or data sparsity on some time nodes, we use the HP filter for sequence preprocessing and obtain a better description of the changing trend of customer satisfaction.
The rest of the paper is organized as follows. In Section 2, we present the related work on customer satisfaction measurement and the information gain model, which will be improved later to carry out our experiment. In Section 3, we first find the informative words in OCRs based on an improved information gain model and then evaluate the helpfulness of an OCR. Based on the results, we further propose a customer satisfaction model. The experimental results and analysis are shown in Section 4. In Section 5, we present the conclusion of the study.

2. Related Work

2.1. Customer Satisfaction Measurement

Customer satisfaction is defined as a measurement that determines how happy customers are with products, services, and capabilities [14]. Customer satisfaction information, reflected by customer reviews and ratings, can help a company improve its products and services [15]. A customer review is a review of a commodity or service offered by a consumer who has purchased and used the product or service. Customer reviews reflect the consumers’ satisfaction degree with their purchased goods [16].
For a long time, researchers are trying to find the factors and evaluation indicators of customer satisfaction. The early theoretical model of customer satisfaction mainly provided a qualitative analysis method for satisfaction evaluation [17]. Simultaneously, researchers and practitioners paid more and more attention to the quantitative analysis of customer satisfaction. At the end of the 1980s, Fornell combined the mathematical calculation method of customer satisfaction and customers’ psychological perception and proposed the Fornell model, which became the theoretical basis for developing customer satisfaction index models in various countries [18]. In 1989, the Swedish Statistics Bureau designed the national Swedish Customer Satisfaction Barometer (SCSB) for the first time based on the Fornell model [19]. Subsequently, Fornell et al. proposed the American Customer Satisfaction Index (ACSI) with the basic framework of perceived quality, perceived value, customer expectations, customer satisfaction, customer loyalty, and customer complaints [20], which has become the most popular Customer Satisfaction Index today. Two other representative customer satisfaction index evaluations are the European Customer Satisfaction Index Model (ECSI) and China Customer Satisfaction Index model (CCSI).
In existing studies, the ways to obtain satisfaction include questionnaires [5,6], interviews [7], and other methods. Chai et al. collected a large amount of data through online questionnaire surveys to determine the relevant evaluation indicators of customer satisfaction. They used F-AHP to establish an evaluation indicator system and layered calculations of evaluation matrices to calculate customer satisfaction for cross-border beauty e-commerce. Degree [21]. However, these methods may cause customers to make wrong decisions due to customers’ unwillingness to cooperate or interference from external factors in the survey process. The evaluation cannot truly reflect their satisfaction after purchasing the product.
Xu et al. used AHP to determine the weights of evaluation indicators for third-party logistics service providers. From the customers’ perspective, they evaluated third-party logistics service providers through a combination of quantitative and qualitative methods [22]. Zhang et al. established a mathematical model of customer satisfaction for construction enterprises and used partial least squares linear regression analysis and principal component analysis to construct a linear relationship between hidden variables and observed variables [23]. However, the interpretation of principal components usually has a vague meaning, not as clear and precise as the original variable’s meaning, which will reduce the result’s accuracy. Zhu used AMOS22.0 to establish a structural equation model to analyze customer satisfaction and combined it with the QFD method to establish the quality model of customer satisfaction [24]. AMOS22.0 requires a large sample and has the shortcoming of insufficient non-normal data processing ability. Shen et al. established a customer satisfaction evaluation model for budget hotels based on ACSI and took the budget hotels in Shanghai as an example to verify the practicability and effectiveness of the model [25]. However, the path from perceived quality to perceived value in both the ACSI model and the ECSI model cannot be well explained, leading to poor calculation results.
In recent years, the development of Internet technology has changed the behavior of customers. Customers are more inclined to shop online and comment on product satisfaction after consumption. These comments reflect the degree of customer expectations and will affect potential customers’ purchase decisions. Compared with information obtained through questionnaires and interviews, online reviews are spontaneously generated by customers and better reflect customers’ true feelings about product satisfaction.
Shen et al. built an online review Bayesian network based on product reviews, used a cross-validation method to test the model, calculated the posterior probability distribution and conditional probability distribution of related nodes, and finally obtained the correlation between customer satisfaction and other associated variables [9]. Feng et al. collected a large amount of online review data in fresh food e-commerce and extracted the influencing factor of customer satisfaction in online reviews based on the LDA model. They also calculated the customer’s emotional tendency score based on online reviews [10].
It needs to be pointed out that when customers post text comments, they just comment on the attributes which they are concerned about. Therefore, the structured data converted from some comments involving fewer attributes are also scarce [26]. In this case, it is not easy to evaluate customer satisfaction using text reviews. Some websites set several characteristics in advance, allowing customers to score different attributes. Geetha et al. [27] found that text reviews and ratings are emotionally consistent, so online ratings can be used to evaluate customer satisfaction. Liu et al. [28] provided customer satisfaction evaluation methods using different review languages based on online hotel ratings. Li et al. proposed a hotel service quality evaluation based on online ratings using the PROMETHEE-II method [29]. Ahani et al. took hotels in the Canary Islands as an example, using a multicriteria decision-making method to determine customer satisfaction and preferences [30]. He et al. combined the frequency of clicks, browsing frequency, collection frequency, and shopping cart frequency in evaluation indicators, which is similar to the PROMETHEE-II process [31]. However, these data are not highly differentiated and are easily affected by order scalping.

2.2. Information-Gain-Algorithm-Related Theories

In this paper, we use the information gain model for online reviews on the website to find the feature items most relevant to each star rating of different products. Information gain ( I G ) is an indicator used to measure the influence of the presence or absence of a feature item on text classification [32]. For feature item t and text category j, the I G value of feature item t on category j is obtained mainly by count the number of texts with and without feature item t in category j. The information gain I G ( t ) formula of the feature term t is as follows [33].
I G ( t ) = H ( C ) H ( C | t ) = i = 1 | c | P c i log 2 P c i + P ( t ) i = 1 | c | P c i | t log 2 P c i | t + P ( t ¯ ) i = 1 | c | P c i | t ¯ log 2 P c i | t ¯
where C j indicates type j document, j = 1 , 2 , . . . , m .
t ¯ means that the feature t does not appear.
p ( c j ) is the probability that a type j document appears in the training set.
p ( t ) is the probability of feature t appearing in a text set.
p ( c j / t ) is the conditional probability that feature term t appearing in the text also belongs to the class j.
p ( t ¯ ) is the probability of feature t not appearing in the text set.
p ( c j / t ¯ ) is the conditional probability that feature term t not appearing in the text also belongs to the class j.
In general, the larger the I G value of the feature term, the greater its effect on classification. To reduce the spatial dimension, we usually choose several feature items with large I G values to form the feature vector of the document [34]. However, when the number distribution of all categories in the text set is severely unbalanced, the I G value obtained from the small document is small. In this case, I G algorithms have a negative impact on feature selection. An improved formula of I G ( t ) to eliminate this negative effect caused by the uneven distribution of the number of documents is as follows:
I G ( t ) = p ( t ) j p c j | t log 2 p c j | t p c j + p ( t ¯ ) j p c j | t ¯ log 2 p c j | t ¯ p c j

3. Methodology

3.1. Assumptions and Symbol Descriptions

In this paper, we face the problem of measuring the customer satisfaction for online products by aggregating review content, star rating, review helpfulness votes, review time, and special purchasers such as Amazon Vine Voices, who have earned credibility in the Amazon community for writing accurate and insightful reviews. Table 1 presents the descriptions of notations used in the rest of this paper.
We make the following assumptions to simplify our analysis and model:
  • Star ratings are consistent with reviews in level of satisfaction.
  • The more recent the star rating is given, the more effective it is on potential customers.
  • Customers’ ratings and reviews truly reflect their satisfaction level on the product.
  • We assume all data we obtain are trustworthy since all of sources are reliable.

3.2. An Improved Information Gain Model

In this subsection, we want to find out the most informative review words in each star rating from a large number of review text data. These words may reflect the users’ emotions and concerns. We propose an improved information gain algorithm to process and analyze review text to determine the most informative review words under different star ratings.
As we know, if a feature item repeatedly appears in all classes, this feature item is considered not to affect text classification. Conversely, if a feature item appears in only one class and rarely in other classes, it is considered useful in text classification. In this section, we use an improved algorithm of information entropy in information theory to measure the concentration degree of feature term among classes. The more concentrated feature terms are distributed among the categories, the larger the value obtained. The more evenly feature terms are distributed among the categories, the smaller the value obtained. The specific calculation steps are as follows.
H ( C ) = j = 1 m f C , t i A i log 2 f C , t i A i
In this case, the range of a i is [ 0 , log 2 m ] . We normalize the calculation as follows.
a i = H ( C ) log 2 m
After normalization, the more concentrated the feature term t i is distributed between classes, the smaller the value of a i is (closer to 0). The more evenly the feature term t i is distributed between classes, the larger the value of a i is (closer to 1). This is negatively related to the desired result, so the real multiplication factor is as follows.
b i = 1 a i
In summary, the improved algorithm we get is:
I G ( t ) = b i p ( t ) j p c j | t log 2 p c j | t p c j + p ( t ¯ ) j p c j | t ¯ log 2 p c j | t ¯ p c j

3.3. Determinate Factors on Review Usefulness

In some e-commerce platforms such as Amazon, other customers can vote for the customer reviews as being helpful or not toward assisting their own product purchasing decision. Therefore, the number of votes received by each review reflects the usefulness of a review in helping users make purchase decisions. In this subsection, we explore the factors that affect the usefulness of a customer review. Some researchers indicate that multiple facts, such as the length of the reviews, the customer ratings, and the regular customer’s review, would influence the usefulness of the reviews [35]. Based on this, we examined some control variables on the usefulness of comments and make the following assumptions:
Hypothesis 1.
The length of comment content has a positive impact on the usefulness of the comment.
The review text usually contains product attributes, emotional tendency, and main points of view. The length of a review can increase the recognizability of the information. The longer the review, the more information it may contain, and the more favorable it is for consumers to make purchasing decisions.
Hypothesis 2.
The extremeness of star rating has a positive impact on the usefulness of the evaluation.
Scoring extremes describe how strong a consumer’s emotional tendencies are when evaluating a product. Studies have shown that the extreme nature of ratings affects consumers’ perception of the value of online reviews, thereby affecting the usefulness of reviews. The extremeness of scoring will be further expressed through reviews, which will resonate with consumers and influence consumers to make shopping decisions.
Hypothesis 3.
Vine has a positive impact on the usefulness of commment.
Vine members are customers who have a good reputation on the Amazon store and often write accurate and insightful reviews. Their reviews may contain more helpful information for consumers to shop.
Hypothesis 4.
The verified purchase has a positive impact on the usefulness of comments.
If people have their purchases confirmed and are listed as verified, it means that the people who write the review purchased the product at Amazon and did not receive the product at a deep discount. Obviously, the comments from these people are also more informative.
To see whether these assumptions are correct, we established a regression model for comment usefulness evaluation. In this paper, we take V i to measure the helpfulness of comments. The formula is as follows:
V i = H i T i
The purpose of using the root of T i instead of T i in the denominator is because we consider not only the absolute numerical impact of helpful votes but also the relative proportion of total votes. For example, the values of 2 5 and 6 15 are the same, but 6 15 has more absolute customer votes, so it should be more reliable to determine the usefulness value.
Based on the comment helpfulness measurement, we use the following multiple linear regression model to verify the proposed hypothesis.
V i = β 0 + β 1 L i + β 2 extremeness + β 3 vine + β 4 verifed
where the extremeness of the rating is represented by ( R i 3 ) 2 . The length of the review content L i is represented by the logarithmic form.

3.4. Customer Satisfaction Model

To measure the customer satisfaction score, we first define the effectiveness of a star rating. Several factors can influence the effectiveness of a star rating, such as the helpful rating and whether the rating is given by Amazon Vine Voice. The function of effectiveness is:
E i = ( 1 + θ vine ) 1 + φ H i T i
Then, the weighted star rating effectiveness E R i is:
E R i = E i R i
As we have assumed above, the more recent the rating is given, the more effective it is on potential customers. Nan Chen [36] discovered that initial comments will have an anchoring effect on people. Due to individuals’ cognitive bias, when individuals make decisions, people’s judgment is often affected by the initial information provided. We use exponential moving average (EMA) to weigh the star ratings by time [37]. The equation can be expressed as follows.
i = 0 N EMA N E R i = α i = ( k 1 ) t ( k 1 ) t + N ( 1 α ) i E R ( k 1 ) t + N i
where
α = 2 N + 1
According to Equations (8)–(11), we establish a customer satisfaction indicator with the following formula.
L t = 2 N + 1 i = ( k 1 ) t ( k 1 ) t + N N 1 N + 1 i E R ( k 1 ) t + N i 2 N + 1 i = ( k 1 ) t ( k 1 ) t + N N 1 N + 1 i · E ( k 1 ) t + N i
where L t is the weighted satisfaction indicator.
In our experiment, we will use L t to draw the customer satisfaction curves of different products in different periods.
We assume that the original fluctuation consists of the main trend component and the noise component where y t is the original fluctuation, g t is the main trend component, and c t is the noise component. The correlation is:
y t = g t + c t t = 1 , 2 , , T
We transform the noise elimination problem into the following minimization problem:
min S ( λ ) = min t = 1 T y t g t 2 + λ t = 3 T g t g t 1 g t 1 g t 2 2
where the residual term t = 1 T y t g t 2 measures the distance between the main trend component and the original fluctuation. The second order difference term measures the smoothness of the trend g t . It is easy to know that when λ is equal to 0, min S ( λ ) is the original fluctuation y t itself. When λ approaches to , the trend g t approaches to a linear function. Empirically, we assume λ is equal to 14,400. The solution to the HP filter optimization problem is as follows. By taking the partial derivatives of different, we can get the system of equations:
S g 1 = 2 y 1 g 1 + 2 λ g 3 2 g 2 + g 1 = 0 S g 2 = 2 y 2 g 2 + 2 λ g 4 2 g 3 + g 2 4 λ g 3 2 g 2 + g 1 = 0 S g T 1 = 2 y T 1 g T 1 + 2 λ g T 1 2 g T 2 + g T 3 4 λ g T 2 g T 1 + g T 2 = 0 S g T = 2 y T g T + 2 λ g T 2 g T 1 + g T 2 = 0
The matrix form of the system is:
I + λ 1 2 2 0 0 2 4 + 1 2 2 0 0 1 2 2 1 + 4 + 1 0 0 0 0 0 1 + 4 2 0 0 0 2 1 g 1 g 2 g 3 g T 1 g T = y 1 y 2 y 3 y T 1 y T
where I is unit matrix. Then, we can get the main trend g i by the above equation.

4. Experimental Results and Analysis

4.1. Data Sets

The data source used in this article is obtained from the 2020 Mathematical Contest in Modeling: MCM PROBLEM C: A Wealth of Data (available at https://www.comap.com/undergraduate/contests/mcm/contests/2020/problems/ (accessed on 28 May 2021 )). It contains a total of 32,024 rows of three products: hair dryer, microwave, and pacifier. The three files contain user ratings and reviews extracted from the Amazon Customer Reviews Dataset through Amazon Simple Storage Service (Amazon S3). Data details are shown in Table 2.

4.2. Informative Words under Different Star Ratings

We use the improved information gain model to process the comment review text data under different star ratings. To preprocess the text data, we concatenate the comment title in the data with the comment content (separated by spaces), convert all letters to lowercase letters, discard words such as prepositions, pronouns, and retain adjectives, nouns, and verbs as feature terms. If a negative word appears, a new phrase consisting of “not” and the following adjective, verb, or noun is identified as a feature term. Finally, the feature items are ranked according to the value of IG obtained by the proposed algorithm.
Table 3, Table 4 and Table 5 show the top ten feature terms related to each star rating in each product. As shown in the tables, the more positive the review keywords, the higher the star rating, and vice versa. Take the microwave oven as an example. Consumers who rated five stars generally leave comments such as “love” and “perfect”. In comparison, consumers who rated one star leave more reviews such as “junk” and “not buy”.

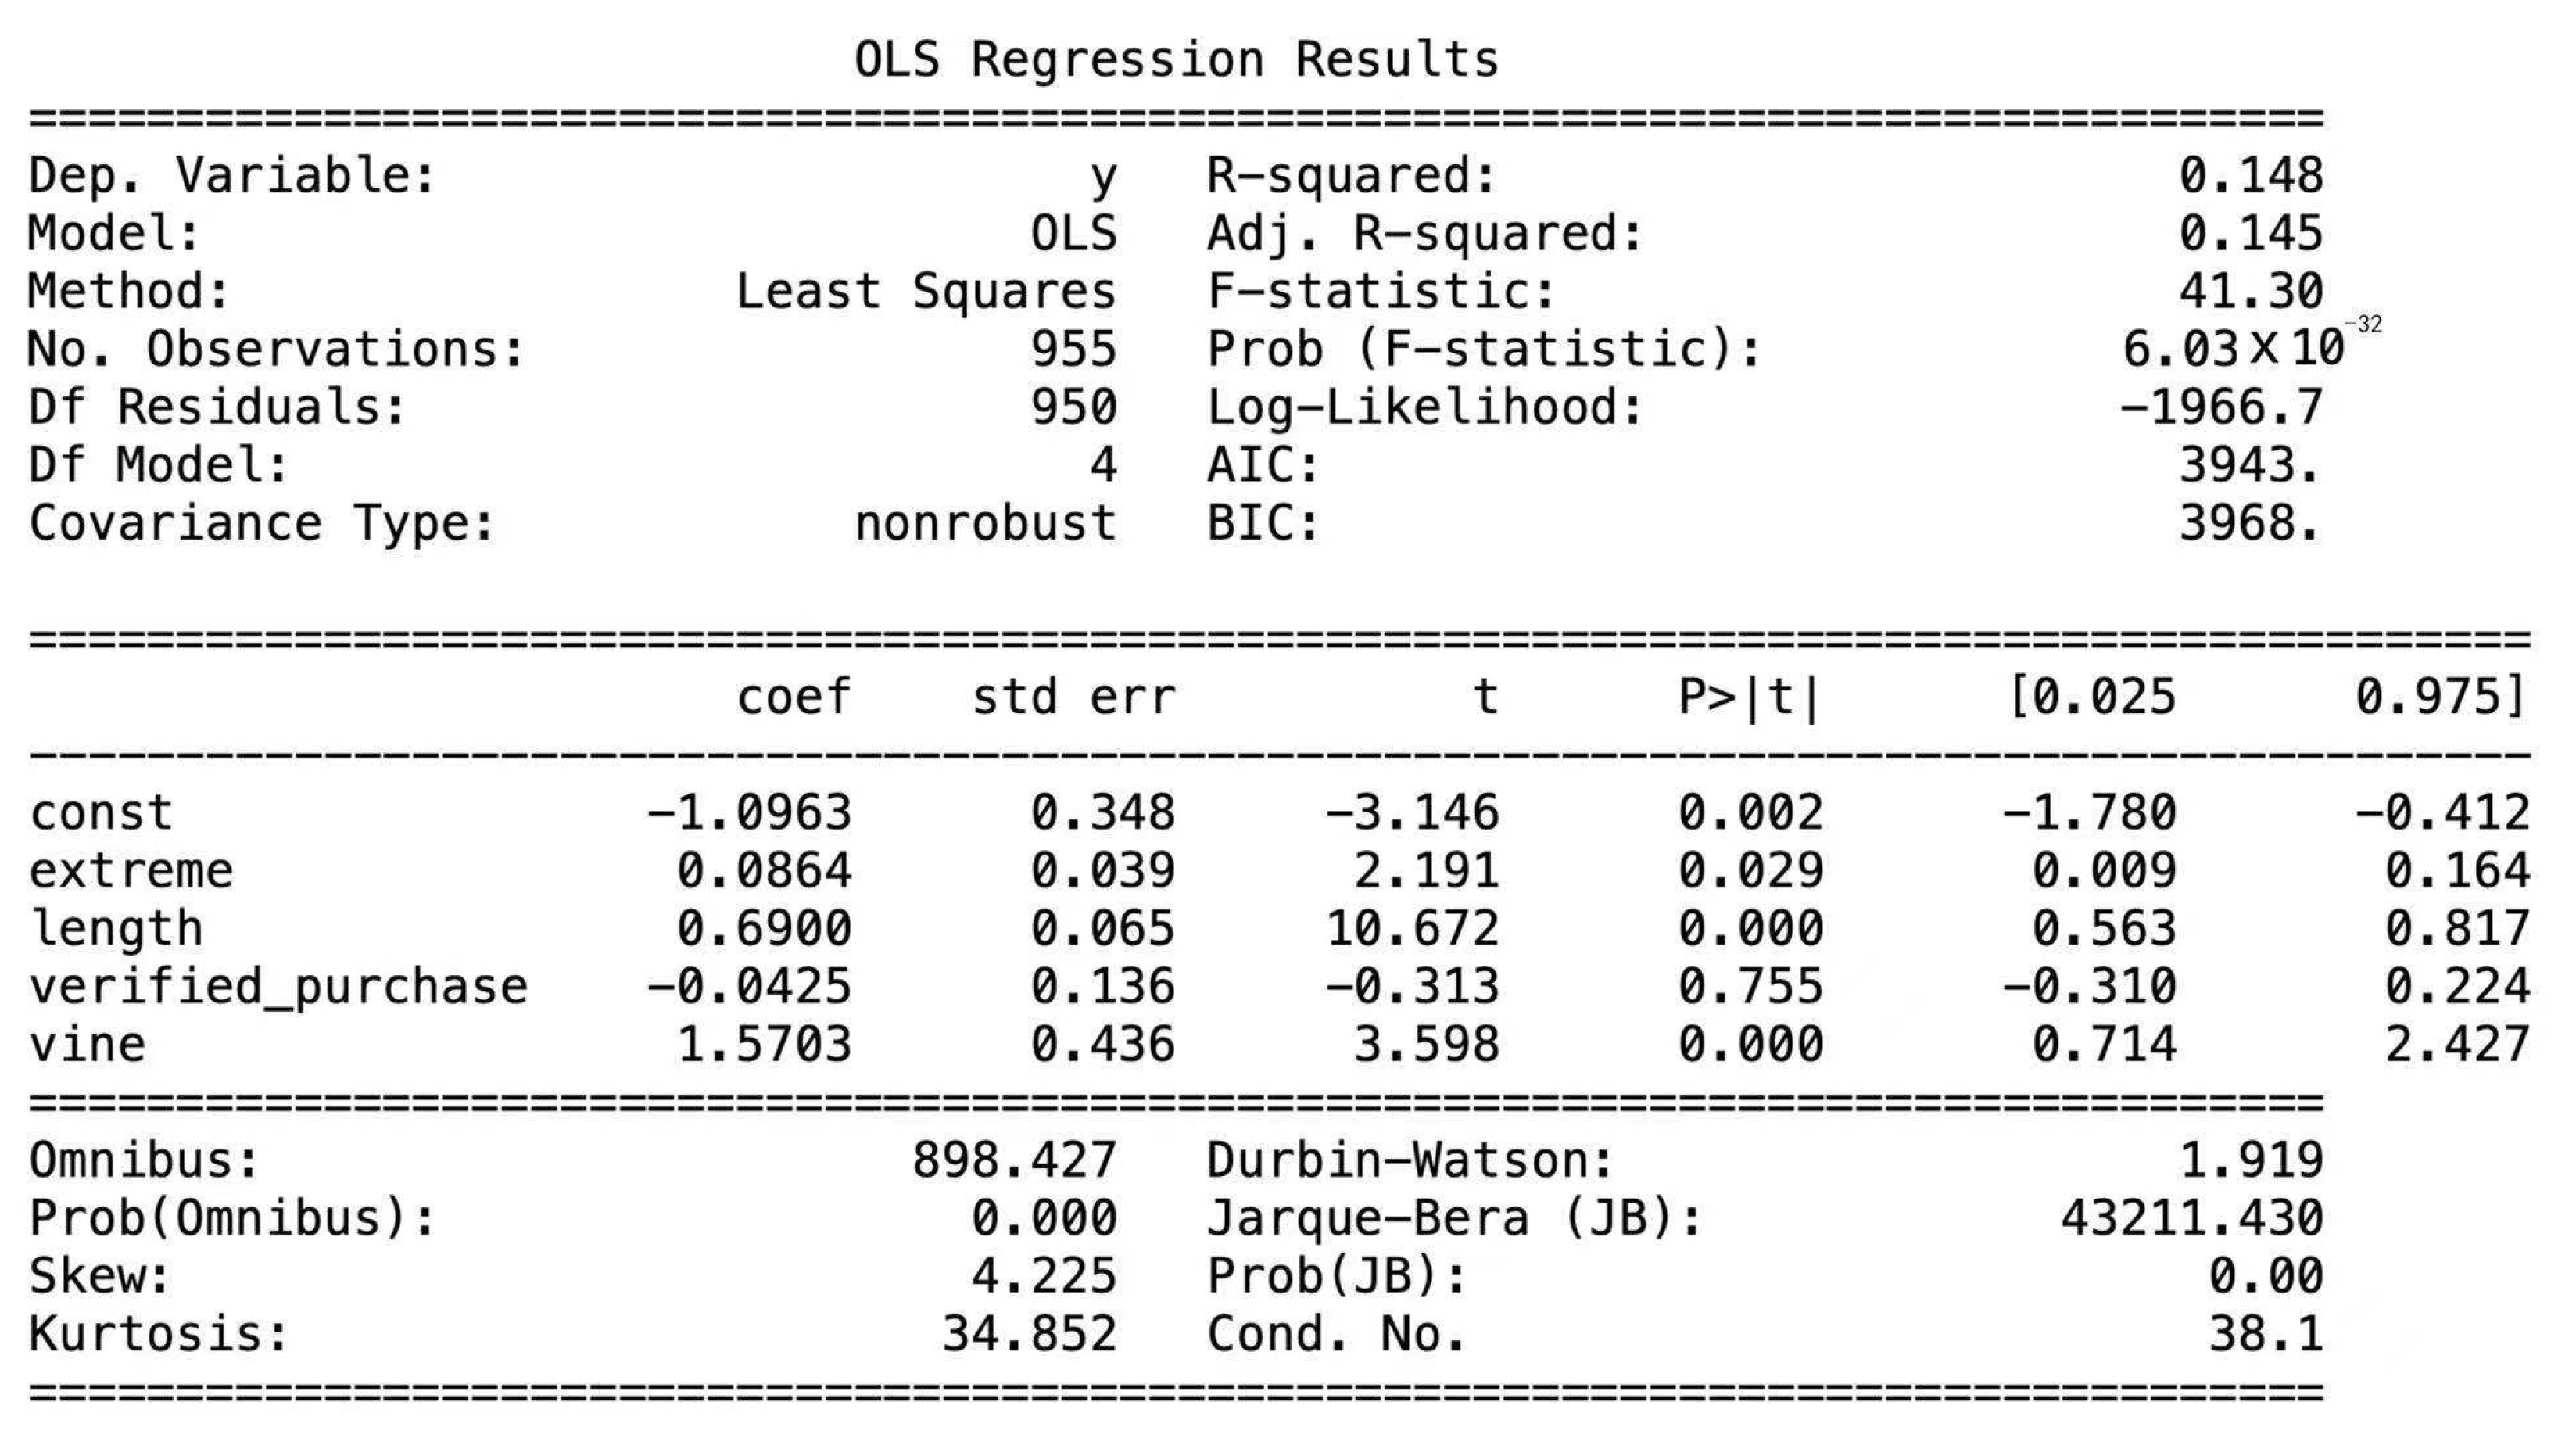
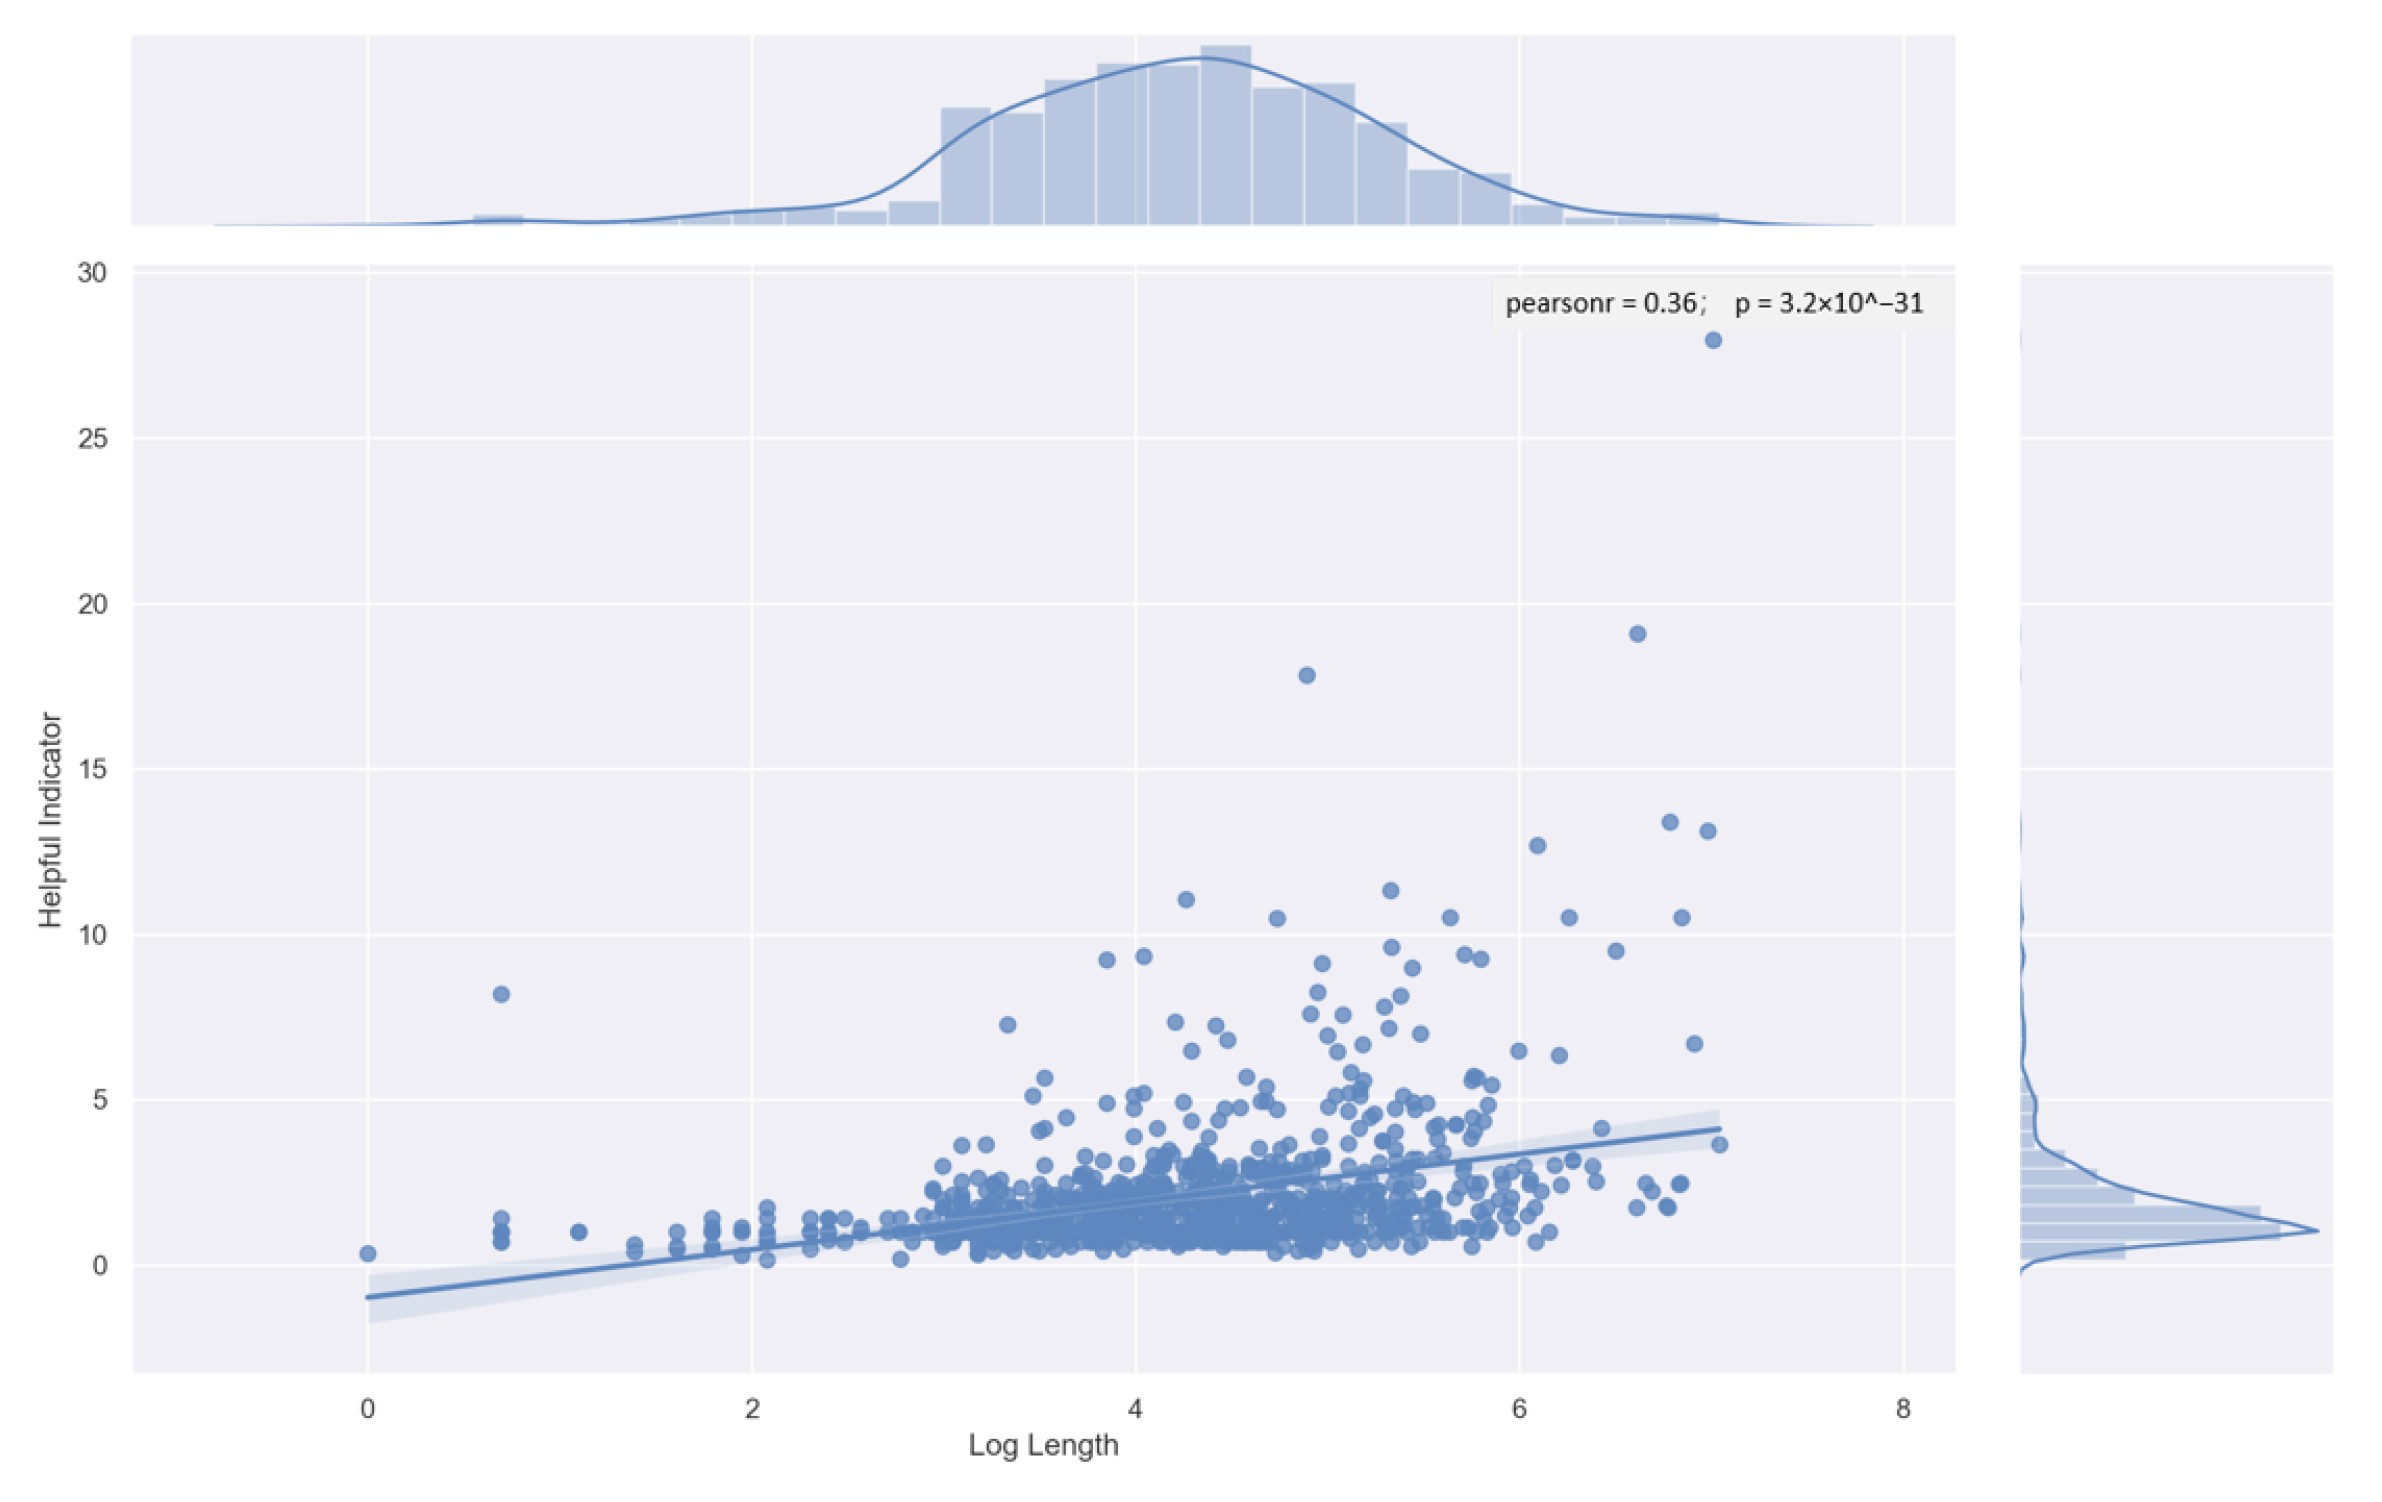
4.3. Review Usefulness Linear Regression Results

The OLS regression results of the comment usefulness model are shown in Figure 1. First, the review content’s length has a significant positive impact on the usefulness of comments, indicating that consumers believe longer reviews can provide more information and help them make purchasing decisions. Hypothesis 1 holds. Second, the scoring polarity also significantly affects the usefulness of comment. Hypothesis 2 holds. Third, a Vine member’s comment is more valuable. Hypothesis 3 holds. For Hypothesis 4, however, according to the regression results, we found that the verified purchase only has a weak negative correlation to the usefulness of the comments, which is contrary to Hypothesis 4. Considering that the regression coefficient of the verified purchase is not significant, we will not take it into account to build our customer satisfaction measurement.
Among them, the length of the logarithmic review has the most significant effect on the review’s validity. We then take the logarithmic length as the horizontal axis and the comment usefulness index V i as the vertical axis, plotting the univariate linear regression results. The results are shown in Figure 2.
As can be seen from Figure 2, the distribution of L i is more uniform. The logarithm of the number of most commented words is concentrated between 3 and 5. The distribution of V i is more concentrated, with individual extreme values as outliers. A few reviews are more effective, and the whole set of reviews shows a left-biased distribution. The regression line is inclined to the upper right, and the Pearson correlation coefficient is positive, indicating a weak positive correlation between the two. As the number of words in the comment increases, the more effective comments are more likely to appear.

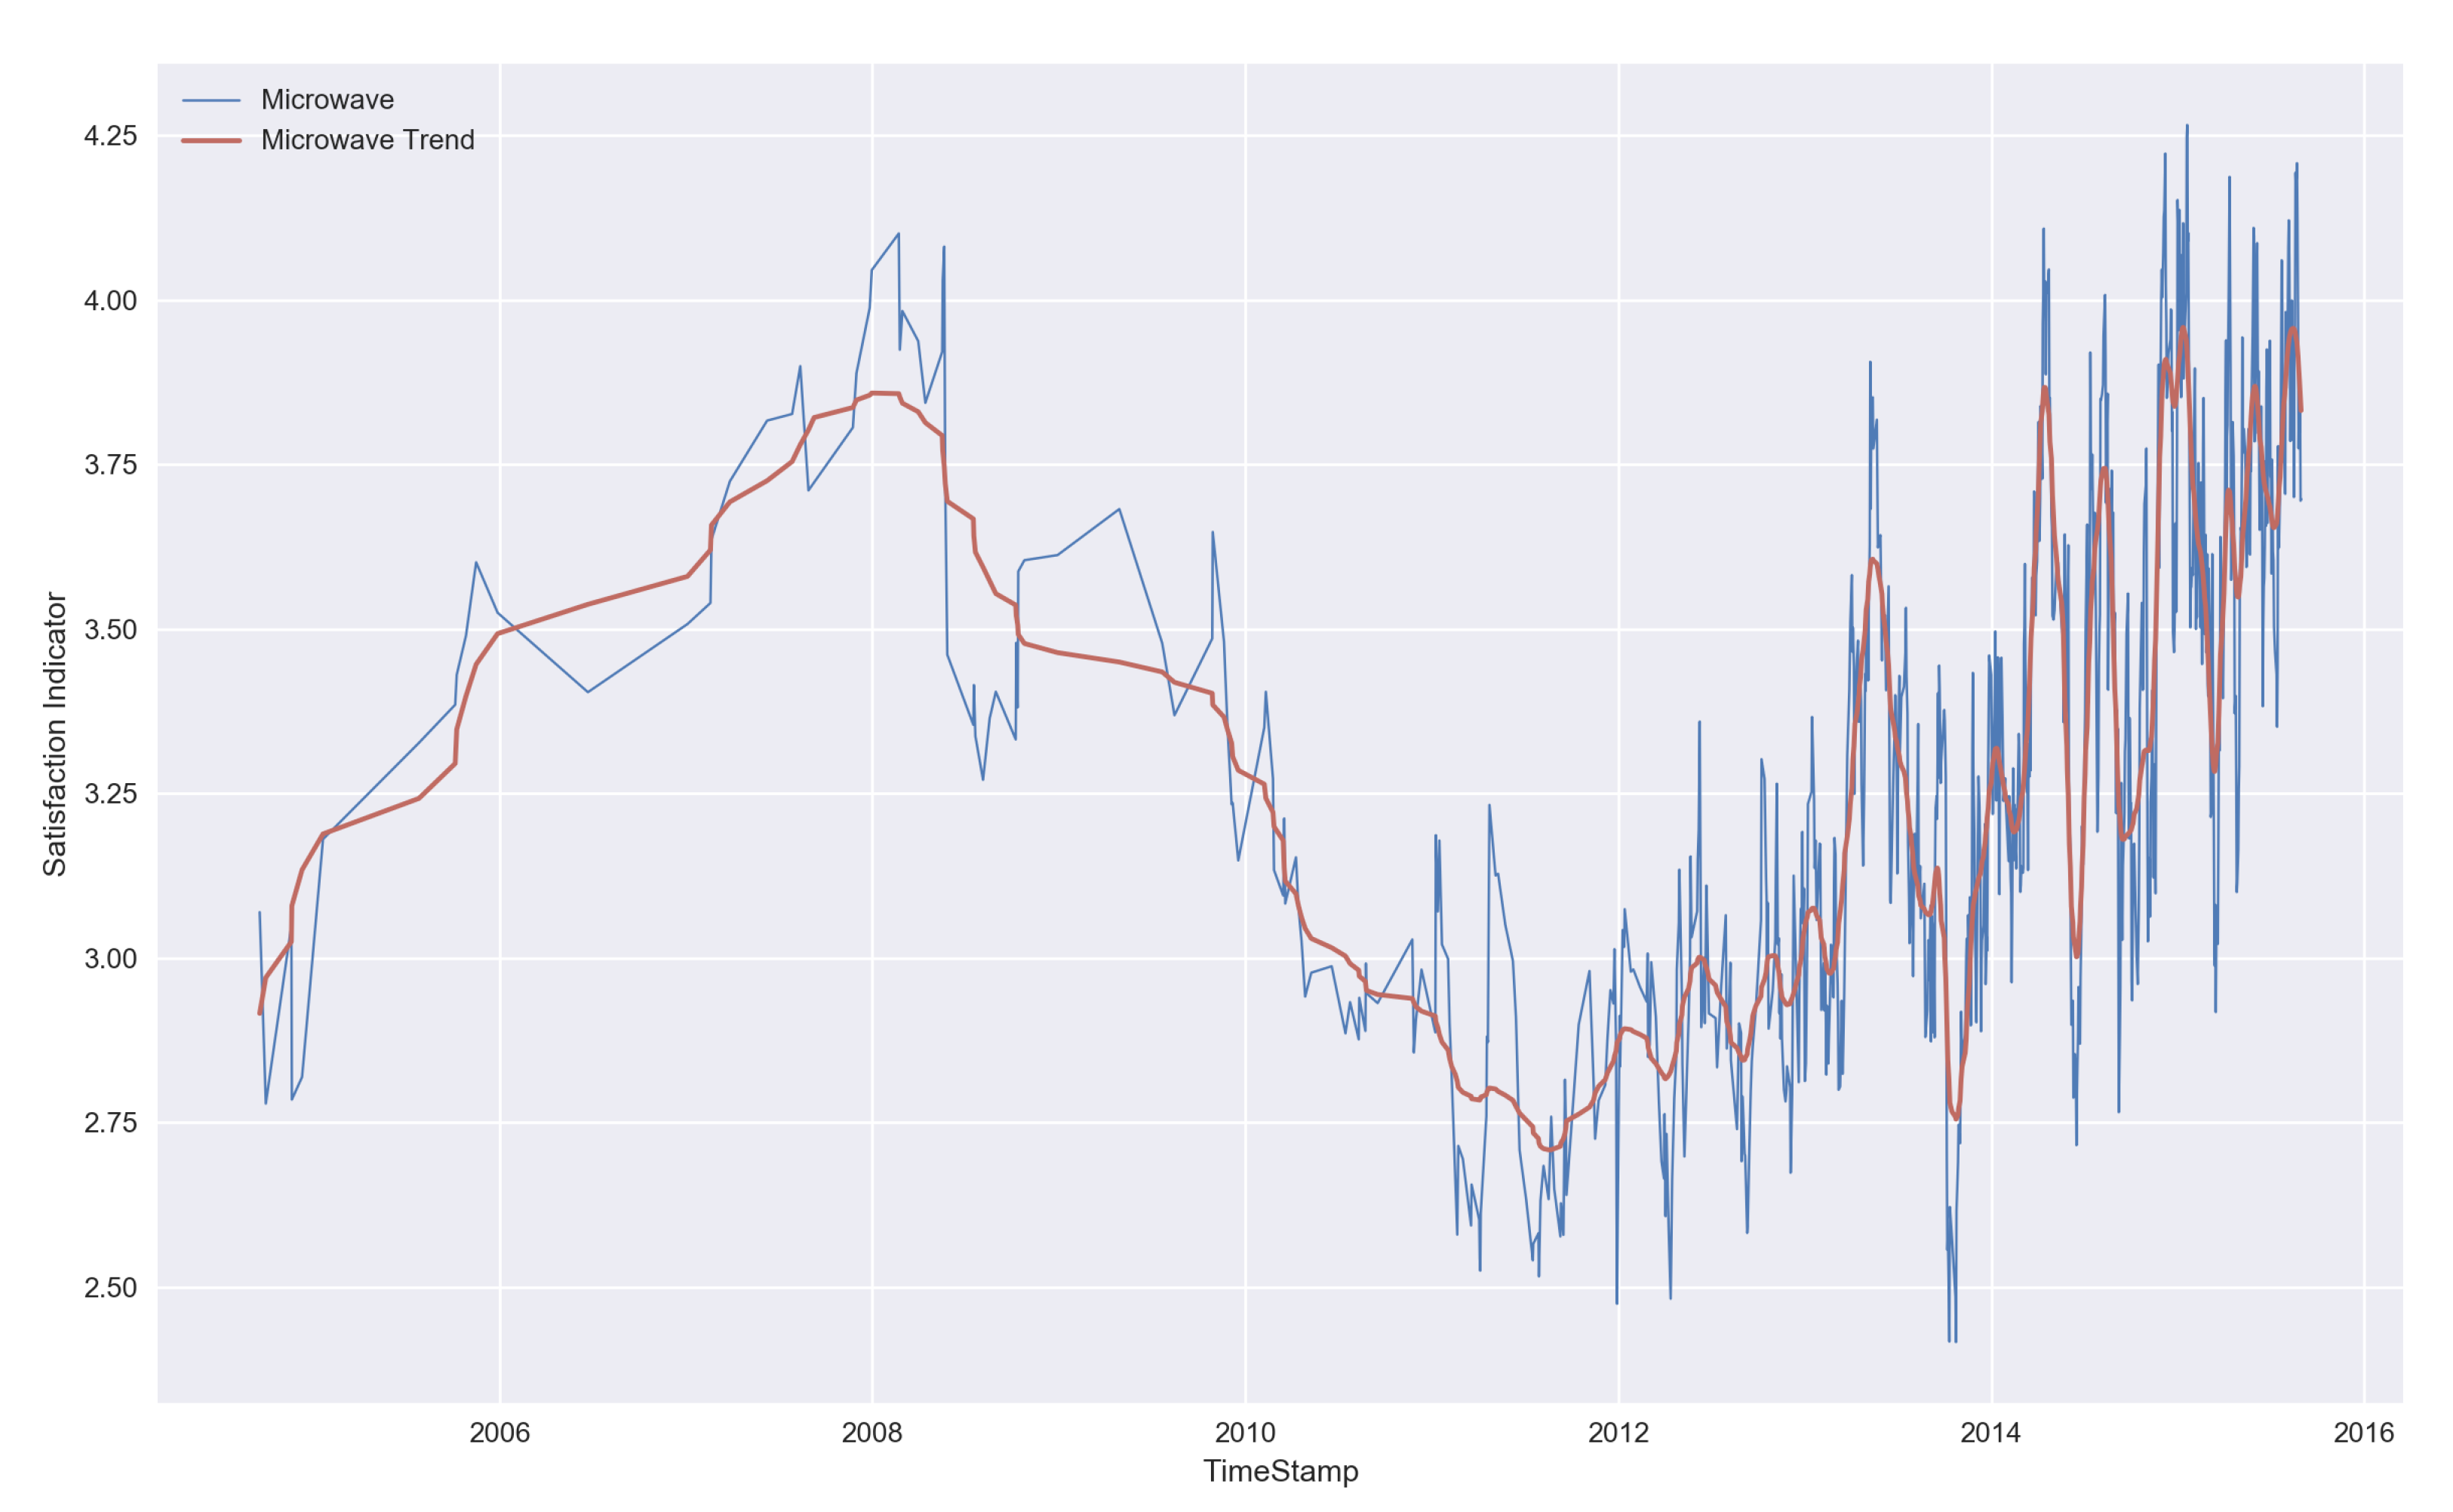
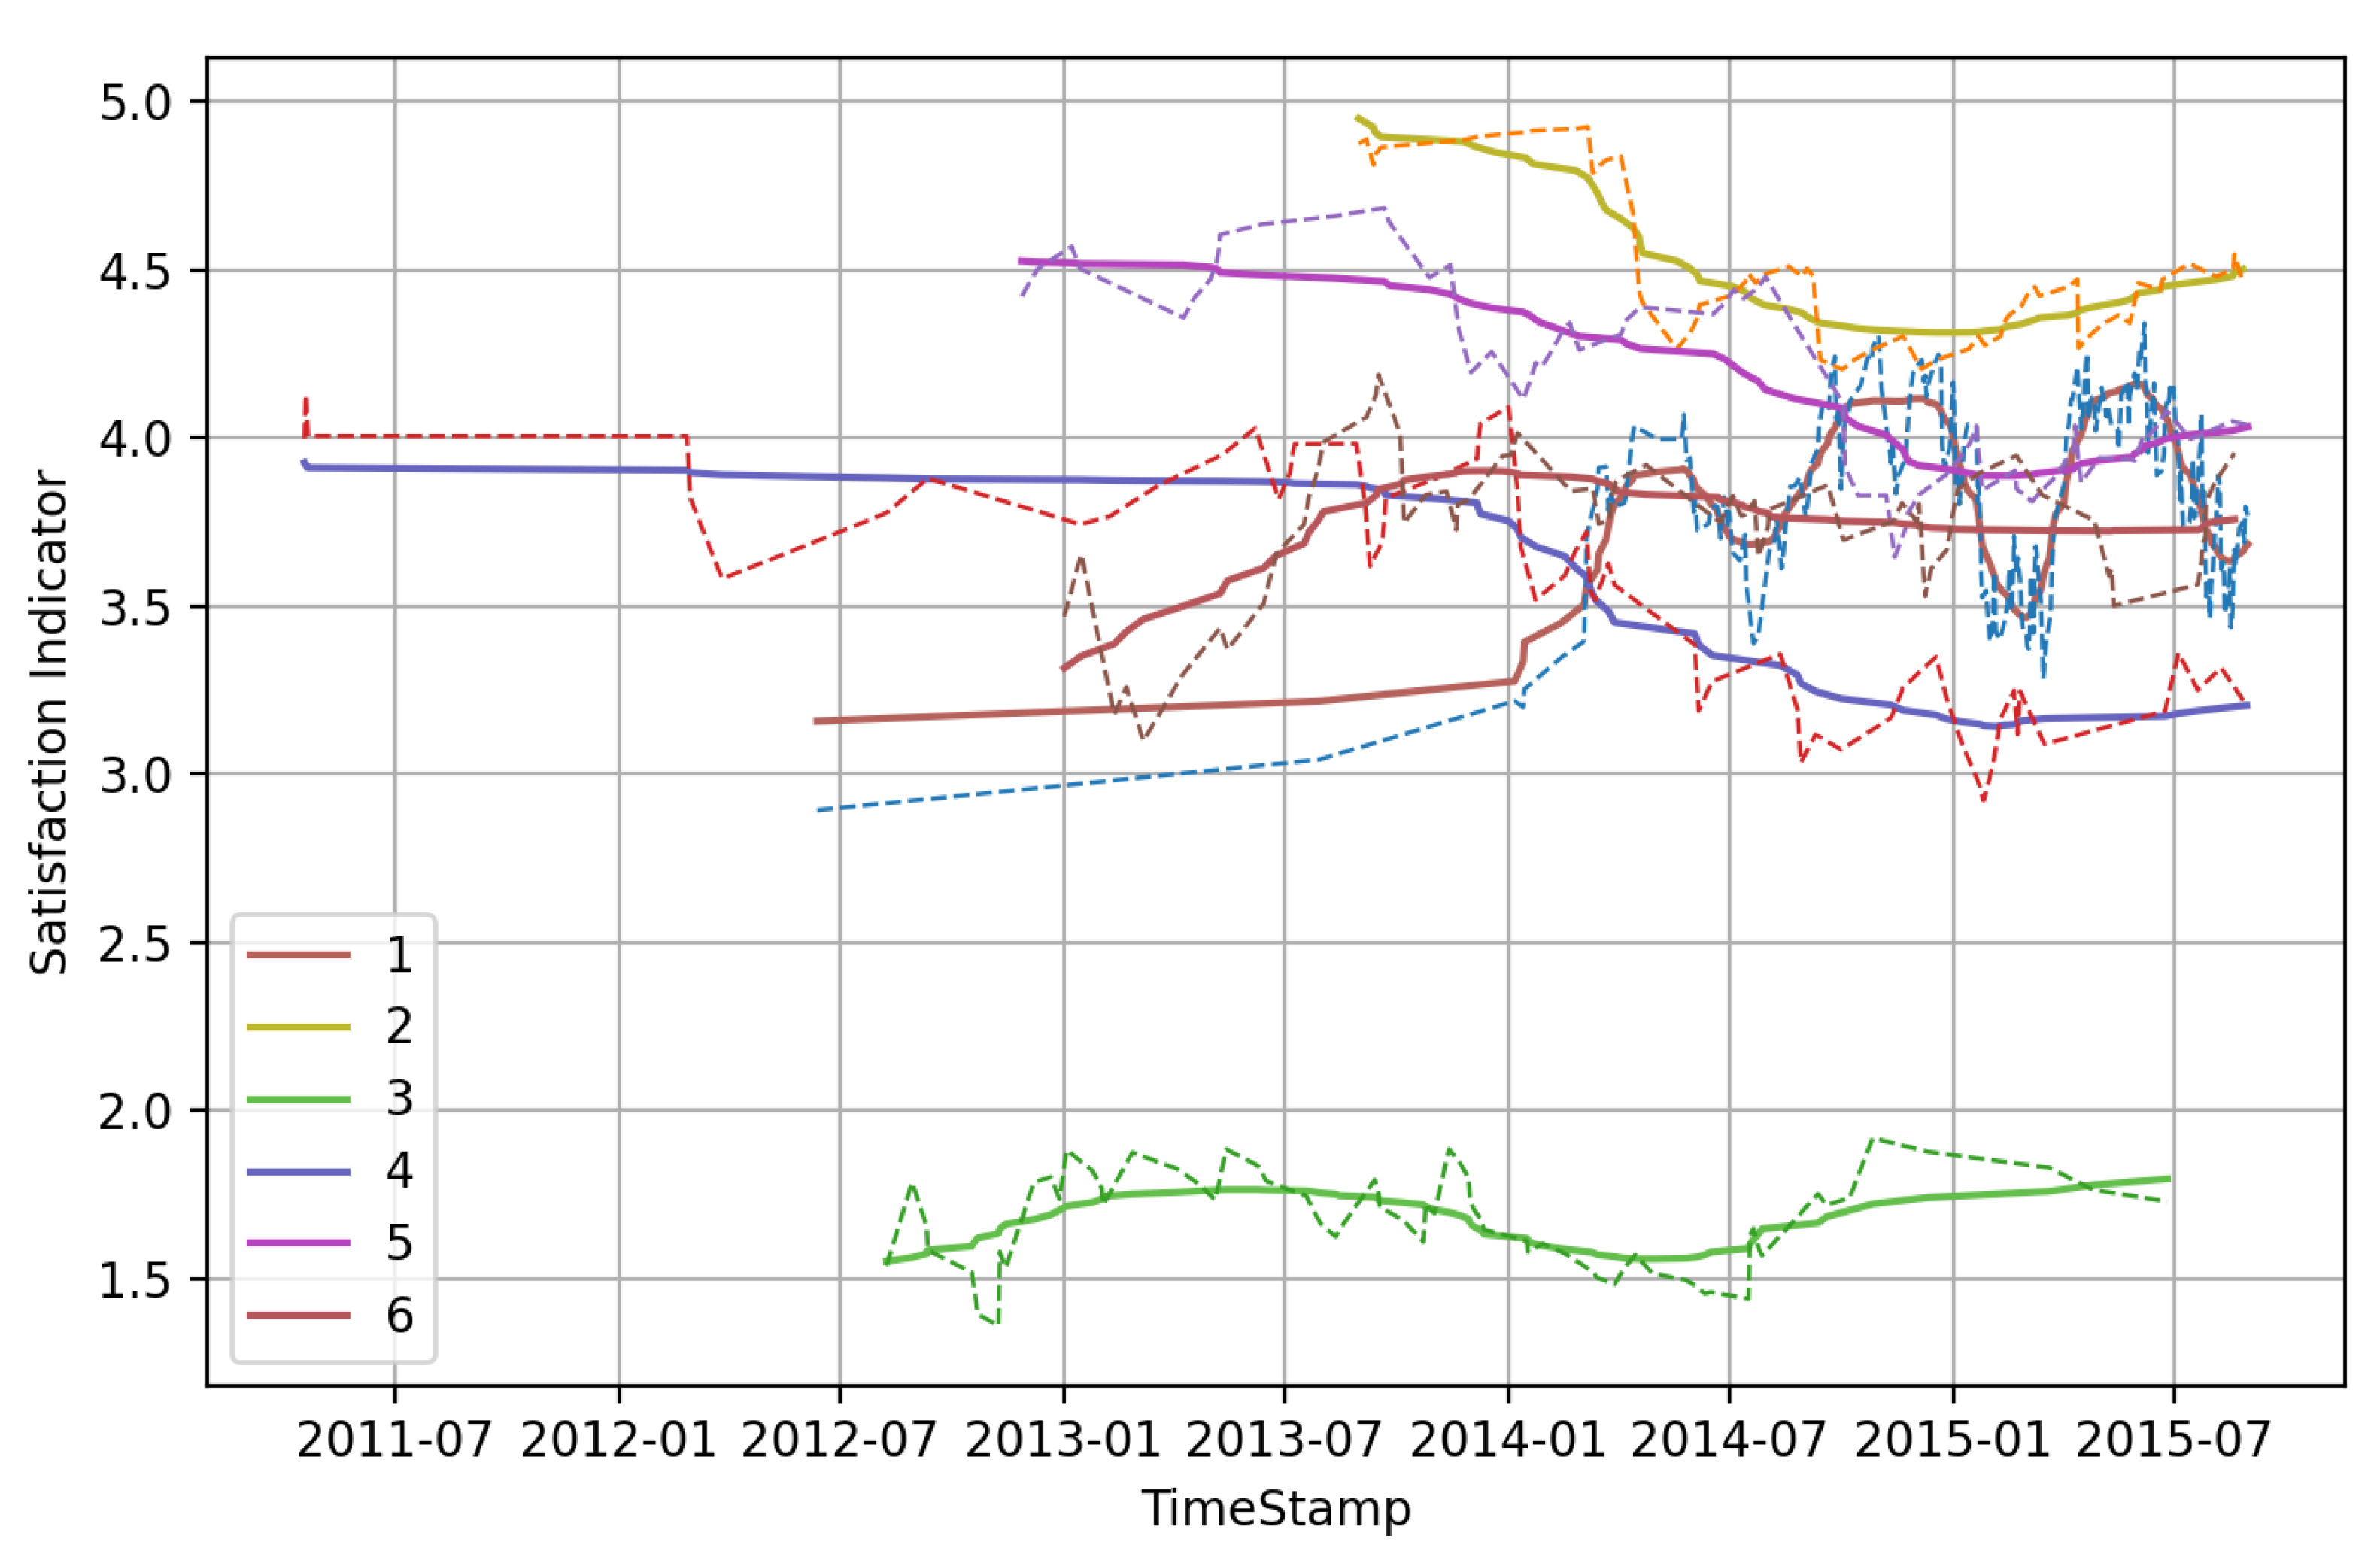
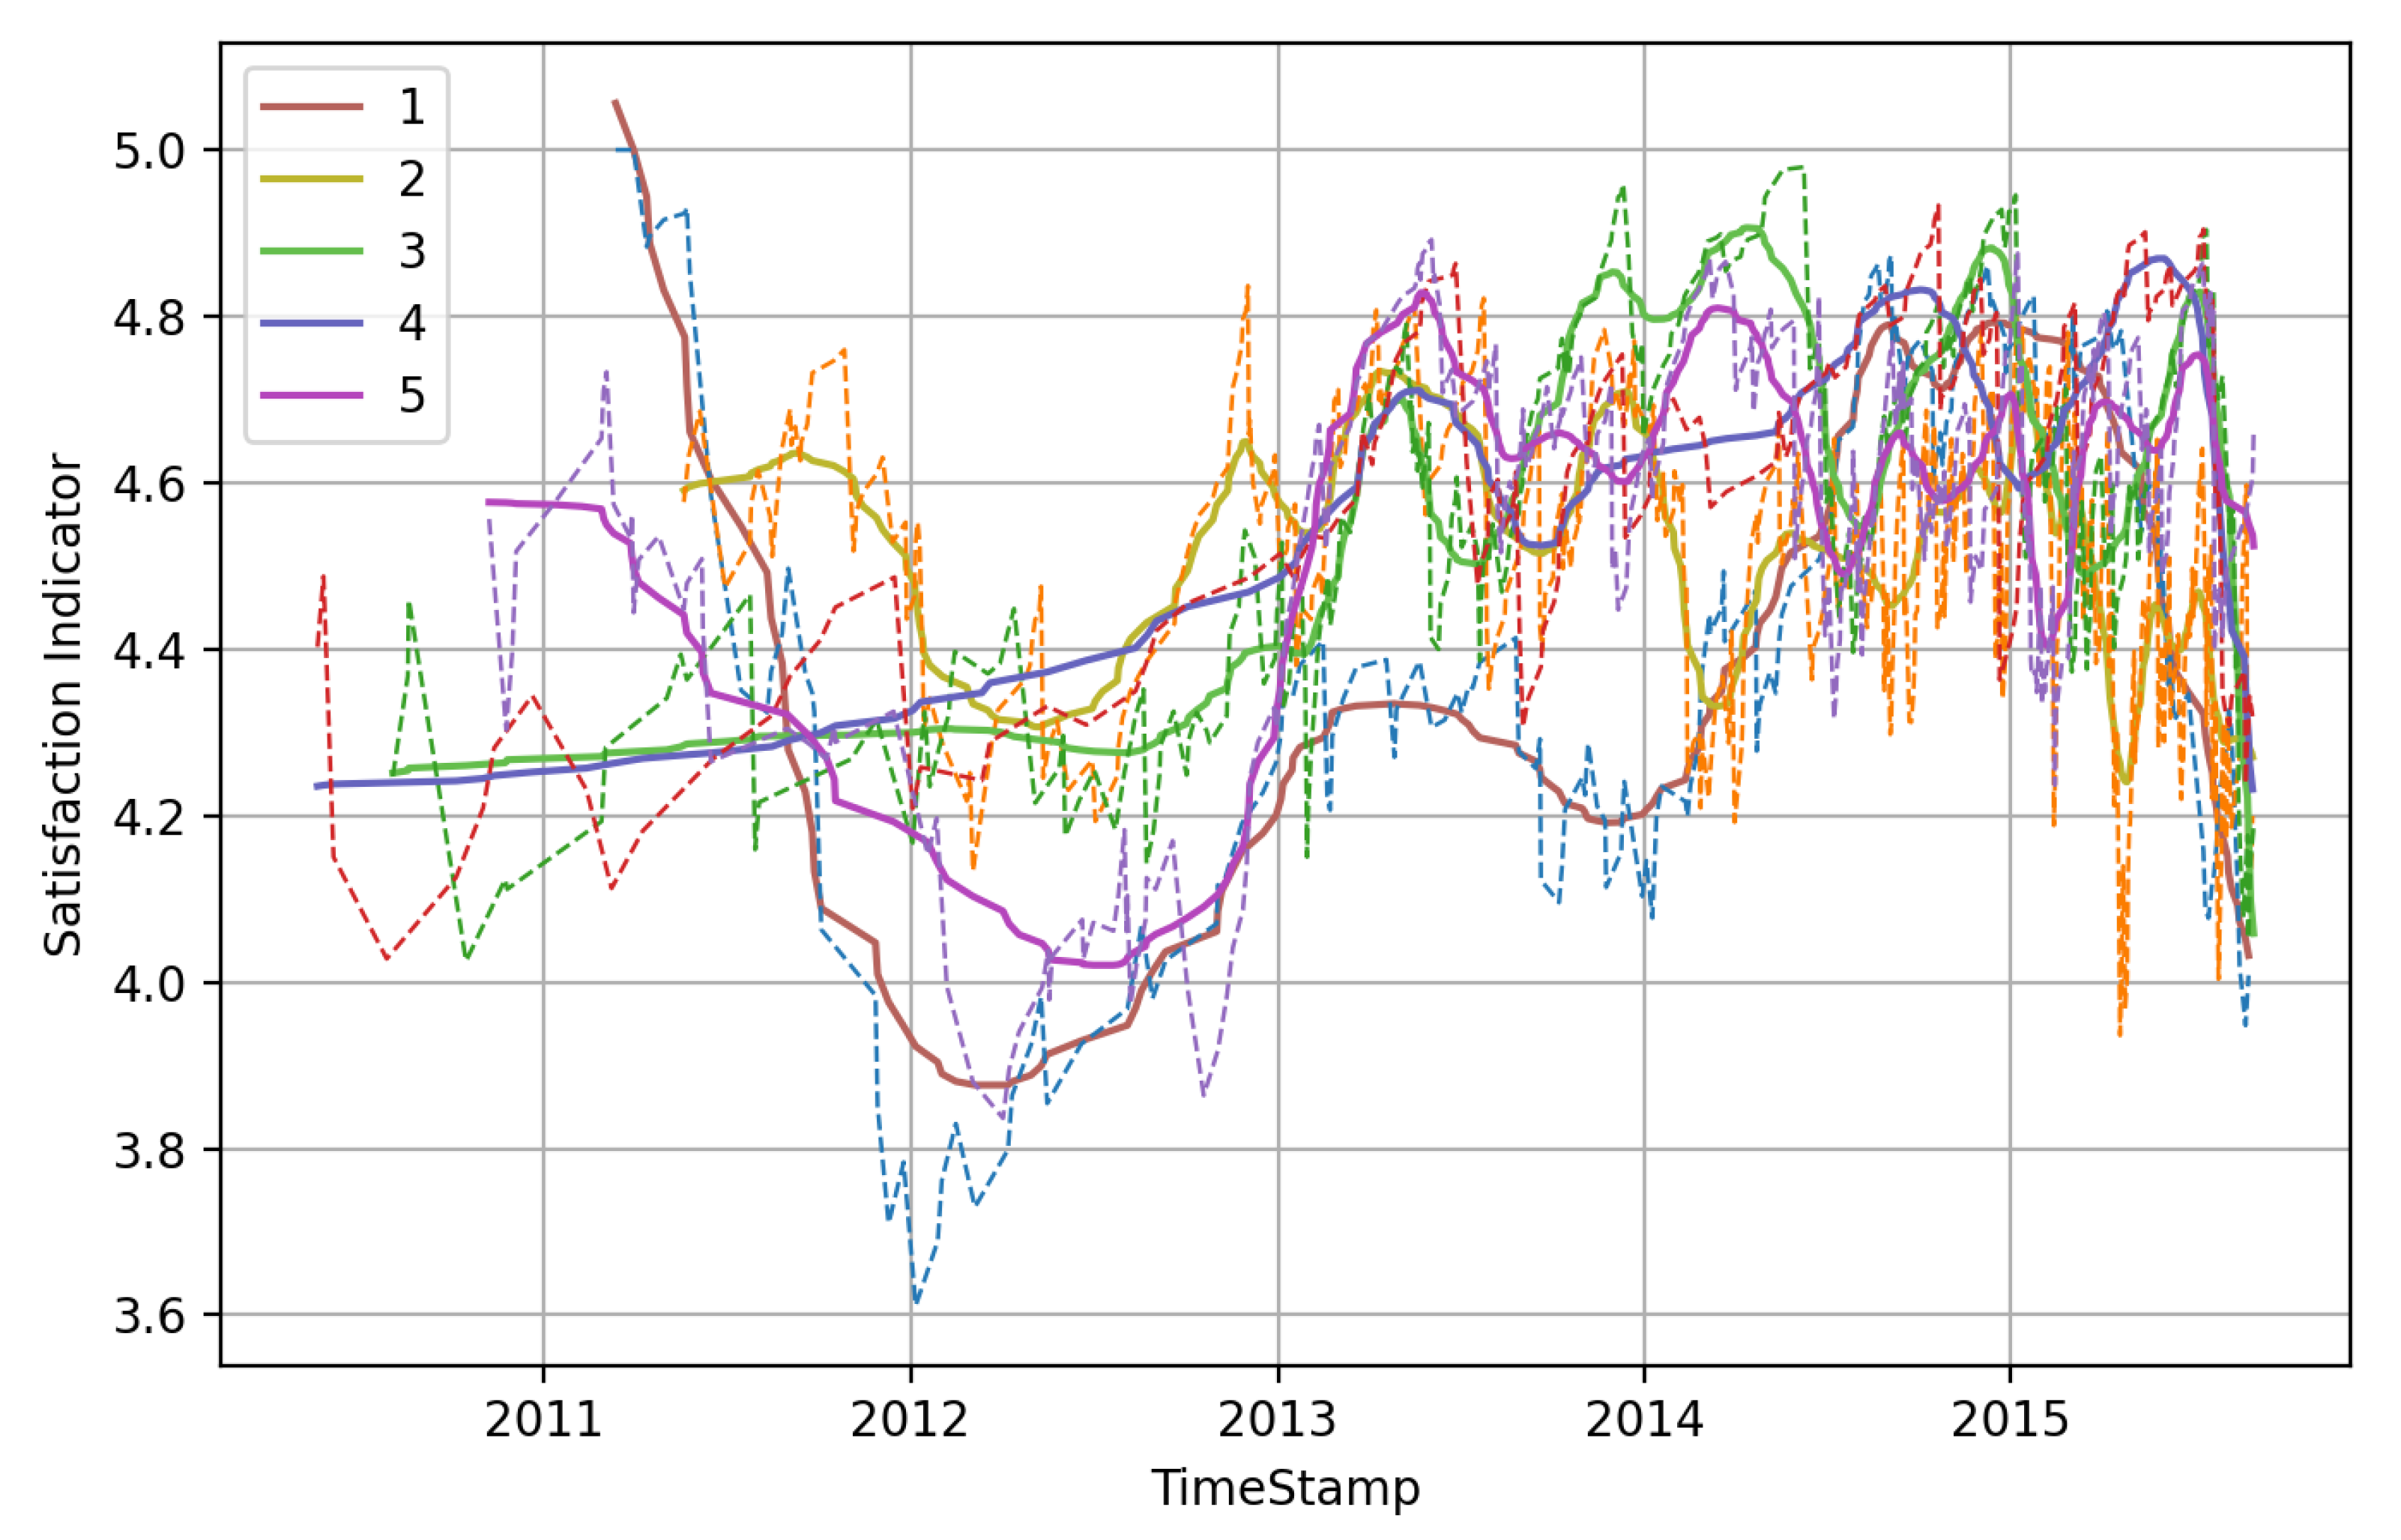
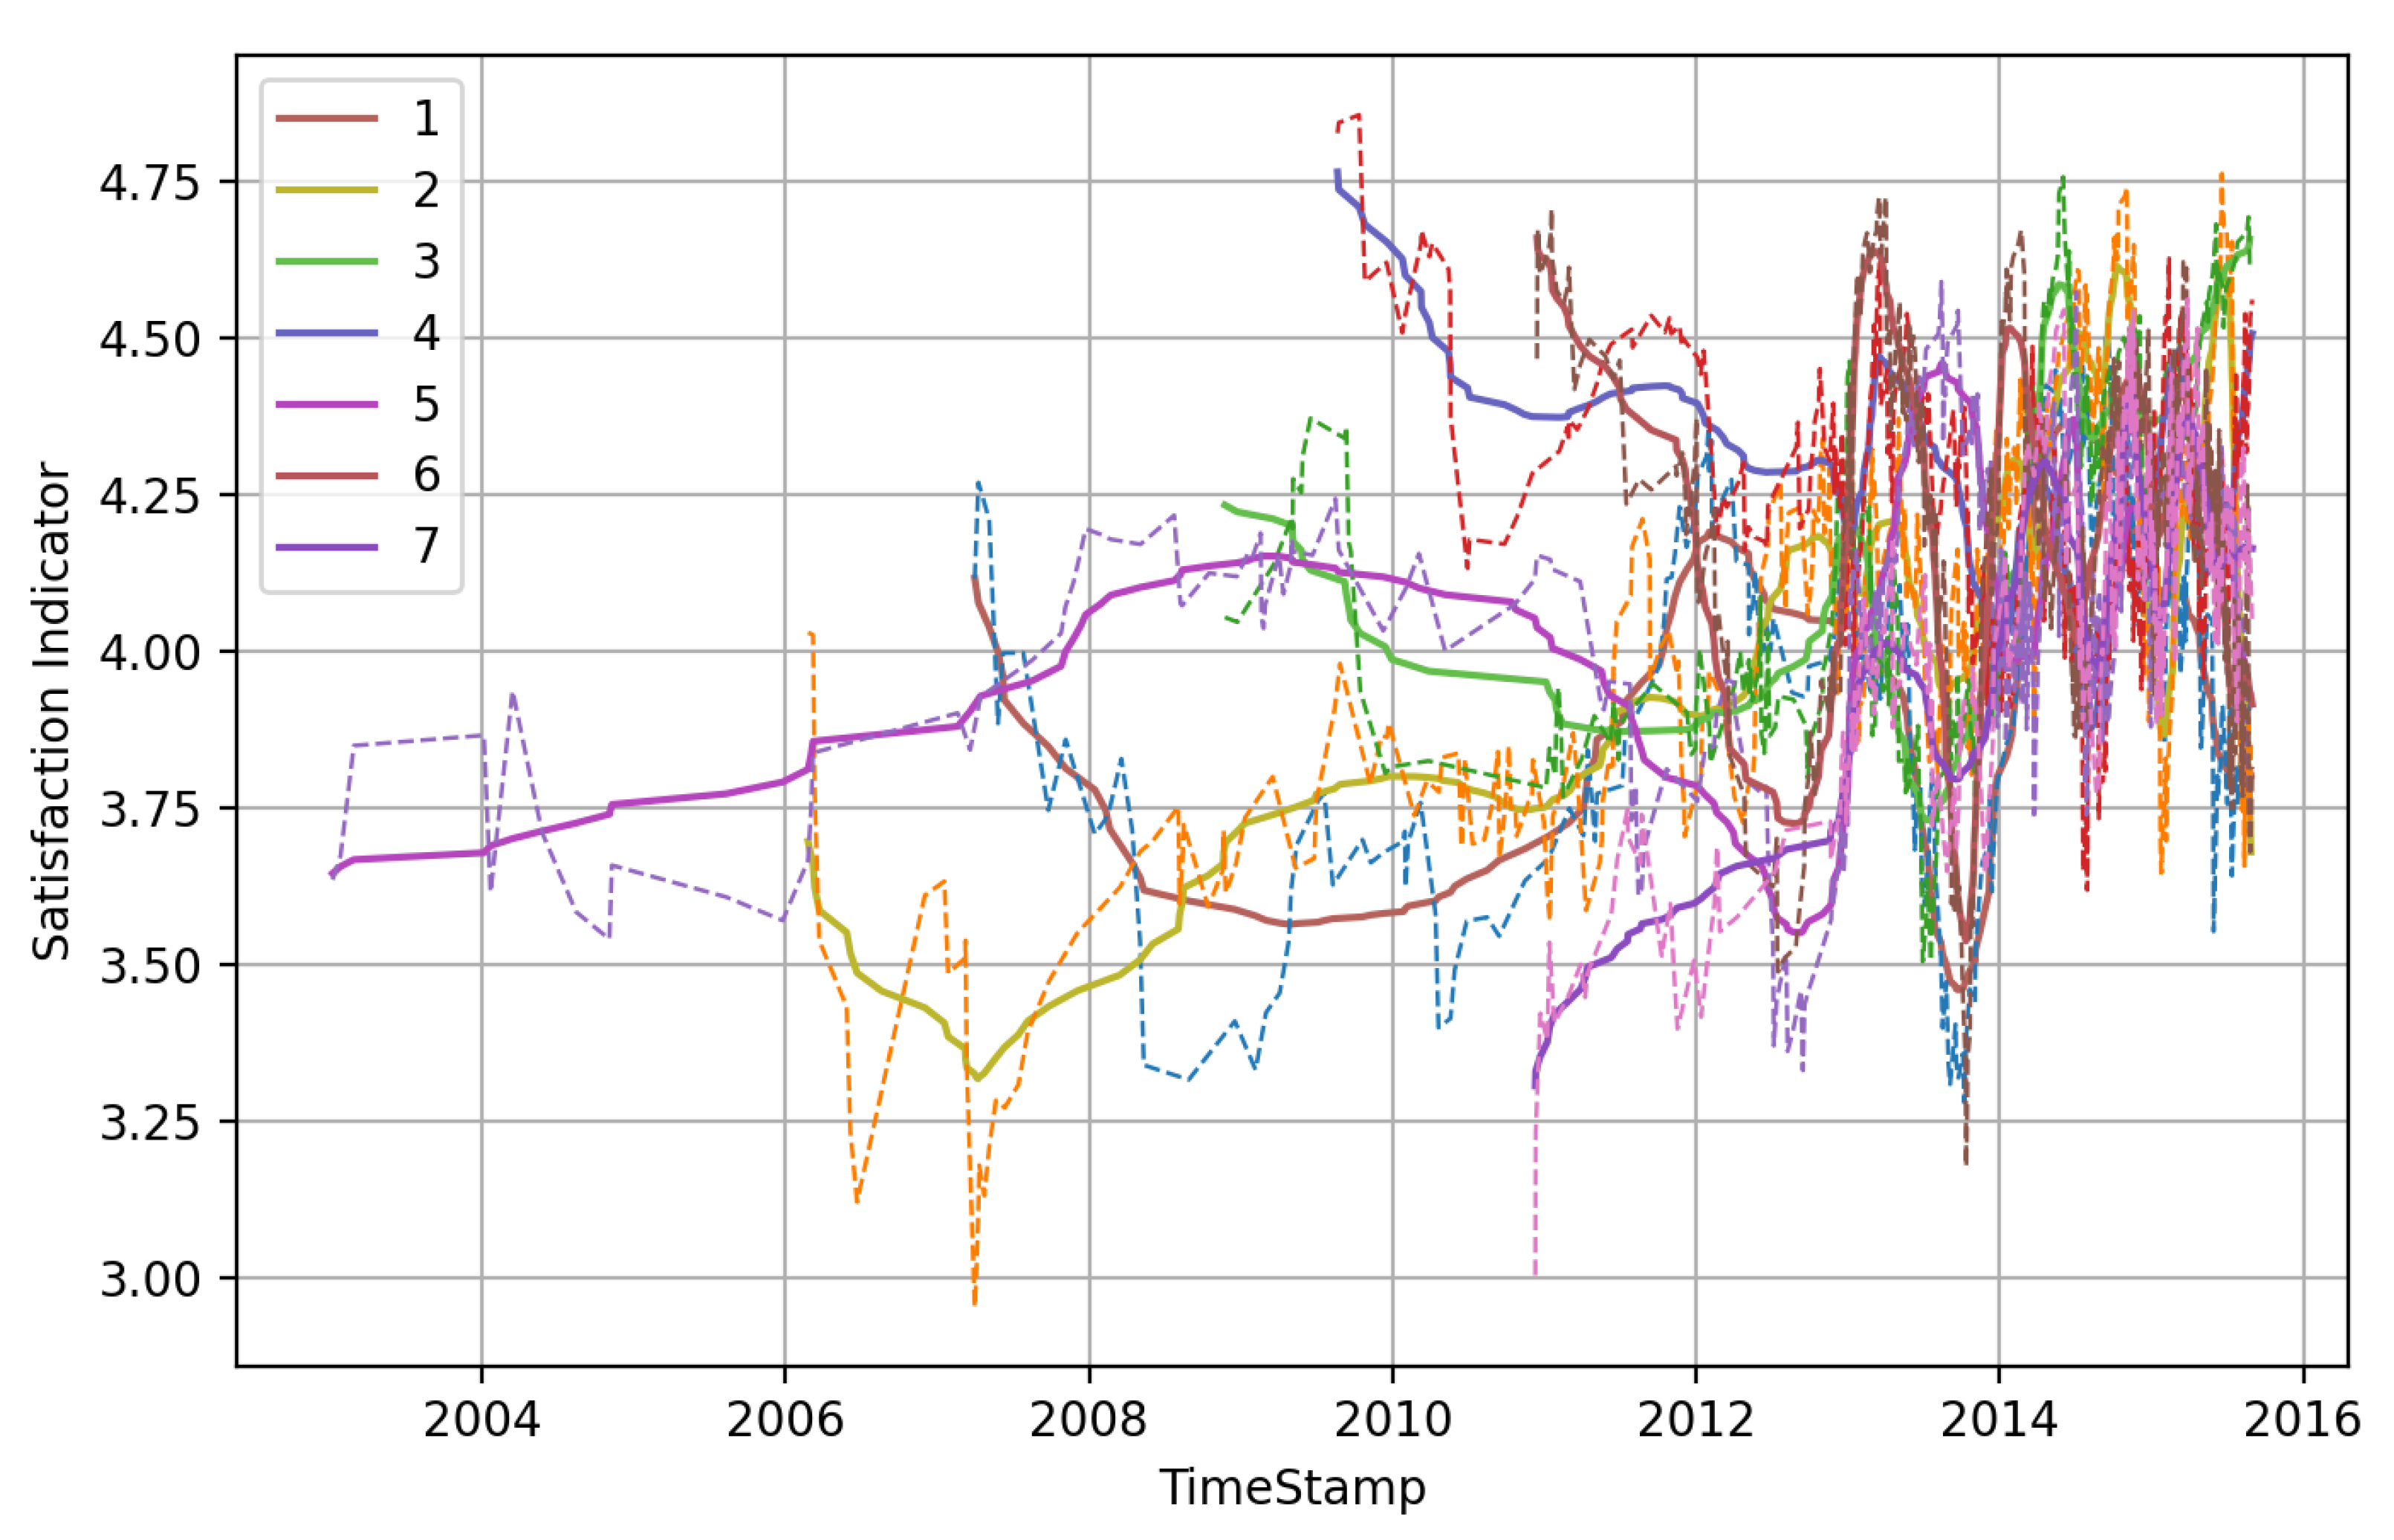
4.4. Customer Satisfaction Experimental Results

Based on the study above, we design a customer satisfaction evaluation model to measure each product’s customer comments. The model consists of two parts. First, we measure the effectiveness of star rating by helpful rating and Vine. To make the curve smoother, we weigh a certain number of star ratings by EMA and get a time-weighted scrolling indicator series. Time series can be presented as a superposition of different frequency components [38]. To better describe the trend of satisfaction change, we use the HP filter algorithm to separate the smooth sequence with a certain trend from the variable time series data and divide the time series into a cycle part and a trend part.
We caculate the coefficient of variation (CV) of three products’ satisifaction scores, respectively, as shown in Table 6.
We can see that the microwave oven has the most significant CV among the three products, and it has a lower average rating and higher variance. The rating of the microwave oven is more dispersed than the other two products. So, we think the microwave oven will have more sales pressure than the other two products [39].
The analysis results of all brands of microwave products can be represented by Figure 3. The weighted satisfaction score went up during 2004–2008 and 2012–2015. It went down during 2009–2011. The blue curve is the original sequence, and the red one is the trend separated by the HP filter. We can infer that the microwave oven rating will rise in the future or stay high.

4.5. Discussion of Customer Satisfaction

Figure A1, Figure A2, Figure A3 (in Appendix A) shows the curve of customer satisfaction indicators of different brands over time using our customer satisfaction measurement model. We select several brands for each product with more than 100 reviews. We then get the weighted satisfaction curve of different brands of product changing over time.
As we can see in Figure A1 (in Appendix A), the most potentially successful microwave oven is microwave cavity paint 98Qbp0302 in the last five years. It has the highest average weighted satisfaction indicator, which is 4.51. According to the analysis of its reviews, the attractive points are excellent painting, good quality, and rapid heating.
The potentially failing microwave oven is the Samsung SMH1816S cu. 1.8 ft. stainless steel over the range of microwave. The average weighted satisfaction indicator is 1.67 in the last three years. The keywords are mainly about quality and safety, such as timing heating function error, function stoppage for no reason.
As for the baby pacifier, the most potentially successful product is the WubbaNub brown monkey pacifier, and the potentially failing one is the RaZbaby Keep-It-Kleen pacifier (see Figure A2 in the Appendix A).
As for the hair dryer, the most potentially successful one is the Conair 1875 Watt tourmaline firing hair dryer. In contrast, the most unsuccessful hair dryer is the T3 Bespoke LABS 83808-se featherweight professional ionic firing tourmaline hair dryer, as we can see in Figure A3 (in the Appendix A).
Therefore, through our satisfaction model, we can get the customer satisfaction curves of multiple brands for different products as time changes. We find that some products have a significant fluctuation in customer satisfaction over the years, and some are relatively gentle. These findings are helpful for the company to improve the quality of products.

5. Conclusions

To effectively evaluate the degree of customer satisfaction with specific goods in different periods according to the online review data, in this paper, we established a customer satisfaction measurement based on different review features. Our research methods were based on data mining technology that extracts useful potential information using machine learning and statistical algorithms from a large data set. We first used the information gain model to find the most informative words most relevant to each rating in the three chosen products. Then, we hypothesized about the factors that may influence the usefulness of reviews. We constructed a review usefulness model and applied OLS regression to find that the usefulness of review is positively related to review length, the extremeness of rating, and whether reviewers are Vine members. Finally, we established a customer satisfaction measurement based on helpful rating, Vine, and EMA to draw the satisfaction time-changing curves and exposed the best and worst brands in each product. Based on our findings, we discovered that features such as length and extremeness of the comments will affect the review usefulness, and the consumer satisfaction measurement constructed by EMA can effectively reflect the trend of user satisfaction over time. Our work can be helpful for researchers to find useful features in the review and for companies to get an accurate and pertinent evaluation of their products as well as the change of a product’s reputation in the online market over time. One of the limitations of our study is that we only use three product data to verify the effectiveness of our model. In future work, our model will extract significant features from more product types. Moreover, our model can be applied in other scenarios, evaluating people’s satisfaction in different fields.

Author Contributions

Conceptualization, J.W.; methodology, Y.L., Y.W., X.S. and Z.Y.; writing—original draft preparation, Y.W., X.S. and Z.Y.; writing—review and editing, Y.L. and J.W.; validation, Y.L. and Y.W.; formal analysis, X.S. and Z.Y.; supervision, J.W. All authors have read and agreed to the published version of the manuscript.

Funding

This research received no external funding.

Institutional Review Board Statement

Not applicable.

Informed Consent Statement

Not applicable.

Data Availability Statement

Publicly available data sets were analyzed in this study. This data can be found here: [https://www.comap.com/undergraduate/contests/mcm/contests/2020/problems/ (accessed on 28 May 2021)].

Conflicts of Interest

The authors declare no conflict of interest.

Appendix A

Figure A1. Satisfaction curve of different brands of microwave oven. The six lines in the picture represent these commodities: 1 refers to the Danby 0.7 cu.ft. countertop microwave; 2 refers to the microwave cavity paint 98Qbp0302; 3 refers to the Samsung SMH1816S 1.8 cu. ft. stainless steel over-the-range microwave; 4 refers to the Sharp microwave drawer oven; 5 refers to the Whirlpool stainless look countertop microwave, 0.5 cu. feet, WMC20005YD; 6 refers to the Whirlpool WMC20005YB 0.5 cu. ft. black countertop microwave.
Information 12 00234 g0a1
Figure A2. Satisfaction curve of different brands of baby pacifier. The five lines in the picture represent these commodities: 1 refers to the Philips Avent BPA-free contemporary freeflow pacifier; 2 refers to the Philips Avent BPA-free soothie pacifier, 0–3 months, 2 pack, packaging may vary; 3 refers to the WubbaNub brown monkey pacifier; 4 refers to the WubbaNub brown puppy pacifier; 5 refers to the WubbaNub infant pacifier—giraffe.
Information 12 00234 g0a2
Figure A3. Satisfaction curve of different brands of hair dryer. The seven lines in the picture represent these commodities: 1 refers to the Andis 1600 Watt quiet hangup hair dryer with night light; 2 refers to the Andis 1875 Watt Fold-N-Go ionic hair dryer, silver/black (80020); 3 refers to the Conair 1875 Watt cord keeper 2-in-1 hair dryer, black; 4 refers to the Conair 1875 Watt tourmaline ceramic hair dryer; 5 refers to the Conair Corp Pers Care 146NP ionic conditioning 1875 Watt hair dryer; 6 refers to the Remington AC2015 T|Studio Salon Collection pearl ceramic hair dryer, deep purple; 7 refers to the Revlon Essentials 1875 W fast dry hair dryer, RV408.
Information 12 00234 g0a3

References

  1. Hou, T.; Yannou, B.; Leroy, Y.; Poirson, E. Mining customer product reviews for product development: A summarization process. Expert Syst. Appl. 2019, 132, 141–150. [Google Scholar] [CrossRef] [Green Version]
  2. Shelly, G.; Vermaat, M. Discovering Computers 2010: Living in a Digital World, Complete; Nelson Education: Toronto, ON, Canada, 2009. [Google Scholar]
  3. Yan, Z.; Jing, X.; Pedrycz, W. Fusing and mining opinions for reputation generation. Inf. Fusion 2017, 36, 172–184. [Google Scholar] [CrossRef]
  4. Benlahbib, A. Aggregating customer review attributes for online reputation generation. IEEE Access 2020, 8, 96550–96564. [Google Scholar] [CrossRef]
  5. Ding, Y.; Xiao, Y. Study on Customer Satisfaction Evaluation of Five-star Hotels Based on Internet Reviews. Econ. Geogr. 2014, 5, 182–186. (In Chinese) [Google Scholar]
  6. Hu, S. Tourism competitiveness evaluation based on analytic hierarchy process and SVR. J. Shenyang Univ. 2019, 5, 404–409. [Google Scholar]
  7. Barsky, J.D. Customer satisfaction in the hotel industry: Meaning and measurement. Hosp. Res. J. 1992, 16, 51–73. [Google Scholar] [CrossRef]
  8. Hu, Y.H.; Chen, Y.L.; Chou, H.L. Opinion mining from online hotel reviews – A text summarization approach. Inf. Process. Manag. 2017, 53, 436–449. [Google Scholar] [CrossRef]
  9. Shen, C.; Che, W.L.; Gui, H. Analysis of influencing factors of e-commerce customer satisfaction based on Bayesian network-taking Jingdong sports shoes as an example. Math. Pract. Underst. 2020, 50, 285–294. [Google Scholar]
  10. Feng, K.; Yang, Q.; Chang, X.Y.; Li, Y.L. Customer Satisfaction Evaluation of Fresh Food E-commerce Based on Online Reviews and Random Dominance Criteria. China Manag. Sci. 2021, 2, 205–216. (In Chinese) [Google Scholar]
  11. Huang, L.; Tan, C.H.; Ke, W.; Wei, K.K. Helpfulness of online review content: The moderating effects of temporal and social cues. J. Assoc. Inf. Syst. 2018, 19, 3. [Google Scholar] [CrossRef]
  12. Capoccia, C. Online reviews are the best thing that ever happened to small businesses. Forbes. Retrieved Febr. 2018, 2, 2019. [Google Scholar]
  13. Kuan, K.K.; Hui, K.L.; Prasarnphanich, P.; Lai, H.Y. What makes a review voted? An empirical investigation of review voting in online review systems. J. Assoc. Inf. Syst. 2015, 16, 1. [Google Scholar] [CrossRef] [Green Version]
  14. Pu, X.; Wu, G.; Yuan, C. Exploring overall opinions for document level sentiment classification with structural SVM. Multimed. Syst. 2018, 25, 21–33. [Google Scholar] [CrossRef]
  15. Liu, B.; Zhang, Y. Research on evaluation of third-party logistics service quality based on dynamic fuzzy sets. IEEE 2011, 833–837. [Google Scholar]
  16. Baek, H.; Ahn, J.; Choi, Y. Helpfulness of Online Consumer Reviews: Readers’ Objectives and Review Cues. Int. J. Electron. Commer. 2012, 17, 99–126. [Google Scholar] [CrossRef]
  17. Maron, M.E.; Kuhns, J.L. On Relevance, Probabilistic Indexing and Information Retrieval. J. ACM 1960, 7, 216–244. [Google Scholar] [CrossRef]
  18. Yoffie, D.B. Competing in the age of digital convergence. Calif. Manag. Rev. 1996, 38, 31. [Google Scholar] [CrossRef]
  19. Fornell, C. A national customer satisfaction barometer: The Swedish experience. J. Mark. 1992, 56, 6–21. [Google Scholar] [CrossRef]
  20. Li, W.; Zhen, W. Frontier Issues of China’s Industrial Development; Shanghai People’s Publishing House: Shanghai, China, 2003. (In Chinese) [Google Scholar]
  21. Cai, Z.; Men, Y.; Liu, N. Comprehensive Evaluation of Customer Satisfaction of Cross-border Beauty E-commerce Based on F-AHP. China’s Collect. Econ. 2020, 18, 102–104. (In Chinese) [Google Scholar]
  22. Xu, J.; Huang, Y. AHP-Based Third-Party Logistics Service Provider Evaluation and Countermeasure Research. Chin. Mark. 2021, 2, 173–174. (In Chinese) [Google Scholar]
  23. Zhang, P.; Han, X.; Guan, Z. Research on User Satisfaction Index Model of Construction Enterprises. J. Southwest Pet. Univ. 2009, 2, 48–58. (In Chinese) [Google Scholar]
  24. Zhen, Z. Study on Customer Satisfaction of Human Resource Service Enterprises under the Background of “Internet +”. Master’s Thesis, East China Jiaotong University, Nanchang, China, 2020. (In Chinese). [Google Scholar]
  25. Fan, W.; Chen, X.; Peng, J.; He, Y. Research on Customer Satisfaction Evaluation Index System of Budget Hotels. Mod. Bus. 2018, 27, 98–99. (In Chinese) [Google Scholar]
  26. Bi, J.-W.; Liu, Y.; Fan, Z.-P.; Zhang, J. Exploring asymmetric effects of attribute performance on customer satisfaction in the hotel industry—ScienceDirect. Tour. Manag. 2015, 77, 104006. [Google Scholar] [CrossRef]
  27. Geetha, M.; Singha, P.; Sinha, S. Relationship between customer sentiment and online customer ratings for hotels - An empirical analysis. Tour. Manag. 2017, 61, 43–54. [Google Scholar] [CrossRef]
  28. Liu, Y.; Teichert, T.; Rossi, M.; Li, H.; Hu, F. Big data for big insights: Investigating language-specific drivers of hotel satisfaction with 412,784 user-generated reviews. Tour. Manag. 2017, 59, 554–563. [Google Scholar] [CrossRef]
  29. Li, M.; Zhao, X. Service quality evaluation method based on customer online evaluation information. J. Liaoning Univ. 2018, 46, 84–94. [Google Scholar]
  30. Ahani, A.; Nilashi, M.; Yadegaridehkordi, E.; Sanzogni, L.; Tarik, A.R.; Knox, K.; Samad, S.; Ibrahim, O. Revealing customers’ satisfaction and preferences through online review analysis: The case of Canary Islands hotels. J. Retail. Consum. Serv. 2019, 51, 331–343. [Google Scholar] [CrossRef]
  31. Ostovare, M.; Shahraki, M.R. Evaluation of hotel websites using the multicriteria analysis of PROMETHEE and GAIA: Evidence from the five-star hotels of Mashhad. Tour. Manag. Perspect. 2019, 30, 107–116. [Google Scholar] [CrossRef]
  32. Feng, J.; Cai, S. Online comment usefulness prediction model fused with information gain and gradient descent algorithm. Comput. Sci. 2020, 47, 69–74. (In Chinese) [Google Scholar]
  33. Klinger, R. An analysis of annotated corpora for emotion classification in text. In Proceedings of the 27th International Conference on Computational Linguistics, Santa Fe, NM, USA, 20–26 August 2018; pp. 2104–2119. [Google Scholar]
  34. Ye, X.; Mao, X.; Xia, J.; Wang, B. Improvement of text classification TF-IDF algorithm. Comput. Eng. Appl. 2019, 55, 104–109. (In Chinese) [Google Scholar]
  35. Du, J.-R.; Gao, L.Q.; Liu, Y.; Li, B.; Yang, Z.M. Research on the Influencing Factors of Consumers’ Willingness to Buy New Energy Vehicles in Beijing, Tianjin and Hebei. Value Eng. 2019, 38, 220–223. [Google Scholar]
  36. Chen, N. Empirical Research on the Deviation Degree of UGC Anchoring Effect Based on E-Commerce Platform. Master’s Thesis, Beijing University of Posts and Telecommunications, Beijing, China, 2017. (In Chinese). [Google Scholar]
  37. Hu, H.; Wei, X.; Wang, Q.; Ou, C.; Yan, Y.; Lv, Y.; Liu, X. EMA-qPCR method for detection of lactic acid bacteria content in fermented feed. J. Anim. Husb. Vet. Med. 2019, 50, 2166–2170. (In Chinese) [Google Scholar]
  38. Sun, W.; Wu, H. Forecasting Analysis of China’s CPI Seasonal Adjustment Model. Stat. Decis. 2017, 2017, 14. [Google Scholar]
  39. Dellarocas, C.; Zhang, X.M.; Awad, N.F. Exploring the value of online product reviews in forecasting sales: The case of motion pictures. J. Interact. Mark. 2007, 21, 23–45. [Google Scholar] [CrossRef]
Figure 1. The regression result of the comment usefulness model.
Information 12 00234 g001
Figure 2. The relationship between comment usefulness and the length of the review.
Information 12 00234 g002
Figure 3. Weighted satisfaction curve of the microwave oven.
Information 12 00234 g003
Table 1. Symbol Description.
SymbolsDescription
iSerial number of rating record
tSerial number of evaluation
H i Helpful votes
T i Total votes
V i Helpful rating
L i Log length of a review
E i Effectiveness of star rating
θ The influence of Amazon Vine Voices on E i
φ The influence of V i on E i
R i Star rating
E R i Effectiveness weighted star rating
α The decay degree parameter in EMA
kThe length of one roll
NThe number of rating records in a scrollable pane
L t Weighted satisfaction indicator
Table 2. Amazon review dataset.
ProductMicrowaveBaby PacifierHair Dryer
Number_of_data18,939161511,470
Number_of_brands546457499
FeaturesCustomer_idRandom identifier that can be used
to aggregate reviews written by a single author
Review_idThe unique ID of the review
Product_idThe unique Product ID the review pertains to
Star_ratingThe 1–5 star rating of the review
Helpful_votesNumber of helpful votes
Total_votesNumber of total votes the review received
VineCustomers are invited to become Amazon
Vine Voices based on the trust that they
have earned in the Amazon community
for writing accurate and insightful reviews.
Amazon provides Amazon Vine members
with free copies of products that have been
submitted to the program by vendors. Amazon
does not influence the opinions of Amazon Vine
members, nor do they modify or edit reviews.
Verified_purchaseA “Y” indicates that Amazon verified that the person
writing the review purchased the product at
Amazon and did not receive the product at a
deep discount.
Review_dateThe date the review was written
Review_titleThe title of the review
Review_bodyThe review text
Table 3. Top 10 feature terms related to each star (microwave oven).
12345
not buypemSlimfourfive
junkpausePansemblemlove
callsnozzleFrypreheatperfect
boardpowersGuideracksfantastic
firegrindingSidesfancycoats
garbageveggiescarefulgrillingexcellent
recallstovetopstraightvaluefoot
worstdualbreadedeffortawesome
codefiltersWoodmenulimited
repairmanbulbFiltermountcrispy
Table 4. Top 10 feature terms related to each star (baby pacifier).
12345
faketilesthreefourfive
junkengineeringdefeatschannelsaver
unsafeboatbumbleridevestlifesaver
worstholynot horribledrawbackgifts
not suitablecollapsesflightdrapescutest
refundrelaxesnot necessarydownfallamazing
not wastestreamingplacematcomplaintbrilliant
wasteretainsquarterminorpenny
not safecamerasalertoverallexcelente
horriblemattenot favoritelimbsexcellent
Table 5. Top 10 feature terms related to each star (hair dryer).
12345
junknot lockAdvancefourfive
garbagenot meetnot baddiffuserloves
dangerousnot recomendHeadspowderlove
wastecottonAlrighttanbest
worstsubstitutedWaverscomplaintamazing
not buyreleasednot impressedminorexcellent
refundlemonStudiobrownawesome
awfultastePhilipselastichappier
explodedsparkingOkaycordsfantastic
needlessexcessiveLooponlywonderful
Table 6. CVs of three products’ satisifaction indicator.
MicrowavePacifierHair Dry
Mean3.44464.30464.1160
Variance2.70681.41711.6909
Coefficient of Variation0.47760.27660.3159
Publisher’s Note: MDPI stays neutral with regard to jurisdictional claims in published maps and institutional affiliations.

