Article

Design Guidelines for the Size and Length of Chinese Characters Displayed in the Intelligent Vehicle’s Central Console Interface

1
Car Interaction Design Lab, College of Art and Media, Tongji University, Shanghai 201804, China
2
College of Design and Innovation, Tongji University, Shanghai 201804, China
*
Author to whom correspondence should be addressed.
Information 2021, 12(5), 213; https://doi.org/10.3390/info12050213
Submission received: 25 April 2021 / Revised: 7 May 2021 / Accepted: 12 May 2021 / Published: 18 May 2021

Abstract

:
In order to ensure the driver’s safe driving, the human–computer interaction interface of an intelligent vehicle needs to convey important information. The text is an important carrier of this kind of information. The design criteria of English characters have been widely discussed, including the color, meaning, size and length. However, design guidelines for Chinese characters in central consoles of vehicles have rarely been discussed from a human–computer interaction perspective. In this paper, we investigated the size and the length of Chinese characters in the intelligent vehicle’s central control screen, based on international design guidelines and standards. The experiment involved 30 participants performing simulated in-vehicle secondary tasks. The result from the experiments shows that the usability of characters increases and the driver’s workload decreases as the characters get larger and shorter. We also propose a set of recommended values for the size and length of Chinese characters in this context. Future work will focus on providing design guidelines for other aspects of HMI design in intelligent vehicles.

1. Introduction

With the development and application of technology in automotive technology [1], [2], the automotive industry faces the new challenge of designing revolutionary human–machine interface (HMI) for the mass production of intelligent vehicles, and the complexity of in-vehicle interfaces has increased dramatically. Central console interfaces now provide the driver with access to varied applications from information to infotainment functions [3]. The interface can also affect the driver’s behavior. Giovanni Delnevo et al. [4] studied braking prediction through the analysis of big data and displayed this prediction information on the interface to promote the driver’s ecological driving behavior. Many of these applications use texts to display information on the central control screen, from live weather reports, vehicle fault warnings to integrated navigation systems with the address lists and the next direction of a trip. As a result of the development of intelligent in-vehicle systems, static hardware buttons, and simple dashboards have gradually given way to larger in-vehicle screens and touch screens, which can adapt to the growing flow of information and provide convenient ways for drivers’ interaction.
It should be taken into account that these screens provide ever-richer information, and drivers use them to accomplish more non-driving tasks, so that drivers’ attention may turn to the device with increasing frequency and duration, rather than to road conditions. Research shows that cognitive load increases steadily with the increase of secondary task difficulty [5]. Providing drivers with visual user interfaces whose information content can be easily read is important. If text characters are hard to read, user satisfaction will be low and the risk of accident may increase. Therefore, the interface design of characters should be optimized to reduce visual demands and reaction time to complete non-driving tasks to reduce workload and free more attention resources.
There is a positive correlation between the accident and the time of the driver’s single sight of the road. It is pointed out that if the driver’s sight is off the road for more than 2 s, the probability of accident will increase [6]. From the visual point of view, the information layout of the interface will have an impact on the scanning time [7], and the information itself will also have an impact. Reading text with different amounts of information or words can affect the reading time and accuracy. From the perspective of font designers, factors that influence legibility can be divided into extrinsic and intrinsic [8]. Extrinsic factors are physical considerations such as size, contrast, polarity, and color. These factors have received attention within the in-vehicle visual presentation and are covered by various standard documents or design guidelines [9,10]. A significant factor that influences reading speed is the text size, which has been confirmed in automotive research [11,12,13]. IOS 15008 also proposes standards for the length of text and the space between characters [6]. However, this research is based on English characters. There are few studies about the effect of the size and length of Chinese fonts in the in-vehicle interface. At the same time, they are assumed to have a great impact on driver behavior, so we focus on these two aspects of Chinese characters.
Evidently, we carry out experiments to draw design guidelines for the displayed size and the number of Chinese characters per row in the intelligent vehicle’s central control screen based on usability and the drivers’ performance.

2. Related Work

Previous research on the legibility of text has been concerned with embedded reading, using metrics and tasks about reading entire paragraphs of text [14]. However, modern reading behavior is fragmented with brief glances, whether looking on a smartphone or scanning at an in-vehicle screen [15]. In the scene of driving, the displayed text on the in-vehicle screen has a significant impact on safe driving. Therefore, exiting studies have also included information on visual signal interaction, text design standards, and driving cognitive models.
A. Visual Signals’ Classification and Human–Computer Interaction Model
In visual interaction, the human and the computer exchange information through interfaces, in form of visual signals composed of text, icons, and colors [16]. The visual signals are of primary importance in the driving and can be divided into various sensory dimensions such as color, luminance, and contrast, as well as stimulus dimensions such as location, size, height, length, shape, spacing, and periodicity [6]. Visual signals must be seen to be effective, and placing them in optimal locations in vehicles can help quickly detect visual signals and promote faster responses to them. In addition, the sensory and stimulus dimensions mentioned above can be combined to maximize the legibility and comprehensibility of messages.
In each step during the interaction, drivers keep offering instructions to the computer and receiving feedback and the interfaces become the communication channel between humans and computers. The visual information provides its meaning for humans and the computer respectively. In order to establish a successful human–computer interaction through visual signals, Bottoni et al. [17] suggest that the correct communication occurs if a pair of inverse morphisms can be established between user meaning and computer meaning.
B. Standards and Guidelines about the Size and Length of Text
Optimum text presented in the driver–vehicle interface is legible under a large number of viewing distances, viewing angles, and environmental conditions. Here are a lot of literature about reference values of text size.
ISO15008 recommends that the character heights for in-vehicle display alphanumerical text should be at least 20 arc-minutes of visual angle, but 16 arc-minutes are also acceptable. Furthermore, it is one of the few standards that provide reference values for Chinese font sizes, which recommends the minimum or modification size of Chinese characters is 24 ∗ 24 pixels. However, studies on Chinese character sizes and related recommended values are very limited. HUAWEI company suggests that 5.3 mm is the minimum size of Chinese characters that can be recognized [18].
Referring to the length of characters per row, there are few standards providing reference values. However, the capacity of short-term memory is instructive to the length design, which indicates that it is easy for people to remember 5–7 items [19].
Before starting this research, we investigated the central console interfaces of 22 intelligent vehicles in the Chinese market and sorted out their information architectures, and the main features of Chinese characters, especially in terms of size and length. The results show that the font size of the first-level heading is 36–40 pt, and of the second-level heading is 20–24 pt. In terms of length, the first-level heading is 4–6 characters, and the second-level heading is 10–16 characters.
After that, we invited six professional test drivers to subjectively score user satisfaction to central control screen interfaces and some vehicle’s interfaces received a high score of recognition. The minimum font size on these interfaces is 3 mm and the average number per row is about seven characters. Based on this literature and our statistical results, we selected the range of the two independent variables of the size and length for Chinese characters.
C. Driving Cognitive Model
There are conceptual cognitive models [20,21], which try to explain components and processing stages including information perception while driving. Mathematical cognitive models explain cognitive principles through signal detection theory [22] for a driver’s information processing [23], information theory [24], and computational cognitive models [25,26,27,28], which focus on understanding the driving process and interaction with different cognitive patterns to reproduce driver behaviors.
Among the above cognitive models, we choose Endsley’s Situation Awareness to explain the cognitive process in the test tasks [29]. Endsley defines situation awareness as “knowing what is happening around you”, which refers to the user’s cognition of the surrounding environment and state. The model describes three levels of understanding: perception of elements in the current situation, comprehension of the current situation, and projection of future status. In other words, factors in the environment are perceived within a certain time and space, their meanings and relationships are understood, and their states in the near future are predicted by drivers.
The driver must draw a conclusion quickly from the deserved information and must understand the meaning or importance of the information [30]. Therefore, time from perception to understanding is very important. In the process of driving, 90% of the driver’s information comes from the human visual system. When engaging in non-driving tasks, the driver cannot withdraw his/her eyes off the road over 2 s [15]. K. L young et al. [31] summarized the decline of cognitive ability and physical ability of the elderly through the research on their use of interactive interface, and also put forward requirements for the design of HMI, such as the guidelines for amount of text, including the research on the optimal font size or display luminance. We explain the experiment tasks using this situation awareness model in the procedure part.

3. Method

We use the driving simulator to conduct the experiment. We require the experiment participates to complete a series of text information cognitive tasks while keeping driving safe. The font size and the length of the sentence were used as the variables of the experiment. We counted the time that took the participates to complete the task, and after a group of tasks were completed, we asked the participants to complete the usability scale and the workload scale.
A. Participants
A representative sample of experienced drivers was recruited to take part (n = 30), comprising 16 males and 14 females. Ages range from 25 to 44 years with a mean age of 33.2, driving experience more than 2 years. Most of them have the experience of using central consoles frequently or occasionally while driving.
B. Experimental environment
The location of the in-vehicle environment and the devices can affect the reading and understanding of the text, so we designed the position of the driver and the central control screen of a real car based on the ergonomics in the automotive design process [32]. On the basis of seat height of 260 mm, the horizontal distance from the steering wheel to the accelerator heel point was set to 440 mm and the height of the steering wheel was set to 660 mm [32]. As for the position of the central control screen, we set the height from the screen center to the ground as 710 mm, the transverse distance between the screen center and the center of the steering wheel as 390 mm, and the horizontal longitudinal distance as 150 mm [32]. At the same time, we tried to ensure that the eyes of participants were 710 mm away from the center of the central control screen, which may vary with participants’ height. A Surface tablet computer was placed on the central control screen and visualize the test content, which ran on a unity application designed to enable the commands like initiate a trial. An experimenter is responsible for controlling the tablet computer. The daytime light (about 5 klx with a relative tolerance of 5%) was selected as the illumination condition in this test of vehicle visual display, as proposed by SAE J1757/1:2015 (SAE, 2015) (see Figure 1).
C. Task and Stimuli
In task designing, driving straight forward at a speed of about 30 km/h was the primary driving task and the non-driving task was to name the text on the central console under the premise of safety and stability. Naming tasks has been used in a lot of English and Chinese character experiment [13,33], in which participants identify and read the target stimulus. The processing of fonts was measured by reaction time from the appearance of the target stimulus to the response of the participants.
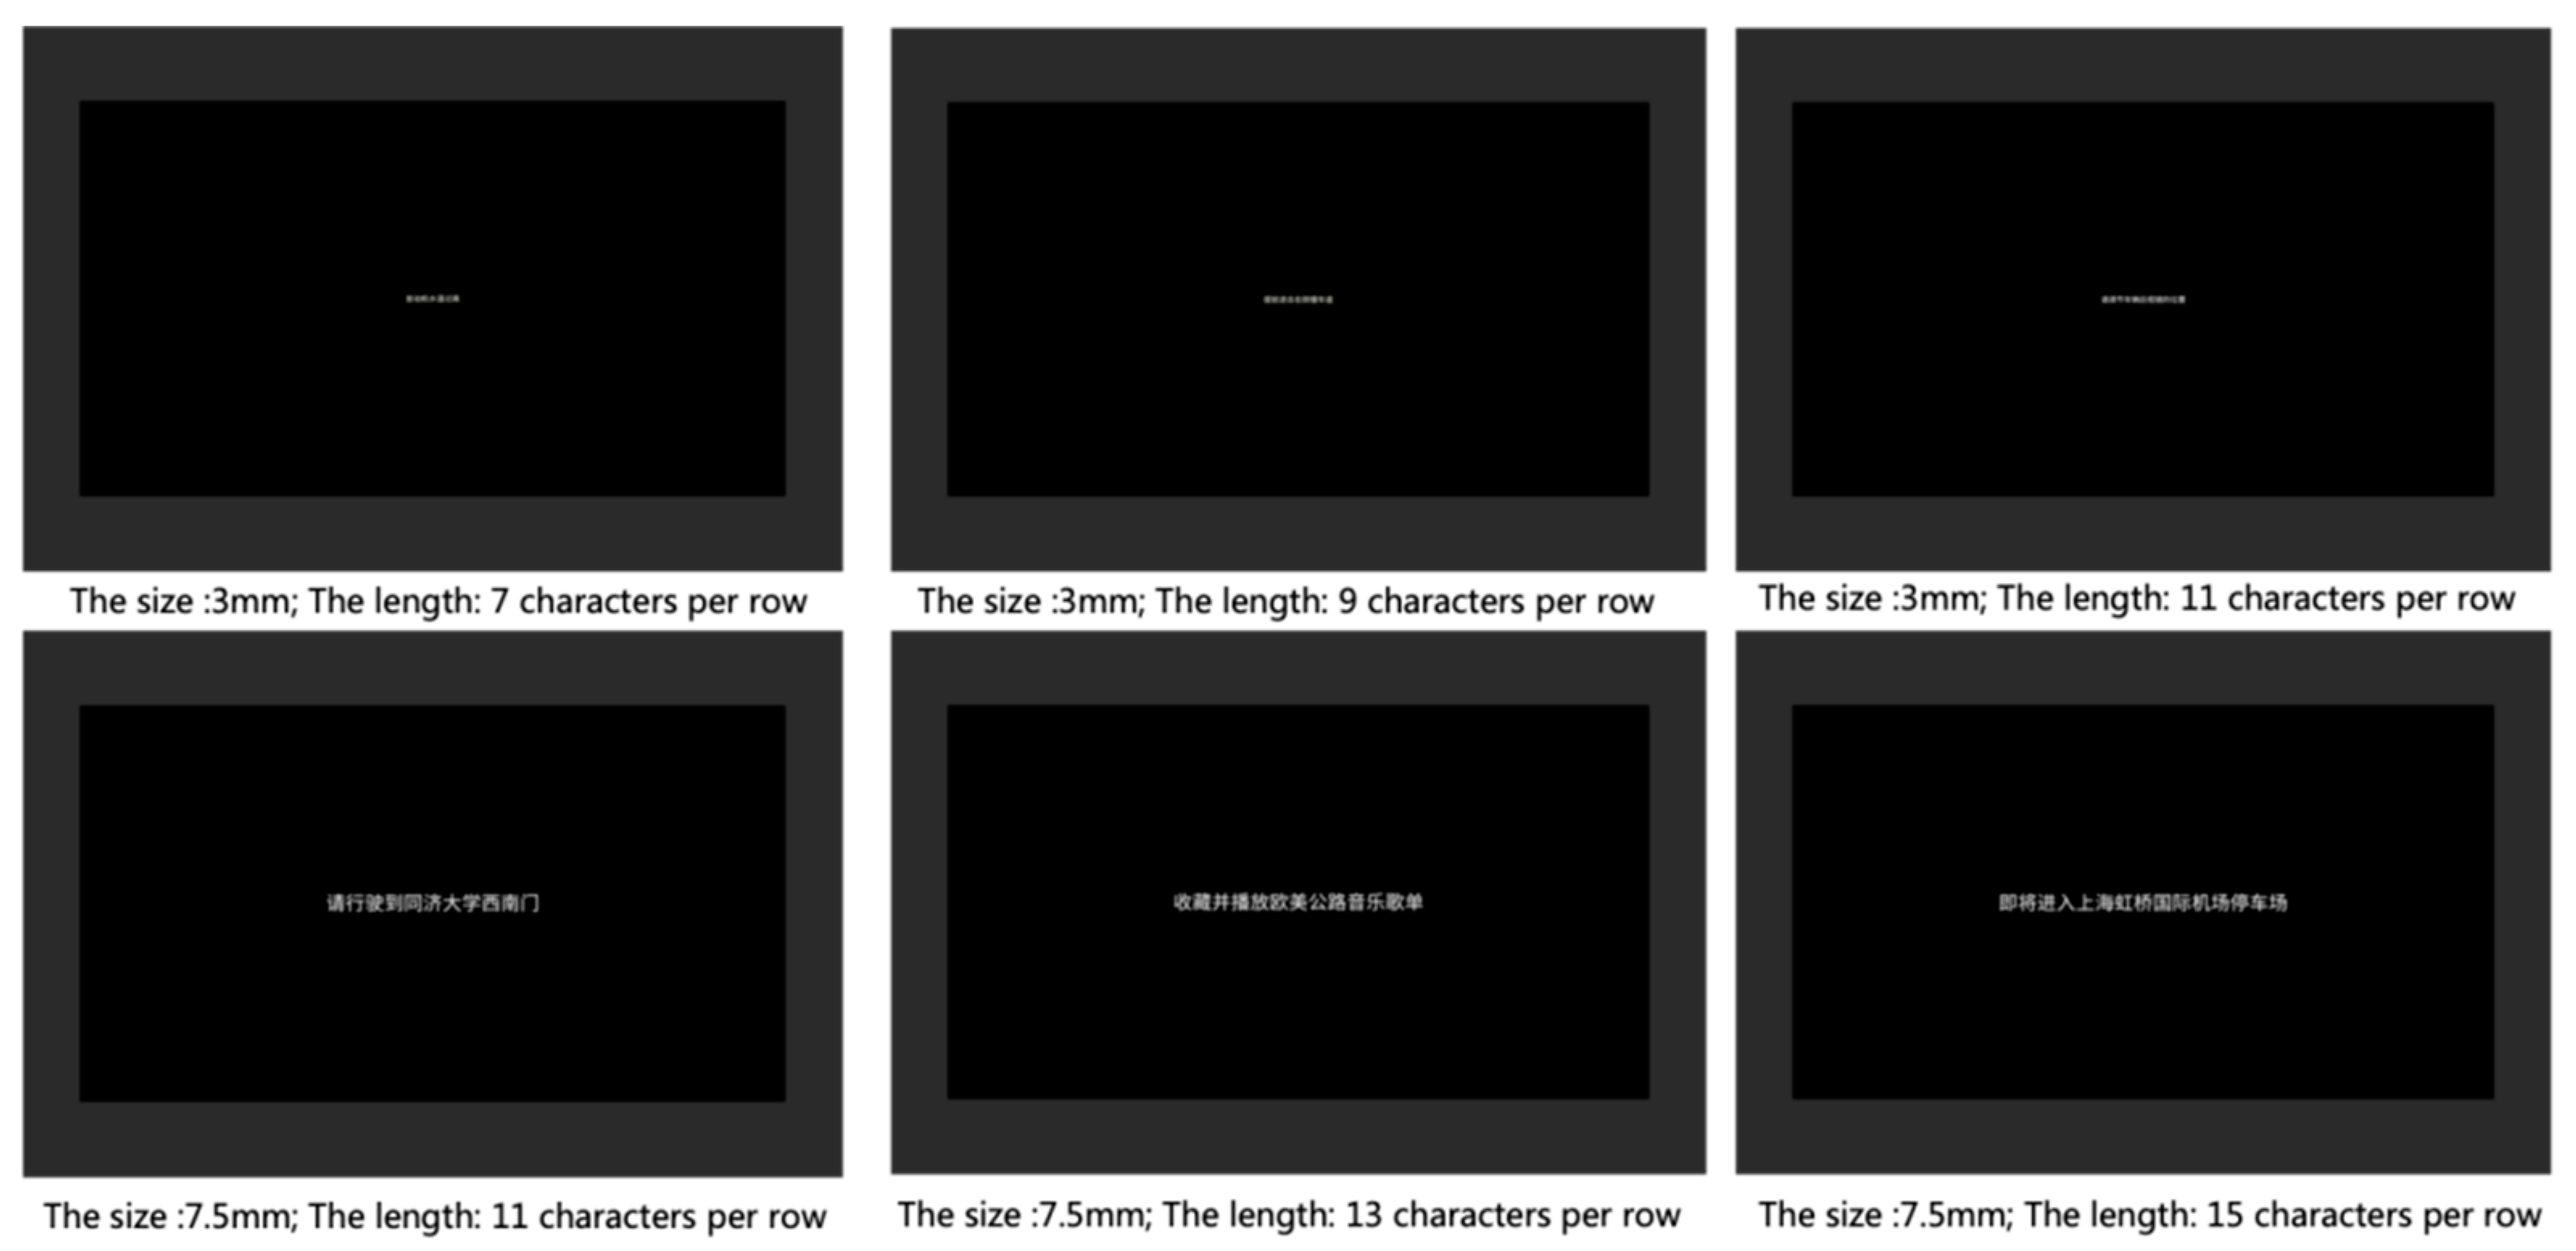
The stimuli of retelling tasks were Mandarin sentences written in Simplified Chinese characters. The text contents consist of the functions of navigation, entertainment, vehicle settings, and driver assistance (see Figure 2). The stimuli varied according to two independent variables: the size of the character (3 mm, 4.5 mm, 6 mm, and 7.5 mm) and the length or the number of characters per row (7, 9, 11, 13, and 15 per row). Each participant performed all 20 tasks combined in levels of size and length (4 levels of height * 5 levels of the number of characters per row = 20 tasks).
Chinese characters using the typeface named Noto sans s Chinese Regular were displayed in pure white (RGB: 255, 255, 255) against a background of a pure black (RGB: 0, 0, 0) in the center of a 12.3-inch screen with 16:9 ratio (see Figure 2).
D. Procedure
Participants read and signed an informed consent and filled in a questionnaire covering demographic information and driving experience. They then came to the simulator and adjusted their seat so that they were comfortable. Next, the experimenter described the test purpose, test content, and test tasks to them and they received instruction on how to interact with the driving simulator. One must be emphasized to participants is that while performance on the non-driving task is important, they should balance driving safety while attempting to complete the tasks, just as they were driving a real car. A brief practice provided a familiarization with the simulator environment and task process, the formal experiment then began.
In this experiment, participants received instructions for non-driving tasks while driving smoothly at a speed of about 30 km/h. A notification tone was employed to cue the participants that the non-driving task was ready, they should scan and try to remember the meaning of the text which just appeared. They could let the experimenter know that they have completed the task by pressing a button on the steering wheel, then the text disappeared and the participants repeated what they had seen. In the cognitive process, after hearing the notification sound, participants began to obtain visual information from the central control screen and selected method to scan and recognize the text information based on the driving condition and surrounding environment, so as to judge whether they could retell the information completely and quickly based on short-term memory. According to the participants’ different abilities and experiences, they made the decision to press the button to start retelling and finally made the corresponding action according to the decision.
After each task was completed, the participants were asked to fill out a questionnaire about usability and a single global workload rating [34]. When the process was repeated 20 times, the whole experiment was over. Test contents were carried out in random order. The whole test lasted approximately 30 min.
E. Questionnaires and Data Analysis
In the experiment, we used a questionnaire about the visual subjective rating, a usability questionnaire, and a global workload rating questionnaire. The visual subjective rating questionnaire was a 7-point scale (on a scale of −3 to 3) used to describe participants’ visual impressions of the text regarding the size and length of the characters. For the size of characters, −3 meant the participants thought the characters were too small, 0 meant the characters were just the appropriate size, and 3 meant the participants thought the characters were too big. Similarly, for the length of characters, −3 and 3 meant that the length of characters was too short and too long respectively, while 0 was the length that was most appropriate. Generally, the usability questionnaire describes efficiency, effectiveness, and satisfaction. Due to the experiment starting from visual evaluation, we chose the clarity of Chinese characters as the representative of efficiency and the understanding of Chinese characters as the representative of effectiveness. The chosen clarity and understanding are the operated items for the two dimensions. We then designed a usability questionnaire using Likert’s 7-point scale (α = 0.814), and we combined the three aspects to comprehensively describe the usability of Chinese characters. As for the workload, we chose the global workload rating questionnaire, which showed consistent results as NASA-TLX [34]. The global rating was a short form to rate how much workload was associated with each type of task using a 0 to 10 scale, where 0 = very low workload, and 10 = very high workload.
Since the data did not meet the normal distribution, the Spearman’s rank correlation coefficient was used. All data were analyzed and visualized in SPSS and Excel.

4. Results

We analyzed objective and subjective data, including response time, visual satisfaction, usability, and workload. The results show that the font size and length have a certain influence on the reaction time. When the font size is less than 6 mm, the reaction time is positively correlated with the font size. When the font size is greater than 6 mm, the reaction time does not change significantly. When the font size is less than 13 characters, the response time is negatively correlated with the number of characters, while when the font size is more than 13 characters, the response time does not change significantly.
A. Reaction Time
Longer reaction times may indicate increased processing and higher uncertainty or difficulty [35]. Therefore, shorter reaction times might make less uncertain or a bad influence on drivers’ behavior. A number of reaction time effects are shown in the data. The main effect of different sizes of characters on reaction time (r = 0.125, p < 0.05) was found and was shown in Figure 3, in which the reactions for the larger Chinese characters are faster. The reaction time of 4.5 mm character size is 6.97% shorter than that of 3 mm and the reaction time of 6 mm character size is 6.63% shorter than that of 4.5 mm character size, while participants reacting to 7.5 mm characters are just 2.39% faster than reacting to 6 mm characters. We can find that there are clear differences in reaction time between the size of 3 mm, 4.5 mm, 6 mm. As the size exceeds 6 mm, reaction time begins to obviously decrease. As a result, when the size of Chinese characters is larger than 6 mm, the size has little impact on the reaction time.
As for the length of Chinese characters per row, the reaction time increases with the increasing number of Chinese characters per row (r = 0.337, p < 0.05). We can find in Figure 4 when the number of characters per row changes from 7 to 13, the reaction time tends to increase. Reaction times even decrease from 13 to 15 characters per row. Therefore, the drivers use more attention resources as the length increases. And when the number of Chinese characters is more than 13, the effect of the length on the reaction time and the driver’s performance is unclear.
B. Visual Subjective Rating
After each task was completed, participants were immediately asked to score the visual perception of the Chinese characters in the task. When the size of Chinese characters is taken as an independent variable, it is found that the size of Chinese characters has an effect on the visual subjective rating and there is a strong correlation between the two variables (r = 0.725, p < 0.01). As shown in Figure 5, the participants thought the Chinese character sizes of 6 mm and 7.5 mm are both appropriate, but the size of 6 mm was better. At the same time, they believed that the 4.5 mm Chinese characters were a little small, while the 3 mm Chinese characters were particularly small, which may affect the legibility of Chinese characters.
The length of Chinese characters significantly impacts the visual subjective rating (r = 0.603, p < 0.01). As illustrated in Figure 6, the participants rated 7 or 9 words per row as the closest scores to 0, which means 7 or 9 words are the most visually appropriate length for them. As the number of characters per row increases, the visual subjective rating of the length increases. When the number of words per row was more than or equal to 13 words, the participants consider the text to be particularly long.
C. Usability Scores and Workload
In this section, usability and workload questionnaires are used to measure participants’ perception of different Chinese character sizes and lengths.
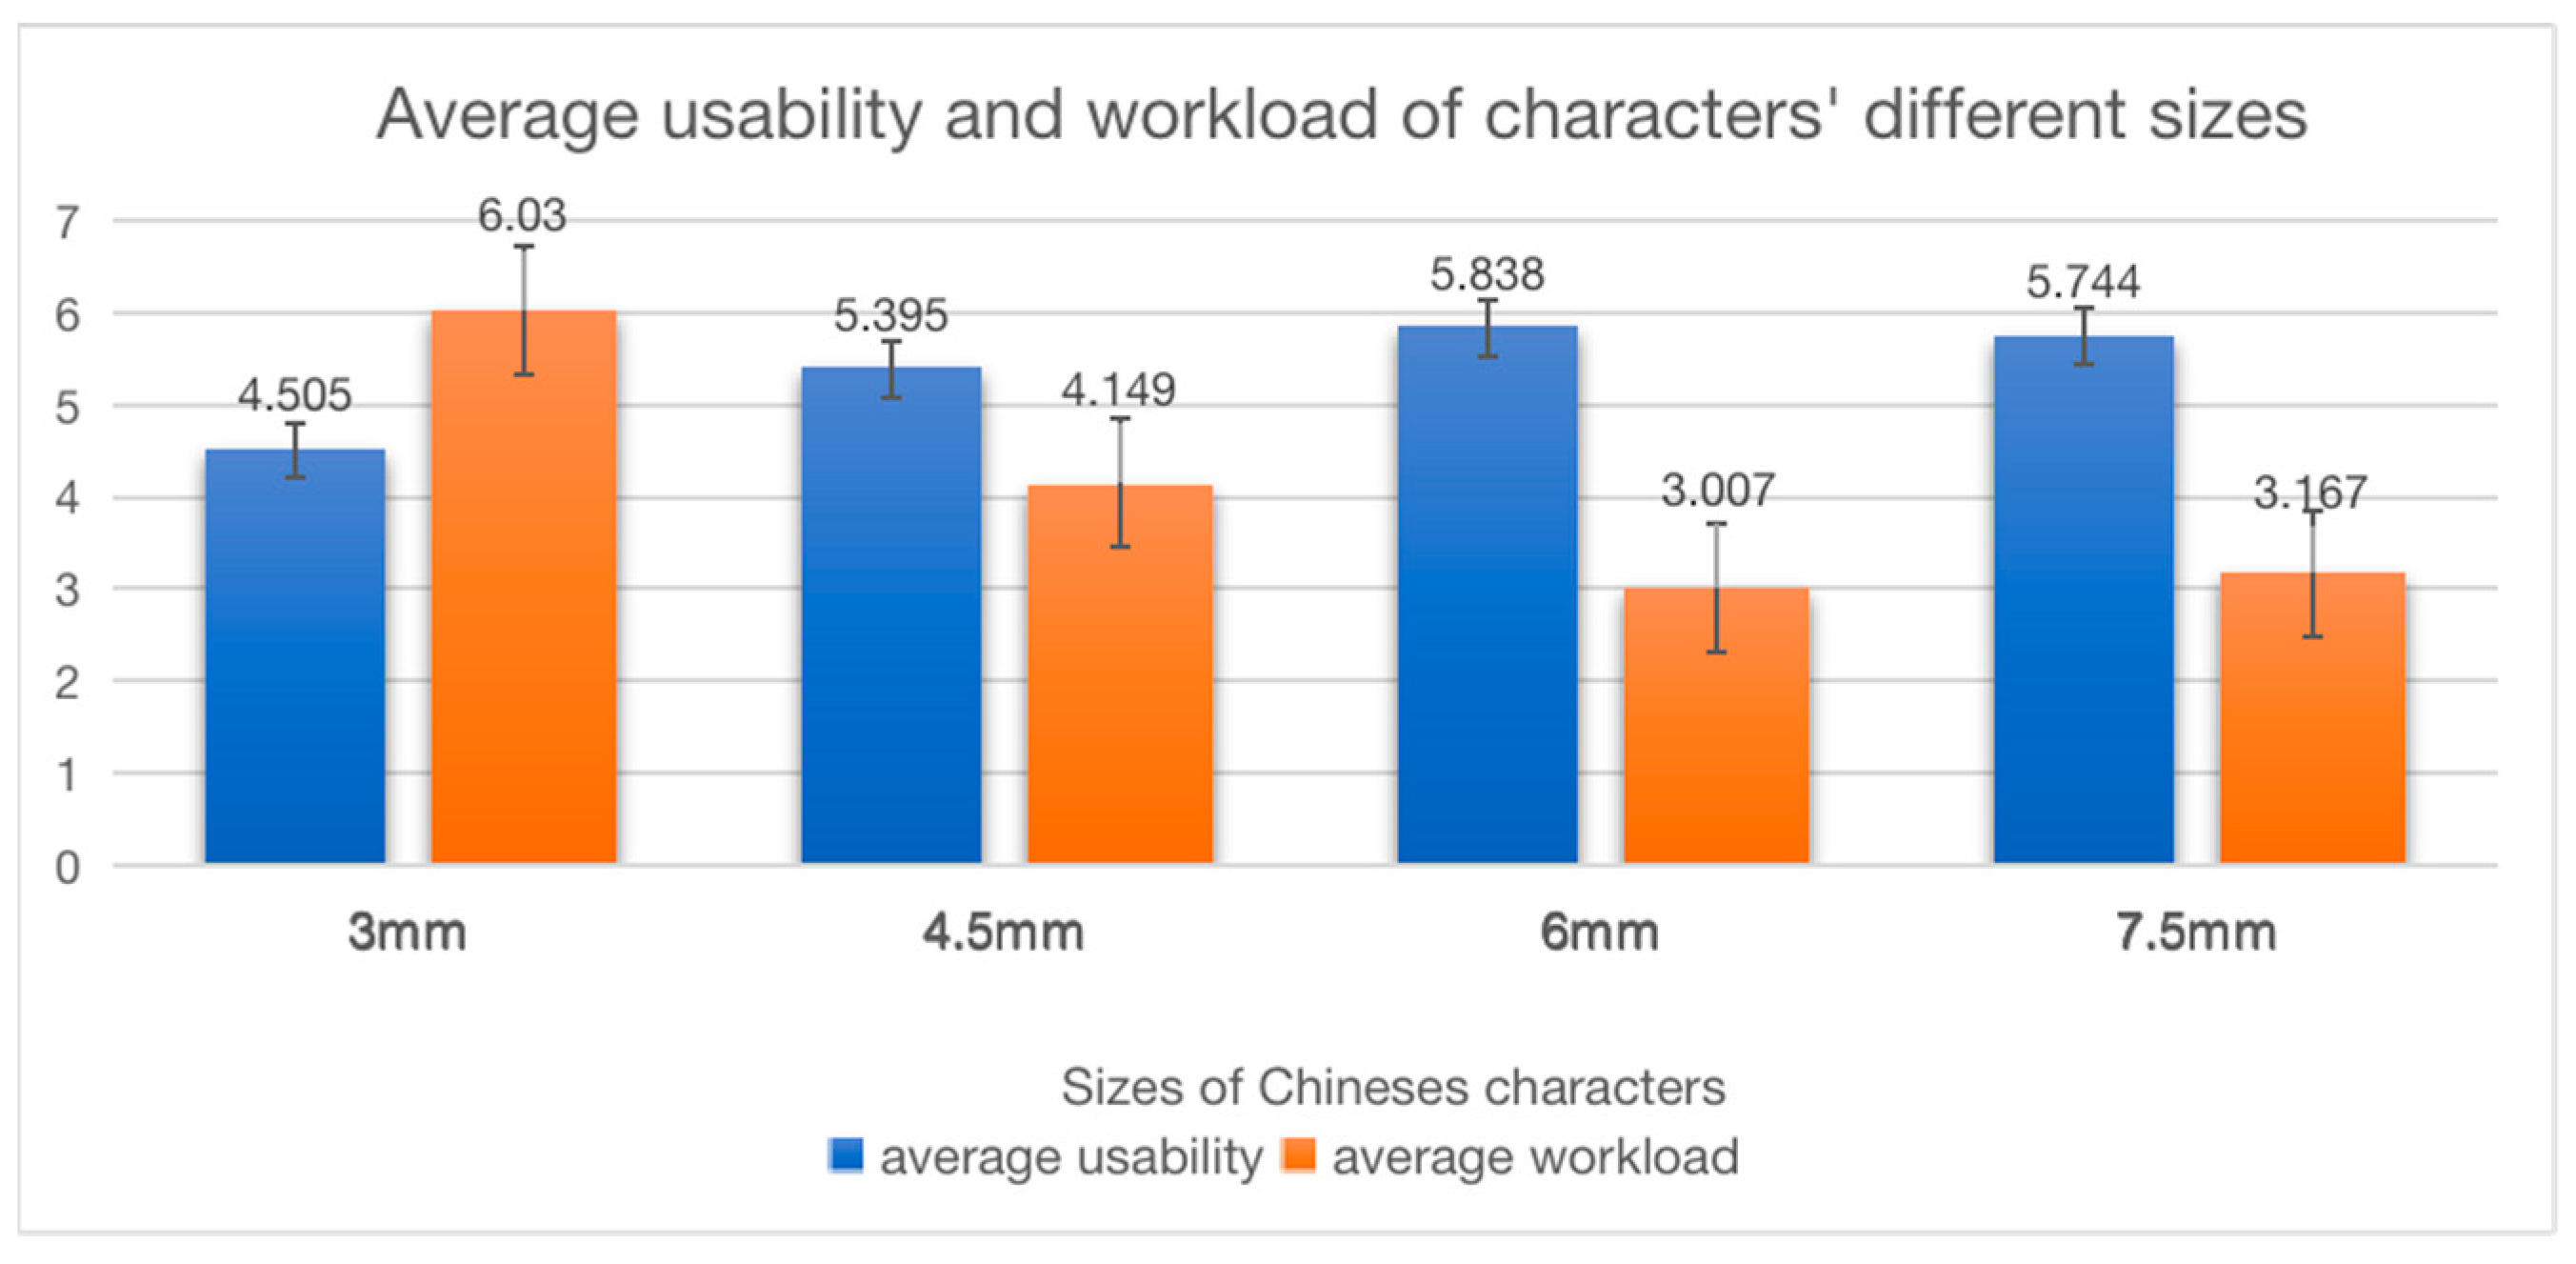
In this experiment, character size has significant effect on usability (r = 0.346, p < 0.01) and workload (r = 0.399, p < 0.01). As the character size increases from 3 mm to 6 mm, the usability increases by 19.8% and 8.2% respectively. When the characters change from 6 mm to 7.5 mm, the usability decreases by 1.6%. Regarding the workload, when character size increases from 3 mm to 6 mm, the workload decreases by 31.2% and 27.5% respectively, while the workload scores of 7.5 mm character are 5.3% higher than that of 6 mm character (see in Figure 7). We can find that the character size of 6 mm is a turning point. When the character size is larger than or equal to 6 mm, the changing trend of usability and workload is smoother than the scoring trend of character sizes smaller than 6 mm. In summary, participants’ perception of character size is getting better as the size increases, but this effect becomes smaller when the size exceeds 6 mm.
As shown in Figure 8, as the number of words per row increases, the usability decreases, and the workload increases. When the number of words per row increases from 7 to 15, the usability scores decrease by 9.6%, 0.4%, 3.5%, and 3.7% in turn. In other words, 9 words per row is a turning point in usability scoring. When the number of words per row exceeds 9 words, the usability decreases in a smoother trend. At the same time, with the increase of the length, the workload has been gradually increasing in a consistent trend. In general, when the number of words per row is 7 or 9, participants’ perception of text is better. Conversely, participants’ perception of text gradually deteriorates as the length continues to increase.

5. Guidelines and Discussion

The study explored the usability and drivers’ workload influenced by different displayed sizes and lengths of Chinese characters in the intelligent vehicle’s central control screen in the driving simulator. Results show that the recommended minimum character size is 4.5 mm, and the recommended appropriate text size is 6 mm with the premise of ensuring legibility. Participants also accept when the size of Chinese characters is larger than 6 mm. For character length, 7 or 9 words or less than 7 or 9 per row are most appropriate, which also conforms to the law of short-term memory [36]. At the same time, it is recommended that the maximum number of Chinese characters per row should not exceed 13 words.
Extending the findings in the experiment to specific design guidelines, designers can build the text hierarchy of the interface by choosing suggested different character sizes. In the navigation scenario shown in Figure 9, the recommended minimum character size of 4.5 mm can be used for the explanatory text, 6 mm characters can be used for the main list display, and 7.5 mm characters can be used for the title bar display. Designers can arrange the text size to highlight the different levels of text information according to design requirements. For the text length, the text in the title bar is better within 9 characters, and each row of text needs to be set within 13 characters in the pop-up window about warnings or notifications. This allows drivers to quickly understand information and reduce distractions for driving tasks.
In order to facilitate designers to directly use the results in the design phase, we provide reference values for the Chinese character size in points. The minimum recommended font value is 12.76 points, and the most appropriate recommended value is 17 points. Designers can refer to the design guidelines to improve and adjust interface design based on different scenarios.
In addition, because this experiment is carried out under a 12.3-inch screen with a 16:9 ratio, more considerations are required when using experimental results on other screens with different sizes and proportions. It can be further utilized to detect optimal design patterns using a larger data set.

6. Limitations

In this study, we studied the effect of the size and length of the characters on human cognition. The limitation is that 1. There are essential differences between Chinese and English. A single Chinese character has its meaning, and in English, a word composed of multiple characters can express meaning. This experiment did not consider this effect. Perhaps following the English language rule, such as grouping characters that make up a word, will also reduce the comprehension time. 2. In addition, color, layout, etc., will also affect the degree of difficulty in people’s perception, and we only tested in the case of a single color. 3. Finally, our experiment is carried out on the simulator. As the simulator has no dynamic vibration, it may not be considered whether the vibration will affect the recognition of text in the real vehicle.

7. Conclusions

This experiment proposes a basic research method from the perspective of visual design and workload for the in-vehicle equipment in a dynamic environment, which is not just for Chinese characters and can be expanded into other fonts. Starting from the size and length of the Chinese characters, we can further study the dimensions of icons, colors, and layouts in the central console interface design in the future. The proposed design guidelines for the intelligent vehicle’s central console can provide a reference for the current innovative design wave of the global automotive human-machine interface. Of course, we cannot rely too much on guidelines, as Tetzlaff et al., argued that we should reduce the dependence on the guide, treat the guide as a supplementary tool, and focus on the information that these tools cannot obtain from the interaction design [37]. Our guide is just an exploration. It can also improve the driver’s information processing for driving tasks and in-vehicle non-driving tasks, and expand on the current knowledge of user-centered design.

Author Contributions

Conceptualization, F.Y.; methodology, Y.-F.Y.; validation, Y.-F.Y. and M.-T.F.; formal analysis, Y.-F.Y.; investigation, Y.-F.Y.; resources, M.-T.F.; data curation, M.-T.F.; writing—original draft preparation, Y.-F.Y.; writing—review and editing, J.Z.; visualization, Y.-F.Y.; supervision, F.Y.; funding acquisition, J.-M.W. All authors have read and agreed to the published version of the manuscript.

Funding

This work was supported by The National Social Science Fund of China (#19FYSB040), the Intelligent Vehicle’s Central Console Interface program of Tongji university and Baidu, Inc. (#wz0060020192097).

Data Availability Statement

The data presented in this study are available on request from the corresponding author.

Conflicts of Interest

The authors declare no conflict of interest.

References

  1. Brookhuis, K.A.; Waard, D.D.; Janssen, W.H. Behavioural impacts of advanced driver assistance systems: An overview. Eur. J. Transp. Infrastruct. Res. 2001, 1, 3. [Google Scholar]
  2. Lu, M.; Wevers, K.; Van Der Heijden, R. Technical Feasibility of Advanced Driver Assistance Systems (ADAS) for Road Traffic Safety. Transp. Plan. Technol. 2005, 28, 167–187. [Google Scholar] [CrossRef] [Green Version]
  3. Dobres, J.; Reimer, B.; Mehler, B.; Chahine, N.; Gould, D. A Pilot Study Measuring the Relative Legibility of Five Simplified Chinese Typefaces Using Psychophysical Methods. In Proceedings of the 6th International Conference on Communications and Broadband Networking-ICCBN 2018, Singapore, 24–26 February 2018; Volume 14, pp. 1–5. [Google Scholar]
  4. Delnevo, G.; Di Lena, P.; Mirri, S.; Prandi, C.; Salomoni, P. On combining Big Data and machine learning to support eco-driving behaviours. J. Big Data 2019, 6, 1–15. [Google Scholar] [CrossRef] [Green Version]
  5. Čegovnik, T.; Stojmenova, K.; Jakus, G.; Sodnik, J. An analysis of the suitability of a low-cost eye tracker for assessing the cognitive load of drivers. Appl. Ergon. 2018, 68, 1–11. [Google Scholar] [CrossRef]
  6. ISO 15008. Road Vehicles–Ergonomic Aspects of Transport Information and Control Systems–Specifications and Compliance Procedures for in-Vehicle Visual Presentation; International Organization for Standardization: Geneva, Switzerland, 2017. [Google Scholar]
  7. Li, R.; Chen, Y.V.; Sha, C.; Lu, Z. Effects of interface layout on the usability of In-Vehicle Information Systems and driving safety. Displays 2017, 49, 124–132. [Google Scholar] [CrossRef]
  8. Bigelow, C.; Matteson, S. Font Improvements in Cockpit Displays and Their Relevance to Automobile Safety. 2011. Available online: https://www.researchgate.net/publication/268439939_Font_Improvements_in_Cockpit_Displays_and_their_Relevance_to_Automobile_Safety (accessed on 13 December 2020).
  9. Campbell, J.L.; Doerzaph, Z.R.; Richard, C.M.; Bacon, L.P. Human Factors Design Principles for the Driver-Vehicle Interface (DVI). In Proceedings of the Adjunct International Conference on Automotive User Interfaces and Interactive Vehicular Applications, Seattle, WA, USA, 17–19 September 2014; pp. 1–6. [Google Scholar]
  10. Campbell, J.L.; Brown, J.L.; Graving, J.S.; Richard, C.M.; Lichty, M.G.; Sanquist, T.; Morgan, J.L. Human Factors Design Guidance for Driver-Vehicle Interfaces (No. Report No. DOT HS 812 360); National Highway Traffic Safety Administration: Washington, DC, USA, 2016. [Google Scholar]
  11. Cai, H.; Green, P. Range of character heights for vehicle displays as predicted by 22 equations. Proc. SID Vehicle. Disp. Symp. 2005. Available online: http://www.umich.edu/~driving/publications/SID%202005%20CaiGreenfinal.doc (accessed on 13 December 2020).
  12. Fujikake, K.; Hasegawa, S.; Omori, M.; Takada, H.; Miyao, M. Readability of Character Size for Car Navigation Systems. Trans. Petri Nets Other Models Concurr. XV 2007, 4558, 503–509. [Google Scholar] [CrossRef]
  13. O’Day, S.; Tijerina, L. Legibility: Back to the Basics. SAE Int. J. Passeng. Cars-Mech. Syst. 2011, 4, 591–604. [Google Scholar] [CrossRef]
  14. Legge, G.E.; Bigelow, C.A. Does print size matter for reading? A review of findings from vision science and typography. J. Vis. 2011, 11, 8. [Google Scholar] [CrossRef] [Green Version]
  15. Simons-Morton, B.G.; Guo, F.; Klauer, S.G.; Ehsani, J.P.; Pradhan, A.K. Keep Your Eyes on the Road: Young Driver Crash Risk Increases According to Duration of Distraction. J. Adolesc. Health 2014, 54, S61–S67. [Google Scholar] [CrossRef] [Green Version]
  16. Marchionini, G.; Fox, E.A. Progress Toward Digital Libraries: Augmentation through Integration. Inf. Process. Manag. 1999, 35, 219–225. [Google Scholar] [CrossRef]
  17. Bottoni, P.; Levialdi, S.; Păun, G. Successful visual human-computer interaction is undecidable. Inf. Process. Lett. 1998, 67, 13–19. [Google Scholar] [CrossRef]
  18. Huawei. HUAWEI Hicar Ecological White Paper; Huawei: Shenzhen, China, 2019. [Google Scholar]
  19. Miller, G.A. The magical number seven, plus or minus two: Some limits on our capacity for processing information. Psychol. Rev. 1994, 101, 343–352. [Google Scholar] [CrossRef] [PubMed]
  20. Deppe, R.K. The Human Factor in Road Safety. Available online: https://trid.trb.org/view/215844 (accessed on 13 December 2020).
  21. Moore, R.L. Paper 5: Some Human Factors Affecting the Design of Vehicles and Roads. Inst. Highw. Eng. J. 1969, 16, 13–22. [Google Scholar] [CrossRef]
  22. Tanner, W.P., Jr.; Swets, J.A. A decision-making theory of visual detection. Psychol. Rev. 1954, 61, 401–409. [Google Scholar] [CrossRef]
  23. Castro, C. Visual Demands and Driving. Hum. Factors Vis. Cogn. Perform. Driv. 2008, 45, 2–26. [Google Scholar]
  24. Shannon, C.E.; Weaver, W. The Mathematical Theory of Information; University of Illinois Press: Urbana, IL, USA, 1949. [Google Scholar]
  25. Aasman, J. Modelling Driver Behaviour in Soar. Available online: http://repository.tudelft.nl/view/tno/uuid:f6ec9503-a255-4b58-b40a-3b79f97586dc/ (accessed on 13 December 2020).
  26. Lim, J.H.; Tsimhoni, O.; Liu, Y. Investigation of Driver Performance with Night Vision and Pedestrian Detection Systems—Part I: Empirical Study on Visual Clutter and Glance Behavior. IEEE Trans. Intell. Transp. Syst. 2010, 11, 670–677. [Google Scholar] [CrossRef]
  27. Liu, Y.; Feyen, R.; Tsimhoni, O. Queueing Network-Model Human Processor (QN-MHP). ACM Trans. Comput. Interact. 2006, 13, 37–70. [Google Scholar] [CrossRef]
  28. Wu, C.; Liu, Y. Queuing Network Modeling of Driver Workload and Performance. IEEE Trans. Intell. Transp. Syst. 2007, 8, 528–537. [Google Scholar] [CrossRef] [Green Version]
  29. Endsley, M.R. Toward a Theory of Situation Awareness in Dynamic Systems. Hum. Factors J. Hum. Factors Ergon. Soc. 1995, 37, 32–64. [Google Scholar] [CrossRef]
  30. Kokar, M.M.; Endsley, M.R. Situation Awareness and Cognitive Modeling. IEEE Intell. Syst. 2012, 27, 91–96. [Google Scholar] [CrossRef] [Green Version]
  31. Young, K.; Koppel, S.; Charlton, J. Toward best practice in Human Machine Interface design for older drivers: A review of current design guidelines. Accid. Anal. Prev. 2017, 106, 460–467. [Google Scholar] [CrossRef]
  32. Bhise, V.D. Ergonomics in the Automotive Design Process. Taylor and Francis; CRC Press: Boca Raton, FL, USA, 2019. [Google Scholar]
  33. Chang, Y.-N.; Hsu, C.-H.; Tsai, J.-L.; Chen, C.-L.; Lee, C.-Y. A psycholinguistic database for traditional Chinese character naming. Behav. Res. Methods 2015, 48, 112–122. [Google Scholar] [CrossRef] [PubMed] [Green Version]
  34. Beckers, N.; Schreiner, S.; Bertrand, P.; Mehler, B.; Reimer, B. Comparing the demands of destination entry using Google Glass and the Samsung Galaxy S4 during simulated driving. Appl. Ergon. 2017, 58, 25–34. [Google Scholar] [CrossRef] [PubMed]
  35. Ratcliff, R.; McKoon, G. The Diffusion Decision Model: Theory and Data for Two-Choice Decision Tasks. Neural Comput. 2008, 20, 873–922. [Google Scholar] [CrossRef] [Green Version]
  36. MacKenzie, I.S. Fitts’ Law as a Research and Design Tool in Human-Computer Interaction. Hum.–Comput. Interact. 1992, 7, 91–139. [Google Scholar] [CrossRef]
  37. Tetzlaff, L.; Schwartz, D.R. The use of guidelines in interface design. In Proceedings of the ACM SIGCHI Conference on Human factors in computing systems, New Orleans, LA, USA, 27 April–2 May 1991. [Google Scholar]
Figure 1. Test environment and test site.
Information 12 00213 g001
Figure 2. Test content.
Information 12 00213 g002
Figure 3. Average reaction time of Chinese characters’ different sizes.
Information 12 00213 g003
Figure 4. Average reaction time of Chinese characters’ different length.
Information 12 00213 g004
Figure 5. Average visual subjective rating of Chinese characters’ sizes.
Information 12 00213 g005
Figure 6. Average visual subjective rating of Chinese characters’ length.
Information 12 00213 g006
Figure 7. Average usability and workload of Chinese characters’ sizes.
Information 12 00213 g007
Figure 8. Average usability and workload of Chinese characters’ length.
Information 12 00213 g008
Figure 9. Examples of Chinese character interface design.
Information 12 00213 g009
Publisher’s Note: MDPI stays neutral with regard to jurisdictional claims in published maps and institutional affiliations.

