Abstract
Certified public accounts’ (CPAs) audit opinions of going concern are the important basis for evaluating whether enterprises can achieve normal operations and sustainable development. This study aims to construct going concern prediction models to help CPAs and auditors to make more effective/correct judgments on going concern opinion decisions by deep learning algorithms, and using the following methods: deep neural networks (DNN), recurrent neural network (RNN), and classification and regression tree (CART). The samples of this study are companies listed on the Taiwan Stock Exchange and the Taipei Exchange, a total of 352 companies, including 88 companies with going concern doubt and 264 normal companies (with no going concern doubt). The data from 2002 to 2019 are taken from the Taiwan Economic Journal (TEJ) Database. According to the empirical results, with the important variables selected by CART and modeling by RNN, the CART-RNN model has the highest going concern prediction accuracy (the accuracy of the test dataset is 95.28%, and the average accuracy is 93.92%).
1. Introduction
The Global Financial Crisis of 2008–2009, which first occurred in the United States, and then influenced the whole world, devastated the global economy. Many scholars have pointed out that, one of the main reasons was that CPAs and auditors failed to fulfill their audit responsibilities and even issued false audit reports [1,2,3,4,5], and some CPAs made wrong evaluations and opinions of the going concern and sustainability of enterprises. Persakis and Iatridis [3] pointed out that audit quality was generally reduced during the global financial crisis. Over the years, auditing regulators worldwide have tried to increase the information in audit reports by requiring discussions of key audit matters (KAM) [6]. In the competitive market environment, many enterprises are facing bankruptcy crises, resulting in heavy losses in the financial statements of users and investors. The problem of going concern is stakeholders’ high concern and deep care regarding the information in the audit opinions of financial statements. The failure of CPAs and auditors to raise audit opinions of going concern doubt before enterprises enter bankruptcy or financial crisis will cause great damage to certified public accountants (CPAs) and accounting firms. The going concern assumption means that an enterprise will continue in business at its current scale and status for the foreseeable future, that is, an enterprise will continue in business for at least one year after the date on the Balance Sheet (GAAP) or the date of the Statement of Financial Position (IFRSs), and will not dissolve and liquidate [7].
Going concern is a professional term used in the accounting field to evaluate whether enterprises can achieve normal operation and sustainable development. CPAs mainly evaluate whether there is any going concern doubt in an enterprise according to its financial statements and information. On the going concern basis, financial statements are prepared on the assumption that an enterprise is a going concern, and will continue in business for the foreseeable future. Unless management intends to liquidate or terminate business, or has no feasible alternative except for liquidation or termination, general-purpose financial statements are prepared on the going concern basis. Auditors’ responsibilities are to obtain sufficient appropriate audit evidence to conclude whether the financial statements, as prepared by management, on the going concern basis are suitable, and whether there are material uncertainties regarding audited companies’ abilities to continue as going concerns. On the basis of the audit evidence, auditors shall conclude whether material uncertainties exist regarding any events or conditions that may cast significant doubts on auditees’ abilities to continue as going concerns [8] (stipulated by referring to ISA 570). Shareholders, investors, suppliers, clients/customers, and other stakeholders all attach great importance to CPAs’ going concern audit opinions issued in audit reports, including: (1) unqualified opinion, (2) qualified opinion, (3) disclaimer opinion, and (4) adverse opinion [8,9] (stipulated by referring to ISA 700). According to the American audit standards, auditors must evaluate the going concern assumption (AS 2415 “Consideration of an Entity’s Ability to Continue as a Going Concern” PCAOB 2017). It is the responsibility of auditors to evaluate whether an entity can continue as a going concern for a reasonable period of time, meaning an audit date within one year of the date of the financial statements (called a reasonable date) (AS 2415.02 PCAOB 2017). CPAs must carefully audit and evaluate in accordance with accounting and auditing regulations, as well as their professional knowledge, in order to avoid the risk of material misstatements in their audit reports. Furthermore, in order to give audit opinions, CPAs shall conclude whether reasonable assurance is obtained to prove that the overall financial statements are free from material misstatements arising from fraud or errors.
The goal of audits for CPAs is to provide a high level, but not absolute, assurance that the financial statements of auditees are free from material misstatement, and such assurance is expressed in positive words in audit reports. CPAs’ opinions provide reasonable assurance regarding whether financial statements are free from material misstatements. While this assurance may enhance the credibility of financial statements, it does not guarantee future sustainable business of auditees or business efficiency or the effectiveness of their management. Audit reports shall give opinions on the overall adequacy of the presented financial statements. If modified opinions are given, including qualified opinion, adverse opinion, and disclaimer opinion, reasons shall be clearly stated [10]. The nature of the matters leading to modified opinions is that financial statements contain material misstatements or lack sufficient appropriate audit evidence. CPAs expressly give appropriate modified opinions in the following circumstances: 1. On the basis of the audit evidence, CPAs conclude that the overall financial statements contain material misstatements. 2. CPAs conclude that the overall financial statements contain material misstatements, due to failure to obtain sufficient appropriate audit evidence. CPAs shall give adverse opinions, if they obtain sufficient appropriate audit evidence and consider that the influences of material misstatements on financial statements are material and extensive. CPAs shall issue audit reports with disclaimer opinions, if they fail to obtain sufficient appropriate audit evidence as the basis for their opinions, but consider that the possible influences on financial statements are sometimes material and extensive without detecting material misstatements. The responsibility of CPAs is to perform the audit and issue audit reports in accordance with the Generally Accepted Auditing Standards. However, because the matters mentioned in the fundamental stage of disclaimer opinions may have material influences, CPAs are unable to obtain sufficient appropriate audit evidence as the basis for giving audit opinions. In accordance with the code of CPAs professional ethics [11] (stipulated by referring to ISA 705), the people subject to the independent standards of the CPA firms have retained independence from auditees, and performed other duties of the standards.
According to No. 52 “Assessment on Identified Misstatements in Auditing” of Taiwan’s Statements on Auditing Standards, a misstatement is defined as a difference between the amount, classification, presentation, or disclosure of a reported financial statement item, and the amount, classification, presentation, or disclosure that is required for the item is in accordance with the applicable financial reporting framework. Hence, material misstatements may be caused by: (1) inappropriate accounting policies selected, (2) inappropriate application of accounting policies selected, and (3) inappropriate or inadequate disclosure of financial statements [12] (stipulated by referring to ISA 450). Material misstatements related to inappropriate or inadequate disclosure of financial statements may include: (1) financial statements exclude disclosures required by the applicable financial reporting framework, (2) the disclosures in financial statements are not presented in accordance with the applicable financial reporting framework, and (3) financial statements do not provide additional disclosures beyond the applicable financial reporting framework, which leads to failure of appropriate presentation. Failure to obtain sufficient appropriate audit evidence by auditors (also known as limits to the auditing scope) may be caused by: (1) circumstances beyond the control of auditees, (2) circumstances related to the nature or duration of the audit, and (3) restrictions by management [11].
The learning and prediction abilities of deep learning algorithms are quite powerful and suitable for going concern study. However, related research is quite rare in the past literature. The purposes of this study are to build models by deep neural networks (DNN) and recurrent neural network (RNN), and to select important variables by the classification and regression tree (CART) method to establish accurate going concern prediction models, in order to help CPAs and auditors to make more effective/correct judgments on going concern opinion decisions, and thus, issue correct audit reports and audit opinions. It is an innovative approach in “going concern” study. Therefore, this study has certain value for and makes contributions to the extension of academic literature and CPAs’ auditing practices.
2. Related Works
In Taiwan, the audit regulations related to the judgment of going concern are: Taiwan SASs No. 1, No. 52, No. 57, No. 59, and No. 61. As mentioned in the previous section, these auditing standards bulletins regulate what CPAs and auditors must follow and their obligation during the audit process.
The responsibility of CPAs and auditors is limited to assessing events prior to the date of the relevant condition reports and exclude prediction (AS 2415 PCAOB 2017, previously Statement on Auditing Standards AU 341 and SAS No. 59). Generally, CPAs and auditors rely on listed methods and their personal judgments, and may be influenced by time pressure and incentive problems, and such influences may influence their judgments on going concern [6]. Many studies have focused on whether CPAs and auditors can accurately predict client default [13,14,15,16,17]. Type I misclassification A will occur if an auditor issues a going concern doubt opinion, but the client does not fail financially in the next year. Type II misclassification A will occur if an auditor fails to issue a going concern doubt opinion, but the client does fail financially in the following year. Generally, about half of American companies go bankrupt without receiving a going concern doubt opinion in advance; in contrast, more than 2/3 of companies that receive a going concern doubt opinion do not go bankrupt the next year [6].
In the past, most researchers used traditional statistical methods, such as regression analysis and discrimination analysis, to make decisions on audit opinions of going concern doubt; however, there are great shortcomings in judgments with a high error rate [18,19].
Recent studies have predicted going concern by data mining and machine learning, and significantly reduced errors in judgment; for example, the studies of making going concern decisions by decision trees [7,18,19,20,21,22,23,24], by support vector machine (SVM) [17,22,23,24,25], and by artificial neural network (ANN) [7,19,20,21]. From an overview of these literature, the accuracy rate by using data mining and machine learning to predict going concern doubt is mostly above 70%. The prediction accuracy of these literatures in the field of social science is quite good.
In the training process of machine learning and deep learning, the iterative approach is most used in past literature [26]. During training, 1 batch training image is trained once through the network, one forward propagation and one backward propagation, and the weights are updated once every iteration. During testing, 1 batch test image passes through the network once. The iterations are the number of batches required to complete an epoch. The advantage of an iterative method is that the code runs efficiently, because the time only increases due to the increase in the number of loops, and there is no additional space needed. Although Rizk and Awad [26] pointed out “compared to RNN trained using the iterative back-propagation algorithm, non-iteratively trained RNN achieved faster training time and better repeatability while incurring an increase in prediction error”. However, the iterative method needs to repeat the entire storable information, which limits their practical use. Several researchers work on non-iterative methods, they argue that non-iterative methods are more efficient. Many optimization problems in machine learning can be solved by non-iterative methods, which can be solved in a closed form. These methods are usually computationally faster than the iterative methods used in modern deep learning algorithms [27,28]. Tkachenko et al. [29] proposed the solutions of a problem on changing image resolution based on computational intelligence by using the Geometric Transformations. Tkachenko et al. [30] proposed a new non-iterative linear supervised learning predictor based on the Ito decomposition and the neural-like structure of the successive geometric transformations model (SGTM), which effectively improved the accuracy and speed in the process. Even though the iteration method has the disadvantage of being more time-consuming, modern iterators can improve this disadvantage. In most computer programming—Java, C#, Ruby, Python, and Delphi, an iterator is an object that enables a programmer to go across a container.
To cater to the advent of the era of big data and artificial intelligence (AI), deep learning algorithms are highly suitable for going concern study. However, related research is quite rare in past literature. This study adopts 19 variables (include 16 financial variables and 3 non-financial variables) by the DNN and RNN algorithms to construct the optimal model. This study takes the listed and OTC companies that received audit opinions of going concern doubt during the period from 2002 to 2019 from the Taiwan Economic Journal (TEJ) Database (Note: there are complete financial information and important non-financial information of listed and OTC companies in Taiwan in the TEJ database).
3. Materials and Methods
The classification and regression tree (CART) is a decision tree algorithm suitable for the selection of important variables, while the deep neural networks (DNN) and recurrent neural network (RNN) are very capable at computing input variables to optimize prediction models. Hence, CART, DNN, and RNN are used in this study to construct going concern prediction models.
3.1. Classification and Regression Tree
The classification and regression tree (CART) method, as developed by Breiman et al. [31], is used to process continuous and discrete non-parametric data, which can be divided into a classification tree and a regression tree according to the data type. The classification tree is used if data are discrete, and the regression tree is used if data are continuous. This decision tree algorithm continuously partitions data into two subsets by the binary method until they cannot be further partitioned, as shown in Figure 1. The advantages of CART are: (1) strong classification ability; (2) simple classification rules; (3) the continuous and discrete values are separately treated; and (4) only generate binary trees. Chen [32] points out the CART is highly suitable to select important variables.
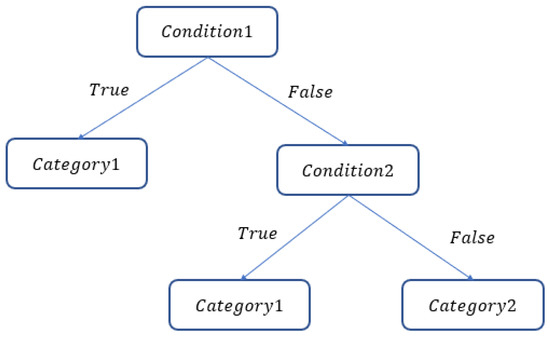
Figure 1.
CART structure.
Taking the Gini index as the partition standard, a classification tree calculates the Gini indices of all variables and selects the one with the smallest Gini index to create a node for partition. The Gini index measures data impurity, where the lower the index, the purer the data. Hence, assuming that Dataset S can be classified into N categories, and the probability of the data being partitioned into Category n is P, the Gini index is shown in Equation (1):
Assuming that the data are classified into and by a given feature , the Ginis index is shown in Equation (2):
The regression tree minimizes the error of Subset after partition by taking the minimum error sum of squares (SSE) as the partition standard. Assuming that Subset has data, the minimum error sum of squares is shown in Equation (3):
3.2. Deep Neural Networks
The deep neural networks (DNN) is a model developed from the artificial neural network (ANN), which has the purpose of simulating the process of the human brain learning new knowledge, thus, it is a basic deep learning model. Compared with the artificial neural network, the deep neural network has many hidden layers. Under such a structure, a deep neural network can deal with more complex problems, and is good at processing big data. The operation mode of the artificial neural network is that the data are input to the output layer for calculation by the neurons in the hidden layer, and then, the results are input to the output layer, as shown in Figure 2. In a deep neural network, more hidden layers are added on this basis, as shown in Figure 3.
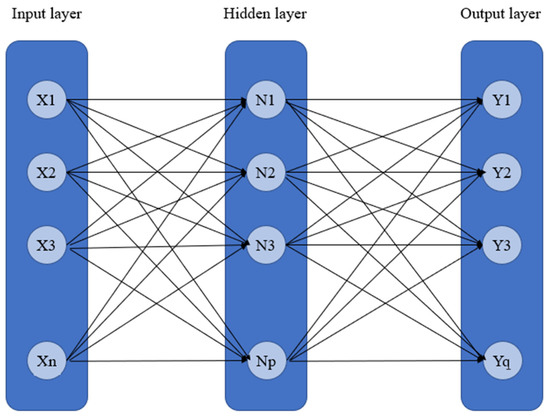
Figure 2.
ANN structure.
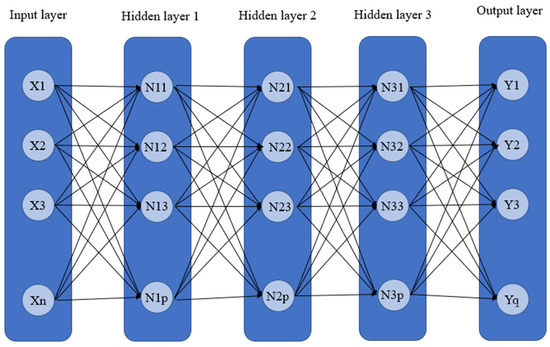
Figure 3.
DNN structure.
The calculation of the hidden layer is shown in Equation (4). After the data in the input layer are multiplied by weights, and then added up with the biases, the outputs processed by neurons are nonlinearly transformed by the activation function (AF), which are input into the next layer until the final results are obtained, and finally, the results are returned to correct the weights.
3.3. Recurrent Neural Network
As a common sequence model of deep learning, the recurrent neural network (RNN) is used to process ordered data, and good at capturing the time dependence of sequential data; therefore, it has a high accuracy in predicting time series data. The RNN structure allows different data to be processed at each time step, while also preserving some important information, as shown in Figure 4. The results of Phase t are imported in a hidden state into the hidden layer together with the data of Phase t + 1 for calculation. The activation function used by the recurrent neural network is the hyperbolic function tanh, thus, Equation (5) is established:
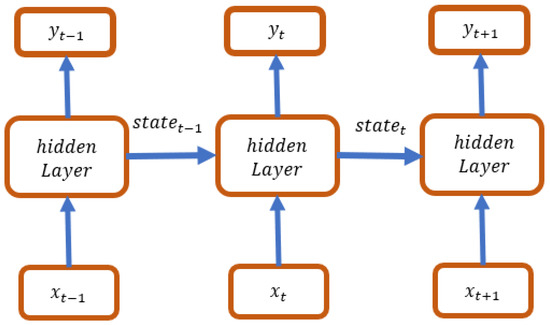
Figure 4.
RNN structure.
3.4. Sampling and Variable Selection
3.4.1. Data Sources
This study takes the listed and OTC companies that received audit opinions of going concern doubt during the period from 2002 to 2019 from the Taiwan Economic Journal (TEJ) Database. After the samples from the financial industry, and those with incomplete data are eliminated, according to the research design of several prior studies [7,18,19,24], a total of 352 samples are obtained by matching one company with going concern doubt with three companies with no going concern doubt (GCD:Non-GCD = 1:3), including 88 company samples with going concern doubt and 264 company samples with no going concern doubt, as shown in Table 1.

Table 1.
Sample distribution.
Dataset: https://drive.google.com/drive/folders/1x8ux0Gd9kpapL72ZvyOcSb-u3XF7bD3n?usp=sharing (accessed on 5 February 2021).
3.4.2. Variable Definitions
(1) Dependent variable
Whether the audit opinion of going concern doubt was issued to a company is taken as the classification standard, and any company that received the audit opinion of going concern doubt is classified as 1, and any company that did not receive the audit opinion of going concern doubt is classified as 0.
(2) Independent variables
A total of 19 research variables are selected in this study, including 16 financial variables and 3 non-financial variables, which are summarized in Table 2.
Table 2.
Research variables.
3.5. Research Process
The parallel mode is adopted in this study to complete the research procedures. On one hand, 19 variables are directly used for deep learning by the DNN and RNN algorithms, and repeatedly trained to construct the best model. On the other hand, important variables are first selected by CART, which are directly used for deep learning by DNN and RNN and repeatedly trained to construct the best model. The tools (software) are used in the process of this study: data acquisition—TEJ Plus and TEJ Pro, modeling and testing—Tensorflow.Keras, confusion matrix—Excel. The research procedures are shown in Figure 5.
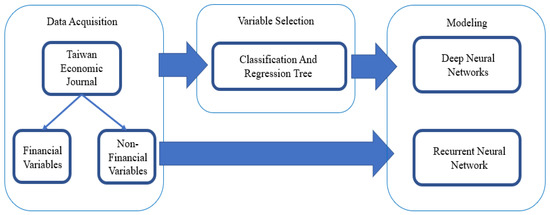
Figure 5.
Research procedures.
4. Empirical Results
For deep learning algorithms, the size of the value will affect the weight adjustment during gradient descent, so the value of all data needs to be limited to between 0 and 1, otherwise there will be poor training effects. In order to eliminate the difference in units or the great difference in data, this study uses the normalization of data, and compares and analyzes the data by converting the original data into a dimensionless scalar. Normalization of data of this study is to scale the original data in the interval of 0 and 1. According to the research process (3.5 Research Process), the parallel mode is adopted in this study to complete the research procedures. On one hand, 19 variables are directly used for deep learning by DNN and RNN, and repeatedly trained to construct the best model. On the other hand, important variables are first selected by CART, which are directly used for deep learning by DNN and RNN and repeatedly trained to construct the best model. Relevant algorithms and coding are listed in Appendix A. The selection of important variables by CART is explained as follows.
4.1. Important Variables Selected by the CART Algorithm
There are 10 important variables selected by CART (Table 3), including 9 financial variables and 1 non-financial variable, namely, in the order of their importance, X01: Debt ratio, X10: ROE, X04:D/E ratio, X09: ROA, X14: EPS, X06: Ratio of current assets to total liabilities, X15: Gross margin, X18: Pledge ratio of directors and supervisors, X03: Current ratio, and X02: Quick ratio. Then, these 10 important variables are directly used for deep learning by DNN and RNN and repeatedly trained to construct the best model.
Table 3.
Important variables selected by CART.
4.2. Validation for Modeling
In the process of prediction model construction by DNN and RNN, this paper adopts the holdout validation suitable for deep learning [33,34,35]. In the modeling process, a total of 70% of data is used for modeling, 52.5% (=70% × 75%) of all data are randomly selected as the training dataset to fit the model parameter dataset in the learning process, and continuously optimized to obtain the best prediction model; 17.5% (=70% × 25%) of all data are randomly selected as the validation dataset to validate the state and convergence of the models in the modeling process, adjust the hyper-parameters, avoid over fitting, and determine when to stop the training; the remaining 30% of the data are used as the test dataset to assess the models’ generalization abilities (prediction performance). A random sampling without replacement approach is used in this study.
The performance indicators in this study are accuracy, precision, sensitivity (recall), specificity, and F1 score. The confusion matrix method is used to evaluate the performance of the models. The output performance of this study focuses on the accuracy (hit ratio) of: (1) all samples, with and without going concern doubt; (2) samples with going concern doubt; and (3) samples with no going concern doubt.
In the process of modeling, a loss function is used to optimize the models; the smaller the loss function value, the better fitness of the model.
The setting of hyper-parameters has a direct impact on the performance of the model. In order to maximize the performance of the model, how to optimize the hyper-parameters is crucial. Adam is used in the process of modeling and to adjust the optimal parameters, Adam is a fusion of AdaGrad and momentum, which is offered in the TensorFlow (Keras. Optimizers. Adam). The main advantage is that it has offset correction, so that the learning rate of each iteration has a certain range, tuning, and the update of parameters is more stable. This process aimed to achieve the purpose of model optimization. The optimal parameters of this study are: learning rate = 0.001, beta 1 = 0.9, beta 2 = 0.999, epsilon = 10−7, batch size = 4, epochs = 150, activation = ReLU and Sigmoid.
4.3. CART-DNN Model
The 10 important variables selected by CART are used for deep learning by DNN and repeatedly trained until stable (150 epochs; training time: 500 microseconds), in order to construct the best model. The accuracy rates of the training dataset and validation dataset are 97.83% and 91.94%, respectively. In addition, the test dataset is used to test the stability of the model, and an accuracy rate of 93.40% is obtained, which is slightly different from the results of the training dataset and validation dataset, and indicates that the model is quite stable, Type I error rate (3.77%) and Type II error rate (2.83%), as shown in Table 4. In the confusion matrix, in addition to accuracy, we also use precision, sensitivity (recall), specificity, and F1-score to evaluate the performance of a model; the confusion matrix indicators of CART-DNN, as shown in Table 5, are accuracy = 93.40%, precision = 85.71%, sensitivity (recall) = 88.89%, specificity = 94.94%, F1-score = 87.27%. By these indicators, the performance of the model is quite good. In modeling, the loss function with binary cross-entropy method is shown in Figure 6. Accuracy line graph of the CART-DNN modeling is shown in Figure 7.
Table 4.
Accuracy of the CART-DNN model.
Table 5.
Confusion matrix indicators: CART-DNN.
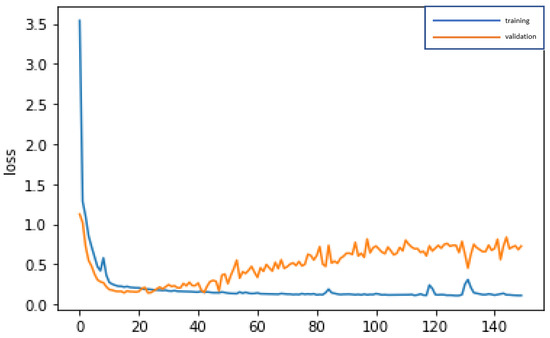
Figure 6.
Graph of loss function of the CART-DNN modeling.
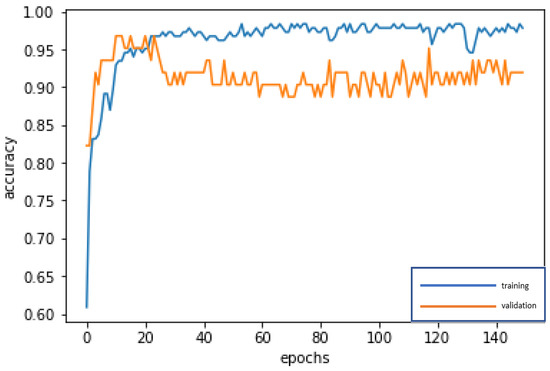
Figure 7.
Accuracy line graph of the CART-DNN modeling.
4.4. CART-RNN Model
The 10 important variables selected by CART are used for deep learning by RNN and repeatedly trained until stable (150 epochs; training time: 500 microseconds), in order to construct the best model. The accuracy rates of the training dataset and validation dataset are 92.93% and 93.55%, respectively. In addition, the test dataset is used to test the stability of the model, and an accuracy rate of 95.28% is obtained, which is slightly different from the results of the training dataset and validation dataset, and indicates that the model is quite stable, Type I error rate (2.83%) and Type II error rate (1.89%), as shown in Table 6. The confusion matrix indicators of CART-RNN, as shown in Table 7, are accuracy = 95.28%, precision = 88.46%, sensitivity (recall) = 92.00%, specificity = 96.30%, and F1-score = 90.19%. By these indicators, the performance of the model is very good. In modeling, the loss function with binary cross-entropy method is shown in Figure 8. Accuracy line graph of the CART-RNN modeling is shown in Figure 9.
Table 6.
Accuracy of the CART-RNN model.
Table 7.
Confusion matrix indicators: CART-RNN.
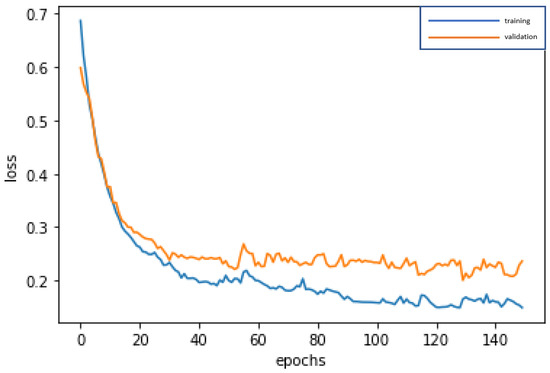
Figure 8.
Graph of loss function of the CART-RNN modeling.
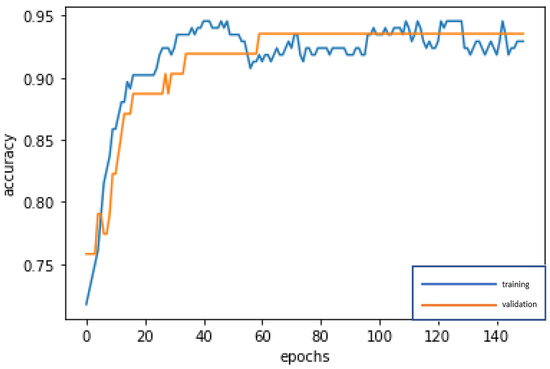
Figure 9.
Accuracy line graph of the CART-RNN modeling.
4.5. DNN Model
Without CART selecting the important variables, the 19 variables are directly used for deep learning by DNN and repeatedly trained until stable (150 epochs; training time: 500 microseconds), in order to construct the best model. The accuracy rates of the training dataset and validation dataset are 96.74% and 91.94%, respectively. In addition, the test dataset is used to test the stability of the model, and an accuracy rate of 88.68% is obtained, which is slightly different from the results of the training dataset and validation dataset, and indicates that the model is quite stable, Type I error rate (3.77%) and Type II error rate (7.55%), as shown in Table 8. The confusion matrix indicators of DNN, as shown in Table 9 are accuracy = 88.68%, precision = 86.21%, sensitivity (recall) = 75.76%, specificity = 94.52%, and F1-score = 80.64%. By these indicators, the performance of the model is good. In modeling, the loss function with binary cross-entropy method is shown in Figure 10. Accuracy line graph of the DNN modeling is shown in Figure 11.
Table 8.
Accuracy of the DNN model.
Table 9.
Confusion matrix indicators: DNN.
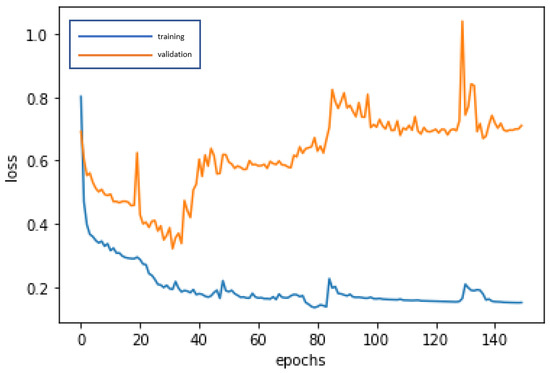
Figure 10.
Graph of loss function of the DNN modeling.
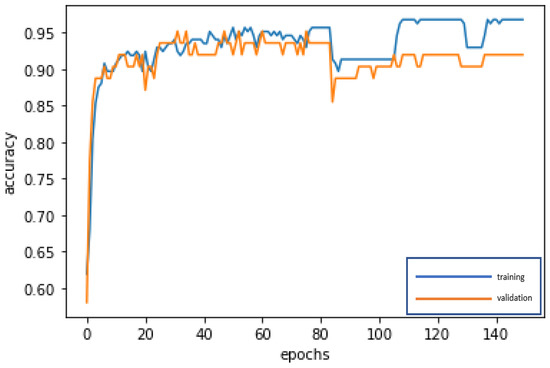
Figure 11.
Accuracy line graph of the DNN modeling.
4.6. RNN Model
Without CART selecting the important variables, the 19 variables are directly used for deep learning by RNN, and trained and fed back until stable (150 epochs; training time: 500 microseconds), in order to construct the best model. The accuracy rates of the training dataset and validation dataset are 94.57% and 88.71%, respectively. In addition, the test dataset is used to test the stability of the model, and an accuracy rate of 90.57% is obtained, which is slightly different from the results of the training dataset and validation dataset, and indicates that the model is quite stable, Type I error rate (2.83%) and Type II error rate (6.60%), as shown in Table 10. The confusion matrix indicators of RNN, as shown in Table 11 are accuracy = 90.57%, precision = 89.29%, sensitivity (recall) = 78.13%, specificity = 95.95%, and F1-score = 83.33%. By these indicators, the performance of the model is good. In modeling, the loss function with binary cross-entropy method is shown in Figure 12. Accuracy line graph of the RNN modeling is shown in Figure 13.
Table 10.
Accuracy of the RNN model.
Table 11.
Confusion matrix indicators: RNN.
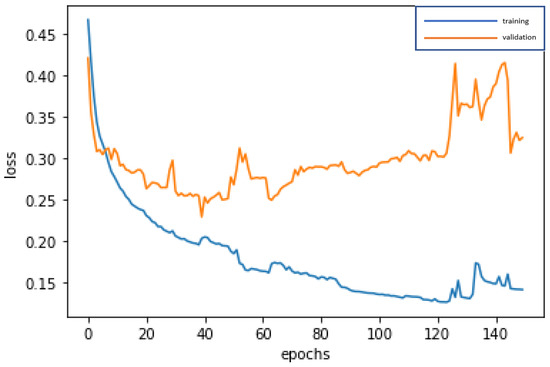
Figure 12.
Graph of loss function of the RNN modeling.
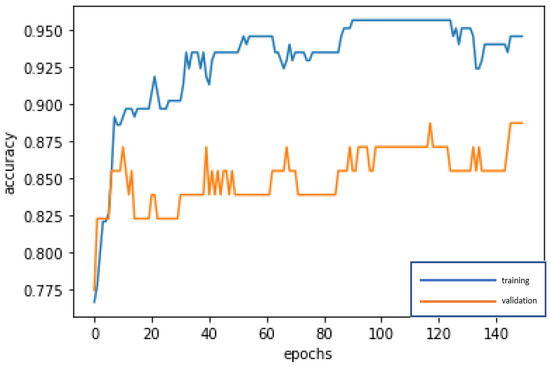
Figure 13.
Accuracy line graph of the RNN modeling.
5. Discussion
DNN and RNN, which are very powerful in learning, feedback, and prediction, are commonly used deep learning technologies. In addition to constructing going concern prediction models with a high accuracy by DNN and RNN, this study intends to learn which model has the better prediction effect, the one constructed by selecting important variables or the one constructed by not selecting important variables. Hence, the parallel mode is adopted in this study. On one hand, without variable selection, the 19 variables are directly used for deep learning by DNN and RNN and repeatedly trained to construct the best model. On the other hand, 10 important variables are first selected by CART, which are used for deep learning by DNN and RNN and repeatedly trained until stable, in order to construct the best model. In the modeling process, a total of 70% of data is used for modeling, 52.5% (=70% × 75%) of all data are randomly selected as the training dataset to fit the model parameter dataset in the learning process, and continuously optimized to obtain the best prediction model; 17.5% (=70% × 25%) of all data are randomly selected as the validation dataset to validate the state and convergence of the models in the modeling process, adjust the hyper-parameters, avoid over fitting, and determine when to stop the training; the remaining 30% of the data are used as the test dataset to assess the models’ generalization abilities (prediction performance). A random sampling without replacement approach is used in this study.
Based on the above design, four going concern prediction models (as shown in Table 12) are constructed, and the results show that CART-RNN has the highest accuracy (the accuracy of test dataset is 95.28%; and the average accuracy is 93.92%, Type I error rate is 2.83% and Type II error rate is 1.89%), followed by CART-DNN (the accuracy of test dataset is 93.40%; and the average accuracy is 94.39%), RNN (the accuracy of test dataset is 90.57%; and the average accuracy is 91.28%), and DNN (the accuracy of test dataset is 88.68%; and the average accuracy is 92.45%). According to the empirical results—the accuracy of test dataset: (1) the four going concern prediction models constructed in this study all have very high accuracy rates above 88%; (2) RNN has better prediction effect than DNN; and (3) important variables are first selected by CART, and then, used to construct the DNN and RNN models, which improved the prediction accuracy of the models.
Table 12.
Summary of accuracy of all models.
The performance indicators in this study are accuracy, precision, sensitivity (recall), specificity, and F1 score. The confusion matrix method is used to evaluation the performance of models (as shown in Table 13). By these indicators, all models are reach the high level standard and the CART-RNN model has the best performance.
Table 13.
Summary of confusion matrix indicators of all models.
In addition, in order to determine whether an enterprise had going concern doubts, the following indices are considered: 10 important variables are selected by CART, including X01: Debt ratio (VI = 0.2623), X10: ROE (VI = 0.1820), X04: D/E ratio (VI = 0.1431), X09: ROA (VI = 0.0964), X14: EPS (VI = 0.0834), X06: Ratio of current assets to total liabilities (VI = 0.0719), X15: Gross margin (VI = 0.0583), X18: Pledge ratio of directors and supervisors (VI = 0.0281), X03: Current ratio (VI = 0.0162), and X02: Quick ratio (VI = 0.0159). In particular, the top three indices with high VI (variable importance), namely, debt ratio (VI = 0.2623), ROE (VI = 0.1820), and D/E ratio (VI = 0.1431), require special concern by CPAs and auditors during auditing and issuing audit reports and audit opinions.
6. Conclusions and Suggestions
Since the global financial crisis, the audit reports and audit opinions issued by CPAs have been closely examined, as they determine whether an enterprise had going concern doubts. In 2001 and 2002, financial scandals successively broke out in Enron and WorldCom in the United States, which exposed the deficiencies in the accounting and securities regulations of listed companies. The United States Congress quickly passed the Sarbanes-Oxley Act in 2002, which imposes strict requirements and legal liability on CPAs, CEOs, and CFOs, and specifies that enterprises must record various financial policies and procedures with documented proof (kept for at least five years), improve the rights and responsibilities system of financial reporting, and enhance the effectiveness of financial reports, in order to enable enterprises to achieve sustainable development and operation, while protecting the rights and interests of their shareholders, creditors, employees, and stakeholders.
While CPAs and auditors must comply with general audit standards and commercial regulations, large international accounting firms (such as: Deloitte, KPMG, PwC, and EY) have strict audit regulations and procedures, in order to assist and supervise their CPAs and auditors to avoid fraud and material misstatements in financial reports. CPAs must also check key audit matters (KAM) and conduct control testing, substantive analytical procedures, and detailed testing to improve the quality and effectiveness of their audit reports and audit opinions, and thus, avoid the risk of audit failure. Even so, the phenomenon of CPAs issuing wrong audit reports and audit opinions continue to endlessly emerge. Therefore, it is necessary and urgent to develop effective going concern prediction models to assist CPAs and auditors to make more effective judgments of going concern opinion decisions, in order that they can issue correct audit reports and opinions.
The purposes of this study are to construct effective going concern prediction models by two commonly used deep learning technologies: deep neural networks (DNN) and recurrent neural network (RNN), and to select important variables by the classification and regression tree (CART) to construct accurate going concern prediction models. It is an innovative approach in “going concern” study. A total of four going concern prediction models are constructed, and the CART-RNN model has the highest accuracy (the accuracy of the test dataset is 95.28%; and the average accuracy is 93.92%, Type I error rate is 2.83% and Type II error rate is 1.89%), followed by CART-DNN (the accuracy of test dataset is 93.40%; and the average accuracy is 94.39%), RNN (the accuracy of test dataset is 90.57%; and the average accuracy is 91.28%), and DNN (the accuracy of test dataset is 88.68%; and the average accuracy is 92.45%). According to the empirical results—the accuracy of test dataset: (1) in terms of social science research, the four going concern prediction models constructed in this study all have very high accuracy rates above 88%; (2) RNN has better prediction effect than DNN; and (3) important variables are first selected by CART, and then used to construct the DNN and RNN models, which improved the prediction accuracy of the models. This study has certain value for and makes contributions to the extension of academic literature and CPAs’ auditing practices.
In cases where there is doubtful or incomplete financial information that cannot be improved, this study suggests and calls on CPAs to have the courage to issue audit reports with “qualified opinions”, “disclaimer opinions”, and “adverse opinions” after communication with clients. Moreover, CPAs shall fulfill their responsibilities, instruct and require their clients to achieve sound corporate governance and internal control in accordance with laws, and are prohibited from engaging in illegal and fraudulent behaviors for the purpose of enhancing their financial statements.
One final issue of note is that, while enterprises’ previous financial reports are true, if top management deliberately cheats with sophisticated techniques this year, it will be difficult for CPAs and auditors to find the defects to make correct assessments, audit judgments, or going concern predictions, which is the unavoidable limitation of this study in reality.
Based on the differences in the economic environment, financial system, and audit regulations of each country or economic entity, suggestions for going concern future research by this study are: (1) to choose the financial and non-financial variables/indicators which are suitable for local environment; (2) to use another deep learning algorithm, such as: deep belief networks (DBN), convolutional neural networks (CNN), convolutional deep belief networks (CDBN), and long short-term memory (LSTM); (3) besides the iterative deep learning algorithms, the non-iterative ANN approach can be taken into consideration by researchers.
Funding
This research received no external funding.
Institutional Review Board Statement
Not applicable.
Informed Consent Statement
Not applicable.
Data Availability Statement
The data of this study is taken from the Taiwan Economic Journal (TEJ) Database.
Acknowledgments
The author would like to thank the editors and the anonymous reviewers of this journal.
Conflicts of Interest
The author declares no conflict of interest.
Appendix A
Algorithms and coding
1. Common preconditions for construction of models
1.1. Importing libraries
import numpy as np
import pandas as pd
import matplotlib.pyplot as plt
from keras.models import Sequential
from keras.layers import Dense
from numpy import ndarray
from sklearn.preprocessing import MinMaxScaler
from tensorflow import keras
from keras.layers.core import Activation, Dense
from keras.preprocessing import sequence
from sklearn.model_selection import train_test_split
from keras.models import load_model
from tensorflow.keras.callbacks import TensorBoard
1.2. Importing modeling data of this study and confirming the number of samples and variables
df = pd.read_excel(“data.xlsx”)
df.shape
1.3. Data pre-processing
1.3.1. Dividing data into training dataset, test dataset, and validation dataset
df_num = df.shape[0]
indexes = np.random.permutation(df_num)
train_indexes = indexes[:int(df_num *0.7)]
test_indexes = indexes[int(df_num *0.7):]
train_df = df.loc[train_indexes]
test_df = df.loc[test_indexes]
1.3.2. Normalize data by converting their values to 0 to 1
scaler = MinMaxScaler(feature_range=(0, 1))
df = scaler.fit_transform(df)
1.3.3. Defining dependent and independent variables
x_train = np.array(train_df.drop(‘GC’,axis=‘columns’))
y_train = np.array(train_df[‘GC’])
x_test = np.array(test_df.drop(‘GC’,axis=‘columns’))
y_test = np.array(test_df[‘GC’])
1.3.4. Transforming data dimensions to conform to the model input conditions
x_train = np.reshape(x_train, (x_train.shape[0],1, x_train.shape[1]))
x_test = np.reshape(x_test, (x_test.shape[0],1, x_test.shape[1]))
2. Modeling—inputting when individual models are constructed
2.1. Deep neural network
model = Sequential()
model.add(Dense(16, activation=‘relu’,input_shape=(x_train.shape[1], x_train.shape[2])))
model.add(Dense(8, activation=‘relu’))
model.add(Dense(4, activation=‘relu’))
model.add(Dense(1, activation=‘sigmoid’))
model.compile(loss=“binary_crossentropy”,optimizer=“adam”,metrics=[‘accuracy’])
model.summary()
2.2. Deep neural network model without selecting variables

2.3. Deep neural network model after selection by CART

2.4. Recurrent neural network
model=Sequential()
model.add(layers.SimpleRNN(16, input_shape=(x_train.shape[1], x_train.shape[2]), return_sequences=True))
model.add(Dense(1,activation=‘sigmoid’))
model.compile(loss=“binary_crossentropy”, optimizer=“adam”,metrics=[‘accuracy’])
model.summary()
2.5. Recurrent neural network without selecting variables

2.6. Recurrent neural network after selection by CART

3. Setting a callback function to store the dynamic training process of models
TensorBoard = TensorBoard (log_dir = ‘file name’,histogram_freq = 2)
4. Training models, using the validation dataset for validation and storing the process in the callback function
history = model.fit(x_train, y_train, epochs=150, batch_size=4, validation_split=0.25,callbacks=[TensorBoard])
5. Assessing models based on the test dataset
t_loss,t_acc = model.evaluate(x_test,y_test)
References
- Bordo, M.D.; Landon-Lane, J.S. The Global Financial Crisis of 2007–08: Is It Unprecedented? Working Paper 16589; National Bureau of Economic Research: Cambridge, MA, USA, 2010. [Google Scholar]
- Aldamen, H.; Duncan, K.; Kelly, S.; McNamara, R.; Nagel, S. Audit committee characteristics and firm performance during the global financial crisis. Account. Financ. 2012, 52, 971–1000. [Google Scholar] [CrossRef]
- Persakis, A.; Iatridis, G.E. Earnings quality under financial crisis: A global empirical investigation. J. Multinatl. Financ. Manag. 2015, 30, 1–35. [Google Scholar] [CrossRef]
- Balakrishnan, K.; Watts, R.; Zuo, L. The effect of accounting conservatism on corporate investment during the global financial crisis. J. Bus. Financ. Account. 2016, 43, 513–542. [Google Scholar] [CrossRef]
- Sanoran, K. Auditors’ going concern reporting accuracy during and after the global financial crisis. J. Contemp. Account. Econ. 2018, 14, 164–178. [Google Scholar] [CrossRef]
- Gutierrez, E.; Krupa, J.; Minutti-Meza, M.; Vulcheva, M. Do going concern opinions provide incremental information to predict corporate defaults? Rev. Account. Stud. 2020, 25, 1344–1381. [Google Scholar] [CrossRef]
- Chen, S. An effective going concern prediction model for the sustainability of enterprises and capital market development. Appl. Econ. 2019, 51, 3376–3388. [Google Scholar] [CrossRef]
- Auditing Standard Committee. Statements on Auditing Standards (SASs) No. 61; Accounting Research and Development Foundation: Taipei, Taiwan, 2018. [Google Scholar]
- Auditing Standard Committee. Statements on Auditing Standards (SASs) No. 57; Accounting Research and Development Foundation: Taipei, Taiwan, 2018. [Google Scholar]
- Auditing Standard Committee. Statements on Auditing Standards (SASs) No. 1; Accounting Research and Development Foundation: Taipei, Taiwan, 2010. [Google Scholar]
- Auditing Standard Committee. Statements on Auditing Standards (SASs) No. 59; Accounting Research and Development Foundation: Taipei, Taiwan, 2018. [Google Scholar]
- Auditing Standard Committee. Statements on Auditing Standards (SASs) No. 52; Accounting Research and Development Foundation: Taipei, Taiwan, 2012. [Google Scholar]
- Geiger, M.A.; Rama, D.V. Audit firm size and going-concern reporting accuracy. Account. Horiz. 2006, 20, 1–17. [Google Scholar] [CrossRef]
- Blay, A.; Geiger, M.; North, D. The auditor’s going-concern opinion as a communication of risk. Audit. J. Pract. Theory 2011, 30, 77–102. [Google Scholar] [CrossRef]
- Myers, L.A.; Schmidt, J.J.; Wilkins, M.S. An investigation of recent changes in going concern reporting decisions among big N and non-big N auditors. Rev. Quant. Financ. Account. 2014, 43, 155–172. [Google Scholar] [CrossRef]
- Blay, A.; Moon, J.; Paterson, J. There’s no place like home: The influence of home-state going concern reporting rates on going-concern opinion propensity and accuracy. Audit. J. Pract. Theory 2016, 35, 23–51. [Google Scholar] [CrossRef]
- Myers, L.A.; Shipman, J.E.; Swanquist, Q.T.; Whited, R.L. Measuring the market response to going concern modifications: The importance of disclosure timing. Rev. Account. Stud. 2018, 23, 1512–1542. [Google Scholar] [CrossRef]
- Yeh, C.C.; Chi, D.J.; Lin, Y.R. Going-concern prediction using hybrid random forests and rough set approach. Inf. Sci. 2014, 254, 98–110. [Google Scholar] [CrossRef]
- Goo, Y.J.; Chi, D.J.; Shen, Z.D. Improving the prediction of going concern of Taiwanese listed companies using a hybrid of LASSO with data mining techniques. SpringerPlus 2016, 5, 539. [Google Scholar] [CrossRef]
- Koh, H.C. Going concern prediction using data mining techniques. Manag. Audit. J. 2004, 19, 462–476. [Google Scholar]
- Kirkos, S.; Spathis, C.; Manolopoulos, Y. Data mining techniques for the detection of fraudulent financial statements. Exp. Syst. Appl. 2007, 32, 995–1003. [Google Scholar] [CrossRef]
- Martens, D.L.; Bruynseels, B.; Baesens, M.; Willekens, M.; Vanthienen, J. Predicting going concern opinion with data mining. Decis. Support Syst. 2008, 45, 765–777. [Google Scholar] [CrossRef]
- Mahdi, S.; Fard, F.Z. Data mining approach to prediction of going concern using classification and regression tree (CART). Int. J. Manag. Bus. Res. 2013, 13, 24–30. [Google Scholar]
- Chi, D.J.; Chu, C.C.; Chen, D. Applying support vector machine, C5.0, and CHAID to the detection of financial statements frauds. Lect. Notes Artif. Intell. 2019, 11645, 327–336. [Google Scholar]
- Shin, K.S. An application of support vector machines in bankruptcy prediction model. Expert Syst. Appl. 2005, 28, 127–135. [Google Scholar] [CrossRef]
- Rizk, Y.; Awad, M. On extreme learning machines in sequential and time series prediction: A non-iterative and approximate training algorithm for recurrent neural networks. Neurocomputing 2019, 325, 1–19. [Google Scholar] [CrossRef]
- Bianchi, F.M.; Maiorino, E.; Kampffmeyer, M.C.; Rizzi, A.; Jenssen, R. Recurrent Neural Networks for Short-Term Load Forecasting: An Overview and Comparative Analysis; Springer: Cham, Switzerland, 2017. [Google Scholar]
- Bianchi, F.M.; Suganthan, P.N. Non-iterative Learning Approaches and Their Applications. Cognit. Comput. 2020, 12, 327–329. [Google Scholar] [CrossRef]
- Tkachenko, R.; Tkachenko, P.; Izonin, I.; Tsymbal, Y. Learning-based image scaling using neural-like structure of geometric transformation paradigm. In Advances in Soft Computing and Machine Learning in Image Processing; Springer: Cham, Switzerland, 2018; Volume 730, pp. 537–565. [Google Scholar]
- Tkachenko, R.; Izonin, I.; Vitynskyi, P.; Lotoshynska, N.; Pavlyuk, O. Development of the non-iterative supervised learning predictor based on the Ito decomposition and SGTM neural-like structure for managing medical insurance costs. Data 2018, 3, 46. [Google Scholar] [CrossRef]
- Breiman, L.; Friedman, J.; Olshen, R.; Stone, C. Classification and Regression Trees; Statistics/Probability Series; Wadsworth & Brooks/Cole Advanced Books & Software: Davis Dr Belmont, CA, USA, 1984. [Google Scholar]
- Chen, S. Detection of fraudulent financial statements using the hybrid data mining approach. SpringerPlus 2016, 5, 1–16. [Google Scholar] [CrossRef]
- Gregova, E.; Valaskova, K.; Adamko, P.; Tumpach, M.; Jaros, J. Predicting financial distress of Slovak enterprises: Comparison of selected traditional and learning algorithms methods. Sustainability 2020, 12, 3954. [Google Scholar] [CrossRef]
- Silva, P.; Luz, E.; Silva, G.; Moreira, G.; Wanner, E.; Vidal, F.; Menotti, D. Towards better heartbeat segmentation with deep learning classification. Sci. Rep. 2020, 10, 20701. [Google Scholar]
- Dencker, T.; Klinkisch, P.; Maul, S.M.; Ommer, B. Deep learning of cuneiform sign detection with weak supervision using transliteration alignment. PLoS ONE 2020, 15, 0243039. [Google Scholar] [CrossRef] [PubMed]
Publisher’s Note: MDPI stays neutral with regard to jurisdictional claims in published maps and institutional affiliations. |
© 2021 by the author. Licensee MDPI, Basel, Switzerland. This article is an open access article distributed under the terms and conditions of the Creative Commons Attribution (CC BY) license (http://creativecommons.org/licenses/by/4.0/).