
Robust Complaint Processing in Portuguese
by
 , , ,
, , ,
Henrique Lopes-Cardoso
1,* ,
,
Tomás Freitas Osório
1, 
Luís Vilar Barbosa
1,
Gil Rocha
1,
Luís Paulo Reis
1 ,
,
João Pedro Machado
2 and
Ana Maria Oliveira
2 1
Laboratório de Inteligência Artificial e Ciência de Computadores (LIACC), Faculdade de Engenharia da Universidade do Porto, Rua Dr. Roberto Frias, 4200-465 Porto, Portugal
2
Autoridade para a Segurança Alimentar e Económica (ASAE), Rua Rodrigo da Fonseca, 73, 1269-274 Lisbon, Portugal
*
Author to whom correspondence should be addressed.
Information 2021, 12(12), 525; https://doi.org/10.3390/info12120525
Submission received: 8 November 2021
/
Revised: 10 December 2021
/
Accepted: 15 December 2021
/
Published: 17 December 2021
(This article belongs to the Collection Natural Language Processing and Applications: Challenges and Perspectives)
Abstract
:The Natural Language Processing (NLP) community has witnessed huge improvements in the last years. However, most achievements are evaluated on benchmarked curated corpora, with little attention devoted to user-generated content and less-resourced languages. Despite the fact that recent approaches target the development of multi-lingual tools and models, they still underperform in languages such as Portuguese, for which linguistic resources do not abound. This paper exposes a set of challenges encountered when dealing with a real-world complex NLP problem, based on user-generated complaint data in Portuguese. This case study meets the needs of a country-wide governmental institution responsible for food safety and economic surveillance, and its responsibilities in handling a high number of citizen complaints. Beyond looking at the problem from an exclusively academic point of view, we adopt application-level concerns when analyzing the progress obtained through different techniques, including the need to obtain explainable decision support. We discuss modeling choices and provide useful insights for researchers working on similar problems or data.
1. Introduction
The usage of Artificial intelligence (AI) technologies is widespread in virtually every sector of human activity. Public administration institutions and governments seek to take advantage of AI to deal with specific needs and opportunities related to their access to substantial amounts of both structured and unstructured information. Natural language processing (NLP) techniques are being used to handle both web-originated text (such as in social networks or newswire) and, most importantly, written information produced in the process of an ever more direct interaction between citizens and governmental institutions [1].
By providing public services through virtual counters, governmental institutions are often required to respond to large numbers of citizen contacts (such as requests or complaints), a process that may quickly become intractable, depending on the size of the country or administrative region covered by the institution. Furthermore, without properly designed contact forms, the quality of the information received inevitably becomes an issue. NLP techniques can help address this information overload and improve public services [2] by automating the processing of textual data.
The Portuguese Economic and Food Safety Authority (ASAE) (http://www.asae.gov.pt/welcome-to-website-asae.aspx, accessed on 13 December 2021) is focused on food safety and economic surveillance, being responsible for the inspection of economic operators, in order to assess risks in the economic and food chains and enforce regulatory legislation. ASAE is a country-wide organization that needs to manage a large quantity of diversified information. One of its main inputs comprises complaints submitted by citizens or institutions concerning the activity of economic operators. Such complaints may arrive in multiple ways, including e-mail and contact forms.
It is ASAE’s responsibility to handle incoming complaints. When doing so, ASAE officers need to extract the targeted economic operator, determine the economic activity with which the complaint is related, identify any infractions implied by the complaint’s content, and decide upon ASAE’s competence to further act on the complaint (e.g., by carrying out an inspection procedure), since in many cases the complaint needs to be forwarded to another competent entity. Given the high number of yearly complaints (tens of thousands, a number that can only increase given the recent release of an electronic complaints book mobile app, which streamlines the process of posting complaints), the use of human labor to analyze and properly handle them is a bottleneck, bringing the need to automate part of the process. However, one must bear in mind that complaints can be seen as user-generated content [3] provided in free-form text fields, bringing high variability to the quality of the content written by citizens. Effectively automating complaint handling is thus a challenging task.
This paper addresses this real-world problem, considering complaint handling in three separate classification tasks that are related to the internal processing of complaints within ASAE. Building on previous insights [4,5], we explore text representation alternatives, including recent trends in language modeling, with the aim of improving classification results. Being aware that Portuguese is a lower-resourced language for NLP, we also explore different preprocessing pipelines, and focus on assessing results both in terms of quantitative metrics (e.g., accuracy, macro-F1) and, most importantly, feature analysis.
While this work is based on a real-world challenging dataset, the insights we get from addressing it can be useful for researchers dealing with similarly modeled classification tasks. These include extremely imbalanced hierarchical multi-class tasks and sparse multi-label tasks, that we have modeled in a number of ways—sticking with a specific hierarchical level or relaxing the problem to a single-label classification task. To deal with the inherent fuzziness of the thus obtained classes, we explore ranking approaches, among other techniques. These are also sensible for the sake of developing models that encompass the needs of a concrete application, where the human must be included in the loop—as such, more than providing black-box machine learning models with adequate levels of performance, we put an emphasis on developing solutions that allow for some kind of explainability on the suggested predictions. For that, we analyze the qualitative impact of different preprocessing and feature extraction techniques, by closely inspecting the most salient features in each class.
Moreover, we expect that the conclusions drawn from our study are equally important to those addressing data with similar characteristics, namely by comprising non-curated textual content expressed in a less-resourced language (Portuguese in our case). ASAE complaints comprise multiple-domain user-generated content, resulting in high variability in terms of language and style. This demands robust preprocessing pipelines, for which we have explored different approaches.
The main contributions of the paper can be summarized as follows:
- We develop a comprehensive study of different NLP techniques employed to process user-generated text with high variability of content and style, constrained by the limited performance of available tools for a less-resourced language.
- We analyze the impact of the decisions made in the NLP pipeline on the traceability of the predictions made by the system without comprising performance, which can be useful in human-in-the-loop scenarios.
- We provide insights on how to deal with challenging machine learning tasks derived from a real-world problem, combining unbalanced datasets, multi-label settings, the fuzziness of the label boundaries, and the peculiarities of user-generated text.
- We carry out an empirical analysis of different text representation approaches, either relying on extensive feature engineering or off-the-shelf neural language models, concluding that conventional techniques remain competitive in these challenging setups.
The rest of the paper is structured as follows. Section 2, looks into related works in analyzing user-generated content and, more specifically, complaint-related data. In Section 3, we characterize the complaint data focused in this work, the complaint processing tasks we address, and how we have chosen to address them. Given the wide range of approaches we have followed to address these tasks, for easier reading we provide, in Section 4, a glimpse of the alternatives explored. Then, in Section 5, we provide some competitive baselines for each of the addressed tasks, following a conservative preprocessing pipeline, by adopting a simple representation strategy, and by using a set of classifiers found to be promising in previous work [4,5]. We compare the classifiers in terms of performance metrics and focus on the most promising model by carrying out an error analysis and a qualitative inspection of the features employed. In Section 6 we explore feature engineering alternatives, with the aim of improving results both in quantitative and qualitative terms. While doing so, we uncover the limitations of certain NLP tools when handling Portuguese. In Section 7 we consider the case of taking advantage of subword information. In Section 8 we follow alternative representations based on word embeddings and language models. Section 9 wraps up the main findings of this journey, and includes the take-home messages of this work. Finally, Section 10 concludes.
2. Related Work
There are several works on the analysis of user-generated content, but they mostly study social media data [6], with a focus on tasks such as sentiment analysis and opinion mining [7] or address predicting the usefulness of product reviews [8]. Forte and Brazdil [9] focus on sentiment polarity of Portuguese comments, and use a lexicon-based approach enriched with domain-specific terms, formulating specific rules for negation and amplifiers.
Given its importance in the industry, customer feedback analysis has received significant attention from the NLP community. A 2017 task on the matter [10] addressed four languages (English, French, Spanish, and Japanese) and concentrated on a single goal: to distinguish, from Microsoft Office customer feedback, between comment, request, bug, complaint, and meaningless. This classification system has been proposed by Liu et al. [11] to provide meaning across languages. In the provided multi-lingual corpus, each example comprises a single sentence. The annotated part of the corpus has a total of 11,122 sentences, divided among train, development, and test sets, and is imbalanced both in terms of language (where English is more prevalent) and classes (with most examples consisting of comments and complaints). An additional set of 28,838 unannotated sentences was included in the corpus, with the aim of enabling the usage of semi-supervised approaches. The best overall performing model, by Plank [12], is based on a Support Vector Machine classifier exploiting both multilingual word embeddings and character n-grams. For the English language, however, Wang et al. [13] score best by using a deep learning approach based on a bidirectional GRU model with attention mechanisms.
Ordenes et al. [14] propose a framework for analyzing customer experience feedback, using a linguistics-based model. This approach explores the identification of activities, resources, and context, so as to automatically distinguish compliments from complaints, regarding different aspects of customer feedback. The work focuses on a single activity domain and, in the end, aims at obtaining a refined sentiment analysis model.
Traditional approaches to text categorization employ feature-based sparse models, using bag-of-words and Term Frequency-Inverse Document Frequency (TF-IDF) encoding. In such settings, common in the preprocessing stage is the use of near-synonym dictionaries to substitute words with similar senses. For instance, in the context of insurance complaint handling, Dong and Wang [15] make use of synonyms and Chi-square statistics to reduce the dimensionality of the feature space. In general, filtering out words that do not meet specified thresholds is a means to obtain a denser matrix of features. More recent techniques, such as word embeddings [16] and recurrent neural networks (RNNs) [17], have also been used in complaint classification. Assawinjaipetch et al. [18] employ these methods to classify complaints of a single company into one of nine classes, related to the specific aspect that is being criticized.
Given the noisy nature of user-generated content, dealing with complaints as a multi-label classification problem can be effective, even when the original problem is single-labeled. Ranking algorithms [3,19] are a promising approach in this regard, providing a set of predictions sorted by confidence. These techniques have been applied in complaint analysis by Fauzan and Khodra [20], although with modest results.
Kalyoncu et al. [21] approach customer complaint analysis from a topic modeling perspective, using techniques such as Latent Dirichlet Allocation (LDA) [22]. This work is not so much focused on automatically processing complaints, but instead on providing a visualization tool for mobile network operators.
The tasks we address in this paper contain some distinguishing properties, as follows. Complaint data is not focused on a single domain. In fact, as we will show in Section 3, economic activity classification at ASAE makes use of a hierarchical taxonomic structure, covering a wide range of domains of activity. Furthermore, infraction prediction is a multi-label problem, given that for any complaint there may be more than one implied infraction, with different severity degrees. Properly addressing this problem is crucial to help ASAE in prioritizing complaint handling. Finally, determining institutional competence is a fuzzy problem, as in many cases more than one competent authority is needed to properly handle a complaint.
3. Complaint Data
The complaints that are the target of this study have reached ASAE either via email or through its web-based contact form (including a free-form text field where the complaint itself is filled-in). The dataset consists of roughly 150 k samples, 63% of which were received via ASAE’s website and collected over the course of 11 years (from 2008 to 2018). During this period, ASAE has received around 14 k complaints per year, with a slight increase towards the last 5 years. The geographical distribution, as expected, is higher in denser populated areas. Each complaint has, on average, 255 tokens.
3.1. Complaint Processing
Each complaint has been manually handled by an officer, who spots relevant information and classifies the complaint according to three key dimensions. Based on the result of such classification and following the institution’s policies, ASAE decides if and when the complaint is to be investigated.
The first dimension is the type of economic activity identifiable in the complaint. Usually, this is related to the economic operator being targeted. However, many economic operators are related to more than one activity; furthermore, it is often hard to unambiguously identify the targeted operator from the complaint text, in particular when it is received via email. Assigning an economic activity to the complaint follows a hierarchical structure, part of which is shown in the leftmost columns of Table 1. Given the nature of the taxonomy in use and the way it has evolved throughout time, some of the third layer classes (identified with I to X and Z) contain a high number of subclasses (namely classes II and V, but especially classes VIII, IX, and X), which gives rise to a tree-like structure with a high branching factor variance.
The second key dimension concerns determining any infractions implied by the complaint. The different kinds of infractions, which amount to more than three hundred, are organized into three main groups, here listed by decreasing order of severity: crimes, administrative infringements, and simple consumer conflicts. Each complaint may evidence more than one infraction, across groups. From a classification task point of view, this comprises a multi-label problem. Understanding the severity of infractions allows ASAE to prioritize investigating more serious and potentially harmful conducts of complaint targets.
Finally, the third key dimension is competence, which essentially determines whether the subject matter enclosed in a complaint is within ASAE jurisdiction, or if it should be (also) treated by a different judicial or governmental entity. Identifying the competent authorities is important because ASAE should not investigate complaints outside its jurisdiction and, if applicable, should forward the complaint to the competent authority. Although, in practice, competence identification is not modeled as such, this task can again be seen as a multi-label classification problem. For the sake of ASAE’s fieldwork, however, the main aim is to check whether ASAE itself is one of the competent authorities.
3.2. Classification Tasks
The complaint data used in this work includes some demanding challenges that we needed to address, so as to deliver useful models that help ASAE automatically process the high volume of complaints it needs to handle. We here describe how each of the three aforementioned tasks has been addressed, and provide a brief exploratory data analysis. The dataset used contains complaints received by ASAE between 2008 and 2018, by email or through an online contact form, in a total of 150,669 records.
Table 1 shows the distribution of data according to the economic activities dimension. As can be seen in the rightmost columns, the dataset denotes an extremely imbalanced nature. Moreover, looking at the hierarchical taxonomy of activities, we can observe that the classes with the higher number of complaints are not always the ones with the higher number of subclasses; for instance, the majority class (III) has a very low number of subclasses, while the second biggest class (IX) has by far the highest number of subclasses. This prevents us from uniformly going down one level in the hierarchy.
For these reasons, we model economic activity prediction as a multi-class problem with the 11 classes shown in Table 1 (from the original 150,669 complaints, 3851 were not properly labeled for this task, and have thus been removed). The top 3 classes (III, IX, and Z) together represent 72.58% of the data, while the smallest class contains as few as 0.02% of the data. To further complicate things, the third most representative class (Z) is one where the human was not able to identify an appropriate economic activity.
Regarding infraction analysis, the number of labels denoting different kinds of infractions prevents us from addressing the problem as a multi-label classification task, when considering the available data. Taking into account that the severity of the implied infractions is the main criteria to decide which complaints ASAE should primarily investigate (with a special focus on criminal offenses), we concentrate on predicting infraction severity. For that, we consider the highest severity present in the list of infractions associated with a given complaint. This is a sensible compromise to deal with the excessively imbalanced nature of this problem, while still deriving useful information from the available data. This approach makes prioritization easier—a complaint indicating crime is more severe than a complaint pointing only to administrative infringements—but also makes classification fuzzier due to the overlap between crimes and administrative infringements in some cases. The three labels obtained with our approach are shown in Table 2, together with the data distribution. We can still observe the imbalanced nature of this classification task, with the most relevant class (crime) being the least represented, with approximately 5% of the data.
As for determining the competent authority to handle a complaint, it turns out that some complaints may imply shared responsibilities between ASAE and other entities, which makes the problem more diffuse. As far as ASAE is concerned, the most important distinction is between complaints ASAE needs to act upon, and those that should exclusively be forwarded elsewhere. For this reason, we formulate the problem as a binary classification task: whether ASAE should be involved in analyzing the complaint or not, as shown in Table 3. The first class corresponds to cases where ASAE should be involved (perhaps together with other institutions, such as courts), while the second class comprises complaints where this is not the case.
In the sections that follow, we put forward and analyze several different NLP approaches to address each of these tasks.
4. Roadmap
To tackle the demanding classification tasks identified in Section 3.2, we have carried out several tryouts based on different experimental setups and pipelines. The decisions were taken based on the insights acquired from each of the experimental results observed.
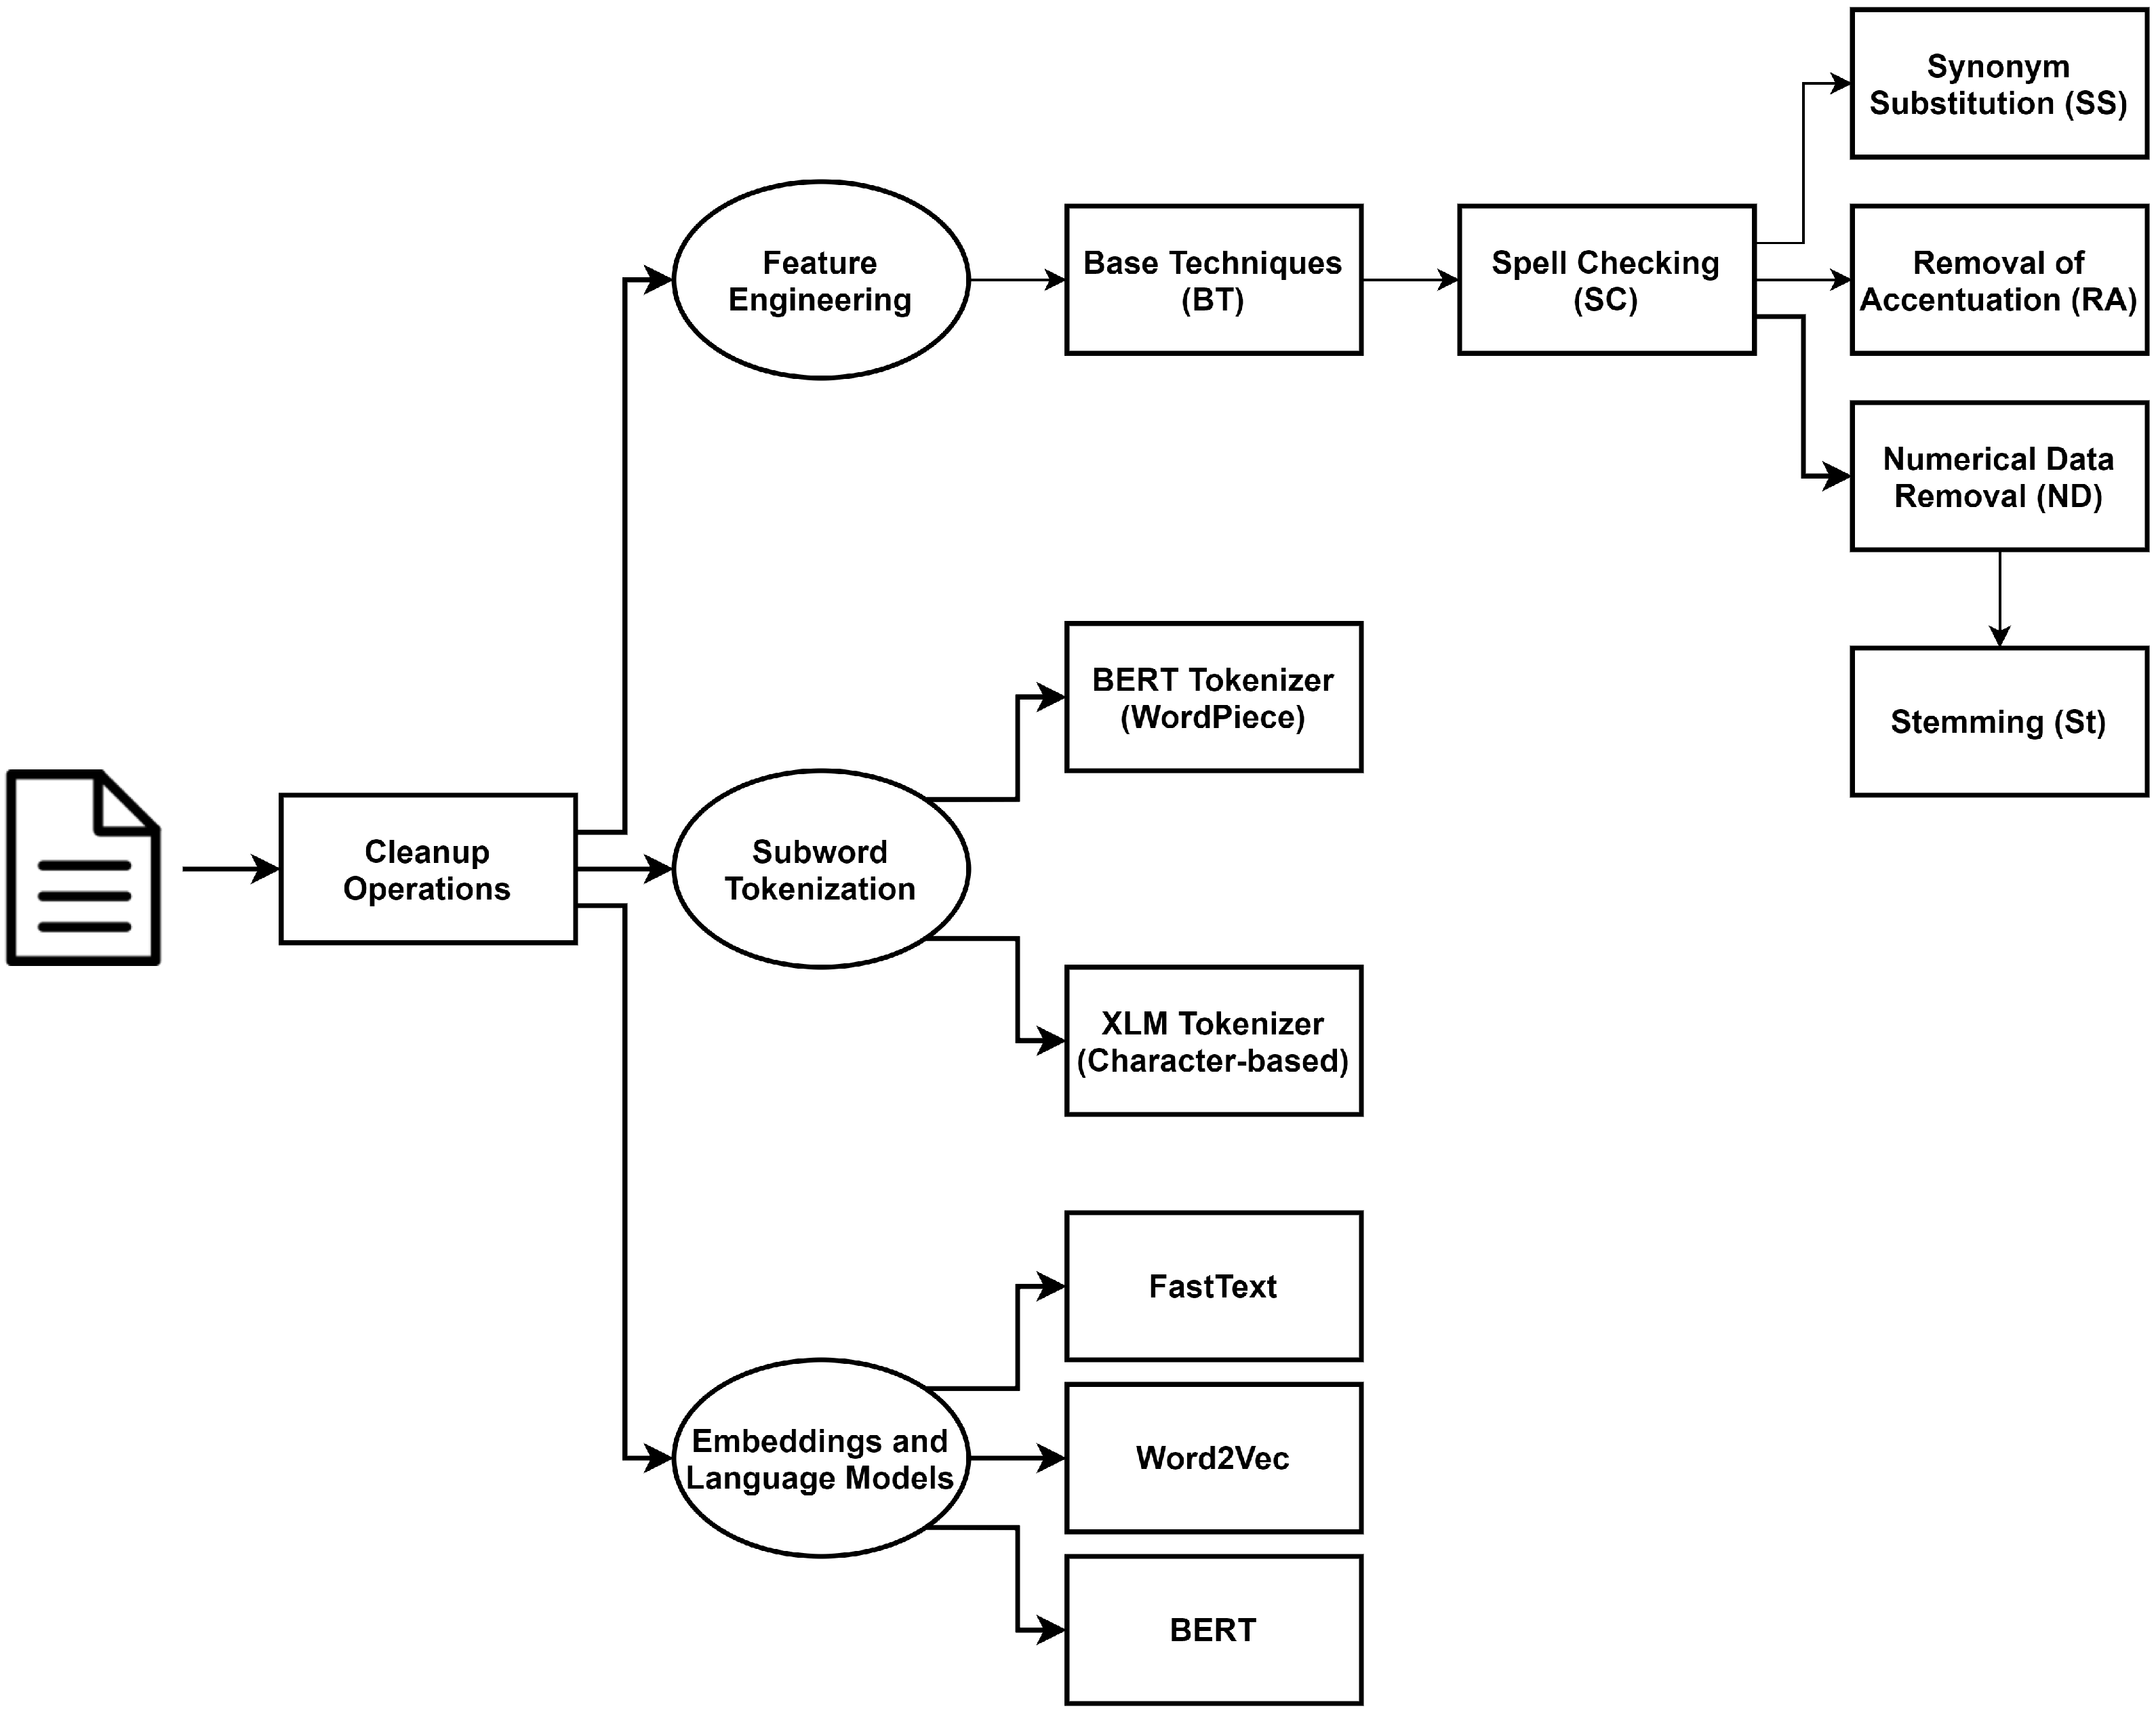
We have explored several approaches, including different preprocessing techniques, tokenization strategies (including subword-based approaches), sparse (feature-based) and dense (word embeddings) representations, and language models. The roadmap for the approaches carried out can be seen in Figure 1.
To analyze our progress, we consider both accuracy and macro-F1 as evaluation metrics, given the imbalanced nature of the classification tasks at hand. Occasionally, we also analyze the obtained ROC curves.
We have started our work by conceiving some baseline approaches, both in terms of feature extraction and classifiers; these are reported in Section 5. Every subsequently explored approach is compared to the baselines in two complementary ways: we report and compare the accuracy and macro-F1 scores; additionally, we carry out a qualitative comparison by analyzing the most salient features, according to the employed classifier.
Several preprocessing and cleanup techniques are explored and analyzed in Section 6, including spell checking, synonym substitution, removal of accentuation, numerical data removal (including dates/times), and stemming. The use of subword tokenization is explored in Section 7, including WordPiece and character-based tokenization. Experiments relying on embeddings and language models are detailed in Section 8, where we explore both using word embeddings to feed deep learning models and fine-tuning language models to our tasks.
5. Baselines
Since complaints are, in essence, a form of user-generated content, in our case submitted through various means (email or contact forms), it is sensible to employ cleanup operations. As such, we have subjected the dataset to different cleanup approaches, including stripping all HTML code from complaints received via email, removing headers, URLs, and email addresses.
As preprocessing steps, in the baseline experiments (see Base Techniques in Figure 1) we make use of Stanza [23] for both tokenization and lemmatization, followed by lower-casing tokens and removing punctuation marks and stop-words. Stanza includes state-of-the-art neural models pretrained for Portuguese. Using scikit-learn libraries [24], we extract features using 1-grams and use TF-IDF for feature representation. We follow our previous insights in addressing this dataset [4], where the use of further n-grams (for ) did not show any improvement.
Following Filgueiras et al. [5], data splits were made for each task separately, to ensure that distribution of labels in the training and test set is kept (stratified split). Each test set is composed of 23,957 complaints, extracted from the last 5 years of data, in an attempt to analyze the performance of the obtained models on more recent data instances.
Based on previous work [5], we have chosen the following classifiers: SVM with a linear kernel; SGD (SVM with a linear kernel and stochastic gradient descent learning); and Random Forest. For matters of explainability, we leave out black box models such as those based on neural networks. The SVM classifier was configured to use l2 norm as a penalty, squared hinge loss, and the one-vs-rest strategy for multi-class. The SGD classifier was configured to use l2 norm as penalty and the smoothed Hinge loss (“modified_huber” loss function in scikit-learn [24]). The Random Forest classifier was configured to use 100 estimators. We use it both as a multi-class classifier and in a one-vs-rest setup (obtaining several binary classifiers), for a more straightforward comparison with SVM.
As an additional baseline, we have also considered Random classifiers for each of the three tasks, following the data distribution (stratified random guesses), using a constant seed.
5.1. Quantitative Analysis
We start by carrying out a performance analysis of the proposed classifiers in each of the tasks.
5.1.1. Economic Activity Prediction
Table 4 presents the results, obtained by each classifier, for the economic activity prediction task. It is easily noticeable that SVM obtains the best overall results.
Given the relatively high number of classes, we have also looked at the performance of each classifier considering its ranked output. This approach is aligned with the foreseeable usage of the classifier, which is meant to help humans on analyzing complaints by providing likely classification labels (as opposed to imposing a definitive one). Each of the columns Acc and (Macro-)F1 are accuracy and macro-F1 scores, respectively, when considering that the classifier has made a correct prediction if any of the k most confidently predicted classes (top-k) corresponds to the target label.
Given that SVM obtained the best overall scores, we focus on SVM for error analysis. The confusion matrix for economic activity prediction is shown in Table 5 and is complemented by the per-class precision and recall metrics displayed in Table 6. The influence of majority classes III and IX is visible, while class Z seems to be the most ambiguous for the classifier (it is the third most represented class, but has the lowest precision and recall of the top five classes). In fact, class III has the highest precision and recall. Most of the remaining classes have relatively good precision scores, while some of them suffer from low recall, namely classes I, II, IV, and X (due to their small size).
Attempts to explore the hierarchical nature of the economic activities taxonomy (as per Table 1) did not allow us to improve performance. Training an SVM classifier to distinguish between “Food”, “Economic” and none, and two subsequent classifiers to distinguish between classes I–VII and VII–X, respectively, obtained an accuracy of 0.7120 and a macro-F1 score of 0.4885.
5.1.2. Infraction Severity Prediction
Table 7 presents the results, obtained by each classifier, for the infraction severity prediction task. Again, SVM has been able to obtain the best scores, when considering both accuracy (for which SGD is on par) and macro-F1.
By analyzing the confusion matrix shown in Table 8, it is possible to obtain similar precision scores for every class (), and disparate recall values (with for the minority class “Crime” and for the other two classes). We also observe that class “Administrative infringements” and “Others” have a considerable number of cases where the prediction is swapped. We attribute this to the simplification of the original multi-label problem to a single-label classification task. These results are aligned with the observation made in Section 3.2 regarding the fuzziness of the obtained classes.
Given the nature of the task, it is important to tune the classifier to not underrate complaints in terms of infraction severity. To this end, it is of utmost relevance to reduce the number of false negatives for the “Crime” and “Adm. infr.” classes. As observed in Table 8, the proposed baseline can be further improved in these lines.
We perform a Receiver Operating Characteristic (ROC) analysis to assess how the true positive rate (TPR) and false-positive rate (FPR) of a given class vary by manipulating the decision threshold of the classifier. In this case, we are interested in understanding to what extent we can improve recall for “Crime” and “Admin. infr.” with low impact on the FPR.
Figure 2 shows the ROC curve averaged for all classes (micro and macro), as well as the ROC curve for each of the classes in a one-vs-rest setting (e.g., the ROC curve of class “Crime” concerns a binary classification task between “Crime” and the union of “Admin. infr.” with “Others”). As mentioned above, using the default threshold value we obtain a recall of for class “Crime”, yielding a very small FPR rate of . Looking at the ROC curve for “Crime”, we conclude that we can increase recall to at the cost of increasing the FPR to . That is, simply by manipulating the threshold value we can tweak the classifier to improve coverage for this class, which is quite relevant for the intended use of this classifier. Analyzing the ROC curves for “Admin. infr.”, we conclude that further improving recall for this class (e.g., from to ) by adjusting the classifier’s threshold compromises the FPR (which goes from to ). It is up to the domain experts (that is, ASAE’s staff) to determine whether such an increase is compensated by the higher recall, in practical terms.
Prior work [5] employed balancing techniques in an attempt to improve the classification ability for the classes with higher infraction severity (one of which is highly under-represented in the dataset), concluding that only marginal improvements could be obtained. We believe that the fuzziness of the class boundaries is the major problem we are facing, and the ROC analysis seems to provide more robust solutions to tackle the problem of underrating complaints in terms of infraction severity.
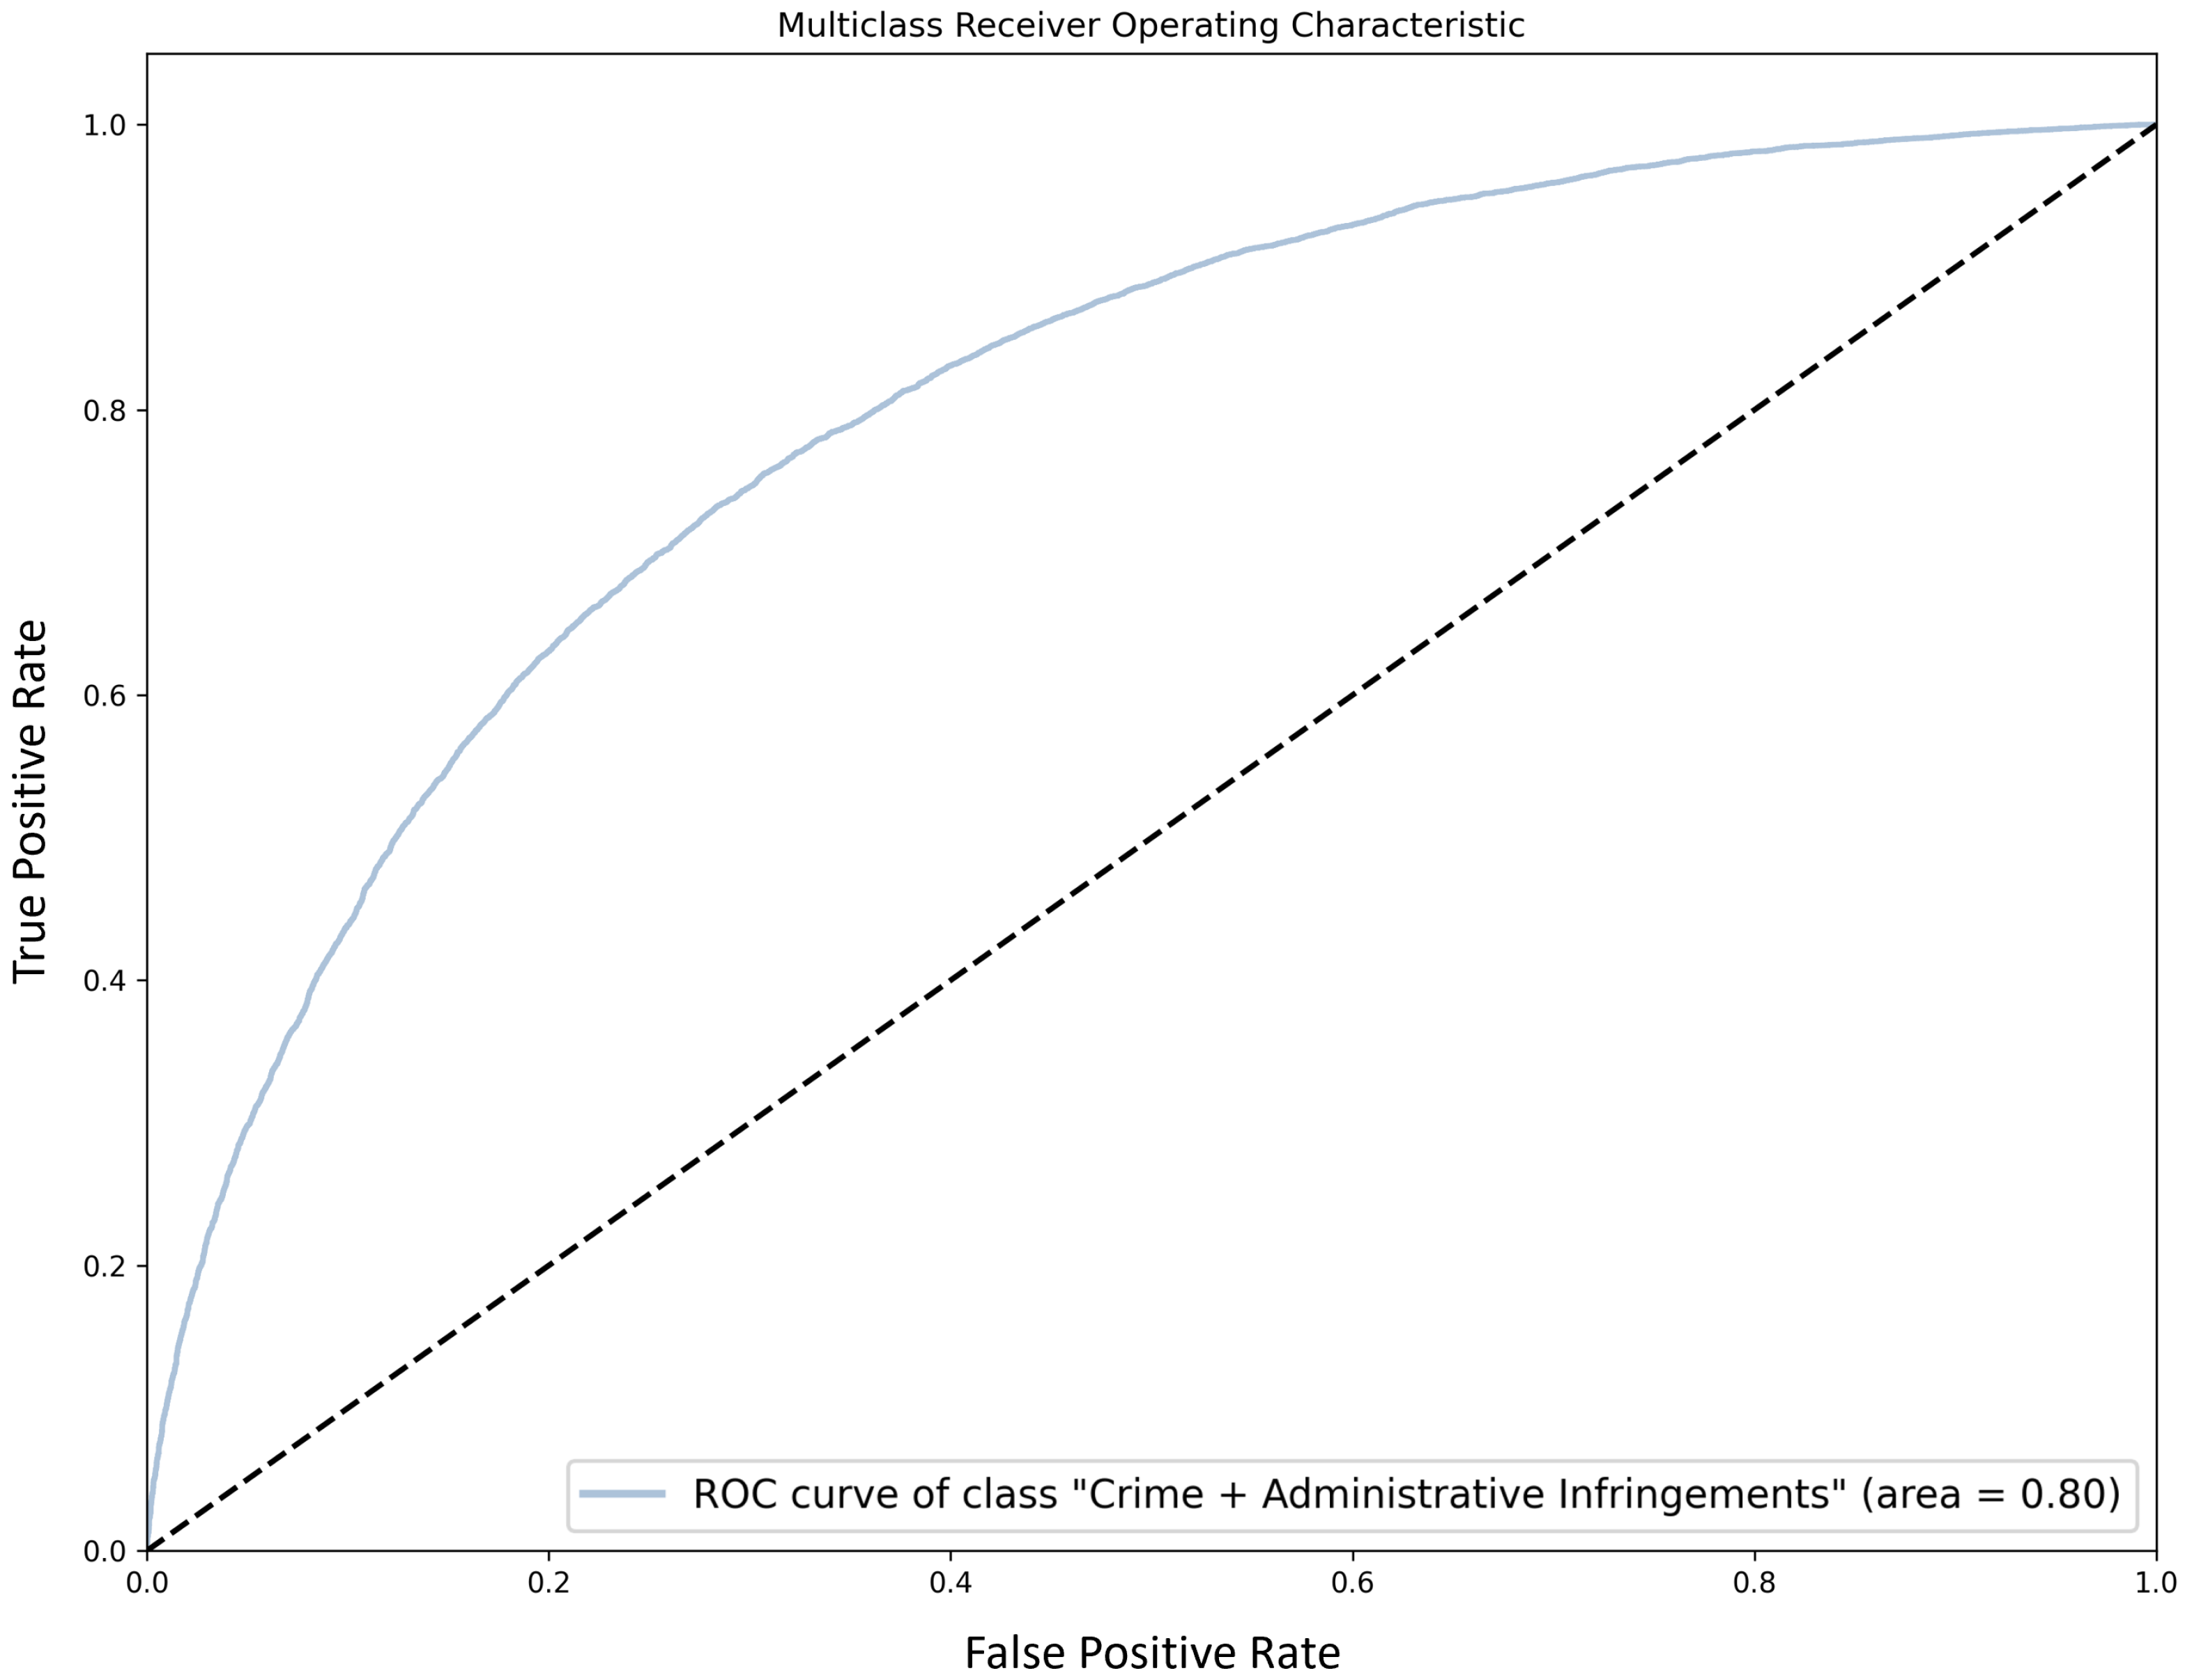
We have also considered handling infraction prediction as a binary classification task, by combining “Crime” and “Adm. infr.” in a single class. In this setting, the SVM classifier was able to obtain an accuracy of and a macro-F1 score of (for a recall of ), while SGD brings a slight improvement to in both metrics. While this brings an increase in recall as compared to the 3-class version of this task (corresponding to an additional 235 complaints that would be signaled for the human operator to consider), it also prevents us from considering different severity levels (which is also an important domain concern).
Figure 3 shows the ROC curve for the merged class “Crime” + “Adm. infr.” in the binary classification setting. We can observe that further improving recall for this merged class comes with a high increase on the FPR: improving recall from to causes the FPR to go from to . However, this has a low impact on the overall performance, with a small drop in macro-F1 from to .
5.1.3. Competence Prediction
Table 9 presents the results obtained by each classifier, for the competence prediction task. SVM has been shown to be the most competent classifier.
Table 10 shows the confusion matrix for competence prediction, from which we can compute a precision of and a recall of for the positive (“ASAE”) class. In relative terms, the number of false positives ( of the negative class) is twice as much as the number of false negatives ( of complaints in the “ASAE” class).
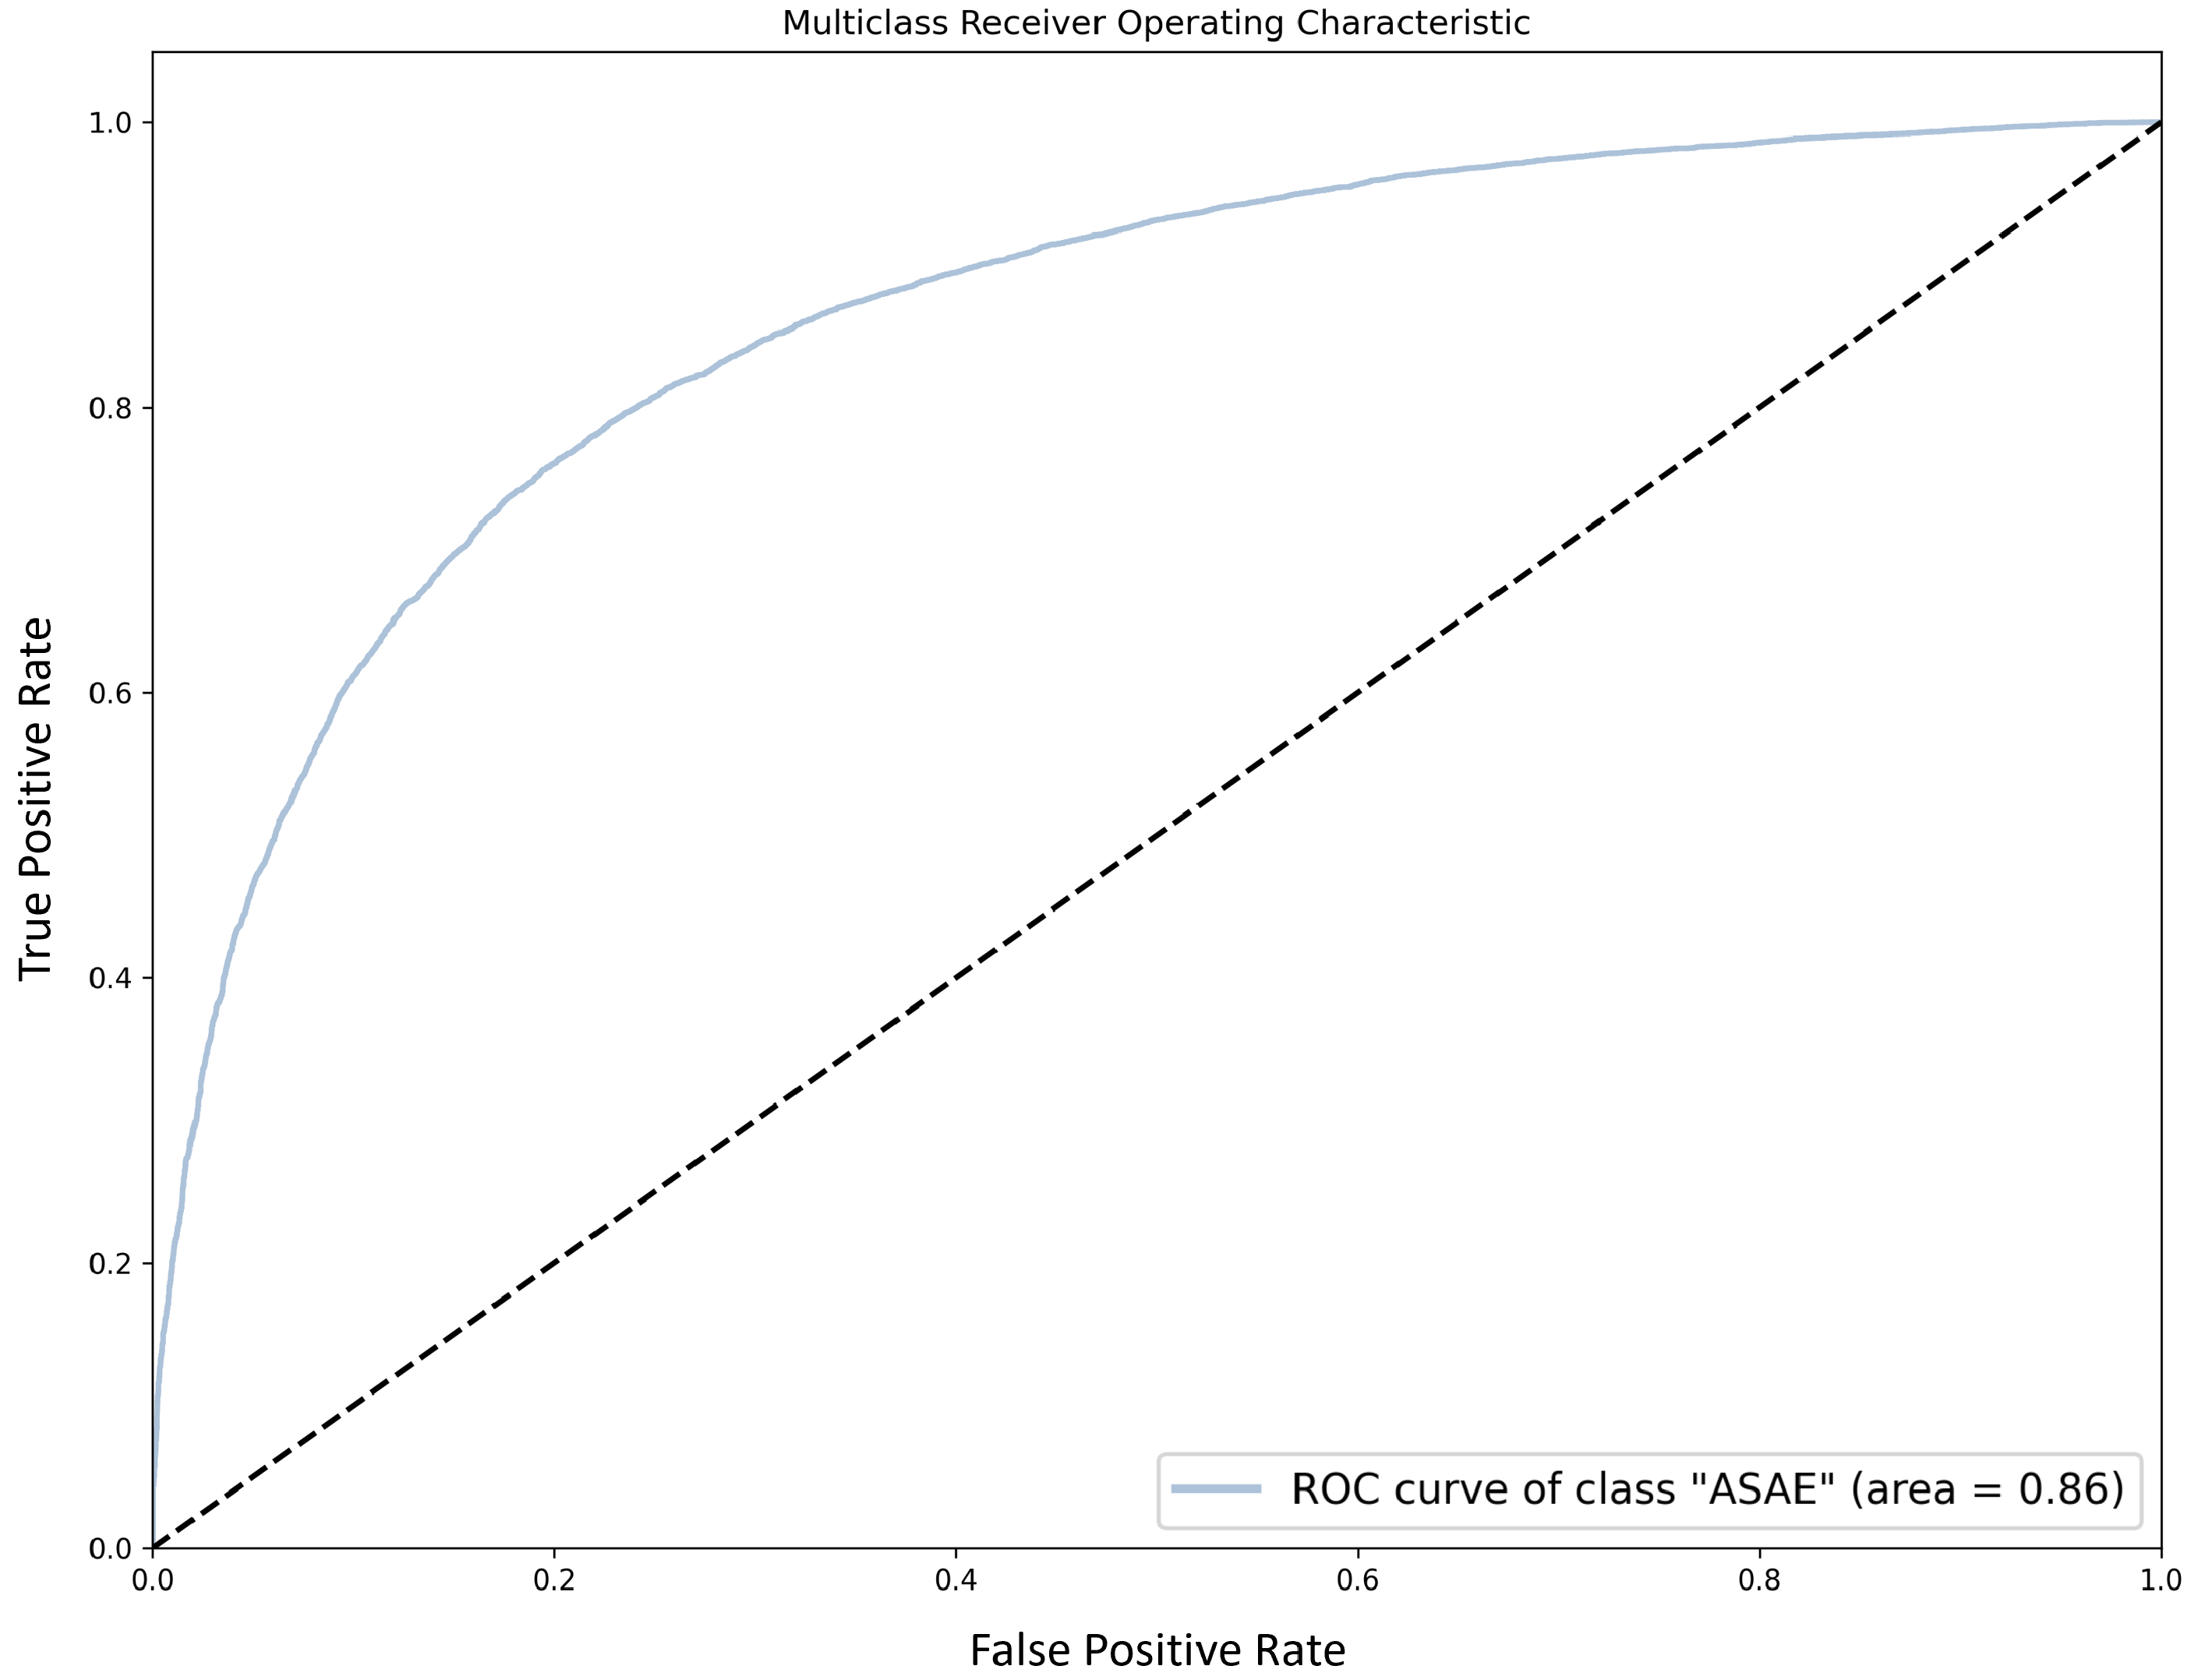
For competence prediction, false negatives are of concern, since they correspond to complaints that are erroneously considered as having been sent to the wrong entity, and will probably receive a lower priority score. Similar to the previous task, we perform a ROC curve analysis. In this case, we aim to determine the impact on the FPR of improving recall for the class of interest (“ASAE”), which accounts for 62.5% of the examples, by adjusting the classifier threshold.
Figure 4 shows the ROC curve for the “ASAE” class. We can observe that adjusting the decision threshold to increase recall (say, from to ) has a high impact on the FPR (from to ). Interestingly, macro-F1 is not too much affected, with a drop from to . Again, it is up to ASAE’s personnel to determine which course of action works best in practice.
5.2. Feature Analysis
Going beyond the crude performance of the SVM classifier in each of the tasks, we perform an analysis of the most relevant features detected by the classifier. This approach will also enable us to perform a more thorough comparison of subsequent experiments, laid out in Section 6.
Table 11, Table 12 and Table 13 present the Top-10 features (for data protection reasons, some features have been anonymized) obtained by performing feature ranking for the SVM classifier trained for each task. We follow the Feature Ranking approach proposed by Guyon and Elisseeff [25] to determine the relevance of each feature for linear predictors, i.e., . This is made possible by the fact that we are employing an SVM with a linear kernel, which aims to learn the hyperplane (linear function in this case) that separates each class as best as possible. The weights attributed by the model to each feature can be used to assess their corresponding relevance: the larger is, the more important is the role the jth feature plays in the decision function. To this end, the range of values that each feature can take must be normalized, which we ensure by employing the TF-IDF weighting schema in the feature set. Consequently, we determine the most salient features by ranking them according to , allowing us to assess whether the features made sense for the given class. In particular, this approach allowed us to check if the model was looking at specific values (e.g., names or dates) or to more generic pieces of information related to the class, ensuring the generalization of the classifier.
Through the analysis of the features shown in Table 11, concerning economic activity prediction, we observe that most features are semantically related with the corresponding economic activity. This is an indication that the SVM classifier is able to emphasize sensible words from the feature set. An exception is class VI, explained by the fact that this class has got very few examples (and in fact, no complaint has been predicted as belonging to class VI). The emergence of a phone number is explained by its high TF-IDF weighting: although its frequency within class VI may not be so relevant, its inverse document frequency is high. In class V, many of the identified features concern large retail stores in Portugal from the food sector. Class Z is a special case, because it does not correspond to an actual economic activity—it is interesting to note that the most salient features are not related with any other class (the actual economic activities), but instead correspond to numerical data, such as dates. This also points towards the direction of building a classifier relying only on the actual ten classes, leaving out those complaints with no assigned economic activity.
Table 11 also shows some cases of words differing only on accentuation (mainly for misspell reasons), and words sharing lemmas. This observation uncovers the suboptimal performance of the chosen lemmatizer (even though Stanza is the main alternative for the job).
Table 12 shows the most salient features for each class in infraction severity prediction. For class “Crime”, we notice a set of words that are in fact associated with several kinds of felonies or severe consequences, such as counterfeit, gambling, forgery, or intoxication. In this class, some features have the same lemma, which again raises concerns on the quality of lemmatization for Portuguese. For class “Admin. infringements”, some words related with certain activities or legal requirements emerge, such as hygiene, license, or accommodation. As expected, class “Others” gets no particularly useful features, as this class corresponds to complaints where no significant infraction is entailed.
As for competence prediction, Table 13 reveals features corresponding to words that are semantically related with the surveillance duties of ASAE (e.g., hygiene, contarfeit, smoking, licence, kitchen, food).
The experiments reported in the rest of the paper take into account these findings, and point to enhancing data processing techniques to overcome some of the observed limitations. Besides considerations regarding the overall performance of the obtained models, our main goal is to improve model robustness and usefulness as a decision-support tool.
6. Feature Engineering
As a way of improving the set of features used by the classifiers (following the observations drawn in Section 5.2), we decided to employ additional feature engineering techniques, which mostly correspond to further preprocessing the dataset. We explore spell checking, synonym substitution, removal of accentuation, numerical data removal (including dates/times), and stemming. The scores obtained for the experiments performed are shown in Table 14, resorting to SVM classifiers (for easier comparison, we show the scores already reported in Table 4, Table 7 and Table 9 for SVM in each of the tasks, when using the base techniques). We analyse these results in the following subsections.
6.1. Spell Checking
As a result of feature analysis and by looking at the text of a sample of complaints, we have observed a non-negligible presence of spelling errors. As such, we have explored applying spell checking and correction to clean up the text in this regard. We have used Hunspell (https://github.com/MSeal/cython_hunspell, accessed on 13 December 2021) in conjunction with the dictionaries for Portuguese provided by LibreOffice (https://github.com/LibreOffice/dictionaries, accessed on 13 December 2021) To simplify the process, we look into the first suggestion provided by Hunspell and decide on substituting the token if the Levenshtein distance is lower or equal to 3.
As visible in Table 14, spell checking obtains slightly worse scores compared to the base techniques for the tasks reported. Still, this is accomplished with a significant decrease in the number of features, from 427,904 to 252,596.
By looking at Table 15 and comparing with Table 11, we notice some cases where misspelled features are merged (e.g.: “aviario” → “aviário”, “panificaçao ” → “panificação”, “cafe” → “café”, “armazem” → “armazém”.), mostly due to missing accentuation marks. Such misspells in the training set can only contribute to overfitting, and are thus removed. Similar corrections are made for features lower in the rank, in some cases bringing changes to the list of most salient features, for the three classification tasks.
Even though running the spell checker is quite slow, we envision that modern contact forms for complaint submission will be equipped with spell checkers that can be used to reduce the number of misspelled words in the input. Based on this analysis, we conclude that spell checking should be employed in our pipeline. Hence, we keep spell-checking in the follow-up experiments.
6.2. Synonym Substitution
In order to aggregate features with similar meaning, we explore a lexical knowledge base of synonyms (wordnet), where these are grouped into synsets. The feature set is obtained by mapping each token occurring in the text to the corresponding synset. Especially tailored for the Portuguese language, we use the CONTO.PT [26] lexical ontology, which is composed of 34 thousand diffuse synsets. We abstain from addressing polysemy issues, and focus instead on simply reducing vocabulary size; as such, we simply replace each word occurring in CONTO-PT by the first synset that is found. As shown in Table 14, this approach did not bring an increase in performance, with both accuracy and macro-F1 scores being lower than those obtained with the base techniques and spell checking.
By comparing the most salient features obtained with synonyms substitution with the ones from the base techniques, we observed that some words are replaced by the corresponding synonyms. This process results in a reduction of the feature set in around 3 k features. However, this reduction did not improve the performance of the SVM classifiers, yielding, on the contrary, a small decrease in the scores.
There are several drawbacks in employing synonym substitution in the automatic assessment of complaints in a production environment. Firstly, given that the process of synonyms substitution must be performed after the submission of the complaint, it can impact the performance of the system. Secondly, since synonym substitution reduces the recognizable vocabulary, it may have a considerable impact when used in combination with the other feature engineering techniques we explore, and may negatively affect the complaint assessment capability of the system. Given the observed drop in performance and the mentioned drawbacks, we opted not to include synonym substitution in the pipeline of preprocessing steps to be employed.
6.3. Removal of Accentuation
An additional typical preprocessing technique concerns the removal of accent marks in accentuated characters. Even if two tokens differing only in accentuation exist in the feature set (either because they are both parts of the language or because of spell-checking limitations), they tend to have similar meanings and can thus be merged. For removal of accentuation, we used Unidecode (https://pypi.org/project/Unidecode/, accessed on 13 December 2021).
As visible in Table 14, the performance of the classifiers when applying removal of accentuation is practically the same, and the reduction of the number of features is not very significant (from 252,596 to 250,895). For that reason, we do not see a value in applying this technique on top of spell checking, and for that reason, in subsequent experiments, we drop the removal of the accentuation processing step.
6.4. Numerical Data Removal
Some salient features observed (especially when looking beyond the top-10 features shown in the tables) refer to numerical data, such as quantities or dates, that should not be taken into account. For instance, the prevalence of a specific date mentioned in complaints may simply denote a temporal time span in which many complaints have been submitted, for circumstantial reasons. Taking this into account, we removed numerical data from the dataset and analyzed the impact of this operation. To account for dates and hours, we apply a naive approach that simply removes any digits found. This approach drastically reduced the number of features to 97,553.
As visible in Table 14, numerical data removal brings accuracy and macro-F1 scores that are close to the ones obtained simply with the base techniques and spell checking (the highest loss is lower than 1%, and there is a negligible gain for infraction severity prediction). At the same time, we observe that for the classes with mostly numerical data as the top-10 features (see Table 11 and Table 12), which we can regard as “negative” classes, new features emerge that are not semantically related with any of the other classes for the same task (see Table 16 and Table 17). For these reasons, and in particular, for the reduction in the number of features, we keep numerical data removal in the sequel.
6.5. Stemming
Given the maintenance of words with the same lemma that the lemmatizer was unable to resolve (as visible in Table 12 and Table 15, for instance), we resort to stemming as an additional technique to deal with this problem. Stemming was performed using NLTK’s SnowballStemmer (https://www.nltk.org/_modules/nltk/stem/snowball.html, accessed on 13 December 2021) for Portuguese.
Looking at Table 14, we notice that stemming deteriorates performance in every task, although in some cases by a negligible margin. At the same time, the number of features is reduced to 62,737. Through the analysis of the features present in Table 18, it is noticeable that despite this further reduction from 97,553 to 62,737 features, there are still stems that should be further merged.
7. Subword Tokenization
As an alternative to the processing pipeline addressed in Section 6, we explored subword tokenization, which is known to bring advantages in terms of reducing vocabulary size, data sparsity and out-of-vocabulary words (relevant in the presence of misspells, in morphologically rich languages, and user-generated content) [27,28]. More precisely, we employ the same set of techniques used in Section 5, excluding lemmatization, and replace the Stanza tokenizer with one of the following.
We explored using the WordPiece tokenizer [27], based on the BERT model “bert-base-multilingual-cased” provided by HuggingFace’s Transformers library [29]. We have also considered character-based tokenization through the Cross-Lingual Language Model (XLM) tokenizer [30], based on the “xlm-mlm-100-1280” pre-trained model available in the same library. Both pretrained models were trained on multilingual resources, and Portuguese is one of the languages considered. The set of experiments addressed in this section target only the economic activity prediction task, based on which we assume similar insights can be extrapolated for the remaining tasks.
The BERT and XLM tokenizers obtain a set of 31,087 and 33,672 features, respectively. Table 19 shows the results obtained with SVM, denoting a drop in performance as compared to the base techniques (see Table 4).
Based on the analysis of the features presented in Table 20 and Table 21, it is noticeable that several features are not complete words, but the corresponding word pieces that are part of the subword tokenizer’s dictionary (e.g., “aviá”, “##caria”, “pada”, “##bric”). In principle, this would mean that the model may use this information to capture more general features, that can encompass vocabulary only seen in the test set; however, this also brings higher cross-class ambiguity in terms of features. Indeed, we attribute the drop in performance to the fact that common parts of words may be shared by features that are relevant for different classes. For instance, tokens “bar” and “barbearia”, which are respectively related with classes III and IX (see Table 11), are both reduced to the word piece “bar”.
Performing subword tokenization is, in general, language-agnostic and based on a multilingual WordPiece vocabulary. Given the added robustness of these approaches to misspell phenomena, spell checking is expected to be less effective; however, by not employing any corrections we do obtain certain features that originate in misspells (e.g., “café” and “cafe”).
8. Embeddings and Language Models
Taking into account recent advances in the NLP community, we employ word embeddings and language models as encoding techniques. For that, we make use of the dataset after applying the cleanup operations mentioned in Section 5.
For word embeddings, we report experiments with pre-trained Word2Vec embeddings [31] using Convolutional Neural Networks (CNN) [32] to encode the input sequence. We also report results using the FastText model [33].
The CNN approach uses Word2Vec [31] embeddings pre-trained with continuous bag-of-words with 300 dimensions for Portuguese, which were obtained from Hartmann et al. [34]. The CNN architecture consists of four layers. An embedding layer is followed by n parallel convolution layers with 100 output channels and a 1D max-pooling layer with a kernel size equal to the length of each layer. The outputs of the pooling layer are concatenated and passed to a fully-connected layer. The convolution layer has a kernel of i by embedding dimension, where n is equal to the number of different i applied. Instead of explicitly using n-grams as in FastText, this leverages the convolution layer kernels to mimic this operation. In this experiment, we used 3 parallel convolutional layers with kernel sizes that go from 3 to 5.
FastText embeddings were trained from scratch. The FastText model consists of three layers: an 100 dimension embedding layer, an average pooling layer that normalizes the input length, and a fully connected layer.
For language models, we employ BERT [35], which has been widely acknowledged to perform well in several downstream tasks. We make use of the pre-trained model “bert-base-multilingual-cased” provided by HuggingFace [29], which includes Portuguese as one of the languages on which the language model has been trained. Each complaint is tokenized using WordPiece tokenization. The maximum sequence length that the BERT model can process is 512 tokens. Consequently, we truncate the tokenized input sequence to 510 tokens, and add the special delimiter [CLS] (the initial token) and [SEP] (the end of sequence token), as expected for the BERT model. The resulting input sequence is fed to the BERT model, and the corresponding [CLS] token hidden representation is used as the semantic-level representation, as suggested by Devlin et al. [35]. On top of the BERT model, we add one fully-connected hidden layer with 768 neurons (as suggested by Sun et al. [36]), and a final softmax layer with 11 neurons (the number of classes). All layers (those in the BERT model and the fully connected layer) are fine-tuned for the task at hand. The model was trained on a single GPU GeForce RTX 2080 TI, for 10 epochs, with a batch size of 8. To avoid catastrophic forgetting, we apply a 1-cycle policy annealing (OCPA) [37] to the learning rate, similar to Sun et al. [36], with an initial learning rate of that was increased during the first epoch, reaching , and then reduced for 9 epochs.
Table 22 presents the results obtained for the different experiments described above. Compared to the results reported in Section 5.1.1, we observe that the models that are based on word embeddings perform worse. On the other hand, the BERT-based model is able to obtain a slight improvement in both accuracy and macro-F1, lower than .
9. Discussion
This paper reports on the use of different NLP techniques to address a real-world complex problem, related to the automatic processing and classification of complaints written in Portuguese. We have discussed, evaluated, and analyzed different preprocessing, representation, and classification models, as per Figure 1.
Some of the main findings relate to the limitations of NLP tools for lesser-resourced languages. As noticed in the feature analysis carried out in this research, both lemmatizers and stemmers alike leave room for improvement, and hamper the performance of classification algorithms (namely SVM) when using word-level features. As performant they may be on benchmark datasets [23], NLP tools are always dependent on the data on which they have been trained, in particular for neural-based approaches such as Stanza.
One thing to do is to train such models on domain data, assuming we have enough of it. The FastText approach reported in Section 8 goes in that direction, although the obtained results have fallen back. Using embeddings trained for the same language is also a sensible approach. However, our attempt to exploit Portuguese Word2Vec embeddings did not succeed, perhaps due to genre shift (although the embeddings used have been trained with more than 1 billion tokens, complaint-like data does not seem to be included).
Not surprisingly, fine-tuning BERT to our task makes a quick jump to scores in line with the best ones obtained with feature-based techniques. Nevertheless, the amount of data available does not bring significant improvements, beating the best SVM model by a small margin. Still, this is accomplished without the need for any preprocessing, which is in line with the findings of Maslej-Krešňáková et al. [38]. Despite the fact that there exist BERT models for (Brazilian) Portuguese [39], we leave for future work evaluating if using such models brings significant improvements over the multilingual variant we have used. Training a BERT model from scratch is computationally expensive, and it is not likely that enough complaint-related data is available to include this particular genre in the training set. Our main concern in using neural models is the lack of explainability that one can extract, which is still an open debate [40,41,42]. Since feature-based explanations are more consolidated and well-established, we leave for future work exploring recent advances towards the explainability of Transformer-based models.
Given the broad set of topics covered in our dataset, we cannot employ domain-oriented feature engineering approaches, as is sometimes used in sentiment analysis in closed domains [43]. We did try out several ways to clean and reduce the vocabulary, including spell checking, synonym substitution, accentuation, and numerical data removal, and stemming. Our findings are non-conclusive as to the best approach both in terms of performance and feature analysis. However, a combination of spell checking and numerical data removal seems to be the most sensible approach to produce a model that can be used in the real world. Based on this observation, we can further fine-tune the model to our needs.
Looking deeper into the classification problems addressed, we note that many of the most salient features identified for economic activity prediction are entities, in some of the classes (class V in particular). These entities concern, in most cases, economic operators that can be easily associated with a specific economy sector. As such, and despite the fact that even in such cases the complaints that address these entities may concern different activities, a wise approach to tackle economic activity prediction may go through named entity recognition. Recognized entities can then be cross-referenced with ASAE’s database in order to try to unmistakably identify the targeted economic operator, and through that obtain its economic activity.
Addressing a multi-label classification problem as if it were single-label, for data scarceness reasons, has its perils. Our experience in approaching implied infraction detection as infraction severity prediction, although promising, brought additional challenges related to the fact that classes are less distinguishable. While infraction labels are groupable in different severity levels, being able to distinguish among those levels is hard. The workaround that we suggest is to tune classification thresholds to the needs of the target application in terms of precision/recall desired for each of the classes.
Techniques to deal with imbalanced datasets (including over/under-sampling, cost-sensitive learning, or data augmentation) are ways to improve the performance of classifiers. While we did not progress much in these lines, preliminary experiments did not succeed when using over/under sampling [4].
Finally, a note on the feasibility of automated complaint classification when handling real-world data. Besides being imbalanced regarding all addressed classification tasks, ASAE’s complaint data is also significantly noisy. More than including misclassified examples (which is a general problem in many datasets), noise is mainly originated from certain complaints not including in themselves the information used by the human operator to classify them: in some cases, they simply refer back to a previous complaint, which is not traceable by automated means; in other cases, it is clear that the human has made use of additional knowledge to decide on the obtained label. These problems make automatic complaint processing even more challenging.
10. Conclusions
Dealing with real-world complex NLP tasks is challenging, and even more so when addressing natural languages for which the available NLP tools are not mature enough. While recent advances in neural language models show promising results in many benchmarks, getting the most out of them in real-world problems brings significant challenges. On one hand, real-world data is not as clean as many curated datasets. On the other hand, putting these models to work in production settings as decision support tools raises concerns about the explainability of the models. Given the practical nature of our research and the aim of employing these models in a production environment for assistive decision making, we contend that the SVM-based models are competitive enough to make it through. This empirical finding is one of the main contributions of this work.
By addressing a set of complex NLP classification tasks from user-generated data that is full of peculiarities, we have studied what current tools can do for noisy text written in Portuguese. We have motivated our choices in modeling the problem and believe our findings will be useful for those addressing tasks or datasets with similar challenges.
Author Contributions
H.L.-C. and G.R. have worked on the conceptualization and methodological approach for the work; T.F.O. and L.V.B. have worked on data curation and on the implementation of the software, including the application of NLP and machine learning models; J.P.M. and A.M.O. have supplied the data and assisted the data curation process; L.P.R. is responsible for the project administration and has supervised the work; every author has participated in the writing or final editing of the paper. All authors have read and agreed to the published version of the manuscript.
Funding
This work is supported by project IA.SAE, funded by Fundação para a Ciência e a Tecnologia (FCT) through program INCoDe.2030. Gil Rocha is supported by a PhD scholarship from FCT (SFRH/BD/140125/2018). This research is supported by LIACC (FCT/UID/CEC/0027/2020).
Institutional Review Board Statement
Not applicable.
Informed Consent Statement
Not applicable.
Data Availability Statement
Not applicable.
Conflicts of Interest
The authors declare no conflict of interest.
References
- Eggers, W.D.; Malik, N.; Gracie, M. Using AI to Unleash the Power of Unstructured Government Data. Deloitte Insights 2019. Available online: https://www2.deloitte.com/us/en/insights/focus/cognitive-technologies/natural-language-processing-examples-in-government-data.html (accessed on 13 December 2021).
- Kowalski, R.; Esteve, M.; Mikhaylov, S.J. Application of Natural Language Processing to Determine User Satisfaction in Public Services. CoRR 2017, arXiv:1711.08083. [Google Scholar]
- Momeni, E.; Cardie, C.; Diakopoulos, N. A Survey on Assessment and Ranking Methodologies for User-Generated Content on the Web. ACM Comput. Surv. 2015, 48, 41:1–41:49. [Google Scholar] [CrossRef]
- Barbosa, L.; Filgueiras, J.; Rocha, G.; Lopes Cardoso, H.; Reis, L.P.; Machado, J.P.; Caldeira, A.C.; Oliveira, A.M. Automatic Identification of Economic Activities in Complaints. In Statistical Language and Speech Processing, 7th International Conference, SLSP 2019, Ljubljana, Slovenia, 14–16 October 2019; Springer: Berlin/Heidelberg, Germany, 2019; Volume 11816, pp. 249–260. [Google Scholar]
- Filgueiras, J.; Barbosa, L.; Rocha, G.; Lopes Cardoso, H.; Reis, L.P.; Machado, J.P.; Oliveira, A.M. Complaint Analysis and Classification for Economic and Food Safety. In Proceedings of the Second Workshop on Economics and Natural Language Processing; Association for Computational Linguistics: Hong Kong, China, 2019; pp. 51–60. [Google Scholar] [CrossRef] [Green Version]
- Batrinca, B.; Treleaven, P.C. Social media analytics: A survey of techniques, tools and platforms. AI Soc. 2015, 30, 89–116. [Google Scholar] [CrossRef] [Green Version]
- Petz, G.; Karpowicz, M.; Fürschuß, H.; Auinger, A.; Stříteský, V.; Holzinger, A. Opinion Mining on the Web 2.0—Characteristics of User Generated Content and Their Impacts. In Human-Computer Interaction and Knowledge Discovery in Complex, Unstructured, Big Data; Springer: Berlin/Heidelberg, Germany, 2013; pp. 35–46. [Google Scholar]
- Diaz, G.O.; Ng, V. Modeling and Prediction of Online Product Review Helpfulness: A Survey. In Proceedings of the 56th Annual Meeting of the Association for Computational Linguistics, Melbourne, Australia, 15–20 July 2018; pp. 698–708. [Google Scholar]
- Forte, A.C.; Brazdil, P.B. Determining the Level of Clients’ Dissatisfaction from Their Commentaries. In Proceedings of the Computational Processing of the Portuguese Language—12th International Conference PROPOR, Tomar, Portugal, 13–15 July 2016; Lecture Notes in Computer Science. Springer: Berlin/Heidelberg, Germany, 2016; Volume 9727, pp. 74–85. [Google Scholar]
- Liu, C.H.; Moriya, Y.; Poncelas, A.; Groves, D. IJCNLP-2017 Task 4: Customer Feedback Analysis. In Proceedings of the IJCNLP, Taipei, Taiwan, 27 November–1 December 2017; Asian Federation of Natural Language Processing: Taipei, Taiwan, 2017; pp. 26–33. [Google Scholar]
- Liu, C.; Groves, D.; Akira, H.; Poncelas, A.; Liu, Q. Understanding Meanings in Multilingual Customer Feedback. arXiv 2018, arXiv:1806.01694. [Google Scholar]
- Plank, B. All-In-1 at IJCNLP-2017 Task 4: Short Text Classification with One Model for All Languages. In Proceedings of the IJCNLP, Taipei, Taiwan, 27 November–1 December 2017; Asian Federation of Natural Language Processing: Taipei, Taiwan, 2017; pp. 143–148. [Google Scholar]
- Wang, N.; Wang, J.; Zhang, X. YNU-HPCC at IJCNLP-2017 Task 4: Attention-based Bi-directional GRU Model for Customer Feedback Analysis Task of English. In Proceedings of the IJCNLP, Taipei, Taiwan, 27 November–1 December 2017; Asian Federation of Natural Language Processing: Taipei, Taiwan, 2017; pp. 174–179. [Google Scholar]
- Ordenes, F.V.; Theodoulidis, B.; Burton, J.; Gruber, T.; Zaki, M. Analyzing Customer Experience Feedback Using Text Mining: A Linguistics-Based Approach. J. Serv. Res. 2014, 17, 278–295. [Google Scholar] [CrossRef] [Green Version]
- Dong, S.; Wang, Z. Evaluating service quality in insurance customer complaint handling throught text categorization. In Proceedings of the 2015 International Conference on Logistics, Informatics and Service Sciences (LISS), Barcelona, Brazil, 27–29 July 2015; pp. 1–5. [Google Scholar]
- Mikolov, T.; Sutskever, I.; Chen, K.; Corrado, G.; Dean, J. Distributed Representations of Words and Phrases and Their Compositionality. In Proceedings of the 26th International Conference on Neural Information Processing Systems—Volume 2, Lake Tahoe, NV, USA, 5–10 December 2013; Curran Associates Inc.: Red Hook, NY, USA, 2013; pp. 3111–3119. [Google Scholar]
- Elman, J.L. Finding Structure in Time. Cogn. Sci. 1990, 14, 179–211. [Google Scholar] [CrossRef]
- Assawinjaipetch, P.; Shirai, K.; Sornlertlamvanich, V.; Marukata, S. Recurrent Neural Network with Word Embedding for Complaint Classification. In Proceedings of the Third International Workshop on Worldwide Language Service Infrastructure and Second Workshop on Open Infrastructures and Analysis Frameworks for Human Language Technologies (WLSI/OIAF4HLT2016); The COLING 2016 Organizing Committee: Osaka, Japan, 2016; pp. 36–43. [Google Scholar]
- Li, H. Learning to Rank for Information Retrieval and Natural Language Processing, 2nd ed.; Synthesis Lectures on Human Language Technologies, Morgan & Claypool Publ.: San Rafael, CA, USA, 2014. [Google Scholar]
- Fauzan, A.; Khodra, M.L. Automatic Multilabel Categorization using Learning to Rank Framework for Complaint Text on Bandung Government. In Proceedings of the 2014 International Conference of Advanced Informatics: Concept, Theory and Application (ICAICTA), Institut Teknologi Bandung, Bandung, Indonesia, 20–21 August 2014; pp. 28–33. [Google Scholar]
- Kalyoncu, F.; Zeydan, E.; Yigit, I.O.; Yildirim, A. A Customer Complaint Analysis Tool for Mobile Network Operators. In Proceedings of the 2018 IEEE/ACM Int. Conf. on Advances in Social Networks Analysis and Mining (ASONAM), Barcelona, Spain, 28–31 August 2018; pp. 609–612. [Google Scholar]
- Blei, D.M.; Ng, A.Y.; Jordan, M.I. Latent Dirichlet Allocation. J. Mach. Learn. Res. 2003, 3, 993–1022. [Google Scholar]
- Qi, P.; Zhang, Y.; Zhang, Y.; Bolton, J.; Manning, C.D. Stanza: A Python Natural Language Processing Toolkit for Many Human Languages. In Proceedings of the 58th Annual Meeting of the Association for Computational Linguistics: System Demonstrations, Online, 5–10 July 2020. [Google Scholar]
- Buitinck, L.; Louppe, G.; Blondel, M.; Pedregosa, F.; Mueller, A.; Grisel, O.; Niculae, V.; Prettenhofer, P.; Gramfort, A.; Grobler, J.; et al. API design for machine learning software: Experiences from the scikit-learn project. In Proceedings of the ECML PKDD Workshop: Languages for Data Mining and Machine Learning, Prague, Czech Republic, 23–27 September 2013; pp. 108–122. [Google Scholar]
- Guyon, I.; Elisseeff, A. An Introduction to Variable and Feature Selection. J. Mach. Learn. Res. 2003, 3, 1157–1182. [Google Scholar]
- Gonçalo Oliveira, H. CONTO.PT: Groundwork for the Automatic Creation of a Fuzzy Portuguese Wordnet. In Computational Processing of the Portuguese Language; Silva, J., Ribeiro, R., Quaresma, P., Adami, A., Branco, A., Eds.; Springer International Publishing: Cham, Switzerland, 2016; pp. 283–295. [Google Scholar]
- Wu, Y.; Schuster, M.; Chen, Z.; Le, Q.V.; Norouzi, M.; Macherey, W.; Krikun, M.; Cao, Y.; Gao, Q.; Macherey, K.; et al. Google’s Neural Machine Translation System: Bridging the Gap between Human and Machine Translation. arXiv 2016, arXiv:1609.08144. [Google Scholar]
- Chung, J.; Cho, K.; Bengio, Y. A Character-level Decoder without Explicit Segmentation for Neural Machine Translation. In Proceedings of the 54th Annual Meeting of the Association for Computational Linguistics (Volume 1: Long Papers); Association for Computational Linguistics: Berlin, Germany, 2016; pp. 1693–1703. [Google Scholar] [CrossRef]
- Wolf, T.; Debut, L.; Sanh, V.; Chaumond, J.; Delangue, C.; Moi, A.; Cistac, P.; Rault, T.; Louf, R.; Funtowicz, M.; et al. HuggingFace’s Transformers: State-of-the-art Natural Language Processing. arXiv 2019, arXiv:1910.03771. [Google Scholar]
- Conneau, A.; Lample, G. Cross-lingual Language Model Pretraining. In Advances in Neural Information Processing Systems; Wallach, H., Larochelle, H., Beygelzimer, A., d’Alché Buc, F., Fox, E., Garnett, R., Eds.; Curran Associates, Inc.: Red Hook, NY, USA, 2019; Volume 32, pp. 7059–7069. [Google Scholar]
- Mikolov, T.; Chen, K.; Corrado, G.; Dean, J. Efficient estimation of word representations in vector space. In Proceedings of the 1st International Conference on Learning Representations, ICLR 2013—Workshop Track Proceedings, Scottsdale, AZ, USA, 2–4 May 2013; pp. 1–12. [Google Scholar]
- Kim, Y. Convolutional neural networks for sentence classification. In Proceedings of the EMNLP 2014—2014 Conference on Empirical Methods in Natural Language Processing, Doha, Qatar, 25–29 October 2014; pp. 1746–1751. [Google Scholar] [CrossRef] [Green Version]
- Joulin, A.; Grave, E.; Bojanowski, P.; Mikolov, T. Bag of tricks for efficient text classification. In Proceedings of the 15th Conference of the European Chapter of the Association for Computational Linguistics, EACL 2017, Valencia, Spain, 3–7 April 2017; Volume 2, pp. 427–431. [Google Scholar] [CrossRef]
- Hartmann, N.; Fonseca, E.; Shulby, C.; Treviso, M.; Rodrigues, J.; Aluisio, S. Portuguese Word Embeddings: Evaluating on Word Analogies and Natural Language Tasks. arXiv 2017, arXiv:1708.06025. [Google Scholar]
- Devlin, J.; Chang, M.W.; Lee, K.; Toutanova, K. BERT: Pre-training of Deep Bidirectional Transformers for Language Understanding. In Proceedings of the 2019 Conference of the North American Chapter of the Association for Computational Linguistics: Human Language Technologies, Volume 1 (Long and Short Papers); Association for Computational Linguistics: Minneapolis, MN, USA, 2019; pp. 4171–4186. [Google Scholar] [CrossRef]
- Sun, C.; Qiu, X.; Xu, Y.; Huang, X. How to Fine-Tune BERT for Text Classification? In Lecture Notes in Computer Science (Including Subseries Lecture Notes in Artificial Intelligence and Lecture Notes in Bioinformatics); Springer: Cham, Switzerland, 2019; Volume 11856 LNAI, pp. 194–206. [Google Scholar] [CrossRef] [Green Version]
- Smith, L.N.; Topin, N. Super-convergence: Very fast training of neural networks using large learning rates. In Artificial Intelligence and Machine Learning for Multi-Domain Operations Applications; Pham, T., Ed.; SPIE: Philadelphia, PA, USA, 2019; p. 36. [Google Scholar] [CrossRef] [Green Version]
- Maslej-Krešňáková, V.; Sarnovský, M.; Butka, P.; Machová, K. Comparison of Deep Learning Models and Various Text Pre-Processing Techniques for the Toxic Comments Classification. Appl. Sci. 2020, 10, 8631. [Google Scholar] [CrossRef]
- Souza, F.; Nogueira, R.; Lotufo, R. BERTimbau: Pretrained BERT Models for Brazilian Portuguese. In Intelligent Systems; Cerri, R., Prati, R.C., Eds.; Springer International Publishing: Cham, Switzerland, 2020; pp. 403–417. [Google Scholar]
- Jain, S.; Wallace, B.C. Attention is not Explanation. In Proceedings of the 2019 Conference of the North American Chapter of the Association for Computational Linguistics: Human Language Technologies, Volume 1 (Long and Short Papers); Association for Computational Linguistics: Minneapolis, MN, USA, 2019; pp. 3543–3556. [Google Scholar] [CrossRef]
- Wiegreffe, S.; Pinter, Y. Attention is not not Explanation. In Proceedings of the 2019 Conference on Empirical Methods in Natural Language Processing and the 9th International Joint Conference on Natural Language Processing (EMNLP-IJCNLP); Association for Computational Linguistics: Hong Kong, China, 2019; pp. 11–20. [Google Scholar] [CrossRef] [Green Version]
- Han, X.; Wallace, B.C.; Tsvetkov, Y. Explaining Black Box Predictions and Unveiling Data Artifacts through Influence Functions. In Proceedings of the 58th Annual Meeting of the Association for Computational Linguistics, ACL 2020, Online, 5–10 July 2020; Jurafsky, D., Chai, J., Schluter, N., Tetreault, J.R., Eds.; Association for Computational Linguistics: Hong Kong, China, 2020; pp. 5553–5563. [Google Scholar] [CrossRef]
- Haddi, E.; Liu, X.; Shi, Y. The Role of Text Pre-processing in Sentiment Analysis. Procedia Comput. Sci. 2013, 17, 26–32. [Google Scholar] [CrossRef] [Green Version]
Figure 1.
Roadmap.

Figure 2.
ROC curve for infraction severity prediction using SVM (3-class setting).
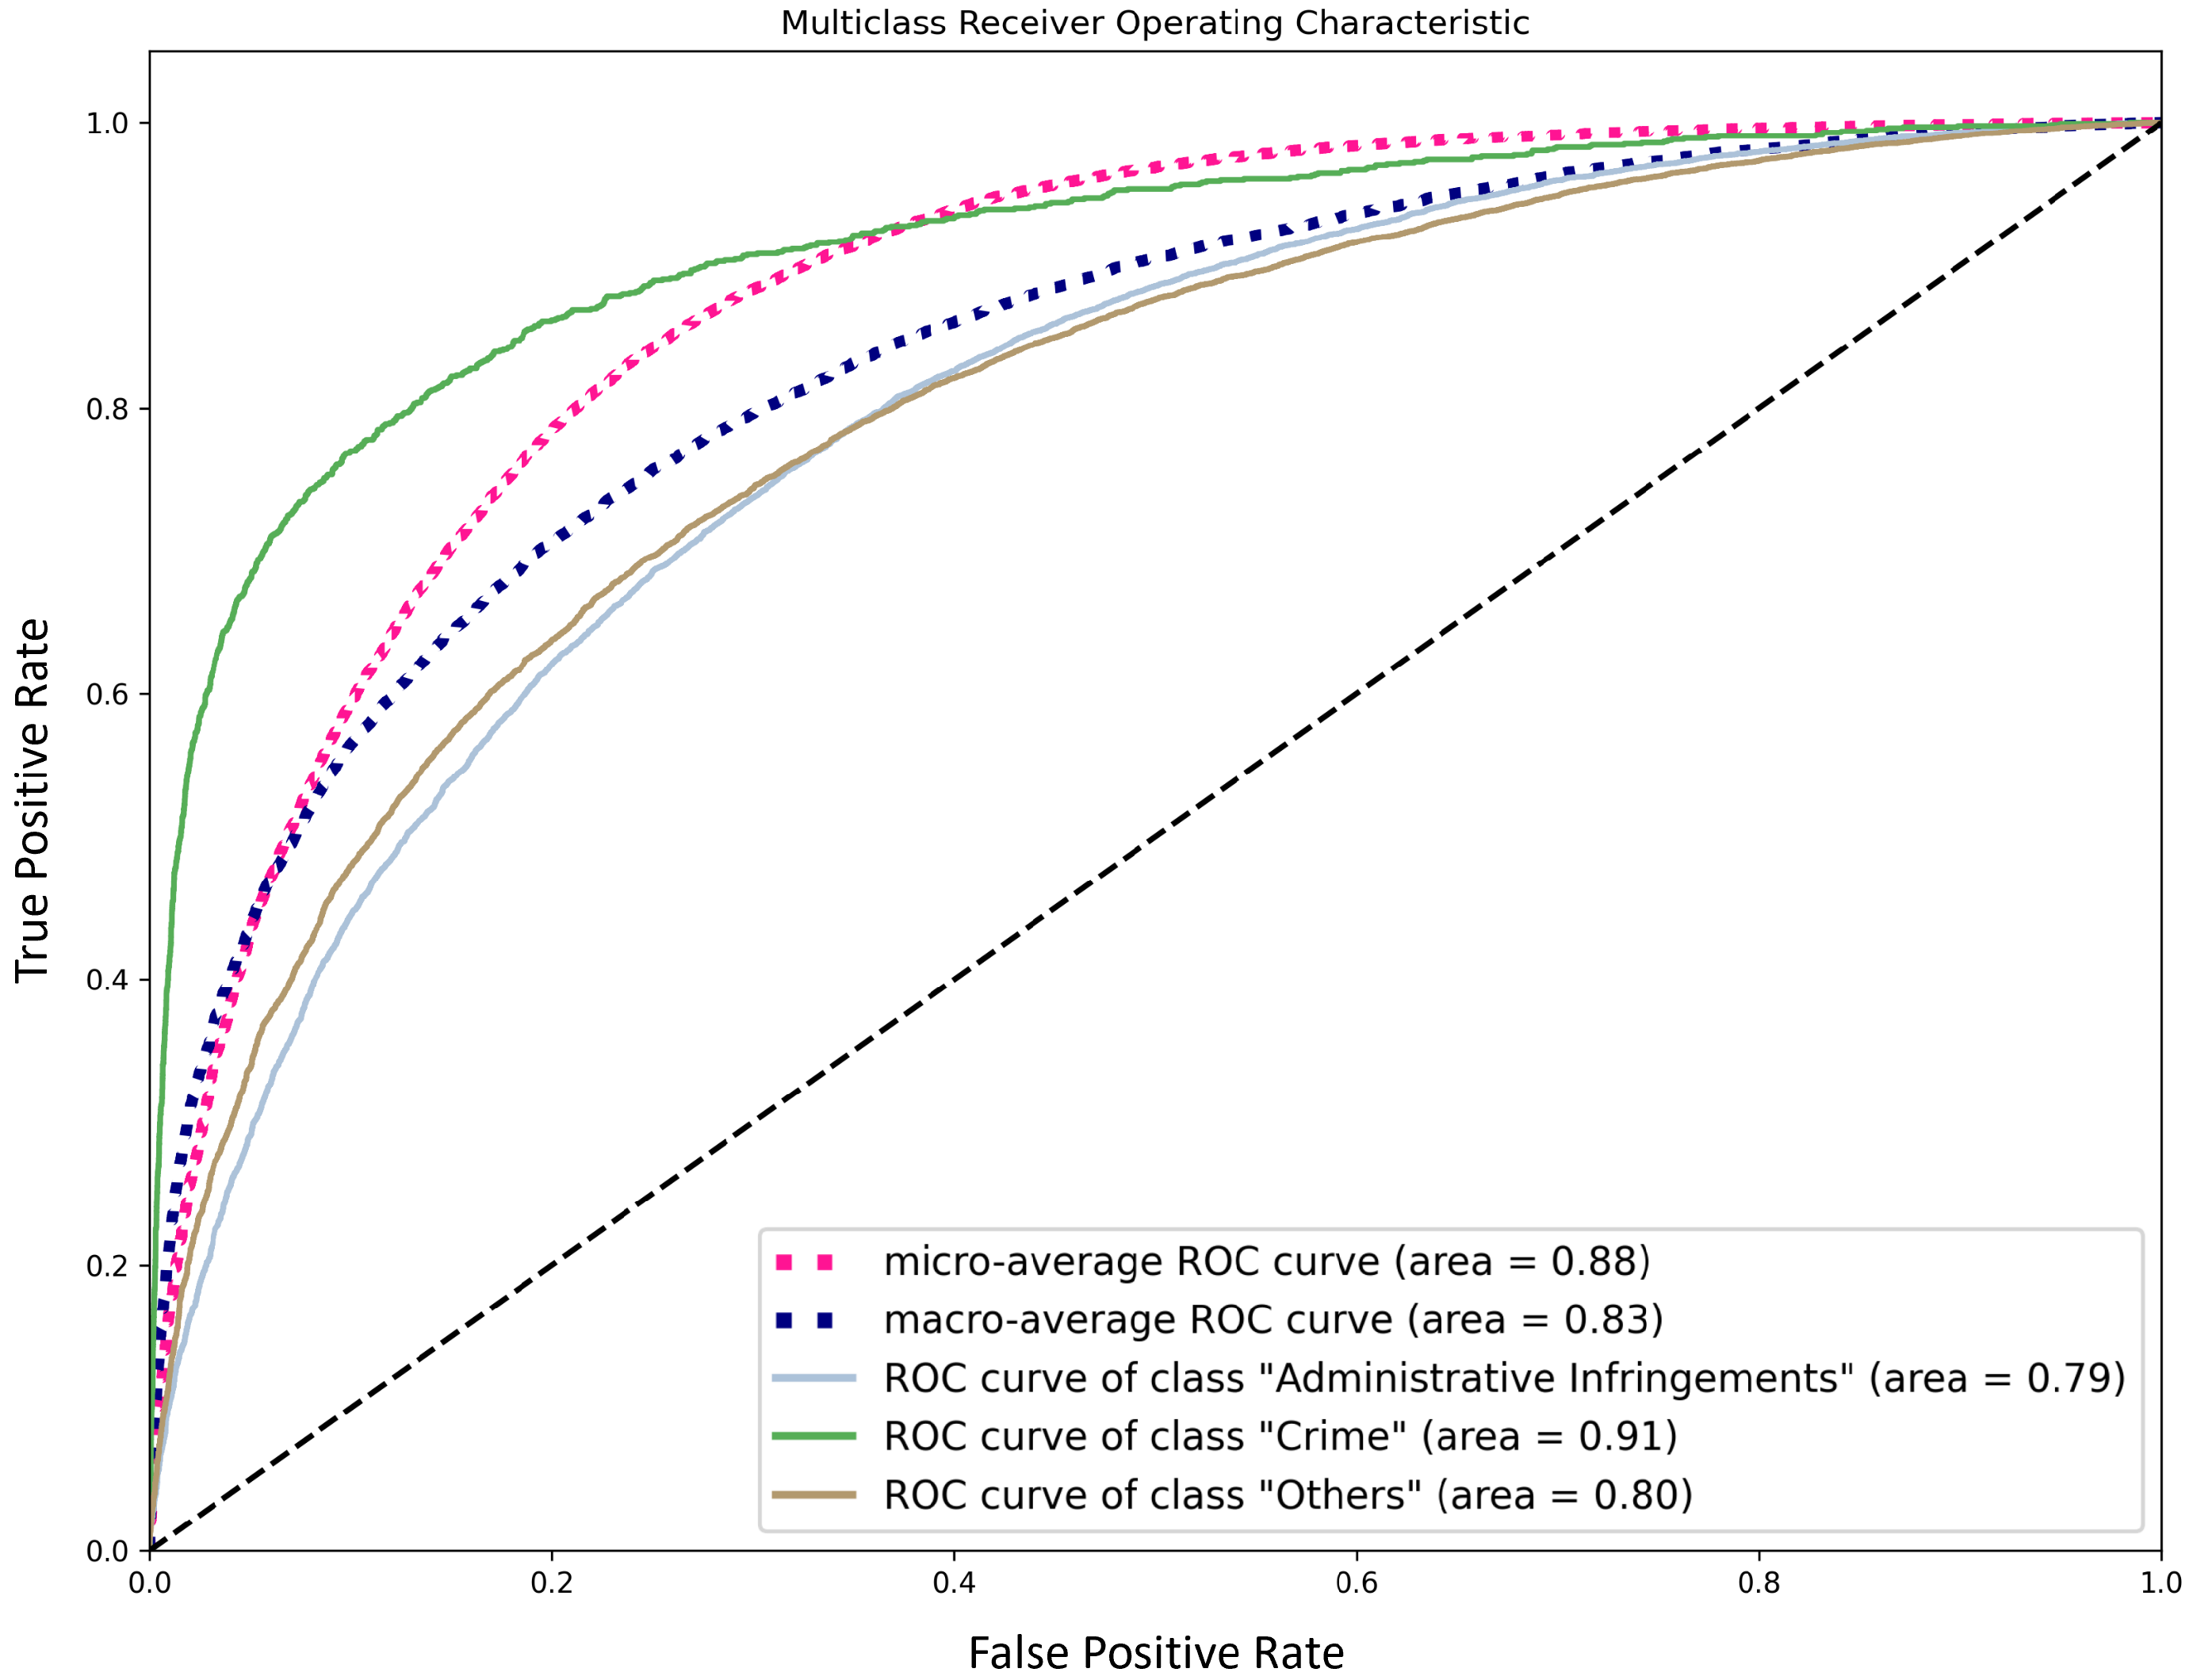
Figure 3.
ROC curve for infraction severity prediction using SVM (2-class setting).

Figure 4.
ROC curve for competence prediction using SVM.

Table 1.
Economic activity class hierarchy and distribution.
| Class | Subclasses | # compl | % | ||
|---|---|---|---|---|---|
| Food | I—Primary production | 7 | 571 | 0.39 | |
| II—Industry | 26 | 4212 | 2.87 | ||
| III—Restauration | 4 | 47,090 | 32.07 | ||
| IV—Wholesalers | 4 | 631 | 0.43 | ||
| V—Retail | 23 | 13,902 | 9.47 | ||
| VI—Direct selling | 1 | 27 | 0.02 | ||
| VII—Distance selling | 1 | 4760 | 3.24 | ||
| Economic | Production | VIII—Production & trade | 69 | 14,232 | 9.69 |
| IX—Service providers | 85 | 35,734 | 24.33 | ||
| Safety | X—Safety & environment | 62 | 1904 | 1.30 | |
| Z—No activity identified | N/A | 23,755 | 16.18 | ||
| Total | 282 | 146,818 | 100.00 | ||
Table 2.
Infraction severity class distribution.
| Class | # compl | % |
|---|---|---|
| Crime | 8082 | 5.36 |
| Admin. infringements | 69,002 | 45.80 |
| Others | 73,585 | 48.84 |
| Total | 150,669 | 100.00 |
Table 3.
Competence class distribution (binary setting).
| Class | # compl | % |
|---|---|---|
| ASAE (among others) | 94,123 | 62.47 |
| Other | 56,546 | 37.53 |
| Total | 150,669 | 100.00 |
Table 4.
Results obtained using the base techniques for economic activity prediction.
| Classifier | Acc@1 | Acc@2 | Acc@3 | F1@1 | F1@2 | F1@3 |
|---|---|---|---|---|---|---|
| Random (stratified) | 0.2054 | 0.2835 | 0.3626 | 0.0916 | 0.1704 | 0.2513 |
| SVM | 0.7465 | 0.8753 | 0.9297 | 0.5640 | 0.7097 | 0.7826 |
| SGD | 0.7104 | 0.8723 | 0.9381 | 0.4855 | 0.6668 | 0.7532 |
| Random Forest | 0.6416 | 0.8012 | 0.8915 | 0.3812 | 0.5133 | 0.5966 |
| Random Forest (1-vs-rest) | 0.6818 | 0.8346 | 0.9132 | 0.4606 | 0.6088 | 0.6875 |
Table 5.
Economic activity prediction confusion matrix using SVM (top-1).
| Predicted | ||||||||||||
|---|---|---|---|---|---|---|---|---|---|---|---|---|
| I | II | III | IV | V | VI | VII | VIII | IX | X | Z | ||
| Actual | I | 41 | 7 | 6 | 0 | 9 | 0 | 0 | 3 | 5 | 1 | 16 |
| II | 0 | 371 | 145 | 3 | 54 | 0 | 4 | 17 | 32 | 0 | 76 | |
| III | 0 | 63 | 7052 | 0 | 86 | 0 | 5 | 41 | 205 | 6 | 200 | |
| IV | 0 | 15 | 18 | 24 | 11 | 0 | 0 | 6 | 9 | 0 | 24 | |
| V | 0 | 26 | 162 | 3 | 1805 | 0 | 11 | 58 | 70 | 0 | 120 | |
| VI | 0 | 0 | 0 | 0 | 0 | 0 | 0 | 1 | 0 | 0 | 0 | |
| VII | 0 | 0 | 12 | 0 | 7 | 0 | 838 | 60 | 124 | 0 | 115 | |
| VIII | 2 | 8 | 141 | 2 | 46 | 0 | 49 | 1495 | 263 | 8 | 261 | |
| IX | 1 | 10 | 389 | 4 | 41 | 0 | 58 | 175 | 4840 | 5 | 405 | |
| X | 0 | 2 | 21 | 2 | 9 | 0 | 7 | 66 | 84 | 113 | 62 | |
| Z | 11 | 71 | 537 | 7 | 173 | 0 | 99 | 363 | 830 | 24 | 1306 | |
Table 6.
Economic activity prediction precision and recall per class (top-1).
| Class | Precision | Recall | F1 |
|---|---|---|---|
| I | 0.75 | 0.47 | 0.58 |
| II | 0.65 | 0.53 | 0.58 |
| III | 0.83 | 0.92 | 0.87 |
| IV | 0.53 | 0.22 | 0.31 |
| V | 0.81 | 0.80 | 0.80 |
| VI | — | 0.00 | — |
| VII | 0.78 | 0.72 | 0.75 |
| VIII | 0.65 | 0.66 | 0.65 |
| IX | 0.75 | 0.82 | 0.78 |
| X | 0.72 | 0.31 | 0.43 |
| Z | 0.51 | 0.38 | 0.44 |
Table 7.
Results obtained using the base techniques for infraction severity prediction.
| Classifier | Acc | Macro-F1 |
|---|---|---|
| Random (stratified) | 0.4481 | 0.3321 |
| SVM | 0.7016 | 0.6542 |
| SGD | 0.7056 | 0.5795 |
| Random Forest | 0.6927 | 0.5542 |
| Random Forest (1-vs-rest) | 0.6925 | 0.5756 |
Table 8.
Infraction severity prediction confusion matrix using SVM.
| Predicted | ||||
|---|---|---|---|---|
| Crime | Adm. infr. | Others | ||
| Actual | Crime | 566 | 397 | 302 |
| Adm. infr. | 100 | 8312 | 3143 | |
| Others | 145 | 3061 | 7931 | |
Table 9.
Results obtained using the base techniques for competence prediction.
| Classifier | Acc | Macro-F1 |
|---|---|---|
| Random (stratified) | 0.5355 | 0.5076 |
| SVM | 0.7885 | 0.7748 |
| SGD | 0.7629 | 0.7339 |
| Random Forest | 0.7588 | 0.7222 |
Table 10.
Competence prediction confusion matrix using SVM.
| Predicted | |||
|---|---|---|---|
| ASAE | Other | ||
| Actual | ASAE | 12,407 | 2244 |
| Other | 2822 | 6484 | |
Table 11.
Top-10 features for economic activity prediction using the base techniques with SVM.
| I—Primary Production | vacaria, aviário, mel, suinicultura, exploração, aviario, pecuária, , texto, criação |
| II—Industry | padaria, panificadora, panificação, catering, queijaria, matadouro, panificaçao, fábrica, abate, lagar |
| III—Restauration | restaurante, café, pastelaria, bar, cafe, churrasqueira, discoteca, , tasca, taberna |
| IV—Wholesalers | abastecedor, armazém, alimentar, armazem, entreposto, , lota, alimentares, licoroso, viande |
| V—Retail | , talho, supermercado, frutaria, mercearia, minimercado, , , , |
| VI—Direct selling | , , descascadas, , , , manita, hijiene, natividade, |
| VII—Distance selling | , online, , site, fashion, , , website, , |
| VIII—Production & Trade | papelaria, quiosque, farmácia, tabacaria, livraria, stand, sucata, drogaria, sapataria, editora |
| IX—Service Providers | cabeleireiro, oficina, alojamento, barbearia, lavandaria, hotel, hostel, carpintaria, ginásio, cabeleireira |
| X—Safety & Environment | infantil, pedreira, circo, aquático, smartshop, solário, carrossel, escorrega, materiais, piscina |
| Z—No activity identified | , mortal, , , , , , , , |
Table 12.
Top-10 features for infraction severity prediction using the base techniques with SVM.
| Crime | contrafeito, jogo, contrafacção, contrafação, abate, falsificar, poker, piratear, intoxicação, |
| Admin. infringements | livro, higiene, alojamento, condiçoes, infantil, , significativo, conveniente, , zinco |
| Others | , , , , , , , , , |
Table 13.
Top-10 features for competence prediction using the base techniques with SVM.
| ASAE | higiene, livro, contrafeito, fumar, licença, cozinha, inpi, , alimento, barata |
Table 14.
Results obtained with further feature engineering, using SVM. (BT = Base techniques; SC = Spell checking; SS = Synonym substitution; RA = Removal of accentuation; ND = Numerical data removal; St = Stemming).
Table 14.
Results obtained with further feature engineering, using SVM. (BT = Base techniques; SC = Spell checking; SS = Synonym substitution; RA = Removal of accentuation; ND = Numerical data removal; St = Stemming).
| Task | Experiment | Acc | Macro-F1 |
|---|---|---|---|
| Economic activity | BT | 0.7465 | 0.5640 |
| BT + SC | 0.7346 | 0.5525 | |
| BT + SC + SS | 0.7229 | 0.5358 | |
| BT + SC + RA | 0.7337 | 0.5512 | |
| BT + SC + ND | 0.7281 | 0.5436 | |
| BT + SC + ND + St | 0.7177 | 0.5251 | |
| Infraction severity | BT | 0.7016 | 0.6542 |
| BT + SC | 0.6983 | 0.6447 | |
| BT + SC + SS | 0.6930 | 0.6243 | |
| BT + SC + RA | 0.6988 | 0.6436 | |
| BT + SC + ND | 0.6997 | 0.6466 | |
| BT + SC + ND + St | 0.6972 | 0.6360 | |
| Competence | BT | 0.7885 | 0.7748 |
| BT + SC | 0.7798 | 0.7656 | |
| BT + SC + SS | 0.7731 | 0.7583 | |
| BT + SC + RA | 0.7796 | 0.7655 | |
| BT + SC + ND | 0.7784 | 0.7643 | |
| BT + SC + ND + St | 0.7739 | 0.7597 |
Table 15.
Top-10 features for economic activity prediction using spell checking with SVM.
| I—Primary Production | aviário, vacaria, mel, suinicultura, exploração, criação, pecuário, pecuária, apicultor, texto |
| II—Industry | nadaria, padaria, danificadora, panificação, panificadora, catering, danificação, queijaria, matadouro, azeite |
| III—Restauration | restaurante, café, pastelaria, bar, discoteca, churrasqueira, , rafe, taberna, rasca |
| IV—Wholesalers | abastecedor, armazém, alimentar, entreposto, lota, alimentares, divertimento, vinde, armazenamento, licoroso |
Table 16.
Top-10 features for economic activity prediction using numerical data removal with SVM.
| Z—No activity identified | mortal, reiterado, , honorários, esotérico, identificador, chinesas, flicta, divorcio, casual |
Table 17.
Top-10 features for infraction prediction using numerical data removal with SVM.
| Others | gueixas, mortal, chinesas, córtice, , errata, complemento, duplicado, açucareiro, homero |
Table 18.
Top-10 features for economic activity prediction using stemming with SVM.
| I—Primary Production | aviári, vac, suinicultur, apicultor, viári, mel, criaçã, pecuári, explor, pecuár |
| II—Industry | panific, pad, catering, danific, nad, panificcoc, matadour, azeit, macabr, áustr |
| III—Restauration | restaur, caf, pastel, bar, discotec, churrasqueir, rasc, raf, tabern, petisqueir |
| IV—Wholesalers | abastecedor, armazém, aliment, entrepost, armazen, , fru, macr, queixasdenunc, câm |
Table 19.
Results obtained with subword tokenization for economic activity prediction, using SVM.
| Experiment | Acc | Macro-F1 |
|---|---|---|
| BertTokenizer | 0.7123 | 0.5241 |
| XLMTokenizer | 0.7117 | 0.5217 |
Table 20.
Top-10 features for economic activity prediction using BertTokenizer with SVM.
| I—Primary Production | aviá, ##caria, ##cu, criação, api, sui, ##ração, ##drome, ##iar, gers |
| II—Industry | pada, ##ering, pani, pan, ##bric, fábrica, abate, ##itaria, ##ificado, austria |
| III—Restauration | restaurant, café, restaurante, caf, ##fe, cafe, bar, chur, tas, past |
| IV—Wholesalers | alimentar, arma, ##cedo, arm, ##mentar, calendar, ##regado, pesca, realiza, lot |
Table 21.
Top-10 features for economic activity prediction using XLMTokenizer with SVM.
| I—Primary Production | mel</w>, vac, explor, avi, icul, criação</w>, ostra, cola</w>, ecu, pec |
| II—Industry | pad, ering</w>, ific, pan, fábrica</w>, fabri, brica</w>, ijos</w>, suí, kell |
| III—Restauration | café</w>, restaur, past, bar</w>, caf, chur, restaura, erna</w>, epiz, izz |
| IV—Wholesalers | maz, aliment, rac, ares</w>, import, carreg, diver, lic</w>, edor</w>, lot |
Table 22.
Results obtained using word embeddings.
| Experiment | Acc | Macro-F1 |
|---|---|---|
| SVM (from Table 14) | 0.7465 | 0.5640 |
| FastText model | 0.7046 | 0.5119 |
| Word2Vec + CNN | 0.6454 | 0.4669 |
| BERT | 0.7527 | 0.5718 |
Publisher’s Note: MDPI stays neutral with regard to jurisdictional claims in published maps and institutional affiliations. |
© 2021 by the authors. Licensee MDPI, Basel, Switzerland. This article is an open access article distributed under the terms and conditions of the Creative Commons Attribution (CC BY) license (https://creativecommons.org/licenses/by/4.0/).
Share and Cite
MDPI and ACS Style
Lopes-Cardoso, H.; Osório, T.F.; Barbosa, L.V.; Rocha, G.; Reis, L.P.; Machado, J.P.; Oliveira, A.M. Robust Complaint Processing in Portuguese. Information 2021, 12, 525. https://doi.org/10.3390/info12120525
AMA Style
Lopes-Cardoso H, Osório TF, Barbosa LV, Rocha G, Reis LP, Machado JP, Oliveira AM. Robust Complaint Processing in Portuguese. Information. 2021; 12(12):525. https://doi.org/10.3390/info12120525
Chicago/Turabian StyleLopes-Cardoso, Henrique, Tomás Freitas Osório, Luís Vilar Barbosa, Gil Rocha, Luís Paulo Reis, João Pedro Machado, and Ana Maria Oliveira. 2021. "Robust Complaint Processing in Portuguese" Information 12, no. 12: 525. https://doi.org/10.3390/info12120525
Note that from the first issue of 2016, this journal uses article numbers instead of page numbers. See further details here.