
Private Car O-D Flow Estimation Based on Automated Vehicle Monitoring Data: Theoretical Issues and Empirical Evidence


Abstract
1. Introduction
2. Literature Review on FCD Usage
2.1. Path Choice and Route Attribute Evaluation
2.2. O-D Demand Flow Estimation
3. Methodology
- Car trip detection: according to some predefined rules, this stage aims to detect the activity stops performed by each sampled vehicle; therefore, the individual trips (with origin and destination) undertaken by each surveyed vehicle can be obtained;
- Sample O-D matrices; according to study area zoning, the origin and destination of each sample vehicle trip is identified; then, through an aggregation procedure, the sampled O-D vehicle trips are then merged in order to obtain the daily (or timely) O-D matrix;
- Expansion to the universe of investigation; in this step, the sample daily (or timely) O-D matrices need to be expanded to the universe of observation in order to obtain the daily/timely-dependent vehicle O-D matrices of the study area. This step can be considered the core of the procedure, given that the statistical significance of the sample needs to be determined.
3.1. Car Trip Detection
3.2. Sample O-D Matrices
3.3. Expansion to the Universe of Investigation
- is the sample estimate of the variance of the variable :
- αk is the sampling rate in the k-th stratum.
4. Application to a Real Test Case
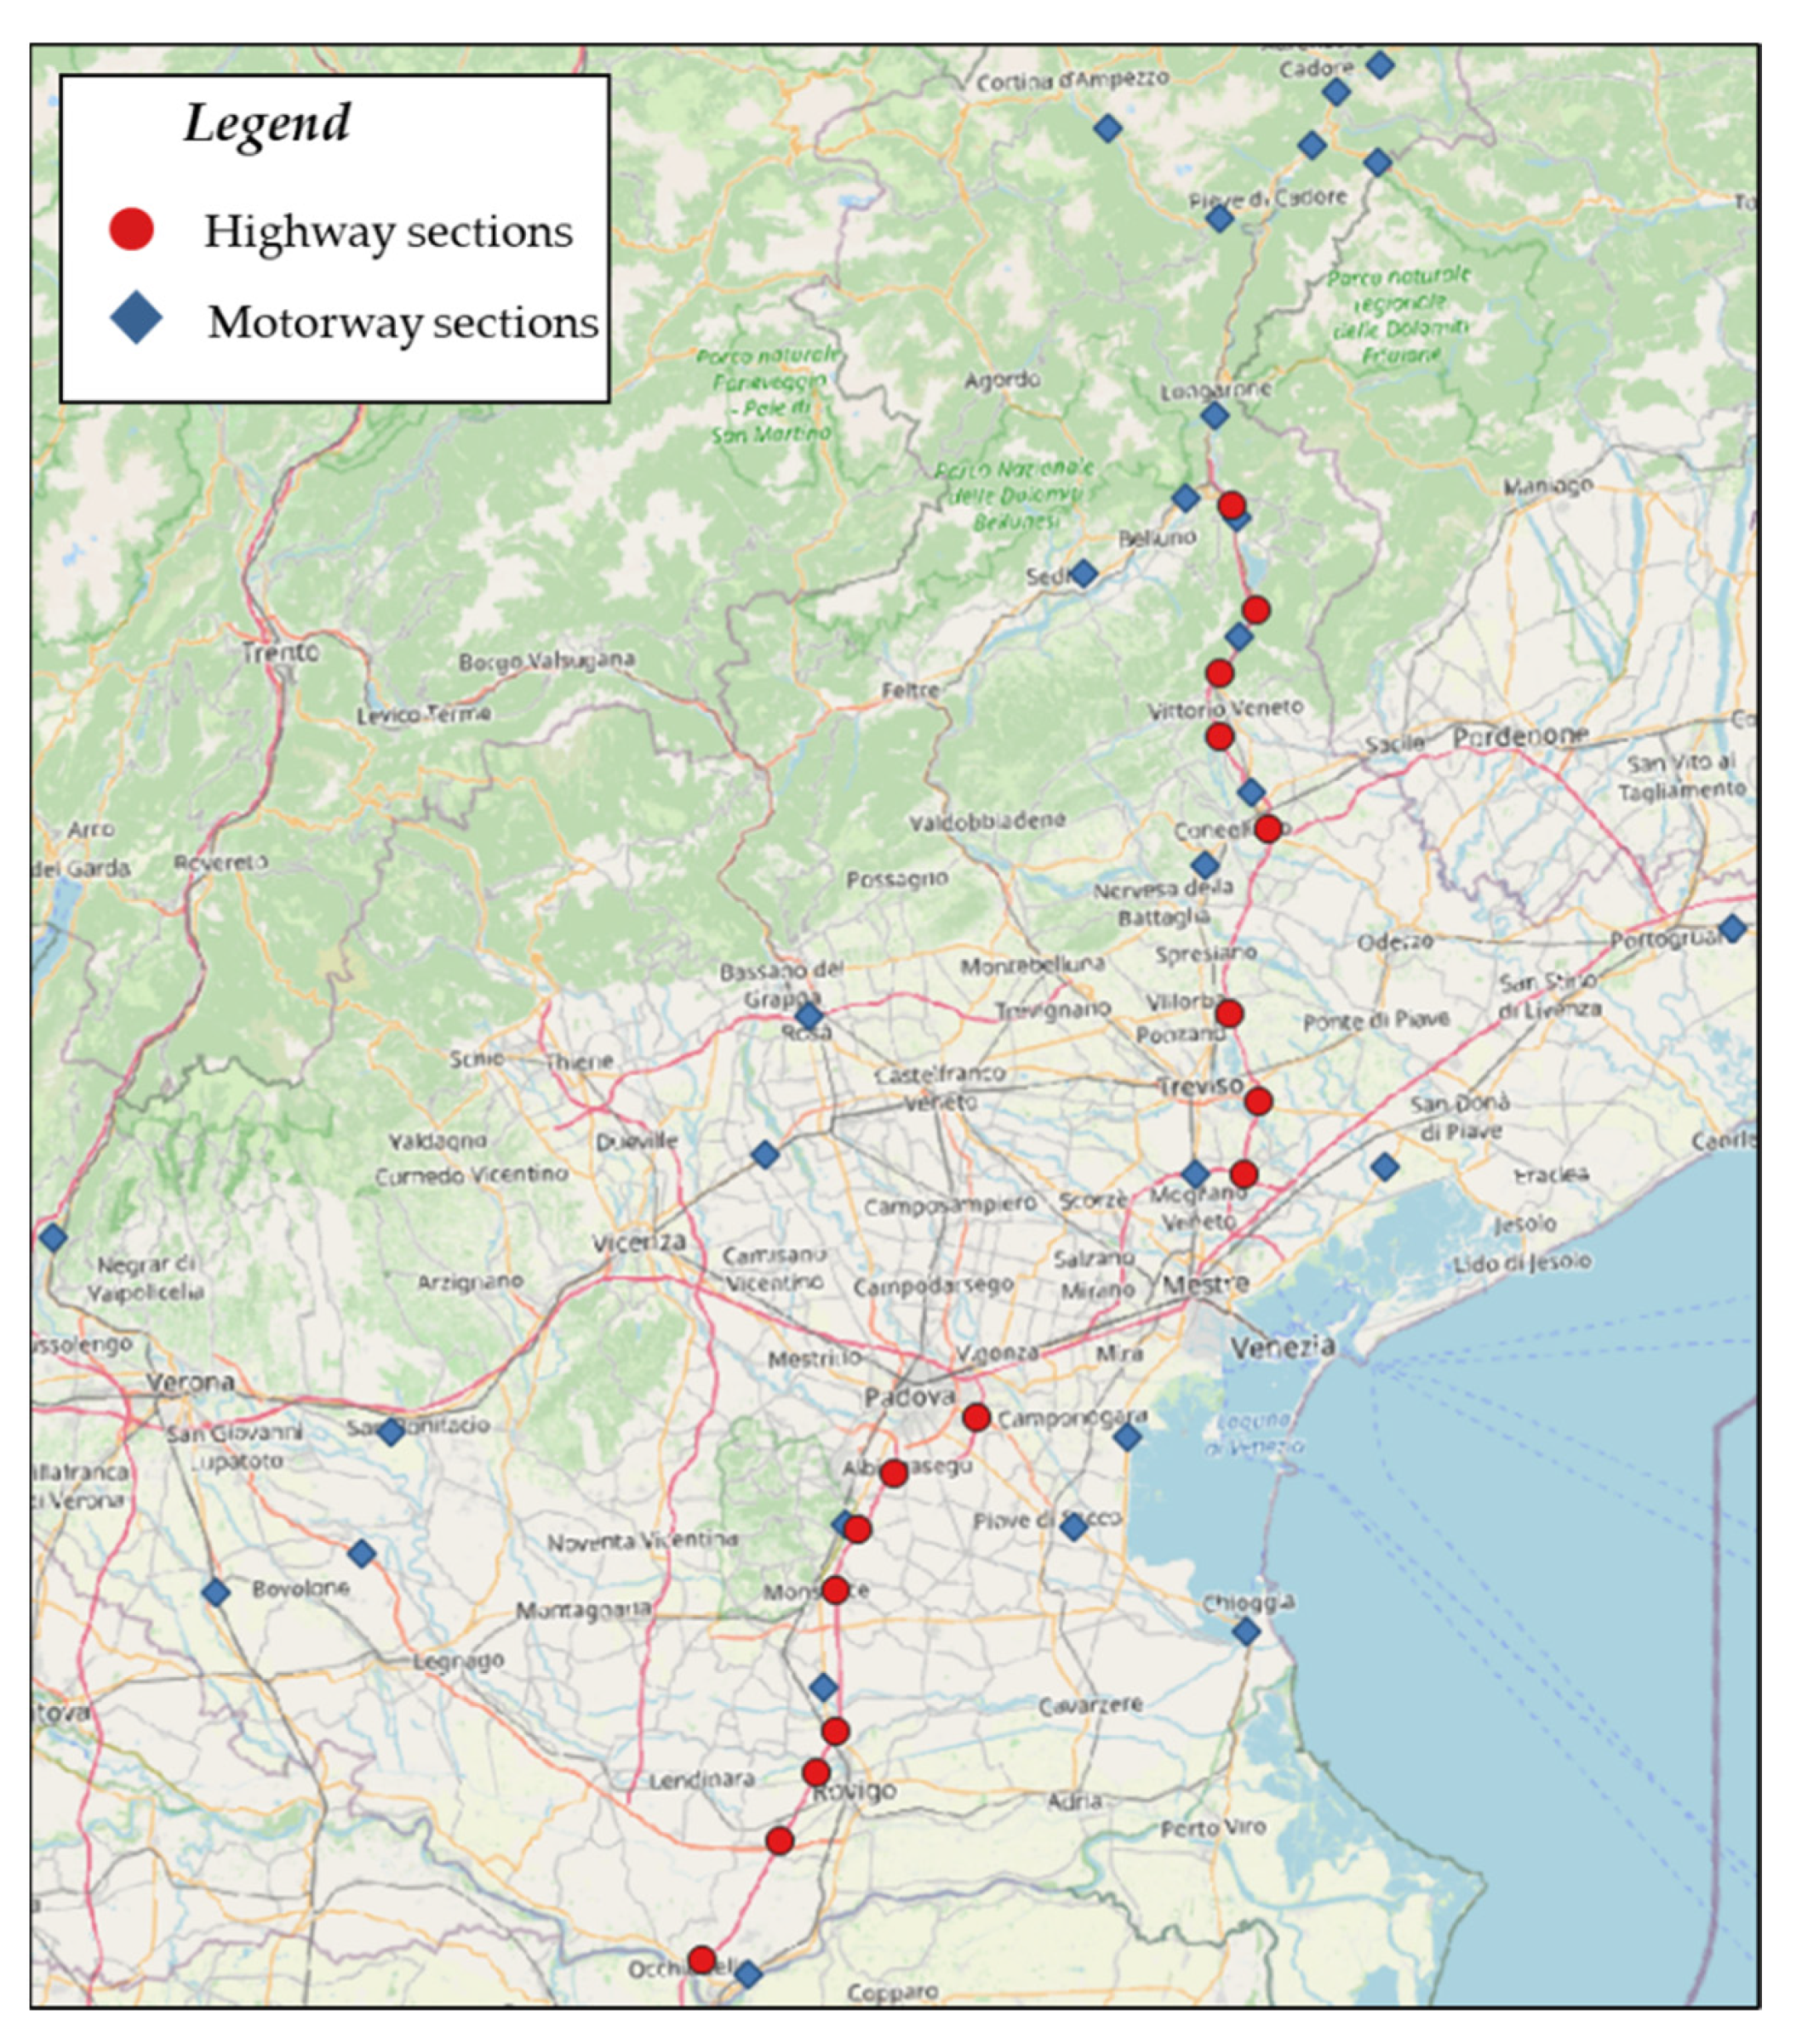
4.1. The Study Area and Available Data
4.2. Car Trip Detection
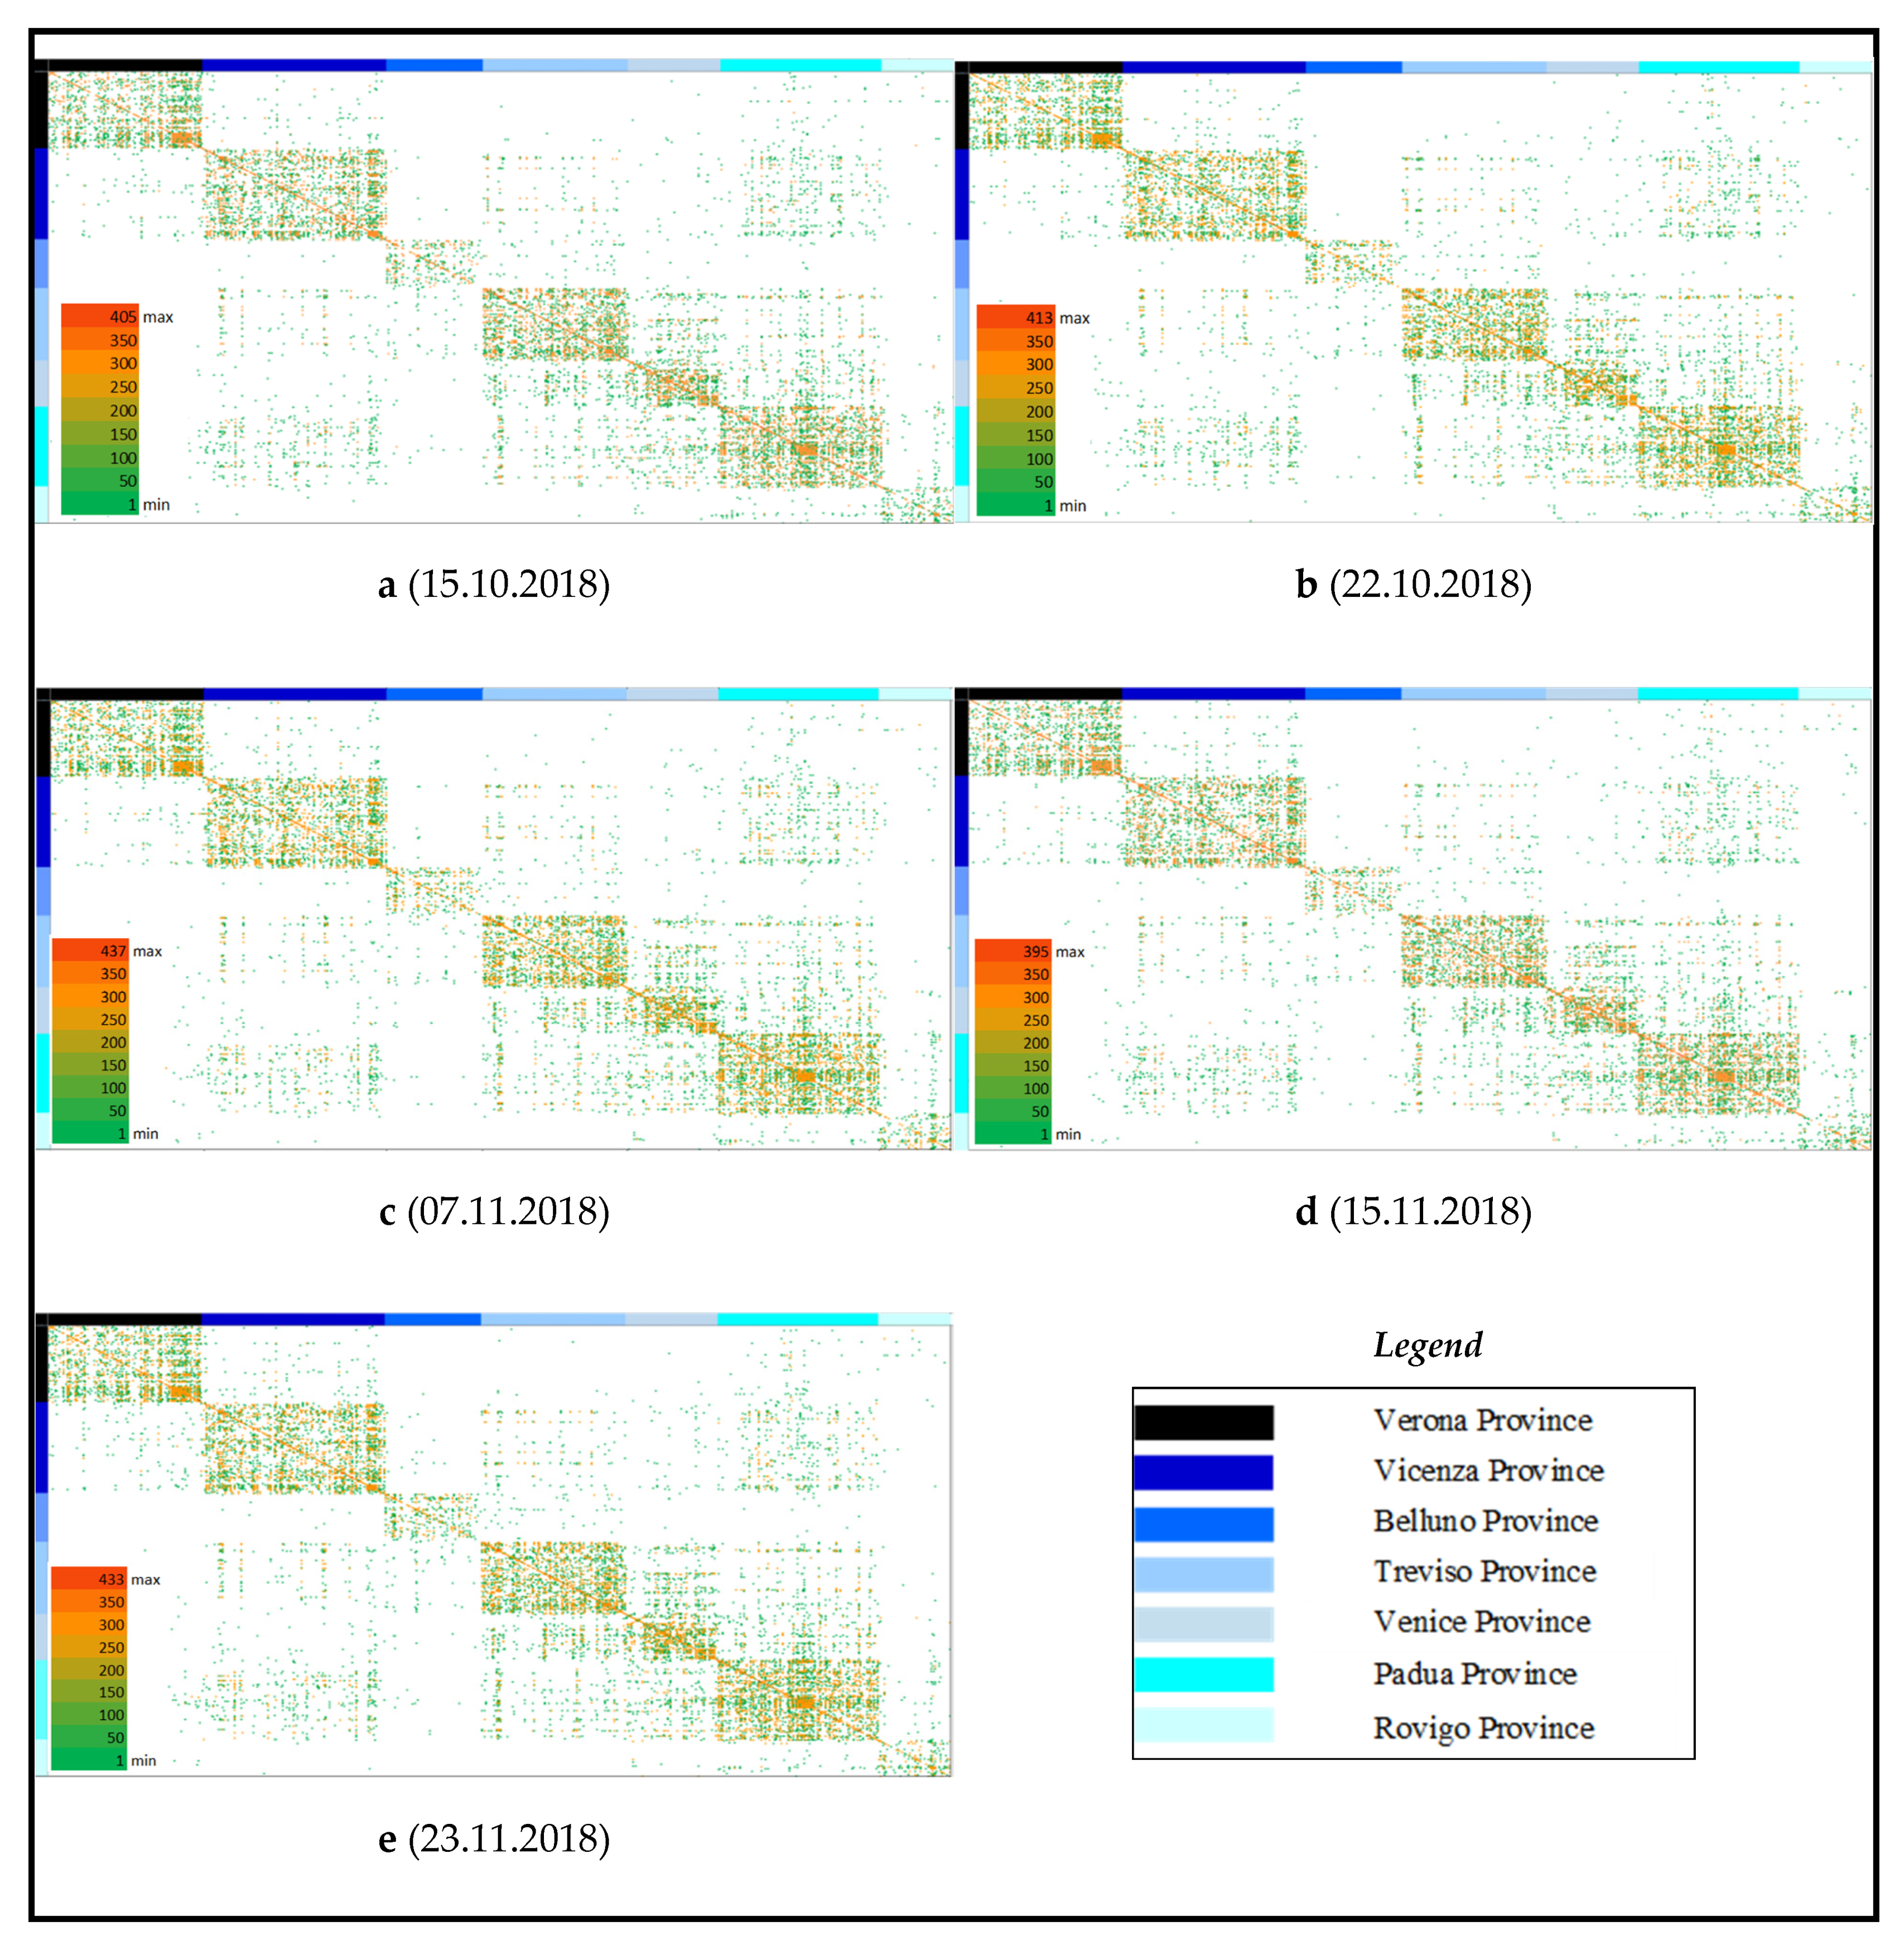
4.3. Sample O-D Matrices
- The predominance of intra-province trips;
- The O-D matrices reproduce quite well the spatial distribution revealed by ISTAT with very limited daily variation.
4.4. Expansion to the Universe of Investigation
4.5. O-D Matrix Validation
4.6. The Road Ahead and Open Research Challenges
4.6.1. Sample Size
- is the mean of VT for province o;
- is the estimated mean of the travelling vehicles VTo;
- is the quantile of the distribution (under Prob = 0.95 equals 1.96);
- is the sample standard deviation for VTo;
- So is the number (days) of observations for VTo.
- is the number of cars that should be monitored for O-D pair od according to sampling statistics data in day s;
- is the average number of trips made by vehicles between or within provinces during the observation day s;
- is the variance of number of trips made by vehicles between or within provinces during the observation day s;
- is the coefficient of variation of number of trips made by vehicles between or within provinces during the observation day s;
- is the average number of trips made by one vehicle during day s;
- is the detected (revealed) flow between zone o and zone d between or within the provinces in survey (observation) day s;
- is the detected number of origin zones in day s for province o;
- is the detected number of destination zones in day s for province o.
4.6.2. Sampling Days
- is the number of survey days required for the flows between zones (provinces) o and d;
- is the average value of flows on O-D pair od within S days;
- is the variance of flows on O-D pair od within S days;
- is the average O-D flow between zone (province) pair od for the survey day s.
4.6.3. Example of Application to the Veneto Region
5. Conclusions
Author Contributions
Funding
Institutional Review Board Statement
Informed Consent Statement
Data Availability Statement
Acknowledgments
Conflicts of Interest
References
- Axhausen, K.W.; Zimmermann, A.; Schönfelder, S.; Rindsfüser, G.; Haupt, T. Observing the rhythms of daily life: A six-week travel diary. Transport 2002, 29, 95–124. [Google Scholar] [CrossRef]
- Ben-Akiva, M. Structure of Passenger Travel Demand Models. Ph.D Thesis, Massachusetts Institute of Technology, Cambridge, MA, USA, 1973; 268p. [Google Scholar]
- Hensher, D.A. Stated preference analysis of travel choices: The state of practice. Transport 1994, 21, 107–133. [Google Scholar] [CrossRef]
- Kitamura, R.; Mokhtarian, P.L.; Daidet, L. A micro-analysis of land use and travel in five neighborhoods in the San Francisco Bay Area. Transport 1997, 24, 125–158. [Google Scholar] [CrossRef]
- McFadden, D. The measurement of urban travel demand. J. Public Econ. 1974, 3, 303–328. [Google Scholar] [CrossRef]
- Schlich, R.; Axhausen, K.W. Habitual travel behaviour: Evidence from a six-week travel diary. Transport 2003, 30, 13–36. [Google Scholar] [CrossRef]
- Williams, H.; Ortuzar, J. Behavioural theories of dispersion and the mis-specification of travel demand models. Transp. Res. Part B Methodol. 1982, 16, 167–219. [Google Scholar] [CrossRef]
- Wilson, A. A statistical theory of spatial distribution models. Transp. Res. 1967, 1, 253–269. [Google Scholar] [CrossRef]
- Alonso, B.; Moura, J.L.; Ibeas, Á.; dell’Olio, L. Using O–D matrices for decision making in road network management. Transport 2013, 28, 31–37. [Google Scholar] [CrossRef]
- Bierlaire, M. The total demand scale: A new measure of quality for static and dynamic origin–destination trip tables. Transp. Res. Part B Methodol. 2002, 36, 837–850. [Google Scholar] [CrossRef]
- Cascetta, E.; Postorino, M.N. Fixed point approaches to the estimation of O/D matrices using traffic counts on congested networks. Transp. Sci. 2001, 35, 134–147. [Google Scholar] [CrossRef]
- Foulds, L.R.; Nascimento, H.A.D.; Calixto, I.; Hall, B.R.; Longo, H. A fuzzy set-based approach to origin–destination matrix estimation in urban traffic networks with imprecise data. Eur. J. Oper. Res. 2013, 231, 190–201. [Google Scholar] [CrossRef]
- Hazelton, M. Some comments on origin–destination matrix estimation. Transp. Res. Part A Policy Pract. 2003, 37, 811–822. [Google Scholar] [CrossRef]
- He, B.Y.; Chow, J.Y.J. Gravity Model of Passenger and Mobility Fleet Origin–Destination Patterns with Partially Observed Service Data. Transp. Res. Board 2021. [Google Scholar] [CrossRef]
- Iqbal, M.S.; Choudhury, C.F.; Wang, P.; González, M.C. Development of origin–destination matrices using mobile phone call data. Transp. Res. Part C Emerg. Technol. 2014, 40, 63–74. [Google Scholar] [CrossRef]
- Mitra, A.; Attanasi, A.; Meschini, L.; Gentile, G. Methodology for O-D matrix estimation using the revealed paths of floating car data on large-scale networks. IET Intell. Transp. Syst. 2020, 14, 1704–1711. [Google Scholar] [CrossRef]
- Munizaga, M.A.; Palma, C. Estimation of a disaggregate multimodal public transport Origin–Destination matrix from passive smartcard data from Santiago, Chile. Transp. Res. Part C Emerg. Technol. 2012, 24, 9–18. [Google Scholar] [CrossRef]
- Russo, F.; Vitetta, A. Reverse assignment: Calibrating link cost functions and updating demand from traffic counts and time measurements. Inverse Probl. Sci. Eng. 2011, 19, 921–950. [Google Scholar] [CrossRef]
- Vrtic, M.; Fröhlich, P.; Schussler, N.; Axhausen, K.; Lohse, D.; Schiller, C.; Teichert, H. Two-dimensionally constrained disaggregate trip generation, distribution and mode choice model: Theory and application for a Swiss national model. Transp. Res. Part A Policy Practice 2007, 41, 857–873. [Google Scholar] [CrossRef][Green Version]
- Cascetta, E. Transportation Systems Analysis–Models and Applications, 2nd ed.; Springer: New York, NY, USA, 2009; 742p. [Google Scholar]
- Antoniou, C.; Dimitrou, L.; Pereira, F. Mobility Patterns, Big Data and Transport Analytics—Tools and Applications for Modelling; Elsevier: Amsterdam, The Netherlands, 2020. [Google Scholar]
- Dixon, M.P.; Rilett, L.R. Real-time OD estimation using automatic vehicle identification and traffic count data. Comput. Civ. Infrastruct. Eng. 2002, 17, 7–21. [Google Scholar] [CrossRef]
- Nasab, M.R.; Shafahi, Y. Estimation of origin–destination matrices using link counts and partial path data. Transport 2020, 47, 2923–2950. [Google Scholar] [CrossRef]
- Michau, G.; Pustelnik, N.; Borgnat, P.; Abry, P.; Bhaskar, A.; Chung, E. Combining traffic counts and bluetooth data for link-origin-destination matrix estimation in large urban networks: The Brisbane case study. arXiv 2019, arXiv:1907.07495. [Google Scholar]
- Guo, J.; Liu, Y.; Li, X.; Huang, W.; Cao, J.; Wei, Y. Enhanced least square based dynamic OD matrix estimation using radio frequency identification data. Math. Comput. Simul. 2017, 155, 27–40. [Google Scholar] [CrossRef]
- Caceres, N.; Romero, L.M.; Benitez, F.G. Exploring strengths and weaknesses of mobility inference from mobile phone data vs. travel surveys. Transp. A Transp. Sci. 2020, 16, 574–601. [Google Scholar] [CrossRef]
- Marra, A.D.; Becker, H.; Axhausen, K.W.; Corman, F. Developing a passive GPS tracking system to study long-term travel behavior. Transp. Res. Part C Emerg. Technol. 2019, 104, 348–368. [Google Scholar] [CrossRef]
- McGowen, P.; McNally, M. 2007. Evaluating the potential to predict activity types from GPS and GIS data. In Proceedings of the Transportation Research Board 86th Meeting, Washington, DC, USA, 21–25 January 2007. [Google Scholar]
- Widhalm, P.; Yang, Y.; Ulm, M.; Athavale, S.; González, M.C. Discovering urban activity patterns in cell phone data. Transport 2015, 42, 597–623. [Google Scholar] [CrossRef]
- Wolf, J.; Guensler, R.; Bachman, W. Elimination of the travel diary: Experiment to derive trip purpose from global positioning system travel data. Transp. Res. Rec. 2001, 1768, 125–134. [Google Scholar] [CrossRef]
- Alsger, A.; Tavassoli, A.; Mesbah, M.; Ferreira, L. Evaluation of effects from sample-size origin-destination estimation using smart card fare data. J. Transp. Eng. Part A Syst. 2017, 143, 04017003. [Google Scholar] [CrossRef]
- He, L.; Agard, B.; Trépanier, M. A classification of public transit users with smart card data based on time series distance metrics and a hierarchical clustering method. Transp. A Transp. Sci. 2018, 16, 56–75. [Google Scholar] [CrossRef]
- Peftitsi, S.; Jenelius, E.; Cats, O. Determinants of passengers’ metro car choice revealed through automated data sources: A Stockholm case study. Transp. A Transp. Sci. 2020, 16, 529–549. [Google Scholar] [CrossRef]
- Tavassoli, A.; Mesbah, M.; Hickman, M. Calibrating a transit assignment model using smart card data in a large-scale multi-modal transit network. Transport 2019, 47, 2133–2156. [Google Scholar] [CrossRef]
- Yap, M.; Cats, O.; van Arem, B. Crowding valuation in urban tram and bus transportation based on smart card data. Transp. A Transp. Sci. 2020, 16, 23–42. [Google Scholar] [CrossRef]
- Alho, A.R.; You, L.; Lu, F.; Cheah, L.; Zhao, F.; Ben-Akiva, M. Next generation freight vehicle surveys: Supplementing truck GPS tracking with a driver activity survey. In Proceedings of the 21st IEEE International Conference on Intelligent Transportation Systems, Maui, HI, USA, 4–7 November 2018. [Google Scholar]
- Figliozzi, M. Modeling the impact of technological changes on urban commercial trips by commercial activity routing type. Transp. Res. Rec. 2006, 1964, 118–126. [Google Scholar] [CrossRef]
- Gonzalez-Feliu, J.; Pluvinet, P.; Serouge, M.; Gardrat, M. GPS-based data production in urban freight distribution. Glob. Position. Syst. Signal Struct. Appl. Sources Error Biases 2013, 1–20. [Google Scholar]
- Nuzzolo, A.; Comi, A.; Papa, E.; Polimeni, A. 2019. Understanding taxi travel demand patterns through floating car data. In Data Analytics: Paving the Way to Sustainable Urban Mobility, Proceedings of the 4th Conference on Sustainable Urban Mobility (CSUM2018), Skiathos Island, Greece, 24–25 May 2018; Nathanail, E., Karakikes, I.D., Eds.; Springer: Berlin/Heidelberg, Germany, 2018; pp. 445–452. [Google Scholar] [CrossRef]
- Comi, A.; Nuzzolo, A.; Polimeni, A. Aggregate delivery tour modeling through AVM data: Experimental evidence for light goods vehicles. Transp. Lett. 2021, 13, 201–208. [Google Scholar] [CrossRef]
- Comi, A.; Polimeni, A. Forecasting delivery pattern through AVM/FCD data: Empirical evidence. Future Transp. 2021, 1, 707–719. [Google Scholar]
- Holguín-Veras, J.; Encarnación, T.; Perez-Guzman, S.; Yang, X. Mechanistic identification of freight activity stops from global positioning system data. Transp. Res. Rec. 2020, 2674, 235–246. [Google Scholar] [CrossRef]
- Polimeni, A.; Vitetta, A. Vehicle routing in urban areas: An optimal approach with cost function calibration. Transp. B Transp. Dyn. 2013, 2, 1–19. [Google Scholar] [CrossRef]
- Thoen, S.; Tavasszy, L.; de Bok, M.; Correia, G.; van Duin, R. Descriptive modeling of freight tour formation: A shipment-based approach. Transp. Res. Part E Logist. Transp. Rev. 2020, 140, 101989. [Google Scholar] [CrossRef]
- Alesio, T. Position Monitoring System and Method. U.S. Patent 5,550,551, 27 August 1996. [Google Scholar]
- Rothert, M.F.; Janky, J.M. Automated Vehicle Monitoring System. U.S. Patent 6,141,610, 31 October 2000. [Google Scholar]
- OnStar. OnStar: In-Vehicle Safety and Security System. 2021. Available online: https://www.onstar.com (accessed on 25 July 2021).
- Bartlett, J.E.; Kotrlik, J.W.; Higgins, C.C. Organizational research: Determining appropriate sample size in survey research. Inf. Technol. Learn. Perform. J. 2001, 19, 43–50. [Google Scholar]
- Bolbol, A.; Cheng, T.; Tsapakis, I.; Chow, A.H. Sample size calculation for studying transportation modes from GPS data. Procedia-Soc. Behav. Sci. 2012, 48, 3040–3050. [Google Scholar] [CrossRef]
- Ceder, A. Public Transit Planning and Operation: Theory, Modelling and Practice, 1st ed.; CRC press: Boca Raton, FL, USA, 2007; 645p. [Google Scholar]
- Ortúzar, J.D.; Willumsen, L.G. Modelling Transport, 4th ed.; John Wiley & Sons, Ltd: Hoboken, NJ, USA, 2011. [Google Scholar]
- Smith, M.E. 1979. Design of small sample home interview travel surveys. Transp. Res. Rec. 1979, 701, 29–35. [Google Scholar]
- Messelodi, S.; Modena, C.M.; Zanin, M.; De Natale, F.G.; Granelli, F.; Betterle, E.; Guarise, A. Intelligent extended floating car data collection. Expert Syst. Appl. 2009, 36, 4213–4227. [Google Scholar] [CrossRef]
- Ehmke, J.F.; Meisel, S.; Mattfeld, D. Floating car based travel times for city logistics. Transp. Res. Part C Emerg. Technol. 2012, 21, 338–352. [Google Scholar] [CrossRef]
- Rahmani, M.; Jenelius, E.; Koutsopoulos, H.N. Non-parametric estimation of route travel time distributions from low-frequency floating car data. Transp. Res. Part C Emerg. Technol. 2015, 58, 343–362. [Google Scholar] [CrossRef]
- Rahmani, M.; Koutsopoulos, H.N.; Jenelius, E. Travel time estimation from sparse floating car data with consistent path inference: A fixed point approach. Transp. Res. Part C Emerg. Technol. 2017, 85, 628–643. [Google Scholar] [CrossRef]
- Tu, W.; Fang, Z.; Li, Q. Exploring time varying shortest path of urban OD Pairs based on floating car data. In Proceedings of the 2010 18th International Conference on Geoinformatics, Beijing, China, 18–20 June 2010; pp. 1–6. [Google Scholar] [CrossRef]
- Dewulf, B.; Neutens, T.; Vanlommel, M.; Logghe, S.; De Maeyer, P.; Witlox, F.; De Weerdt, Y.; Van de Weghe, N. Examining commuting patterns using Floating Car Data and circular statistics: Exploring the use of new methods and visualizations to study travel times. J. Transp. Geogr. 2015, 48, 41–51. [Google Scholar] [CrossRef]
- Yamamoto, T.; Miwa, T.; Takeshita, T.; Morikawa, T. Updating dynamic origin-destination matrices using observed link travel speed by probe vehicles. In Transportation and Traffic Theory 2009: Golden Jubilee; Lam, W., Wong, S., Lo, H., Eds.; Springer: Boston, MA, USA, 2009; p. 723. [Google Scholar] [CrossRef]
- Cao, P.; Miwa, T.; Yamamoto, T.; Morikawa, T. Bilevel generalized least squares estimation of dynamic origin–destination matrix for urban network with probe vehicle data. Transp. Res. Rec. J. Transp. Res. Board 2013, 2333, 66–73. [Google Scholar] [CrossRef]
- Croce, A.; Musolino, G.; Rindone, C.; Vitetta, A. Route and path choices of freight vehicles: A case study with floating car data. Sustainability 2020, 12, 855. [Google Scholar] [CrossRef]
- Stipancic, J.; Miranda-Moreno, L.; Saunier, N. Vehicle manoeuvers as surrogate safety measures: Extracting data from the gps-enabled smartphones of regular drivers. Accid. Anal. Prev. 2018, 115, 160–169. [Google Scholar] [CrossRef]
- Sun, L.; Lee, D.H.; Erath, A.; Huang, X. Using smart card data to extract passenger’s spatio-temporal density and train’s trajectory of MRT system. In Proceedings of the ACM SIGKDD International Workshop on Urban Computing, Beijing, China, 12 August 2012. [Google Scholar]
- Carrese, S.; Cipriani, E.; Mannini, L.; Nigro, M. Dynamic demand estimation and prediction for traffic urban networks adopting new data sources. Transp. Res. Part C Emerg. Technol. 2017, 81, 83–98. [Google Scholar] [CrossRef]
- Yang, X.; Lu, Y.; Hao, W. Origin-destination estimation using probe vehicle trajectory and link counts. J. Adv. Transp. 2017, 2017, 1–18. [Google Scholar] [CrossRef]
- Sbaï, A.; Van Zuylen, H.J.; Li, J.; Zheng, F.; Ghadi, F. Estimation of an urban OD matrix using different information sources. In Computational Science and Its Applications–ICCSA 2017. Lecture Notes in Computer Science; Gervasi, O., Ed.; Springer International Publishing: Cham, Switzerland, 2017; Volume 10405, pp. 183–198. [Google Scholar] [CrossRef]
- Vogt, S.; Fourati, W.; Schendzielorz, T.; Friedrich, B. Estimation of origin-destination matrices by fusing detector data and Floating Car Data. Transp. Res. Procedia 2019, 37, 473–480. [Google Scholar] [CrossRef]
- Dabbas, H.; Fourati, W.; Friedrich, B. Floating car data for traffic demand estimation-field and simulation studies. In Proceedings of the 2020 IEEE 23rd International Conference on Intelligent Transportation Systems (ITSC), Rhodes, Greece, 20–23 September 2020; pp. 1–8. [Google Scholar] [CrossRef]
- Guo, D.; Zhu, X.; Jin, H.; Gao, P.; Andris, C. Discovering spatial patterns in origin-destination mobility data. Trans. GIS 2012, 16, 411–429. [Google Scholar] [CrossRef]
- Tang, J.; Liu, F.; Wang, Y.; Wang, H. Uncovering urban human mobility from large scale taxi GPS data. Phys. A Stat. Mech. Its Appl. 2015, 438, 140–153. [Google Scholar] [CrossRef]
- ISTAT. Il Veneto e la mobilità sostenibile. In Rapporto Statistico 2018; Italian Institute of Statistics: Rome, Italy, 2018. [Google Scholar]
- ACI. Autoritratto 2018; Automobile Club d’Italia: Rome, Italy, 2019. [Google Scholar]
- Jiang, S.; Ferreira, J.; Gonzalez, M.C. Activity-based human mobility patterns inferred from mobile phone data: A case study of Singapore. IEEE Trans. Big Data 2017, 3, 208–219. [Google Scholar] [CrossRef]
- Tsekeris, T.; Tsekeris, C. Demand forecasting in transport: Overview and modeling advances. Econ. Res.-Ekon. Istraživanja 2011, 24, 82–94. [Google Scholar] [CrossRef]
- Comi, A.; Delle Site, P.; Filippi, F.; Marcucci, E.; Nuzzolo, A. Differentiated regulation of urban freight traffic: Conceptual framework and examples from Italy. In Proceedings of the 13th International Conference of Hong Kong Society for Transportation Studies, Hong Kong, China, 13–15 December 2008. [Google Scholar]
- Holguín-Veras, J.; Leal, J.A.; Sanchez-Diaz, I.; Browne, M.; Wojtowicz, J. State of the art and practice of urban freight management Part II: Financial approaches, logistics, and demand management. Transp. Res. Part A Policy Pracitce 2020, 137, 383–410. [Google Scholar] [CrossRef]
- Nuzzolo, A.; Comi, A. A system of models to forecast the effects of demographic changes on urban shop restocking. Res. Transp. Bus. Manag. 2014, 11, 142–151. [Google Scholar] [CrossRef]
- Banister, D. The sustainable mobility paradigm. Transp. Policy 2008, 15, 73–80. [Google Scholar] [CrossRef]
- Tight, M.; Bristow, A.; Pridmore, A.; May, A. What is a sustainable level of CO2 emissions from transport activity in the UK in 2050? Transp. Policy 2005, 12, 235–244. [Google Scholar] [CrossRef]
- Bösch, P.M.; Becker, F.; Becker, H.; Axhausen, K.W. Cost-based analysis of autonomous mobility services. Transp. Policy 2018, 64, 76–91. [Google Scholar] [CrossRef]
- de Almeida Correia, G.H.; van Arem, B. Solving the user optimum privately owned automated vehicles assignment problem (UO-POAVAP): A model to explore the impacts of self-driving vehicles on urban mobility. Transp. Res. Part B Methodol. 2016, 87, 64–88. [Google Scholar] [CrossRef]
- Mishra, G.S.; Clewlow, R.R.; Mokhtarian, P.L.; Widaman, K.F. The effect of carsharing on vehicle holdings and travel behavior: A propensity score and causal mediation analysis of the San Francisco Bay Area. Res. Transp. Econ. 2015, 52, 46–55. [Google Scholar] [CrossRef]


| Province | Area, [km2] | Inhabitants | Males | Females | Number of Cars | Average No. of Vehicles per Inhabitant | Sampled Vehicles * |
|---|---|---|---|---|---|---|---|
| Belluno | 3678 | 204,900 | 49% | 51% | 135,261 | 0.660 | 918 (0.7%) |
| Padua | 2141 | 936,740 | 49% | 51% | 603,290 | 0.644 | 7503 (1.2%) |
| Rovigo | 1789 | 236,400 | 49% | 51% | 159,231 | 0.674 | 420 (0.3%) |
| Treviso | 2477 | 887,420 | 49% | 51% | 588,052 | 0.663 | 5875 (1.0%) |
| Venice | 2463 | 853,552 | 48% | 52% | 471,324 | 0.552 | 3274 (0.7%) |
| Verona | 3121 | 922,821 | 49% | 51% | 614,838 | 0.666 | 3870 (0.6%) |
| Vicenza | 2722 | 863,204 | 49% | 51% | 577,339 | 0.669 | 7298 (1.3%) |
| Total | 18,391 | 4,905,037 | 49% | 51% | 3,149,335 | 0.642 | 29,158 (0.9%) |
| Sampling/Surveyed Days | No. of Observations in the Database | ||
|---|---|---|---|
| Sampled Vehicles Travelling | Trip Description | Trip Details | |
| 15.10.2018 | 16,760 | 66,639 | 797,408 |
| 22.10.2018 | 16,674 | 67,057 | 794,775 |
| 07.11.2018 | 16,958 | 69,447 | 799,604 |
| 15.11.2018 | 17,139 | 71,304 | 883,329 |
| 23.11.2018 | 17,427 | 74,548 | 924,729 |
| Average | 16,992 | 69,799 | 839,969 |
| Province of Vehicle Registration | Survey Day | Average No. of Cars Sampled | Standard Deviation, Cars | ||||
|---|---|---|---|---|---|---|---|
| 15.10.2018 | 22.10.2018 | 07.11.2018 | 15.11.2018 | 23.11.2018 | |||
| Belluno | 449 | 441 | 449 | 461 | 441 | 448.2 | 7.33 |
| Padua | 4421 | 4412 | 4475 | 4545 | 4412 | 4453.0 | 51.64 |
| Rovigo | 236 | 236 | 238 | 235 | 236 | 236.2 | 0.98 |
| Treviso | 3760 | 3747 | 3804 | 3832 | 3747 | 3778.0 | 34.17 |
| Venice | 1519 | 1514 | 1513 | 1566 | 1514 | 1525.2 | 20.51 |
| Verona | 2249 | 2233 | 2271 | 2288 | 2233 | 2254.8 | 21.67 |
| Vicenza | 4126 | 4091 | 4208 | 4212 | 4091 | 4145.6 | 54.13 |
| Unknown location | 955 | 945 | 961 | 985 | 945 | 958.2 | 14.73 |
| Extra Veneto region | 1377 | 1337 | 1296 | 1389 | 1337 | 1347.2 | 33.06 |
| Total | 19,092 | 18,956 | 19,215 | 19,513 | 18,956 | - | - |
| SWod | Verona | Vicenza | Belluno | Treviso | Venice | Padua | Rovigo | Total |
| Verona | 97.05% | 2.18% | 0.00% | 0.05% | 0.08% | 0.42% | 0.22% | 100.00% |
| Vicenza | 1.28% | 94.37% | 0.08% | 1.08% | 0.14% | 3.02% | 0.03% | 100.00% |
| Belluno | 0.01% | 0.24% | 96.83% | 2.62% | 0.16% | 0.14% | 0.00% | 100.00% |
| Treviso | 0.04% | 2.01% | 0.57% | 89.76% | 5.43% | 2.18% | 0.01% | 100.00% |
| Venice | 0.13% | 0.48% | 0.04% | 8.35% | 79.90% | 10.41% | 0.69% | 100.00% |
| Padua | 0.90% | 4.77% | 0.03% | 2.35% | 4.65% | 85.88% | 1.42% | 100.00% |
| Rovigo | 2.22% | 0.27% | 0.02% | 0.11% | 2.42% | 6.50% | 88.46% | 100.00% |
| SPd | 19.04% | 20.20% | 4.43% | 19.54% | 13.06% | 19.36% | 4.37% | 100.00% |
| Province of Origin | Parameter | Province of Destination | ||||||
|---|---|---|---|---|---|---|---|---|
| Verona | Vicenza | Belluno | Treviso | Venice | Padua | Rovigo | ||
| Verona | No. of O-D pairs | 0.02 | 0.11 | 0.00 | 0.26 | 0.34 | 0.09 | 0.21 |
| Average O-D trip value | 0.02 | 0.03 | 0.00 | 0.00 | 0.00 | 0.03 | 0.02 | |
| Vicenza | No. of O-D pairs | 0.13 | 0.02 | 0.45 | 0.07 | 0.23 | 0.03 | 0.30 |
| Average O-D trip value | 0.02 | 0.03 | 0.06 | 0.04 | 0.02 | 0.04 | 0.00 | |
| Belluno | No. of O-D pairs | 0.71 | 0.10 | 0.05 | 0.06 | 0.24 | 0.18 | n.a. |
| Average O-D trip value | 0.00 | 0.00 | 0.03 | 0.03 | 0.00 | 0.00 | n.a. | |
| Treviso | No. of O-D pairs | 0.39 | 0.07 | 0.02 | 0.02 | 0.06 | 0.03 | 0.57 |
| Average O-D trip value | 0.00 | 0.04 | 0.04 | 0.02 | 0.01 | 0.05 | 0.00 | |
| Venice | No. of O-D pairs | 0.31 | 0.24 | 0.32 | 0.05 | 0.02 | 0.04 | 0.16 |
| Average O-D trip value | 0.00 | 0.02 | 0.00 | 0.02 | 0.03 | 0.02 | 0.07 | |
| Padua | No. of O-D pairs | 0.12 | 0.04 | 0.28 | 0.05 | 0.05 | 0.02 | 0.08 |
| Average O-D trip value | 0.03 | 0.04 | 0.04 | 0.03 | 0.02 | 0.01 | 0.03 | |
| Rovigo | No. of O-D pairs | 0.13 | 0.27 | n.a. | 1.41 | 0.16 | 0.10 | 0.02 |
| Average O-D trip value | 0.10 | 0.00 | n.a. | 0.00 | 0.14 | 0.02 | 0.05 | |
| Sampling/Surveyed Days | Number of Trips Made by One Vehicle | Number of Estimated Vehicles | |||
|---|---|---|---|---|---|
| Mean | Standard Deviation | Min | Max | ||
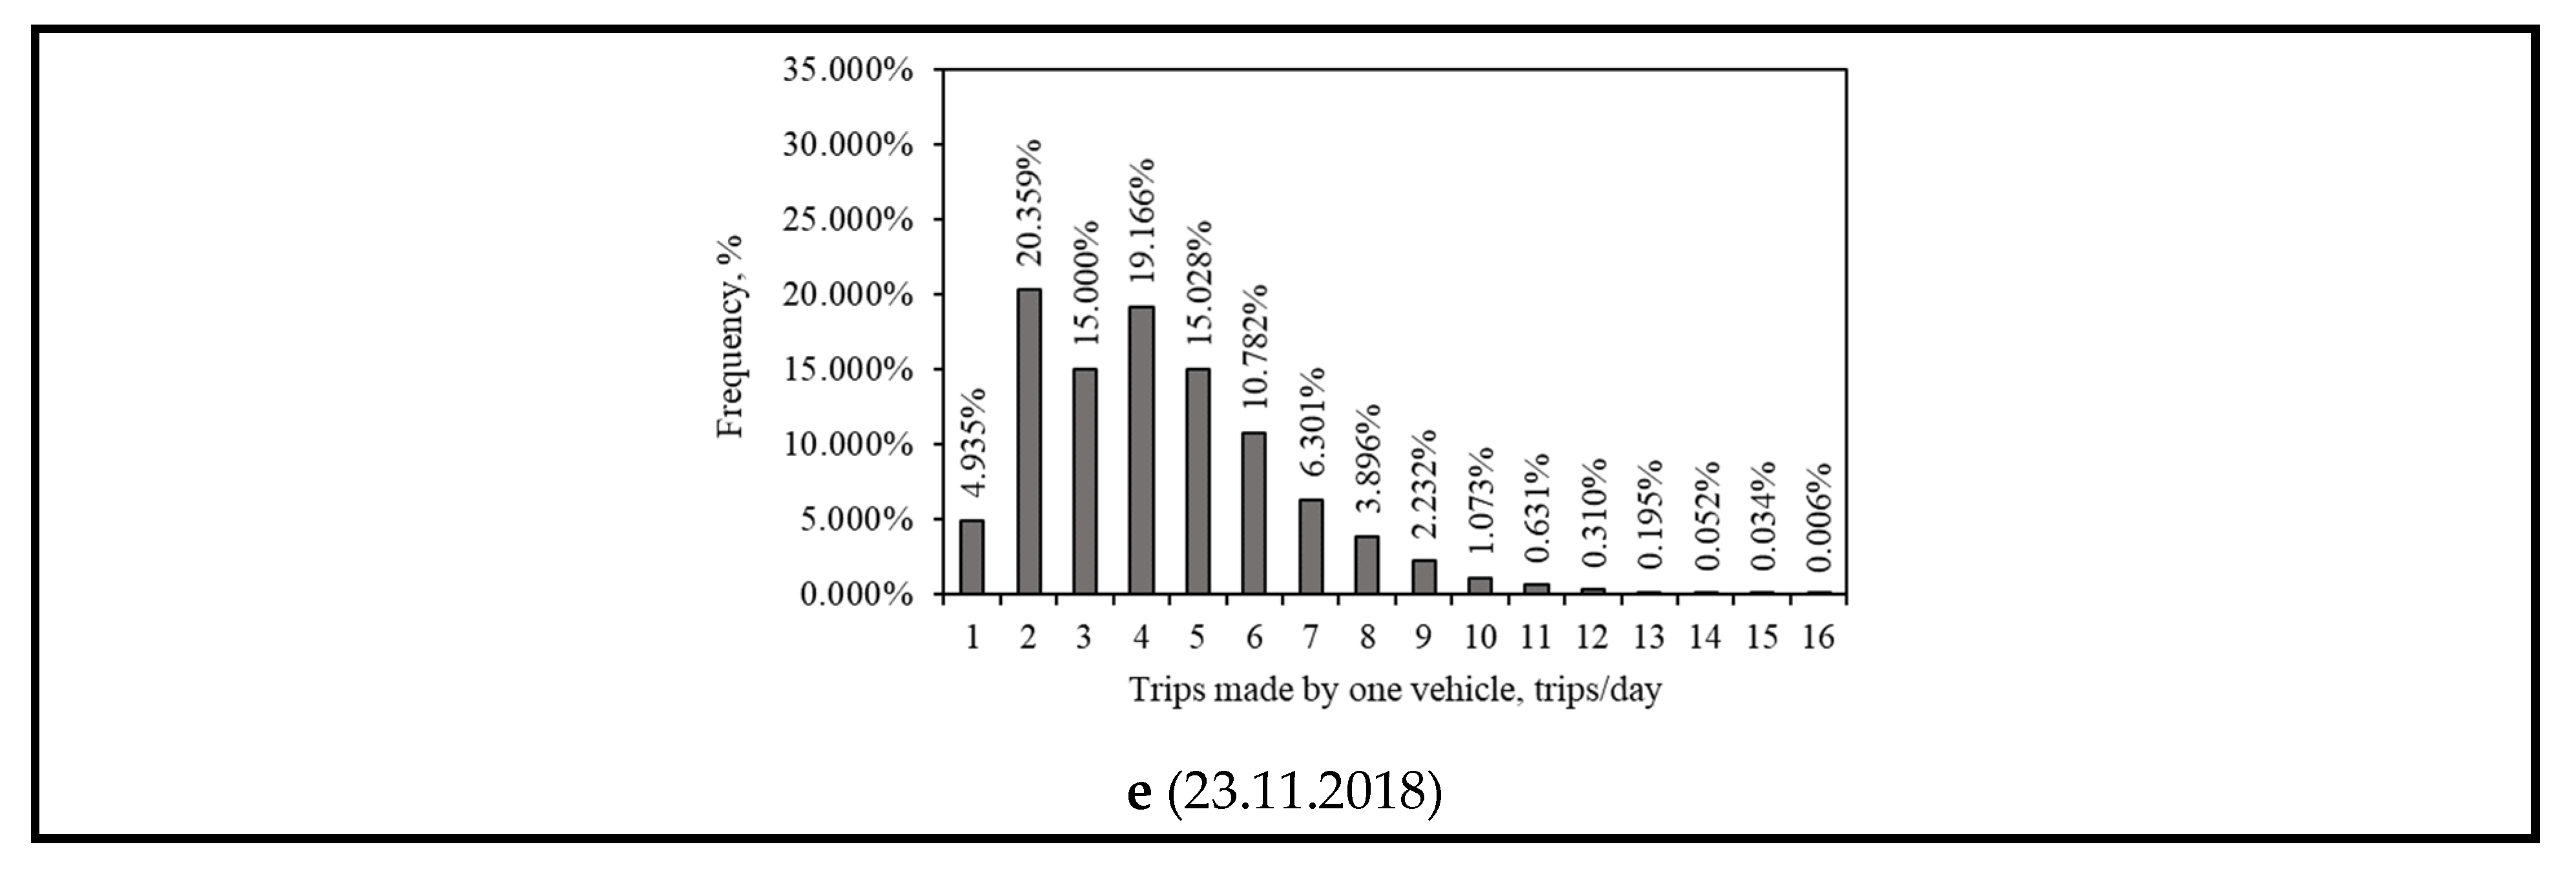
| 15.10.2018 | 3.98 | 1.51 | 1 | 19 | 16,760 |
| 22.10.2018 | 4.02 | 1.52 | 1 | 16 | 16,674 |
| 07.11.2018 | 4.10 | 1.46 | 1 | 17 | 16,958 |
| 15.11.2018 | 4.16 | 1.47 | 1 | 16 | 17,139 |
| 23.11.2018 | 4.28 | 1.49 | 1 | 16 | 17,427 |
| Type of Estimation | MSE | RMSE | MAE |
|---|---|---|---|
| Through AVM/FCD data | 74 | 5507 | 3104 |
| Updating using traffic counts | 74 | 5489 | 3040 |
| Province of Vehicle Registration | VT [%] | Mean [%] | Standard Deviation [%] | Confidence Interval | |||||
|---|---|---|---|---|---|---|---|---|---|
| 15.10 | 22.10 | 07.11 | 15.11 | 23.11 | Left Side [%] | Right Side [%] | |||
| Belluno | 48.91 | 48.04 | 48.91 | 50.22 | 48.04 | 48.82 | 0.80 | 48.12 | 49.52 |
| Padua | 58.92 | 58.80 | 59.64 | 60.58 | 58.80 | 59.35 | 0.69 | 58.75 | 59.95 |
| Rovigo | 56.19 | 56.19 | 56.67 | 55.95 | 56.19 | 56.24 | 0.24 | 56.03 | 56.45 |
| Treviso | 64.00 | 63.78 | 64.75 | 65.23 | 63.78 | 64.31 | 0.58 | 63.80 | 64.82 |
| Venice | 46.4 | 46.24 | 46.21 | 47.83 | 46.24 | 46.58 | 0.63 | 46.03 | 47.13 |
| Verona | 58.11 | 57.70 | 58.68 | 59.12 | 57.70 | 58.26 | 0.56 | 57.77 | 58.75 |
| Vicenza | 56.54 | 56.06 | 57.66 | 57.71 | 56.06 | 56.81 | 0.74 | 56.16 | 57.46 |
| Province of Origin | Province of Destination | Required No. of Survey Days | ||||||
|---|---|---|---|---|---|---|---|---|
| Verona | Vicenza | Belluno | Treviso | Venice | Padua | Rovigo | ||
| Verona | 1 | 1 | 1 | 1 | 1 | 1 | 1 | 1 |
| Vicenza | 1 | 1 | 5 | 2 | 1 | 2 | 1 | 5 |
| Belluno | 1 | 1 | 1 | 1 | 1 | 1 | n.a. | 1 |
| Treviso | 1 | 3 | 3 | 1 | 1 | 4 | 1 | 4 |
| Venice | 1 | 1 | 1 | 1 | 1 | 1 | 8 | 8 |
| Padua | 1 | 3 | 3 | 1 | 1 | 1 | 1 | 3 |
| Rovigo | 14 | 1 | n.a. | 1 | 31 | 1 | 5 | 31 |
Publisher’s Note: MDPI stays neutral with regard to jurisdictional claims in published maps and institutional affiliations. |
© 2021 by the authors. Licensee MDPI, Basel, Switzerland. This article is an open access article distributed under the terms and conditions of the Creative Commons Attribution (CC BY) license (https://creativecommons.org/licenses/by/4.0/).
Share and Cite
Comi, A.; Rossolov, A.; Polimeni, A.; Nuzzolo, A. Private Car O-D Flow Estimation Based on Automated Vehicle Monitoring Data: Theoretical Issues and Empirical Evidence. Information 2021, 12, 493. https://doi.org/10.3390/info12120493
Comi A, Rossolov A, Polimeni A, Nuzzolo A. Private Car O-D Flow Estimation Based on Automated Vehicle Monitoring Data: Theoretical Issues and Empirical Evidence. Information. 2021; 12(12):493. https://doi.org/10.3390/info12120493
Chicago/Turabian StyleComi, Antonio, Alexander Rossolov, Antonio Polimeni, and Agostino Nuzzolo. 2021. "Private Car O-D Flow Estimation Based on Automated Vehicle Monitoring Data: Theoretical Issues and Empirical Evidence" Information 12, no. 12: 493. https://doi.org/10.3390/info12120493
APA StyleComi, A., Rossolov, A., Polimeni, A., & Nuzzolo, A. (2021). Private Car O-D Flow Estimation Based on Automated Vehicle Monitoring Data: Theoretical Issues and Empirical Evidence. Information, 12(12), 493. https://doi.org/10.3390/info12120493