Article

Predictive Maintenance for Switch Machine Based on Digital Twins

1
School of Electronic and Information Engineering, Beijing Jiaotong University, Beijing 100044, China
2
The National Engineering Research Center of Rail Transportation Operation Control System, Beijing 100044, China
3
State Key Laboratory of Rail Traffic Control and Safety, Beijing Jiaotong University, Beijing 100044, China
*
Author to whom correspondence should be addressed.
Information 2021, 12(11), 485; https://doi.org/10.3390/info12110485
Submission received: 15 October 2021 / Revised: 13 November 2021 / Accepted: 16 November 2021 / Published: 22 November 2021

Abstract

:
As a unique device of railway networks, the normal operation of switch machines involves railway safe and efficient operation. Predictive maintenance becomes the focus of the switch machine. Aiming at the low accuracy of the prediction state and the difficulty in state visualization, the paper proposes a predictive maintenance model for switch machines based on Digital Twins (DT). It constructs a DT model for the switch machine, which contains a behavior model and a rule model. The behavior model is a high-fidelity visual model. The rule model is a high-precision prediction model, which is combined with long short-term memory (LSTM) and autoregressive Integrated Moving Average model (ARIMA). Experiment results show that the model can be more intuitive with higher prediction accuracy and better applicability. The proposed DT approach is potentially practical, providing a promising idea for switching machines in predictive maintenance.

1. Introduction

Today, the railway has developed rapidly and has become the most extensively used network, especially in China [1,2]. So, high security is required to keep trains operation safe [3]. The switch machine, which takes charge of pulling and pushing turnout blades, is significant to ensure railway safe and efficient operation. Any failure in turnout may lead to nasty accidents and even cause severe loss of life and property. Besides, statistics survey reports that the failure number of switch machines accounts for more than 40% of all railway signaling equipment [4]. However, the most used maintenance in railway on-sites depends on human experience [5], which tends to fail when facing complex problems. Additionally, maintenance personnel indeed needs a visual tool for observing the device for better maintenance. Hence, the intelligent maintenance model and the visualization for switch machines are essential [6].
Many scholars have researched switch machines in Prognostic and Health Management (PHM), including fault detection and diagnosis, prognosis, health prediction, etc. [7]. Compared to prognosis, fault diagnosis is relatively mature. However, diagnostics is, in essence, a classification problem. It can only classify existing fault phenomenon of switch machines and cannot handle the urgent problem since it belongs to corrective maintenance, lacking foresight ability. This paper focuses on the predictive maintenance for switch machines.
Predictive Maintenance (PM) has gradually become the promising solution in complex equipment Prognosis and Health Management (PHM) since it is more likely to effectively reduce operation and maintenance costs than breakdown maintenance and periodic maintenance [8]. PM evolves the maintenance pattern from the passive generation to active optimization selection [9] and improves the stability and reliability of the switch machine, as well as increases its service life. There are also some studies on the state prediction for the switch machine.
Aiming to forecast failure progression in railway turnout systems. Guclu presented an autoregressive moving average (ARMA) model to predict states in the slide chair of turnout system [10]. Liu proposed using polynomials to fit the relationship between temperature and gap offset data to achieve the purpose of predicting gap offset [11]. However, ARMA and polynomial fitting methods are difficult to build high-precision models based on nonlinear data. In other fields, some scholars have related research on prediction problems. Yang proposed support vector regression machine (SVR) to predict landslide displacement [12]. In terms of nonlinear fitting, SVR shows advantages. However, its prediction accuracy is relatively low. Hsu proposed the Grey forecasting model to predict the demand and sales in the global integrated circuit industry [13]. Grey prediction model has high prediction accuracy for short-term prediction, and its calculation is simple. Kong proposed a long short-term memory (LSTM) to solve the problem of volatility and uncertainly in electric load prediction [14]. Although the LSTM method has certain advantages for nonlinear data, it is relatively simple to fit more information. To solve this problem, Li proposed an optimally combined PSO-SVR-NGM model based on the entropy weight method to construct slope displacement prediction model [15]. The combination model can make full use of the information of various single prediction model and meet higher standards of prediction accuracy. The various prediction models are compared as shown in Table 1.
Most of the research only analyzes the monitoring data, lacking comprehensive analysis for the real-time status of the equipment, which leads to one-sided and low real-time prediction results. Therefore, it is necessary to realize the interaction between the real operating status and virtual simulation by real-time monitoring data. It will be conducive to the comprehensive prediction of the equipment health status.
Digital Twins (DT) provide important theoretical basis and technical support for the connection and real-time interaction between virtual space and physical space [16]. DT is a digital model of the physical system that expresses all components and their states, and the model dynamically updates by monitoring the system state in real-time [17], which in other words, it would show the current state and predict its future state immediately and intuitively. Recently, the concept of Digital Twins (DT) has been proposed and gradually attracted widespread attention in smart manufacturing and complex system [18,19]. The most popular application is for PHM [20], especially in the aerospace field. Researchers have realized that the DT has the potential to optimize maintenance performance. The first application of DT was in 2011. AFRL proposed a DT conceptual model to predict the life of aircraft structure and assure its structural integrity [21]. Using the concept of dynamic Bayesian network, Li constructed wing health monitoring DT to predict the probability of crack growth and realized DT vision [22]. Luo studied a DT model and DT data approach to realize reliable PM of CNC machine tools [23]. Combining the machine learning model, Binderberger created a digital representation of humans, which could predict individual stress levels to monitor health [24]. Ding proposed a prediction method of shearer health status driven by the fusion of Digital Twins and deep learning [25].
Researchers have tried to construct the DT model in aircraft, industrial equipment, medical, and other fields using data-driven technology for PHM. Currently, there is no DT research applied to PHM in the railway field.
In order to solve the problems of poor accuracy and real-time of prediction results, DT can be introduced into PHM for switch machines. This paper proposed a PM approach for switch machines based on the DT, which improves the accuracy of the prediction results and fills research of the DT on the railway field for PHM. Modeling technologies are used to establish a high-guaranteed switch machine visualization model. Sensors obtain equipment parameters in real-time, and a large amount of historical data is processed and stored in the cloud storage files. To solve the problem of low prediction accuracy, a model combined LSTM and ARIMA by entropy weights is proposed, which comprises a real-time digital model that reflects and predicts the switch machine state. In addition, the prediction results are easy to be demonstrated in the visualization model, which helps the maintenance personnel to grasp the mechanism and more details.
The outline is organized as follows. Section 2 proposes the framework and methods of the DT of PM for switch machines. Then, Section 3 takes the switch machine gap as a case for verification and analyzes experimental results. Section 4 makes a summarization.

2. Framework and Method
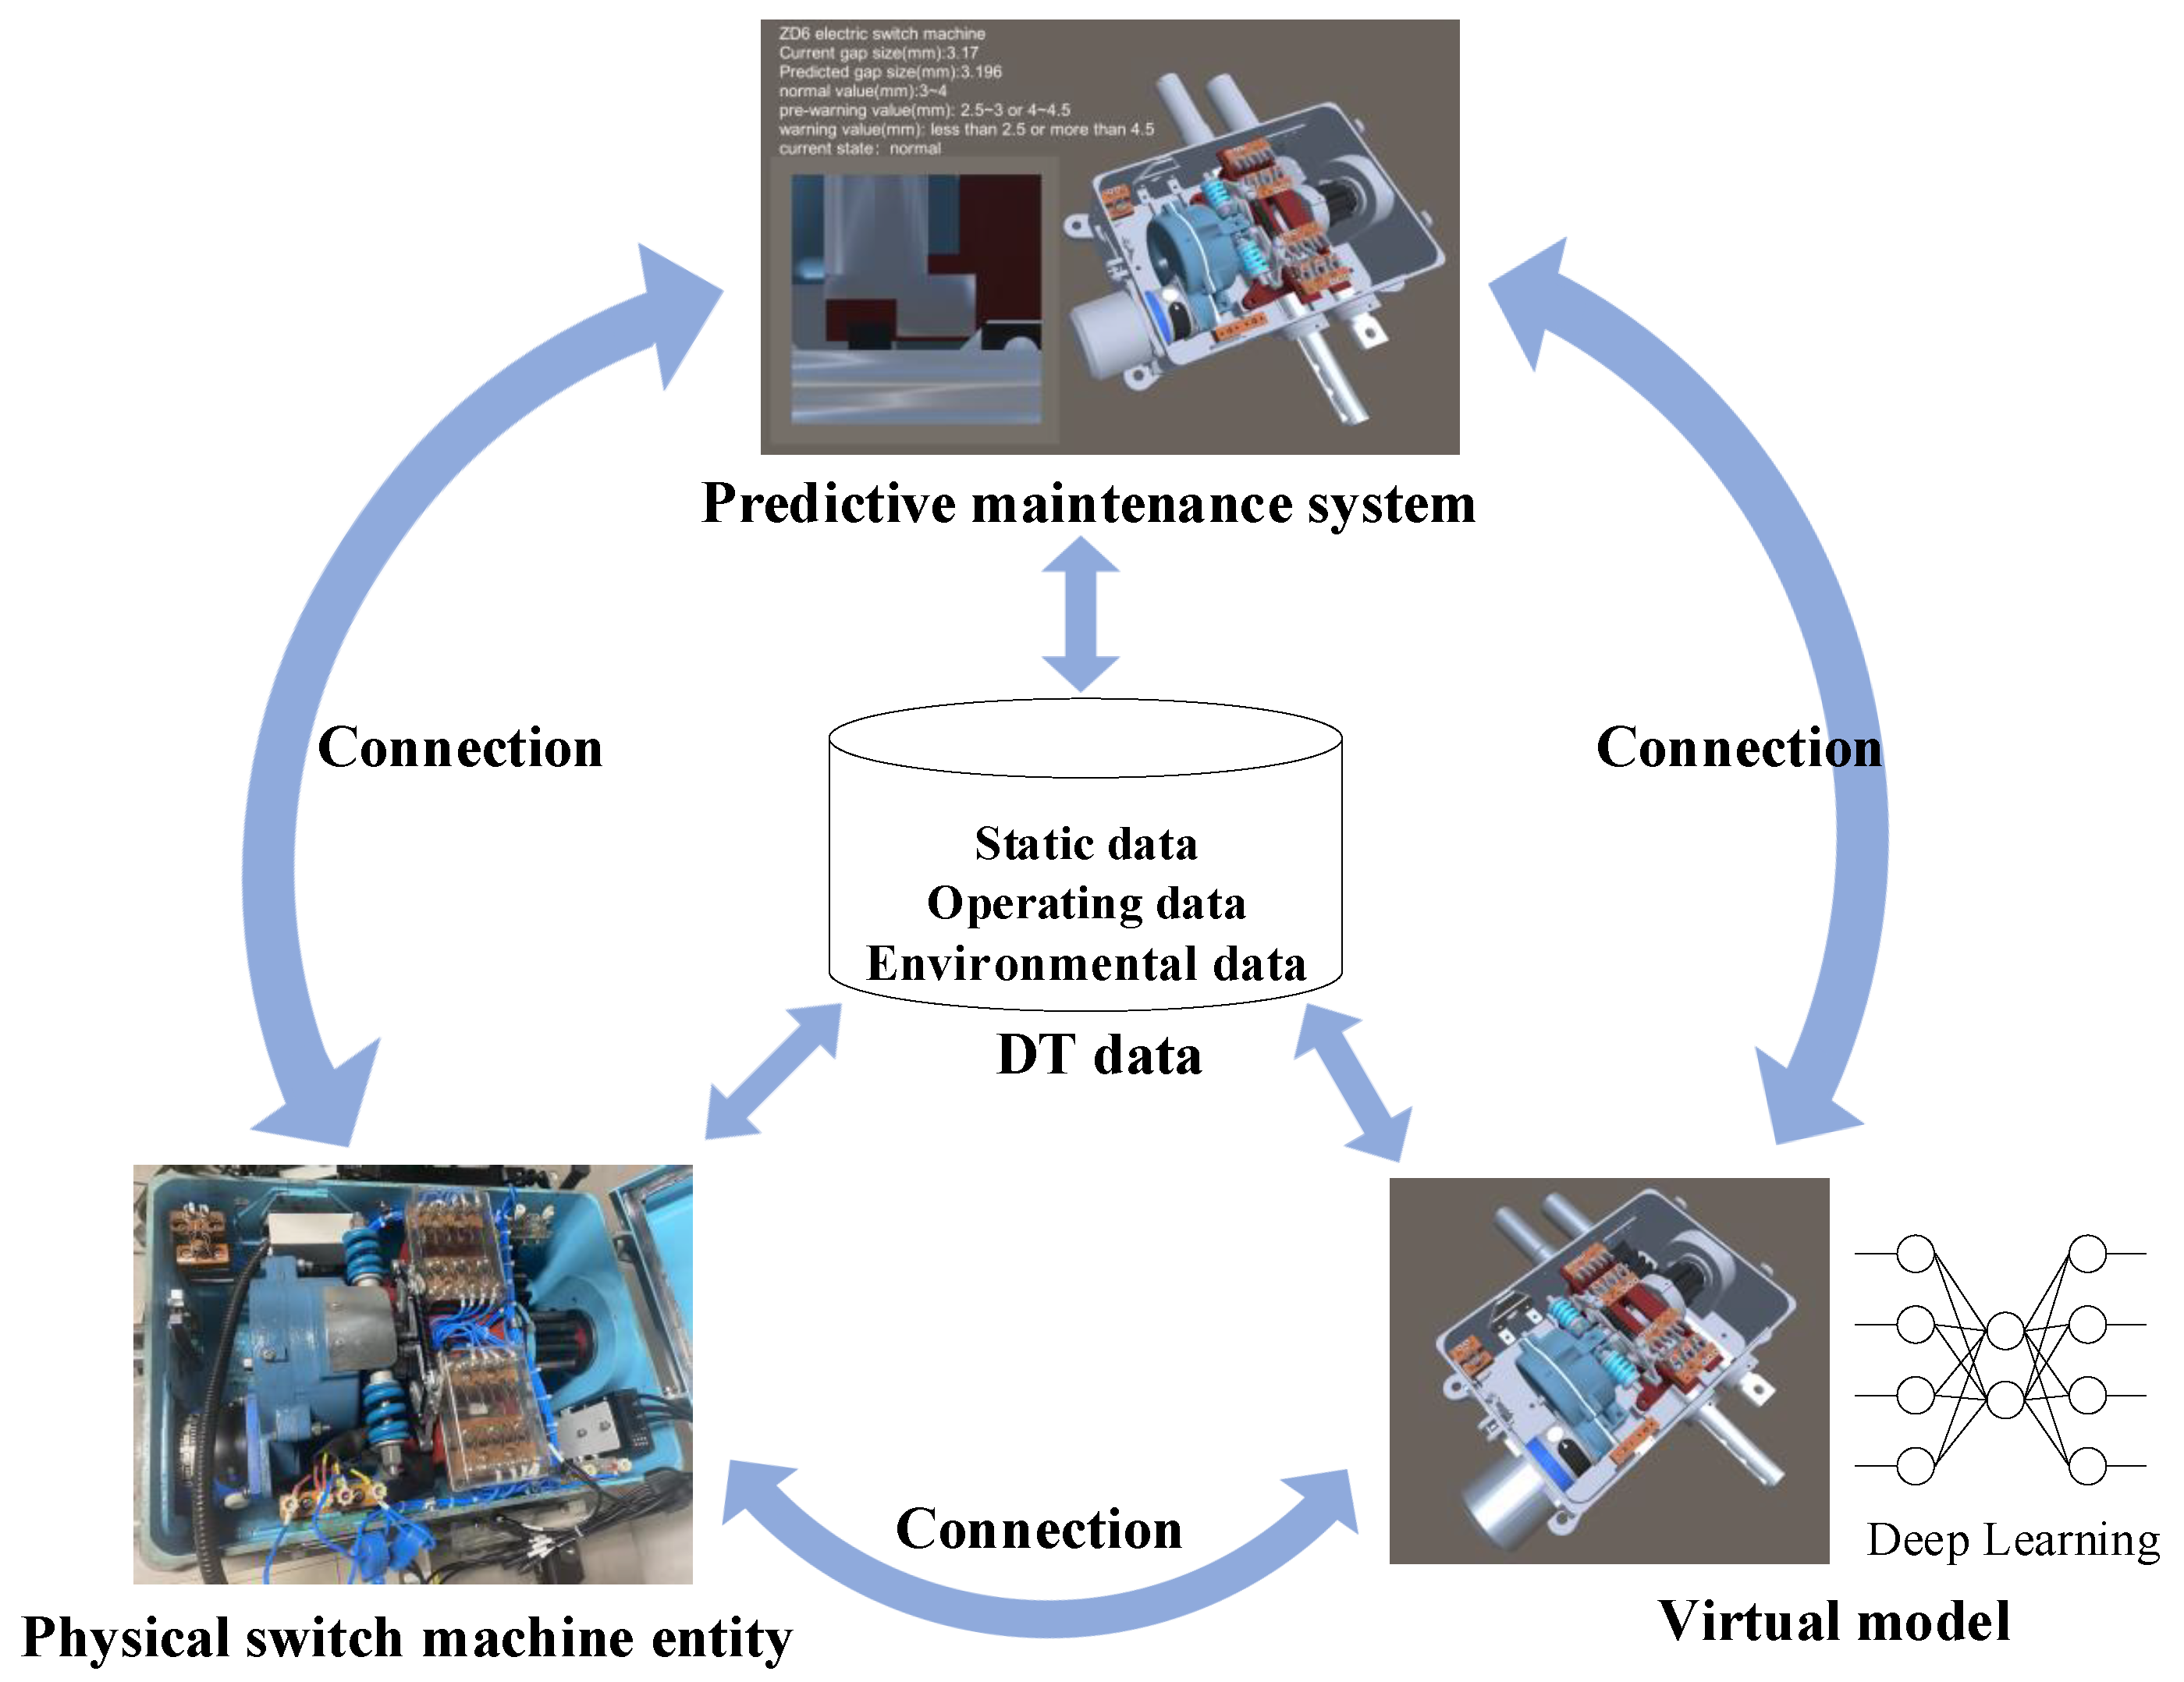
2.1. Overview

According to the five-dimension DT model proposed by Tao [26], a DT model for the switch machine can be structured by physical entity model (PE), Virtual Equipment model (VE), services model (Ss), DT Data model (DD), and Connection Model (CN). The DT structure of the switch machine is shown in Figure 1.
(1)
PE is a physical device of the switch machine, which provides parameters and data for DD.
(2)
VE is the core of the DT. It concludes visualization model and rule model, which is the key to realizing the switch machine’s visualization and prediction.
(3)
DD contains equipment static data, environmental data and real-time operating data collected by the Internet of Things. DD takes the change of data processing and data cleaning.
(4)
CN transmits information through the data communication mechanism.
(5)
Ss can visually present the prediction results to the maintenance personnel and provide solutions to the problem.
Among them, VE is the most important part in DT. VE includes the behavior model and rule model.

2.2. Behavior Model Construction

Firstly, a three-dimensional model is constructed based on solid modeling according to the physical parameters of switch machine elements. Then, after format conversion, import these elements into Unity3D and complete assembly based on cooperation and constraints of mechanical components. Operating data and dynamic parameters make a virtual model update and drive its behavior simulation.
Secondly, a rule model should be constructed by data-driven approach. The concept of data-driven has been extensively researched in many areas. This method could mine knowledge from the large amount of historical data of the switch machine and learn the healthy/unhealthy states of the switch machine. The constructed rule model could examine the switch machine performance and predict the possibility of equipment degradation.
Finally, the calculation of the rule model can be shown in the visualization model to provide guidance to operators.

2.3. Rule Model Construction

This paper utilizes the combined prediction model of LSTM and ARIMA based on entropy weight. This model can capture both linear patterns and nonlinear patterns. It involves the LSTM model, ARIMA model, and entropy weight method theory. Firstly, two single prediction models are established. Then, a combination prediction model based on the entropy weighting theory is obtained using the statistical error information from single prediction models. The process of combination model construction is shown in Figure 2.

2.3.1. LSTM Model

LSTM is a particular type of RNN, which could process and analyze time series [27]. LSTM can learn long-term dependency information.
The LSTM model contains a memory unit and three gate controllers (forget gate, input gate, and output gate). The forget gate determines what information should be discarded, the input gate determines which new input information should be saved in the memory unit, the output gate determines what information should be output, and the memory unit is adopted to store information for use in the next stage.
The training algorithm of the LSTM network is a back-propagation algorithm. The main steps are as follows [28].
(1) Based on the forward calculation algorithm, calculate forget gate output f t , input gate output i t , output gate output o t , and the output of the LSTM layer h t at time t.
f t = σ ( W f [ h t 1 , x t ] + b f ) ,
i t = σ ( W i [ h t 1 , x t ] + b i ) ,
o t = σ ( W o [ h t 1 , x t ] + b o ) ,
C t = f t C ( t 1 ) + i t ( tanh ( W C [ h t 1 , x t ] + b C ) ) ,
h t = o t tanh ( C t ) ,
where W = W f W i W C W o is weights, and b = b f b i b C b o is bias. σ and tanh are sigmoid and hyperbolic tangent activation functions, respectively, which play the role of gate. They describe the throughput of each part. They describe the throughput of each part.
(2) Reverse calculation of the error term of each LSTM cell. The error term can be represented by the mean square error (MSE).
M S E = 1 n i = 1 n y ^ i y i 2 ,
where y ^ is the network prediction value, and y is the actual value. There are two directions of error term propagation. One is along the time, and another is to spread to the previous layer.
(3) According to the error term, calculate the gradient of each weight.
(4) Update the weights by the gradient optimization algorithm.

2.3.2. ARIMA Model

The Autoregressive Integrated Moving Average (ARIMA) model is one of the most typical and widely used linear statistical models [29]. In the ARIMA model, the current value is assumed to have a linear relationship with the historical value and random interference. The goal of ARIMA is to find a linear function to express this linear relationship and predict current value based on historical value.
ARIMA can be regarded as the ARMA model after differential processing. The ARIMA model can be shortened as A R I M A ( p , d , q ) ( P , D , Q ) s .
Here, p, d, and q, respectively, represent the order of the autoregression (AR) of the model, the number of nonseasonal differences, and the order of the moving average (MA) of the model. P, D, and Q, respectively, represent the order of the seasonal autoregressive, the number of seasonal differences, and the order of the seasonal moving average.
Building a model includes the following three steps, model identification, parameter estimation, and diagnostic checking [30].
(1) Firstly, choose the appropriate value of d to convert non-stationary series into stationary series. Then, test the stationarity of series according to the Augmented Dickey-Fuller (ADF). Analyze the autocorrelation coefficient function (ACF) and partial autocorrelation function (PACF) plots to determine the parameters of the seasonal part (P and Q), and the nonseasonal part (p and q).
(2) The best parameters combination can be estimated by Bayesian Information Criterion.
(3) The estimated model should be checked whether it fits these data. If the prediction error is white noise, it demonstrates that the model extracts the information from the original. Meanwhile, the ACF of the prediction error will be very low.

2.3.3. Entropy Weight Method

Shannon introduced the concept of entropy into information theory to describe the amount of object’s information in 1984 and named it information entropy. Information entropy is an objective measure of the degree of disorder of information. The idea of the entropy weight method is that the greater the amount of information in the indicator, the lower the entropy is, and the higher the weight is. Therefore, the entropy weight method has strong operability and objectivity. The processes of calculating weights are as follows.
Supposed there are m objects and n indexes. Let X be a known index matrix, where the element x i j represents the j-th index of the i-th evaluation object. X is the normalized matrix of X. benefit object [31].
x i j = x i j min x i max x i min x i , for benefit indexes max x i x i j max x i min x i , for cost indexes .
The entropy p i of the i-th evaluation object could be calculated by
p i = 1 ln n j = 1 n x i j ln x i j ,
where it is assumed that, when x i j = 0 , x i j ln x i j = 0 . The weight w i of the i-th object can be calculated by
w i = 1 p i m i = 1 m p i .

3. Experiment

The PM system based on DT for switch machine can monitor and predict the state of the switch machine, such as the closed state of turnout, the loss of the automatic switch, the loss of the reducer, etc. This paper takes the prediction of turnout closed state as an example for research.
This paper selects the ZD6 electric switch machine as an example object. Experiment data were sampled from September to November 2020 at a station, and the sampling interval is 2 h. There are total 648 time series points to be researched for verifying the validity of the approach. The change of the switch gap can be considered as a time series to study.

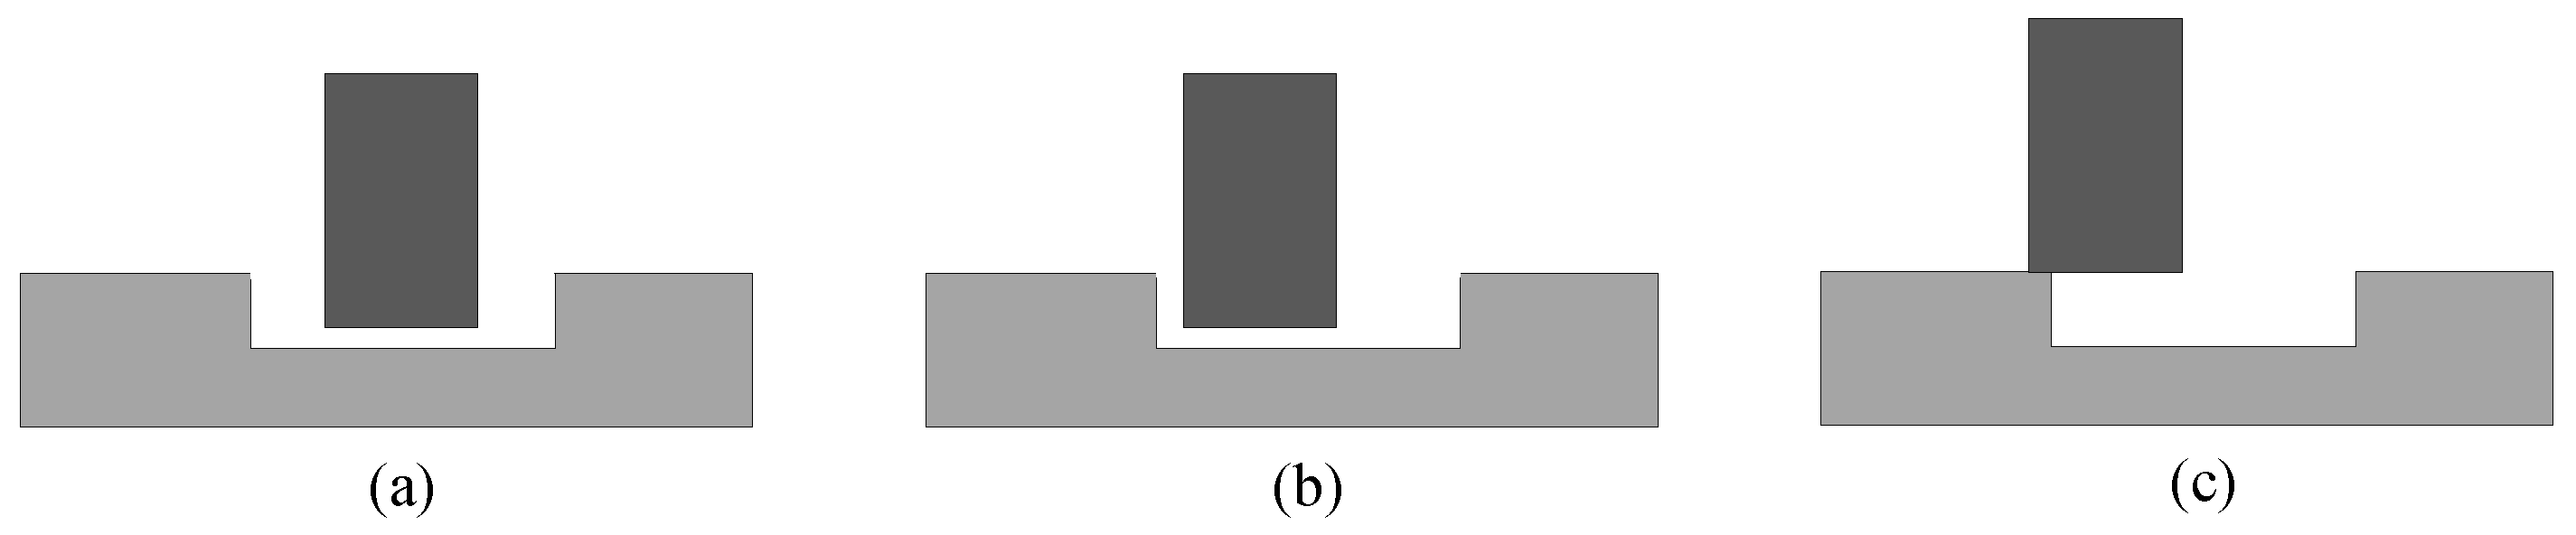
3.1. Principle of Switch Machine Gap

The task of the switch machine changes the switch rails position and locks it in their place. The turnout contact state can be expressed by switch machine gap value. As shown in Figure 3, the gap size ( Δ L1 or Δ L2) can reveal the relative displacement of the indication rod and indirectly measure the degree of contact of the switch rail and the stock rail, supervising the state of the road in the terminal position.
As shown in Figure 4a, under normal conditions, the switch rail would closely contact with the stock rail and the gap size would be normal. The corresponding circuits could complete disconnected and connected work. As shown in Figure 4b, under abnormal conditions, if the switch rail does not closely contact with the stock rail, the gap size will be too large or too small [32], even the indicator piece could not fall into the notch as shown in Figure 4c.
The switch machine gap value is related to the operating state of the switch machine. Whether the switch machine will keep working in a normal state can be judged by predicting the change of gap value. If the switch machine gap size exceeds the standard, maintenance personnel need to check operation on-site to ensure the normal operation of the switch machine.

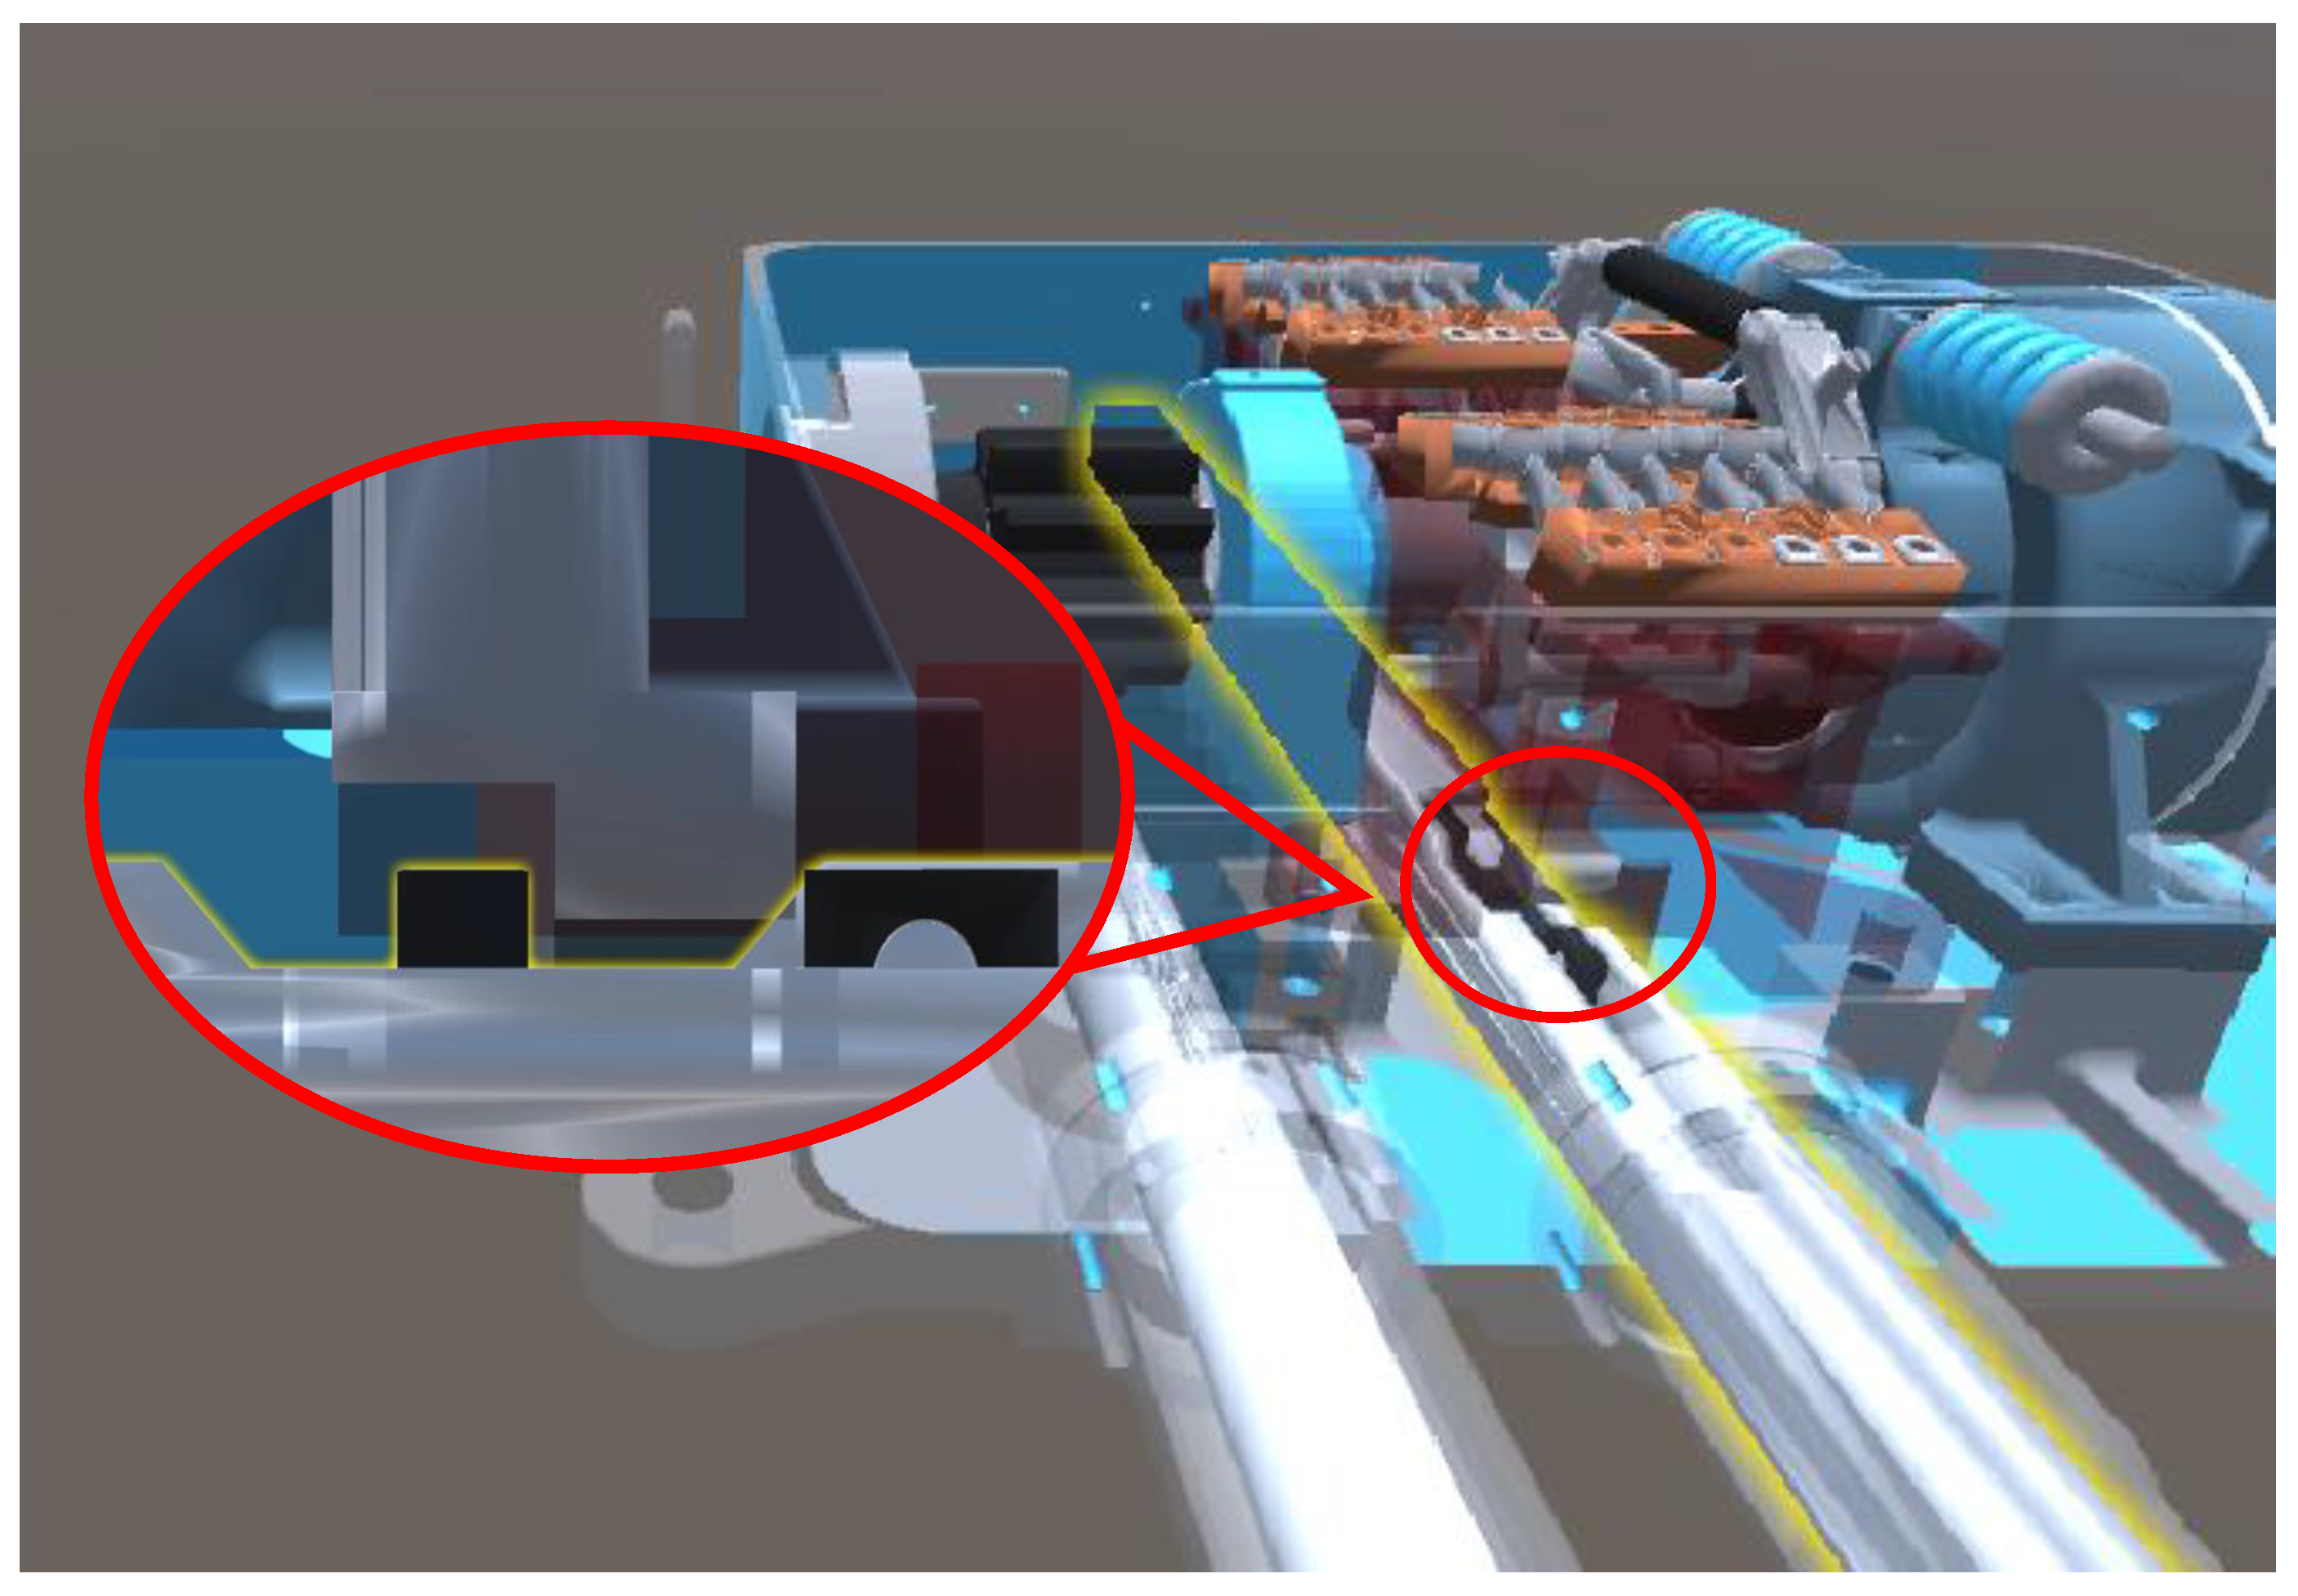
3.2. The Construction of Behavior Model

According to the method mentioned in Section 2, the visualization model is constructed. Figure 5 shows the behavior simulation of the physical switch machine in normal and reverse directions. The virtual model mirrors and visualizes the real-time state of the switch machine in physical space and provides a decision-making solution for its PM.

3.3. Combination Prediction Model

The gap value data in DD is selected to verify the predictive performance of the combined prediction model. The data from November 3rd to November 10th data is used as a test set. All other data is used as a training set to construct a model. The first step is to train the LSTM model and ARIMA model.
The LSTM prediction model involves a large number of parameters. The experimental platform is based on the Keras framework. Based on experience and multiple experiment comparisons, the LSTM model parameters that minimize the average prediction error are determined. The length of the segmentation window for the model is set as 30. There are three hidden layers, and the number of hidden layer neurons are 128, 32, and 64, respectively. In order to prevent over-fitting, a Dropout layer is added after each layer of the loop structure, and the value is set to 0.2. Epochs and batch size are set to 350 and 32, respectively. The batch size is 32, the loss function is the mean square error (MSE), the activation function is tanh function, and the optimizer chooses Nadam.
The most important process of ARIMA model construction is to determine the orders. It can be seen that the time series is non-stationary and seasonal fluctuations. Hence, we applied both nonseasonal ( d = 1 ) difference and seasonal difference ( D = 1 ) to eliminate non-stationarity. Analyze its ACF plot and PACF plot after first-order difference. Figure 6a,b, respectively, show the ACF plot and PACF plot of differential time series. For the seasonal part of the ARIMA model, there was a significant spike at lag 12 in the ACF plot ( Q = 1 ), but there was no significant spike at lag 12 or 24 in the PACF plot ( P = 0 ). For the nonseasonal part of the ARIMA model, in the first cycle, there were two significant spikes (lag 1 and lag 10) in the ACF plot and three significant spikes (lag 2, lag 10, and lag 11) in the PACF plot. After further fitting and bias information criteria for comparison, we finally chose ( 11 , 1 , 2 ) ( 0 , 1 , 1 ) 1 2 ARIMA model.
The second step is to determine the weight of the model according to the information entropy of the models. The selection of evaluation indexes and evaluation objects is crucial. We select the absolute value of the error between the actual value and the predicted value of the two single prediction methods as the evaluation indexes (n = 2). Meanwhile, five days before a test day are selected as the evaluation objects (m = 60). The weights of the two models of the combination prediction model are obtained by calculation. The weights of the two single models are shown in Table 2.
Figure 7 shows the prediction results of the two single models and the combination model.

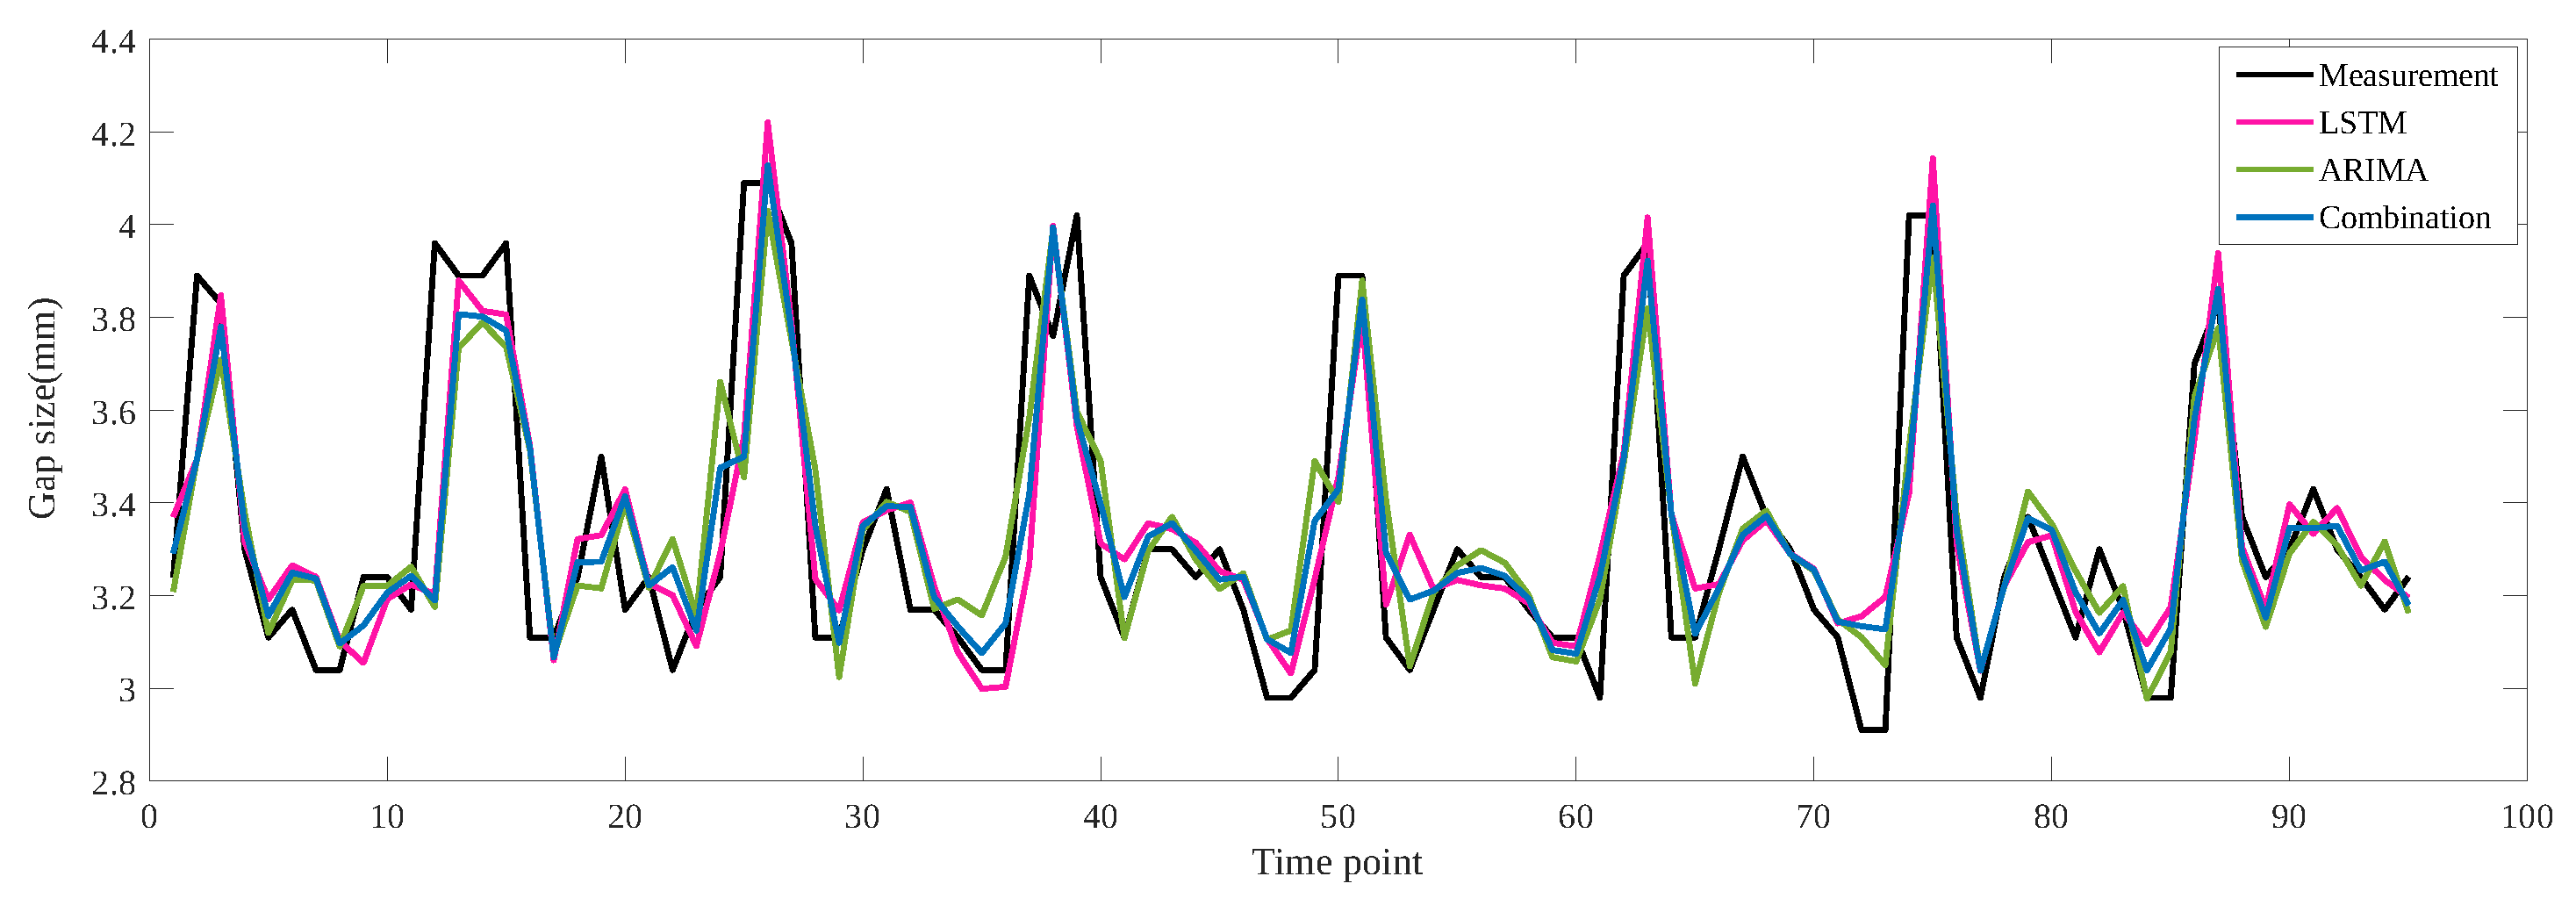
3.4. Results and Analysis

From the comparison, it can be seen that the prediction result of the combination prediction model is closer to the actual value than the prediction result of the single prediction models, and the prediction effect is better. There are three general indicators for evaluating the performance of time series prediction models: Root Mean Squared Error (RMSE), mean absolute error (MAE), and mean absolute percentage error (MAPE). The computing formulas for the RMSE is as follows [33]:
R M S E = 1 N i = 1 N y i y ^ i 2 ,
M A E = 1 N i = 1 N y i y ^ i ,
M A P E = 100 % N i = 1 N y i y ^ i y i .
Table 3 shows the RMSE of the two single method prediction models and the entropy-weighted combination prediction model. It shows that RMSE, MAE, and MAPE of the combination model were less than those of the other two single models in the numerical values, which shows that the combination prediction model based on entropy weight has the better fitting ability and more robust stability than the single prediction method. The entropy weight method evaluates the amount of information contained in a single prediction method and then calculates and sets the weights of various single methods in different prediction days. Hence, the combination prediction model based on the entropy method utilizes the explicit and implicit information contained in each prediction models, avoids the concentrated influence of multiple factors on the prediction accuracy, balances the deviation of each single prediction model, and fully integrates information. Finally, the prediction accuracy can be improved, indicating the superiority and feasibility of the proposed method.
The gap prediction results can be visualized in the virtual model. If there is an abnormality in the prediction result of the gap in the next day, the indicator rod in the model will show an exception to remind the maintenance personnel to arrange an inspection. Figure 8 is the diagram of the virtual model pre-warning.

3.5. Discussion

Overall, this paper establishes the DT model of switch machine. Taking the gap in the switch machine as an example, combining the current behavior simulation and the prediction result of the switch machine gap, we can estimate the future state of switch machine. On switch machine PM task, compared with other prediction methods, the approach proposed has good performance and strong applicability and makes switch machine maintenance proactive, reliable, and economical.

4. Conclusions

To reduce maintenance cost, improve the prediction accuracy, and provide a visualization tool in switch machines on PM tasks, we proposed a DT approach. Firstly, we built a high-fidelity model of the physical switch machine to map it, which realizes the real-time mapping between the virtual model and the physical entity, and visually displays the physical equipment’s state. Then, the LSTM-ARIMA combination model was utilized as the inference algorithm to predict the state of the switch machine indirectly. The intelligent switch machine DT system realized the visual monitoring, as well as the state prediction. Meanwhile, it can provide technical support for its maintenance issues. Combining the visual model of the switch machine and the state prediction results, the maintenance personnel can reasonably arrange the maintenance plan. This approach can predict the switch machine state in advance to improve the reliability of the switch machine and avoid affecting the driving efficiency.
In future work, data from different sources of switch machines can be fed to the DT model. The DT framework can be applied to the PM for switch machines, and even other equipment.

Author Contributions

J.Y.; methodology, software, validation, resources, writing—original draft preparation, Y.S.; methodology, writing—review and editing. Y.C.; writing—review and editing. X.H.; data curation, writing—review and editing. All authors have read and agreed to the published version of the manuscript.

Funding

This work was supported by the National Natural Science Foundation of China (No. U1934219, and No. U1734211), the National Science Fund for Excellent Young Scholars (No. 52022010), and the Science and Technology Research and Development Plan of China National Railway Corporation Limited (No. 2020G019).

Institutional Review Board Statement

Not applicable.

Informed Consent Statement

Not applicable.

Data Availability Statement

Not applicable.

Conflicts of Interest

The authors declare no conflict of interest.

Abbreviations

The following abbreviations are used in this manuscript:
DTDigital Twins
PMpredictive maintenance
PHMPrognostic and Health Management
LSTMLong short-term memory
ARMAAutoregressive moving average
SVRsupport vector regression
ARIMAAutoregressive Integrated Moving Average

References

  1. Cao, Y.; Wen, J.; Ma, L. Tracking and collision avoidance of virtual coupling train control system. Future Gener. Comput. Syst. 2021, 120, 76–90. [Google Scholar] [CrossRef]
  2. Cao, Y.; Zhang, Y.; Wen, T.; Li, P. Research on dynamic nonlinear input prediction of fault diagnosis based on fractional differential operator equation in high-speed train control system. Chaos 2019, 29, 1. [Google Scholar] [CrossRef]
  3. Cao, Y.; Wang, Z.; Liu, F.; Li, P.; Xie, G. Bio-inspired speed curve optimization and sliding mode tracking control for subway trains. IEEE Trans. Ehicular Technol. 2019, 68, 6331–6342. [Google Scholar] [CrossRef]
  4. Zhong, Z.; Tang, T.; Wang, F. Research on fault feature extraction and diagnosis of railway switches based on PLSA and SVM. J. China Railw. Soc. 2018, 40, 80–87. [Google Scholar]
  5. Cao, Y.; Li, P.; Zhang, Y. Parallel processing algorithm for railway signal fault diagnosis data based on cloud computing. Future Gener. Comput. Syst. 2018, 88, 279–283. [Google Scholar] [CrossRef]
  6. Sun, Y.; Cao, Y.; Xie, G.; Wen, T. Sound based fault diagnosis for RPMs based on multi-scale fractional permutation entropy and two-scale algorithm. IEEE Trans. Veh. Technol. 2021, 70, 11184–11192. [Google Scholar] [CrossRef]
  7. Ardakani, H.D.; Lucas, C.; Siegel, D.; Chang, S.; Dersin, P.; Bonnet, B.; Lee, J. PHM for railway system—A case study on the health assessment of the point machines. In Proceedings of the 2012 IEEE Conference on Prognostics and Health Management, Beijing, China, 23–25 May 2012; pp. 1–5. [Google Scholar]
  8. Sun, Y.; Cao, Y.; Ma, L. A fault diagnosis method for train plug doors via sound signals. IEEE Intell. Transp. Syst. Mag. 2021, 13, 107–117. [Google Scholar] [CrossRef]
  9. Garrido-Hidalgo, C.; Hortelano, D.; Roda-Sanchez, L.; Olivares, T.; Ruiz, M.C.; Lopez, V. IoT heterogeneous mesh network deployment for human-in-the-loop challenges towards a social and sustainable industry 4.0. IEEE Access 2018, 6, 28417–28437. [Google Scholar] [CrossRef]
  10. Guclu, A.; Yılboga, H.; Eker, O.F.; Camci, F.; Jennions, I. Prognostics with Autoregressive Moving Average for Railway Turnouts. Annual Conference of the PHM Society. IEEE Trans. Instrum. Meas. 2010, 2, 1901. [Google Scholar]
  11. Liu, Z. Prediction research of point switch loophole by of polynomial fitting. Heilongjiang Sci. 2020, 11, 9–11. [Google Scholar]
  12. Yang, F.; Xu, Q.; Fan, X.; Ye, W. Prediction of landslide displacement time series based on support vector regression machine with artificial bee colony algorithm. J. Eng. Geol. 2019, 27, 880–889. [Google Scholar]
  13. Hsu, L. Applying the Grey prediction model to the global integrated circuit industry. Technol. Forecast. Soc. Chang. 2003, 70, 563–574. [Google Scholar] [CrossRef]
  14. Kong, W.; Dong, Z.; Jia, Y.; Hill, D.; Xu, Y.; Zhang, Y. Short-Term Residential Load Forecasting Based on LSTM Recurrent Neural Network. IEEE Trans. Smart Grid 2019, 10, 841–851. [Google Scholar] [CrossRef]
  15. Li, Q.; Pei, H.; Song, H.; Zhu, H. Prediction of Slope Displacement Based on PSO-SVR-NGM Combined with Entropy Weight Method. 2021. Available online: http://150.138.141.24/kcms/detail/detail.aspx?filename=GCDZ2021062100C&dbcode=CJFD&dbname=CAPJ2021 (accessed on 15 October 2021).
  16. Nikolaos, N.; Kosmas, A.; Evangelos, X.; George, C. The digital twin implementation for linking the virtual representation of human-based production tasks to their physical counterpart in the factory-floor. Int. J. Comput. Integr. Manuf. 2019, 32, 1–12. [Google Scholar] [CrossRef]
  17. Zhuang, C.; Liu, J.; Xiong, H.; Ding, X.; Liu, S.; Weng, G. Connotation, architecture and trends of product digital twin. Comput. Integr. Manuf. Syst. 2017, 23, 753–768. [Google Scholar]
  18. Napoleone, A.; Macchi, M.; Pozzetti, A. A review on the characteristics of cyber- physical systems for the future smart factories. J. Manuf. Syst. 2020, 54, 305–335. [Google Scholar] [CrossRef]
  19. Qiao, Q.; Wang, J.; Ye, L.; Gao, R.X. Digital Twin for Machining Tool Condition Prediction. Procedia CIRP 2019, 81, 1388–1393. [Google Scholar] [CrossRef]
  20. Tao, F.; Zhang, H.; Liu, A.; Nee, A. Digital twin in industry: State-of-the-art. IEEE Trans. Ind. Inform. 2019, 15, 2405–2415. [Google Scholar] [CrossRef]
  21. Tuegel, E.J.; Ingraffea, A.R.; Eason, T.G. Reengineering Aircraft Structural Life Prediction Using a Digital Twin. Int. J. Aerosp. Eng. 2011, 2011, 154798. [Google Scholar] [CrossRef] [Green Version]
  22. Li, C.; Mahadevan, S.; You, L.; Choze, S.; Wang, L. Dynamic bayesian network for aircraft wing health monitoring digital twin. AIAA J. 2017, 55, 930–941. [Google Scholar] [CrossRef]
  23. Luo, W.; Hu, T.; Ye, Y.; Zhang, C.; Wei, Y. A hybrid predictive maintenance approach for CNC machine tool driven by Digital Twin. Robot.-Comput.-Integr. Manuf. 2020, 65, 101974. [Google Scholar] [CrossRef]
  24. Scheuermann, C.; Binderberger, T.; Frankenberg, N.; Werner, A. Digital Twin: A Machine Learning Approach to Predict Individual Stress Levels in Extreme Environments. In Adjunct Proceedings of the 2020 ACM International Joint Conference on Pervasive and Ubiquitous Computing and Proceedings of the 2020 ACM International Symposium on Wearable Computers; Association for Computing Machinery: New York, NY, USA, 2020; Volume 8, pp. 657–664. [Google Scholar]
  25. Ding, H.; Yang, L.; Yang, Y.; Wang, Y. Health Prediction of Shearers Driven by Digital Twin and Deep Learning. China Mech. Eng. 2020, 31, 815–823. [Google Scholar]
  26. Tao, F.; Zhang, M.; Liu, Y.; Nee, A.Y.C. Digital twin driven prognostics and health management for complex equipment. CIRP Ann. 2018, 67, 169–172. [Google Scholar] [CrossRef]
  27. Kaveh, K.; Kaveh, H.; Bui, M.D.; Rutschmann, P. Long short-term memory for predicting daily suspended sediment concentration. Eng. Comput. 2021, 37, 2013–2027. [Google Scholar] [CrossRef]
  28. Liu, Z.; Meng, X.; Wei, H. A Regularized LSTM Method for Predicting Remaining Useful Life of Rolling Bearings. Int. J. Autom. Comput. 2021, 18, 581–593. [Google Scholar] [CrossRef]
  29. Contreras, J.; Espinola, R.; Nogales, F.J.; Conejo, A.J. ARIMA models to predict next-day electricity prices. IEEE Trans. Power Syst. 2003, 18, 1014–1020. [Google Scholar] [CrossRef]
  30. Liu, L.; Luan, R.; Yin, F.; Zhu, X.; Lu, Q. Predicting the incidence of hand, foot and mouth disease in Sichuan province, China using the ARIMA model. Epidemiol. Infect. 2016, 144, 144–151. [Google Scholar] [CrossRef] [Green Version]
  31. Yang, X.; Liu, H.; Zhang, B.; Chen, S. A Combination method for photovoltaic power forecasting based on entropy weight method. Acta Energ. Solaris Sin. 2014, 35, 744–749. [Google Scholar]
  32. Yang, L.; Liu, J.; Chen, L. Detection rod gap jamming fault at second traction point of S700K switch machine for urban rail transit. Railw. Signal Commun. Eng. 2021, 18, 67–71, 85. [Google Scholar]
  33. Kim, T.; Cho, S. Predicting residential energy consumption using CNN-LSTM neural networks. Energy 2019, 182, 72–81. [Google Scholar] [CrossRef]
Figure 1. DT structure of the switch machine.
Information 12 00485 g001
Figure 2. The process of combination model construction.
Information 12 00485 g002
Figure 3. The relationship between gap and turnout.
Information 12 00485 g003
Figure 4. Schematic diagram of gap size: (a) gap size is normal. (b) gap size is too large or too small. (c) indicator piece could not fall into notch.
Information 12 00485 g004
Figure 5. The behavior simulation of the switch machine: (a) in normal directions; (b) in reverse direction.
Information 12 00485 g005
Figure 6. (a) The ACF plot of differential time series; (b) the PACF plot of differential time series.
Information 12 00485 g006
Figure 7. The prediction results of three models.
Information 12 00485 g007
Figure 8. The diagram of the virtual model pre-warning.
Information 12 00485 g008
Table 1. Comparison of various prediction models.
AuthorModelAdvantageDisadvantage
GucluARMAThe calculation is simple.It is difficult to capture nonlinear information.
LiuPolynomialsThe calculation is simple.It is difficult to capture nonlinear information and only suit for small simple.
YangSVRIt could capture nonlinear information.The prediction accuracy is relatively low.
HsuGrey forecastingThe prediction accuracy is relatively high for short term and calculation is simple.It is not suit for long-term predictions.
KongLSTMIt could capture nonlinear information and suit for long-term predictions.It is relatively simple to fit more information.
Table 2. Weights of single model based on entropy weight.
Date w 1 (LSTM) w 2 (ARIMA)
3 November0.51170.4883
4 November0.50130.4987
5 November0.51270.4873
6 November0.52190.4781
7 November0.50690.4931
8 November0.52290.4771
9 November0.52380.4762
10 November0.52330.4767
Table 3. The evaluation indicators of the prediction models.
MethodRMSE (mm)MAE (mm)MAPE
LSTM model0.19980.13703.9855%
ARIMA model0.20670.14184.1420%
Combination model0.19550.13183.8435%
Publisher’s Note: MDPI stays neutral with regard to jurisdictional claims in published maps and institutional affiliations.

