Article

DBA_SSD: A Novel End-to-End Object Detection Algorithm Applied to Plant Disease Detection

1
School of Mechanical Engineering, Guizhou University, Guiyang 520025, China
2
State Key Laboratory of Public Big Data, Guizhou University, Guiyang 550025, China
*
Author to whom correspondence should be addressed.
Information 2021, 12(11), 474; https://doi.org/10.3390/info12110474
Submission received: 20 October 2021 / Revised: 13 November 2021 / Accepted: 13 November 2021 / Published: 16 November 2021

Abstract

:
In response to the difficulty of plant leaf disease detection and classification, this study proposes a novel plant leaf disease detection method called deep block attention SSD (DBA_SSD) for disease identification and disease degree classification of plant leaves. We propose three plant leaf detection methods, namely, squeeze-and-excitation SSD (Se_SSD), deep block SSD (DB_SSD), and DBA_SSD. Se_SSD fuses SSD feature extraction network and attention mechanism channel, DB_SSD improves VGG feature extraction network, and DBA_SSD fuses the improved VGG network and channel attention mechanism. To reduce the training time and accelerate the training process, the convolutional layers trained in the Image Net image dataset by the VGG model are migrated to this model, whereas the collected plant leaves disease image dataset is randomly divided into training set, validation set, and test set in the ratio of 8:1:1. We chose the PlantVillage dataset after careful consideration because it contains images related to the domain of interest. This dataset consists of images of 14 plants, including images of apples, tomatoes, strawberries, peppers, and potatoes, as well as the leaves of other plants. In addition, data enhancement methods, such as histogram equalization and horizontal flip were used to expand the image data. The performance of the three improved algorithms is compared and analyzed in the same environment and with the classical target detection algorithms YOLOv4, YOLOv3, Faster RCNN, and YOLOv4 tiny. Experiments show that DBA_SSD outperforms the two other improved algorithms, and its performance in comparative analysis is superior to other target detection algorithms.

1. Introduction

Plants are susceptible to various diseases, thereby affecting their quality and yield seriously. The formulation of prevention and control plans as soon as possible before the outbreak of the diseases can maximize the effect of prevention and control and reduce economic losses. Therefore, the identification of plant diseases is an effective way to inhibit the rapid development of diseases and avoid their occurrence. Previously, People are used to making subjective judgments by crop disease category, and often disease detection is expert-based, making it a costly and error-prone process.
Agricultural detection based on artificial intelligence, such as crop yield prediction [1], weed identification processing [2], and plant disease detection [3,4], is widely used with the development of artificial intelligence technology. Machine learning-based disease detection requires preprocessing the dataset, extracting the features of disease regions in the image using feature extraction algorithms, sending the obtained feature information to the classifier to obtain the model parameters, and obtaining the disease categories and the degree of disease to be detected. However, the model generalization ability is weak because of the machine learning-based image recognition. When the number of categories is excessive, the features of each class cannot be distinguished effectively. Moreover, the categories can only be recognized in a specific image context. Thus, the needs of large-scale planting, based on which it is important to research a fast end-to-end plants disease detection method, cannot be met.
In recent years, CNNs have been increasingly incorporated in plant phenotyping concepts. They have been very successful in modeling complicated systems, owing to their ability of distinguishing patterns and extracting regularities from data. Examples further extent to variety identification in seeds [5] and in intact plants by using leaves [6]. And some of the latest network models have been applied to the classification of plant diseases. Longsheng Fu [7] proposed an orchard kiwi fruit target detection algorithm. According to the characteristics of kiwi fruit images, the 3 × 3 and 1 × 1 convolutions were introduced into the YOLOv3-tiny [8] model, DY3TNet model was proposed and combined with R- CNN, YOLOv2 and YOLOv3-tiny are compared. The experimental results show that the improved DY3TNet model is small in size and high in efficiency. Guoxu Liu et al. [9] detected tomatoes based on the YOLOv3 model [10], combined dense structure for feature extraction, replaced traditional R-Bbox with C-Bbox, matched the shape of the tomato, reduced the number of parameters, and compared YOLOv2, and Faster RCNN [11]. Literature [12] proposed a tomato gray spot recognition method based on Mobilenev2 and YOLOv3 lightweight network model. This method improves the accuracy of tomato gray spot recognition by introducing GIOU regression loss function, and uses a pre-training method that combines hybrid training and migration learning to improve the generalization ability of the model. Literature [13] compared the performance of five networks, namely, AlexNet [14], VGG-16 [15], ResNet-101, DenseNet-161 [16], and SqueezeNet [17] for nutrient deficiency symptom identification based on the Deep Nutrient Deficiency for Sugar Beet dataset and discussed their limitations.
Building a fast and high classification accuracy model is necessary to determine the detection quality of plant disease. The current mainstream target recognition networks include YOLO series, Faster RCNN, SSD [18], and FPN. The SSD target detection network uses an end-to-end method to regress features and extracts different levels of image features, which cover low-level and high-level semantic information. Previous studies have shown that the SSD network is fast. However, the direct application of SSD methods to detect plant disease cannot meet the high precision requirements in agricultural production. This paper proposes a fusion residual network and 1 × 1 convolution feature extraction module. It strengthens the feature extraction capability of SSD and improves the positioning and recognition accuracy of SSD for detecting plant disease. We also use data-enhancement to perform spatial transformation and pixel transformation on images, thereby not only improving the abundance of algorithm features, detection accuracy, and detection efficiency but also reduces the labor costs for agricultural plant disease detection. In addition, Images under analysis were obtained by employing cameras operating in the visible portion of the electromagnetic spectrum (400–700 nm). In this way, costly equipment or trained personnel are not required for obtaining the input data [19]. Therefore, future users of the developed protocol can acquire data through affordable/cost-effective, portable (thus in situ) and rapid means.
This study focuses on proposing a novel end-to-end plant disease detection algorithm called Deep Block Attention SSD (DBA_SSD) for plant leaves. Our main work and contributions are presented as follows:
(1)
We proposed a novel end-to-end detection algorithm for plant disease, DBA_SSD, by combining the attention mechanism and convolution kernel, which combines the attributes of the plant leaf disease pictures and pay more attention to disease details when testing plant disease.
(2)
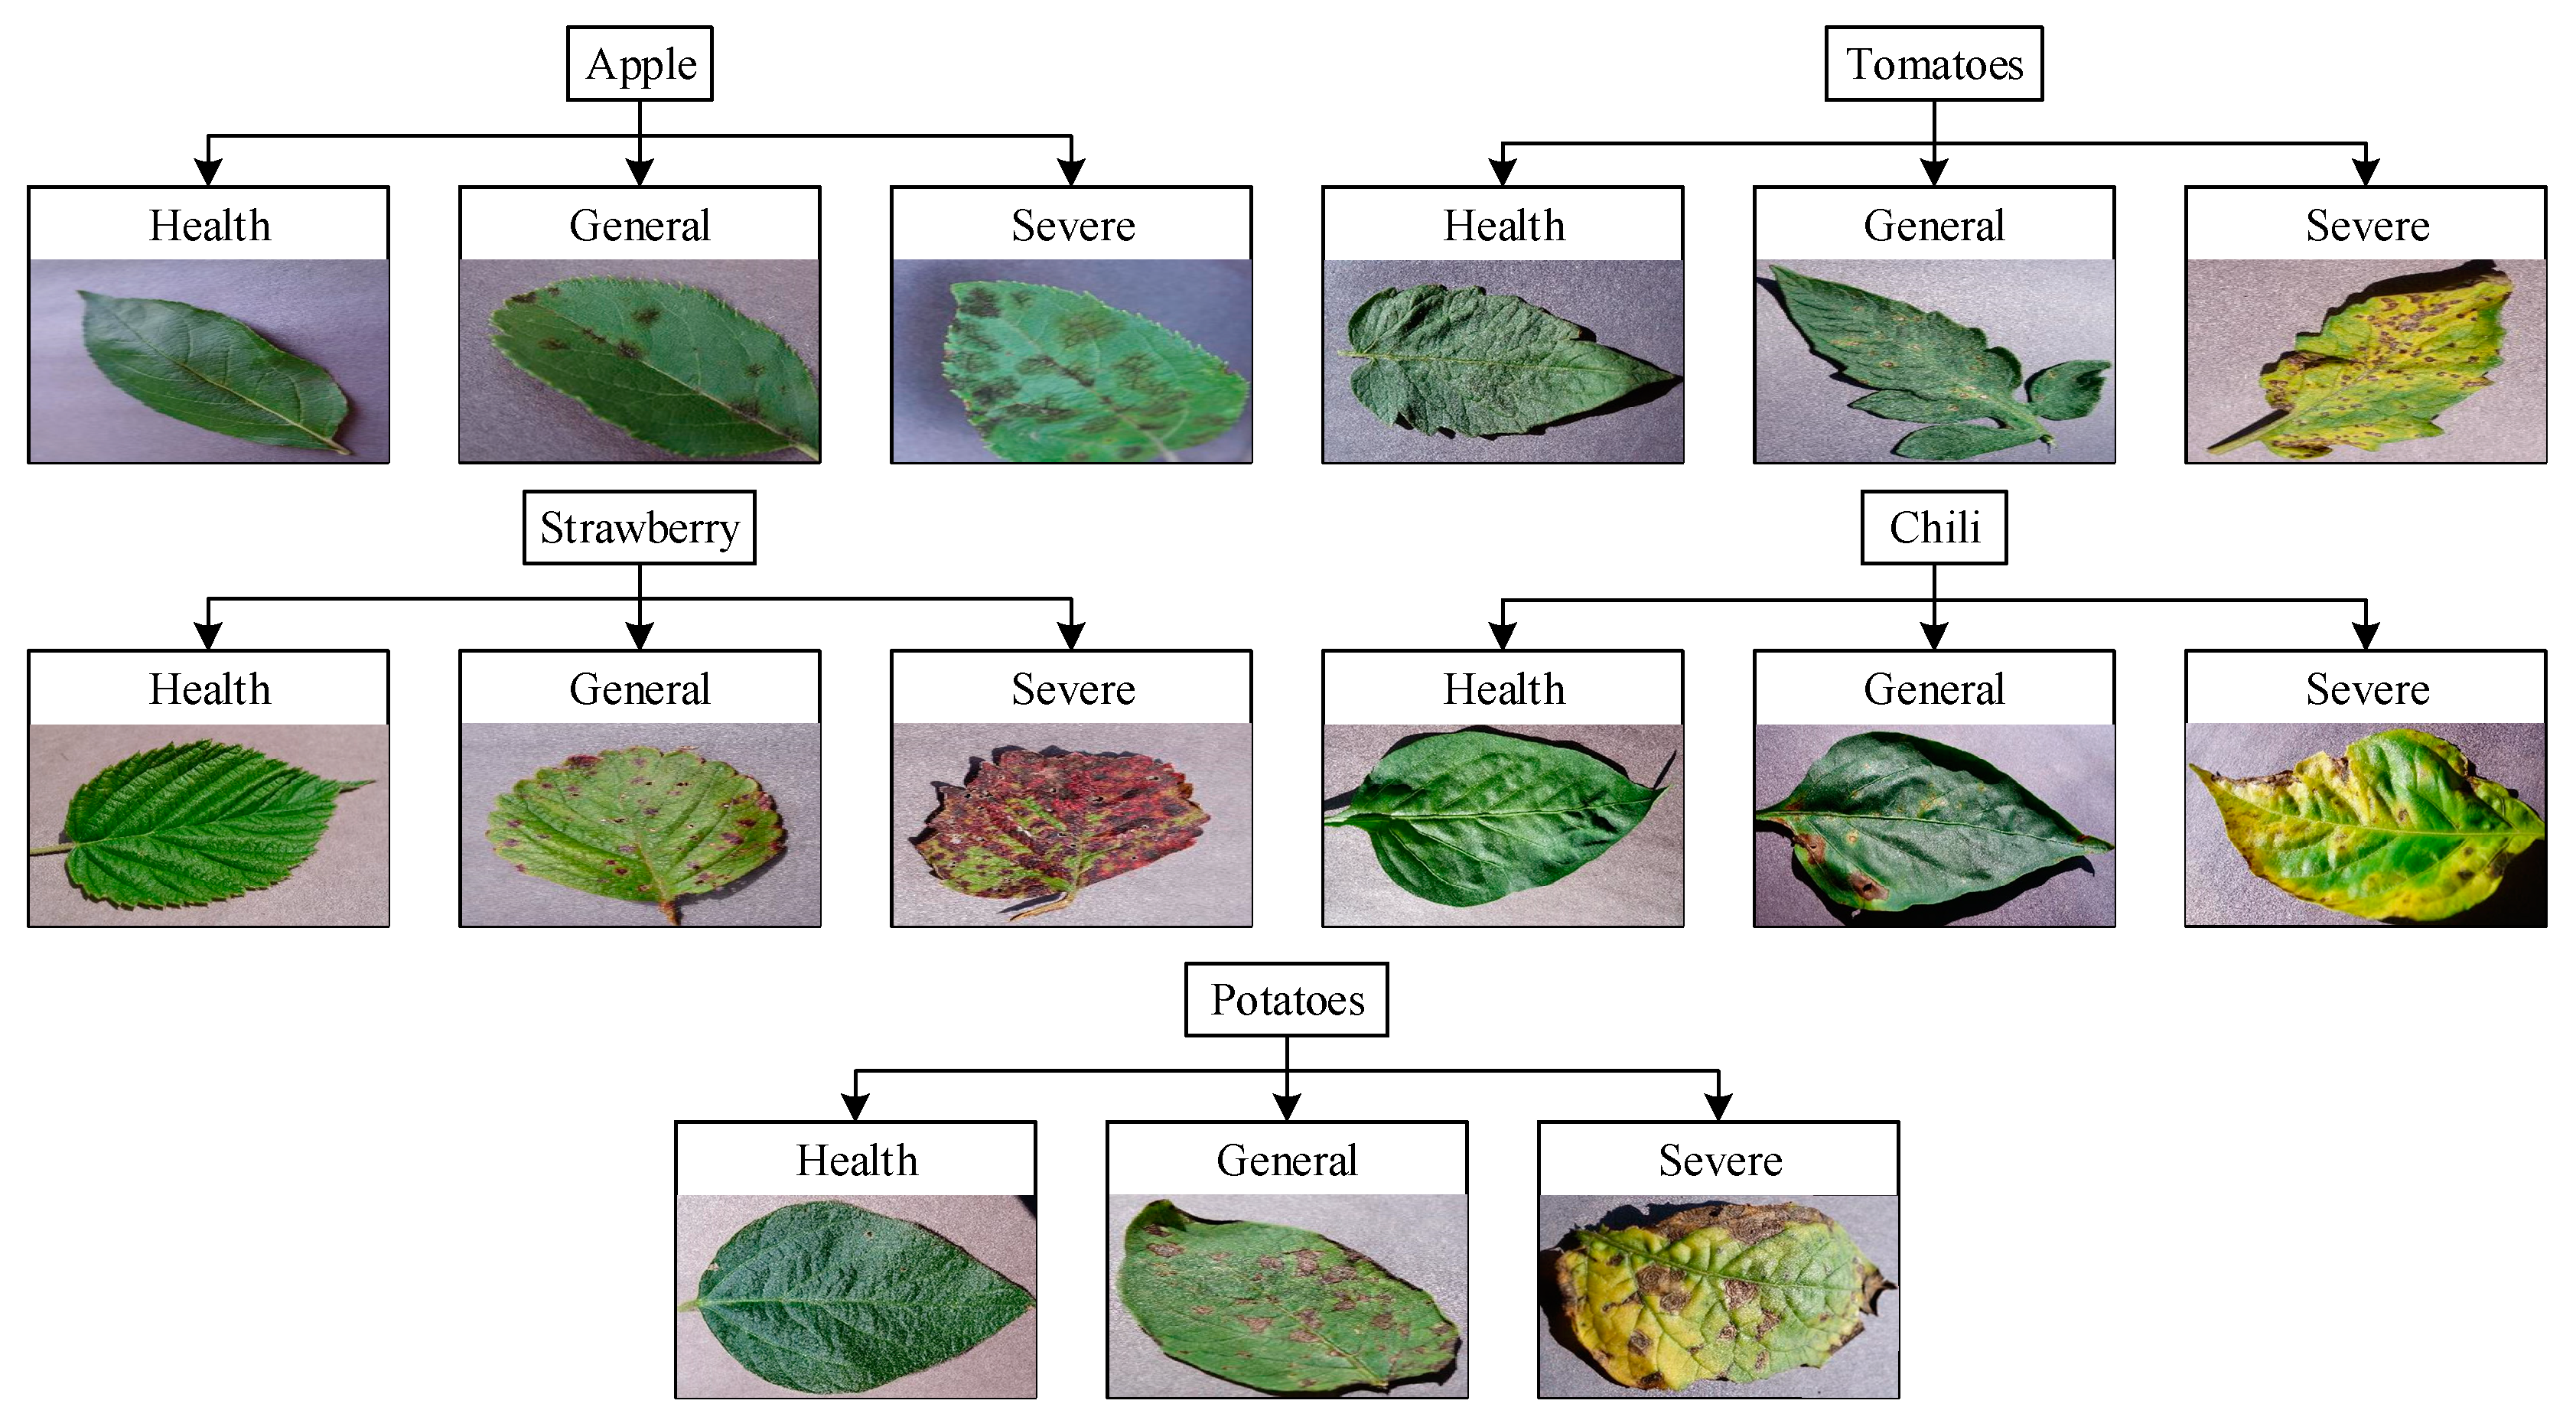
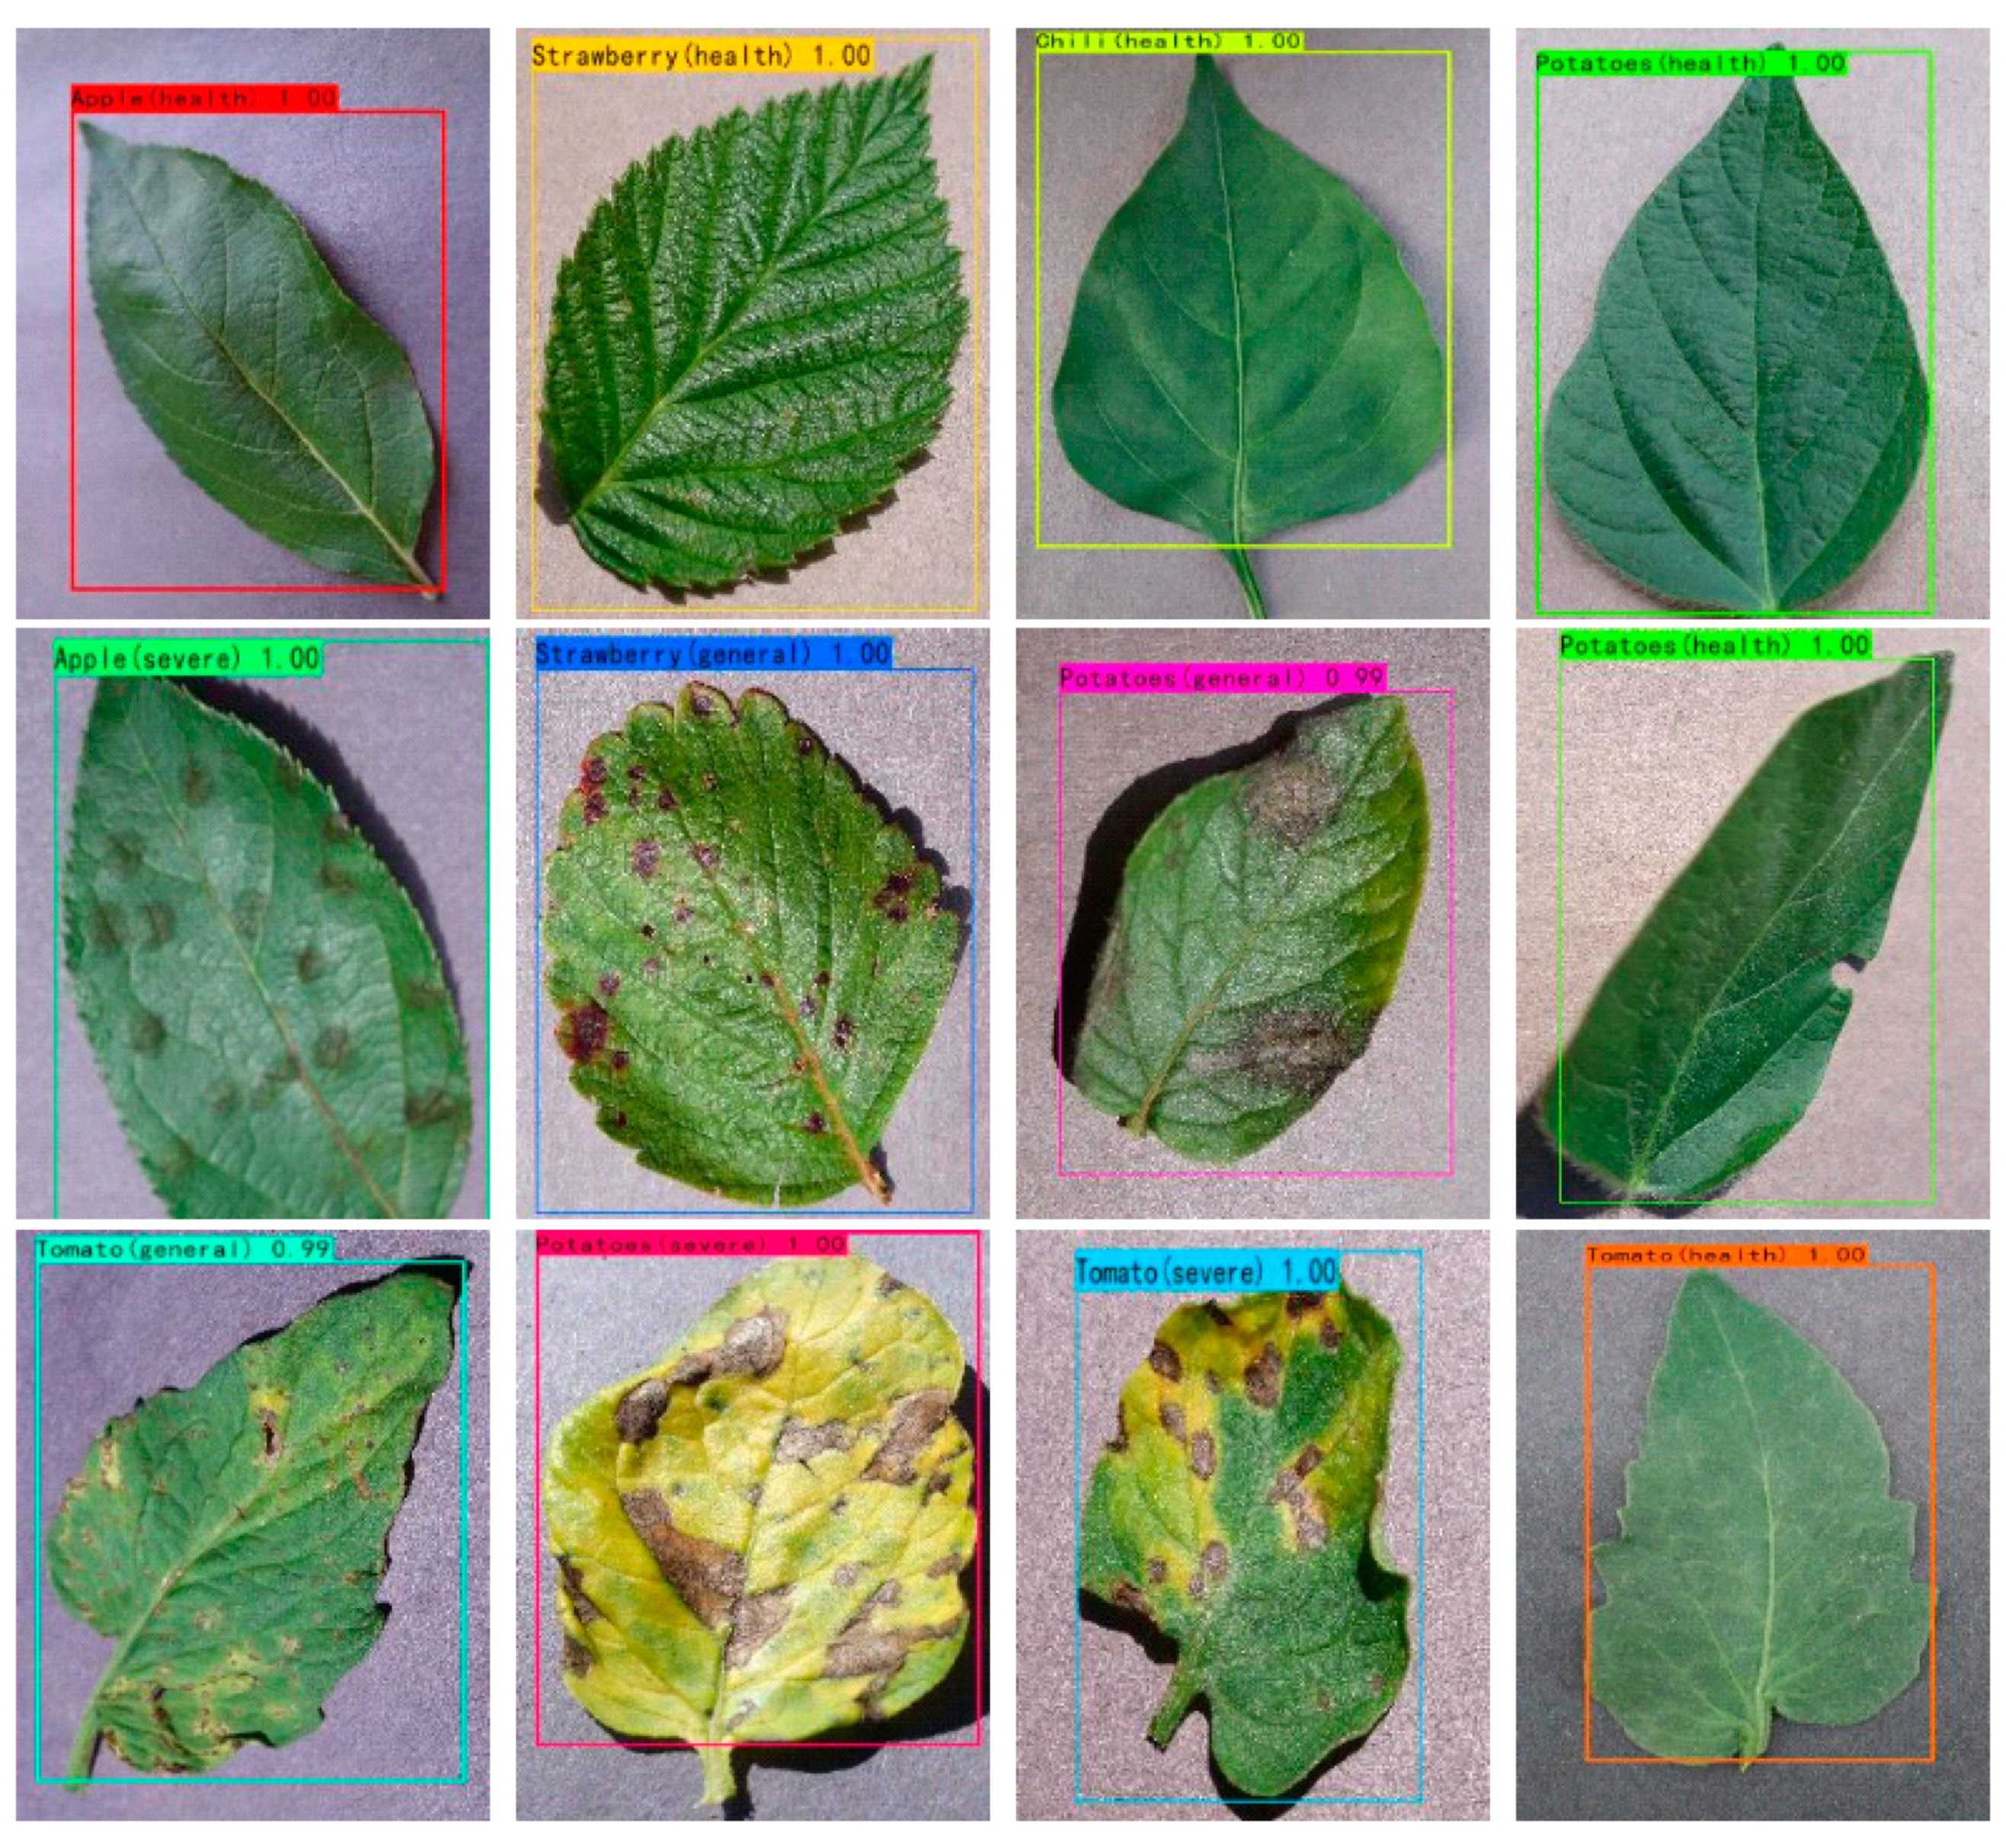
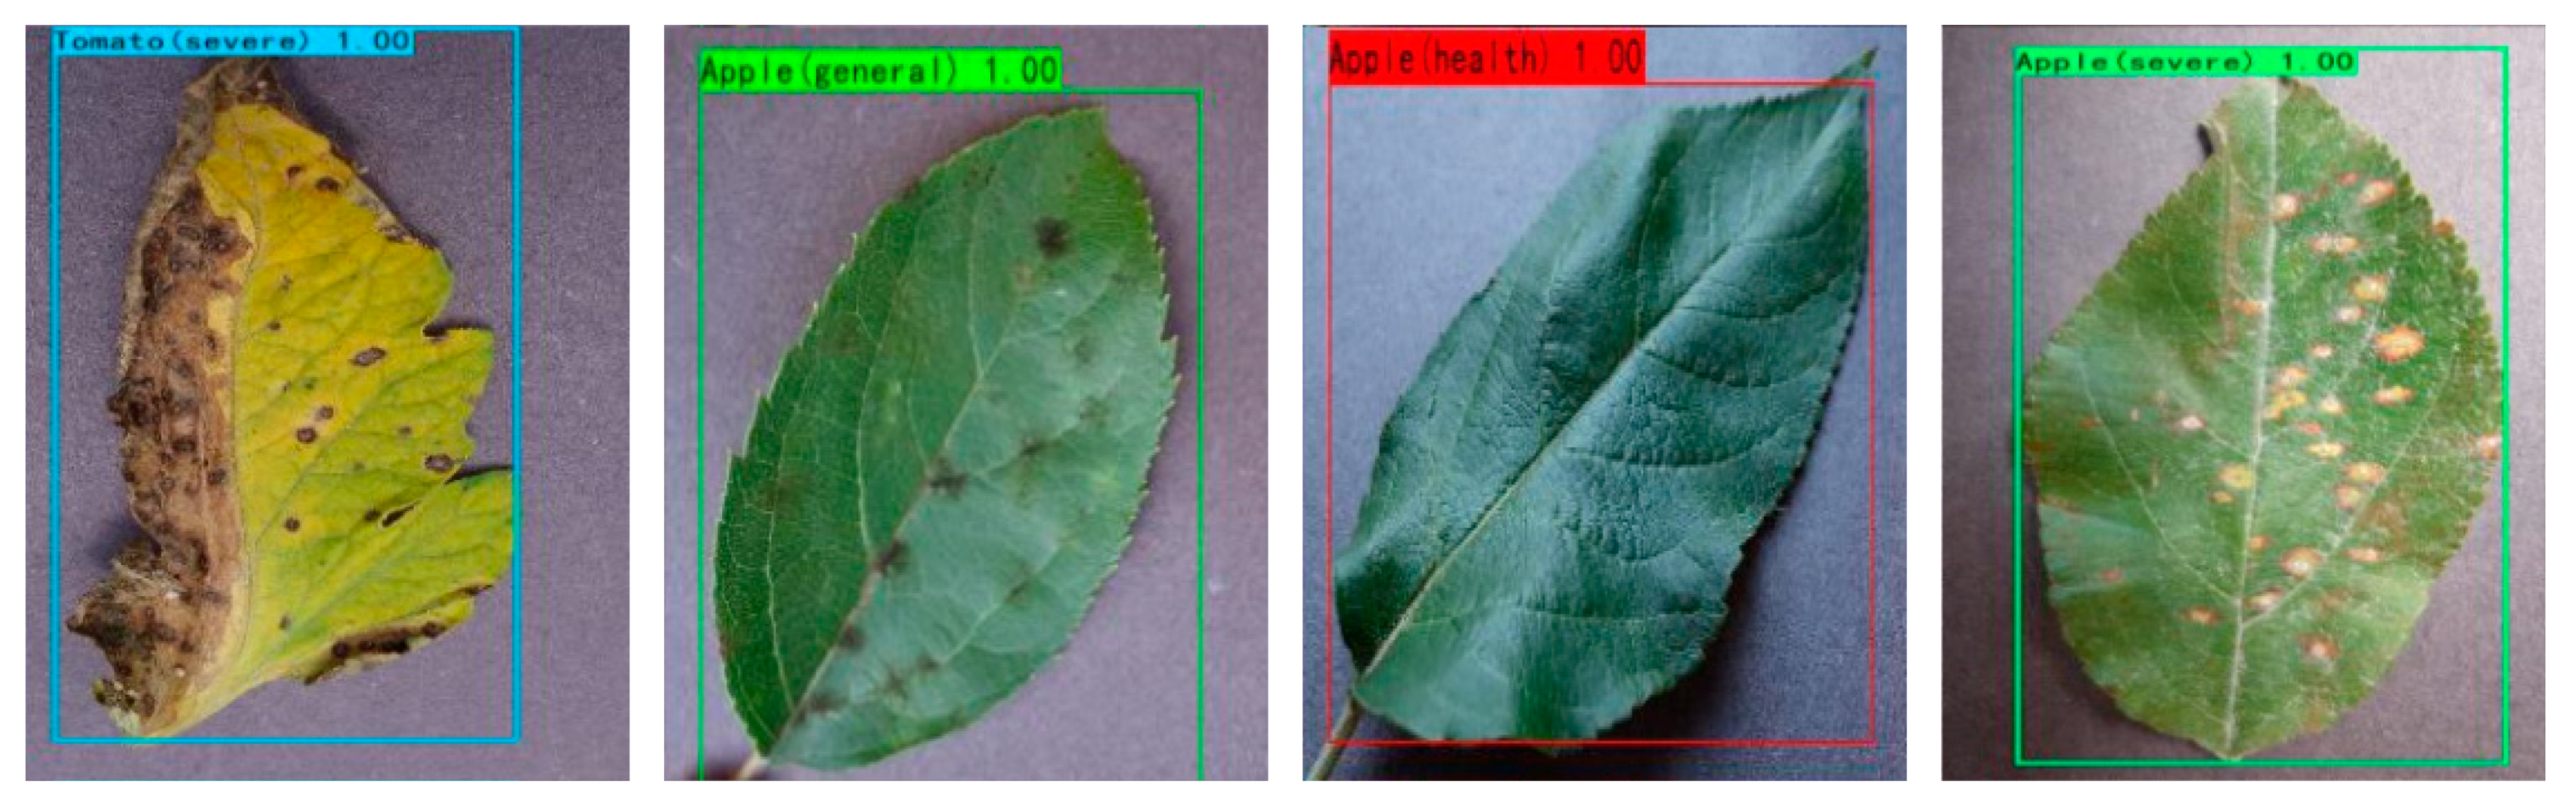
We graded the health of the fruit and vegetable leaves. According to the research results of the paper, different measures can be taken according to the severity of the diseases of the fruit and vegetable leaves. Increasing the yield of plants is of great significance.
(3)
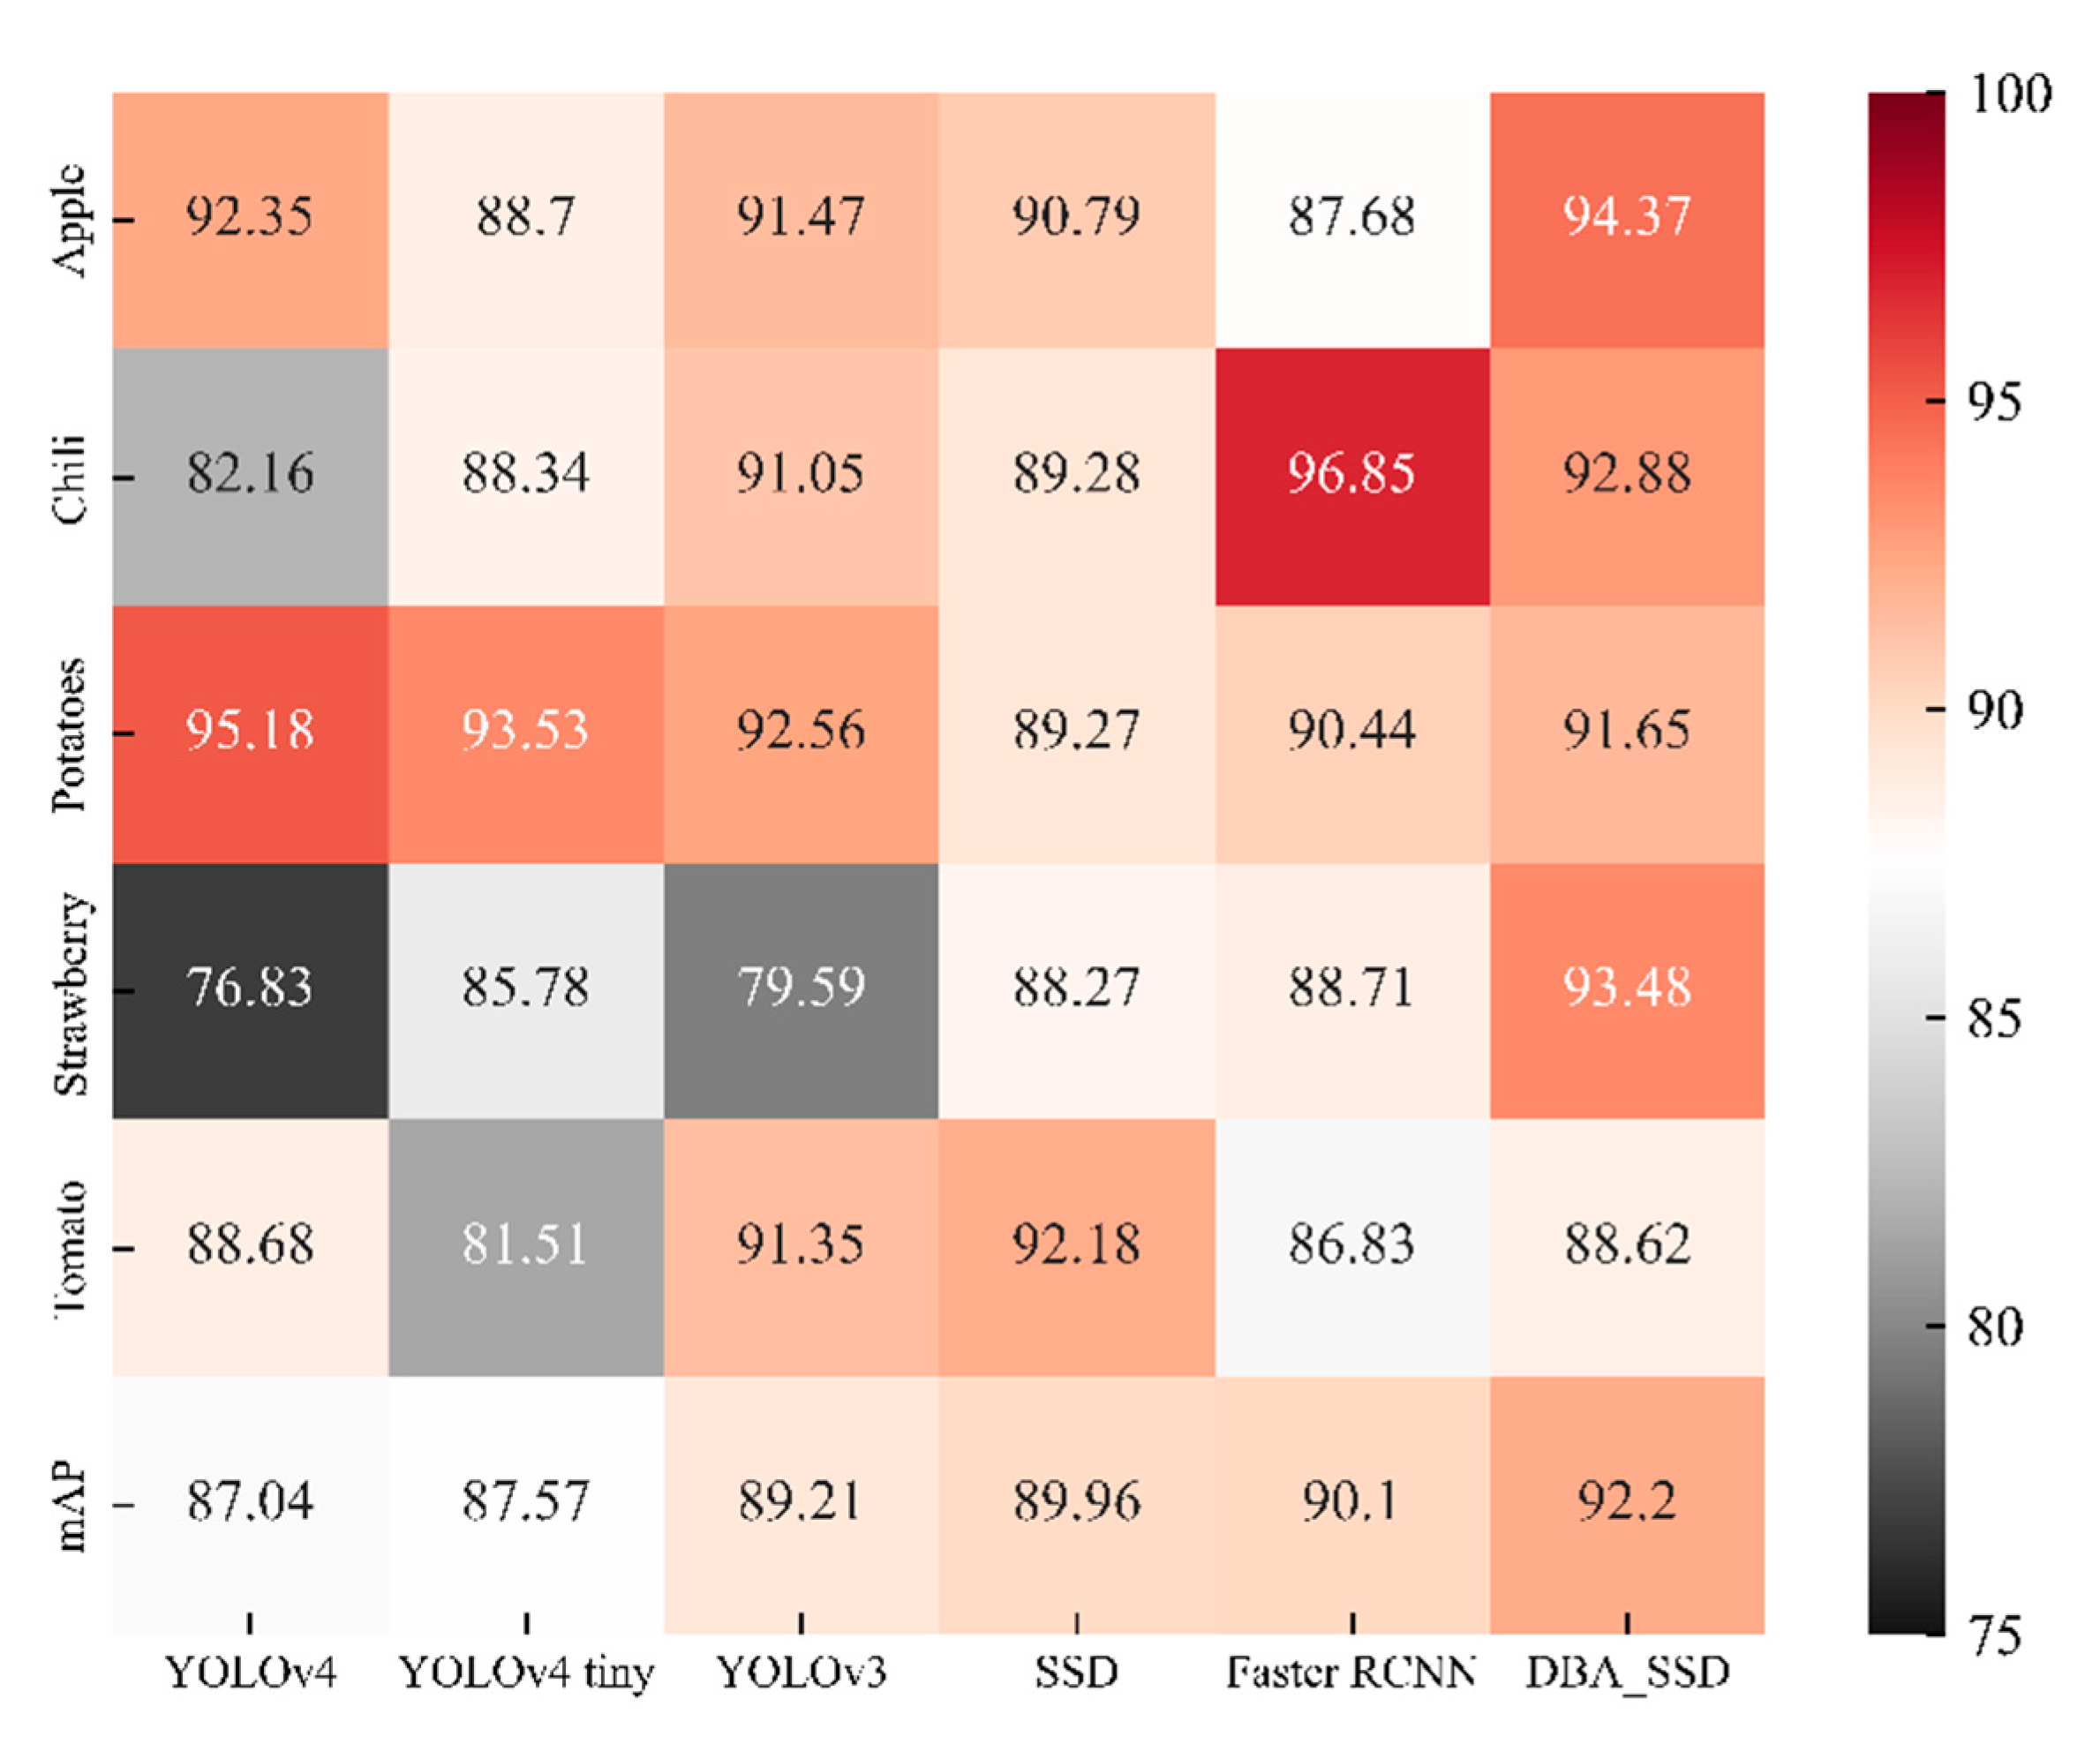
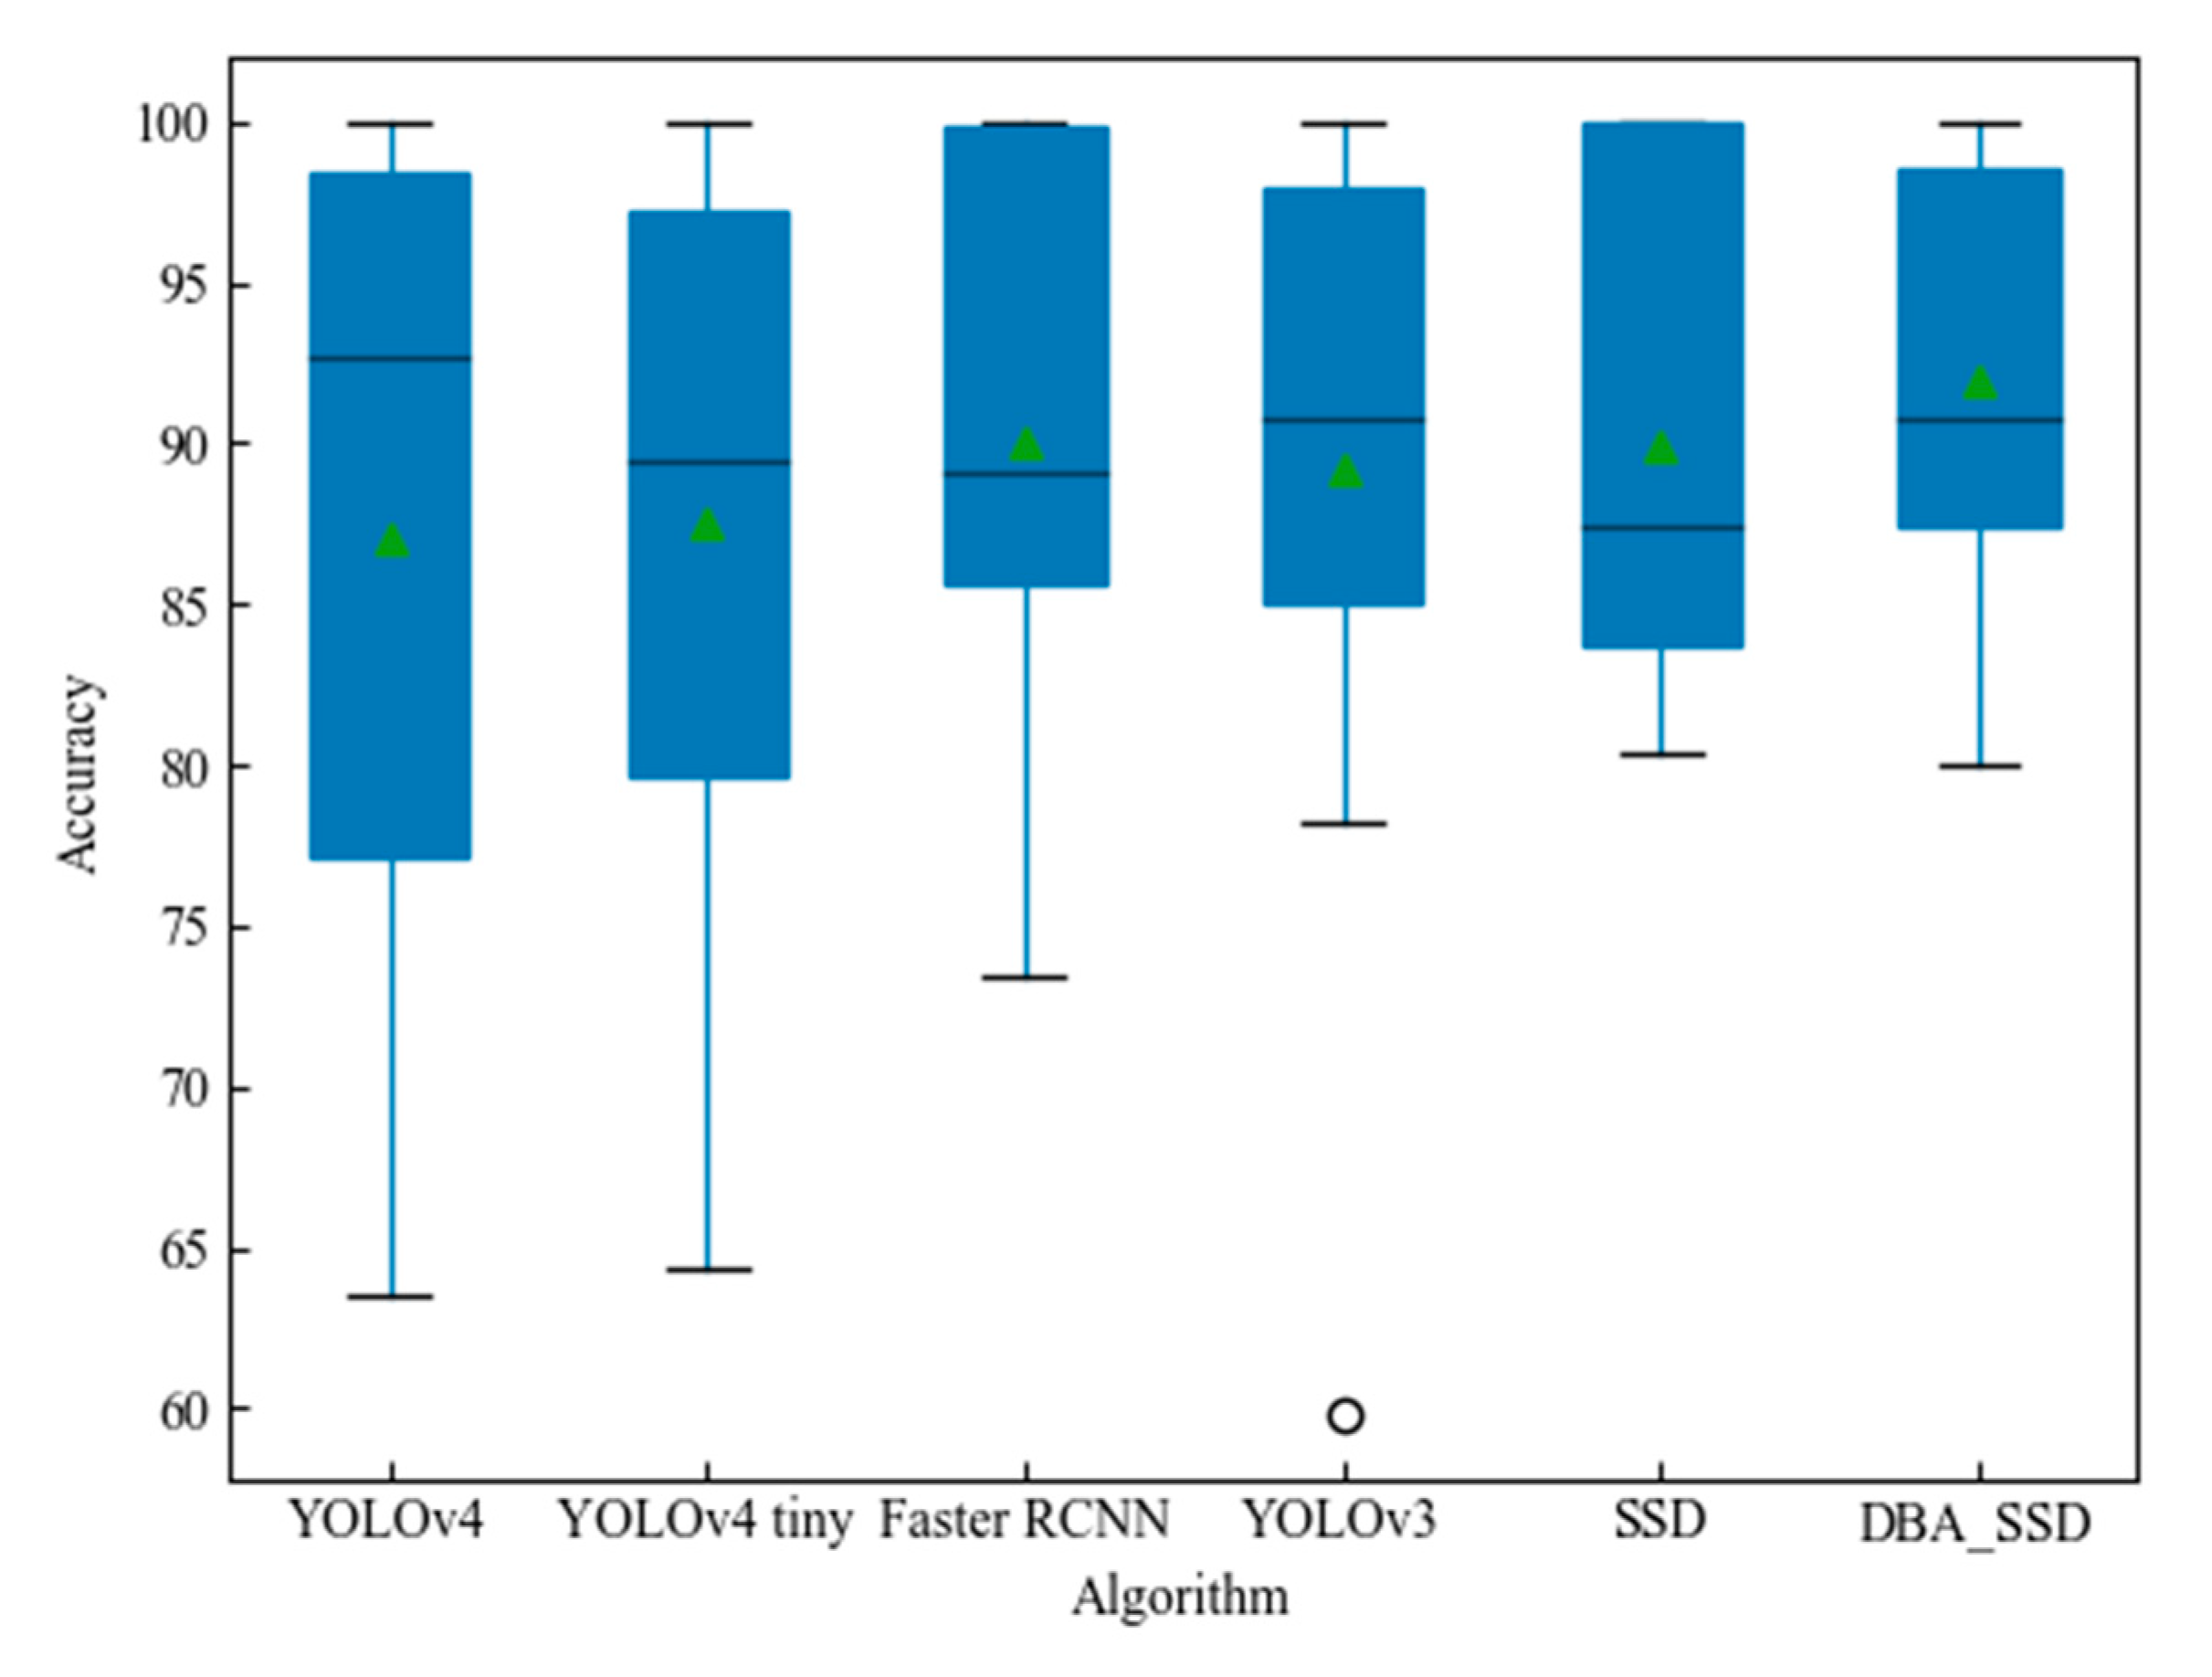
We implemented the classic SSD, YOLOv4, YOLOv3, Faster RCNN, and YOLOv4 tiny models and compared them with our proposed DBA_SSD. Our method is better than the classic baseline method on the vegetable and fruit leaf data set.
The main structure of this article is presented as follows. The first chapter mainly introduces the related work on the detection of leaf disease and combs the detection technology of leaf disease. The second chapter introduces the SSD model and related improvement modules and proposes two improved methods for the SSD target detection algorithm. The third chapter introduces the environment of algorithm experiment, data set structure, experiment procedure, and experiment evaluation standard. The fourth chapter conducts a comparative analysis of the results of the two sets of experiments and related ablation experiments on the proposed DBA_SSD. The other is a comparative analysis of the results of SSD improved algorithms and other target detection algorithms. Finally, we summarize and prospect the research in this article.

2. Materials and Methods

2.1. Related Work

At present, the research methods on plant disease recognition mainly focuses on two aspects: one is disease recognition based on machine learning, and the general steps include diseased leaf image segmentation, feature extraction, and disease recognition; and the other is target recognition technology based on deep learning, wherein terminal end-to-end target detection is favored by many researchers because of its fast recognition speed and efficient feature extraction methods. End-to-end target detection algorithm is also called one-stage target detection algorithm. One-stage means that no candidate frames are generated and the target frame localization problem is directly transformed into a regression problem processing.
In the research on the identification of plant diseases based on machine learning, Literature [20] proposed a DCNN-based apple tree leaf disease (ATLD) diagnosis method, and established 5 common ATLDs and healthy leaf data sets. The DCNN model combines DenseNet and Xception [21] models by using support vector machine to classify apple leaf diseases, the experimental results show that the accuracy of the DCNN model better than and comparing Inception-v3, MobileNet [22], VGG-16, DenseNet-201, Xception, VGG-INCEP. Shrivastava et al. [23] proposed a rice disease image classification by only method using color features, and explored the feature extraction methods of 14 different color channels. They obtained 172 different color channel feature information and used 7 different classifiers. The performance is compared, and the result shows that the classification accuracy of the support vector machine classifier is up to 94.65%. Literature [24] introduced a hybrid method for detecting plant leaf disease. The first stage corresponds to the image enhancement and image conversion scheme to overcome the problems related to low illumination and noise. The second stage combines the feature extraction technology of GLCM, complex Gabor filter, Curvelet, and image moments. The third stage uses the extracted features to train the nerve fuzzy logic classifier, and the proposed combination of feature extraction and image preprocessing can improve classification accuracy. Abdulridha [25] used hyperspectral imaging and machine learning to develop a technique for detecting pumpkin powdery mildew in the asymptomatic, early, middle, and late stages. This method uses a radial basis function to treat the disease. Strains and healthy strains were distinguished, and the severity of diseased strains was classified. Abdu [26] proposed a method for identifying the surface of plant diseased leaves, extracting optimized features from the diseased area, and identifying plant diseased leaves based on a feature-based machine learning classifier. The diseased features are connected in series to form a pathological feature vector for disease recognition to improve detection accuracy.
In deep learning-based research on fruit and vegetable diseases, Salma Samiei [27] used red clover and alfalfa as research objects and proposed CNN-LSTM models combined with denoising algorithms to classify the different growth stages of two different plant species. Based on high-resolution remote sensing data, Alin-Ionut, Ples, oianu et al. [28] and others proposed an integrated deep learning model for individual tree crown detection and species classification. Mohamed Kerkech et al. [29] proposed a new method of grape disease detection based on the SegNet [30] architecture for visible light and infrared image segmentation to identify shadows, ground, healthy and symptomatic vines, and finally merge the segmentation obtained from visible light and infrared images to generate the whole disease map of grapes. Literature [31], a U-Net method for pixel-level purple rapeseed segmentation was proposed to calculate the model parameters by adjusting the sample size. In the literature [32], a new thermal imaging method was proposed to calculate the color similarity problem between unripe citrus fruits and leaves, which were prone to temperature differences between fruit and leaf surfaces because of the varying rates of temperature change between the fruit and leaf surfaces caused by water mist and to build a deep learning model based on the thermal imaging system. Meanwhile, the disease detection algorithm is moving towards lightweight, thereby making deploy into embedded devices easy. Chongke Bi [33] proposed a lightweight method for apple leaf disease identification based on MobileNet model. This method was also compared with ResNet152 and InceptionV3. The method can provide stable recognition results and is easily deployed in mobile devices. Utpal Barman [34] compared MobileNet CNN and Self-Structured CNN (SSCNN) based on citrus disease dataset from smartphone images. The experiments show that SSCNN is more accurate in classifying citrus leaf diseases based on smartphone images and takes less computation time. After research, increasing number of scholars tend to detect plant diseases using deep learning-based target detection methods, especially YOLO, SSD, and other target detection algorithms represented by one-stage methods, which omit tedious machine learning steps, such as image preprocessing, segmentation, and feature extraction, in a one-step end-to-end method with high recognition accuracy. Therefore, this paper explores the effectiveness of target detection algorithms for vegetable and fruit leaf disease detection and grading by using SSD as baseline method.

2.2. Novel End-to-End Method for Leaf Disease Detection
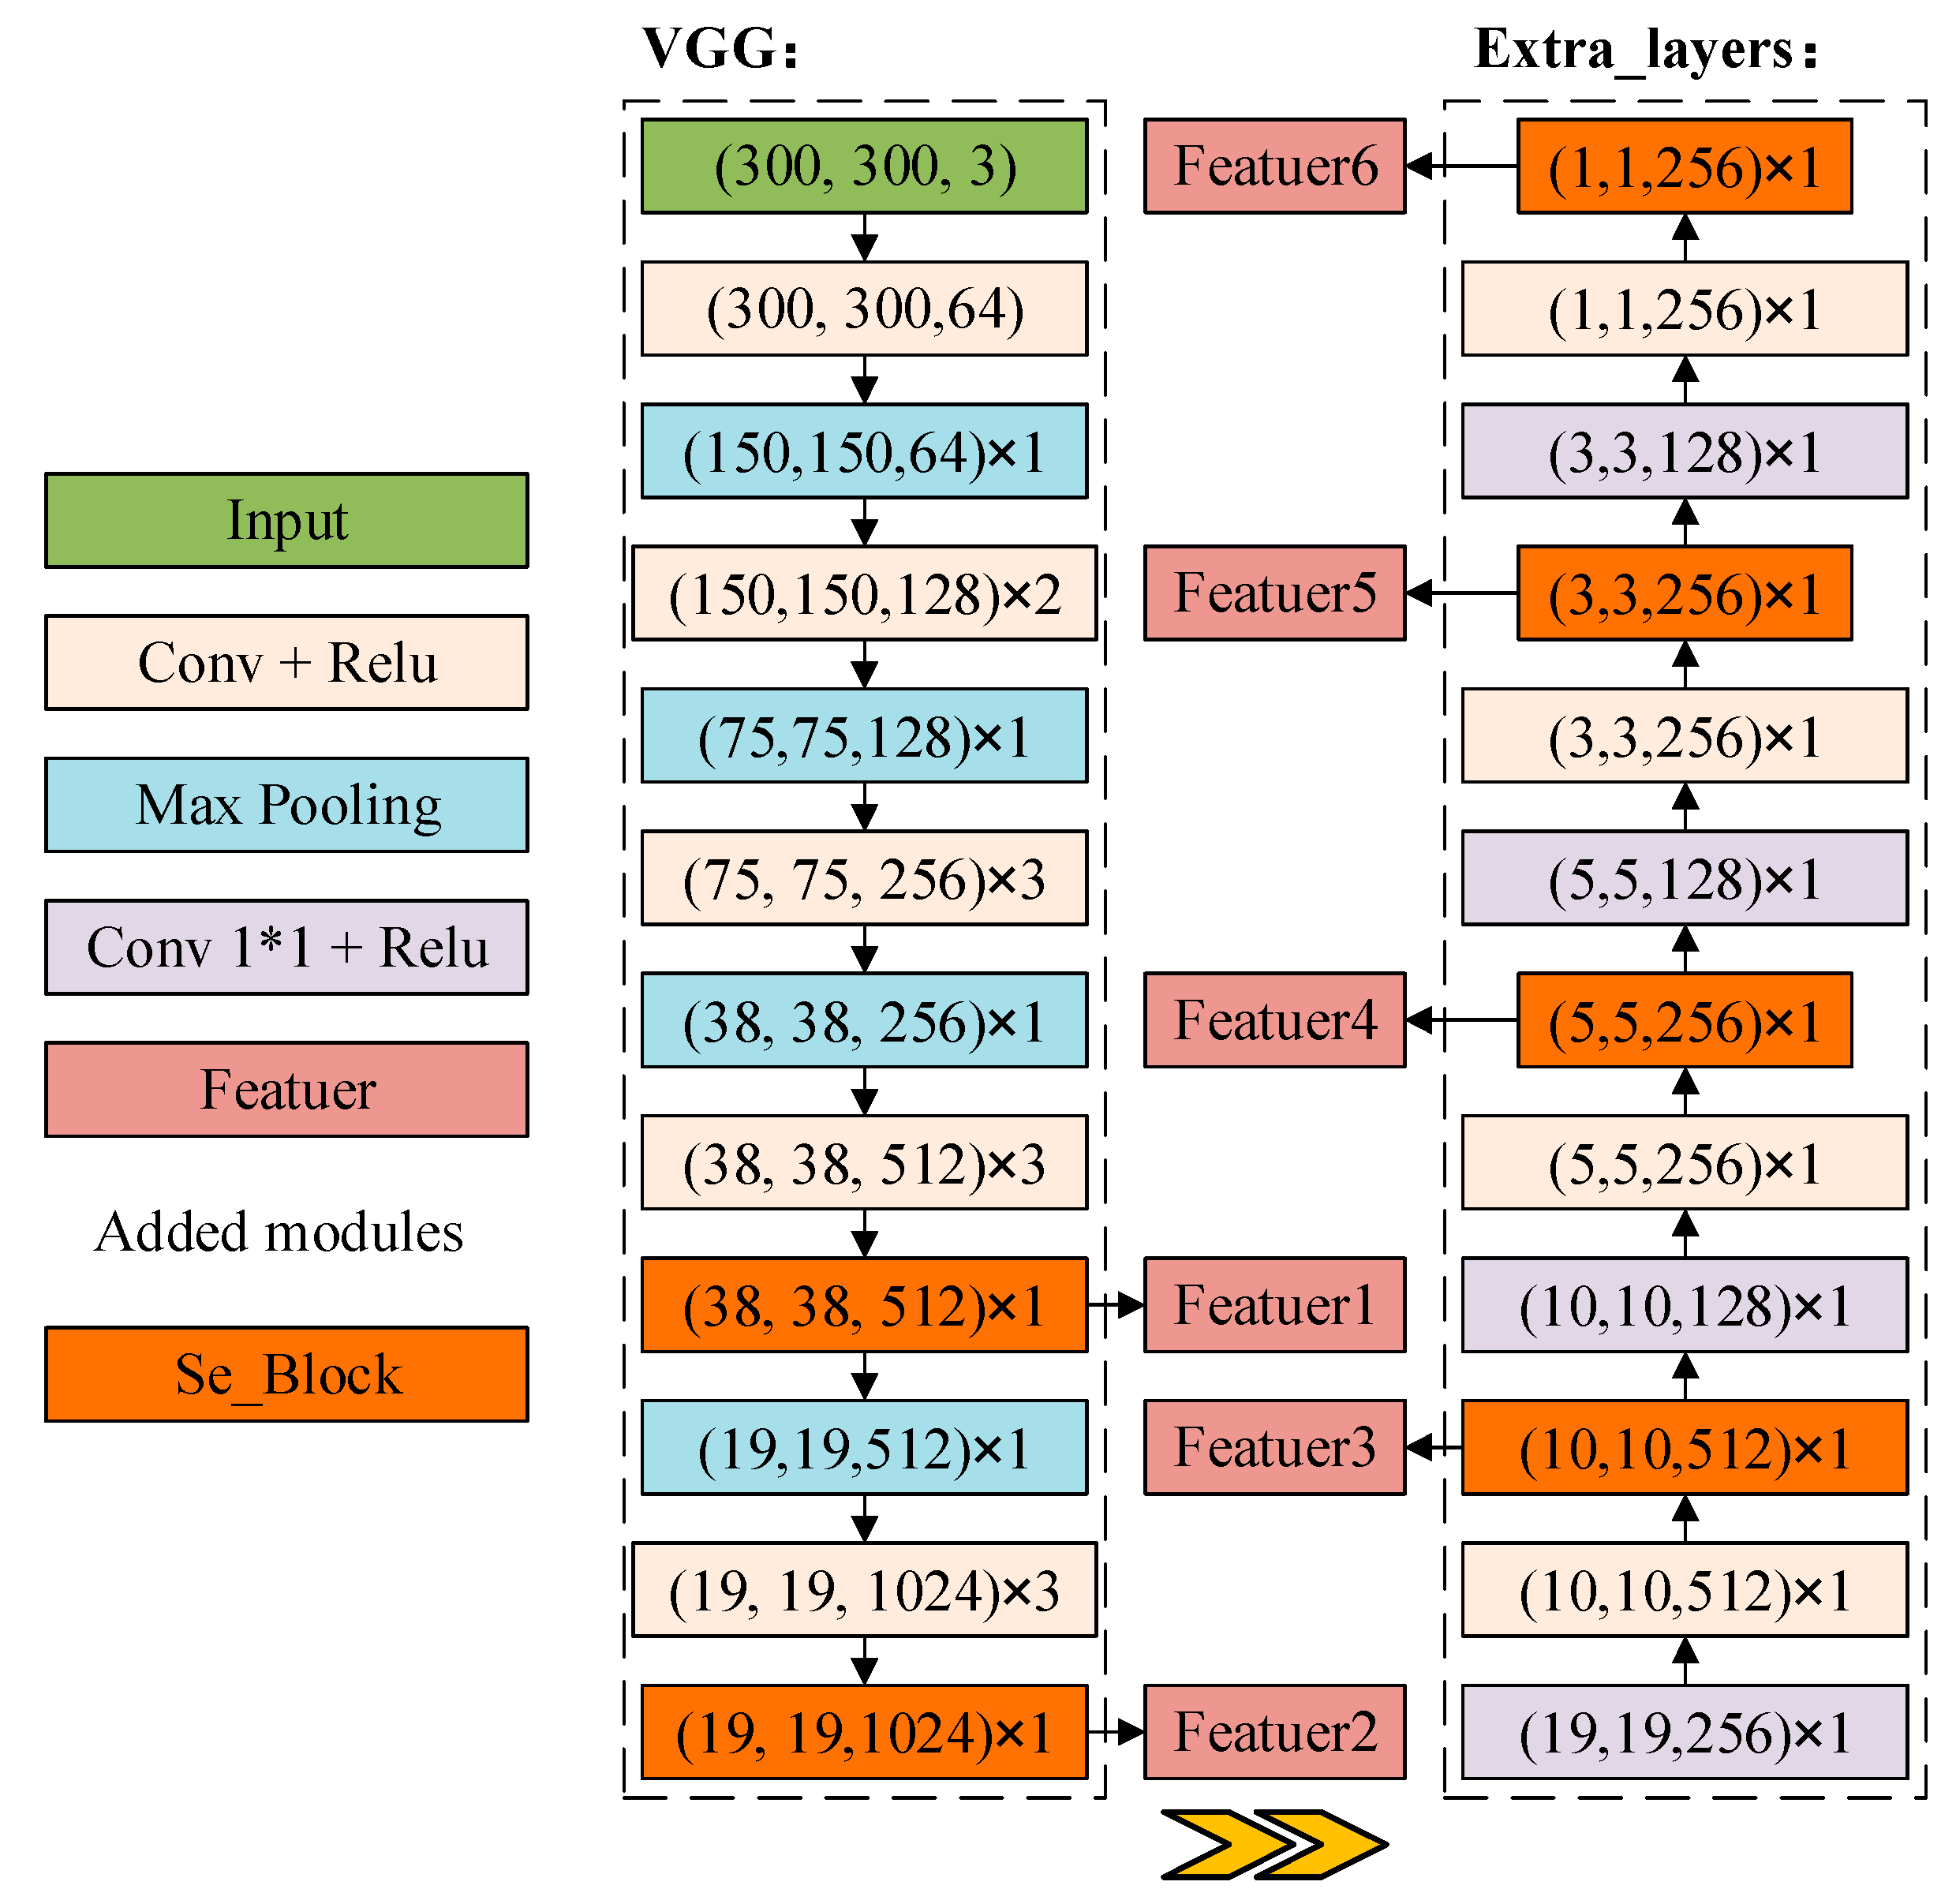
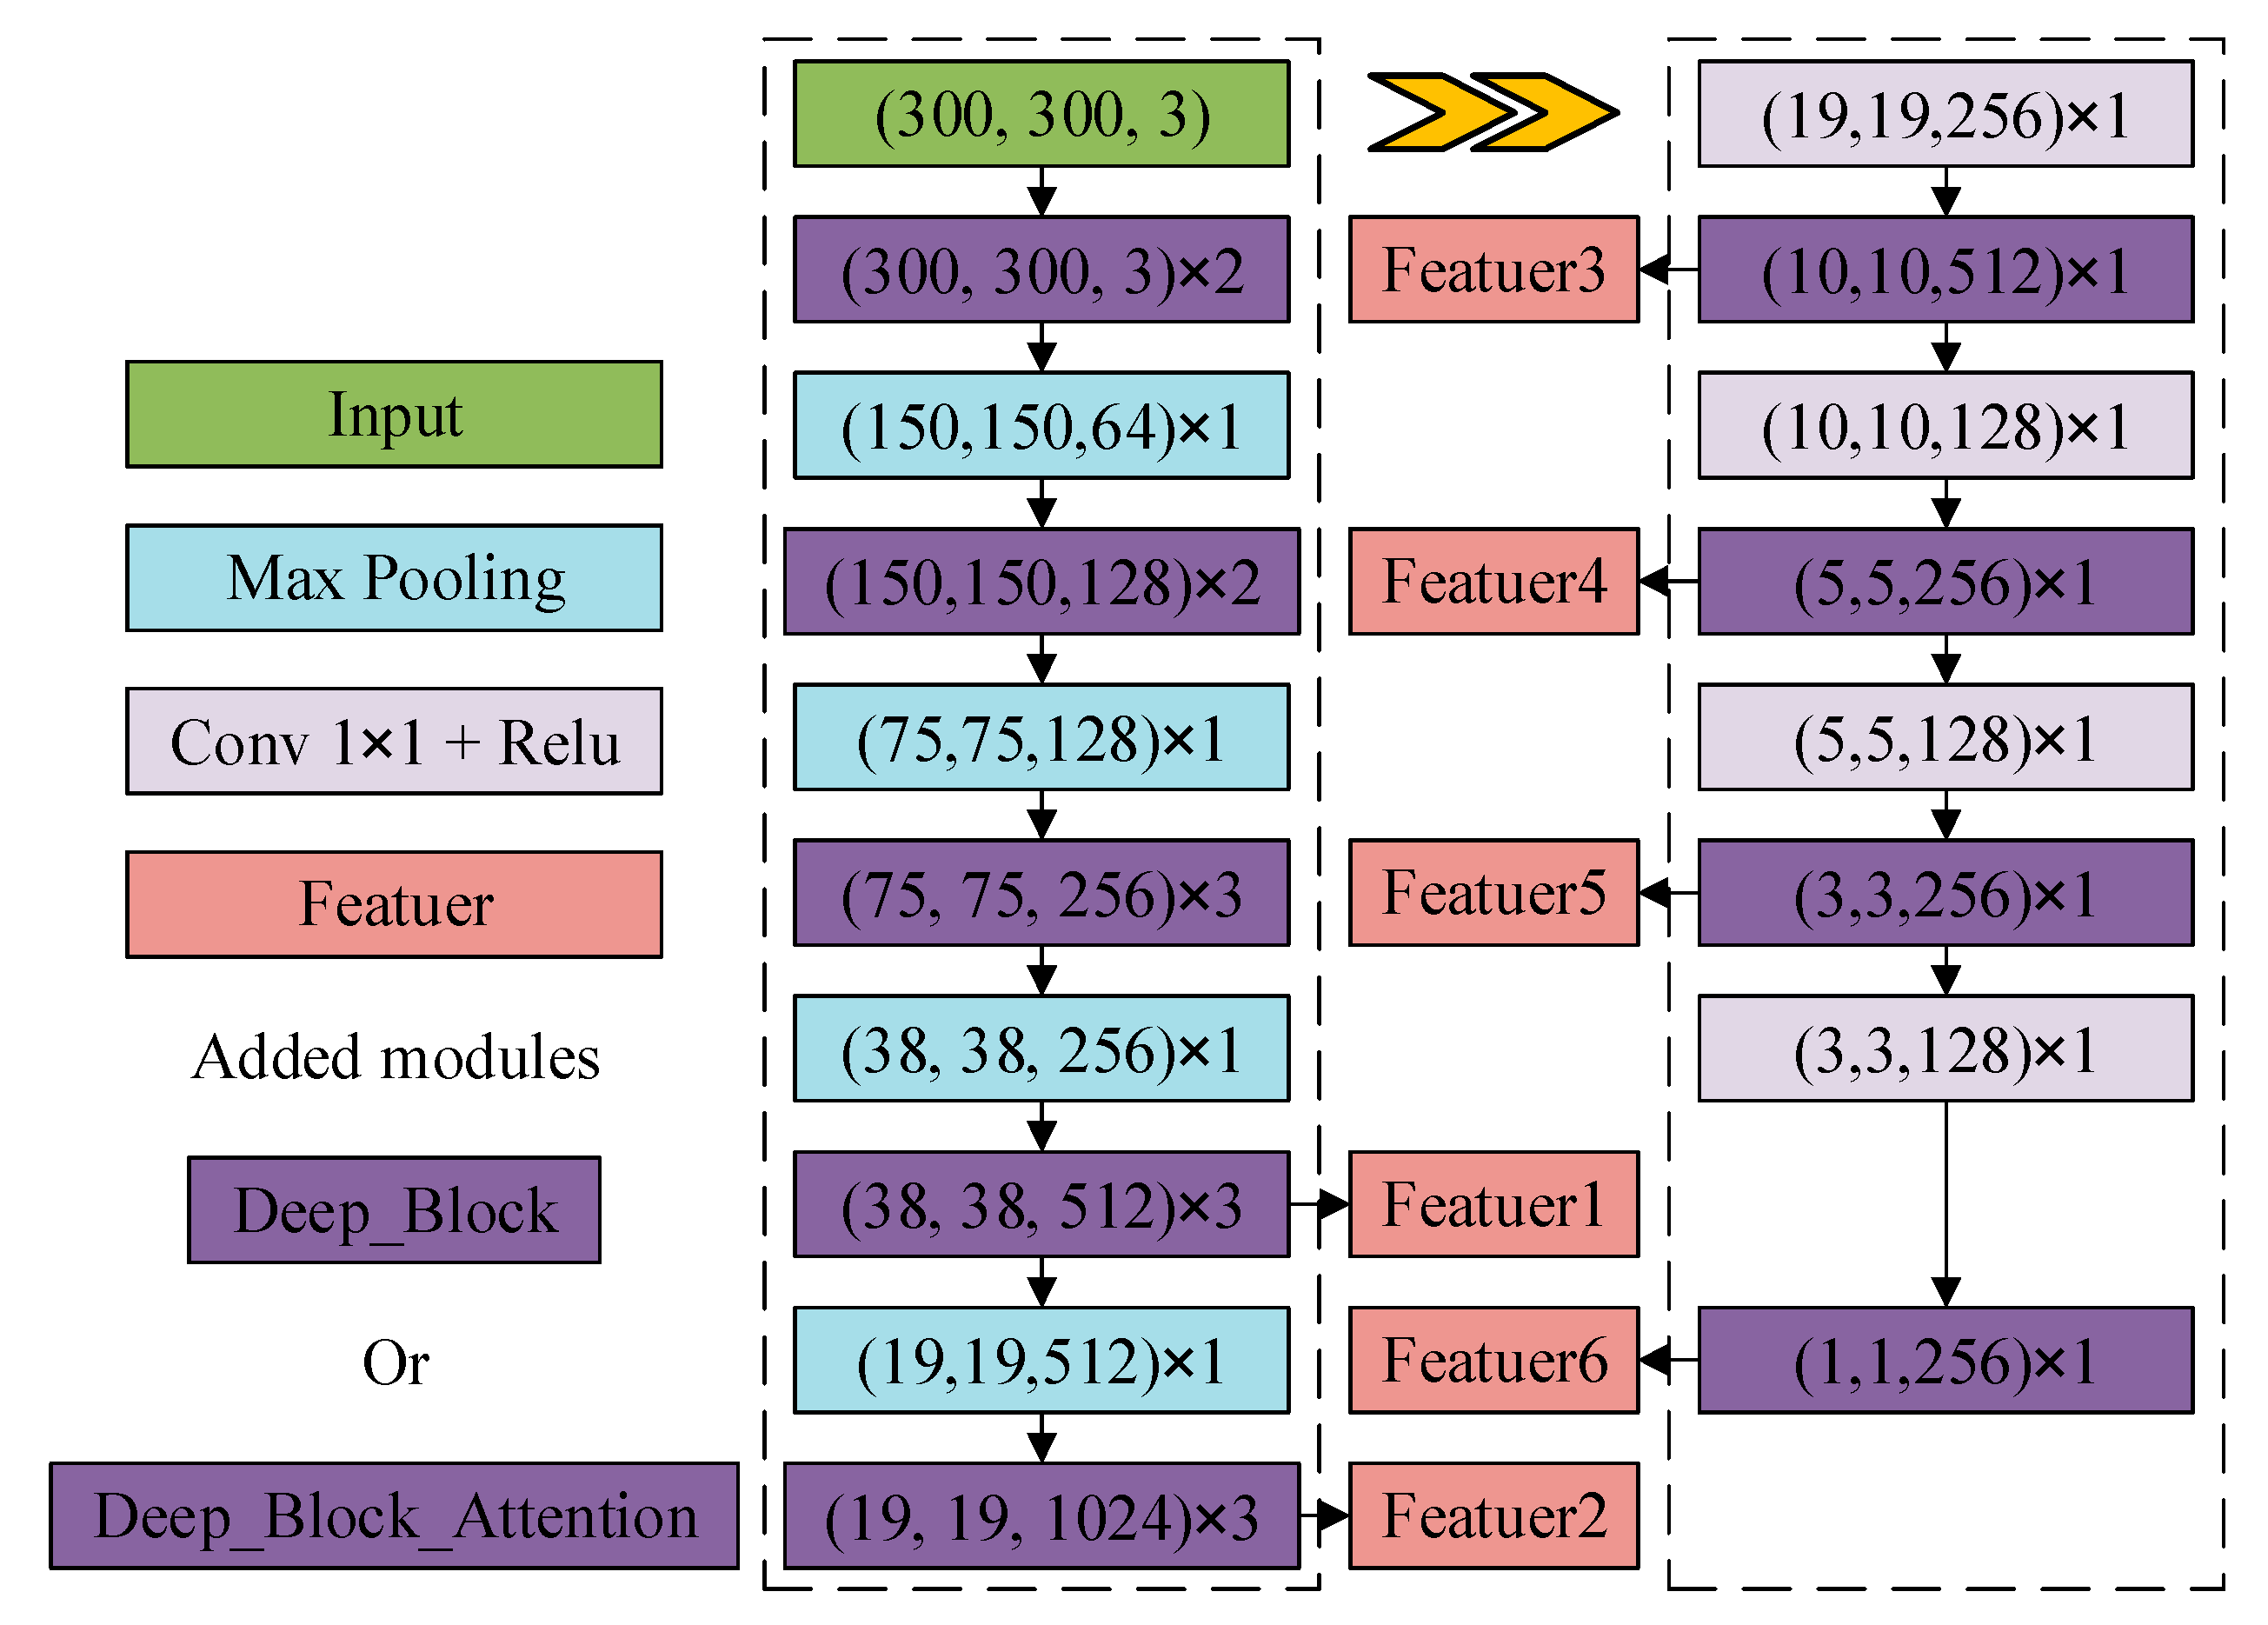
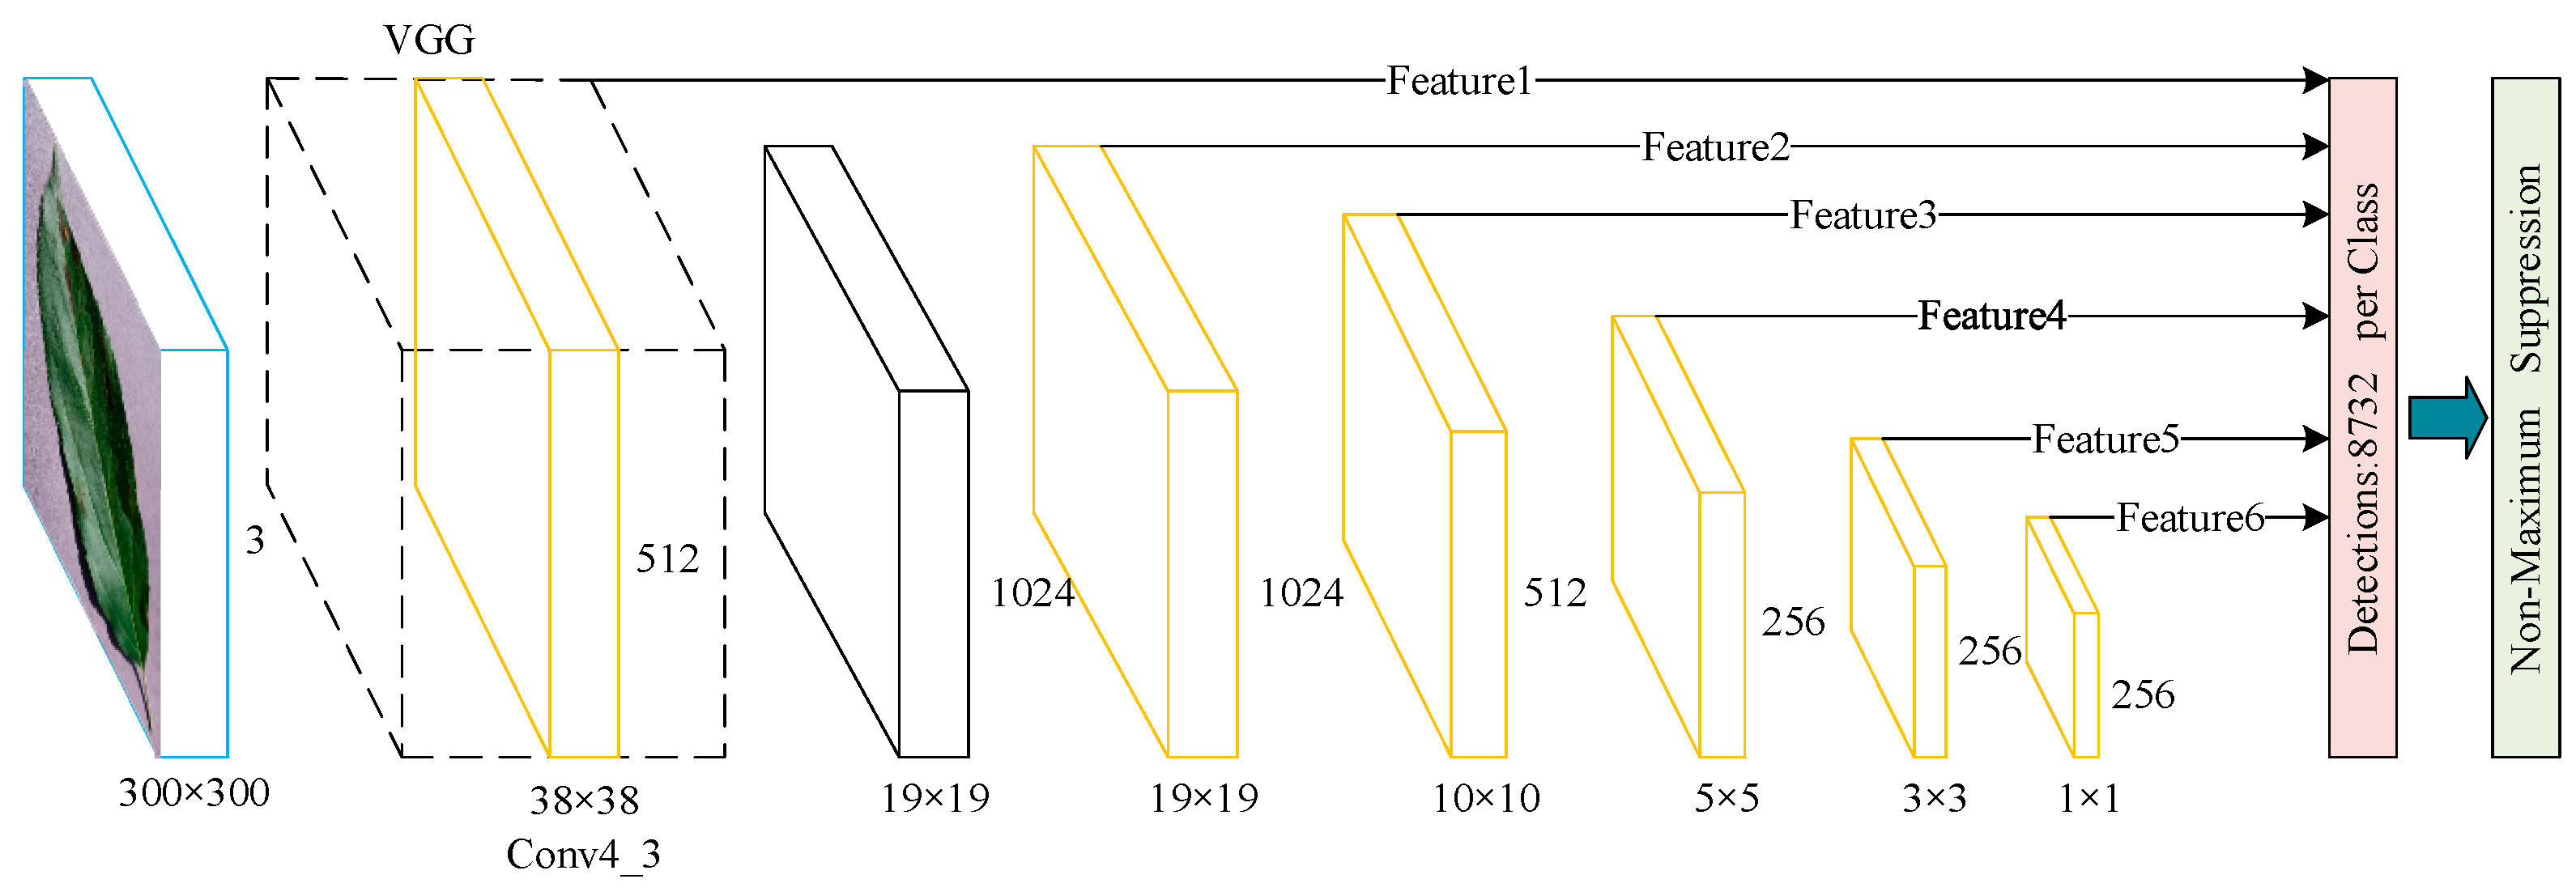
2.2.1. SSD Network

The SSD algorithm model is a one-stage real-time target detection model proposed simultaneously with YOLO series. SSD combines the one-stage regression prediction idea of the YOLO series and the Anchor Box mechanism of the Faster RCNN by using VGG as the base feature extraction network and extracting six different size feature layers from the bottom to the top layer as the regression prediction features. The advantage of SSD is that it improves the operation speed of the algorithm greatly while maintaining the detection accuracy. Moreover, the detection of small targets and large objects are considered. Figure 1 shows the SSD backbone network structure.
The loss function of SSD contains log loss for classification and smooth L1 for regression, and controls the proportion of positive and negative samples, which can improve the speed of optimization and the stability of training results. The total loss function is the sum of the errors of classification and regression. α is used to adjust the weight between the confidence loss and location loss, default = 1, and N denotes the total number of default boxes that eventually match with Ground Truth boxes. Confidence loss is a typical softmax loss, and location loss is a typical smooth L1 loss.
Total loss:
L ( x , c , l , g ) = 1 N ( L c o n f ( x , c ) + α L l o c ( x , l , g ) )
Classified losses:
L conf ( x , c ) = i N e g N x i j p log ( c ^ i p ) i N e g log ( c ^ i 0 )   c ^ i p   = exp ( c i p ) p exp ( c i p )
Of which:
x i j p = { 1 , 0 }
represents whether the i-th regression box matches the j-th GroundTruth box of type P.
Regression of losses:
L l o c ( x , l , g ) = i P o s N m { c x , c y , w , h } x i j k s m o o t h L 1 ( l i m g ^ j m )
SSD adopts full convolution for direct regression prediction and no longer generates candidate frames, which greatly improves the detection speed of SSD network. But there are some cases where the detection accuracy is not as good as we expect. When the surface features of leaves are similar or leaves are occluded from each other, SSD will miss and mis-detect, which often occurs in the actual leaf disease detection. For this reason, SSD needs to be improved to enhance feature recognition.

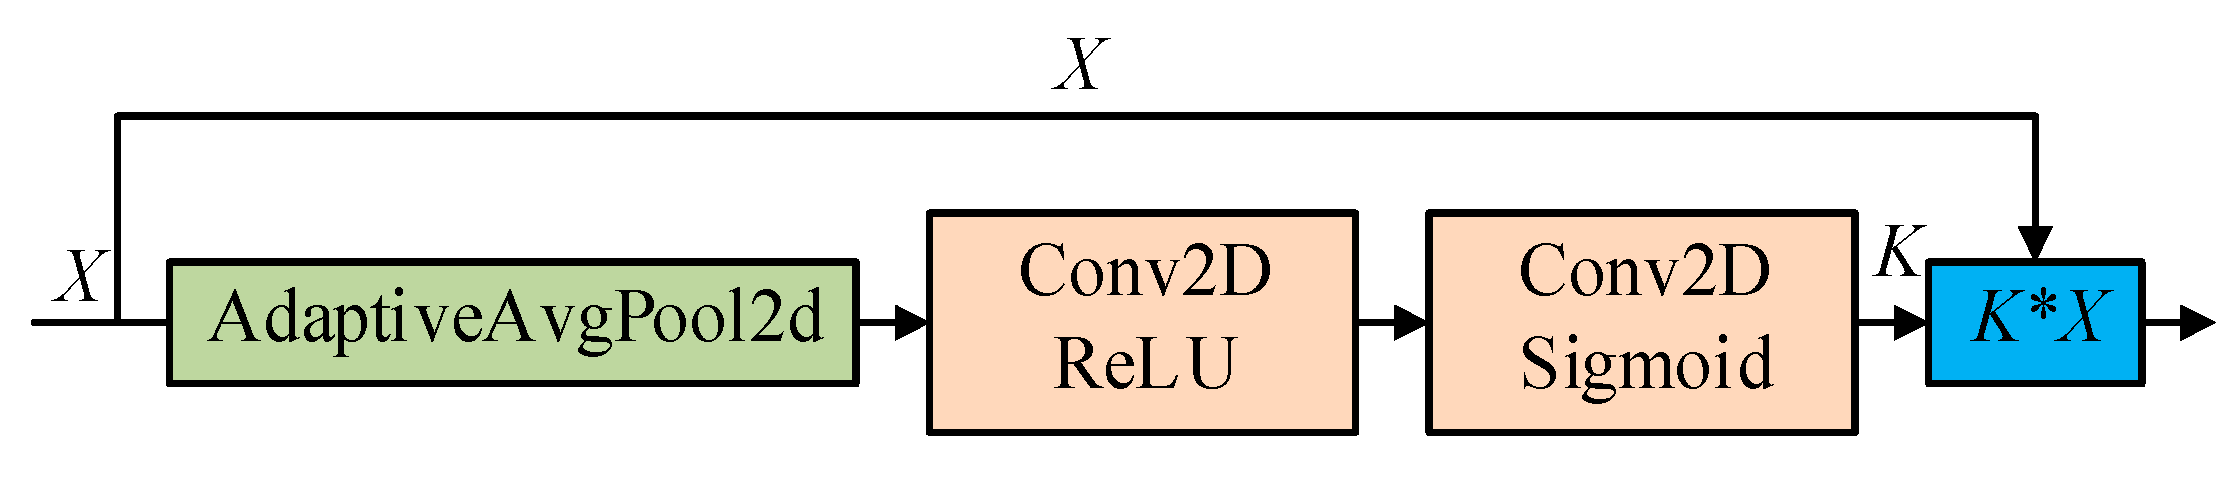
2.2.2. Squeeze-and-Excitation SSD (Se_SSD) Network

Se_Block [35] mainly focuses on the relationship between channels and can explicitly model the interdependencies between feature channels with the structural unit “Squeeze-and Excitation (SE)” module, which adaptively adjusts the feature response values of each channel and internal dependencies between channels. The Se_Block module works as shown in Figure 2, First, feature compression is performed along the spatial dimension of the feature map, and each two-dimensional feature channel is turned into a real number, that has a global perceptual field to a certain extent. The output has the same number of dimensions as the input feature channels. Then, based on the correlation between the feature channels, a weight is generated for each feature channel to represent the importance of the feature channels. Finally, the original features are re-calibrated in the channel dimension by multiplying the channel-by-channel weights onto the previous features.
To increase the feature extraction capability of SSD feature extraction model and focus more on the feature layers with higher importance, this paper adds Se_Block attention mechanism module in front of the last six effective feature layers used for regression prediction on the basis of SSD model. The feature layers are rescaled by channel dimension. The structure of Se_SSD network is shown in Figure 3.

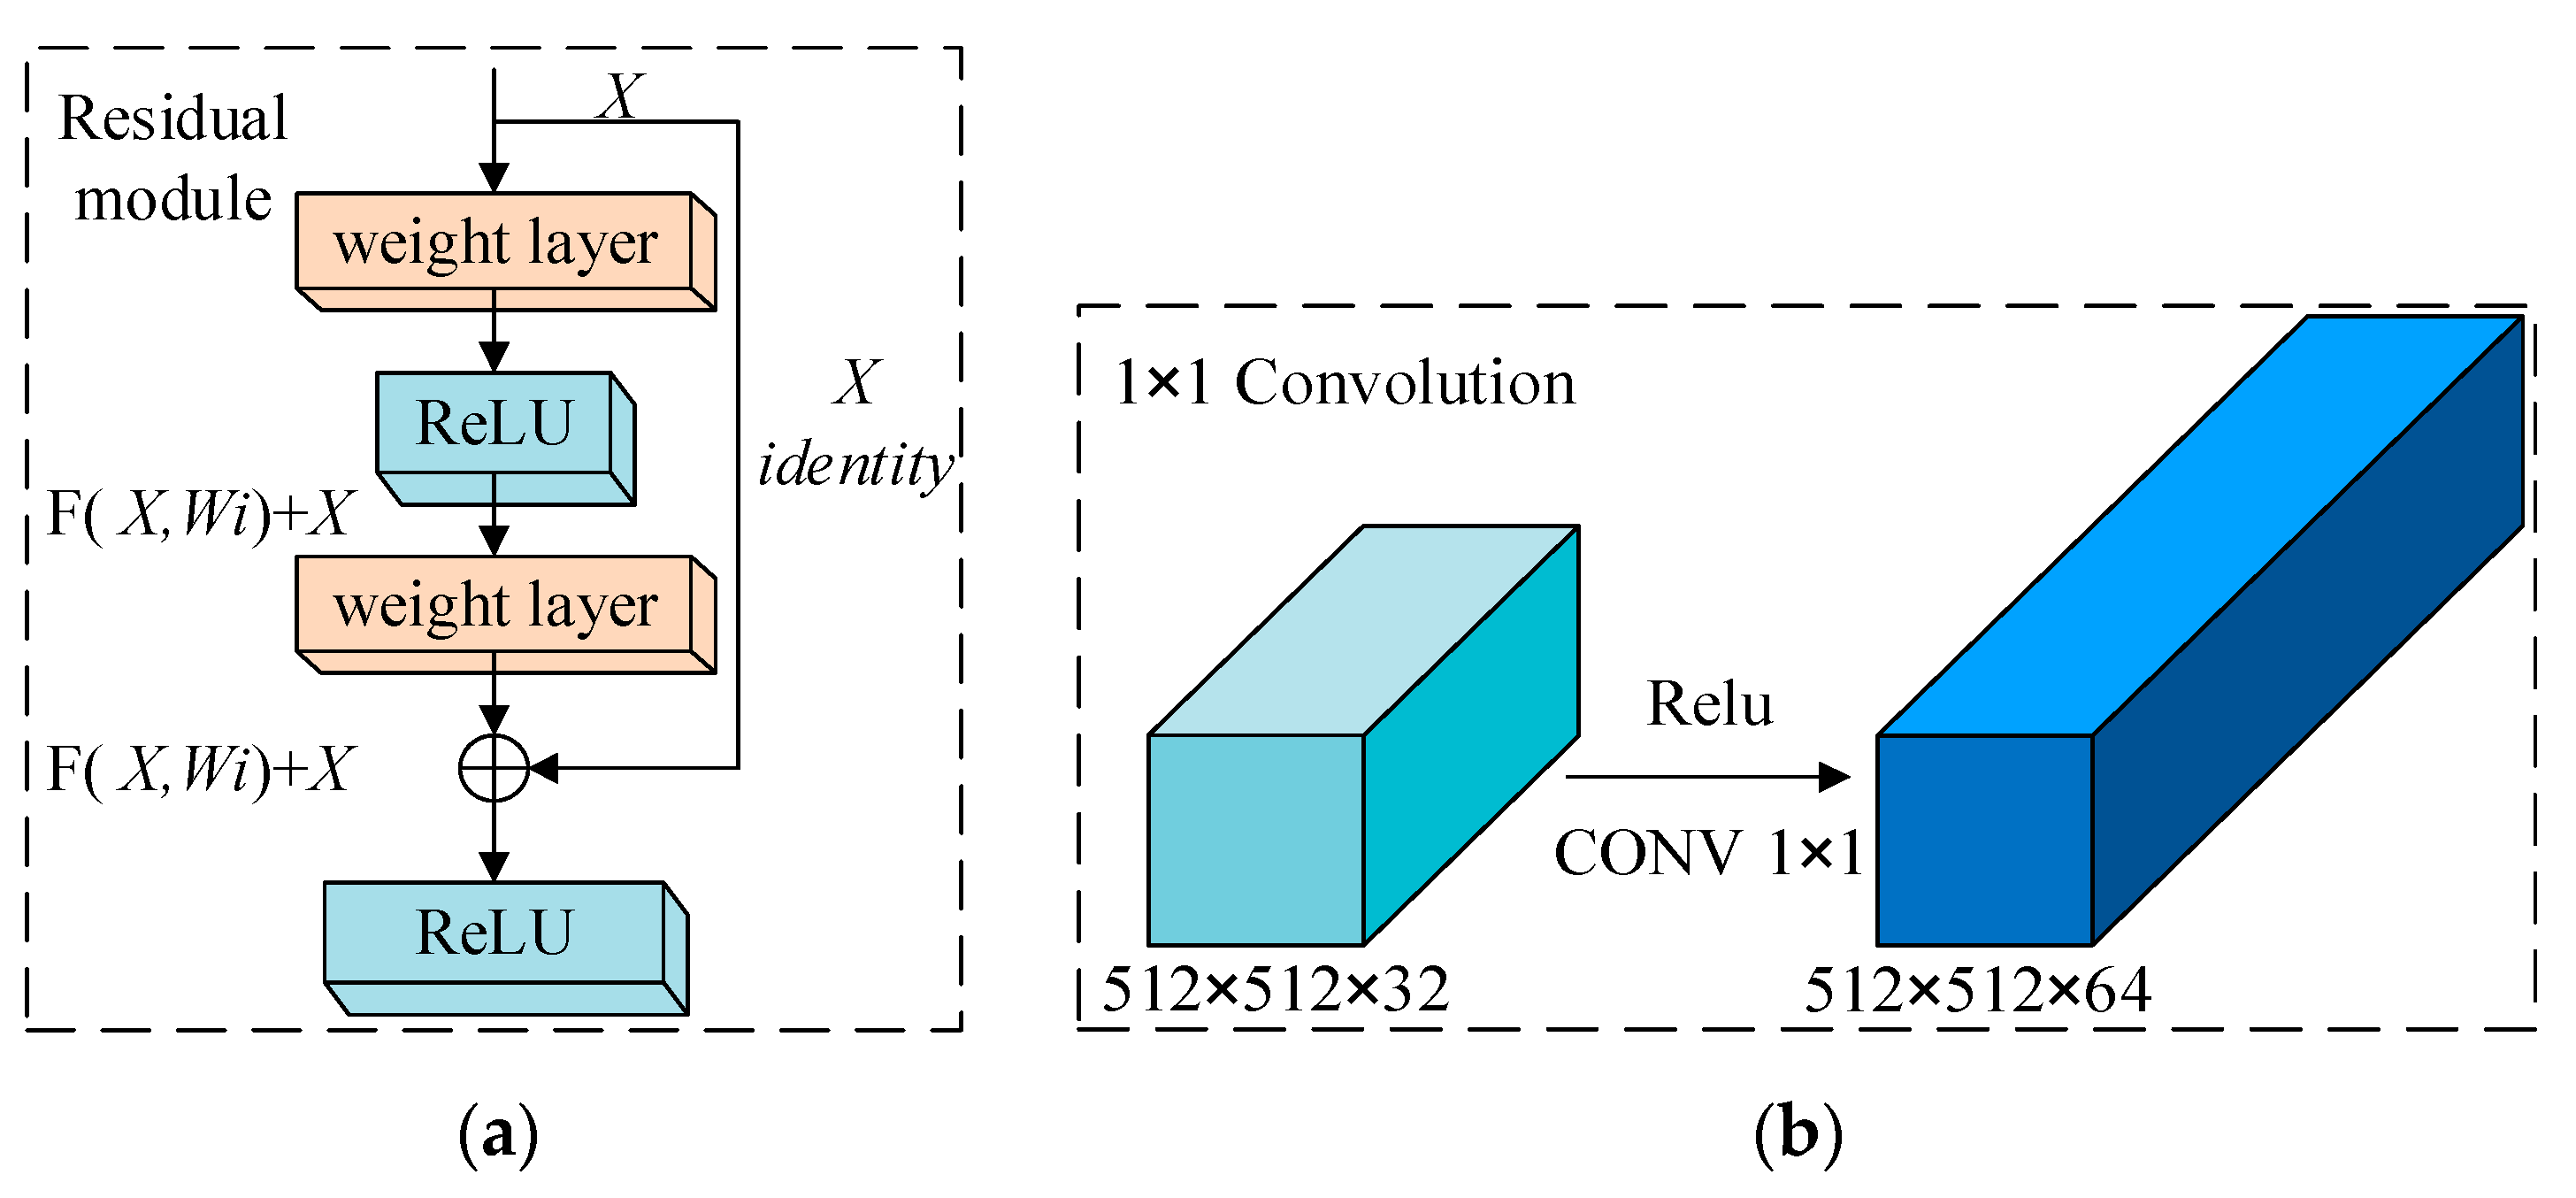
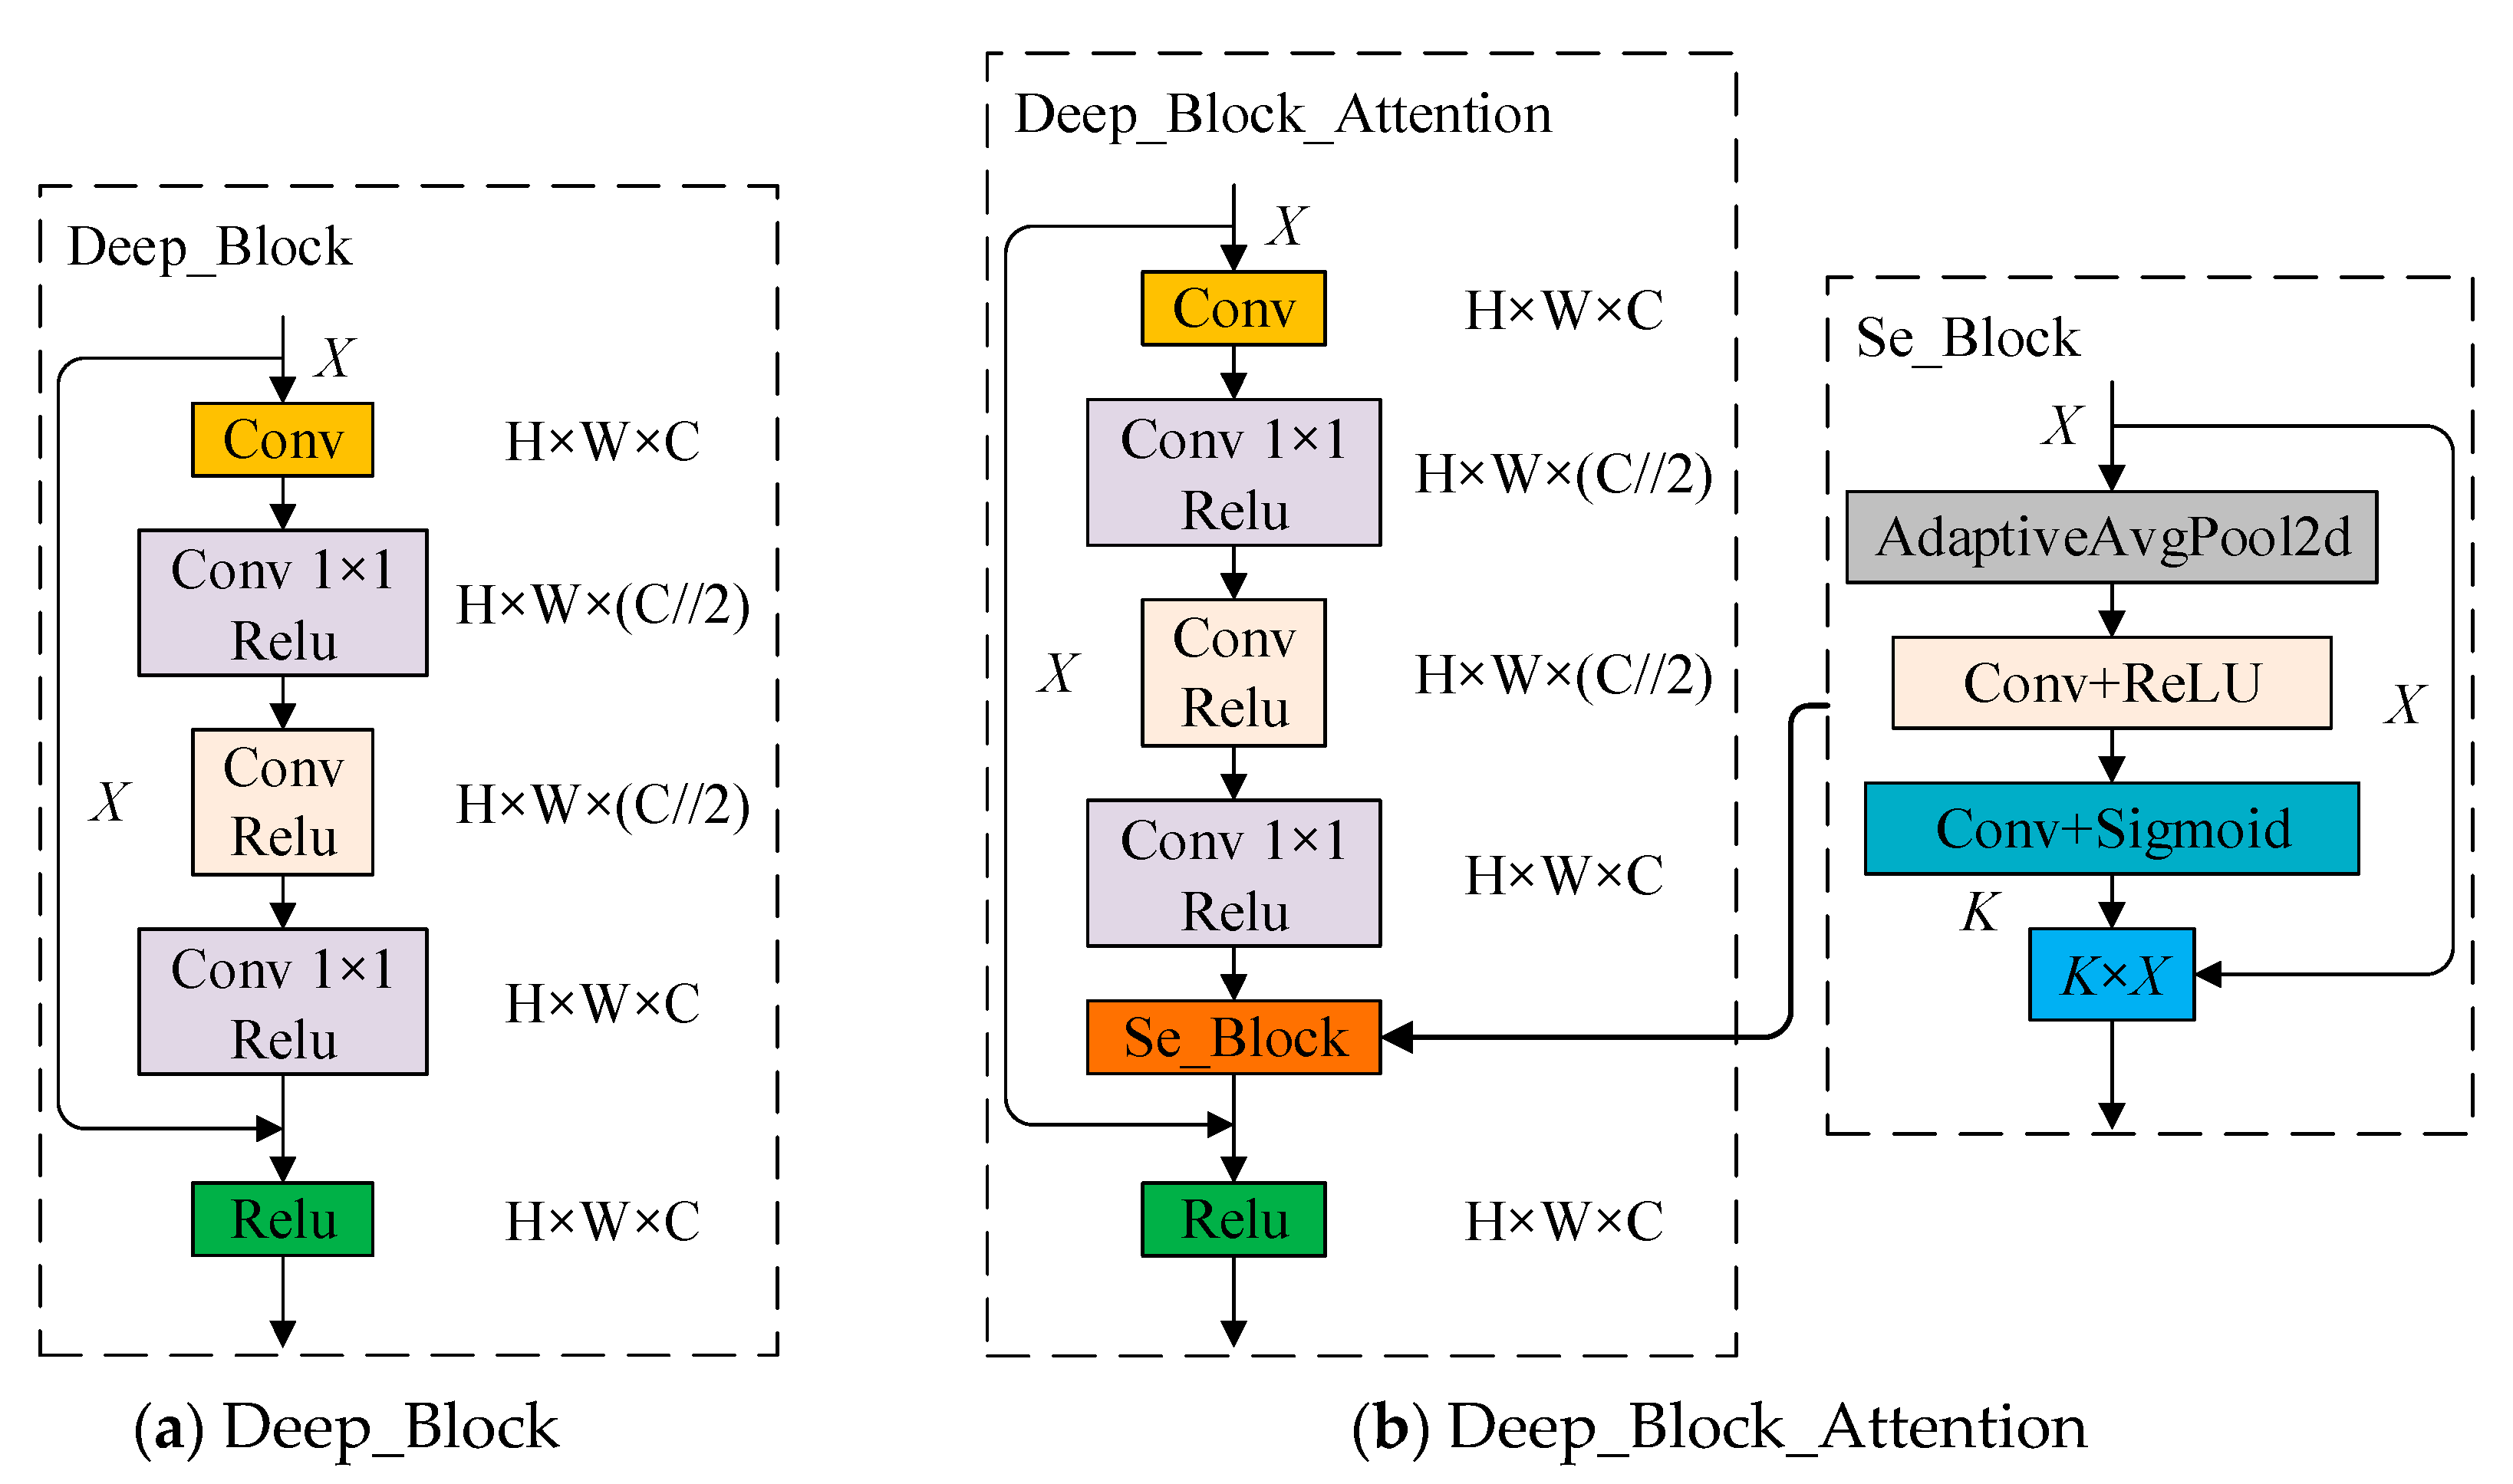
2.2.3. DB_SSD and DBA_SSD Network

The residual network module, which is a module with good application in the last two years, is shown in Figure 4a. X is the input feature map, Wi is the weight of the ith layer network, F (X, Wi) + X is the feature output, and F (X, Wi) + X is how the data are computed in the module. The residual network is superior to the traditional convolutional network. The residual network module implements an ultra-deep network and avoids the bottleneck problem of saturating the neural network with correctness due to continuous deepening. In addition, by directly connecting the input and output to achieve the goal of simplifying the learning objective and difficulty. 1 × 1 convolution is shown in Figure 4b, and 1 × 1 convolution is usually followed by a nonlinear layer of Relu for nonlinearization to learn more features. In addition to this 1 × 1 convolution’s can change the dimensionality of the image and transform the original image by 1 × 1 convolution to improve the generalization ability to reduce overfitting, and at the same time reduce the computational effort by boosting and reducing the number of channels to achieve cross-channel information interaction and feature integration in the process.
As shown in Figure 5, two kinds of rich feature extraction modules are designed in this paper, as shown in Figure 5a, Deep_Block is used to enhance the network feature extraction capability by using 1 × 1 convolution to reduce the number of channels after convolution, fusing multi-channel information, while introducing a residual structure to prevent the loss of feature layer information. Deep_Block_Attention adds a channel attention mechanism at the end of the Deep_Block structure for fine-tuning at the channel level. As shown in Figure 5b, the feature extraction network of SSD is reconstructed with the rich feature extraction module as the basic feature extraction unit, as shown in Figure 6, to deepen the feature extraction of each layer and increase the richness of feature learning by the rich feature extraction module.

3. Experimental Environment and Experimental Design

3.1. Experimental Environment

This experiment is a deep learning model built under the Pytorch deep learning framework, using a dataset of 3000 plant leaves, and the final output prediction frame identifies the leaf species and determines the severity of leaf disease. The experiments were conducted on an Asus laptop from Shanghai, China, with an AMD Ryzen 7 4800H processor, NVIDIA Ge-Force RTX 2060 graphics card, and 32G RAM. The deep learning framework we use is Pytorch.

3.2. Dataset

We chose the PlantVillage dataset [36] after careful consideration because of the large number of leaf species and the abundance of disease species in this dataset. And benefiting from the convenience and simplicity of Labelimg, this experiment uses Labelimg software to label the dataset and obtain data in VOC format for training, with label files as xml. files and pictures as jpg. files. The dataset of the experiment has 3000 images, which are divided into 5 major categories: Apple, Tomato, Potatoes, Strawberry and Chili; each major category is divided into 3 subcategories according to the severity of leaf disease: healthy, general, and severe. In total, 15 subcategories are noted, and the image resolution is around 255 × 470 × 3 pixels. The ratio of test, train, and val in the total data set is 1:8:1. Figure 7 shows the composition of the data set.

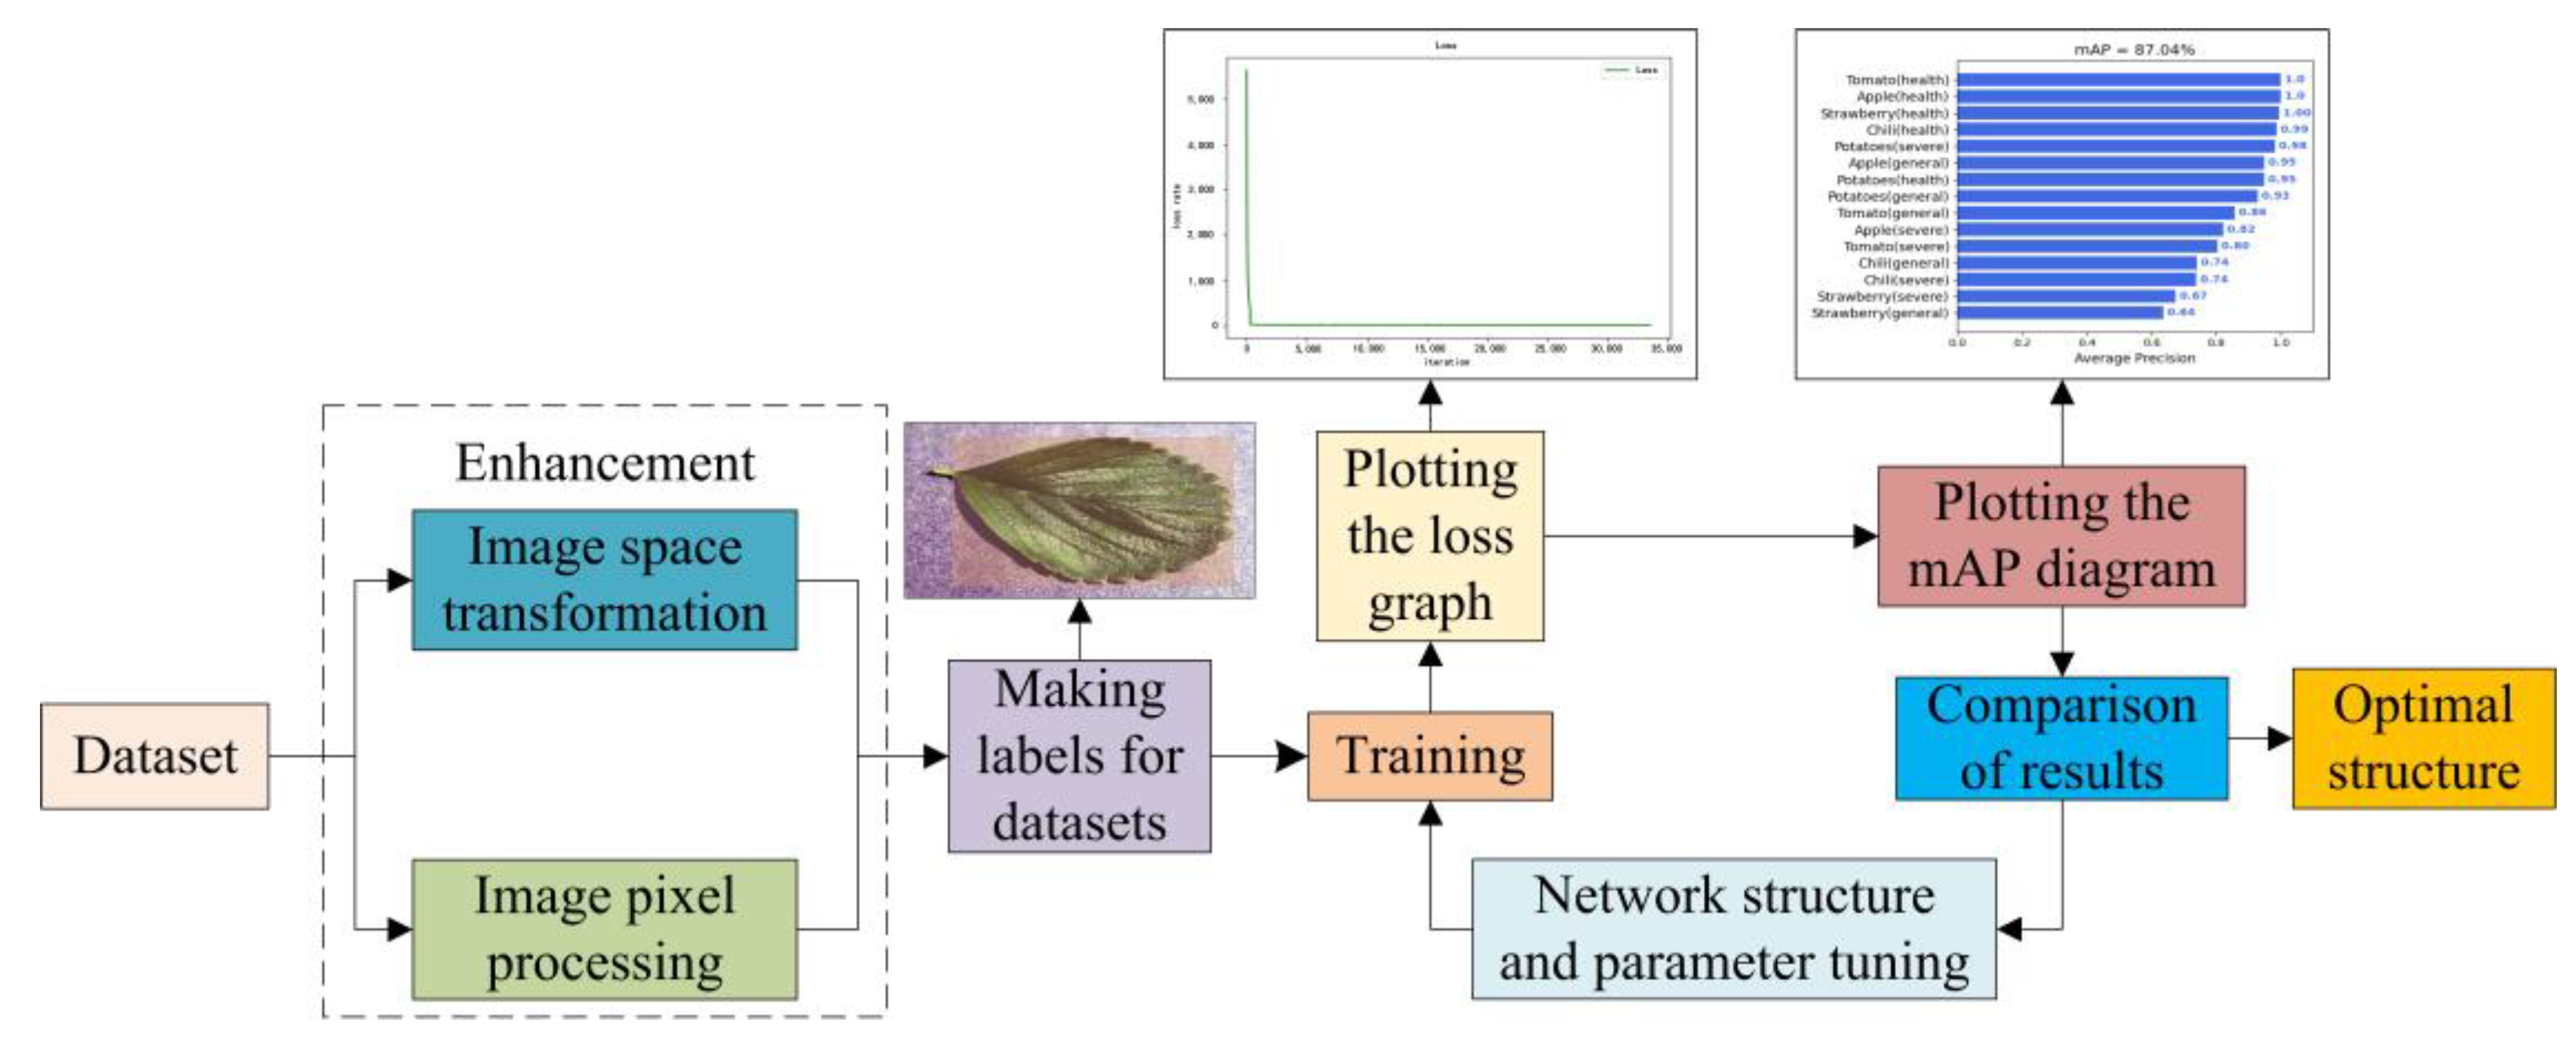
3.3. Experimental Design

To ensure the equalization of the dataset and to increase the richness and quality of the dataset, data enhancement and image preprocessing were performed on the images before the experimental tests [37]. The means of enhancement are Histogram Equalization, Horizontal Flip + Hue Saturation Value, Vertical Flip + Channel Shuffle, Horizontal Flip + Vertical Flip+ Channel Shuffle. The enhanced images are shown in Figure 8, with each of the 15 classes expanded to 1000 images, and the number of data sets expanded from 3000 to 15,000, with the training, validation, and testing ratios randomly assigned according to 1:8:1.
To better test the performance of the improved algorithm, four experiments were designed. Se_SSD with channel attention mechanism added at the end of the feature extraction network, DB_SSD (Deep Block SSD) with improved VGG feature extraction network, DBA_SSD with fusion of the improved VGG network and channel attention mechanism, and SSD of the original network are compared, and the VGG model trained on Image Net image dataset is trained by migrated convolutional layers to this model.
Experiment 1: The Se_SSD network with the Se_Block channel attention mechanism added is trained and the average accuracy of this network for the detection of plant leaves is tested.
Experiment 2: The DB_SSD network with the Deep_Block module added, where the Deep_Block module does not contain the attention mechanism, is trained in the environment and hardware conditions of Experiment 1.
Experiment 3. The DBA_SSD network with the Deep_Block_Attention module added, where the Deep_Block_Attention module containing the attention mechanism, is trained and tested under the environment and hardware conditions of Experiment 1.
Experiment 4. The original SSD network is trained and tested under the environment and hardware conditions of Experiment 1.
All the four experiments were trained on the basis of 15,000 plant leaf datasets and tested 1500 randomly selected images. The experiments followed the experimental flow in Figure 9, the experiment-comparison-optimization-experiment pattern, to obtain the average accuracy mAP under this model and to compare the mAP values of different models.

3.4. Performance Evaluation Metrics

Precision is a measure of the accuracy of a model’s prediction, and its value is equal to the number of correctly predicted positive samples over the total number of positively predicted samples. Recall (Recall) is a measure of the model’s ability to identify positive samples, and its value is the number of correctly predicted positive samples over the total number of positively predicted samples. The prediction results of the model are shown in Table 1 for TP, FP, FN, and TN.
True Positives (TP): indicates the number of correctly identified positive samples; True Negatives (TN): indicates the number of correctly identified negative samples; False Positives (FP): indicates the number of incorrectly identified negative samples; False Negatives (FN): indicates the number of incorrectly identified positive samples.
p r e c i s i o n = T P T P + F P  
r e c a l l = T P T P + F N  
The PR curve is a graph drawn with Recall as the horizontal axis and Precision as the vertical axis; Precision is negatively correlated with Recall, and the recall rate decreases as precision increases. AP (Average Precision) as a single category indicator is the integration of PR curve.
A P = 0 1 p ( r ) d ( r )
The value of mAP (mean average precision), as one of the important metrics for the evaluation of the whole model, is the average of the summation of all the category APs.
m A P = n = 1 N A P ( n ) N  
where n is the category and N is the total number of categories.

4. Analysis of Experimental Results

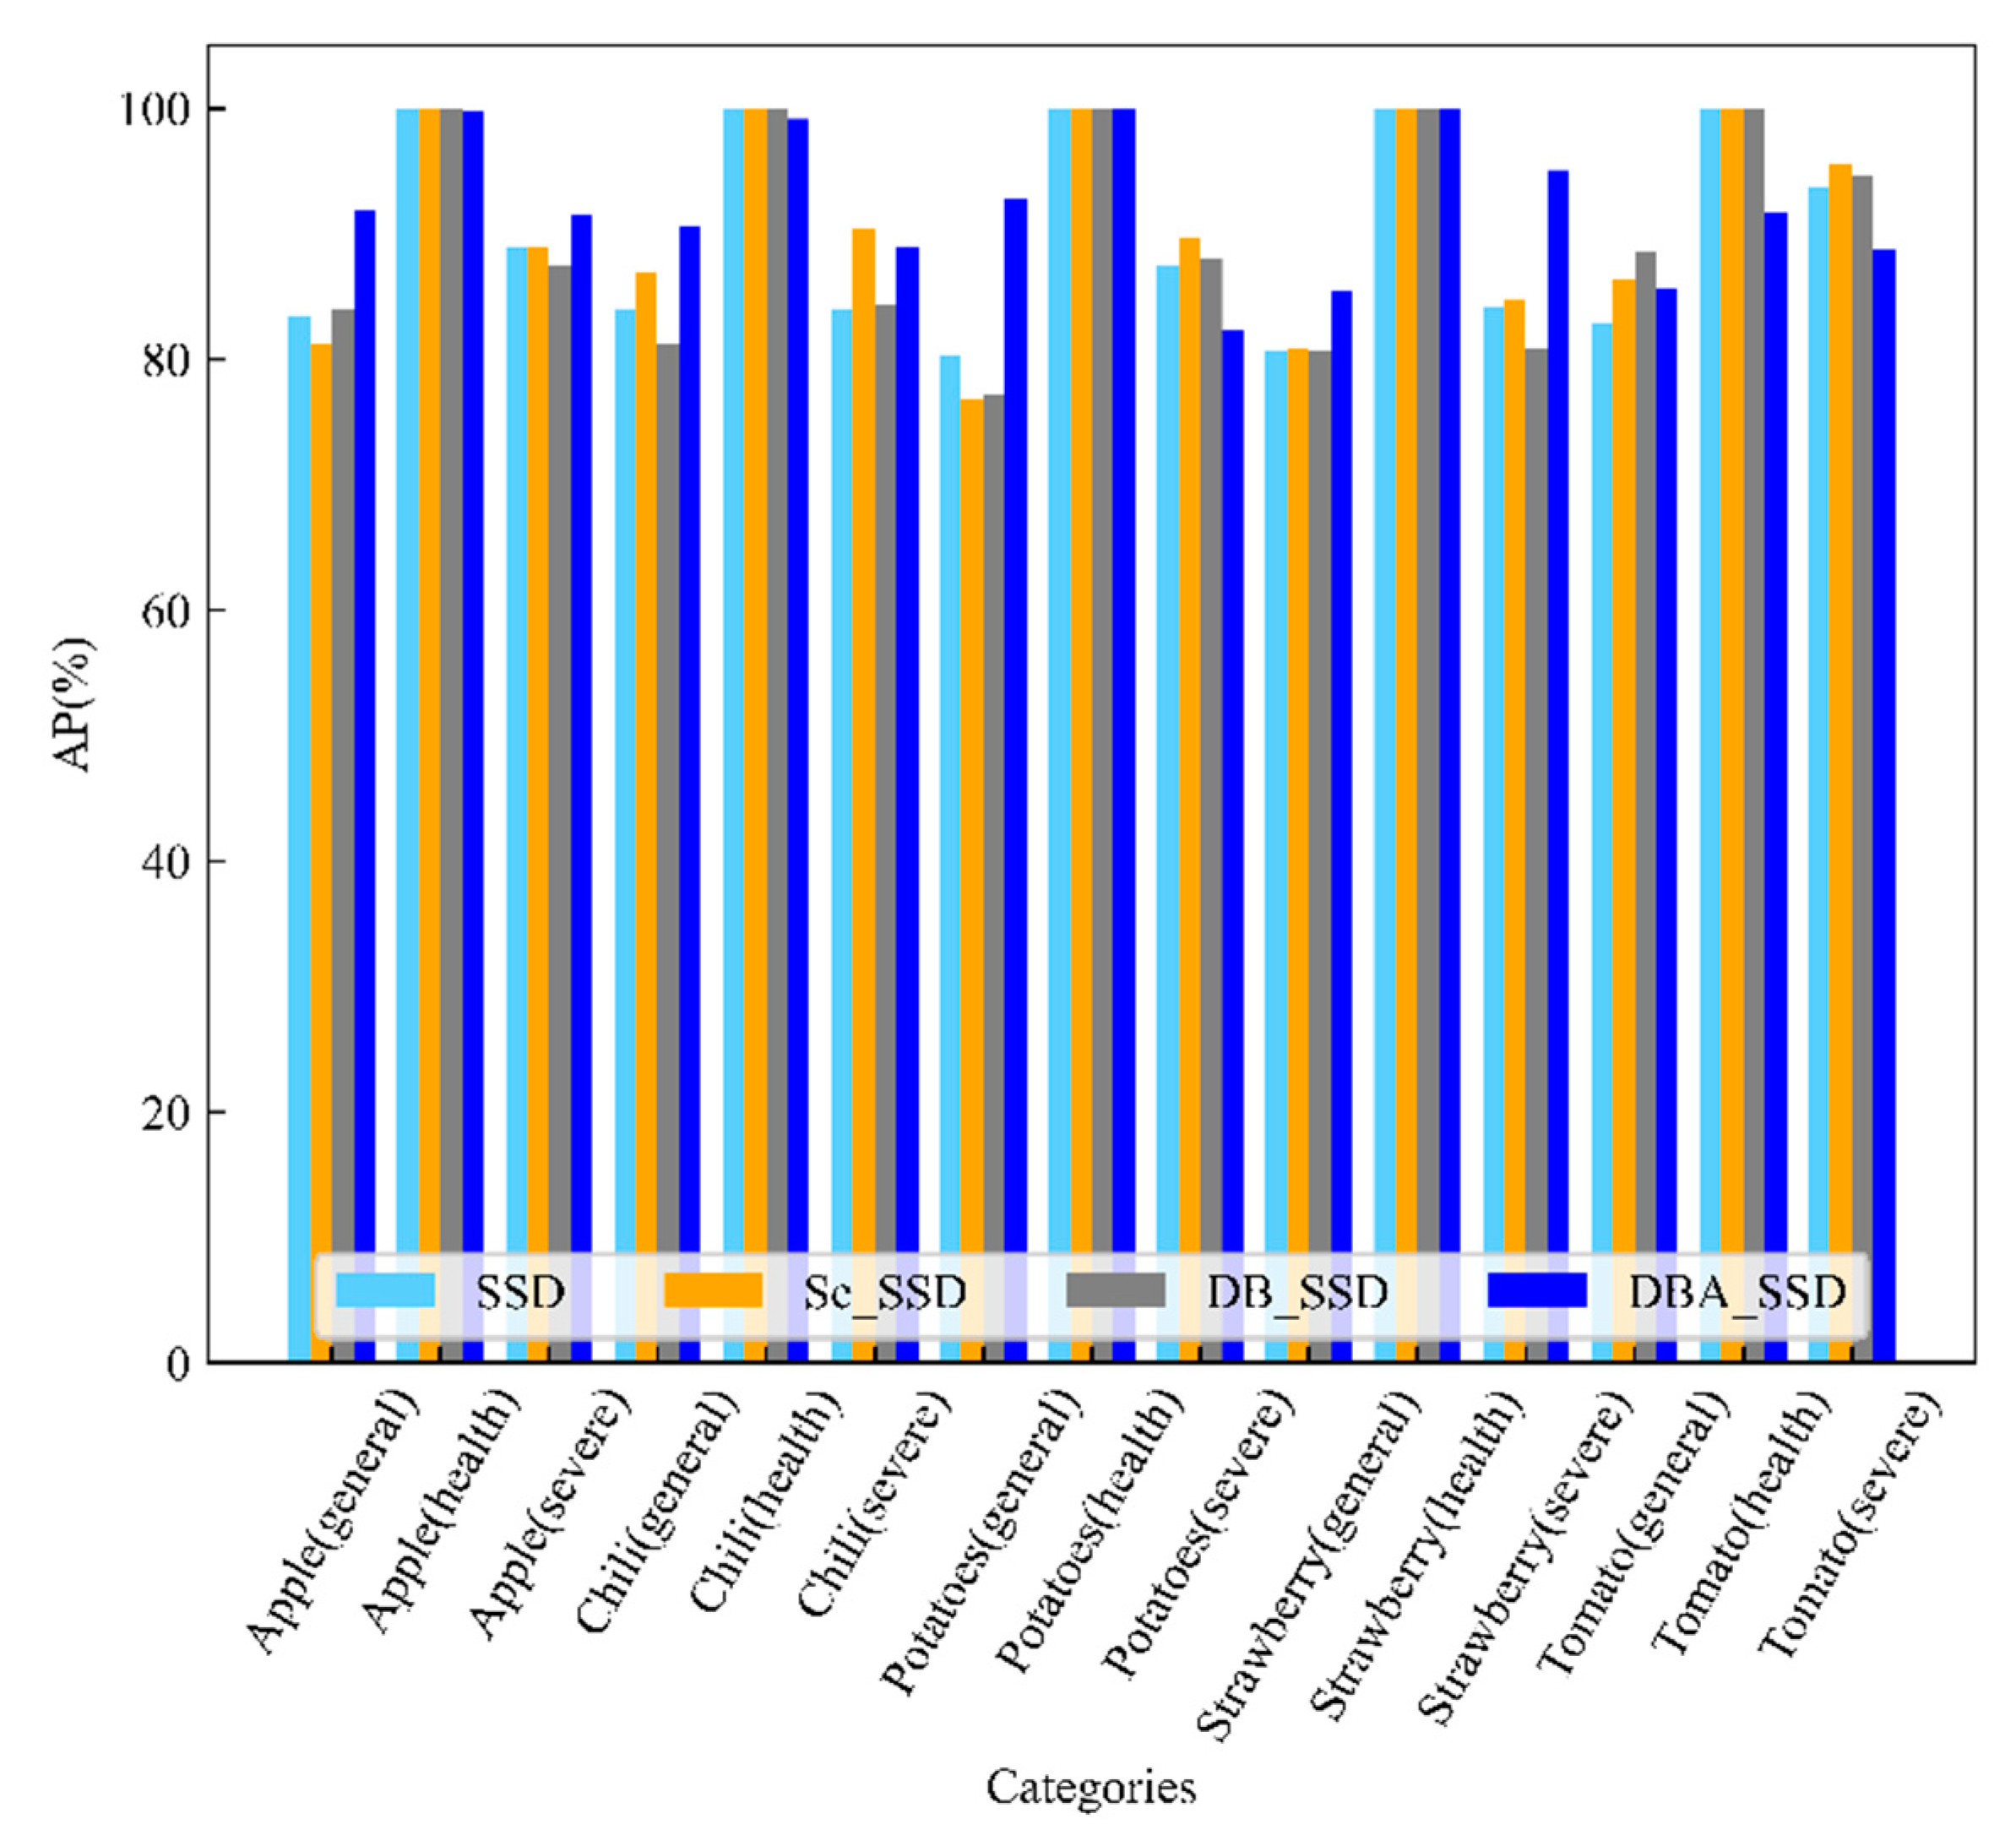
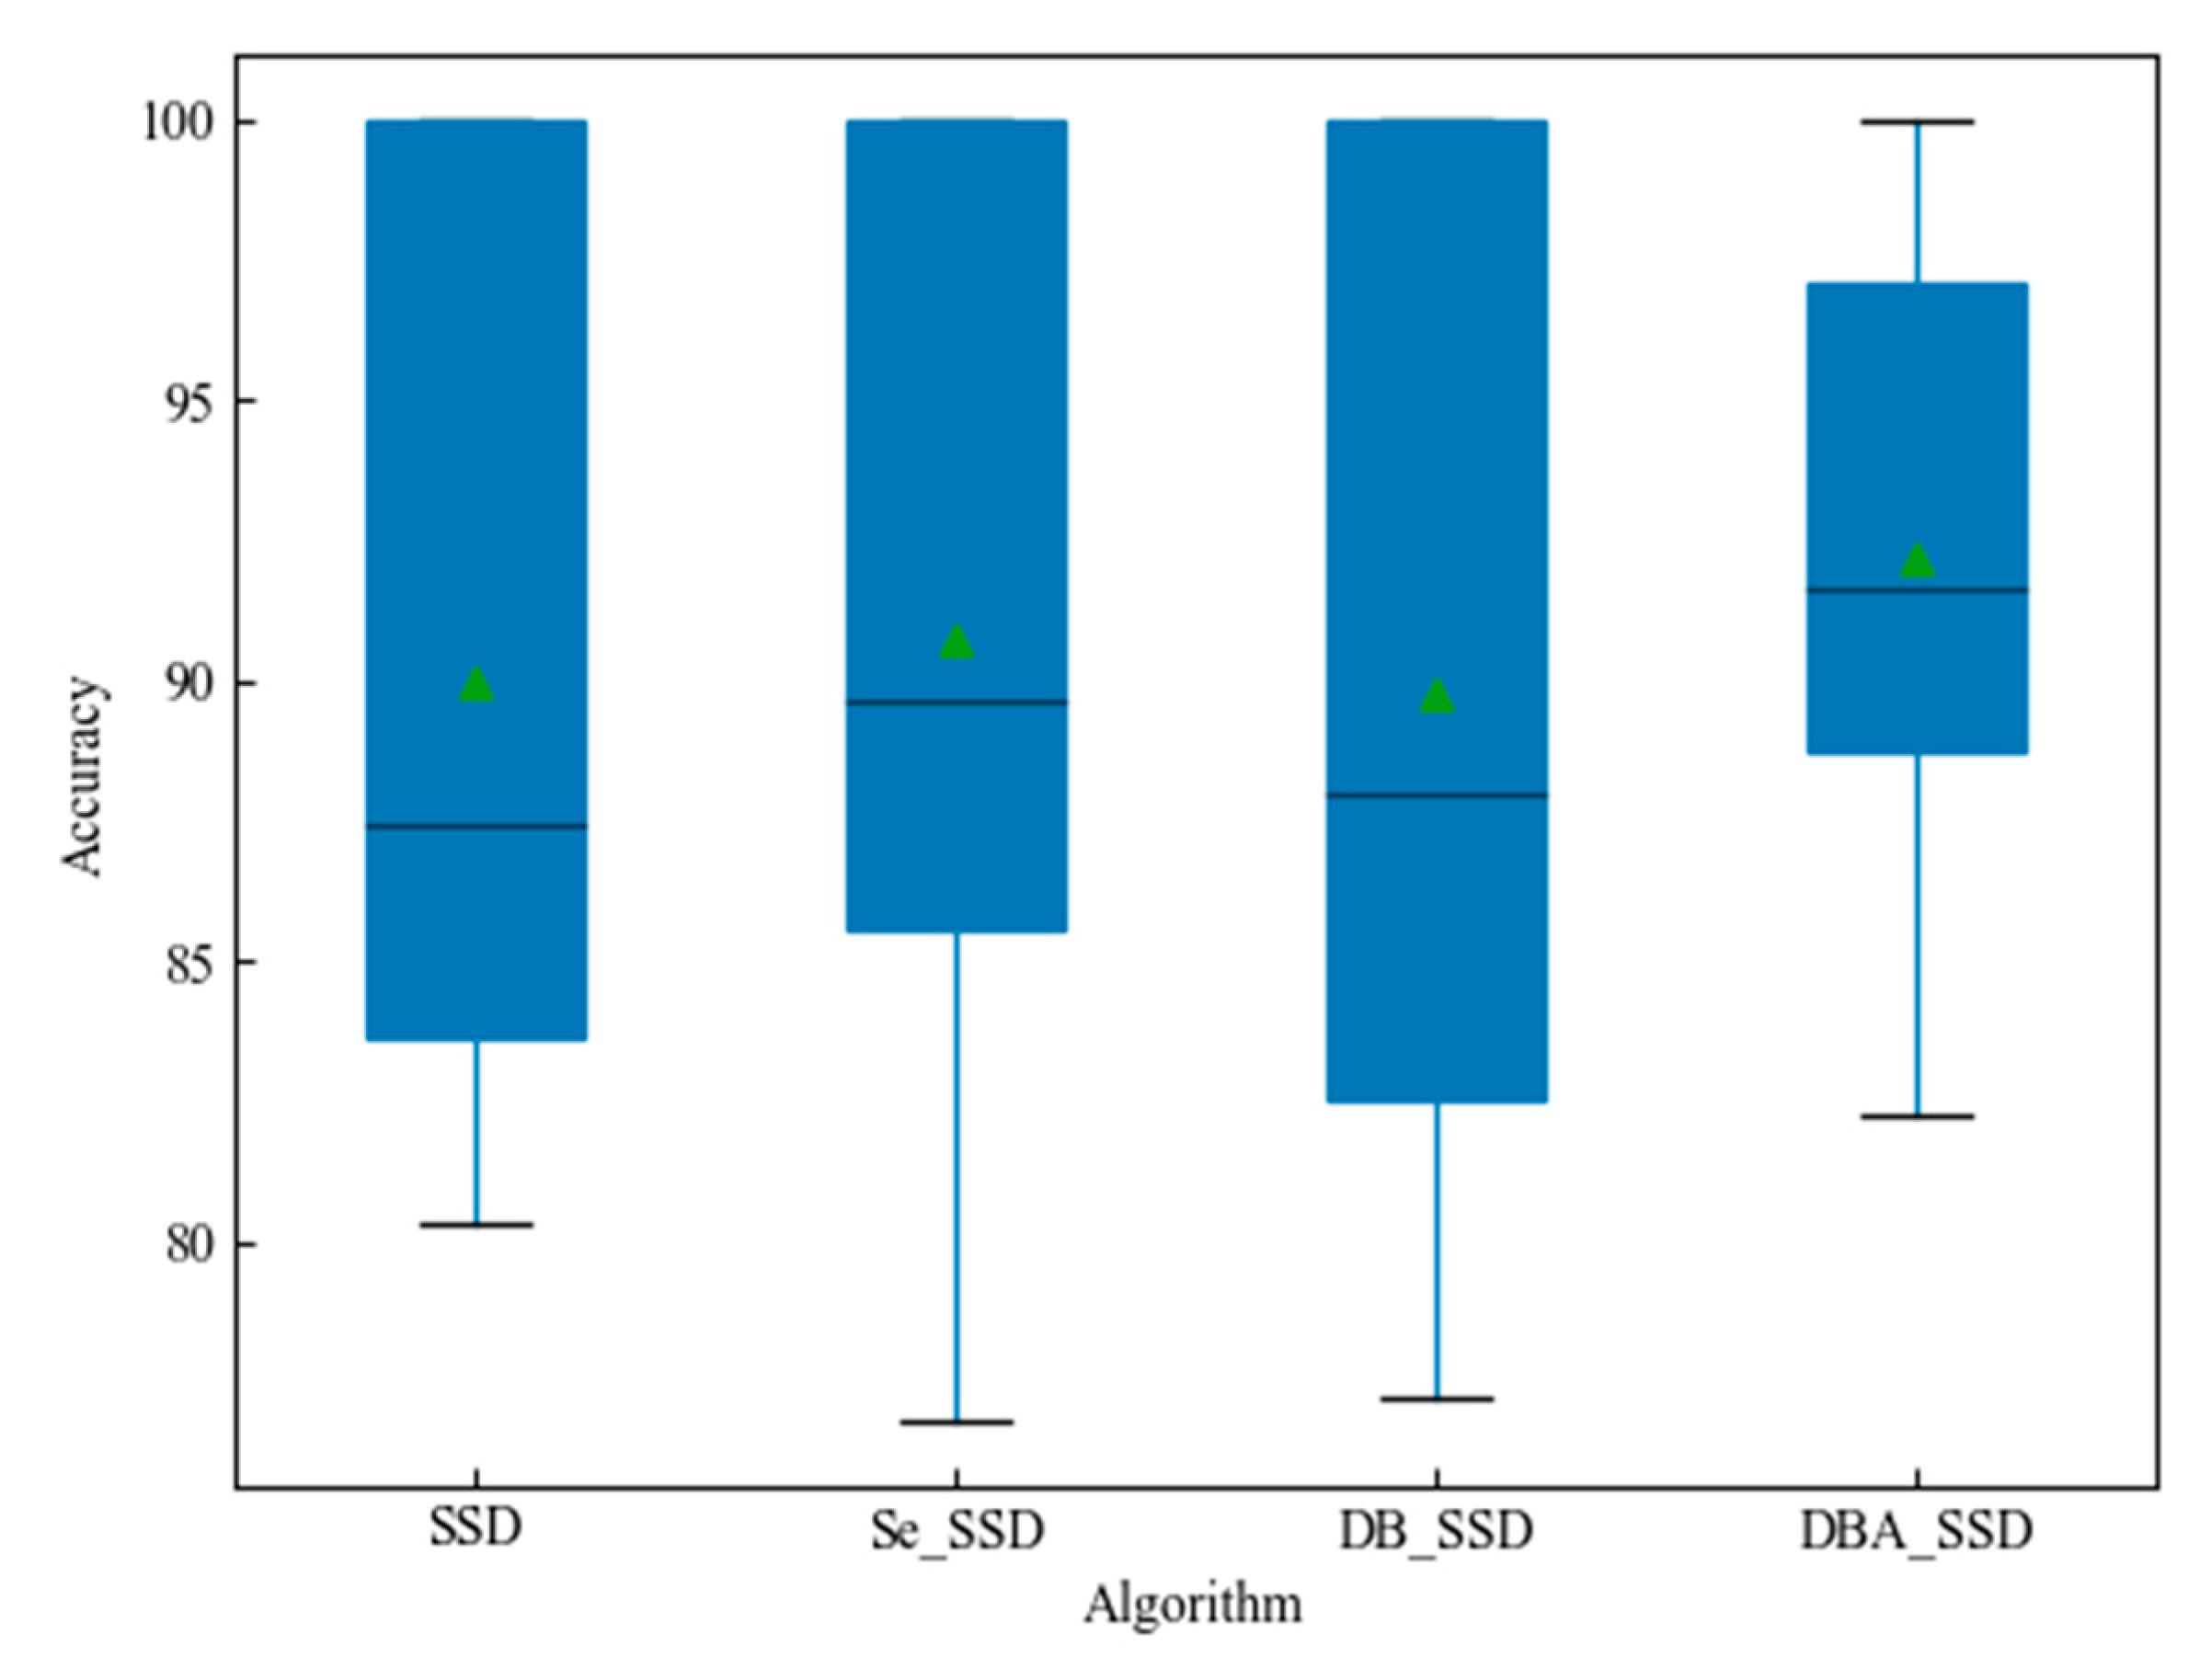
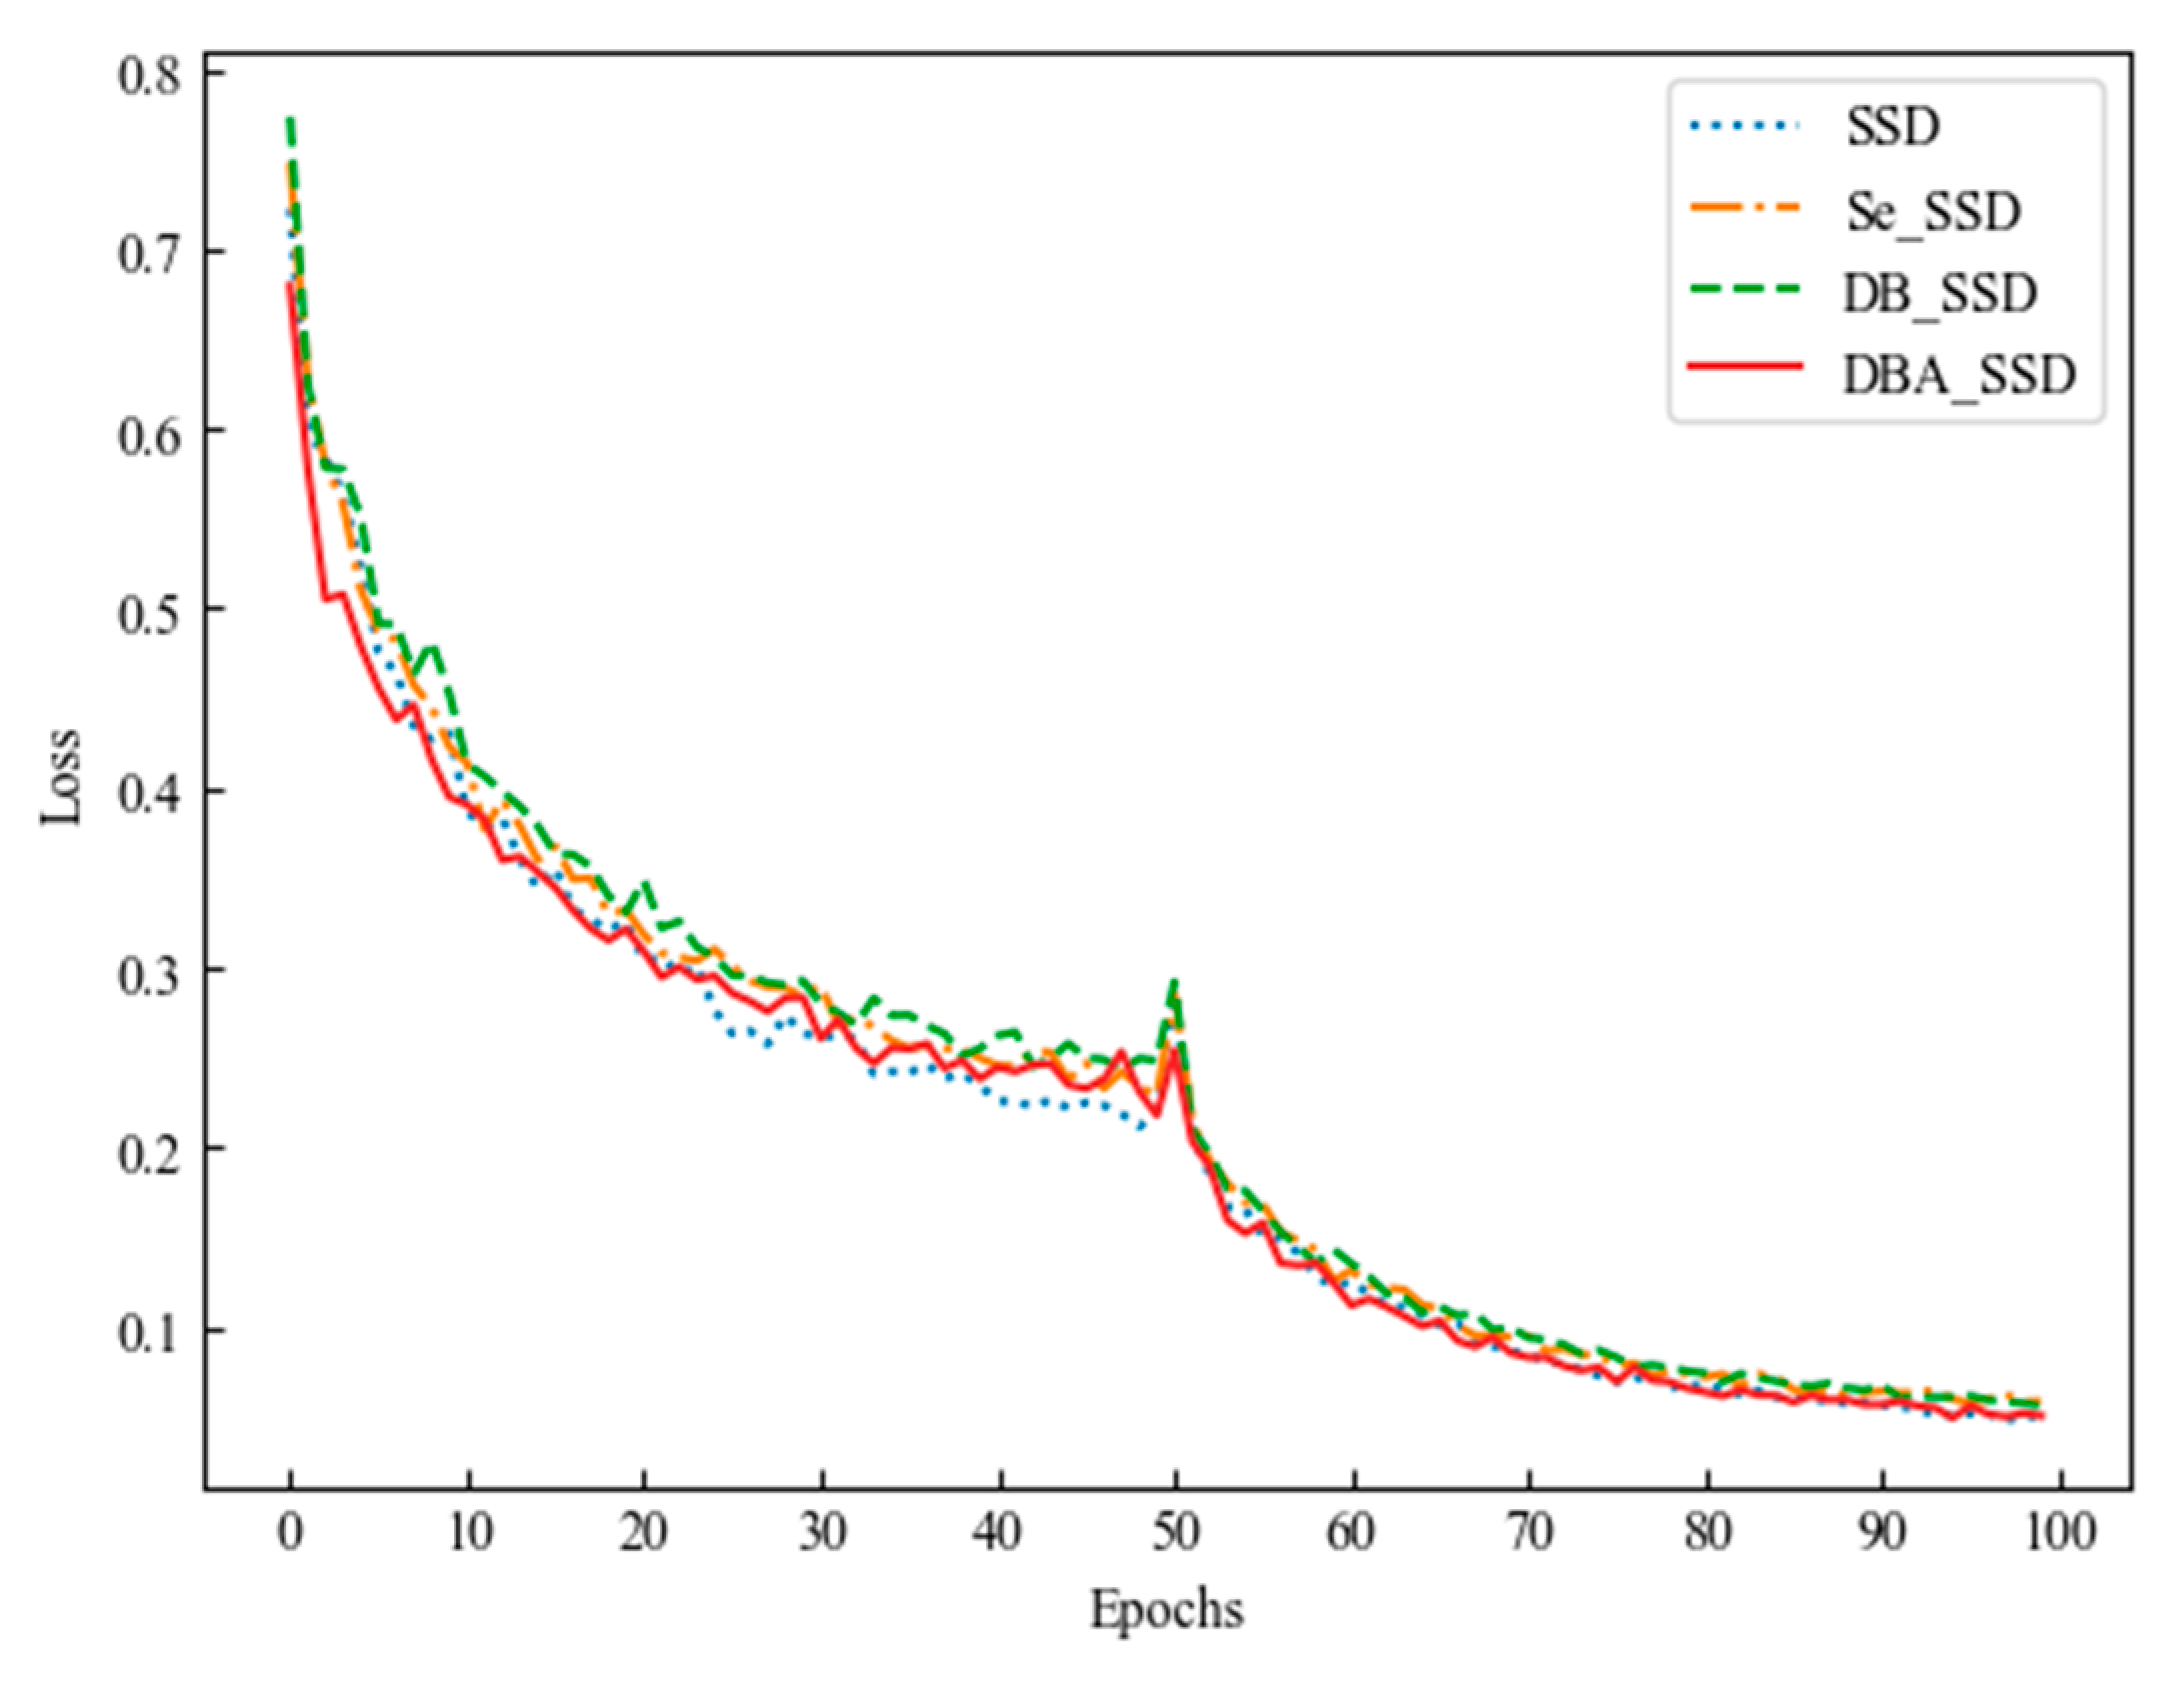
4.1. DBA_SSD Model Experimental Comparison Analysis

The first 50 Epochs were trained by freezing some of the network layer weights, and each batch was trained with 8 images. For the last 50 Epochs, the frozen layers were unfrozen and the full network was trained. The learning rate started at 5 × 10⁻⁴, and after unfrozen the learning rate was 10−4. Fine tuning of the model parameters was performed. As shown in Figure 10, the horizontal coordinate is the number of Epochs trained, and the vertical coordinate is the loss value at the end of training for each Epoch. Different line shapes indicate different improvement algorithms. The loss value of the model decreases as the number of iterations increases. The loss values in the training log gradually stop changing around 90–100 Epoch. The red thin solid line in the figure indicates the loss value of DBA_SSD, whose value is lower compared with the loss of SSD, Se_SSD, and DB_SSD algorithms.
The test results between SSD and its improved algorithm are shown in Table 2. DBA_SSD has the highest accuracy because Deep Block strengthens the network’s feature extraction ability on the one hand, and it incorporates the channel attention mechanism to accelerate the network learning on the other hand, so that the network focuses on the channels with high information content for feature learning. The prediction accuracy between its SSD and its improved algorithm for predicting different species of fruit and vegetable diseases is shown in Figure 11. The prediction accuracy of DBA_SSD is relatively high among most of the categories, and the mAP value of DBA_SSD is 92.20%, while the mAP values of SSD, Se_SSD, and DB_SSD are 9.96%, 90.77%, and 89.93%, respectively.
Further observe the data distribution of the experimental results in Figure 12. The horizontal coordinates indicate the improved algorithm types, the vertical coordinates are the distribution of predicted AP values for the 15 types, the points of the triangle indicate the mean, and the thin solid line in the middle of the rectangle indicates the median. From Figure 12, we can see that among the four algorithms SSD, Se_SSD, DB_SSD, and DBA_SSD, DBA_SSD prediction accuracy is more concentrated. Moreover, the median and mean are the highest. DBA_SSD algorithm has better performance compared with other improved algorithms.

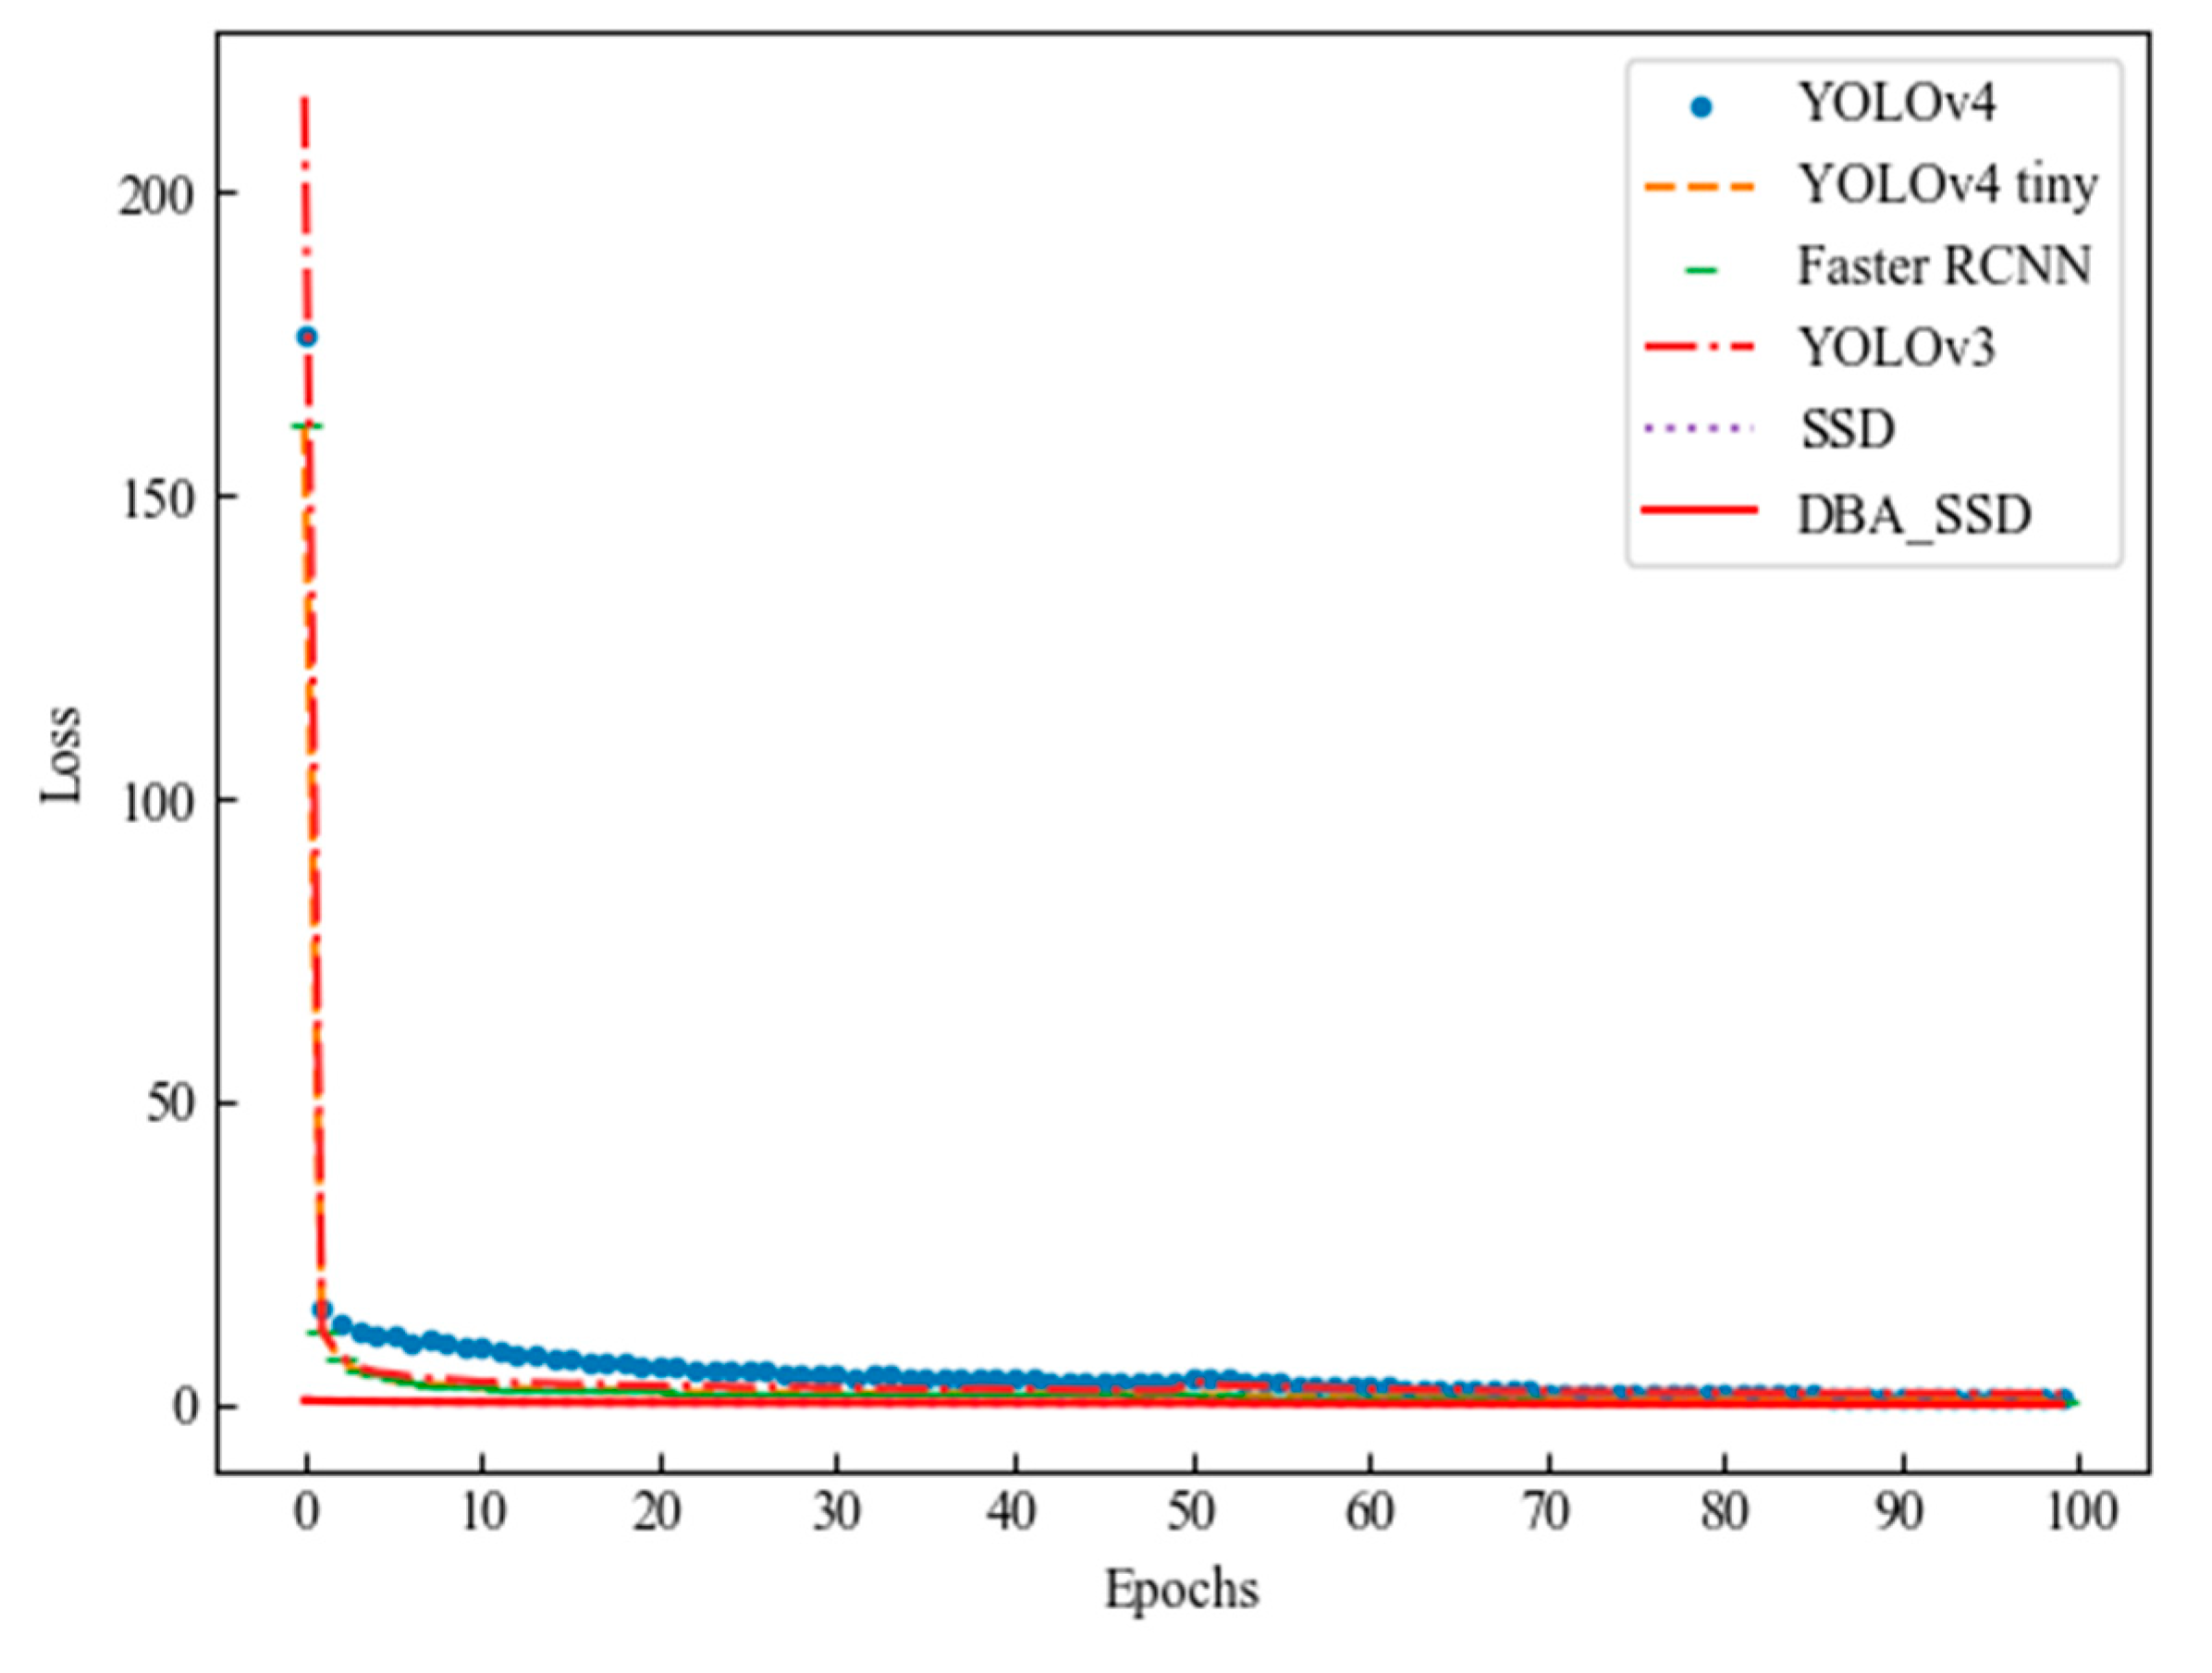
4.2. Comparative Analysis with Classical Target Detection Algorithms

This experiment compares and analyzes the test results of the classical target detection algorithms YOLOv4 [38], YOLOv4 tiny [39], Faster RCNN, and YOLOv3. This experiment is conducted with the same dataset in the same experimental environment, and its Loss variation of each algorithm is shown in Figure 13.
The disease degree of each plant leaf in this article can be divided into three categories: healthy, normal and severe (Table 3). Figure 14 then averages the detection accuracy of the same leaves on the basis of Table 3. The prediction accuracy of this category is the average of the sum of the prediction accuracy of the three degrees of leaves. Therefore, its horizontal coordinates indicate different target detection algorithms, and its vertical coordinates indicate the average prediction accuracy and the total average prediction accuracy (mAP) of different kinds of plant leaves.
Compared with DBA_SSD, YOLOv4 has lower prediction accuracy for Strawberry and Chili, YOLOv4 tiny has weaker prediction ability for Tomato, and YOLOv3 has lower prediction accuracy for Strawberry. This is the learning difference caused by different algorithms of feature extraction networks focusing on different information of the learned images, and DBA_SSD solves this deficiency by covering all levels of semantic information. The rightmost column indicates the average detection accuracy of the DBA_SSD algorithm in different categories, with the highest classification accuracy of 100% and the lowest of 82.24%.
Figure 15 shows that YOLOv4 corresponds to the largest rectangular box area, and its upper quartile edge is close to 100%, indicating the existence of a certain number of prediction accuracies higher than 95%. However, its predicted category accuracy is more discrete. YOLOv3 has a smaller rectangular area, but its distance at the top of the rectangle is not as far as DBA_SSD, indicating that the number of its higher accuracy is not as high as DBA_SSD. Although the upper quartile line of SSD is in contact with the 100% line, its rectangle area is larger, indicating that the prediction accuracy varies widely and is unstable. The rectangle box area of DBA_SSD is the smallest among other algorithms, indicating that the prediction accuracy is more concentrated and is closer to the 100% line, suggesting that a large part of the prediction accuracy is high and the prediction of each kind is more stable. The experiment shows that the DBA_SSD model has a high accuracy rate for the recognition of fruit and vegetable leaves, and the SSD is a one-stage target recognition algorithm with the advantage of fast recognition speed. The comprehensive performance of DBA_SSD has been improved compared with the previous SSD, and the performance is also higher compared with other target detection algorithms. The detection effect is shown in Figure 16.

5. Discussion

In the above experiments, we not only compare the performance of different improved algorithms, but also compare the performance of DBA_SSD with other classical target detection algorithms. The following is the performance comparison of each algorithm:
Table 4 shows the FPS, the number of parameters, and computational complexity for different algorithms based on the same image input. We can see that DBA_SSD has lower number of parameters than other classical target detection algorithms except YOLOv4-tiny method, but a little bit more parameters than SSD, SE_SSD and DB_SSD. It is worth mentioning that the fps of DBA_SSD is not reduced too much. The algorithm can be applied to students’ academic research, scientific algorithm research, but it is still far from agricultural applications. The real-time performance of the algorithm still needs to be improved. Another shortcoming is that the algorithm has a high accuracy only for the currently trained species. If the plants that need to be predicted are not mentioned in this paper, they need to be retrained. But on the other hand, the algorithm is more effective if it is applied to the disease identification of the same plant only. At the same time, considering that individual differences occur in the same plant growing in different environments, we add pictures of individual differences of the same plant in the data enhancement process, so that the individual differences will not affect the final detection results and make the algorithm proposed in this paper generalize better. The algorithm proposed in this paper is able to detect plant diseases early in their development and take timely control measures, which helps to reduce production costs. At the commercial scale, it is clear that capital investment in the adopted method is initially required [40]. However, broad-scale commercial applications can provide high returns through significant improvements in process improvements and cost reductions. This is the significance of the algorithm presented in this paper.

6. Conclusions

In this paper, we discuss work related to plant disease detection and enhance the number and variety of datasets by performing spatial transformations as well as pixel processing based on the original dataset. To address the problem of low recognition rate and low accuracy of SSD model, we propose a DBA_SSD network model for plant leaf detection by incorporating 1 × 1 convolution, residual network and attention mechanism in the SSD algorithm. In our experiments we compare several classical target detection algorithms and verify the efficacy of DBA_SSD algorithm in plant disease detection. The experiments show that the DBA_SSD algorithm improves the accuracy to 92.20% and has high robustness and speed. The significance of this algorithm is to be able to detect the disease at the early stage of plant disease in time, so as to prevent the disease and reduce the economic loss in time. This is of great significance for disease control. The shortcoming of the algorithm in this paper is that the algorithm is still too far from being applied in real production, so future work will focus on optimizing the algorithm and implanting it easily into embedded devices so that it can be applied to the real-time monitoring of agricultural plant diseases.

Author Contributions

All authors contributed to this work. J.W. designed the research and processed the corresponding data. J.W. wrote the first draft of the manuscript. J.Y. and H.D. gave some guidance about methods. Writing—review and editing, J.Y. and L.Y. All authors have read and agreed to the published version of the manuscript.

Funding

This research was funded by the Higher Education Project of Guizhou Province (No. [2020]005, No. [2020]009); the Science and Technology Project of Guizhou Province (No. [2019]3003).

Data Availability Statement

The data used to support this study’s findings are available from the corresponding author upon request.

Conflicts of Interest

The authors declare no conflict of interest.

References

  1. Reza, N.; Na, I.S.; Baek, S.W.; Lee, K.-H. Rice yield estimation based on K-means clustering with graph-cut segmentation using low-altitude UAV images. Biosyst. Eng. 2018, 177, 109–121. [Google Scholar] [CrossRef]
  2. Quan, L.; Feng, H.; Lv, Y.; Wang, Q.; Zhang, C.; Liu, J.; Yuan, Z. Maize seedling detection under different growth stages and complex field environments based on an improved Faster R–CNN. Biosyst. Eng. 2019, 184, 1–23. [Google Scholar] [CrossRef]
  3. Sun, Y.; Liu, X.; Yuan, M.; Ren, L.; Wang, J.; Chen, Z. Automatic in-trap pest detection using deep learning for pheromone-based Dendroctonus valens monitoring. Biosyst. Eng. 2018, 176, 140–150. [Google Scholar] [CrossRef]
  4. Barbedo, J.G.A. Plant disease identification from individual lesions and spots using deep learning. Biosyst. Eng. 2019, 180, 96–107. [Google Scholar] [CrossRef]
  5. Taheri-Garavand, A.; Nasiri, A.; Fanourakis, D.; Fatahi, S.; Omid, M.; Nikoloudakis, N. Automated In Situ Seed Variety Identification via Deep Learning: A Case Study in Chickpea. Plants 2021, 10, 1406. [Google Scholar] [CrossRef] [PubMed]
  6. Nasiri, A.; Taheri-Garavand, A.; Fanourakis, D.; Zhang, Y.-D.; Nikoloudakis, N. Automated Grapevine Cultivar Identification via Leaf Imaging and Deep Convolutional Neural Networks: A Proof-of-Concept Study Employing Primary Iranian Varieties. Plants 2021, 10, 1628. [Google Scholar] [CrossRef] [PubMed]
  7. Fu, L.; Feng, Y.; Wu, J.; Liu, Z.; Gao, F.; Majeed, Y.; Al-Mallahi, A.; Zhang, Q.; Li, R.; Cui, Y. Fast and accurate detection of kiwifruit in orchard using improved YOLOv3-tiny model. Precis. Agric. 2020, 22, 754–776. [Google Scholar] [CrossRef]
  8. Zhao, H.; Zhou, Y.; Zhang, L.; Peng, Y.; Hu, X.; Peng, H.; Cai, X. Mixed YOLOv3-LITE: A Lightweight Real-Time Object Detection Method. Sensors 2020, 20, 1861. [Google Scholar] [CrossRef] [Green Version]
  9. Liu, G.; Nouaze, J.C.; Mbouembe, P.L.T.; Kim, J.H. YOLO-Tomato: A Robust Algorithm for Tomato Detection Based on YOLOv3. Sensors 2020, 20, 2145. [Google Scholar] [CrossRef] [Green Version]
  10. Redmon, J.; Farhadi, A. YOLOv3: An Incremental Improvement. arXiv 2018, arXiv:1804.02767. [Google Scholar]
  11. Ren, S.; He, K.; Girshick, R.; Sun, J. Faster R-CNN: Towards Real-Time Object Detection with Region Proposal Networks. IEEE Trans. Pattern Anal. Mach. Intell. 2017, 39, 1137–1149. [Google Scholar] [CrossRef] [Green Version]
  12. Liu, J.; Wang, X. Early recognition of tomato gray leaf spot disease based on MobileNetv2-YOLOv3 model. Plant Methods 2020, 16, 1–16. [Google Scholar] [CrossRef]
  13. Yi, J.; Krusenbaum, L.; Unger, P.; Hüging, H.; Seidel, S.J.; Schaaf, G.; Gall, J. Deep Learning for Non-Invasive Diagnosis of Nutrient Deficiencies in Sugar Beet Using RGB Images. Sensors 2020, 20, 5893. [Google Scholar] [CrossRef]
  14. Krizhevsky, A.; Sutskever, I.; Hinton, G.E. ImageNet classification with deep convolutional neural networks. Adv. Neural Inf. Process. Syst. 2017, 60, 84–90. [Google Scholar] [CrossRef]
  15. Simonyan, K.; Zisserman, A. Very Deep Convolutional Networks for Large-Scale Image Recognition. arXiv 2014, arXiv:1409.1556. [Google Scholar]
  16. Huang, G.; Liu, Z.; Van Der Maaten, L.; Weinberger, K.Q. Densely Connected Convolutional Networks. arXiv 2016, arXiv:1608.06993. [Google Scholar]
  17. Iandola, F.N.; Han, S.; Moskewicz, M.W.; Ashraf, K.; Dally, W.J.; Keutzer, K. SqueezeNet: AlexNet-level accuracy with 50x fewer parameters and <0.5 MB model size. arXiv 2016, arXiv:1602.07360. [Google Scholar]
  18. Liu, W.; Anguelov, D.; Erhan, D.; Szegedy, C.; Reed, S.; Fu, C.Y.; Berg, A.C. SSD: Single Shot MultiBox Detector. arXiv 2015, arXiv:1512.02325. [Google Scholar]
  19. Taheri-Garavand, A.; Nejad, A.R.; Fanourakis, D.; Fatahi, S.; Majd, M.A. Employment of artificial neural networks for non-invasive estimation of leaf water status using color features: A case study in Spathiphyllum wallisii. Acta Physiol. Plant. 2021, 43, 78. [Google Scholar] [CrossRef]
  20. Chao, X.; Sun, G.; Zhao, H.; Li, M.; He, D. Identification of Apple Tree Leaf Diseases Based on Deep Learning Models. Symmetry 2020, 12, 1065. [Google Scholar] [CrossRef]
  21. Chollet, F. Xception: Deep Learning with Depthwise Separable Convolutions. arXiv 2016, arXiv:1610.02357. [Google Scholar]
  22. Howard, A.G.; Zhu, M.; Chen, B.; Kalenichenko, D.; Wang, W.; Weyand, T.; Andreetto, M.; Adam, H. MobileNets: Efficient Convolutional Neural Networks for Mobile Vision Applications. arXiv 2017, arXiv:1704.04861. [Google Scholar]
  23. Shrivastava, V.K.; Pradhan, M.K. Rice plant disease classification using color features: A machine learning paradigm. J. Plant Pathol. 2020, 103, 17–26. [Google Scholar] [CrossRef]
  24. Rao, A.; Kulkarni, S. A Hybrid Approach for Plant Leaf Disease Detection and Classification Using Digital Image Processing Methods. Int. J. Electr. Eng. Educ. 2020, 0020720920953126. [Google Scholar] [CrossRef]
  25. Abdulridha, J.; Ampatzidis, Y.; Roberts, P.; Kakarla, S.C. Detecting powdery mildew disease in squash at different stages using UAV-based hyperspectral imaging and artificial intelligence. Biosyst. Eng. 2020, 197, 135–148. [Google Scholar] [CrossRef]
  26. Abdu, A.M.; Mokji, M.M.; Sheikh, U.U. Automatic vegetable disease identification approach using individual lesion features. Comput. Electron. Agric. 2020, 176, 105660. [Google Scholar] [CrossRef]
  27. Samiei, S.; Rasti, P.; Vu, J.L.; Buitink, J.; Rousseau, D. Deep learning-based detection of seedling development. Plant Methods 2020, 16, 103. [Google Scholar] [CrossRef] [PubMed]
  28. Pleșoianu, A.-I.; Stupariu, M.-S.; Șandric, I.; Pătru-Stupariu, I.; Drăguț, L. Individual Tree-Crown Detection and Species Classification in Very High-Resolution Remote Sensing Imagery Using a Deep Learning Ensemble Model. Remote Sens. 2020, 12, 2426. [Google Scholar] [CrossRef]
  29. Kerkech, M.; Hafiane, A.; Canals, R. Vine disease detection in UAV multispectral images using optimized image registration and deep learning segmentation approach. Comput. Electron. Agric. 2020, 174, 105446. [Google Scholar] [CrossRef]
  30. Badrinarayanan, V.; Kendall, A.; Cipolla, R. SegNet: A Deep Convolutional Encoder-Decoder Architecture for Image Segmentation. IEEE Trans. Pattern Anal. Mach. Intell. 2017, 39, 2481–2495. [Google Scholar] [CrossRef]
  31. Zhang, J.; Xie, T.; Yang, C.; Song, H.; Jiang, Z.; Zhou, G.; Zhang, D.; Feng, H.; Xie, J. Segmenting Purple Rapeseed Leaves in the Field from UAV RGB Imagery Using Deep Learning as an Auxiliary Means for Nitrogen Stress Detection. Remote Sens. 2020, 12, 1403. [Google Scholar] [CrossRef]
  32. Gan, H.; Lee, W.S.; Alchanatis, V.; Abd-Elrahman, A. Active thermal imaging for immature citrus fruit detection. Biosyst. Eng. 2020, 198, 291–303. [Google Scholar] [CrossRef]
  33. Bi, C.; Wang, J.; Duan, Y.; Fu, B.; Kang, J.-R.; Shi, Y. MobileNet Based Apple Leaf Diseases Identification. Mob. Netw. Appl. 2020, 1–9. [Google Scholar] [CrossRef]
  34. Barman, U.; Choudhury, R.D.; Sahu, D.; Barman, G.G. Comparison of convolution neural networks for smartphone image based real time classification of citrus leaf disease. Comput. Electron. Agric. 2020, 177, 105661. [Google Scholar] [CrossRef]
  35. Hu, J.; Shen, L.; Albanie, S.; Sun, G.; Wu, E. Squeeze-and-Excitation Networks. IEEE Trans. Pattern Anal. Mach. Intell. 2019, 42, 2011–2023. [Google Scholar] [CrossRef] [PubMed] [Green Version]
  36. Buslaev, A.; Iglovikov, V.I.; Khvedchenya, E.; Parinov, A.; Druzhinin, M.; Kalinin, A.A. Albumentations: Fast and Flexible Image Augmentations. Information 2020, 11, 125. [Google Scholar] [CrossRef] [Green Version]
  37. Hughes, D.; Salathé, M. An open access repository of images on plant health to enable the development of mobile disease diagnostics. arXiv 2015, arXiv:1511.08060. [Google Scholar]
  38. Bochkovskiy, A.; Wang, C.Y.; Liao, H.Y.M. YOLOv4: Optimal Speed and Accuracy of Object Detection. arXiv 2020, arXiv:2004.10934. [Google Scholar]
  39. Jiang, Z.; Zhao, L.; Li, S.; Jia, Y. Real-time object detection method based on improved YOLOv4-tiny. arXiv 2020, arXiv:2011.04244. [Google Scholar]
  40. Taheri-Garavand, A.; Mumivand, H.; Fanourakis, D.; Fatahi, S.; Taghipour, S. An artificial neural network approach for non-invasive estimation of essential oil content and composition through considering drying processing factors: A case study in Mentha aquatica. Ind. Crop. Prod. 2021, 171, 113985. [Google Scholar] [CrossRef]
Figure 1. SSD backbone network structure.
Information 12 00474 g001
Figure 2. Se_Block Attention Module.
Information 12 00474 g002
Figure 3. Se_SSD network structure.
Information 12 00474 g003
Figure 4. (a) Residual network module and (b) 1 × 1 convolution.
Information 12 00474 g004
Figure 5. Enriched feature extraction module ((a) Deep_Block, a feature extraction module combining residual network and 1 × 1 convolution; (b) Deep_Block_Attention, a feature extraction module adding an attention mechanism to (a)).
Information 12 00474 g005
Figure 6. DBA_SSD network structure.
Information 12 00474 g006
Figure 7. Data set composition structure.
Information 12 00474 g007
Figure 8. Data Enhancement. (a) Positive sample (healthy); (b) Negative sample (Diseases).
Information 12 00474 g008aInformation 12 00474 g008b
Figure 9. Experimental flow.
Information 12 00474 g009
Figure 10. SSD and its improved algorithm loss variation graph.
Information 12 00474 g010
Figure 11. AP diagram of SSD and its improved algorithm for the detection of different kinds of diseases.
Information 12 00474 g011
Figure 12. Box diagram of SSD and its improvement algorithm.
Information 12 00474 g012
Figure 13. Target detection algorithm loss diagram.
Information 12 00474 g013
Figure 14. Heat map of correlation between different target detection algorithms and vegetable and fruit leaf types.
Information 12 00474 g014
Figure 15. Box plot of AP statistics under target detection algorithm.
Information 12 00474 g015
Figure 16. DBA_SSD recognition effect.
Information 12 00474 g016aInformation 12 00474 g016b
Table 1. Confusion matrix.
True Class
Predict classTP
True Positive
FP
False Positive
FN
False Negative
TN
True Negative
Table 2. Comparison of accuracy of improved SSD algorithm.
Target Identification MethodsInserted ModulesmAP
SSD\89.96%
Se_SSDSe_Block90.77%
DB_SSDDeep_Block89.93%
DBA_SSDDeep_Block_Attention92.20%
Table 3. Comparison of the accuracy of the improved SSD model and other target detection algorithms for the detection of different kinds of diseases.
CategoryYOLOv4YOLOv4 TinyYOLOv3SSDFaster RCNNDBA_SSD
Algorithm
Apple(general)94.79%78.32%88.87%83.45%74.85%91.83%
Apple(health)100.00%99.78%94.83%100.00%100.00%99.73%
Apple(severe)82.27%88.01%90.71%88.93%88.20%91.56%
Chili(general)73.99%92.32%81.60%83.89%90.54%90.65%
Chili(health)98.75%100.00%100.00%100.00%100.00%99.12%
Chili(severe)73.74%72.70%91.55%83.94%100.00%88.86%
Potatoes(general)92.71%89.41%88.37%80.35%88.65%92.72%
Potatoes(health)94.74%100.00%100.00%100.00%99.80%100.00%
Potatoes(severe)98.08%91.18%89.32%87.46%82.88%82.24%
Strawberry(general)63.52%80.89%59.83%80.69%73.48%85.37%
Strawberry(health)99.52%100.00%100.00%100.00%100.00%100.00%
Strawberry(severe)67.46%76.44%78.95%84.11%92.64%95.07%
Tomato(general)85.70%85.64%95.81%82.85%85.02%85.54%
Tomato(health)100.00%94.58%100.00%100.00%89.14%91.67%
Tomato(severe)80.35%64.31%78.24%93.69%86.33%88.65%
mAP87.04%87.57%89.21%89.96%90.10%92.20%
Table 4. Performance comparison of target detection algorithms.
AlgorithmBackbone ModelImage SizeParametersFPSGFLOPs
YOLOv4CSPDarkNet53512 × 51264.62 M6245.96GMac
YOLOv4-tinyCSPDarknet53-tiny512 × 5125.91 M755.19 GMac
Faster RCNNVGG16512 × 512136.98 M986.0 GMac
YOLOv3darknet53512 × 51261.6 M3449.7 GMac
SSDVGG16512 × 51225.48 M4585.6 GMac
SE_SSDVGG16_SE512 × 51225.60M4385.62 GMac
DB_SSDVGG_DB512 × 51230.55 M4086.6 GMac
DBA_SSDVGG_DBA512 × 51230.57M4086.6GMac
Publisher’s Note: MDPI stays neutral with regard to jurisdictional claims in published maps and institutional affiliations.

