Article

Robust and Precise Matching Algorithm Combining Absent Color Indexing and Correlation Filter

1
Graduate School of Information Science and Technology, Hokkaido University, Sapporo 0600808, Japan
2
Research & Development Group, Hitachi Ltd., Hitachi 3191292, Japan
3
Graduate School of Computer Science and Technology, Changchun University of Science and Technology, Changchun 130022, China
*
Author to whom correspondence should be addressed.
Information 2021, 12(10), 428; https://doi.org/10.3390/info12100428
Submission received: 31 August 2021 / Revised: 9 October 2021 / Accepted: 11 October 2021 / Published: 18 October 2021

Abstract

:
This paper presents a novel method that absorbs the strong discriminative ability from absent color indexing (ABC) to enhance sensitivity and combines it with a correlation filter (CF) for obtaining a higher precision; this method is named ABC-CF. First, by separating the original color histogram, apparent and absent colors are introduced. Subsequently, an automatic threshold acquisition is proposed using a mean color histogram. Next, a histogram intersection is selected to calculate the similarity. Finally, CF follows them to solve the drift caused by ABC during the matching process. The novel approach proposed in this paper realizes robustness in distortion of target images and higher margins in fundamental matching problems, and then achieves more precise matching in positions. The effectiveness of the proposed approach can be evaluated in the comparative experiments with other representative methods by use of the open data.

1. Introduction

In the field of computer vision [1,2], color histogram-based features have been applied in various applications, including image retrieval [3], face recognition, pedestrian tracking [4], and object matching [5]. Among other features, such as grayscale, texture, gradient, and geometric features, color features are much vital in providing useful cues for object detection or matching. In many applications, the color features often appear in the algorithms as a main or auxiliary feature. The color feature [6] of an image is an important statistical feature in histogram-based methods, which facilitates solving problems with rotation, deformation, and scale variation during the matching process. Therefore, using the histogram method to perform statistics on colors can effectively reveal the distribution characteristics of colors to achieve robust search goals. Swain et al. [7] and Stricker et al. [8] introduced a method to utilize a color histogram-based approach for matching, known as color indexing (CI) and the cumulative color histogram (CCH). In CI, a histogram intersection approach is used to perform matching by considering each bin in the color histogram as a type of color feature. The CCH describes the index to fix the order of the colors and then recalculates each bin value to strengthen the feature of high-frequency colors. They can manage the challenges of rotation, deformation, and scale variation; however, they cannot easily process noise interferences and illumination problems. Thereafter, a series of fuzzy color histogram-based methods [9,10,11,12] have been proposed to overcome the problems of noise interference and illumination. Verma et al. [13] introduced triangular membership functions to improve fuzzy color histograms for template matching (TFCM).
However, color histogram-based methods present some disadvantages, such as the lack of position information, which reduces the discrimination sensitivity. In addition to its robustness, as a crucial evaluation indicator in matching, its alignment precision is another evaluation indicator for improving its accuracy while maintaining robustness during object matching.
Image matching technologies based on image features have been widely applied, where classical template matching methods include the sum of squared difference (SSD) and normalized cross-correlation (NCC) [14,15]. Most object detection or matching methods, such as LGCmF [16] and MGNet [17], are based on multi-feature fusion and training processes. However, in general, they tend to be time-consuming, especially in preparing sufficiently large training datasets for models designed to learn verified training signals in applications requiring high performance. In this paper, an efficient approach is proposed for robust, fast, and accurate matching that is based on color histogram matching and combination with a high precision matching scheme.
The novel approach proposed in this paper realizes robustness in distortion of target images and higher margins in fundamental matching problems, and then achieves more precise matching in position. The effectiveness of the proposed approach is evaluated in comparative experiments with other representative methods by use of the open data. In our previous studies [18,19], the fundamental idea of absent color indexing, named ABC, i.e., the decomposition of a normal histogram into two disjoint ones using fixed parameters, was introduced to achieve good performances in feasible matching. In this paper, it is largely modified to give a clear formalization and a new scheme for defining an important parameter h T by use of an original concept of the mean color histogram to obtain more effective threshold values. Furthermore, it can be combined with the correlation filter, CF, that was utilized after ABC to achieve a more precise target search.
The remaining sections of the paper are as follows: Section 2 introduces the concept of apparent colors and absent colors, as well as a statistical method to determine the threshold h T . Section 3 describes a method to incorporate CF to improve the match precision. Section 4 shows the experimental results for real-world and open data. Section 5 presents the conclusions and future work.

2. Absent Color Indexing

2.1. Why Are Minor Colors Important?

The motivation of introducing a novel concept is to enhance color-based features in cases where an object to be searched has a few but prominent colors together with existing features. For example, when identifying an individual person, eye color is a quantitatively minor or hidden color feature, but it can provide an important feature for identification. Especially in the cases of image pattern search problems by computers, these may be somewhat hopeful to contribute separation of the targets from other candidates through enhancement of identifier in apparent or neutral color features.
In Figure 1, I 1 and I 2 are examples of the same size ( 100 , 90 ) that exhibit extremely similar colors; the major color is black which occupies a large proportion; yellow, red, and white are minor colors with relatively few pixels. For conventional color histogram-based matching, the main colors have played an essential role in existing similarity calculation methods. However, minor colors were ignored as trivial information for evaluating similar images.
The proposed approach focuses on low-frequency colors in any pair of two histograms of the reference and target images. To evaluate histogram similarity, three conditional combinations with respect to high and low frequencies in their respective bins are required. If both of two bins include high frequencies, they may have high similarity. In contrast, if only one of the two bins has a lower frequency, its contribution to the overall similarity may be much lower. The last case where they both have low frequencies has been evaluated as having only a relatively small contribution to the overall similarity; however, it is considered to be of interest in this work. This shows that the two images include the color with low frequencies represented in the bins. In this study, this case was formalized as an effective feature in histogram evaluation. However, we must prevent contamination by additional noise in histograms when designing algorithms, because noise may easily influence such low frequencies. This problem should be one of the subjects in the paper to solve by use of some particular definitions of minor colors.

2.2. Color Space Selection

Many color spaces have been proposed in color management and image processing, e.g., HSV, YUV, and L*a*b*. In this study, the L*a*b* color space [20] was used for ABC because it is a perceptually uniform space, where the color distribution shows a concentrated distribution trend, and the L* channel expresses the lightness. The value of L* channel defines from 0 and 100. The a* and b* channels mean colors from green to red and blue to yellow, respectively. The range of these two channels is −128 to 127. L*a*b* color space is closer to human vision. It can separate the lightness independently. To avoid the effect of illumination, the a* and b* channels without the L* channel are used in this study.

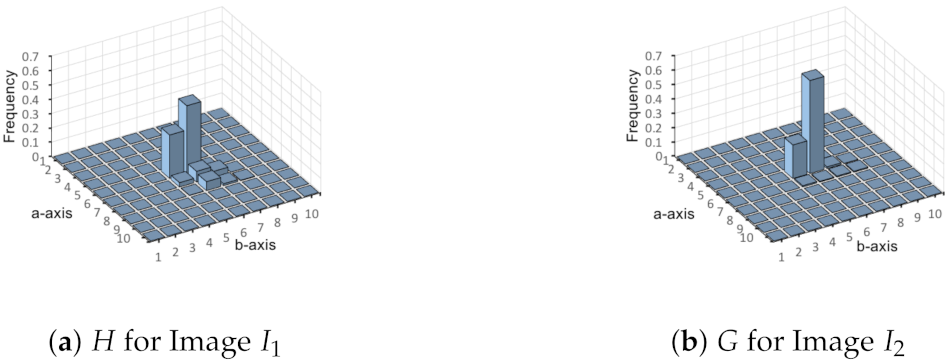
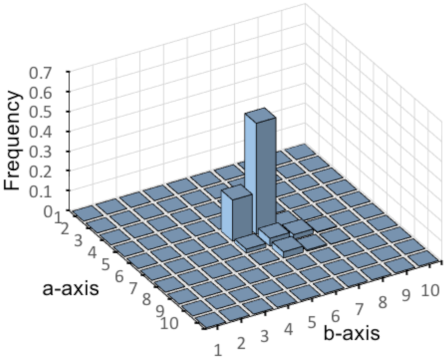
2.3. Apparent and Absent Color Histograms

With reference to the schematic diagram in Figure 2, a detailed mathematical formulation of the proposed procedure is given.
It may be helpful to prepare a kind of nomenclature of definitions for reading the formalization as follows: AP · and AB · show a pair of apparent and absent color histograms before normalization and inverting. AB · ¯ is absent color histogram after inverting, and then · AP and · AB are apparent and absent color histograms after normalization. Assume that each image has N pixels and the color space has β 1 by β 2 bins or quantization. They are represented by two-dimensional color histograms H and G , respectively, as follows [21]:
H = h i j i , j = 1 , 1 , , β 1 , β 2
G = g i j i , j = 1 , 1 , , β 1 , β 2
where h i , j is the frequency in pixels in the bin at position i , j in the color space. Using H as a representative in the following formalization, the relative frequencies are defined as
H = h i j = h i j N i , j = 1 , 1 , , β 1 , β 2
The histogram G is transformed to G in the same manner. Figure 3 shows the relative histograms H and G for images I 1 and I 2 , respectively. An apparent color histogram AP H and another absent color histogram AB H are defined from H as
AP H = AP h i j | AP h i j = h i j > h T
AB H = AB h i j | AB h i j = h i j h T
where h T is an important threshold or parameter for thresholding to decompose the histograms H into two disjoint constituent histograms. The definition of h T is provided in Section 2.4. AP H is an apparent or major color that can be easily observed in images. AB H contains minor colors because their occurrence is not frequent in the image or the proportion of pixels in the image is relatively small. AP H and AB H have the same structure as the two-dimensional histogram H, where their elements AP h i j and AB h i j represent the frequencies of the colors in the i , j bin, respectively. Any other bins without the definitions above-mentioned have zero or null frequencies at this point. To utilize any information included in the low frequencies in any histogram, the decomposition process is introduced systematically and effectively.
Next, after decomposition, the inversion of AB H is necessary to convert each value in it to the complement of the value h T . If AB h i j > 0 for any bin at position ( i , j ) , then the frequencies in the inverted histogram AB H ¯ = AB h ¯ i j is defined as follows:
AB h ¯ i j = h T AB h i j
Through this inversion operation, one can make inverted evaluation in similarity for absent colors as distinguished features. For completion of the inversion, some auxiliary small rules are necessary as follows. If AB h i j = 0 and AP h i j > 0 , then AB h ¯ i j = 0 because the color represented at coordinate ( i , j ) in the color space should be considered as an apparent color, and if AB h i j = 0 and AP h i j = 0 and AB g i j > 0 , then AB h ¯ i j = h T . The last rule imposes a particular condition on the component AB h ¯ i j , for which AB g i j > 0 , i.e., AB h ¯ i j may contain the counter part for comparison when evaluating absent colors as enhanced features. Furthermore, the definition of absent colors is interdependent between the two images for matching comparisons. It is noteworthy that if h i j = g i j = 0 in the original histogram because of no operation on those bins. In the last step, both AP H and AB H ¯ must be normalized to H AP = h i j AP and H AB = h i j AB to satisfy the condition that all the components should sum up to one. Figure 4 shows the apparent color histograms H AP and G AP and absent color histograms H AB and G AB for images I 1 and I 2 , respectively.
The procedure proposed here allows us to make certain balanced histograms for the evaluation of image similarity, and then they are expected as effective features to solve some troublesome problems through enhancement a rather small part of the images.

2.4. Design of Threshold

The threshold h T is one of the main roles in defining the apparent and absent colors. In this section, the approach to define the colors is explained so that meaningful histograms and effective performances can be achieved. Since jittering just around the level must be a trouble for stable signal conversion, an excellent algorithm using averaging histograms has been proposed to solve this problem. The mean color histogram, M, is introduced to obtain an averaged tendency of color distribution in two histograms to be compared and then to realize a stable definition of the threshold. M = m i j i , j = 1 , 1 , , β 1 , β 2 is defined as
m i j = h i j + g i j 2
M is a critical phase before threshold selection. It analyzes the proportion of each component color in the histogram from a statistical perspective to match images. Hence, the rationality and dynamics of the threshold determination are improved, and the accuracy of the final similarity measurement is guaranteed. After creating M, it is converted to another sorted one-dimensional histogram M sorted = m i as follows:
M sorted = m i 1 sorted m i sorted
where i represents the bin’s index in histogram M sorted . The threshold value h T can be defined by the following equation using an order index s related to a significant rate α , by which one can separate the set of all bins into two sets of apparent colors and absent colors in consideration of rare colors in the images.
s = a r g m i n i = 1 s m i sorted 1 α
h T = m s sorted + m s + 1 sorted 2
Compared with a constant threshold, using the parameter s yields a stable decomposition that can be performed without any patterning near the threshold value. Because a zero frequency is important for eliminating noise effects, a removal operation for frequencies close to zero must be applied in the absent color histogram; for example, the bins retained from the original color histogram should be larger than 0.2 × h T in our experiments. Figure 5 shows the mean color histogram M for histograms H and G. Figure 6 is a Pareto chart [22] for this example; the significant rate α represents the effectiveness by revealing the rareness of the absent colors and contributes to the design of the threshold value.

2.5. Histogram Intersection

Histogram intersection [23,24,25] is a popular similarity index used in many studies and applications. It provides the following simple procedure for any two histograms H and G of the same size defined in a given color space.
I H , G = i , j = 1 , 1 β 1 , β 2 m i n h i j , g i j
For the two types of histograms proposed herein, i.e., apparent and absent color histograms, a scheme for combining two intersections is defined by using a weighting coefficient as follows [26]:
S = w I H AP , G AP + ( 1 w ) I H AB , G AB
where 0 < w < 1 .

3. Combination of ABC with CF

The proposed method, ABC, is expected to be robust against ill-conditions, such as rotation, distortion, and scaling [18], while it is not enough in positional precision due to the loss of pixel location information. Some applications require higher sensitivity and positioning accuracy, as well as robustness against adverse conditions. As a trial in this paper, these requirements can be realized by combining ABC and another registration scheme of higher positional precision.
Correlation filter, CF, is an effective scheme for some kind of precise registration based on training and filtering in the Fourier domain [27,28], which can produce sharp peaks in the correlation output and achieve accurate localization of matched images. By training on deformed samples, CF is expected to be less sensitive to deformations of the target image, a property that makes it suitable for use in combination with robust but rough registration schemes, such as ABC.
In this method, an optimal filter is defined by a provided two-dimensional peak-centered Gaussian-like distribution and is obtained through several training processes to get a maximum value in a response map, which indicates the best-matched position. Let a reference image be p in image domain. Subsequently, an output q is calculated to use the model of Gaussian-like profile, where σ = 8 for the reference image of the size 110 × 80, as shown in Figure 7.
The correlation operation with filter u in the image domain was performed via pixel-wise calculations, which is efficiently performed in the frequency domain [29] as follows:
Q = P U
where P, Q, and U are the Fourier transforms of p, q, and u, respectively; symbols “*” and “⊙” indicate the complex conjugate and Hadamard product [30]. To obtain a better filter U, several p i are trained as a training set via the affine transformation of the reference image as shown in Figure 8, and q i as the output was generated to make a two-dimensional peak. This training is a key process for achieving high and stable sensitivity in finding any precise position in spite of the ill conditions. The minimization of the output sum of squared error [31] is utilized.
ε = m i n i P i U Q i 2
where i is the number of samples from one to 60 in our experiment. A closed-form expression of U is obtained as follows:
U = i Q i P i i P i P i
Let an image t be the input to CF from the searched position by pre-processing, ABC, as shown in Figure 9. The optimal filter U is applied to T, the transformed version of t, for making its response map R in the Fourier domain, in which the largest peak indicates any target position.
R = T U
Figure 9 is an overview of the combination of ABC and CF. As shown in the upper left corner of the figure, ABC as the first step for coarse matching gives a searched image t for initial candidate and then CF is performed as the next step, in which the filter u in the upper right corner allows for more accurate registration. The figure shows the profile of the response map r in the upper right and the yellow bounding box shows the best-matched position by use of the image data from Box dataset [32,33].

4. Experiments

Some experiments are performed to demonstrate the performance of our proposed method by comparing it with other approaches. In Section 4.1, four color histogram-based approaches, i.e., CI, CCH, ABC, and ABC-CF, are compared using real-world images. In Section 4.2, not only color histogram-based approaches as comparison, but also template matching approaches are compared for tracking using the open data.
The same set of parameters are used as those of the two-dimensional color histogram, i.e., 10 × 10 bins, α = 0.2 , and w = 0.6 throughout all the experiments for a fair comparison.

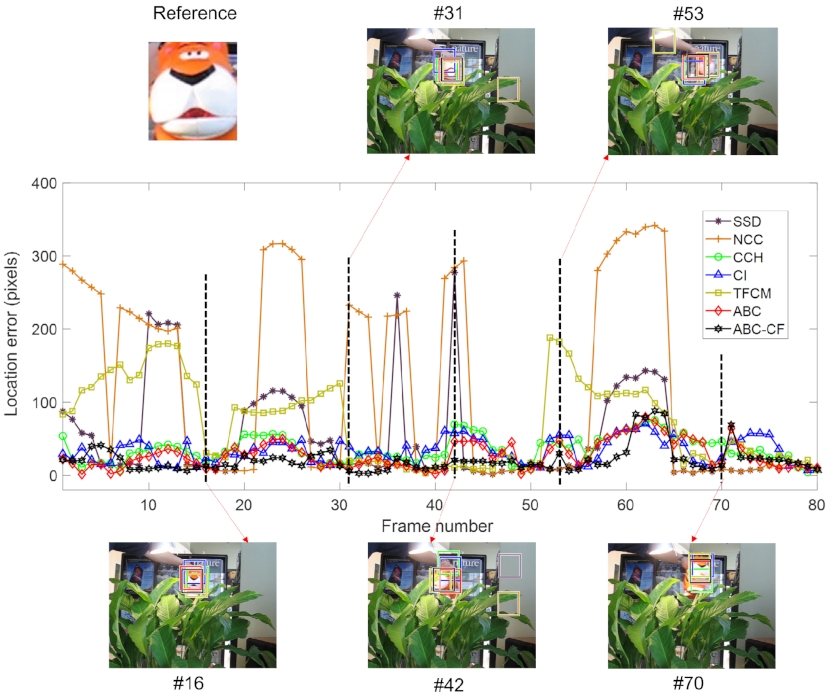
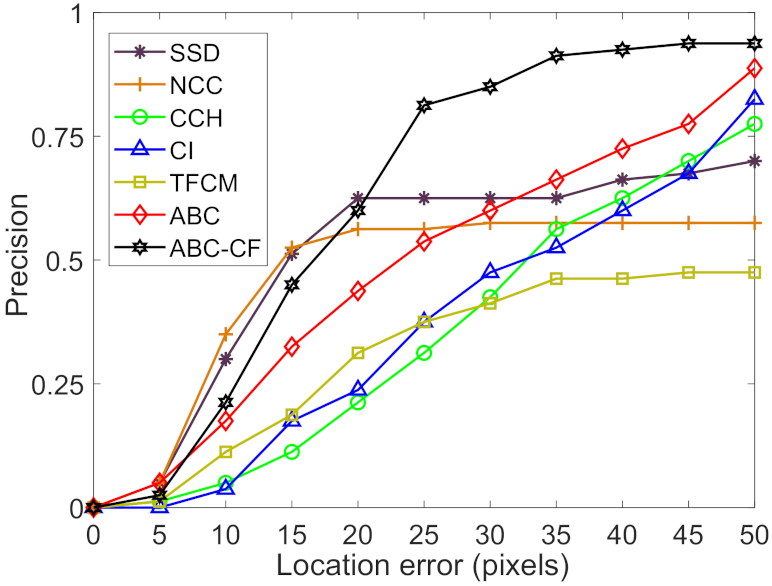
4.1. Experimental Comparison with Color Histogram-Based Methods

Meanwhile, ABC-CF was selected as an improved version of ABC to compare the matching results. In the experiments, different challenges could be tried, such as rotation, deformation, occlusion, scale variation, and illumination variation [34,35,36,37], to prove the merits of ABC and ABC-CF. The results obtained in a scene measuring 360 × 640 are shown in Figure 10. The key feature of ABC is to complete image matching via a color histogram. Therefore, it is compared with some existing color histogram-based methods to evaluate the performance of our approach. Figure 10a shows a reference image measuring 100 × 40 . Figure 10b through Figure 10f show the different challenges to search for the reference position. For the case of rotation, deformation, and occlusion, the methods of ABC, CI, and CCH yielded good performances in the experiments; this demonstrates the advantages of the color histogram-based approaches. In the case of scale variation, the CCH indicated a slight shift, whereas ABC and CI maintained the correct matching position. In the experiment pertaining to illumination variation, only ABC matched with the target, although the matching target position shifted upward slightly. Figure 10g–i show the similarity profiles. The best-matched position is compared with the second-best matched position; ABC demonstrated better discrimination ability compared with the other two methods. It was evident that the margin distance of ABC was larger than those of CI and CCH.
Figure 11 shows the results of ABC and ABC-CF.
ABC-CF, which is the improved version of the original ABC, yielded more accurate searching results and solved the shift problem. GT represents the ground truth for evaluating the performance of the comparison methods. Table 1 shows a comparison of the location error based on different challenges for color histogram-based methods, where the location error was calculated based on the Euclidean distance that used GT to compare with the searched position. In cases involving rotation and deformation, the CCH and CI can search for the best position in the experiments. The ABC matching position exhibited a slight downward shift, and this problem was mitigated using the ABC-CF method. In another three cases, the ABC-CF method proved to be the best method as it yielded the lowest location error.

4.2. ABC-CF in Open Data

To evaluate the performance of our new approach, ABC-CF, with color-histogram- and template-based matching methods, the four histogram-based algorithms are selected, i.e., ABC, CI, CCH, and TFCM and two template-matching algorithms, i.e., SSD and NCC, for comparison using open data. Figure 12 shows a reference image of the 85 × 77 from Tiger1 data in [32], where many frames included various instances with severe ill-conditions such as out-of-plane rotation, occlusion, and scaling in many frames. Pixel-by-pixel scanning is done over the scene using the reference image for all the algorithms. In Figure 12, the horizontal axis represents the number of frames, and the vertical axis represents the location error in the Euclidean distance between their best matched positions and the ground truths. The five frames are extracted as examples to show some details in finding or matching the reference in the scene. For instance, Frame #31 shows the matching result under the conditions of deformation and illumination variation, where ABC, CI, CCH, TFCM and SSD obtained better positions despite being slightly shifted. The ABC-CF method yielded the best matched precision. Similar results were observed in other frames.
The precision plot is shown in Figure 13, in which the horizontal axis shows the upper limit of the location error. For example, the precision value at limit 15 signifies the total rate of frames in which the detected positions do not exceed 15 relative to all the frames. The vertical axis shows the precision in the range of 0 to 1. Because both the template-matching-based algorithms failed to increase their precisions as the limits increased, they might have a clear bound of registration up to a distance of approximately 20 pixels, which is approximately 20% of the reference size in this case. All the histogram-based approaches did not exhibit such characteristics; however, their precision increased gradually, albeit lower than the template-based methods, particularly in the low limits. The ABC method demonstrated the best overall performance among all the methods, as indicated by the following two findings: the higher values around the low limits indicated more precise sensitivity in terms of registration performance, whereas the higher values in the high limits indicated more robustness in identifying the targets.

4.3. Computation Cost

The programs for the experiments were implemented in C++ by using Visual Studio 2015 and the OpenCV 2.4.13 library, without any parallel processing or GPU acceleration. The hardware was a Windows 10 PC with a 2.81 GHz Intel Core i5-8400 CPU and 8 GB RAM. Since the approach proposed in the paper, ABC-CF, is based on pixel-by-pixel calculation in nature, the computation cost is proportional to the number of pixels in the reference images and the target scene. The matching task depicted in Figure 7a and Figure 9 was selected as a typical example to check the computation time requirements. A reference image of 110 × 80 pixels and a scene of 480 × 640 were used in this task, and the computation time was then observed using the OpenCV timing function. Table 2 shows the computation costs for ABC-CF and the other methods. The most efficient methods were SSD and NCC, given their simplicity. Although ABC-CF exhibited a time disadvantage, this is not problematic in practical applications because the computation cost of all histogram-based methods does not differ significantly.

5. Conclusions

A new approach named absent color indexing was proposed for robust pattern retrieval by a novel segmentation of histograms for enhancing colors of low-frequency or no-frequency. Using another particular structure, mean color histogram, the threshold h T can be calculated for stable segmentation of histograms without any jitter. To supplement insufficient precision in registration by the absent color indexing, the correlation filter was combined with it. Experiments on various image data show that the proposed method can achieve better performance in image matching and robust tracking compared to other typical methods.

Author Contributions

All five authors contributed to this work. Methodology, Y.T. and S.K.; writing—original draft preparation, Y.T.; writing—review and editing, S.K. and M.F.; supervision, S.K.; project administration, S.S. and M.I.; resources, S.S., M.I. and M.F. All authors have read and agreed to the published version of the manuscript.

Funding

This research received no external funding.

Institutional Review Board Statement

Not applicable.

Informed Consent Statement

Not applicable.

Data Availability Statement

Not applicable.

Conflicts of Interest

The authors declare no conflict of interest.

References

  1. Wiley, V.; Lucas, T. Computer vision and image processing: A paper review. Int. J. Artif. Intell. Res. 2018, 2, 29–36. [Google Scholar] [CrossRef] [Green Version]
  2. O’Mahony, N.; Campbell, S.; Carvalho, A.; Harapanahalli, S.; Hernandez, G.V.; Krpalkova, L.; Riordan, D.; Walsh, J. Deep learning vs. traditional computer vision. In Science and Information Conference; Springer: Berlin/Heidelberg, Germany, 2019; pp. 128–144. [Google Scholar]
  3. Liu, P.; Guo, J.M.; Chamnongthai, K.; Prasetyo, H. Fusion of color histogram and LBP-based features for texture image retrieval and classification. Inf. Sci. 2017, 390, 95–111. [Google Scholar] [CrossRef]
  4. Zivkovic, Z.; Krose, B. An EM-like algorithm for color-histogram-based object tracking. In Proceedings of the 2004 IEEE Computer Society Conference on Computer Vision and Pattern Recognition, 2004. CVPR 2004, Washington, DC, USA, 27 June–2 July 2004; Volume 1, p. I. [Google Scholar]
  5. Jia, W.; Zhang, H.; He, X.; Wu, Q. A comparison on histogram based image matching methods. In Proceedings of the 2006 IEEE International Conference on Video and Signal Based Surveillance, Sydney, NSW, Australia, 22–24 November 2006; p. 97. [Google Scholar]
  6. Tyagi, V. Content-Based Image Retrieval; Springer: Berlin/Heidelberg, Germany, 2017. [Google Scholar]
  7. Swain, M.J.; Ballard, D.H. Indexing via color histograms. In Active Perception and Robot Vision; Springer: Berlin/Heidelberg, Germany, 1992; pp. 261–273. [Google Scholar]
  8. Stricker, M.A.; Orengo, M. Similarity of color images. In Storage and Retrieval for Image and Video Databases III; International Society for Optics and Photonics: Washington, DC, USA, 1995; Volume 2420, pp. 381–393. [Google Scholar]
  9. Han, J.; Ma, K.K. Fuzzy color histogram and its use in color image retrieval. IEEE Trans. Image Process. 2002, 11, 944–952. [Google Scholar] [CrossRef] [PubMed] [Green Version]
  10. Küçüktunç, O.; Güdükbay, U.; Ulusoy, Ö. Fuzzy color histogram-based video segmentation. Comput. Vis. Image Underst. 2010, 114, 125–134. [Google Scholar] [CrossRef]
  11. Mayathevar, K.; Veluchamy, M.; Subramani, B. Fuzzy color histogram equalization with weighted distribution for image enhancement. Optik 2020, 216, 164927. [Google Scholar] [CrossRef]
  12. Veluchamy, M.; Subramani, B. Fuzzy dissimilarity color histogram equalization for contrast enhancement and color correction. Appl. Soft Comput. 2020, 89, 106077. [Google Scholar] [CrossRef]
  13. Verma, N.K.; Goyal, A.; Chaman, A.; Sevakula, R.K.; Salour, A. Template matching for inventory management using fuzzy color histogram and spatial filters. In Proceedings of the 2015 IEEE 10th Conference on Industrial Electronics and Applications (ICIEA), Auckland, New Zealand, 15–17 June 2015; pp. 317–322. [Google Scholar]
  14. Hisham, M.; Yaakob, S.N.; Raof, R.A.; Nazren, A.A. Template matching using sum of squared difference and normalized cross correlation. In Proceedings of the 2015 IEEE student conference on research and development (SCOReD), Kuala Lumpur, Malaysia, 13–14 December 2015; pp. 100–104. [Google Scholar]
  15. El-Hallaq, M.A. A proposed template image matching algorithm for face recognition. In Proceedings of the 2019 IEEE 7th Palestinian International Conference on Electrical and Computer Engineering (PICECE), Gaza, Palestine, 26–27 March 2019; pp. 1–6. [Google Scholar]
  16. Zhang, H.; Liu, G.; Hao, Z. Robust visual tracking via multi-feature response maps fusion using a collaborative local-global layer visual model. J. Vis. Commun. Image Represent. 2018, 56, 1–14. [Google Scholar] [CrossRef]
  17. Gan, W.; Lee, M.S.; Wu, C.H.; Kuo, C.C.J. Online object tracking via motion-guided convolutional neural network (MGNet). J. Vis. Commun. Image Represent. 2018, 53, 180–191. [Google Scholar] [CrossRef]
  18. Tian, Y.; Kaneko, S.; Sasatani, S.; Itoh, M. Robust Picture Search by Absent Color Indexing. In Proceedings of the Seventh Asia International Symposium on Mechatronics; Springer: Singapore, 2020; pp. 860–866. [Google Scholar]
  19. Tian, Y.; Kaneko, S.; Sasatani, S.; Itoh, M.; Fang, M. Reliable and Accurate Pattern Search by Combination of Absent Color Indexing with Correlation Filter. In Proceedings of the IECON 2019 Forty-fifth Annual Conference of the IEEE Industrial Electronics Society, Lisbon, Portugal, 14–17 October 2019; pp. 5273–5278. [Google Scholar]
  20. Kaur, A.; Kranthi, B. Comparison between YCbCr color space and CIELab color space for skin color segmentation. Int. J. Appl. Inf. Syst. 2012, 3, 30–33. [Google Scholar]
  21. Stricker, M.; Swain, M. The capacity of color histogram indexing. In Proceedings of the IEEE Conference on Computer Vision and Pattern Recognition, Seattle, WA, USA, 21–23 June 1994; Volume 94, pp. 704–708. [Google Scholar]
  22. Wilkinson, L. Revising the Pareto chart. Am. Stat. 2006, 60, 332–334. [Google Scholar] [CrossRef]
  23. Lee, S.; Xin, J.H.; Westland, S. Evaluation of image similarity by histogram intersection. Color Res. Appl. 2005, 30, 265–274. [Google Scholar] [CrossRef]
  24. Grauman, K.; Darrell, T. The pyramid match kernel: Efficient learning with sets of features. J. Mach. Learn. Res. 2007, 8, 725–760. [Google Scholar]
  25. Chen, H.; Xie, K.; Wang, H.; Zhao, C. Scene image classification using locality-constrained linear coding based on histogram intersection. Multimed. Tools Appl. 2018, 77, 4081–4092. [Google Scholar] [CrossRef]
  26. Anderson, N.H. Note on weighted sum and linear operator models. Psychon. Sci. 1964, 1, 189–190. [Google Scholar] [CrossRef] [Green Version]
  27. Bolme, D.S.; Beveridge, J.R.; Draper, B.A.; Lui, Y.M. Visual object tracking using adaptive correlation filters. In Proceedings of the 2010 IEEE Computer Society Conference on Computer Vision and Pattern Recognition, San Francisco, CA, USA, 13–18 June 2010; pp. 2544–2550. [Google Scholar]
  28. Li, Y.; Zhu, J. A scale adaptive kernel correlation filter tracker with feature integration. In European Conference on Computer Vision; Springer: Berlin/Heidelberg, Germany, 2014; pp. 254–265. [Google Scholar]
  29. Mahalanobis, A.; Kumar, B.V.; Song, S.; Sims, S.R.F.; Epperson, J.F. Unconstrained correlation filters. Appl. Opt. 1994, 33, 3751–3759. [Google Scholar] [CrossRef] [PubMed]
  30. Grad, H. Proceedings of Symposia in Applied Mathematics; American Mathematical Society: Providence, RI, USA, 1967; pp. 87–169. [Google Scholar]
  31. Danelljan, M.; Häger, G.; Khan, F.; Felsberg, M. Accurate scale estimation for robust visual tracking. In Proceedings of the British Machine Vision Conference, Nottingham, UK, 1–5 September 2014; BMVA Press: Durham, UK, 2014. [Google Scholar]
  32. Wu, Y.; Lim, J.; Yang, M.H. Online object tracking: A benchmark. In Proceedings of the IEEE Conference on Computer Vision and Pattern Recognition, Portland, OR, USA, 23–28 June 2013; pp. 2411–2418. [Google Scholar]
  33. Wu, Y.; Lim, J.; Yang, M.H. Object tracking benchmark. IEEE Trans. Pattern Anal. Mach. Intell. 2015, 37, 1834–1848. [Google Scholar] [CrossRef] [PubMed] [Green Version]
  34. Li, Z.; Gao, S.; Nai, K. Robust object tracking based on adaptive templates matching via the fusion of multiple features. J. Vis. Commun. Image Represent. 2017, 44, 1–20. [Google Scholar] [CrossRef]
  35. Jia, X. Visual Tracking via Adaptive Structural Local Sparse Appearance Model. In Proceedings of the 2012 IEEE Conference on Computer Vision and Pattern Recognition (CVPR), Providence, RI, USA, 16–21 June 2012; pp. 1822–1829. [Google Scholar]
  36. Korman, S.; Milam, M.; Soatto, S. OATM: Occlusion Aware Template Matching by Consensus Set Maximization. In Proceedings of the IEEE Conference on Computer Vision and Pattern Recognition (CVPR), Salt Lake City, UT, USA, 18–23 June 2018. [Google Scholar]
  37. Yang, H.; Huang, C.; Wang, F.; Song, K.; Zheng, S.; Yin, Z. Large-Scale and Rotation-Invariant Template Matching Using Adaptive Radial Ring Code Histograms. Pattern Recognit. 2019, 91, 345–356. [Google Scholar] [CrossRef]
Figure 1. Two images I 1 and I 2 as example of same size.
Information 12 00428 g001
Figure 2. Methodology of ABC approach.
Information 12 00428 g002
Figure 3. Original color histograms (10 × 10 bins).
Information 12 00428 g003
Figure 4. Example of apparent and absent color histograms.
Information 12 00428 g004
Figure 5. Mean color histogram for H and G.
Information 12 00428 g005
Figure 6. Parameter α and sorted one-dimensional histogram in Pareto chart.
Information 12 00428 g006
Figure 7. Reference image p and output q. (a) Reference p; (b) Output q of model of two-dimensional peak-centered Gaussian-like distribution.
Information 12 00428 g007
Figure 8. Affine transformation for getting reference samples p i .
Information 12 00428 g008
Figure 9. Overview of ABC-CF matching.
Information 12 00428 g009
Figure 10. Matched results in (a) reference image. (bf) show matching results by CI, CCH, ABC, and ABC-CF. Bounding black, red, blue, and green boxes show matching results by ABC-CF, ABC, CI, and CCH, respectively. (gi) show profiles of their similarity in the case of rotation.
Information 12 00428 g010
Figure 11. High precision matching by ABC-CF. Black bounding boxes show ABC-CF matching, while red boxes are ABC results. Yellow boxes are their ground truth (GT). (a) Rotation; (b) Deformation; (c) Occlusion; (d) Scale variation; (e) Illumination variation.
Information 12 00428 g011
Figure 12. Comparison of template- and color-histogram-based methods.
Information 12 00428 g012
Figure 13. Precision plot in T i g e r 1 data.
Information 12 00428 g013
Table 1. Location error comparison with different challenges for color histogram-based approaches.
CICCHABCABC-CF
Rotation3.792.239.193.16
Deformation2.826.099.165.09
Occlusion12.0421.6310.664.46
Scale variation3.4112.163.703.16
Illumination variation190.96164.769.053.60
Table 2. Computation costs for seven methods.
SSDNCCCCHCITFCMABCABC-CF
Computation cost0.024 s0.026 s5.34 s3.83 s5.82 s7.56 s8.05 s
Publisher’s Note: MDPI stays neutral with regard to jurisdictional claims in published maps and institutional affiliations.

