Article

Feeling Uncertain—Effects of a Vibrotactile Belt that Communicates Vehicle Sensor Uncertainty

by
Matti Krüger
1,†,
Tom Driessen
2,†,
Christiane B. Wiebel-Herboth
1,
Joost C. F. de Winter
2,* and
Heiko Wersing
1
1
Honda Research Institute Europe, 63073 Offenbach am Main, Germany
2
Department of Cognitive Robotics, Faculty of Mechanical, Maritime and Materials Engineering, Delft University of Technology, 2628 CD Delft, The Netherlands
*
Author to whom correspondence should be addressed.
These authors contributed equally to this work.
Information 2020, 11(7), 353; https://doi.org/10.3390/info11070353
Submission received: 31 May 2020 / Revised: 29 June 2020 / Accepted: 30 June 2020 / Published: 6 July 2020

Abstract

:
With the rise of partially automated cars, drivers are more and more required to judge the degree of responsibility that can be delegated to vehicle assistant systems. This can be supported by utilizing interfaces that intuitively convey real-time reliabilities of system functions such as environment sensing. We designed a vibrotactile interface that communicates spatiotemporal information about surrounding vehicles and encodes a representation of spatial uncertainty in a novel way. We evaluated this interface in a driving simulator experiment with high and low levels of human and machine confidence respectively caused by simulated degraded vehicle sensor precision and limited human visibility range. Thereby we were interested in whether drivers (i) could perceive and understand the vibrotactile encoding of spatial uncertainty, (ii) would subjectively benefit from the encoded information, (iii) would be disturbed in cases of information redundancy, and (iv) would gain objective safety benefits from the encoded information. To measure subjective understanding and benefit, a custom questionnaire, Van der Laan acceptance ratings and NASA TLX scores were used. To measure the objective benefit, we computed the minimum time-to-contact as a measure of safety and gaze distributions as an indicator for attention guidance. Results indicate that participants were able to understand the encoded uncertainty and spatiotemporal information and purposefully utilized it when needed. The tactile interface provided meaningful support despite sensory restrictions. By encoding spatial uncertainties, it successfully extended the operating range of the assistance system.

1. Introduction

Modern cars are equipped with sensor systems that surpass human perception in various ways. For example, camera systems may offer continuous 360-degree vision and Lidar can provide vision in the dark. Advanced driver assistance systems use these sensor capabilities by providing the driver with supportive information (e.g., lane departure warning, blind-spot detection, navigation) or by taking over control (e.g., adaptive cruise control, automated lane-keeping). However, the reliability of sensory systems may degrade due to changes in the environment. For example, the accuracy of Lidar measurements tends to decrease in the rain [1], and car manufacturers warn about reduced reliability of sensors in tunnels (e.g., Reference [2] (p. 96)). Since drivers cannot be expected to have an understanding of the functioning (or the mere existence) of these sensor systems, they may benefit from the availability of information on sensor reliability. An assistance system could assess such measures of uncertainty by itself, where the level of uncertainty may be based on signal variance or the disagreement between different sensor signals. A system that would share information on sensor uncertainty could help drivers adjust their level of trust in the automation to appropriate levels [3]. This approach is in line with a cooperative automation framework, which challenges designers to regard assistance functions as cooperative partners or team agents, rather than as tools, for example, References [4,5,6,7,8]. Among ten challenges to make automation a team player, Klein et al. [6] (p. 93) listed the team agent’s ability to “make pertinent aspects of their status and intentions obvious to their teammates”. Communicating system uncertainty might be one step in this direction.

1.1. Related Work

Drivers have been found to show safer behavior when being given appropriate supplementary information about the traffic environment (see e.g., References [9,10,11], but also Reference [12] for potential adverse effects). Several studies in the automotive context have further investigated the potential of reliability displays, especially for automated driving. Most attempts to communicate system uncertainty have focused on visual displays [13,14,15,16,17,18]. Variants of such displays include function-specific versus function-unspecific uncertainty encodings or different types of implicit and explicit visualization. Qualitative displays, for example, have illustrated uncertainty through icons, while quantitative displays have incorporated multiple levels or continuous measures of uncertainty using graphs and scales. Beller et al. [13] used an emoji-like icon showing a confused face reaching out with open palms to indicate system uncertainty in a driving simulator experiment. Helldin et al. [15] investigated the impact of visualizing assistance uncertainty on drivers’ trust by displaying a visualization of assistance competence (SAE level 2 [19]) in a driving simulation with varying weather conditions. The amount of machine confidence was displayed by means of seven empty bars that filled up as confidence increased, in a similar way to mobile phone status bars displaying signal quality. Kunze et al. [16] designed an anthropomorphic reliability display for a simulated SAE level 3 automated vehicle. They made a visual display showing a peak from a heartbeat graph that lit up according to a simulated heartbeat frequency between 50 bpm (high reliability) and 140 bpm (low reliability). In addition to the graph, a numeric value of the current machine heart rate was visible.
Uncertainty communication has been shown to be beneficial. Previous work has found improved safety measures [13] and faster take-over times [15,16,20], as well as accompanying changes in gaze behavior [15,16,20]. Furthermore, it was found that drivers showed a more appropriate trust calibration [13,15,18] and gave higher acceptance ratings for such systems [13] compared to baseline conditions. Also, system comprehension [13] and situation awareness [13] were shown to be improved due to uncertainty communication. However, the deployment of the visual modality as a feedback channel has also been subject to criticism. One disadvantage of visual uncertainty communication is that the driver’s visual modality might not be continuously available for input as other activities compete for visual attention. When observing the road or engaging in non-driving tasks, drivers may neglect continuous visual displays [21]. This might become especially problematic in automated driving, where the driver is likely to be engaged in a non-driving task. Thus, the use of visual displays for communicating uncertainty carries the risk of disuse or an increase in perceptual workload [16,20].
Recent studies have investigated the use of touch [22], olfaction [23], as well as peripheral vision to share measures of system uncertainty with the driver. In particular, a driving simulator study by Kunze et al. [22] investigated different variants of vibrotactile feedback in a car seat to communicate increases or decreases in the global uncertainty of an automated vehicle for initiating a takeover by the driver. They showed that encodings of uncertainty increase were more intuitive to users than encodings of uncertainty decrease. Moreover, changes in amplitude and rhythm of the vibrotactile feedback were rated highest. The authors did not investigate the effect of the tactile uncertainty feedback on objective measures and recommended that it should still be examined whether people can make use of the feedback and respond to it appropriately. In another study, Kunze et al. [20] coupled a peripheral awareness display with vibrotactile feedback in order to communicate different levels of global system uncertainty in an automated driving simulator experiment. However, they only used the vibrotactile feedback to communicate the highest level of system uncertainty. Results showed that driver workload was significantly lower compared to a visual display condition that needed focal visual attention for the uncertainty communication to be perceived. In addition, they found that users had a more appropriate attention distribution and showed better take-over performance.
Apart from its potential for reliability communication, vibrotactile interfaces have been identified as promising elements of user interfaces [24] and particularly applicable in the context of driver assistance [25] such as for driving- [26,27,28,29,30] or navigation support [31,32,33,34,35,36,37,38,39]. In addition, also advanced tactile encodings of relevant information such as spatial distances [40,41,42,43,44,45,46], directions [32,47,48,49,50,51,52] and spatio-temporal measures [53,54] have been investigated.
Auspicious reports from these studies let us conclude that vibrotactile feedback is a promising candidate for uncertainty communication in the automotive context and should be investigated in greater detail. To our knowledge, no study so far has investigated tactile communication of system uncertainty relating to individual sensing and signaling about other traffic participants. Here we extend previous research by investigating a previously presented vibrotactile driving assistance system [53,54], augmented with an uncertainty communication functionality.

1.2. Current Study

The main goal of this study is to evaluate driving experience and performance with a driving assistance system that communicates safety-relevant information and additionally conveys its uncertainty about this information. Using a driving simulation environment, we test how the tactile encoding of one dimension of system uncertainty affects the driver’s perception of the system in terms of its usefulness and satisfaction and how it affects perceived workload. In addition, we explore whether such a signal influences measures of driving safety and gaze-based attention.
We extend a vibrotactile driving assistance interface that has been shown before to successfully support a driver in gaining a better understanding of the environment through sensory augmentation [53,54]. The tactile assistance provides two types of information—temporal distances and the directions of objects that are on a collision trajectory with the ego-vehicle. The extension introduced here consists of further encoding uncertainty in the tactile stimuli about the directions of objects that are directly approaching. We refer to this uncertainty as directional or spatial uncertainty. Because the underlying assistance system provides information about both direction and temporal distance, also temporal uncertainty, that is, uncertainty about temporal distances can exist. This dimension of uncertainty is not investigated here and the system is marginalized to have full temporal certainty in this study.
We expect that the effect of directional uncertainty communication will be moderated by the driver’s own certainty about the directions of potential collision objects. More specifically, we propose the following hypotheses:
Hypotheses 1 (H1).
Understanding. Drivers perceive and understand directional uncertainty encoded in tactile stimuli which communicate spatiotemporal distances of approaching vehicles.
Hypotheses 2 (H2).
Subjective Benefit. Drivers utilize complementary uncertainty information in tactile stimuli for their subjective benefit.
Hypotheses 3 (H3).
Disturbance. Drivers are not disturbed by receiving redundant uncertainty information.
Hypotheses 4 (H4).
Safety. Signaling complementary uncertainty information leads to higher objective safety.
We here understand subjective benefit as a term that subsumes impressions of usefulness, satisfaction and reduced workload and objective safety as an expression of safety derived from driving data such as the the smallest predicted time-to-contact to any vehicle that is on a collision trajectory with the ego-vehicle (i.e., the minimal time-to-contact, see Section 2.3 and Section 2.5.5.4). Complementary uncertainty information is here defined as information that augments uncertain human perception. Redundant uncertainty information is defined as information that is already fully covered by more certain human perception. Disturbance should be understood as the opposite of benefit and would be expressed in lower scores on the subjective measures and lower performance on the objective measures. For this study, we created conditions that enable us to induce both machine and human sensory uncertainty and thereby determine how complementary or how redundant the encoded uncertainty information becomes.

2. Materials and Methods

2.1. Participants

Fourteen drivers (1 female) between 21 and 41 years old (M = 29.1, S D = 5.4) participated in the study. All participants reported that they had (corrected-to) normal vision and held a valid driving license for an average of 11 years. All participants gave their written informed consent before taking part in the study.

2.2. Experimental Setup
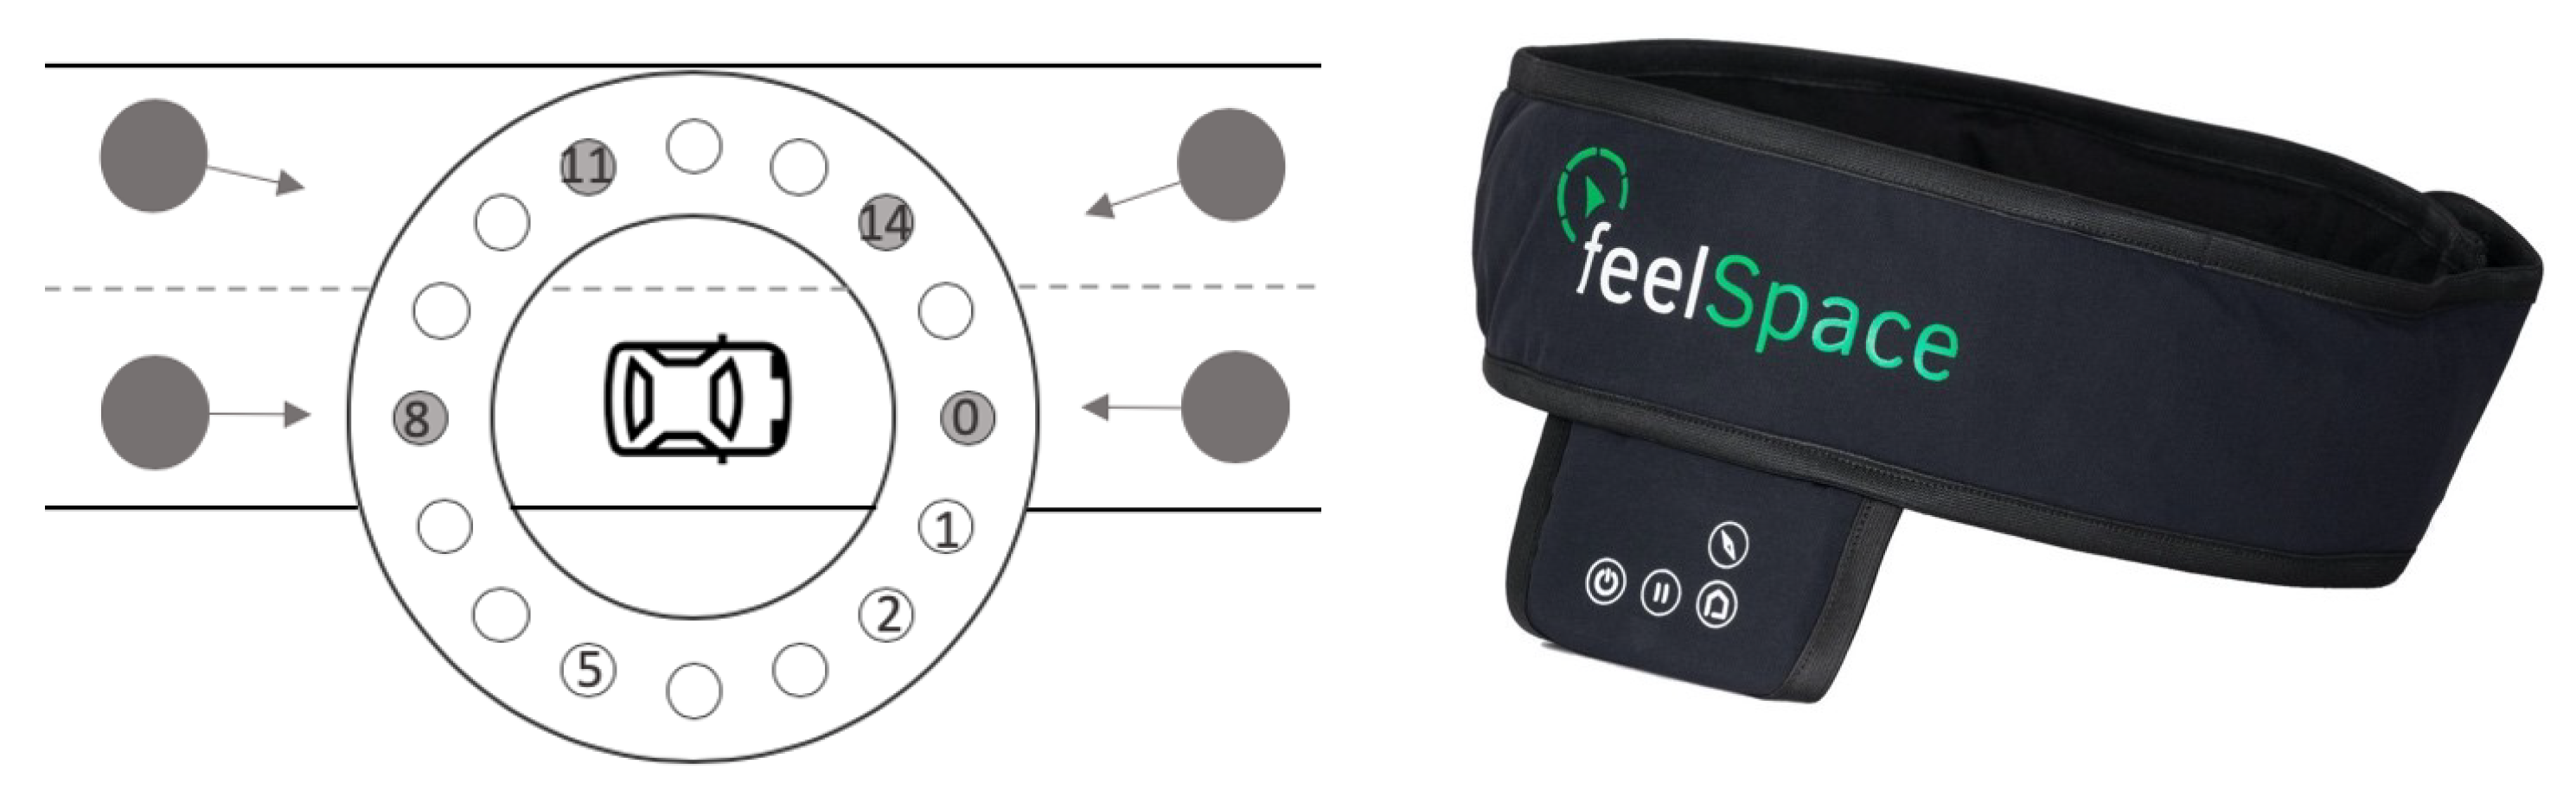
The experiment was conducted in a static driving simulator (Figure 1) with controls for steering, braking, and accelerating. Gear-shifting/transmission was set to automatic mode. Three display panels (50 inch diagonal, 1080p each, 60 Hz) presented the driving scenario and the remaining parts of the interior (dashboard, instrument cluster, mirrors), using the SILAB 5.1 driving simulation software developed by the WIVW GmbH (Würzburg Institute for Traffic Sciences, Germany). Participants wore a 120 Hz monocular eye-tracker (Pupil Labs GmbH [55]). In addition, participants wore a waist belt (feelSpace GmbH [56]) containing 16 equally spaced vibromotors (between 4.9 and 7.5 cm depending on the size of the belt). In particular, the belt contains eccentric rotation mass motors that can have a maximum amplitude of 2.2 g and a frequency spectrum of 50–240 Hz (0.45–3.3 V) triggered with a 50 ms latency. Frequency and amplitude were set to scale approximately linearly with voltage. Four belt sizes were used in the experiment to ensure a good fit for all participants. The firmware of the belt interface was customized for the experiment.

2.3. Stimuli

The tactile communication was implemented with a signaling mode similar to the interface used in the experiments by Krüger et al. [53,54]. Two information dimensions about approaching objects were encoded in the tactile stimuli. First, the direction of approaching objects relative to the ego-vehicle was encoded in a mapping of stimulus location on the belt. That is, stimulus location signaled from which lane(s) and lane segments (i.e., center front/back, left front/back, right front/back) vehicles were approaching by activating pre-defined vibromotors that were corresponding to the direction of the lane and segment. In previous studies [53,54], we have found a circular arrangement of actuators, as provided by the feelSpace belt, to be suitable for intuitive signaling of direction information. Nevertheless, other arrangements may also be suitable and could be preferred when working with specific design constraints. Six out of the 16 vibromotors were chosen to realize such mapping (Figure 2). The vibromotors for directional lane encoding were distributed according to the schematic shown in Figure 2. Thereby we chose to set distances between dorsal actuators to be larger than those for the front direction due to differences in spatial discriminability between dorsal and ventral regions [47,57]. A similar direction encoding with eight actuators but no varied treatment of ventral and dorsal regions has, for instance, been successfully employed before by Van Erp et al. [32].
Second, the temporal proximity to the approaching object was encoded in the stimulus intensity. We defined the temporal proximity as the complement of the time to collision (TTC) towards a surrounding object that is on a collision track with the ego-vehicle within a fixed temporal range. Assuming that an object b is moving behind an object a along the same path and trajectory with velocities V a and V b and a and b are distance D a b apart, the TTC between a and b is given by:
T T C = D a b V b V a , if V b > V a , otherwise .
For the left and right lanes, we simplified TTC computation by calculating the L 2 norm of a vector consisting of the respective hypothetical (i.e., assuming already being on the respective lane) longitudinal TTC ( T T C L o n g ) and the time to lane crossing ( T L C ) for the respective lane according to Equation (2). The TLC is derived as a TTC that is based on the lateral velocity relative to the lane and the distance to the lane boundary.
T T C L / R = T T C L o n g 2 + T L C L / R 2 1 2 .
The TTC defines the time it would take until a collision occurred if two objects maintained their current velocities and direction of travel. In the present experiment, we decided to make the stimulus intensity correspond to the complement of the TTC for a temporal range between zero and nine seconds. Stimulus onset occurred whenever the TTC between the ego-vehicle and a surrounding object dropped below a threshold ( θ ) of nine seconds. This value was chosen as a compromise between the goal of maximizing the range of intensity coding and the need to keep stimuli in a range that can still be perceived by the participants as relevant. Stimulus intensity at onset was set to the smallest perceivable intensity identified by the experimenter, and increased linearly as the TTC dropped. If the TTC was zero (a collision), stimulus intensity reached its maximum, which was equal to the maximum intensity provided by tactile interface. Accordingly, close temporal proximities were signaled with more intense vibration and vice versa.
Intensity = m a x θ T T C θ , 0 .
The tactile interface can give exact signals about the location and temporal proximity of an approaching object as long as the vehicle has precise knowledge about the location and velocity of this object. We refer to this signal as the precise signal, which served as a baseline.

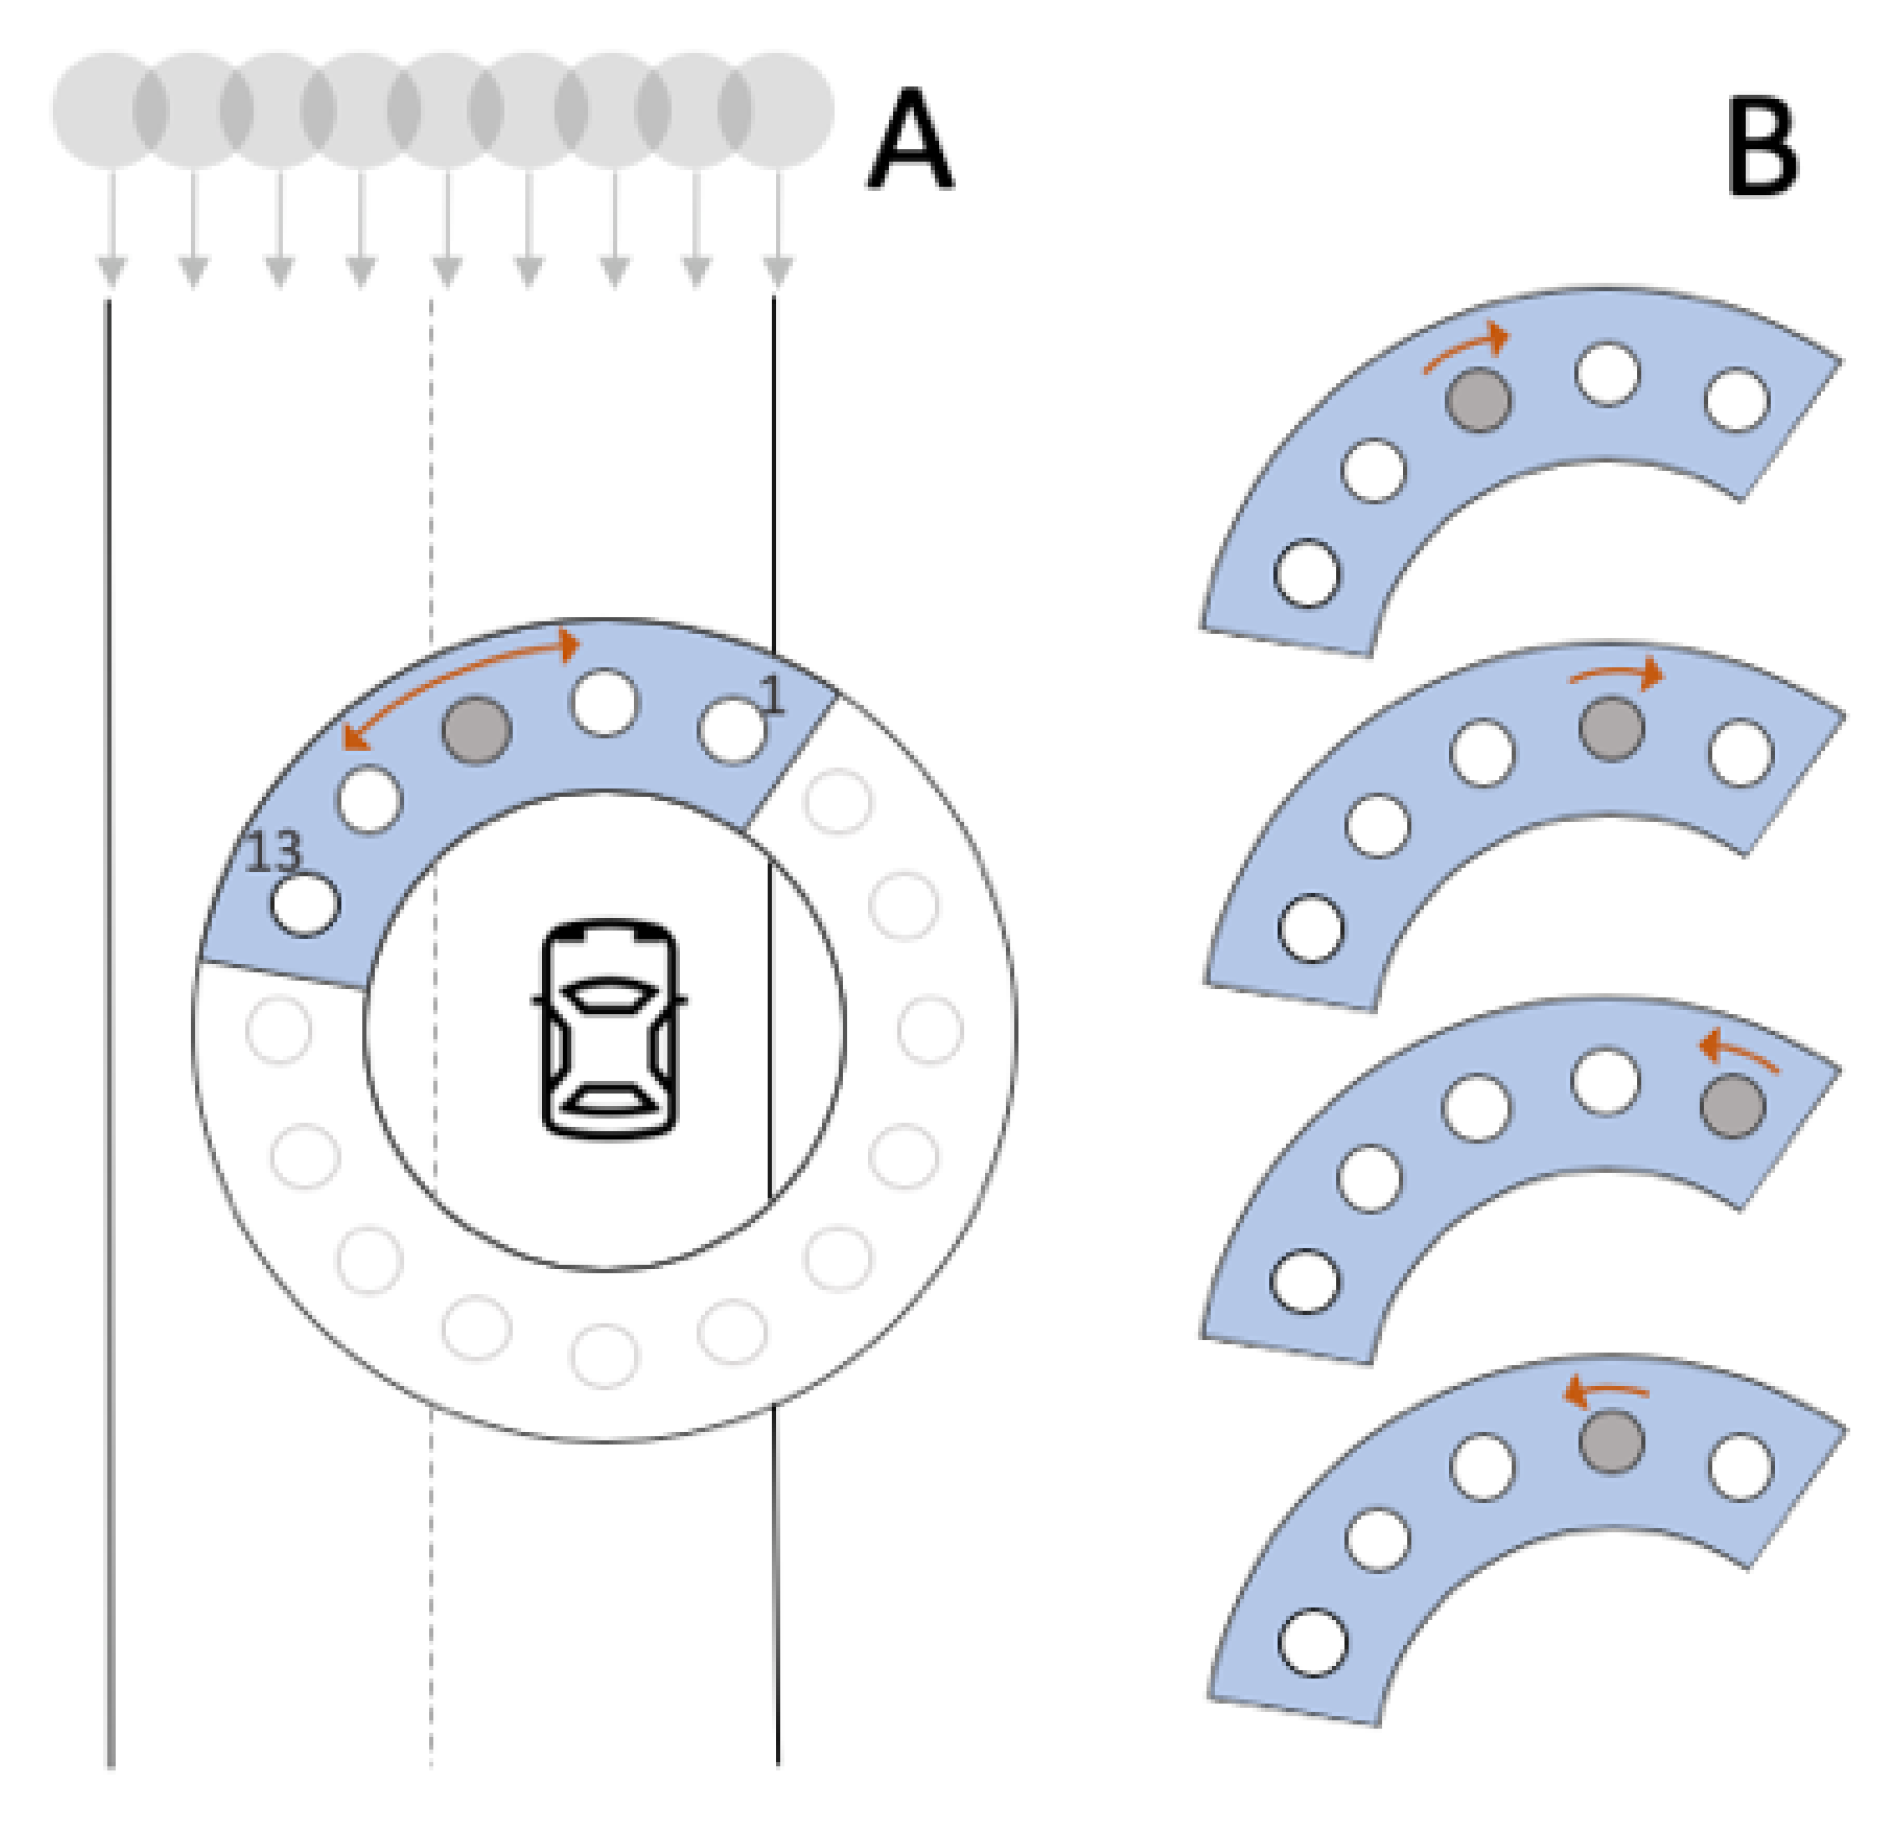
2.3.1. Uncertainty Communication

In addition to the precise signal, a second signaling mode was realized to communicate the machine’s uncertainty about an exact object direction to the user. We refer to this signal as the uncertainty communication. For the uncertainty communication, the encoding of temporal proximity was identical to the precise signal; only the location encoding was varied. The rationale behind the uncertainty communication was that, due to the environmental changes, the vehicle’s sensory system may be unable to measure precise object locations (the exact lane), but could still signal the presence of an approaching object from either front or back, without specifying the ego- or a neighboring lane. In order to convey this information to the user, the direction of approach for a vehicle was no longer signaled by one unique stimulus location, but through a dynamic vibration pattern traveling over a specific range that represented the overlap between the two lanes on which a vehicle might appear. Upon stimulus onset, neighboring vibromotors were successively activated in the clock- or counter-clockwise direction, creating a tactile illusion of apparent motion [24]. The initial vibromotor position and direction was chosen randomly from the available vibromotors within the respective uncertainty range.
Figure 3A shows a schematic of the uncertainty signal. The stimulus development is illustrated by the pointer oscillating between the two borders with a constant frequency (1.0 Hz, from start-to-start point). The next vibromotor activated at the same instance that its predecessor switched off (Figure 3B). The pointer continued to bounce between these borders until either one of two events occured: (1) the TTC became greater than nine seconds, in which case the signal disappeared, or (2) a reliable estimate of the current lane of the approaching vehicle became available. In the latter case, the width of the range converged to one, conveying the same unique direction as in the precise signal condition. We also experimented with other representations of uncertainty, such as synchronously activating multiple actuators in the uncertainty range. However, such variants which employ co-activation of nearby actuators can produce side effects like the funneling illusion [58] and a perceived stimulus intensity increase [59]. Because such effects would interfere with the encoding of information in stimulus direction and intensity, we favored the described method of sequential activation.

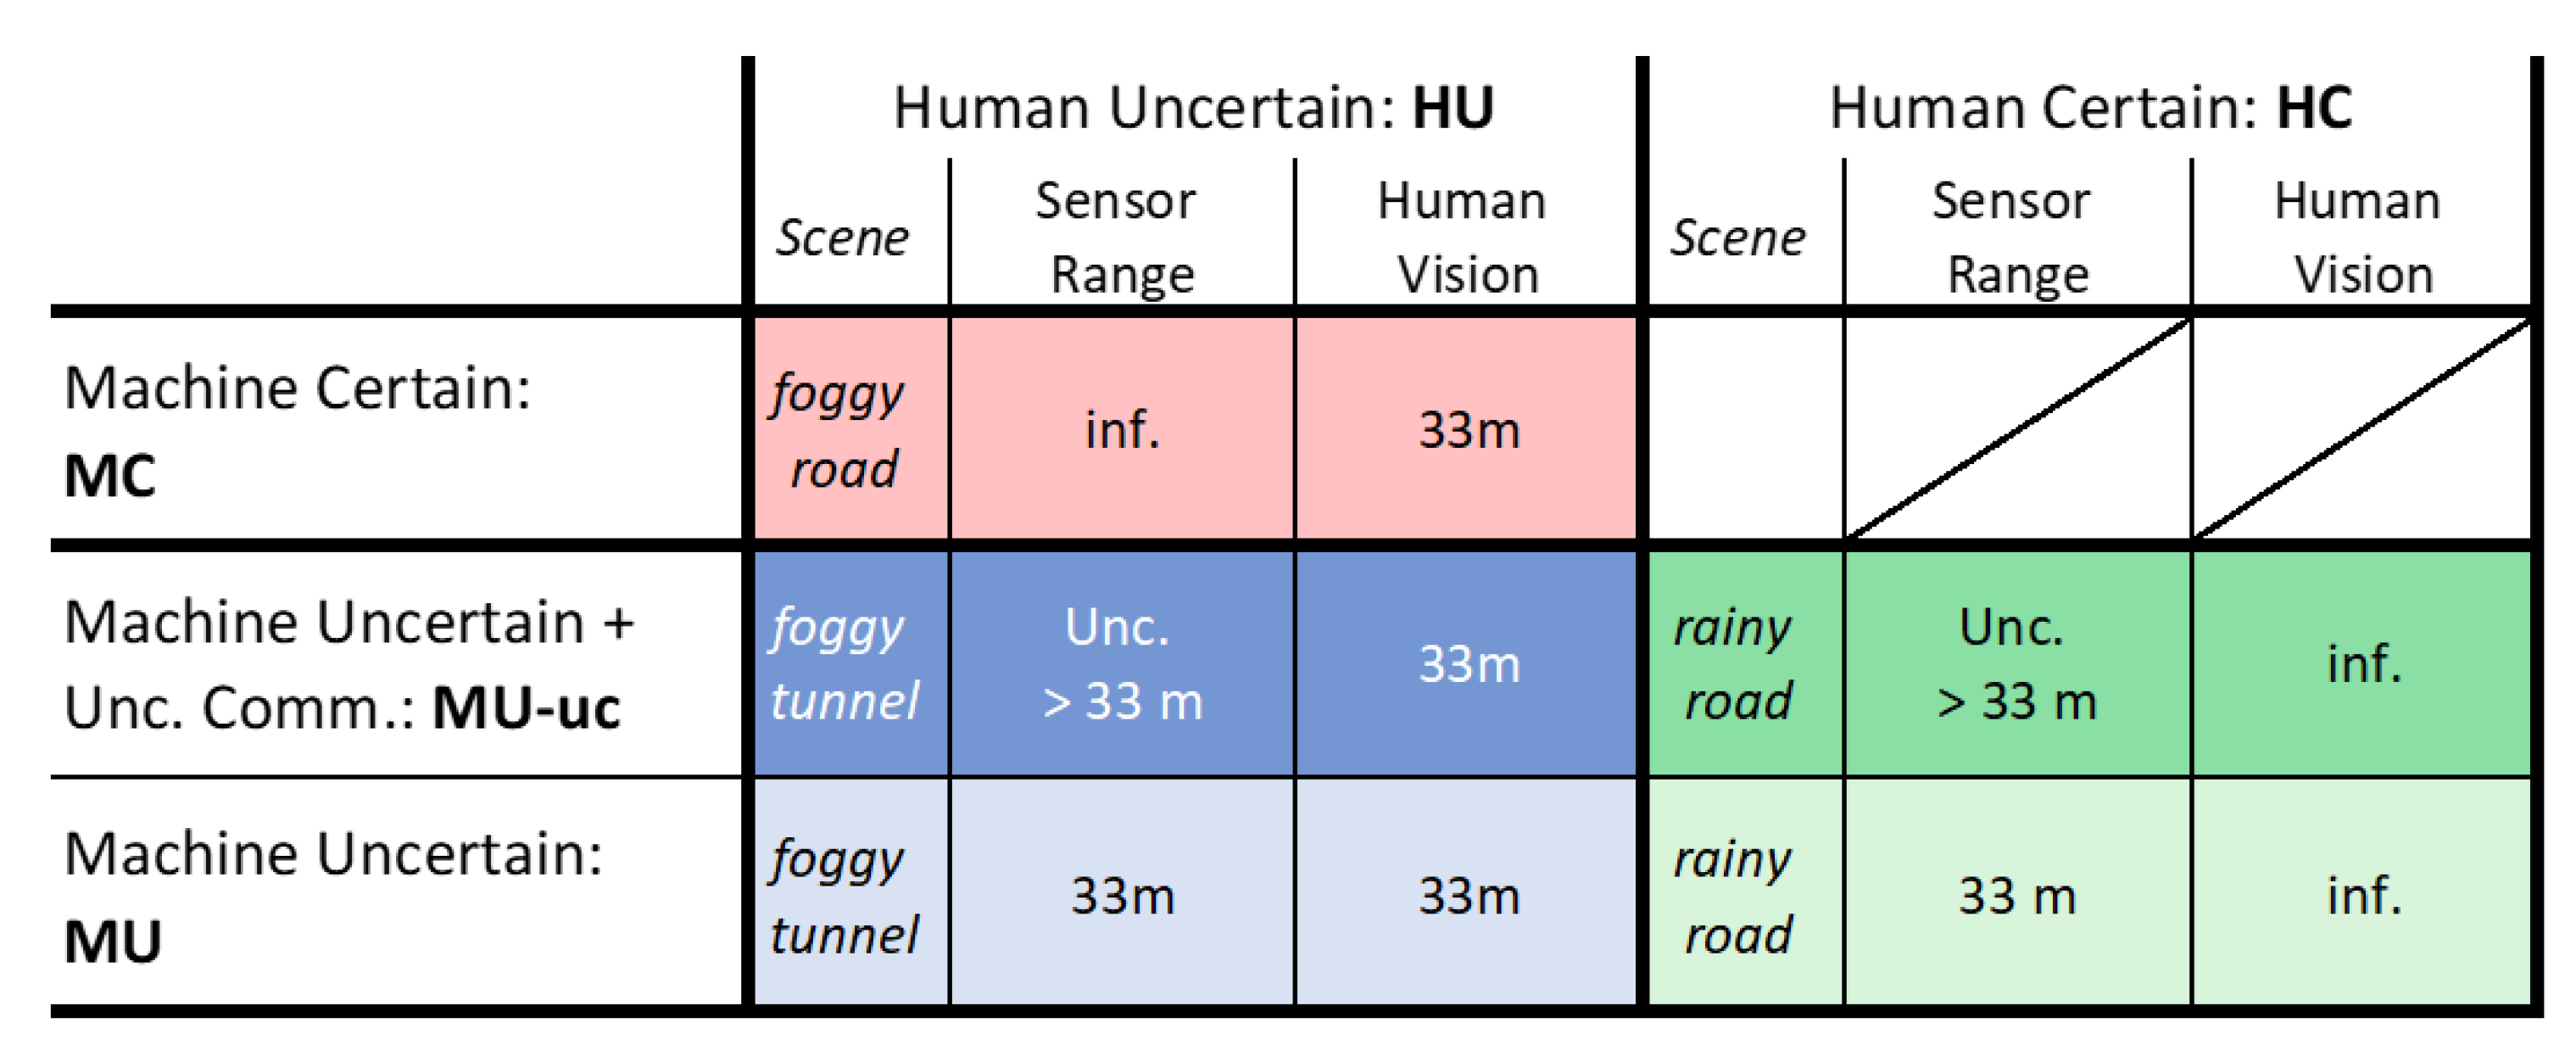
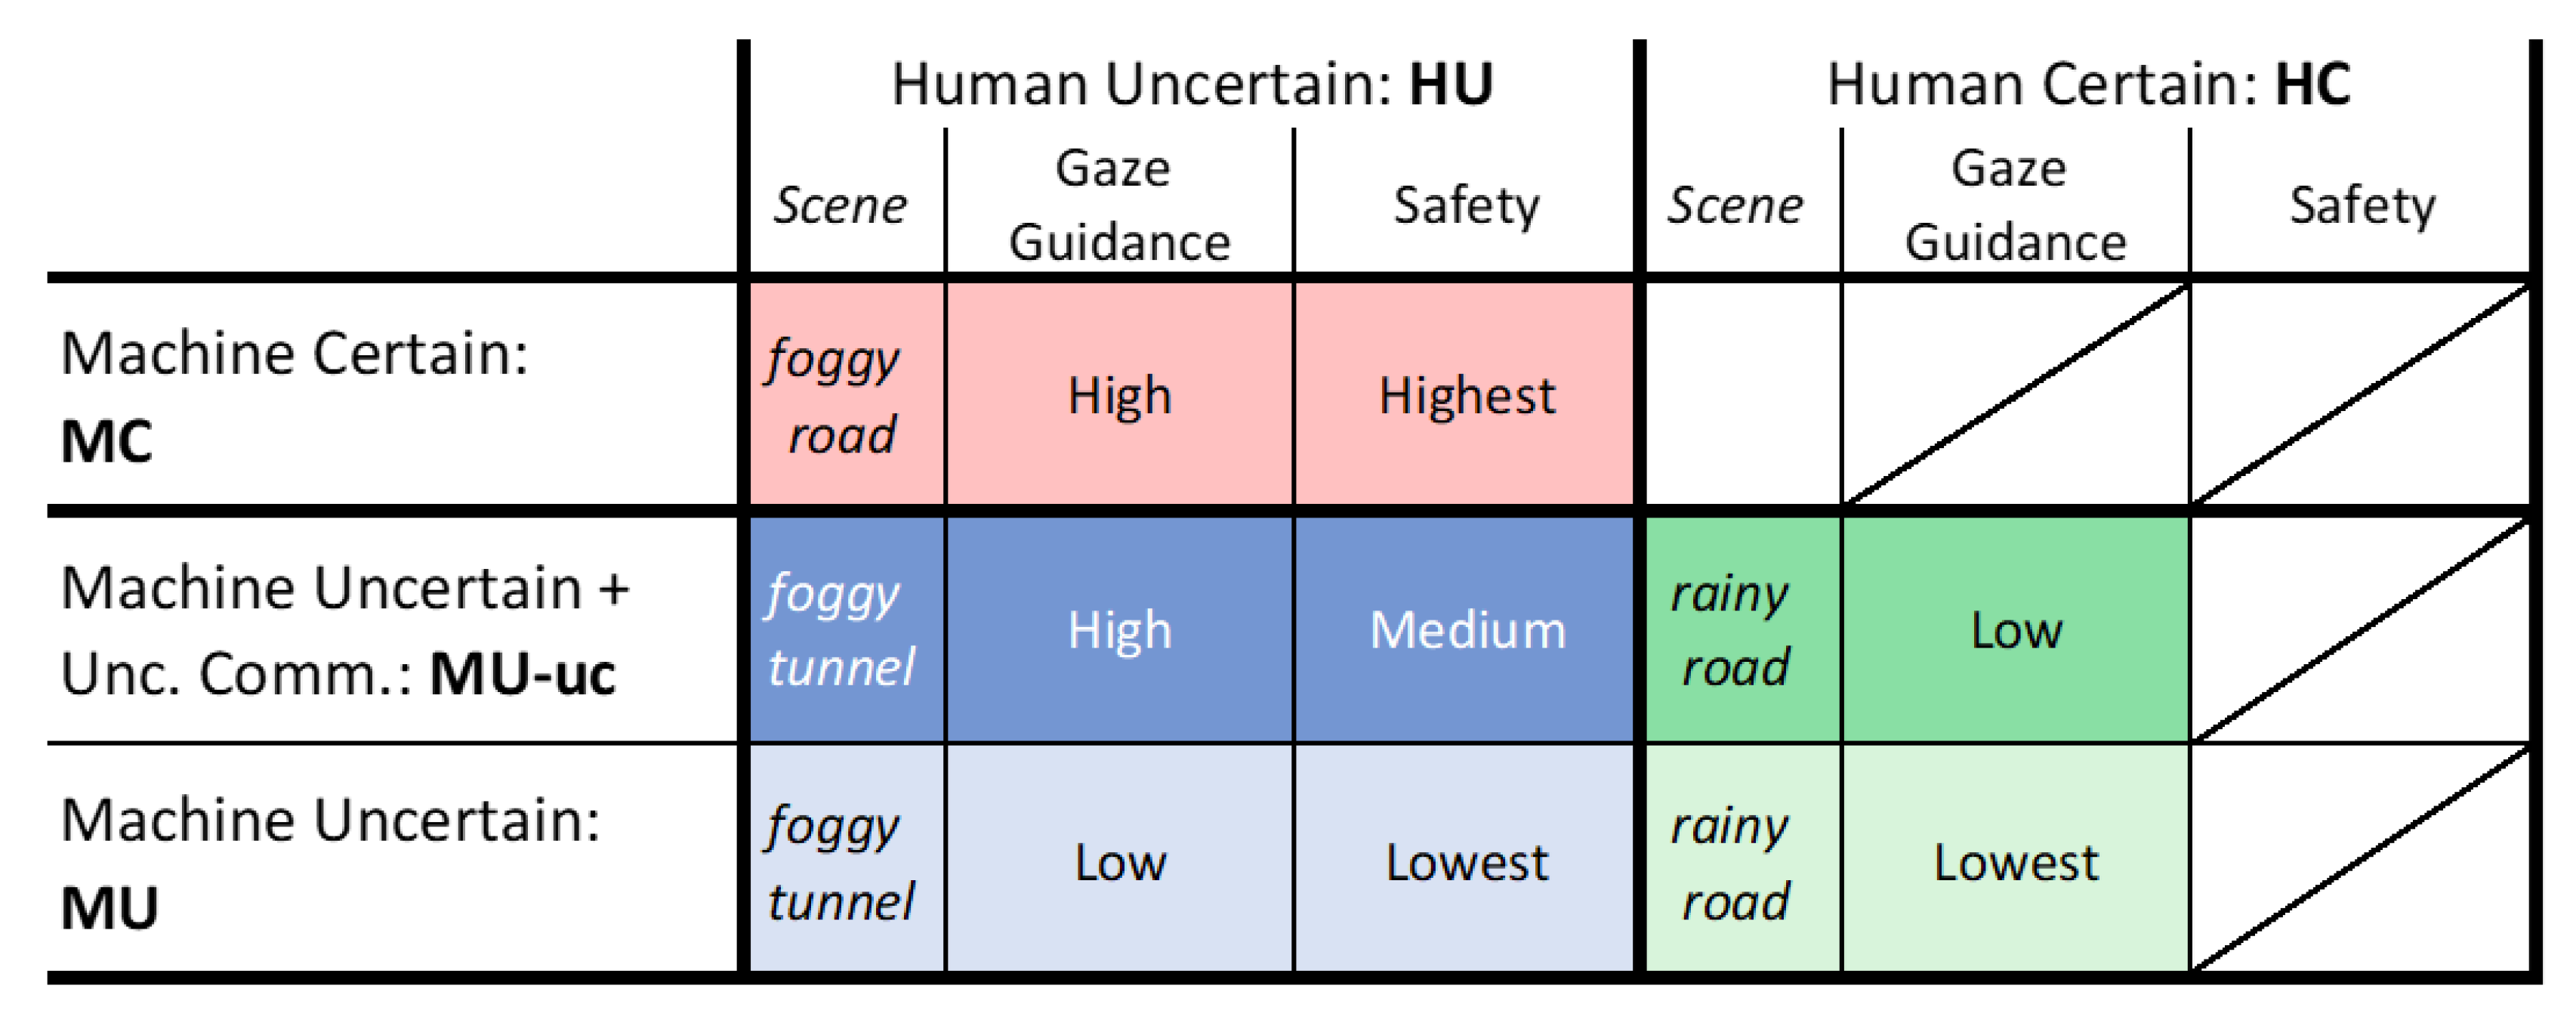
2.4. Experimental Design

Independent Variables

Two factors were systematically varied in the experiment in order to evaluate the proposed uncertainty communication system. First, we varied the availability of uncertainty communication (on vs. off). Second, we varied the perceptual uncertainty in the different scenarios between human and machine (machine certain-human uncertain (MC-HU), machine uncertain-human certain (MU-HC), both uncertain (MU-HU)). The uncertainty manipulation was realized through contextual conditions in the driving scenarios that aimed at independently modulating the uncertainty of the vehicle’s observations and the uncertainty of the human’s observations. Machine uncertainty was introduced by means of driving through (a) a foggy tunnel and (b) rain. Both situations would decrease sensor reliability and increase machine uncertainty. Human uncertainty was provoked by driving through (a) a foggy tunnel and (b) a foggy road. The foggy tunnel thus served as the joint uncertainty condition, in which both the human and the machine suffered from limited sensory input. Since the goal of this study was to examine the effects of uncertainty communication in human-machine cooperation, we decided to omit a condition in which both the human and the machine would be certain. In the foggy road scenario, the machine had an accurate estimate of the position of vehicles at any distance away from it, and it could always communicate the precise signal. Therefore, uncertainty communication (uc) was only available in the foggy tunnel and rain scenarios. Participants drove through these scenarios twice: once without (MU-HU, MU-HC) and once with the uncertainty communication functionality enabled (MU-HU-uc, MU-HC-uc). In case the uncertainty communication was disabled, the vibrotactile interface provided a precise signal only as soon as the approaching car entered a visible range (see Section 2.5 for details). In case the uncertainty communication was enabled, the vibrotactile interface communicated the uncertain signal whenever the defined threshold of a TTC lower than nine seconds to an approaching object was reached. This resulted in a total amount of five experimental conditions, the characteristics of which are summarized in Figure 4.

2.5. Procedure

The study was structured into five experimental and two familiarization blocks. The two familiarization blocks had the purpose of introducing the participants to the driving simulator and the tactile interface. The first familiarization procedure was carried out according to guidelines specified by Hoffmann and Buld [60]. This procedure aimed at reducing the probability of causing simulator sickness by gradually increasing exposure to virtual accelerations. The second familiarization scenario allowed the driver to explore the direction and temporal proximity encoding provided by the tactile interface in a scenario where the machine was certain (precise signal). In the five experimental blocks, the participant’s task was to maintain a speed of 120 km/h where possible and avoid collisions with other vehicles. All scenarios consisted of a straight two-lane highway. To rule out potential learning effects, the order in which experimental conditions were conducted varied between participants. Half of the participants started with the two uncertainty communication conditions and half without. Foggy scenarios and rain scenarios were alternated. Before the uncertainty communication conditions, participants were verbally instructed by the experimenter about the machine limitations as follows—“In this section, you will drive through rain/a tunnel. Therefore, the vehicle is less certain about the locations of vehicles that are further away”. The following sections further detail the design of the scenarios. Conceptually each scenario followed the same structure: To maintain an objective speed of 120 km/h the driver had to detect and overtake slower cars on the left or right lane from the front, and avoid faster cars that approached at 160 km/h from the rear, possibly changing lanes for overtaking.

2.5.1. Familiarization—System Exploration Scenario

The scenario consisted of a two-lane highway on a sunny day. Participants were not informed about the functionality of the tactile interface and were asked to maintain a speed of 120 km/h where possible. Since vehicles on the passing lane were designed to drive faster than the target speed, the task was most easily fulfilled by driving on the rightmost lane. However, vehicles on the right lane that were trailed by the ego-vehicle would occasionally slow down, forcing the participant to either overtake via the left lane or brake to avoid a collision. These instances ensured that the time to collision between the ego-vehicle and its surrounding vehicles dropped below the threshold value of nine seconds, causing exposure to the tactile stimuli (the precise signal). After five minutes of driving, participants were asked to park their car on the emergency lane, and the system exploration scenario was stopped. Participants were then asked what they thought the tactile stimuli communicated, and they were informed about the true nature of the assistance function. This scenario was similar to the experimental scenario by Krüger et al. [53,54], who found that participants were able to develop an intuitive understanding of the stimuli within four minutes of system exposure. Similarly rapid user understanding times for directional tactile displays were described by Cassinelli et al. [40] and Hogema et al. [61].

2.5.2. Experimental Block-Foggy Road: Machine Certain, Human Uncertain (MC-HU)

The foggy road scenario was simulated as a night-time scenario, designed to make the human uncertain by inserting a dense fog field and disabled lights of surrounding traffic. The fog was parameterized to limit the look-ahead distance to about 33 m (Figure 5), corresponding to a look-ahead time of about one second assuming the driver drove at the target speed. A temporal distance of one second has been suggested as the threshold below which a driving situation can be considered critical [62,63]. We assumed that this look-ahead distance would induce uncertainty in drivers, as they would need to be continuously prepared for the occurrence of a critical situation.
Machine observations were not affected by the mist or darkness, so a precise signal was communicated for vehicles driving at any distance away from the ego-vehicle. The experimenter triggered the onset of a target vehicle approaching the ego-vehicle according to a fixed script. This approach allowed for an easy verification that participants were driving at the approximate target speed, which was a prerequisite for the correct situation development. When a command was given, the target vehicle started approaching behind the fog barrier from one of the four possible lane directions (front, front-left, rear, rear-left). Vehicles coming from the rear were driving at a speed of 160 km/h. Vehicles in the front were driving at 80 km/h. As a consequence, the target vehicle would overtake (or be overtaken by) the ego-vehicle, assuming that the participant kept driving around the target speed of 120 km/h. Vehicles that approached from the rear on the right lane were programmed to change lanes and overtake the ego-vehicle at a distance of 30 m. After the target vehicle had passed and disappeared into the fog again, and the experimenter confirmed that the participant was driving at the target speed, the next target vehicle was launched. This procedure was carried out 14 times. Directions from which cars approached were pseudo-randomized.

2.5.3. Experimental Block-Foggy Tunnel: Machine and Human Uncertain (MU-HU)

The foggy tunnel scenario was identical to the foggy road (MC-HU) scenario, except for the addition of a tunnel that ran for the entire course and a change in sensor reliability such that vehicles outside a 33 m radius from the ego-vehicle could at most be signaled via uncertainty communication as described in Section 2.3.1. Limitations of the look-ahead distance were the same as in the foggy road condition (33 m, 1 s) for the human. For comparability reasons, traffic definitions were identical to the foggy road scenario (MC-HU).

2.5.4. Experimental Block-Rain: Machine Uncertain, Human Certain (MU-HC)

The rain scenario consisted of a straight road on a rainy day. The rain was visually present, though at an intensity at which it did not have much influence on the driver’s visual perception. The reliability of the machine was said to be negatively affected by the rain, in the same manner as it was in the foggy tunnel scenario. That is, the look-ahead distance of the machine for precise direction identification and signaling was limited to 33 m. Because the driver’s field of view was not obstructed, the traffic setup had to be organized in a different way compared to the fog conditions. The altered traffic profile for the rain scenario is explained in Figure 6.

2.5.5. Dependent Measures

As dependent variables, we recorded subjective measures concerning the usefulness, satisfaction and perceived workload in the different experimental conditions, as well as the overall understanding and experience. In addition, we were interested in objective measures which express effects on peoples’ gazing behavior and their performance in a driving task.
We used three questionnaires for the subjective evaluation. These were used to gain insights into the subjective experiences which the different experimental conditions induced and see whether the conditions were correctly perceived and understood.

2.5.5.1. Task Load, Usefulness, Satisfaction

After each experimental condition, the NASA Task Load Index (Raw-TLX, [64]) assessment was conducted. Usefulness and satisfaction ratings were obtained using the Van der Laan acceptance scale [65].

2.5.5.2. Understanding and Experience

Furthermore, after every experimental block, participants were asked to rate a number of statements on a 5-point Likert scale (strongly disagree to strongly agree). These statements were included to check if (a) the modulation of human perceptual confidence through environmental factors was successful, (b) the participants had understood the machine’s level of uncertainty, and (c) participants experienced that the machine expressed its level of uncertainty.

2.5.5.3. Gaze Distributions

The front gaze ratio was computed as the ratio of the number of gaze points in the front window versus the total amount of gaze points in the mirrors and windshield (Equation (4)). A higher front gaze ratio indicates that the driver allocated more attention towards the front; a lower front gaze ratio indicates that the user allocated more attention towards the rear. By means of this measure, we aimed at evaluating whether the uncertainty communication caused shifts in visual attention towards the direction of the presented signal.
front gaze ratio = gaze count on windshield gaze count on windshield + mirrors .

2.5.5.4. Trial Safety

Trial safety was operationalized as the Minimum Time-to-Contact (MTTC) recorded in each trial in any direction. The MTTC can be understood as a conservative measure of safety that only takes into account the smallest recorded TTC and thus indicates how dangerous a trial became at the most (see e.g., References [20,54]).

2.5.5.5. Trial Definition

We restricted the analysis of gaze distributions and safety to specific periods of interest which we refer to as trials. A trial occurred for every vehicle that overtook or was overtaken by the ego vehicle. The starting point of a trial was set to the moment where time to passing (TTP) of a surrounding vehicle dropped below nine seconds. Here, we defined the TTP as the time it would take until two vehicles would pass each other if they would maintain their current velocities. The TTP can be understood as a TTC (see Equation (1)) without the requirement for being on a collision trajectory. We set the end point of a trial to the moment at which the ego-vehicle and the other vehicle passed each other.

2.6. Analysis

We split the analysis of the data into three parts—(1) custom questionnaire data, (2) subjective data on perceived workload as well as on perceived system acceptance in terms of usefulness and satisfaction, and (3) objective behavioral and performance data, including gaze distribution results and measures of trial safety. To rule out potential confounds, we only ran statistical tests between experimental conditions that shared the same traffic profiles. While the differences in traffic profiles prevented comparisons between fog and rain conditions, this design choice did not impair the investigation of our research hypotheses. It allowed us to prioritize internal validity through the implementation of scenarios that contained credible sources of uncertainty for each environmental condition.
Statistical analysis was carried out using the scipy python library. Plots were generated using the python packages matplotlib and seaborn.

2.6.1. Custom Questionnaire Data—H1 (Understanding)

Custom questionnaire data for all conditions were analyzed descriptively based on median responses and interquartile ranges. According to H1, we expected participants to indicate understanding of the uncertainty encoding stimuli.

2.6.2. Acceptance and Workload—H2 (Subjective Benefit) and H3 (Disturbance)

Usefulness and satisfaction scores were obtained by mapping subsets of Van Der Laan Questionnaire responses to two respective scales in the [−2, 2] range (see [65]). Figure 7 illustrates the outcome that we would expect for usefulness, satisfaction and workload under our research hypotheses H2 and H3. We expected usefulness and satisfaction to be higher in human uncertain (HU) conditions with uncertainty communication than when omitting the information. We further assumed that an advantage of the machine certain (MC—red) over the uncertainty communication (dark blue) condition should exist due to the higher information gain achievable by precise signals. On the other hand, for cases with higher human certainty (HC—green) we would expect information from an uncertainty communication to be redundant and therefore to cause no advantage over an omission of signals in the uncertainty range. However, under H3 also no disadvantage from redundant uncertainty communication was assumed.
For workload, measured as the NASA Task Load Index (Raw-TLX [64]), the expected relationship would be reversed because we define the relationship between workload and benefit as inverse, that is, a high workload reflects low benefit whereas a low workload can indicate higher benefit.
We compared scores of human uncertain conditions (MC-HU, MU-HU-uc, MU-HU—red, blue) using Friedmann tests and post-hoc one-sided Wilcoxon signed rank tests with Bonferroni adjusted alpha levels for repeated testing. As there were only two human certain conditions (MU-HC-uc, MU-HC—green) we directly compared scores for these conditions using Wilcoxon signed rank tests with Bonferroni adjusted alpha levels.

2.6.3. Gaze Distribution and Safety—H4 (Safety)

Figure 8 illustrates the outcome that we would expect for safety and gaze guidance under H4. While gaze guidance is not directly subsumed in the benefit term, here we understand it as a behavioral indicator for an influence on peoples’ information sampling which relates to our second and fourth hypotheses. The assistance system primes relevant regions of interest through tactile stimuli which may prompt users to shift their gaze accordingly in order to acquire additional information or visual confirmation. Under H2 and H4 we would therefore expect gaze guidance to be observable for conditions in which the system can provide novel information, that is, machine certain (MC—red) and human uncertain with uncertainty communication (MU-HU-uc—dark blue) conditions. In contrast, according to H3 this should not be the case for cases in which human uncertainty is equal or lower than machine uncertainty (light blue and green).
Prior to gaze distribution analysis, we filtered the data to only include trials in which vehicles approached from behind. As driving requires frontal visual attention at most times, especially with low visibility conditions, a comparison of front gaze ratios is more meaningful for situations in which safety-relevant events take place behind the ego vehicle. Due to the presence of outliers and a violation of the normality assumption, we compared front gaze ratios of human uncertain conditions (MC-HU, MU-HU-uc, MU-HU—red, blue) using Friedmann tests and post-hoc one-sided Wilcoxon signed rank tests with Bonferroni adjusted alpha levels for repeated testing. As there were only two human certain conditions (MU-HC-uc, MU-HC—green) we directly compared front gaze ratios for these conditions using one-sided Wilcoxon signed rank tests with Bonferroni adjusted alpha levels.
For the analysis of safety we focused on human uncertain conditions and trials in which vehicles approached from the front right lane because these trials required corrective actions by the driver to ensure safety. In line with H4 we expected safety to be highest in the machine certain (MC—red) condition, lowest in the absence of >33 m signaling (MU-HU—light blue) and intermediate with uncertainty communication enabled (MU-HU-uc—dark blue). MTTC scores (see Section 2.5.5.4) were calculated for each trial and mean MTTC scores per participant and condition were compared using a Friedmann test and post-hoc one-sided Wilcoxon signed rank tests with Bonferroni adjusted alpha levels for repeated testing.

3. Results

3.1. Subjective Reports

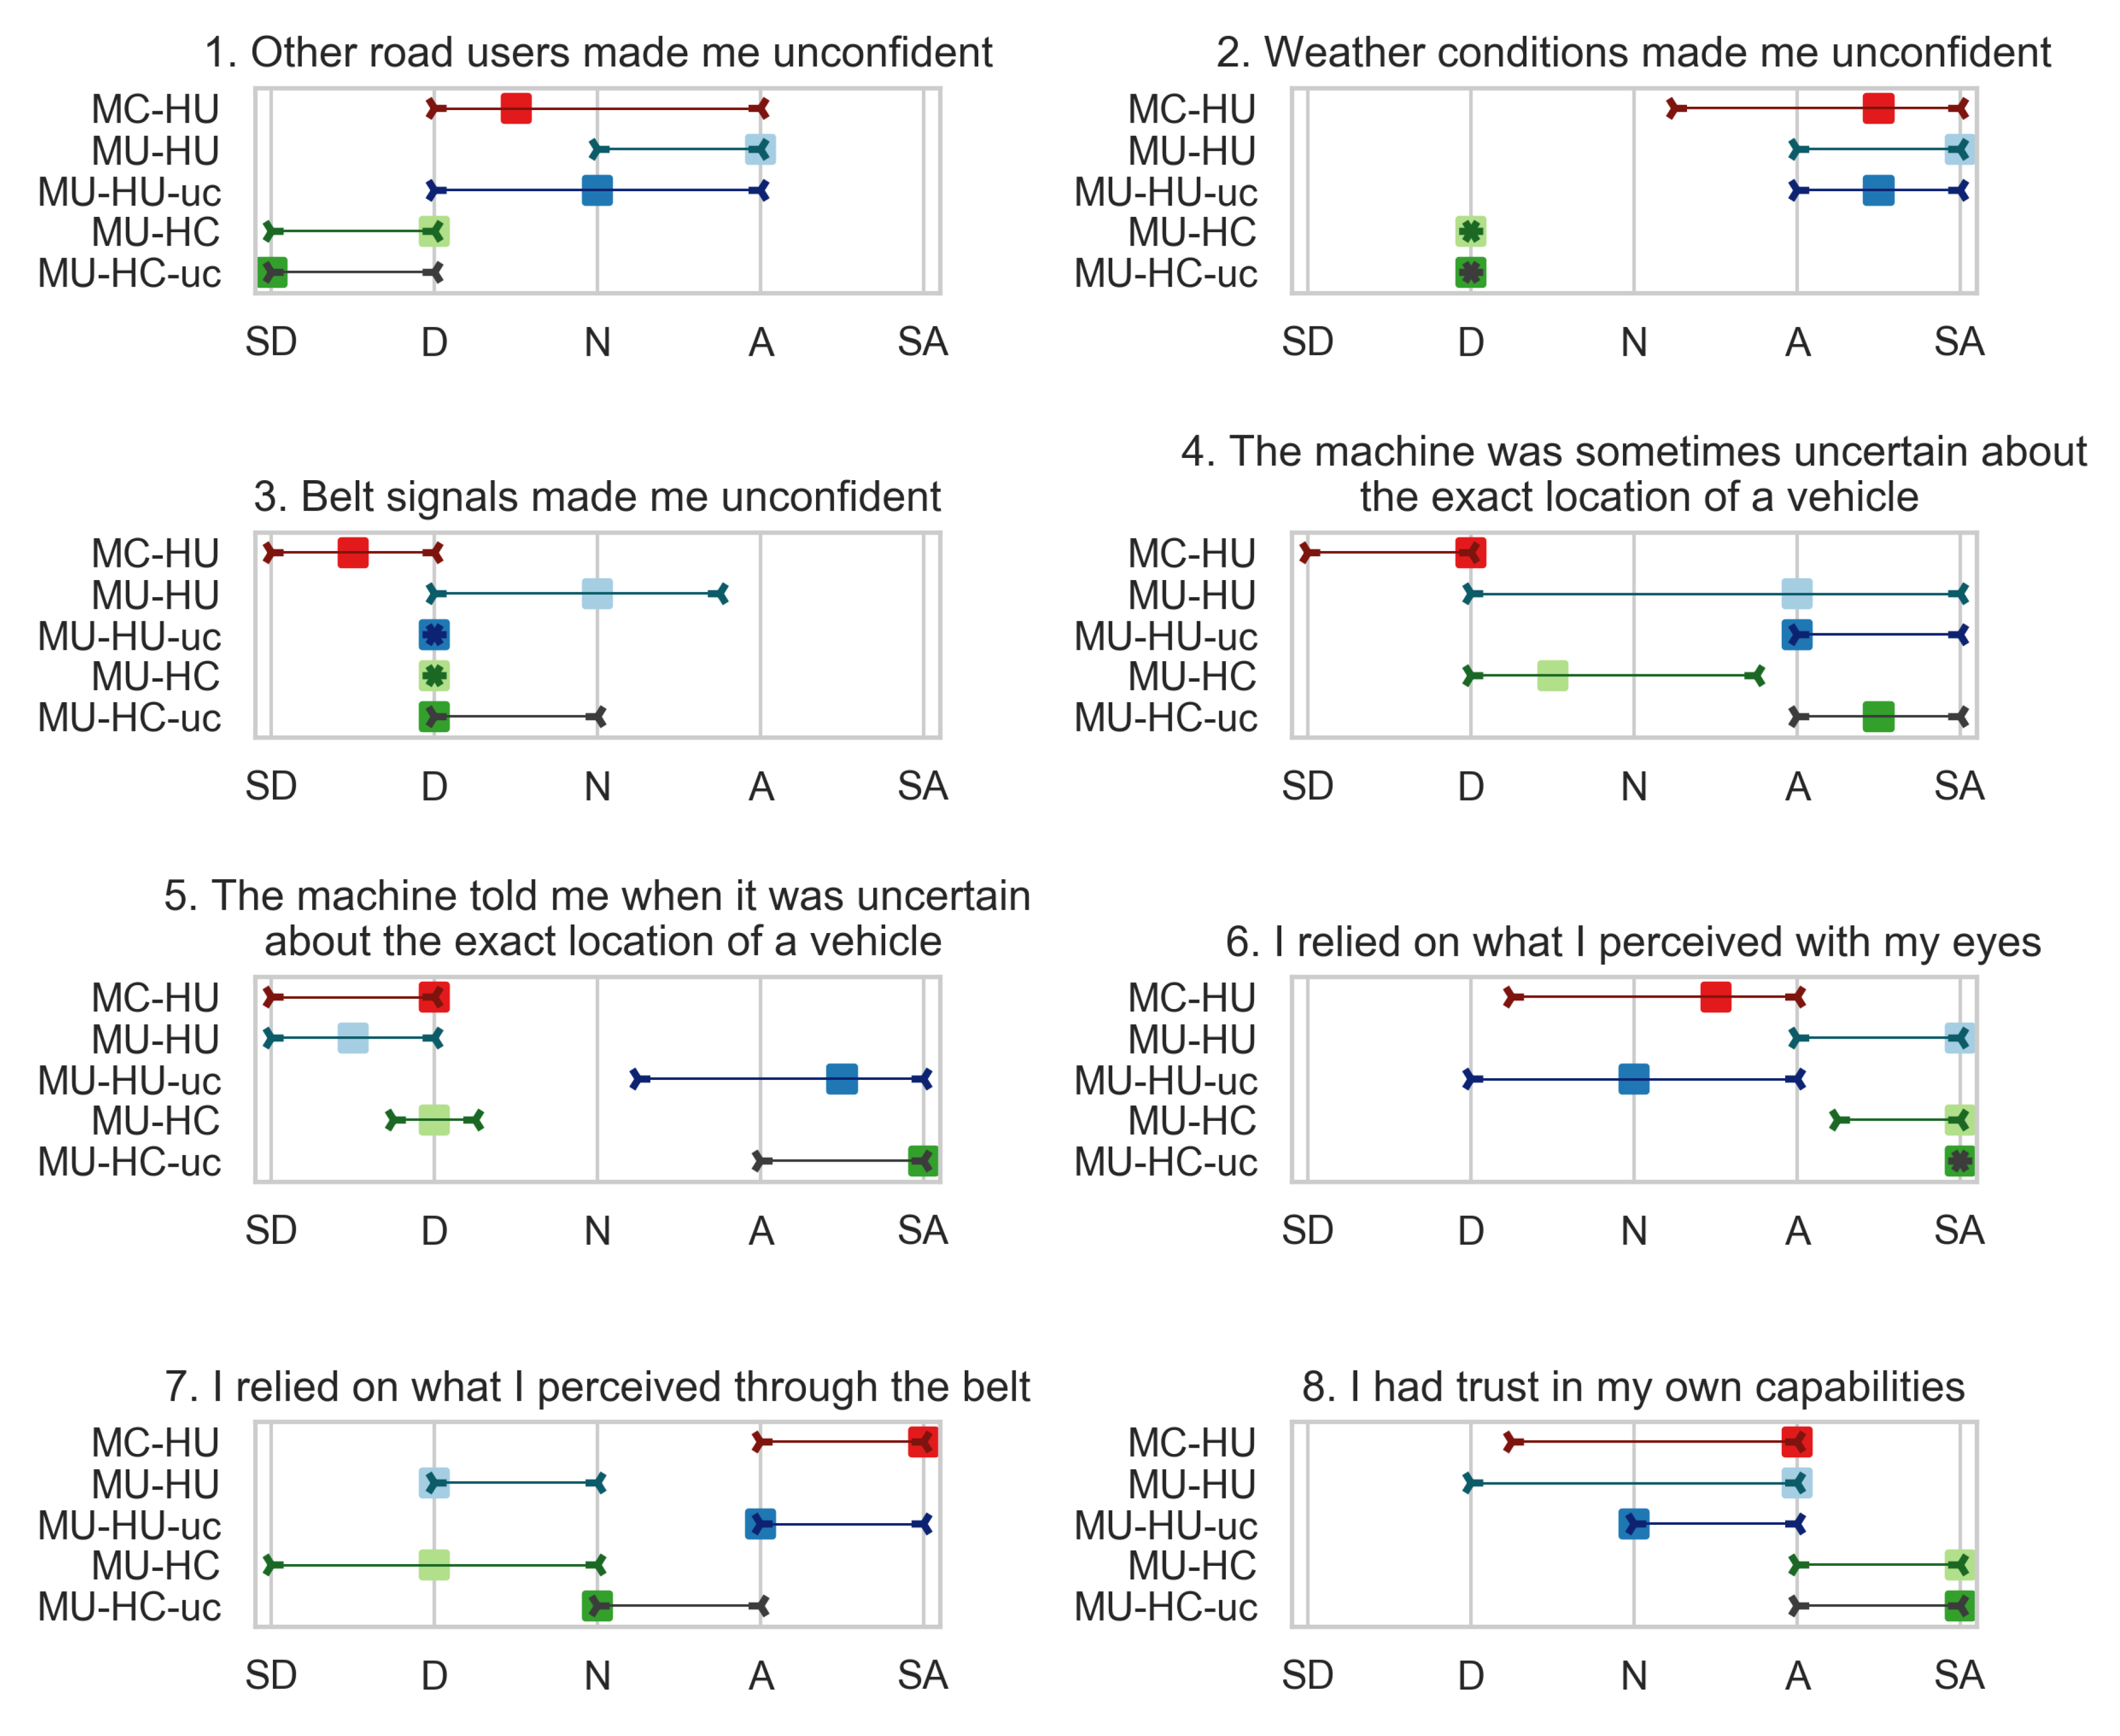
3.1.1. Custom Questionnaire—H1 (Understanding)

Response distributions to the eight Likert items that were used in our customized questionnaire are shown in Figure 9 for each experimental condition. For human uncertain conditions, participants strongly indicated weather conditions as a cause for feeling unconfident whereas other road users had a smaller influence and belt signals were not negatively affecting confidence. For human certain conditions, none of these three factors reduced confidence. These ratings suggest that our experimental manipulation of human uncertainty through different weather conditions was successful. Statements 4 and 5 targeted the understanding of the tactile stimuli and the machine uncertainty state. In support of H1, participants generally identified system uncertainty when present (MU), especially with uncertainty communication (uc) and correctly indicated its absence (MC). This suggests that the state transparency achieved by the uncertainty communication supported system state understanding. The last three statements were included for an estimate on which modalities the participants relied during the different conditions. Reliance on own capabilities and visual sensing was highest in the human certain conditions (HC). For human uncertain conditions (HU), reliance on the tactile stimuli was high, especially for the machine certain (MC) and machine uncertain + communication (MU-HU-uc) conditions. This was no longer the case when uncertainty communication was disabled (MU-HU). In support of the H2 and H3, this suggests that participants utilized tactile stimuli depending on system reliability and their own confidence state. In summary, participant responses suggest that the experimental manipulations worked as intended and induced different levels of congruency between human and machine perceptual uncertainty.

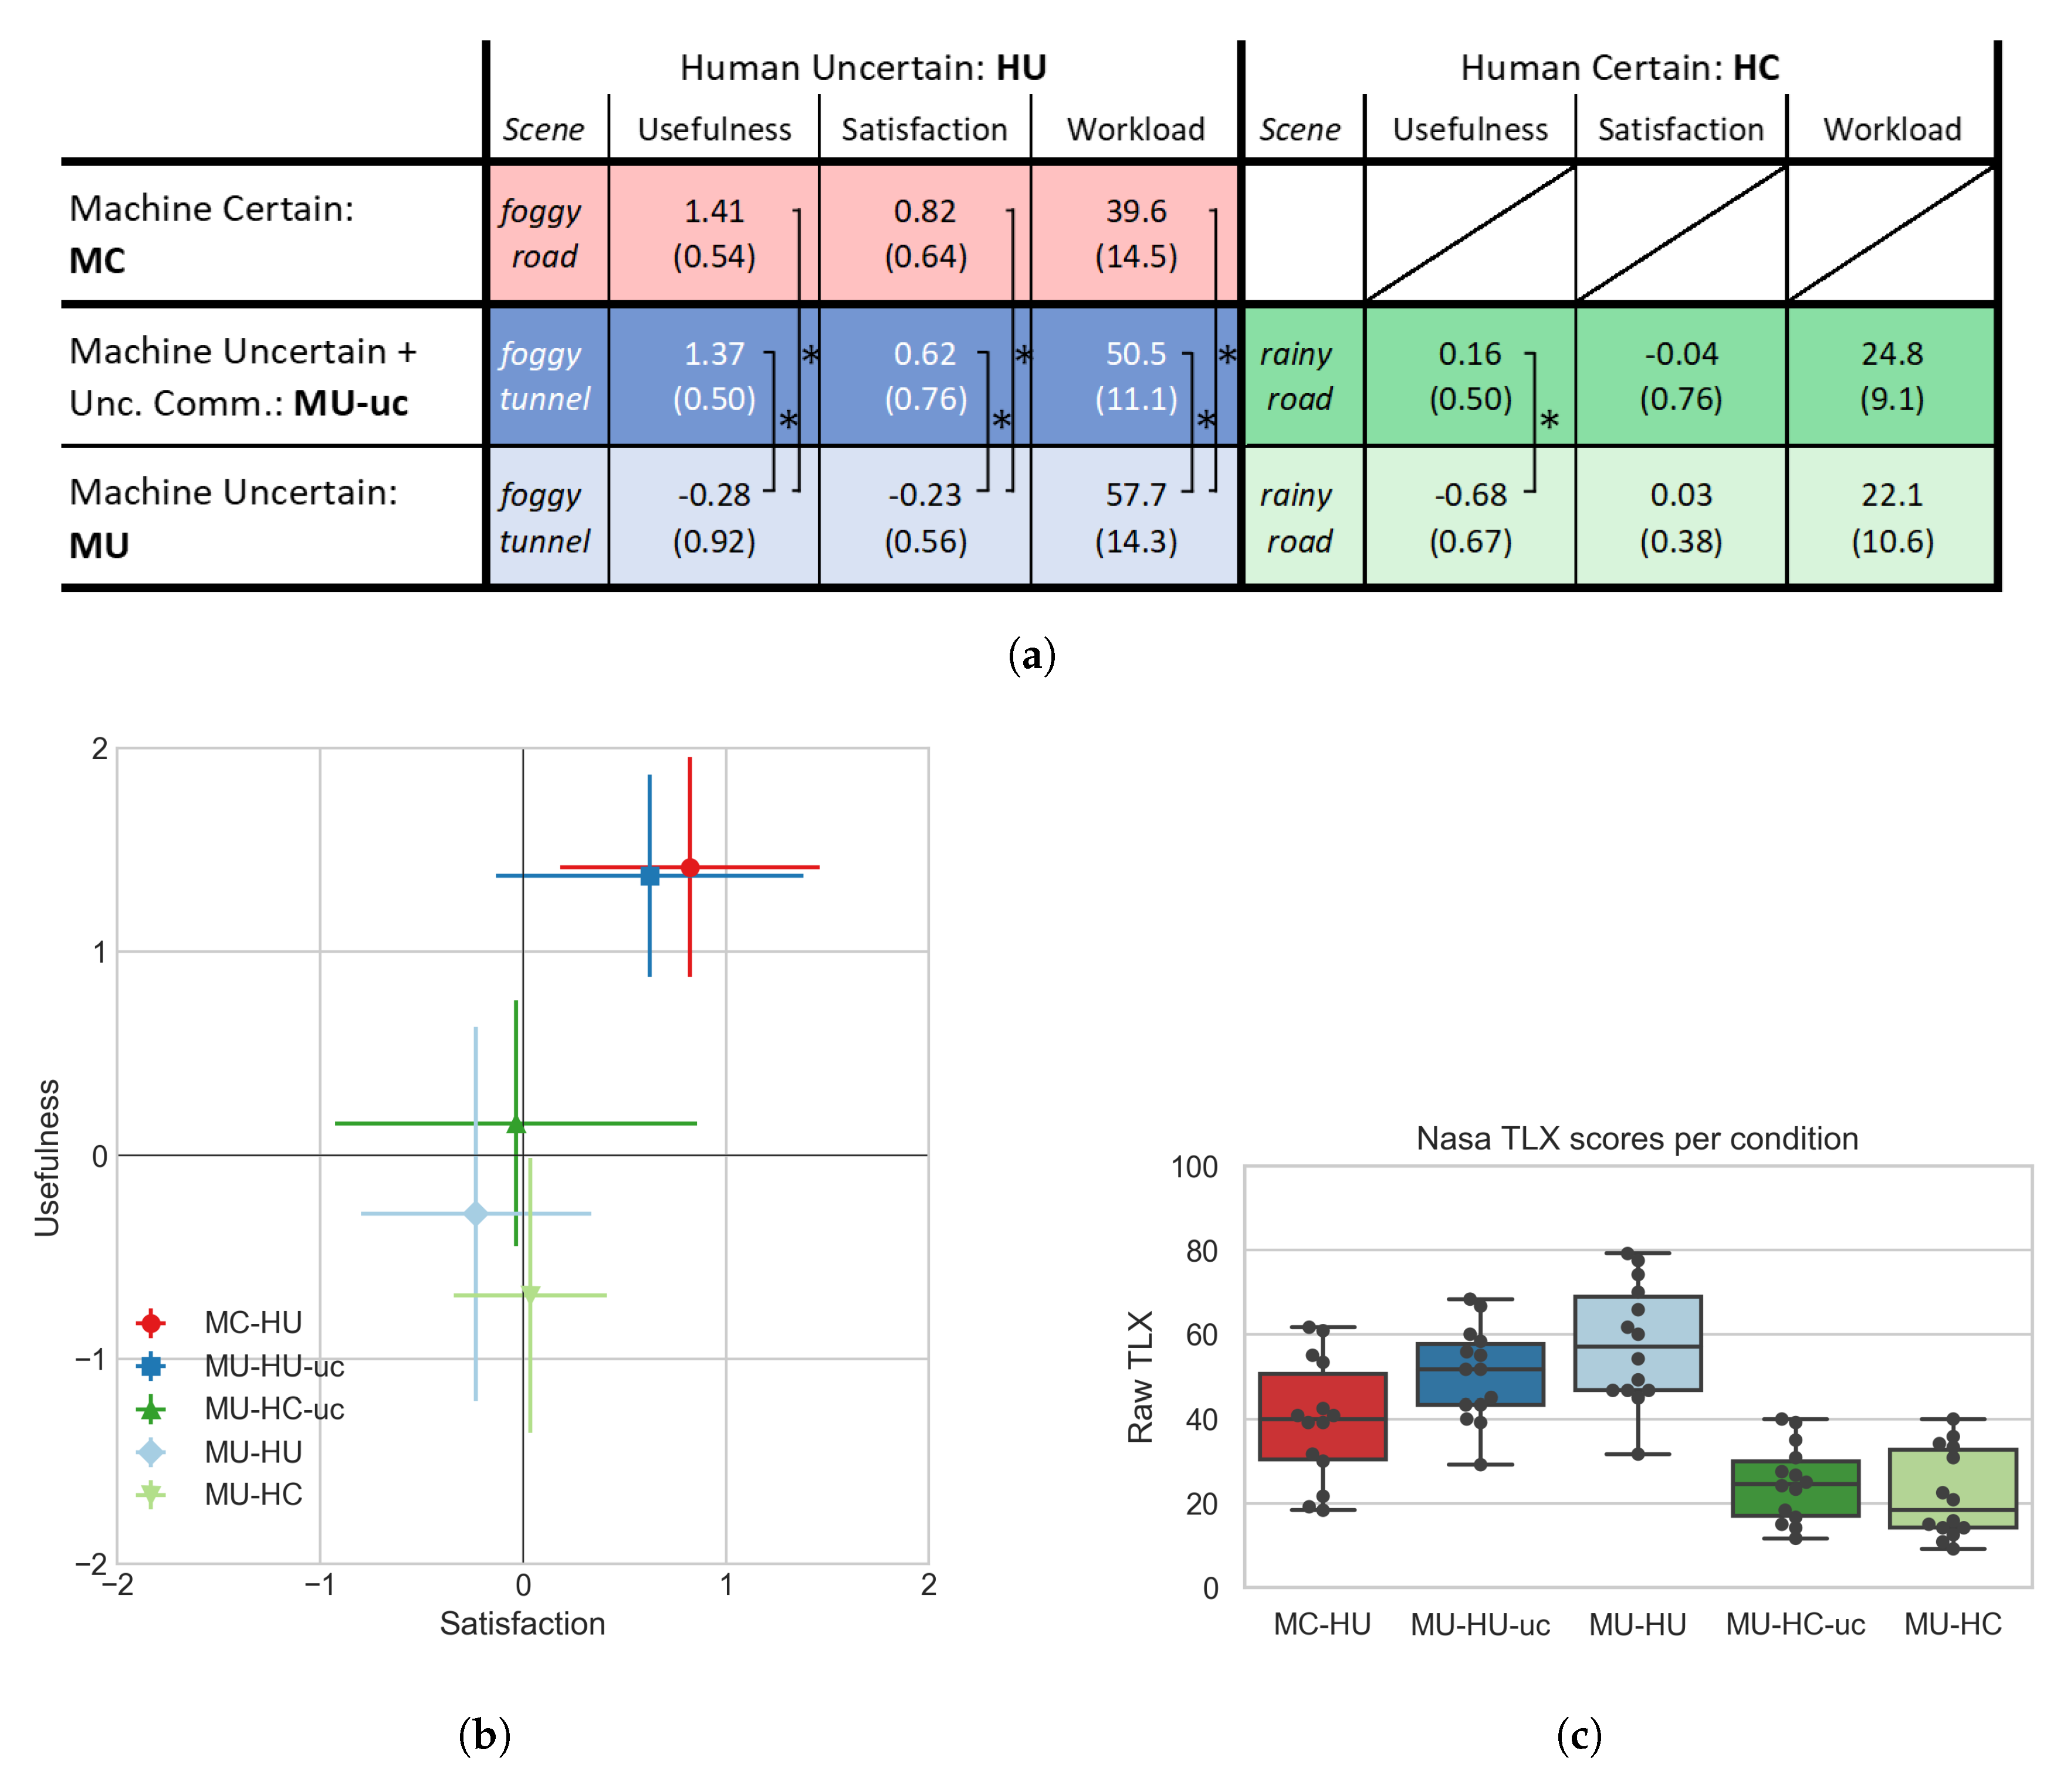
3.1.2. Usefulness and Satisfaction—H2 (Subjective Benefit) and H3 (Disturbance)

An overview of the usefulness and satisfaction scores that were obtained in each experimental condition can be found in Figure 10b. As expected, the overall highest score was found for the machine certain and human uncertain condition (MC-HU). The overall lowest score was obtained for the machine uncertain-human certain condition (MU-HC). We were interested in comparing conditions within a given level of human certainty, that is a comparison between the three human uncertain conditions (HU—red and blue) and between the two human certain conditions (HC—green).
The human uncertain conditions (MC-HU, MU-HU-uc, MU-HU) differed significantly for usefulness, χ 2 ( 2 ) = 20.87 , p < 0.001 (< α = 0.025 ) , as well as for the satisfaction scores, χ 2 ( 2 ) = 16.62 , p < 0.001 (< α = 0.025 ) . Post-hoc comparisons revealed that usefulness was rated significantly higher with uncertainty communication enabled (MU-HU-uc—dark blue) than disabled (MU-HU—light blue), MU-HU-uc vs. MU-HU: w = 0.0 , p < 0.001 (< α = 0.008 ) where w denotes the sum of the ranks of the differences above zero (In contrast to test statistics of many parametric tests, a small value for w is therefore a strong indicator for consistent and significant differences). Similarly, usefulness in the machine certain condition (MC—red) was rated significantly higher than in the machine uncertain condition without uncertainty communication (MU-HU), MC-HU vs. MU-HU: w = 0.0 , p < 0.001 (< α = 0.008 ) . However, there was no significant difference in usefulness ratings between the machine certain (MC-HU) and the uncertainty communication condition (MU-HU-uc), MC-HU vs. MU-HU-uc: w = 32.0 , p = 0.289 (> α = 0.008 ) . The same pattern of results was observed for the satisfaction ratings, MU-HU-uc vs. MU-HU: w = 10.5 , p = 0.004 (< α = 0.008 ) , MC-HU vs. MU-HU: w = 0.0 , p < 0.001 (< α = 0.008 ) , MC-HU vs. MU-HU-uc: w = 34.5 , p = 0.219 (> α = 0.008 ) .
These results support the prediction driven by H2 that usefulness and satisfaction ratings should be higher with enabled than disabled uncertainty communication. However, contrary to our assumption, no advantage of the machine certain (MC-HU) over the uncertainty communication (MU-HU-uc) condition, reflecting a difference in potential information gain, could be confirmed.
Also for the human certain conditions (HC–green), we found that usefulness was rated as significantly higher with uncertainty communication enabled (MU-HC-uc) than disabled (MU-HC), MU-HC-uc vs. MU-HC: w = 16.5 , p = 0.012 (< α = 0.05 ) . For satisfaction ratings, the differences between human certain conditions were not significant, MU-HC-uc vs. MU-HC: w = 21.0 , p = 0.429 (> α = 0.05 ) . While average satisfaction ratings were somewhat neutral for both conditions, the usefulness of a late-supporting system was negatively judged. Average neutral usefulness ratings for the uncertainty communication condition support our predictions made under H3, presumably because it was neither needed nor disturbing.

3.1.3. Workload—H2 (Subjective Benefit) and H3 (Disturbance)

NASA TLX workload ratings (Figure 10c) differed significantly between human uncertain conditions (MC-HU, MU-HU-uc, MU-HU), χ 2 ( 2 ) = 11.66 , p = 0.003 (< α = 0.05 ) . Post-hoc comparisons revealed that workload was rated significantly lower with uncertainty communication enabled (MU-HU-uc—dark blue) than disabled (MU-HU—light blue), MU-HU-uc vs. MU-HU: w = 14.0 , p = 0.008 (< α = 0.016 ) . Also in the machine certain condition (MC—red), workload was rated significantly lower than in the machine uncertain condition without uncertainty communication (MU-HU), MC-HU vs. MU-HU: w = 1.0 , p = 0.001 (< α = 0.016 ) . These results confirm the prediction that workload should be reduced when enabling uncertainty communication and thus support H2. However, differences in subjective workload between the machine certain (MC-HU) and the uncertainty communication condition (MU-HU-uc) were not significant, MC-HU vs. MU-HU-uc: w = 19.0 , p = 0.032 (> α = 0.016 ) . In contrast to H2, an assumed advantage of the machine certain (MC-HU) over the uncertainty communication (MU-HU-uc) could therefore not be confirmed.
For the human certain conditions (HC—green), workload ratings were comparably low and did not differ significantly between conditions with uncertainty communication enabled (MU-HC-uc—dark green) and disabled (MU-HC—light green), MU-HC-uc vs. MU-HC: w = 31.0 , p = 0.310 (> α = 0.05 ) . When contrasted with results from the human uncertain (HU) conditions, the low averages and the lack of difference in satisfaction and workload between the two human certain (HC) conditions may be seen as support for H3. However, due to the use of different driving profiles, a formal comparison of differences would not be valid.

3.2. Gaze Distribution—H2 (Subjective Benefit) and H4 (Safety)

Figure 11b shows the ratio of gaze points on the front (front window) divided by front+back (front window + mirrors). Front gaze ratios differed significantly between human uncertain conditions (MC-HU, MU-HU-uc, MU-HU) for trials in which vehicles approached from the back, χ 2 ( 2 ) = 16.0 , p < 0.001 (< α = 0.05 ) . Post-hoc comparisons revealed that the front gaze ratios were significantly lower with uncertainty communication enabled (MU-HU-uc—dark blue) than disabled (MU-HU—light blue), MU-HU-uc vs. MU-HU: w = 0.0 , p < 0.001 (< α = 0.016 ) . Also in the machine certain condition (HC—red), front gaze ratios were significantly lower than in the machine uncertain condition without uncertainty communication (MU-HU), MC-HU vs. MU-HU: w = 2.0 , p < 0.001 (< α = 0.016 ) . Differences in front gaze ratios between the machine certain (MC-HU) and the uncertainty communication condition (MU-HU-uc) were not significant, MC-HU vs. MU-HU-uc: w = 14.0 , p = 0.007 (< α = 0.016 but w > w c r i t i c a l = 12 ) .
Between human certain conditions (MU-HC, MU-HC-uc—green), differences between front gaze ratios could not be regarded as significant for trials in which vehicles approached from the back, MU-HC vs. MU-HC-uc: w = 24.0 , p = 0.037 (> α = 0.016 and w > w c r i t i c a l = 12 ) . These findings indicate an increased overt attention guidance for conditions in which the assistance can provide novel relevant information. They are therefore in line with our predictions (see Figure 8) made under H2 and H4.
For comparison, for situations in which vehicles approached from the front (Figure 11c), the gaze distributions substantially shifted to the front (MU-HC: M = 0.92 , S D = 0.05 ; MU-HC-uc: M = 0.91 , S D = 0.06 ; MU-HU: M = 0.97 , S D = 0.02 ; MU-HU-uc: M = 0.96 , S D = 0.04 ; MC-HU: M = 0.94 , S D = 0.07 ) across all conditions. Differences between uncertainty communication and no uncertainty communication diminished, as stimuli with uncertain direction encoding only drew attention to front regions.

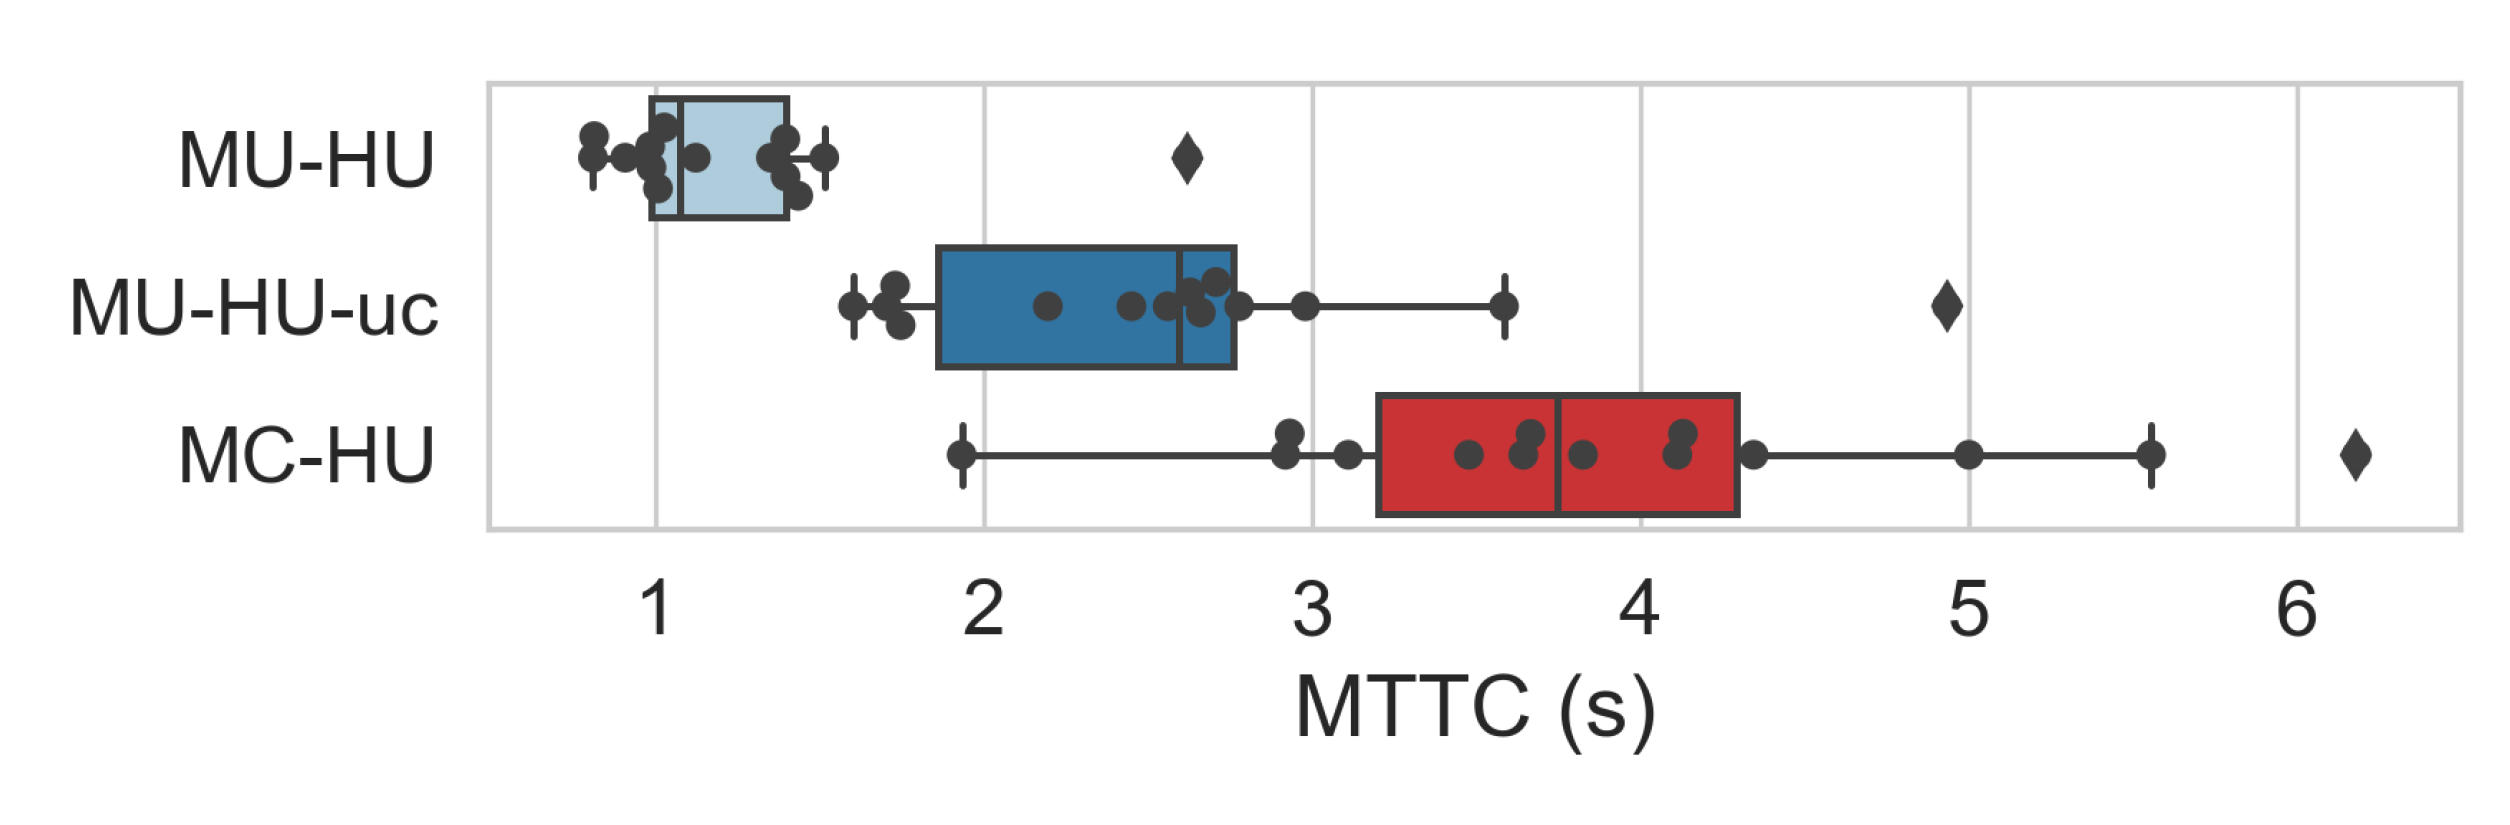
3.3. Trial Safety—H4 (Safety)

Figure 12 displays the MTTC scores for human uncertain conditions. We only considered the data of the human uncertain (HU—blue and red) conditions for statistical tests. MTTCs differed significantly between human uncertain conditions (MC-HU, MU-HU-uc, MU-HU), χ 2 ( 2 ) = 24.14 , p < 0.001 (< α = 0.05 ) . We found that the MTTCs were significantly higher for the MU-HU-uc condition (M = 2.59 s, S D = 0.88) than for the MU-HU condition (M = 1.24 s, S D = 0.46); w = 4.0 , p = 0.001 (< α = 0.016 ) . Furthermore, driving safety in terms of MTTC was also significantly higher in the MC-HU condition (M = 3.92 s, S D = 1.11) than in the MU-HU-uc condition, w = 7.0 , p = 0.002 (< α = 0.016 ) and the MU-HU condition, w = 0.0 , p < 0.001 (< α = 0.016 ) . In poor visibility conditions (MU), imprecise tactile direction signaling (MU-HU-uc) appears superior to a variant only capable of signaling specific, reliable observations within a substantially constrained spatial range (MU-HU). In accordance with H4, participants thus seem to have taken advantage of the information available in the tactile stimuli to adjust their driving behavior for achieving higher safety.

4. Discussion

In the present driving simulator study, we investigated the effects of a novel approach to encode spatial uncertainty in the stimuli of a vibrotactile assistance system. We aimed at evaluating the influence of the uncertainty communication on subjective measures indicative of perceived usefulness, satisfaction, and workload, as well as on behavioral measures, that is, driving safety and gaze allocation. We assumed that any effect of the uncertainty communication would be influenced by the relation of spatial uncertainty in human perception and the assistance system. Therefore, we experimentally varied the driving scenarios to simulate machine uncertainty (tunnel + fog, rain) and to induce human uncertainty (fog, tunnel + fog). We found that our suggested uncertainty communication mode was understood by participants and had significant effects on both subjective and objective behavioral measures. Thereby the utility of the system seemed to depend on the driver’s perceptual confidence state. In our experiment, the uncertainty communication was regarded as beneficial and had a measurable influence on driver behavior in cases where the human driver was uncertain as well.

4.1. Signal Understanding and Experiment Validation

A prerequisite to this study was that our environmental scenario manipulations had the effect that we intended. Data from our custom questionnaire indicate that this was indeed the case. Participants reported that they felt uncertain due to the weather conditions and agreed that they relied more on the belt signal than on their own perception in the human uncertain conditions. Furthermore, participants experienced higher workload in the human uncertain conditions compared to the human certain conditions.
Besides, we were interested in the participants’ subjective agreement on understanding the manipulation of machine uncertainty and the respective uncertainty communication signal. This was important to further validate our experimental procedure and the design of our uncertainty signal. Participants indicated that they had understood when the machine was uncertain and that they understood the meaning of the signal. Interestingly, they seemed to have noticed the machine uncertainty more strongly in the conditions in which the uncertainty communication was enabled, which suggests that this feature helped to make the machine state more transparent. Taken together, in support of hypothesis H1 (Understanding), these results indicate that our experimental manipulations were valid and that participants seemed to have an appropriate understanding of the uncertainty communication.
An important difference between earlier studies that have demonstrated successful communication of uncertainty (e.g., References [13,16,23]) and the work presented here, is that we relied on an implicit representation of uncertainty in the tactile modality: The uncertainty component was encoded within the spatiotemporal signaling functionality of our vibrotactile interface. Instead of explicitly stating that “I am uncertain”, the machine agent implicitly communicates uncertainty by being less specific in its display of the location of objects. We argue that the distinction between implicit and explicit uncertainty communication may be useful for the future design of reliability displays. Implicit uncertainty communication is characterized by an increase in ambiguity or vagueness, or a decrease in specificness of presented information. One example of implicit uncertainty communication that we encountered in the literature is by Finger and Bisantz [14], who added distortions to an image to make it increasingly difficult to specify the underlying image.

4.2. Uncertainty Signaling in Human Uncertain Conditions

In terms of behavioral adaptations and user acceptance, we found substantial differences in the results between the human certain and the human uncertain conditions. In particular, in case of both human and system uncertainty, uncertainty communication was perceived as significantly more useful and satisfying compared to the no uncertainty communication conditions. Uncertainty communication also yielded significantly lower workload, increased driving safety and more strongly guided gaze behavior, indicating that more attention was allocated towards the direction of the uncertainty signal. These results support hypotheses H2 (Subjective Benefit) and H4 (Safety) by showing that the vibrotactile uncertainty communication had beneficial effects on driving comfort and safety.
In the human uncertain conditions, the uncertainty communication signal was not perceived as significantly different from the precise signal in terms of perceived usefulness and satisfaction, as well as in perceived workload. This is somewhat surprising as one might think that participants would naturally value the accessibility of the full information that is provided by the precise signal more than the more ambiguous uncertainty information signal. Overall, this outcome indicates that making the vehicle’s perceptual state transparent is appreciated by participants. Our results suggest that users are still satisfied with the directional cues and recognize the usefulness of the uncertainty signals, despite the lower quality in terms of information specificity. However, in case of driving safety, we observed a significant advantage of the precise signal over the uncertainty communication signal. That is, we observed the safest driving behavior in terms of MTTC scores in conditions where the machine’s sensory capabilities were unaffected by the environment.
We conclude that the precise signal was appropriately used by participants to acquire a more accurate understanding of the direction of surrounding objects.This finding is in line with the reports by Krüger et al. [53,54], who found that participants rapidly gained an understanding of vibrotactile stimuli and presented safer driving behavior using the same vibrotactile assistance with a precise signal mode compared to driving without.

4.3. Uncertainty Signaling in Human Certain Conditions

Analysis of the eye-tracking data revealed that visual attention distributions were affected significantly by the uncertainty signaling in scenarios in which human visibility was limited (human uncertain conditions), but not in the human certain conditions. Furthermore, usefulness and satisfaction ratings showed neutral ratings in the human certain conditions. In agreement with hypothesis H3 (Disturbance) this suggests that there is no direct disadvantage but also no benefit in sharing observations continuously when the human is confident.
For successful human-machine cooperation [7,8] or teaming, a human mental representation of system uncertainty may not be enough. When the machine also has a representation of human confidence in different environments, it allows the machine to decide under what conditions to provide support to the user. However, such a selective and presumably personalized communication could induce confusion when violating a user’s assumptions on what the machine is communicating. In this example, it might not even be possible for a user to unambiguously distinguish between cases in which the machine is not providing stimuli because it has not detected a potential collision event and cases in which it has selectively disabled communication because it could confirm that the user has a sufficient scene understanding. Selectively deactivating systems that implicitly encode the absence of issues through an absence of stimuli could therefore be problematic but may be an important challenge to tackle in the design of future driving assistance systems.

4.4. Limitations

Despite the relatively small sample size, the results show clear statistical significance and accordingly provide support for the benefits of uncertainty communication. A limitation of the current study is that the sample (technically schooled, 13/14 male) was not balanced to be representative of a diverse population. Consequently, inferences are restricted to mostly male drivers younger than 42 years. It is well known that age is associated with sensory and cognitive decline [66]. However, prior work on sensory integration [67] and proximity alerting [68] suggests a positive relationship between age and multimodal facilitation effects such as reaction time shortening. Future work should investigate whether such a relationship also exists with our system. Another limitation comes from the restriction to highly challenging situations for cases with human uncertainty. An advantage of the fast succession of safety-critical situations is that it ensured exposure to the functionality of the device, which currently only provides stimuli when operating outside a safety margin. This means that in safe conditions the system does not produce any stimuli. The fact that the system proved its usefulness in challenging situations can be seen as a strength. However, we do not know if the observed effects would remain with less frequent system activation under more common traffic conditions. Future work could address this issue by implementing easier scenarios where a participant encounters fewer safety-critical event(s) for an overall longer exposure time.

4.5. Conclusions

Taken together, the study yields new insights about the communication of directional uncertainty for a driving assistance system in the tactile modality. We found that an implicit encoding of spatial uncertainty in a vibrotactile interface was easily understood and used by participants, and that its impact on drivers depended on the drivers’ sense of certainty. Importantly, in case the human driver was uncertain, the uncertainty communication signal was perceived as equally useful and satisfying as a precise signal of the assistance system. Along with previous literature, our findings stress the value and importance of communicating appropriate information and making machine states transparent to the user. Our results suggest that the tactile modality is a suitable candidate for communicating such information to the user unobtrusively and intuitively while potentially circumventing the risks and challenges which an additional utilization of the visual modality would introduce.

Author Contributions

Conceptualization, M.K., T.D., C.B.W.-H. and J.C.F.d.W.; Methodology, M.K., T.D., C.B.W.-H. and J.C.F.d.W.; Software, T.D. and M.K.; Validation, M.K. and J.C.F.d.W.; Formal analysis, T.D. and M.K.; Investigation, T.D.; Resources, H.W.; Data curation, T.D. and M.K.; Writing–original draft preparation, T.D. and M.K.; Writing–review and editing, M.K., C.B.W.-H., J.C.F.d.W., H.W. and T.D.; Visualization, T.D. and M.K.; Supervision, M.K., C.B.W.-H., J.C.F.d.W. and H.W.; Project administration, C.B.W.-H. and H.W.; Funding acquisition, H.W.; All authors have read and agreed to the published version of the manuscript.

Funding

This research was funded by Honda Research Institute Europe GmbH.

Conflicts of Interest

The authors declare no conflict of interest.

References

  1. Hasirlioglu, S.; Kamann, A.; Doric, I.; Brandmeier, T. Test methodology for rain influence on automotive surround sensors. In Proceedings of the 2016 IEEE 19th International Conference on Intelligent Transportation Systems (ITSC), Rio de Janeiro, Brazil, 1–4 November 2016; pp. 2242–2247. [Google Scholar] [CrossRef]
  2. Audi. A8 Owner’s Manual; Audi AG: Ingolstadt, Germany, 2018. [Google Scholar]
  3. Lee, J.D.; See, K.A. Trust in Automation: Designing for Appropriate Reliance. Hum. Factors J. Hum. Factors Ergon. Soc. 2004, 46, 50–80. [Google Scholar] [CrossRef] [PubMed]
  4. Flemisch, F.O.; Bengler, K.; Bubb, H.; Winner, H.; Bruder, R. Towards cooperative guidance and control of highly automated vehicles: H-Mode and Conduct-by-Wire. Ergonomics 2014, 57, 343–360. [Google Scholar] [CrossRef] [PubMed]
  5. Hoc, J.M. Towards a cognitive approach to human-machine cooperation in dynamic situations. Int. J. Hum. Comput. Stud. 2001, 54, 509–540. [Google Scholar] [CrossRef] [Green Version]
  6. Klein, G.; Woods, D.; Bradshaw, J.; Hoffman, R.; Feltovich, P. Ten Challenges for Making Automation a “Team Player” in Joint Human-Agent Activity. IEEE Intell. Syst. 2004, 19, 91–95. [Google Scholar] [CrossRef] [Green Version]
  7. Krüger, M.; Wiebel, C.B.; Wersing, H. From Tools Towards Cooperative Assistants. In Proceedings of the 5th International Conference on Human Agent Interaction (HAI ’17), Bielefeld, Germany, 17–20 October 2017; ACM Press: New York, NY, USA, 2017; pp. 287–294. [Google Scholar] [CrossRef]
  8. Sendhoff, B.; Wersing, H. Cooperative Intelligence—A Humane Perspective. In Proceedings of the 1st IEEE International Conference on Human-Machine Systems (ICHMS 2020), Rome, Italy, 7–9 September 2020; IEEE: New York, NY, USA, 2020. [Google Scholar]
  9. Caird, J.K.; Chisholm, S.; Lockhart, J. Do in-vehicle advanced signs enhance older and younger drivers’ intersection performance? Driving simulation and eye movement results. Int. J. Hum.-Comput. Stud. 2008, 66, 132–144. [Google Scholar] [CrossRef]
  10. Naujoks, F.; Neukum, A. Timing of in-vehicle advisory warnings based on cooperative perception. In Proceedings of the Human Factors and Ergonomics Society Europe Chapter Annual Meeting, Torino, Italy, 16–18 October 2013. [Google Scholar]
  11. Ali, Y.; Zheng, Z.; Haque, M.M. Connectivity’s impact on mandatory lane-changing behaviour: Evidences from a driving simulator study. Transp. Res. Part Emerg. Technol. 2018, 93, 292–309. [Google Scholar] [CrossRef]
  12. Naujoks, F.; Totzke, I. Behavioral adaptation caused by predictive warning systems—The case of congestion tail warnings. Transp. Res. Part Traffic Psychol. Behav. 2014, 26, 49–61. [Google Scholar] [CrossRef]
  13. Beller, J.; Heesen, M.; Vollrath, M. Improving the Driver-Automation Interaction. Hum. Factors J. Hum. Factors Ergon. Soc. 2013, 55, 1130–1141. [Google Scholar] [CrossRef]
  14. Finger, R.; Bisantz, A.M. Utilizing graphical formats to convey uncertainty in a decision-making task. Theor. Issues Ergon. Sci. 2002, 3, 1–25. [Google Scholar] [CrossRef]
  15. Helldin, T.; Falkman, G.; Riveiro, M.; Davidsson, S. Presenting system uncertainty in automotive UIs for supporting trust calibration in autonomous driving. In Proceedings of the 5th International Conference on Automotive User Interfaces and Interactive Vehicular Applications (AutomotiveUI ’13), Eindhoven, The Netherlands, 27–30 October 2013; ACM Press: New York, NY, USA, 2013; pp. 210–217. [Google Scholar] [CrossRef]
  16. Kunze, A.; Summerskill, S.J.; Marshall, R.; Filtness, A.J. Automation transparency: Implications of uncertainty communication for human-automation interaction and interfaces. Ergonomics 2019, 1–16. [Google Scholar] [CrossRef] [Green Version]
  17. Noah, B.E.; Gable, T.M.; Chen, S.Y.; Singh, S.; Walker, B.N. Development and Preliminary Evaluation of Reliability Displays for Automated Lane Keeping. In Proceedings of the 9th International Conference on Automotive User Interfaces and Interactive Vehicular Applications (AutomotiveUI ’17), Oldenburg, Germany, 24–27 September 2017; ACM Press: New York, NY, USA, 2017; pp. 202–208. [Google Scholar] [CrossRef]
  18. Faltaous, S.; Baumann, M.; Schneegass, S.; Chuang, L.L. Design Guidelines for Reliability Communication in Autonomous Vehicles. In Proceedings of the 10th International Conference on Automotive User Interfaces and Interactive Vehicular Applications, Toronto, ON, Canada, 23–25 September 2018; pp. 258–267. [Google Scholar]
  19. SAE International On-Road Automated Driving Committee. Taxonomy and Definitions for Terms Related to Driving Automation Systems for On-Road Motor Vehicles; Technical report SAE J3016; SAE International: Warrendale, PA, USA, 2016. [Google Scholar]
  20. Kunze, A.; Summerskill, S.J.; Marshall, R.; Filtness, A.J. Conveying Uncertainties Using Peripheral Awareness Displays in the Context of Automated Driving. In Proceedings of the 11th International Conference on Automotive User Interfaces and Interactive Vehicular Applications, Utrecht, The Netherlands, 22–25 September 2019; pp. 329–341. [Google Scholar]
  21. Cohen-Lazry, G.; Borowsky, A.; Oron-Gilad, T. The effects of continuous driving-related feedback on drivers’ response to automation failures. In Proceedings of the Human Factors and Ergonomics Society Annual Meeting, Nantes, France, 20 October 2017; SAGE Publications Sage CA: Los Angeles, CA, USA, 2017; Volume 61, pp. 1980–1984. [Google Scholar]
  22. Kunze, A.; Summerskill, S.J.; Marshall, R.; Filtness, A.J. Preliminary Evaluation of Variables for Communicating Uncertainties Using a Haptic Seat. In Proceedings of the 10th International Conference on Automotive User Interfaces and Interactive Vehicular Applications (AutomotiveUI ’18), Toronto, ON, Canada, 23–25 September 2018; ACM Press: New York, NY, USA, 2018; pp. 154–158. [Google Scholar]
  23. Wintersberger, P.; Dmitrenko, D.; Schartmüller, C.; Frison, A.K.; Maggioni, E.; Obrist, M.; Riener, A. S(C)ENTINEL. In Proceedings of the 24th International Conference on Intelligent User Interfaces (IUI ’19), Marina del Ray, CA, USA, 19–22 March 2019; ACM Press: New York, NY, USA, 2019; pp. 538–546. [Google Scholar] [CrossRef] [Green Version]
  24. Van Erp, J.B.F. Guidelines for the use of vibro-tactile displays in human computer interaction. In Proceedings of the Eurohaptics, Edinburgh, UK, 8–10 July 2002; Volume 2002, pp. 18–22. [Google Scholar]
  25. Petermeijer, S.M.; Cieler, S.; De Winter, J.C.F. Comparing spatially static and dynamic vibrotactile take-over requests in the driver seat. Accid. Anal. Prev. 2017, 99, 218–227. [Google Scholar] [CrossRef] [PubMed]
  26. Ho, C.; Tan, H.Z.; Spence, C. Using spatial vibrotactile cues to direct visual attention in driving scenes. Transp. Res. Part Traffic Psychol. Behav. 2005, 8, 397–412. [Google Scholar] [CrossRef]
  27. Spence, C.; Ho, C. Tactile and Multisensory Spatial Warning Signals for Drivers. IEEE Trans. Haptics 2008, 1, 121–129. [Google Scholar] [CrossRef] [PubMed]
  28. Fitch, G.M.; Hankey, J.M.; Kleiner, B.M.; Dingus, T.A. Driver comprehension of multiple haptic seat alerts intended for use in an integrated collision avoidance system. Transp. Res. Part Traffic Psychol. Behav. 2011, 14, 278–290. [Google Scholar] [CrossRef]
  29. Meng, F.; Spence, C. Tactile warning signals for in-vehicle systems. Accid. Anal. Prev. 2015, 75, 333–346. [Google Scholar] [CrossRef] [PubMed]
  30. Petermeijer, S.M.; de Winter, J.C.; Bengler, K.J. Vibrotactile displays: A survey with a view on highly automated driving. IEEE Trans. Intell. Transp. Syst. 2016, 17, 897–907. [Google Scholar] [CrossRef] [Green Version]
  31. Nagel, S.K.; Carl, C.; Kringe, T.; Märtin, R.; König, P. Beyond sensory substitution—Learning the sixth sense. J. Neural Eng. 2005, 2, R13. [Google Scholar] [CrossRef] [Green Version]
  32. Van Erp, J.B.F.; Veen, H.A.H.C.V.; Jansen, C.; Dobbins, T. Waypoint Navigation with a Vibrotactile Waist Belt. ACM Trans. Appl. Percept. 2005, 2, 106–117. [Google Scholar] [CrossRef]
  33. Smets, N.J.; te Brake, G.M.; Neerincx, M.A.; Lindenberg, J. Effects of mobile map orientation and tactile feedback on navigation speed and situation awareness. In Proceedings of the 10th International Conference on Human Computer Interaction with Mobile Devices and Services, Amsterdam, The Netherlands, 2–5 September 2008; ACM: New York, NY, USA, 2008; pp. 73–80. [Google Scholar]
  34. Srikulwong, M.; O’Neill, E. A comparative study of tactile representation techniques for landmarks on a wearable device. In Proceedings of the SIGCHI Conference on Human Factors in Computing Systems, Vancouver, BC, Canada, 7–12 May 2011; ACM: New York, NY, USA, 2011. [Google Scholar]
  35. Zelek, J.; Hobein, M. Wearable Tactile Navigation System. US20130218456, 22 August 2013. [Google Scholar]
  36. Steltenpohl, H.; Bouwer, A. Vibrobelt: Tactile Navigation Support for Cyclists. In Proceedings of the 2013 International Conference on Intelligent User Interfaces, Santa Monica, CA, USA, 19–22 March 2013; ACM: New York, NY, USA, 2013; pp. 417–426. [Google Scholar]
  37. Prasad, M.; Taele, P.; Goldberg, D.; Hammond, T.A. Haptimoto: Turn-by-turn haptic route guidance interface for motorcyclists. In Proceedings of the SIGCHI Conference on Human Factors in Computing Systems, Toronto, ON, Canada, 26 April–1 May 2014; ACM: New York, NY, USA, 2014. [Google Scholar]
  38. Schirmer, M.; Hartmann, J.; Bertel, S.; Echtler, F. Shoe me the way: A shoe-based tactile interface for eyes-free urban navigation. In Proceedings of the 17th International Conference on Human-Computer Interaction with Mobile Devices and Services, Copenhagen, Denmark, 24–27 August 2015; ACM: New York, NY, USA, 2015; pp. 327–336. [Google Scholar]
  39. Dobbelstein, D.; Henzler, P.; Rukzio, E. Unconstrained pedestrian navigation based on vibro-tactile feedback around the wristband of a smartwatch. In Proceedings of the 2016 CHI Conference Extended Abstracts on Human Factors in Computing Systems, San Jose, CA, USA, 7–12 May 2016; ACM: New York, NY, USA, 2016; pp. 2439–2445. [Google Scholar]
  40. Cassinelli, A.; Reynolds, C.; Ishikawa, M. Augmenting spatial awareness with Haptic Radar. In Proceedings of the 2006 10th IEEE International Symposium on Wearable Computers, Montreux, Switzerland, 11–14 October 2006; IEEE: Piscataway, NJ, USA, 2006; pp. 61–64. [Google Scholar] [CrossRef]
  41. Cardin, S.; Thalmann, D.; Vexo, F. A wearable system for mobility improvement of visually impaired people. Vis. Comput. 2007, 23, 109–118. [Google Scholar] [CrossRef] [Green Version]
  42. Franz, M.; Zeidler, A.; dos Santos Rocha, M.; Klein, C. Vibro-Tactile Space-Awareness. In Proceedings of the Tenth International Conference on Ubiquitous Computing, Seoul, Korea, 21–24 September 2008; pp. 117–120. [Google Scholar]
  43. Riener, A.; Ferscha, A. Raising awareness about space via vibro-tactile notifications. In Proceedings of the European Conference on Smart Sensing and Context, Zurich, Switzerland, 29–31 October 2008; Springer: Berlin, Germany, 2008; pp. 235–245. [Google Scholar]
  44. Morrell, J.; Wasilewski, K. Design and evaluation of a vibrotactile seat to improve spatial awareness while driving. In Proceedings of the 2010 IEEE Haptics Symposium, Waltham, MA, USA, 25–26 March 2010; pp. 281–288. [Google Scholar] [CrossRef]
  45. de Barros, P.G.; Lindeman, R.W. Performance effects of multi-sensory displays in virtual teleoperation environments. In Proceedings of the 1st Symposium on Spatial User Interaction (SUI ’13), Los Angeles, CA, USA, 20–21 July 2013; ACM Press: New York, NY, USA, 2013; p. 41. [Google Scholar] [CrossRef] [Green Version]
  46. Berning, M.; Braun, F.; Riedel, T.; Beigl, M. ProximityHat: A head-worn system for subtle sensory augmentation with tactile stimulation. In Proceedings of the International Symposium on Wearable Computers, Osaka, Japan, 7–11 September 2015; ACM: New York, NY, USA, 2015. [Google Scholar]
  47. Tsukada, K.; Yasumura, M. Activebelt: Belt-type wearable tactile display for directional navigation. In Proceedings of the International Conference on Ubiquitous Computing, Nottingham, UK, 7–10 September 2004; Springer: Berlin, Germany, 2004; pp. 384–399. [Google Scholar]
  48. Murata, A.; Kemori, S.; Moriwaka, M.; Hayami, T. Proposal of Automotive 8-directional Warning System That Makes Use of Tactile Apparent Movement. In Proceedings of the International Conference on Digital Human Modeling and Applications in Health, Safety, Ergonomics and Risk Management, Las Vegas, NV, USA, 21–26 July 2013; pp. 98–107. [Google Scholar]
  49. Telpaz, A.; Rhindress, B.; Zelman, I.; Tsimhoni, O. Haptic Seat for Automated Driving: Preparing the Driver to Take Control Effectively. In Proceedings of the 7th International Conference on Automotive User Interfaces and Interactive Vehicular Applications (AutomotiveUI ’15), Nottingham, UK, 1–3 September 2015; ACM: New York, USA, 2015; pp. 23–30. [Google Scholar] [CrossRef]
  50. Boll, S.; Asif, A.; Heuten, W. Feel your route: A tactile display for car navigation. IEEE Pervasive Comput. 2011, 10, 35–42. [Google Scholar] [CrossRef]
  51. Pielot, M.; Henze, N.; Heuten, W.; Boll, S. Evaluation of continuous direction encoding with tactile belts. In Proceedings of the International Workshop on Haptic and Audio Interaction Design, 31 August–1 September 2008; Springer: Berlin, Germany, 2008; pp. 1–10. [Google Scholar]
  52. Pielot, M.; Boll, S. Tactile Wayfinder: Comparison of tactile waypoint navigation with commercial pedestrian navigation systems. In Proceedings of the International Conference on Pervasive Computing, Helsinki, Finland, 17–20 May 2010; Springer: Berlin, Germany, 2010; pp. 76–93. [Google Scholar]
  53. Krüger, M.; Wersing, H.; Wiebel-Herboth, C.B. Approach for Enhancing the Perception and Prediction of Traffic Dynamics with a Tactile Interface. In Proceedings of the 10th International Conference on Automotive User Interfaces and Interactive Vehicular Applications (AutomotiveUI ’18), Toronto, ON, Canada, 23–25 September 2018; ACM Press: New York, NY, USA, 2018; pp. 164–169. [Google Scholar] [CrossRef]
  54. Krüger, M.; Wiebel-Herboth, C.B.; Wersing, H. The Lateral Line: Augmenting Spatiotemporal Perception with a Tactile Interface. In Proceedings of the AHs ’20: Augmented Humans International Conference, Kaiserslautern, Germany, 16–17 March 2020; ACM Press: New York, NY, USA, 2020. [Google Scholar] [CrossRef]
  55. Kassner, M.; Patera, W.; Bulling, A. Pupil: An Open Source Platform for Pervasive Eye Tracking and Mobile Gaze-based Interaction. In Proceedings of the 2014 ACM International Joint Conference on Pervasive and Ubiquitous Computing Adjunct Publication (UbiComp ’14 Adjunct), Seattle, WA, USA, 13–17 September 2014; ACM Press: New York, NY, USA, 2014; pp. 1151–1160. [Google Scholar] [CrossRef]
  56. Acik, A.; Bernhard, B.; Dombrowe, I.; Kringe, T.; Märtin, R.; Carl, C.; Honey, C.; Kabisch, C.; Jansen, L.; Lörken, C.; et al. FeelSpace—Report of a Study Project; Technical Report; University of Osnabrück: Osnabrück, Germany, 2005. [Google Scholar]
  57. Van Erp, J. Tactile navigation display. In Haptic Human-Computer Interaction, Proceedings of the First International Workshop Glasgow, UK, 31 August–1 September 2000; Springer: Berlin/Heidelberg, Germany, 2001; pp. 165–173. [Google Scholar]
  58. Kerdegari, H.; Kim, Y.; Stafford, T.; Prescott, T.J. Centralizing bias and the vibrotactile funneling illusion on the forehead. In Proceedings of the International Conference on Human Haptic Sensing and Touch Enabled Computer Applications, Versailles, France, 24–26 June 2014; Springer: Berlin, Germany, 2014; pp. 55–62. [Google Scholar]
  59. Cholewiak, R.W. Spatial factors in the perceived intensity of vibrotactile patterns. Sens. Process. 1979, 3, 141–156. [Google Scholar]
  60. Hoffmann, S.; Krüger, H.P.; Buld, S. Vermeidung von Simulator Sickness anhand eines Trainings zur Gewöhnung an die Fahrsimulation. VDI Berichte 2003, 1745, 385–404. [Google Scholar]
  61. Hogema, J.; De Vries, S.; Van Erp, J.; Kiefer, R. A Tactile Seat for Direction Coding in Car Driving: Field Evaluation. IEEE Trans. Haptics 2009, 2, 181–188. [Google Scholar] [CrossRef] [PubMed]
  62. Hayward, J.C. Near miss determination through use of a scale of danger. In Proceedings of the 51st Annual Meeting of the Highway Research Board, Washington, DC, USA, 17–21 January 1972; pp. 24–34. [Google Scholar]
  63. Van der Horst, A.R.A. A Time-Based Analysis of Road User Behaviour in Normal and Critical Encounters; Delft University of Technology: Delft, The Netherlands, 1991. [Google Scholar]
  64. Hart, S.G. Nasa-Task Load Index (NASA-TLX); 20 Years Later. Proc. Hum. Factors Ergon. Soc. Annu. Meet. 2006, 50, 904–908. [Google Scholar] [CrossRef] [Green Version]
  65. Van Der Laan, J.D.; Heino, A.; De Waard, D. A simple procedure for the assessment of acceptance of advanced transport telematics. Transp. Res. Part Emerg. Technol. 1997, 5, 1–10. [Google Scholar] [CrossRef]
  66. Verhaeghen, P.; Salthouse, T.A. Meta-analyses of age–cognition relations in adulthood: Estimates of linear and nonlinear age effects and structural models. Psychol. Bull. 1997, 122, 231. [Google Scholar] [CrossRef]
  67. Laurienti, P.J.; Burdette, J.H.; Maldjian, J.A.; Wallace, M.T. Enhanced multisensory integration in older adults. Neurobiol. Aging 2006, 27, 1155–1163. [Google Scholar] [CrossRef]
  68. Kramer, A.F.; Cassavaugh, N.; Horrey, W.J.; Becic, E.; Mayhugh, J.L. Influence of age and proximity warning devices on collision avoidance in simulated driving. Hum. Factors 2007, 49, 935–949. [Google Scholar] [CrossRef]
Figure 1. Driving simulator setup in the foggy tunnel scenario. The experimenter screen (bottom left) shows a visualization of the tactile stimuli. In this visualization (magnified in the white box on the right side) the location of a dark dot corresponds to the current direction communicated via a tactile stimulus and the size of the dot indicates the intensity of the respective stimulus. Black bars mark the boundaries between which stimuli oscillate dependent on the current range of spatial uncertainty. This visualization was not available to participants.
Information 11 00353 g001
Figure 2. (Left) Schematic of the belt in an example situation where from every left and center lane direction an object (large gray dot) is approaching with a time to collision (TTC) value under nine seconds. Vibromotors nr. 0, 14, 8 and 11 (small grey dots) would activate in this case. If the ego-vehicle drove on the left lane, the activations would occur at vibromotor 0, 2, 5 and 8. Note that the selected vibromotors on the rear were spaced two instead of one gap apart to account for differences in spatial discriminability between dorsal and ventral regions [47,57]. (Right) Photograph of the tactile waist belt (© feelSpace GmbH).
Information 11 00353 g002
Figure 3. Uncertainty signal for an object approaching from the front on a two-lane road (A). Grey dots indicate possible locations of the approaching vehicle as signaled by the system. The stimulus traveled between the borders and bounced back in the other direction as it hit one of the borders (B). The width of the range was chosen to be between the vibromotors that were allocated for the static signal (Figure 2) plus one extra vibromotor on each side. Thus, in the example in this image, the signal bounced between vibromotors 13 and 1.
Information 11 00353 g003
Figure 4. Overview of five experimental conditions with corresponding ranges for human vision and machine sensors. Colors are assigned to individual conditions to facilitate condition mapping of the results. For machine uncertain conditions (blue and green), the light colors mark conditions without uncertainty communication while their dark counterparts indicate uncertainty communication.
Information 11 00353 g004
Figure 5. Visibility in the foggy scenarios. Vehicles disappear at a distance of approximately 33 m.
Information 11 00353 g005
Figure 6. Traffic definition in the rain (machine uncertain-human certain condition (MU-HC)) scenarios. Five vehicles were driving on the right lane at 80 km/h, spaced 250 m apart (I). The ego-vehicle could maintain the target speed (120 km/h) by overtaking the vehicles. When the front truck (E) was overtaken, a trigger point was activated that made the trailing cars B, C, and D switch to the left lane, and adjust their speed to 160 km/h (II). This resulted in B, C and D eventually overtaking the ego-vehicle from the rear. When D passed the ego-vehicle (III), the leading vehicle (A) accelerated to 160 km/h, and it changed to the left lane if it came within a distance of 30 m of the ego-vehicle.
Information 11 00353 g006
Figure 7. Predicted outcome of subjective evaluations according to our research hypotheses when assuming successful experimental manipulations. Usefulness and satisfaction: Symbols +,0 are used to illustrate the predicted valuation. Relative workload predictions were given verbally. For machine uncertain conditions (blue and green), the light colors mark conditions without uncertainty communication. Their dark counterparts indicate uncertainty communication.
Information 11 00353 g007
Figure 8. Predicted outcome of behavioral measures according to our research hypotheses when assuming successful experimental manipulations through the introduced conditions. For machine uncertain conditions (blue and green), the light colors mark conditions without uncertainty communication. Their dark counterparts indicate uncertainty communication.
Information 11 00353 g008
Figure 9. Median agreement ratings (square) and 25th and 75th percentiles on a custom 5-point Likert scale questionnaire. SD = Strongly Disagree, D = Disagree, N = Neutral, A = Agree, SA = Strongly Agree.
Information 11 00353 g009
Figure 10. Results of subjective measures for different conditions. Conditions are visually represented by distinct colors. For machine uncertain conditions (blue and green), the light colors mark conditions without uncertainty communication. Their dark counterparts indicate uncertainty communication. (a) Mean usefulness, satisfaction, and NASA TLX scores for each condition. Standard deviations are shown in brackets. Asterisks indicate statistically significant differences between conditions linked by brackets; (b) Mean usefulness and satisfaction scores of the assistance functionality in MC-HU (Foggy Road), MU-HU-uc (Foggy Tunnel), MU-HC-uc (Rain), MU-HU (Foggy Tunnel, no UC), MU-HC (Rain, no UC). Error bars display the standard deviation; (c) NASA Raw TLX scores per condition. Scores of individual questions were averaged to obtain the overall RTLX score in the range [0,100].
Information 11 00353 g010
Figure 11. Results of objective measures for different conditions. Conditions are visually represented by distinct colors. For machine uncertain conditions (blue and green), the light colors mark conditions without uncertainty communication. Their dark counterparts indicate uncertainty communication. (a) Mean front gaze ratios and MTTC scores for each applicable condition. Standard deviations are shown in brackets. Asterisks indicate statistically significant differences between conditions linked by brackets; (b) Gaze ratio for conditions in which the machine was uncertain and for trials in which vehicles were approaching from the rear. Lower values indicate more gazing towards the mirrors. Due to failed eye tracking recordings, n = 13 (instead of 14) for all conditions; (c) Gaze ratio for conditions in which the machine was uncertain and for trials in which vehicles were approaching from the front.
Information 11 00353 g011
Figure 12. Minimum Time-to-Contact (MTTC) scores for human-uncertain conditions (n = 14).
Information 11 00353 g012

