Article

Classroom Attendance Systems Based on Bluetooth Low Energy Indoor Positioning Technology for Smart Campus

by
Apiruk Puckdeevongs
1,*,
N. K. Tripathi
1,
Apichon Witayangkurn
1 and
Poompat Saengudomlert
2
1
Remote Sensing and Geographic Information Systems Field of Study, School of Engineering and Technology, Asian Institute of Technology, P.O. Box 4, Klong Luang, Pathumthani 12120, Thailand
2
Telecommunications Field of Study, School of Engineering and Technology, Asian Institute of Technology, P.O. Box 4, Klong Luang, Pathumthani 12120, Thailand
*
Author to whom correspondence should be addressed.
Information 2020, 11(6), 329; https://doi.org/10.3390/info11060329
Submission received: 3 May 2020 / Revised: 11 June 2020 / Accepted: 16 June 2020 / Published: 19 June 2020
(This article belongs to the Special Issue Indoor Navigation in Smart Cities)

Abstract

:
Student attendance during classroom hours is important, because it impacts the academic performance of students. Consequently, several universities impose a minimum attendance percentage criterion for students to be allowed to attend examinations; therefore, recording student attendance is a vital task. Conventional methods for recording student attendance in the classroom, such as roll-call and sign-in, are an inefficient use of instruction time and only increase teachers’ workloads. In this study, we propose a Bluetooth Low Energy-based student positioning framework for automatically recording student attendance in classrooms. The proposed architecture consists of two components, an indoor positioning framework within the classroom and student attendance registration. Experimental studies using our method show that the Received Signal Strength Indicator fingerprinting technique that is used in indoor scenarios can achieve satisfactory positioning accuracy, even in a classroom environment with typically high signal interference. We intentionally focused on designing a basic system with simple indoor devices based on ubiquitous Bluetooth technology and integrating an attendance system with computational techniques in order to minimize operational costs and complications. The proposed system is tested and demonstrated to be usable in a real classroom environment at Rangsit University, Thailand.

1. Introduction

In academic institutions, recording student attendance consumes a significant amount of time per classroom session. Further, recording the actual time for which each student is present is time consuming, when considering the typical number of students in a batch, and such information when recorded is usually inaccurate [1]. Nevertheless, recording student attendance is a common practice in many schools and universities, especially for those that implement a mandatory attendance policy [2,3,4]. In particular, the education system in Thailand attaches significant importance to student attendance in the class across all educational levels. At the undergraduate level, such as for science or engineering, the policy enforces a minimum of 80% attendance for a particular course or laboratory to permit students to write an end of term examination [5].
Prior research [6] shows a strong relationship between regularity in classroom attendance and academic performance. Therefore, institutions enforce a policy of recording student attendance in classrooms, which instructors manually perform. However, this traditional process of attendance recording suffers from drawbacks and is prone to errors. In recent years, systems have been developed to automate this process in classrooms using various technologies to save relevant instruction time and improve the reliability of attendance reports. The biometric systems [7,8] have been widely proposed, but they still have limitations in terms of the cost of installation and the time-consuming process of attendance registration.
In such a scenario, the role of technology must be to provide a smart learning environment, through connected sensors and devices, create innovation and enhance learning activities [9]. Therefore, technology must be used to facilitate the growth of student potential and to unburden the teachers from time-consuming manual activities. Bluetooth, owing to its low power consumption and cost [10], is the most commonly used radio frequency (RF) technology for automatically capturing the actual time of students’ attendance [11]. Further, being one of the most widely used technologies in mobile phones, wireless headsets, and wearable devices, it is an on-demand platform for everyone to use anywhere.
In this study, we propose the system to contribute framework for the class attendance system with indoor positioning technology. Bluetooth Low Energy (BLE) technology was utilized for indoor location tracking by determining the relationship between mobile phones position and the RSSI. However, this is challenging to calculate in indoor areas, because it is not possible to directly use an error model for free-field propagation, owing to boundary conditions, reflections, and walls [12]. Our approach is based on the fingerprinting algorithm, combined artificial neural networks (ANN) with the radial basis function (RBF). The server is responsible for calculating positions and recording attendance information. The system automatically gathers signals from users’ smartphones in the closed environment (classroom) and they are applied in real situations as follows.
  • We record the attendance of students with their positions in the classroom using our proposed system.
  • We store all of the gathered information in a database and display it in a web application each course (including calculations for absence or late attendance, per week, and per term).
The system achieves good positioning accuracy even in a classroom environment where signal interference is typically high, and the study demonstrates the system’s usability.
The rest of this paper is organized, as follows. In Section 2, we discuss related work on classroom attendance and indoor positioning techniques. In Section 3, we then present our proposed method, including the architecture of the system. In Section 4, we describe the procedure and results of the experiment that we performed to test the proposed method. Finally, in Section 5, we discuss and summarize the conclusions of the study.

2. Related Work

2.1. Class Attendance

In this section, we review relevant research on class attendance and technologies that have been used in class attendance recording systems. Class attendance is important from an academic performance perspective, as outlined in the previous section. A study by Stanca [13] over a large dataset reveals a positive correlation between class attendance and academic performance. Moreover, Quantile Regression Analysis [14] demonstrates the negative impact of class absence on academic performance.
One approach to developing class attendance systems is through the use of RF identification (RFID) or near-field communication (NFC) technologies. For example, the study in [15] applied RFID technology in an attendance system by developing a Java application for this purpose (by Nippon Systems Development [16]). This particular application builds links among data collected from RFID devices to automatically register attendance and record entries into the database. In general, RFID special tags are embedded into students’ identity cards. Therefore, students are required to display their student identity cards and scan them over a reader. A drawback with such a procedure, however, is that anyone can use the identity cards. Therefore, it is not sufficient to validate the student’s identity for recording his or her attendance. In the research conducted by Ichimura et al. [17], students are required to scan their cards over the NFC tag on their smartphones which contains the student’s picture. Class Attendance Management System (CAMS) prototype has been developed and introduced by Mohandes [18]. CAMS evaluates the attendance using a mobile device with Near-field communication (NFC) technology enabled and NFC (or RFID) tag/card. The known drawback for the class attendance system using NFC or RFID is that it requires additional preparation and equipment installation.
Recently, BLE has garnered significant attention among researchers as a technology for short-range communication between nodes of a network and it has also been studied for its potential in classroom attendance systems. In 2013, a student attendance system based on Bluetooth and RFID was developed by Bhalla et al. [19]. In this system, student information is first collected via an RFID reader, and the class assistant or professor can then view the student attendance by using a desktop or laptop connected to the system. In 2015, Lodha et al. [20] developed an attendance management system application with Bluetooth-enabled devices. Their system requires Bluetooth electronic tags that can be embedded into student ID cards. This system improves efficiency, as it can work with a wireless network while using Bluetooth technology, thereby removing the necessity for students to display their cards over a reader. In 2016, Apoorv and Mathur [21] developed a system that assists the teacher to collect student attendance in the classroom. The students need to bring their student ID card (which has e-stimote [22] sticker beacons attached) to the classroom, and the system uses BLE beacons planted in the classroom to detect the student identity and attendance. However, the teacher still needs to manually extract attendance information using the application on an Android device that connects to the BLE beacon and collects the sensor data.
Some attendance systems require the installation of an application on students’ mobile devices to gather attendance information. In 2016, Saraswat and Garg [23] developed an application using beacons for faculty admin tasks. This system directly notifies and interacts with students via web links and an application. Moreover, during the class, students’ attendance information is automatically gathered by the system based on their location in the classroom. The system runs a clock timer (in the application background) when the student is close to the beacon (near and immediate). The computation in this system is primarily performed on the student’s smartphone. This requires a significant amount of processing on the student’s mobile phone. Further, an inherent disadvantage of such a system is that it requires the student to install and maintain an additional application.
Many prior techniques for recording classroom attendance require either using additional equipment, such as NFC or RFID, or installing additional applications by the students. In our proposed system, we chose to utilize already existing equipment in order to minimize operational costs and complications, by leveraging indoor localization techniques.

2.2. Indoor Location Positioning

Despite its unreliability in indoor environments, GPS has proven to be a successful technology and it is commonly used in location tracking systems. However, for recording classroom attendance, we require student location tracking in indoor environments within the university campus. Therefore, GPS is not a suitable technology for classroom attendance systems.
Location tracking in indoor environments has recently garnered significant interest among researchers. Several technologies have been invented and leveraged for indoor location tracking, such as image processing, RFID, Wi-Fi, magnetic sensors, and BLE [24]. The cost of these technologies (with the exception of BLE) is typically high, and all of them require the installation of additional equipment or devices in the target environment. BLE (Bluetooth version 4.0+), also known as Bluetooth Smart, enables Bluetooth signals in personal devices. BLE introduces energy saving features and it can last for very long periods of time [25]. Therefore, in this study, we adapted BLE technology on personal and mobile devices to develop an indoor positioning system.

2.2.1. Bluetooth Based Indoor Positioning

For student attendance monitoring in the classroom, we chose Bluetooth in our system because of two primary reasons.
  • Devices with Bluetooth capability are commonplace today, such as mobile phones, smart watches, Bluetooth tags, and smart wearable devices.
  • Bluetooth is able to transmit a small amount of data with ultra-low power consumption.
Because students have to identify themselves by their personal devices, each student needs to be actually present in the classroom. The signal strength can vary, depending on the distance and intensity of the Bluetooth signal emitted by the device used in indoor location tracking. Indoor positioning systems typically adopt either trilateration or fingerprinting-based approaches.

2.2.2. Trilateration

The trilateration technique estimates the distance by translating RSSI. At least three Bluetooth reference points (devices) are required in the same area to calculate the receiver location. In addition, the location of the reference points must be clearly defined. A challenge with this technique is that obstacles or attenuations in the target area can significantly affect the estimation or the RSSI value at the receiver [26]. Because it is common for classrooms to contain furniture or large objects, these can significantly interfere with the signal at the receiver device. Modeling the environment with a perfect path loss coefficient can be complicated in such a case.

2.2.3. Fingerprinting

The fingerprinting technique consists of two steps [27]. First, all of the RSSI values at the reference point are collected as a vector from predefined locations throughout the space in the classroom. Subsequently, the receiver detects the RSSI value from the device. At this point, the RSSI vector is compared with the RSSI vector previously recorded, and location estimates can be calculated by a variety of algorithms. Because fingerprinting considers the variations in RSSI values, it is a feasible technique for classroom environments. This technique is used in an improvement of the RSSI collecting process as well as the overall accuracy by taking into account the device proximity, device movement, and temporal sampling.

3. Materials and Methods

3.1. Experiment Environment

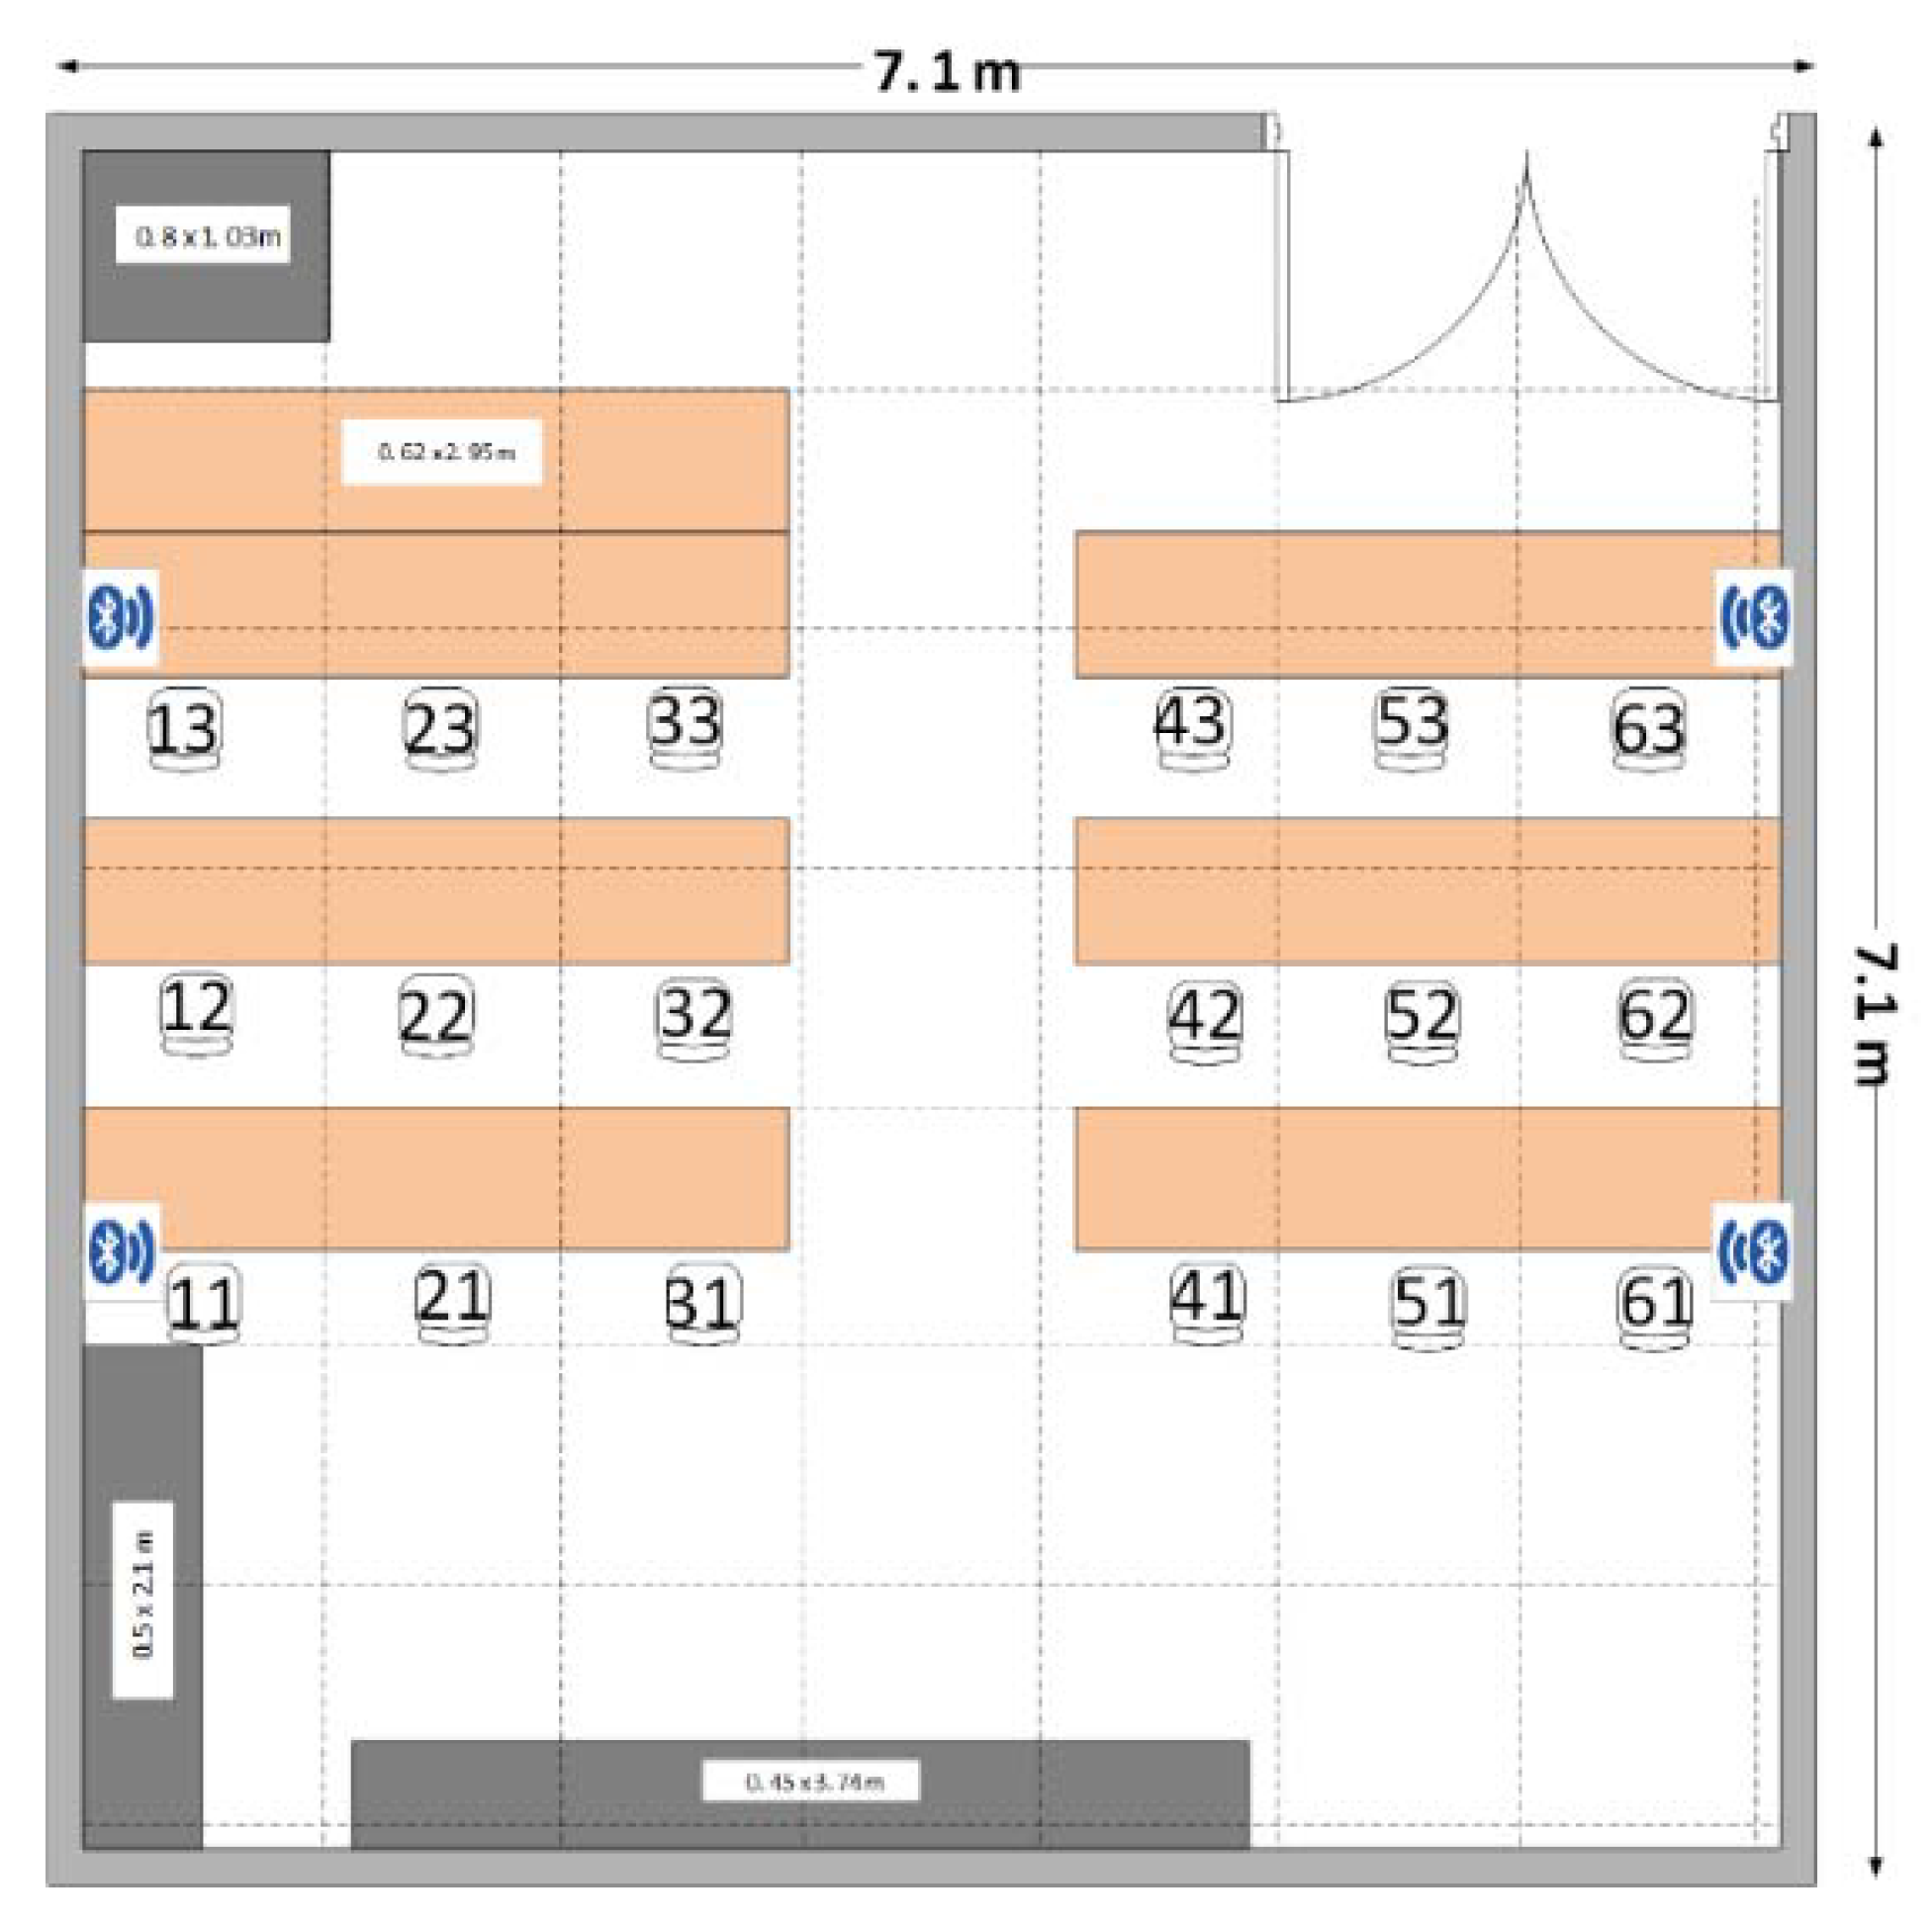
In this study, we designed and evaluated the proposed class attendance system in the computer laboratory in Rangsit University. The experimental room was a common classroom in the university. Three types of classrooms were used in this research. The first one (type I) was a laboratory classroom. The dimensions of the room were approximately 7.2 m × 9.5 m, with a total area of 68.6 m2. This type of classroom contained lab tables, chairs, desktop computers, and cabinets. Four stations with fixed Bluetooth sensors were installed on both of the longer sidewalls of the room. The four fixed stations were intentionally redundant to ensure that all students’ mobiles could connect with Bluetooth sensors, as shown in Figure 1. The signals that were received from the Bluetooth sensors (installed at a height of 2.2 m) were quite stable because of minimal interference from ground objects (such as tables, chairs, laboratory equipment, or humans). The type I classroom was used in our evaluation methodology for the development of the framework of the class attendance system and the identification of students’ locations in the classroom using Bluetooth RSSI.
The second type of classroom (type II) was also a common room with dimensions of 7 m × 7 m (total 49 m2), as shown in Figure 2. The room contained desktop computers, laboratory tables, network device racks, and chairs. The framework was similarly developed and evaluated following the type I. The experiment conducted in classroom type II is our implementing case study, since the framework was applied during an actual course.
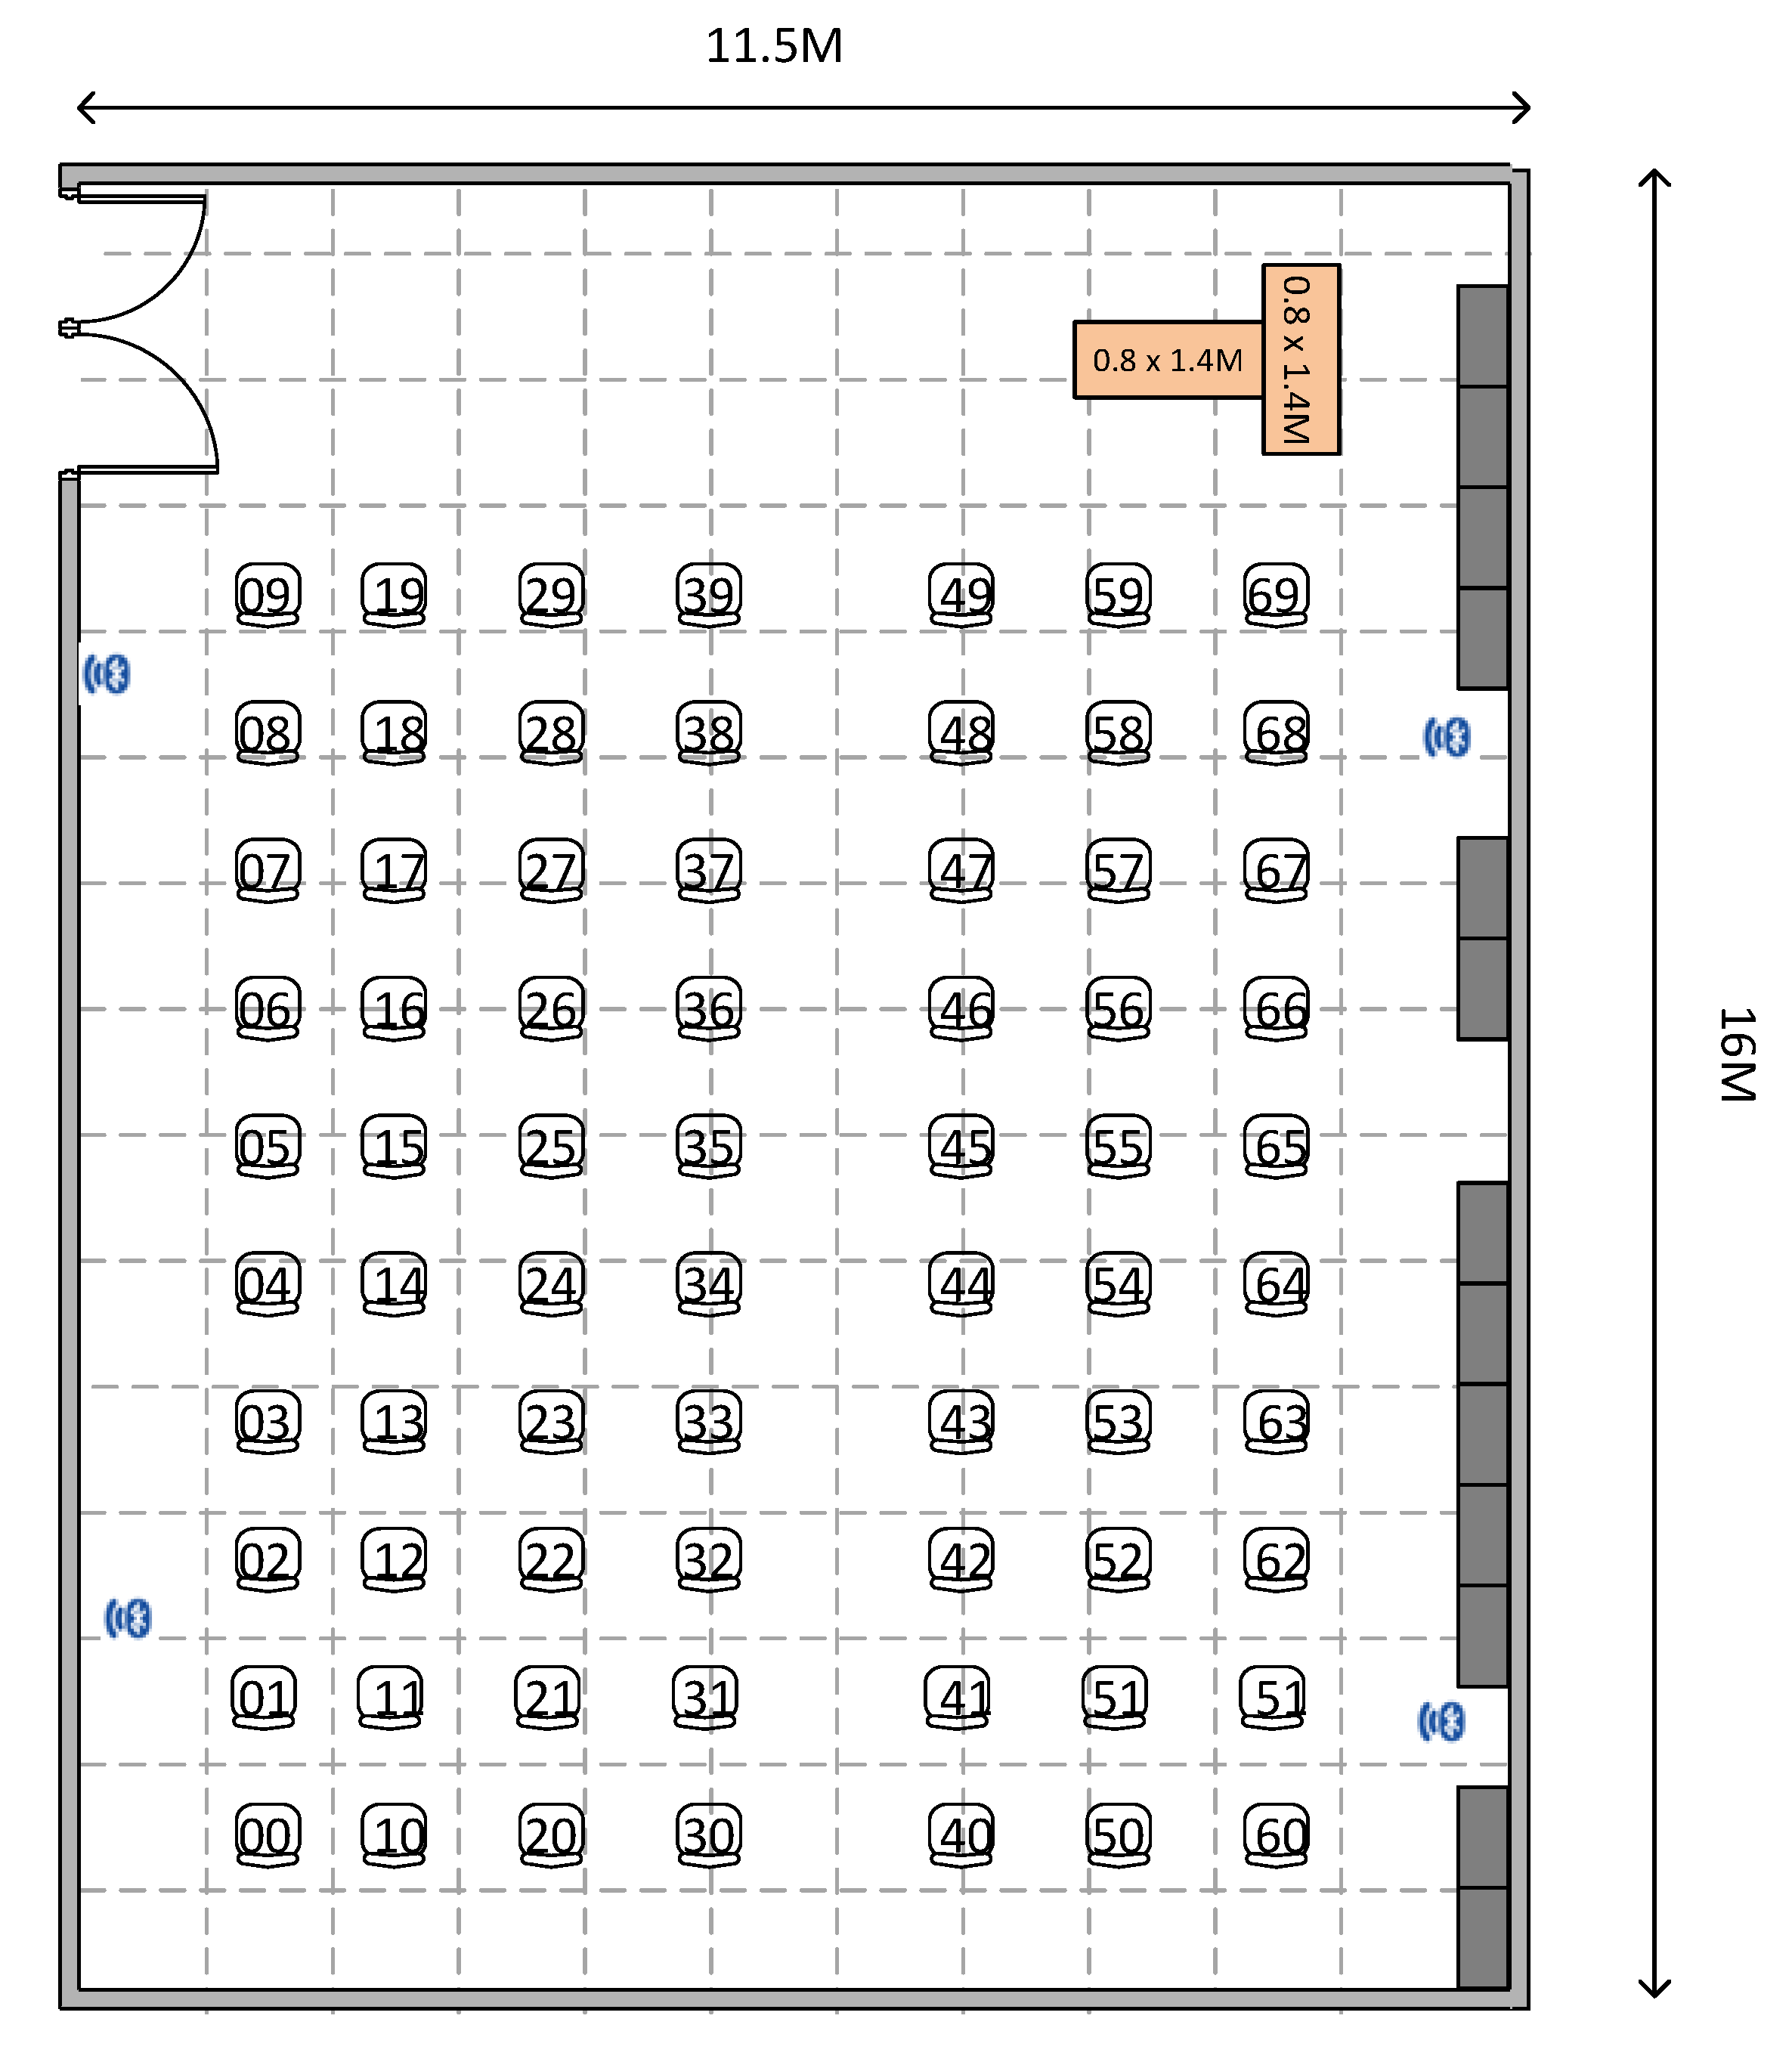
The last type of classrooms (type III) was the largest lecture room with dimensions of 11.5 m × 16 m (total 184 m2), which can typically contain up to 70 students. The room contained a lecturer’s table, student chairs, and cabinets, as shown in Figure 3. The experiment that was conducted in classroom type III was also applied to an actual classroom. All three types are located at the computer engineering faculty in Rangsit university.

3.2. System Architecture

The proposed architecture in this study consists of two parts, a general classroom attendance prototype and supporting measures for the integration of the model with daily operations of smart classrooms. The smart classroom prototype was designed based on our study and the Rangsit Smart Classroom project. The supporting measures, in terms of technology, are concepts and rules that are necessary for smart classroom operations of the proposed model.
This study focuses on developing a novel application with BLE signals, which can recognize a user’s identity and track the location or position of the recognized user. The user’s smart device can be used as a positioning system in the BLE indoor environment. Position information collected from the user’s location is automatically updated. We consider the gathering of students’ attendance information for a lecture session as a scenario for the direct application of this system. In the traditional approach, when a student walks into the classroom, a professor marks the student’s presence (either on paper or an application). This process is time consuming, and the collected data need to be manually processed and analyzed to provide insights on students, classes, and subjects. Meanwhile, the proposed system automatically calculates the locations of students that are present in the classroom. The information is directly fed into the professor’s interface to facilitate insights and decisions on classroom evaluations and examinations. This is a very innovative way of registering both the attendance and the location at any given time. This kind of information on location mapping of attendance records is very useful for large classrooms with large number of students.
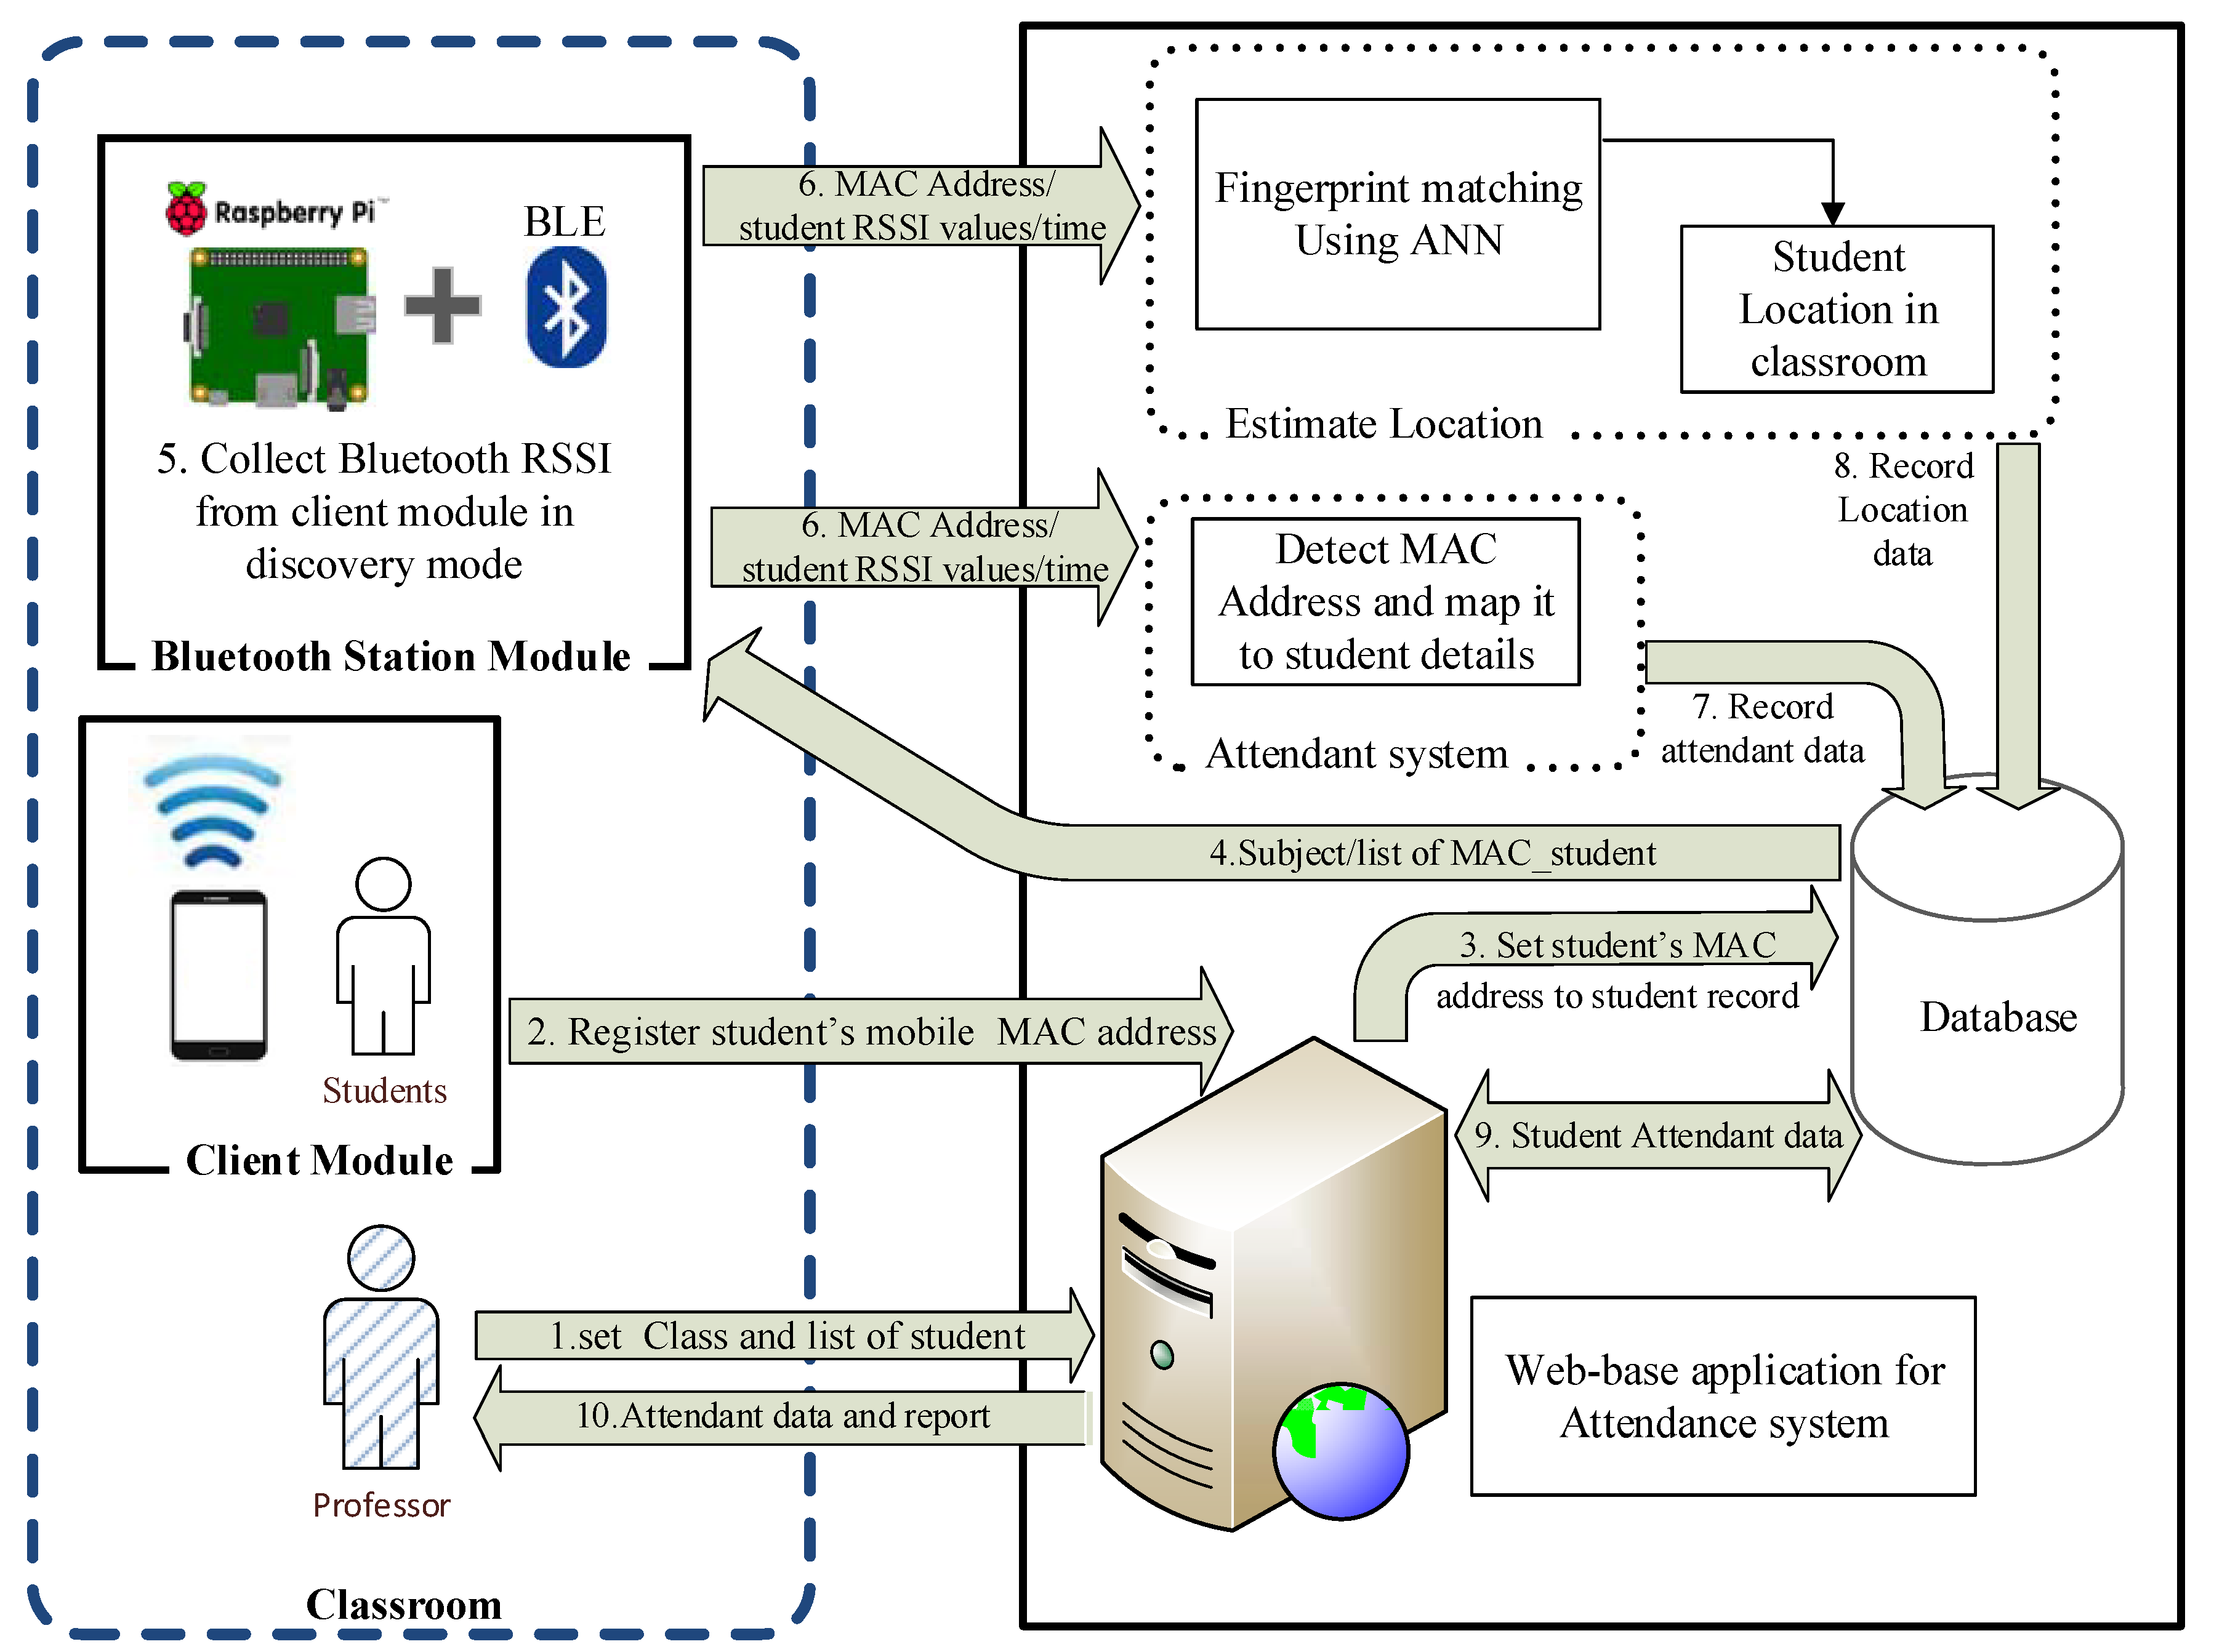
Figure 4 illustrates the attendance monitoring system, which is designed for recording student attendance and student locations in a classroom. The system utilizes Bluetooth signals from students’ mobile phones, and device identification information, such as the device media access control address (MAC), is captured to determine student identity.
The sensors used in this system are referred to as Bluetooth stations (running on Raspberry Pi with BLE), which are used to measure and collect the RSSI of the students’ devices from the four reference points to calculate the students’ position in the classroom.
The Bluetooth station node is the BLE hardware that is installed in the classroom, which sends out Bluetooth signals and it is referenced for position identification of a particular student in the classroom. This works in the discovery (scanning) mode on the Bluetooth device of the student in the classroom and collects the BLE MAC address as well as the BLE RSSI from the returned message of the Bluetooth packet. The discovery mode keeps constantly searching for BLE devices nearby. When a student walks into a classroom (broadcasting area) with his or her smart device, his device gets recognized by the Bluetooth station node. Subsequently, the Bluetooth station node device sends the user’s BLE MAC address for recording in the database. Moreover, the Bluetooth station node sends the signal strength of BLE RSSI to the Estimate Location Systems to calculate the user’s position in the room before sending it to the database. The Bluetooth station sends the MAC address to mark the user’s presence and sends RSSI with the MAC address for user position estimation. The system consists of three parts: server module, Bluetooth station module, and client module.

3.2.1. Server Module

The student attendance system was designed to work with a Bluetooth station module (acting as a Bluetooth sensor) that was installed in the classroom. The sensors read RSSI from students’ mobile devices via the hypertext transfer protocol (HTTP) over the network. The student attendance system consists of two major components. The first component, the attendance recording module, was developed as a web application using PHP: Hypertext Preprocessor (PHP) over XAMPP 7.2.4 with a MySQL database. The second component, the positioning calculation module, uses the MATLAB application for model training and ANN for calculations.

3.2.2. Bluetooth Station Module

The sensor system was developed with the Python programming language over Raspberry Pi (RPI 3 Model B with Raspbian kernel 4.4.38-v7), equipped with Bluetooth USB dongles. This module periodically collects information, such as Bluetooth addresses and signal strength from mobile devices in the target area, before submitting the information to the server module. The server module then uses the information to calculate the locations of students in the classroom. The sensors were distributed on the walls of the classroom, as this facilitates convenient connection with the local area network (LAN) and power line.

3.2.3. Client Module

The client device refers to a student’s mobile phone with the Bluetooth service enabled and set to visible. The system scans nearby devices and read RSSI value with student identity (such as mapped MAC address) from the student’s mobile phone to stamp the attendance for the particular student.

3.3. Participant

A total of 23 students from the Computer Engineering and Computer Science Schools, Rangsit University, Thailand, participated in the study. The participants were all students of two subjects in the classrooms that were chosen as the experimental area. Every session, the systems recorded the attendance data of all the students.

3.4. Student Attendance Mechanism

The student attendance system uses the signal strength from the Bluetooth devices in the users’ mobile phones received at the Bluetooth station module within the classroom. The mobile phones do not require any installation or setup, and only the Bluetooth functionality needs to be turned on. The Bluetooth RSSI from the students’ mobiles were read in the discovery mode or inquiry mode. This mode does not require a connection to be established between the source and destination. When the mobile node encounters a Bluetooth device in the range, it immediately reads the Bluetooth RSSI value from the device. The software in the Bluetooth station was developed based on the Python programing language, which Figure 5 illustrates.

3.5. Location Estimation Framework

The positioning system utilizes the RSSI technology for the measurement process, with Bluetooth stations being distributed in the classroom. We adapted the fingerprint localization methods based on ANNs [26] to enable the ANNs to tolerate noisy RSSI measurements and, therefore, ensure accurate position calculations. This positioning system does not require detailed information regarding the indoor environment and reference node locations. The system interpolates the collected information in the fingerprint database to provide a mapping between the multi-dimensional fingerprints space and the coordinates of nodes. The pattern matching process comprises two important stages. First, the offline stage consists of a survey and construction of a radio map, which represents the distribution of the signal strength over the target area. The purpose of this stage is to build a fingerprint database, beginning from gathering fingerprints across the target territory by performing a survey using different Bluetooth reference points. Second, the online stage is the real-time or positioning phase. In this phase, the system also calculates the area of the transmitter to be recorded in the database. The online phase estimates the location of the devices using ANNs.
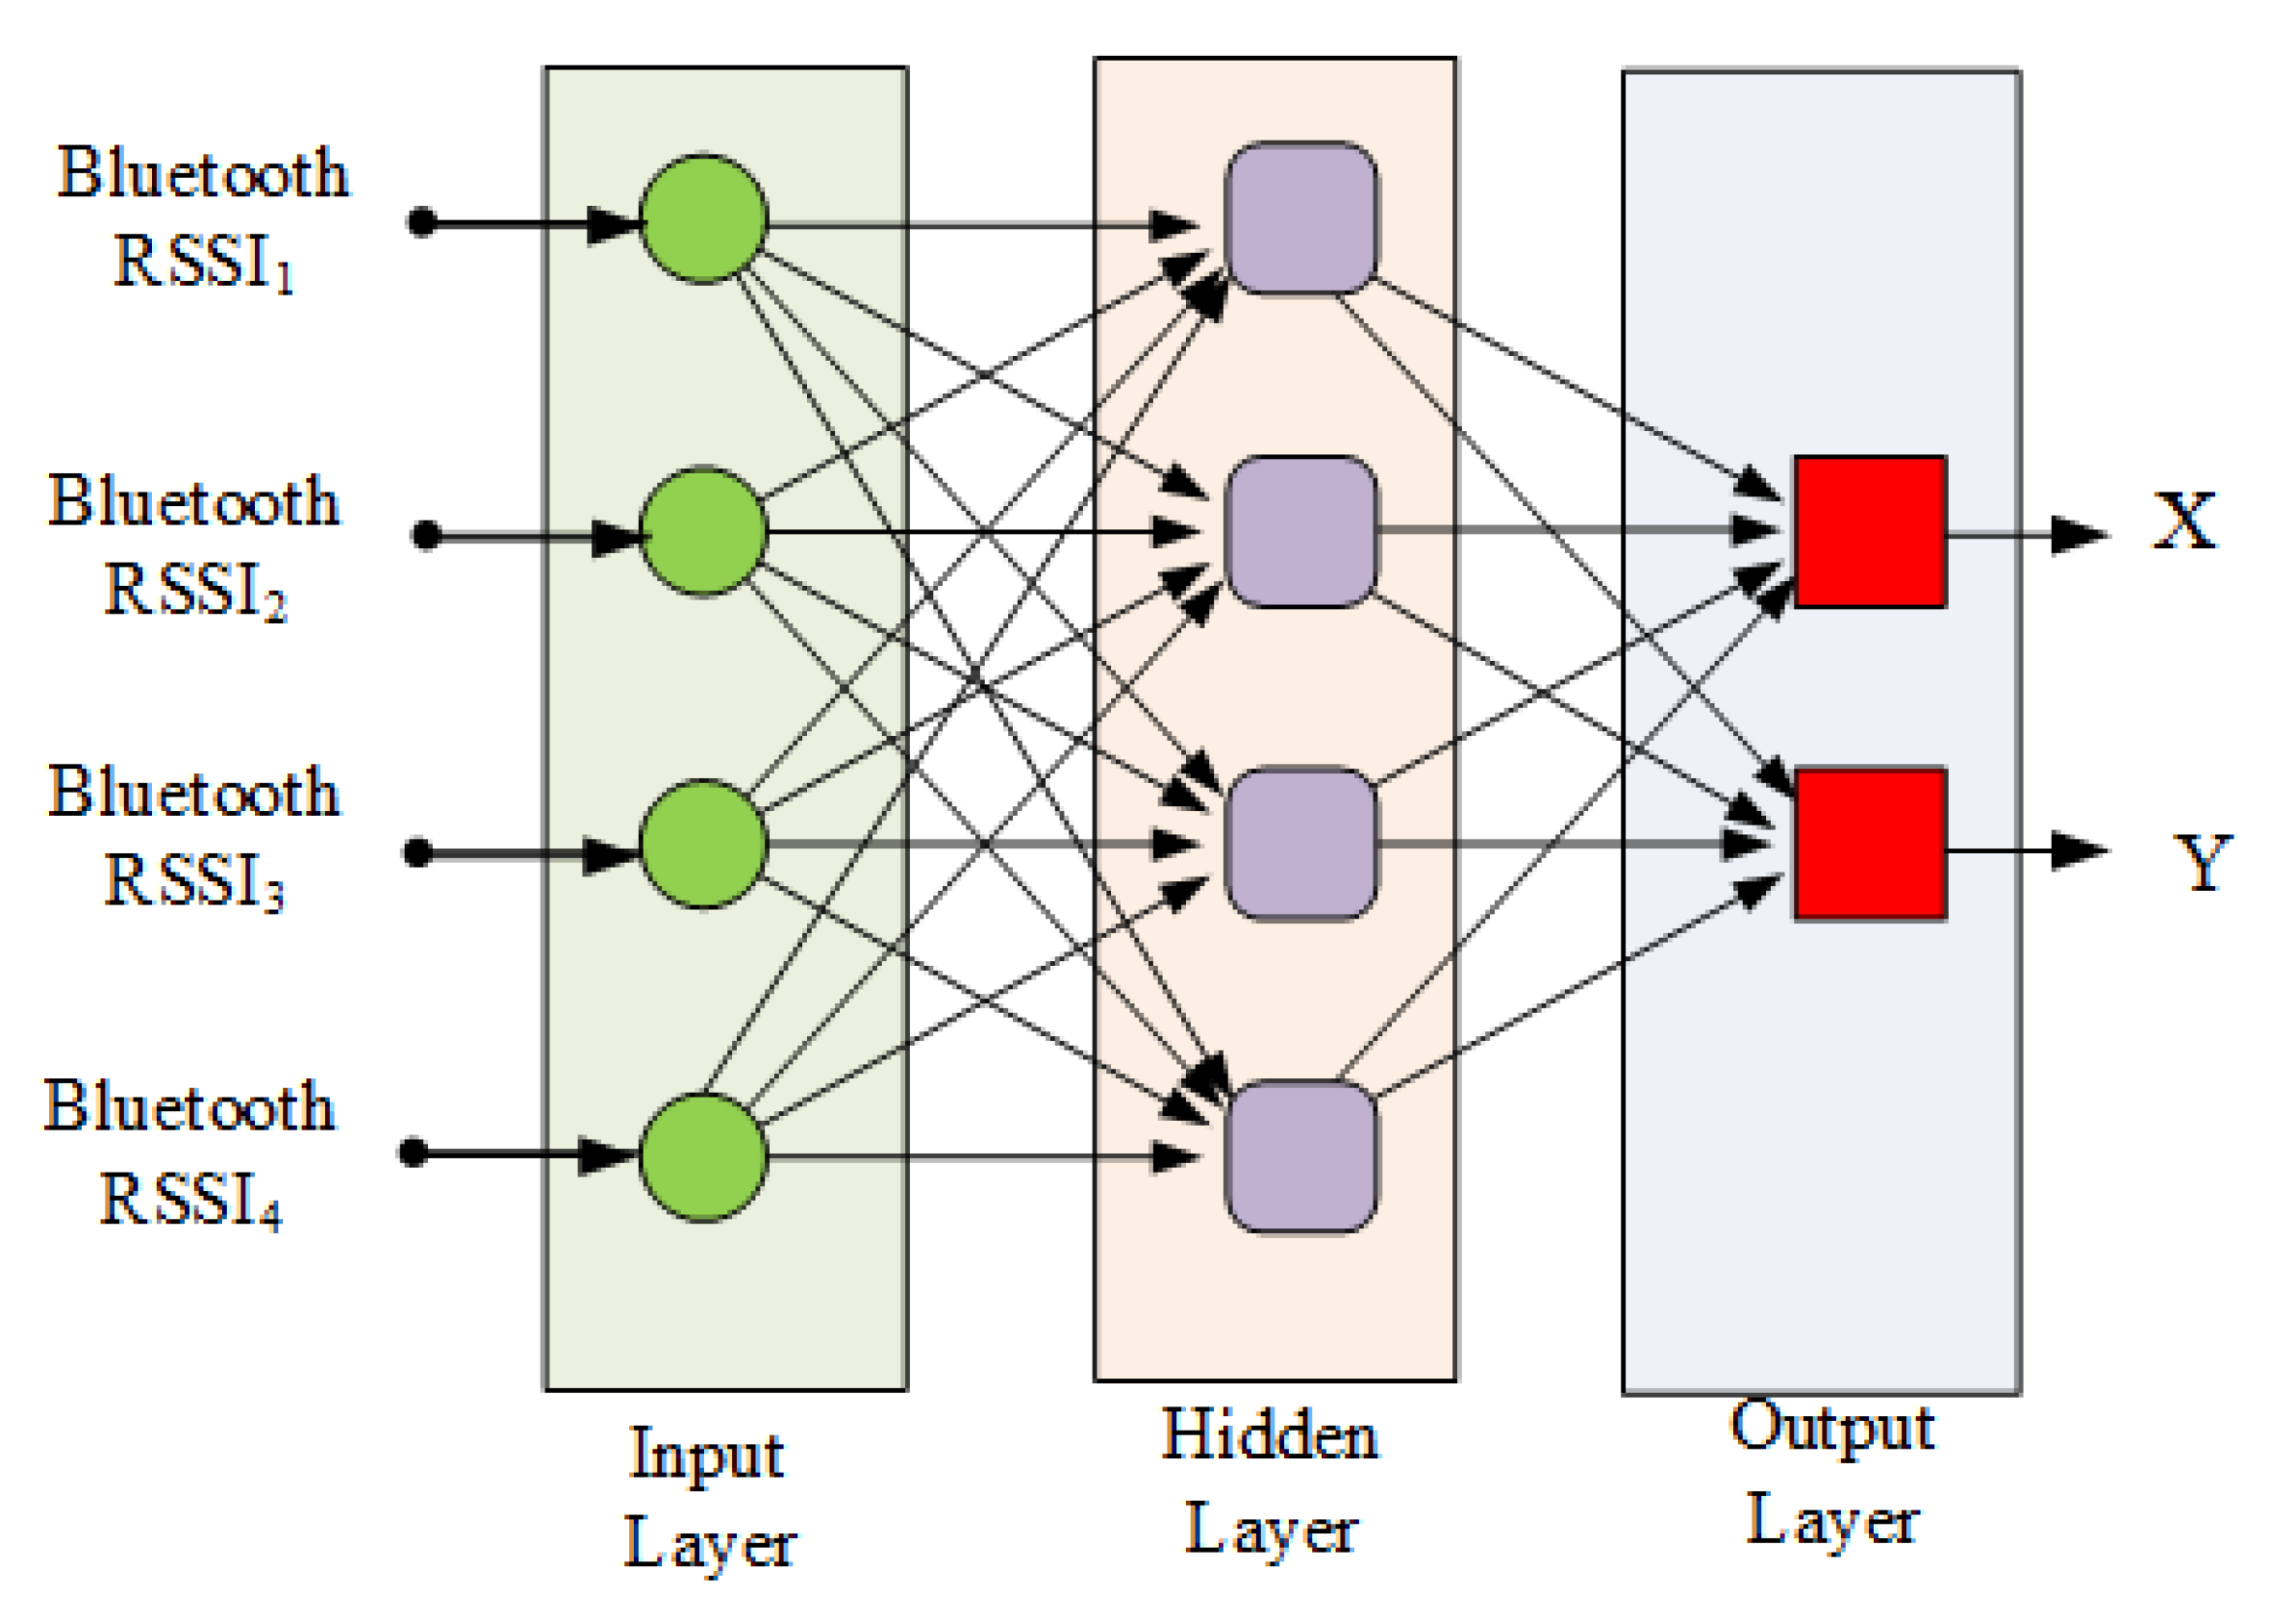
The ANN is used to establish the relationship between pattern of RSSI samples and locations. A trained ANN can perform complex tasks, such as classification, optimization, control, and function approximation. The network structure consists of four inputs (received RSS from four Bluetooth reference points) and outputs with two neurons (corresponding to the x and y locations of the user), and one hidden layer with different number of neurons. In this study, we optimized the smallest network (when considering the number of nodes in the hidden layer) that yields the acceptable accuracy in the experimental room via trial and error. Figure 6 illustrates the structure of the feedforward multilayer perceptron (FF-MLP) ANN used in this study.

3.5.1. Data Collection

In this experiment, there are four Bluetooth stations in the experimental area. This ensures that all positions in the experimental area have sufficient strength and frequency in terms of Bluetooth RSSI. Therefore, the data collection for location estimates in this study can be divided into two components:
  • The RSSI data for every point in the experimental site were collected with the four Bluetooth reference nodes.
  • At each point, the RSSI was collected by moving the mobile around (the experimenter hold the receiver in front and turns toward north, south, east, and west).
This process is repeated 100 times at each coordinate point where the mobile device is located. The dataset in this study contains two parts. The first dataset with 540 samples is used as the training dataset for the ANN model. The second dataset with 324 samples is used for testing. The total collected for observation is 864 samples.

3.5.2. Location Estimation Module Structure

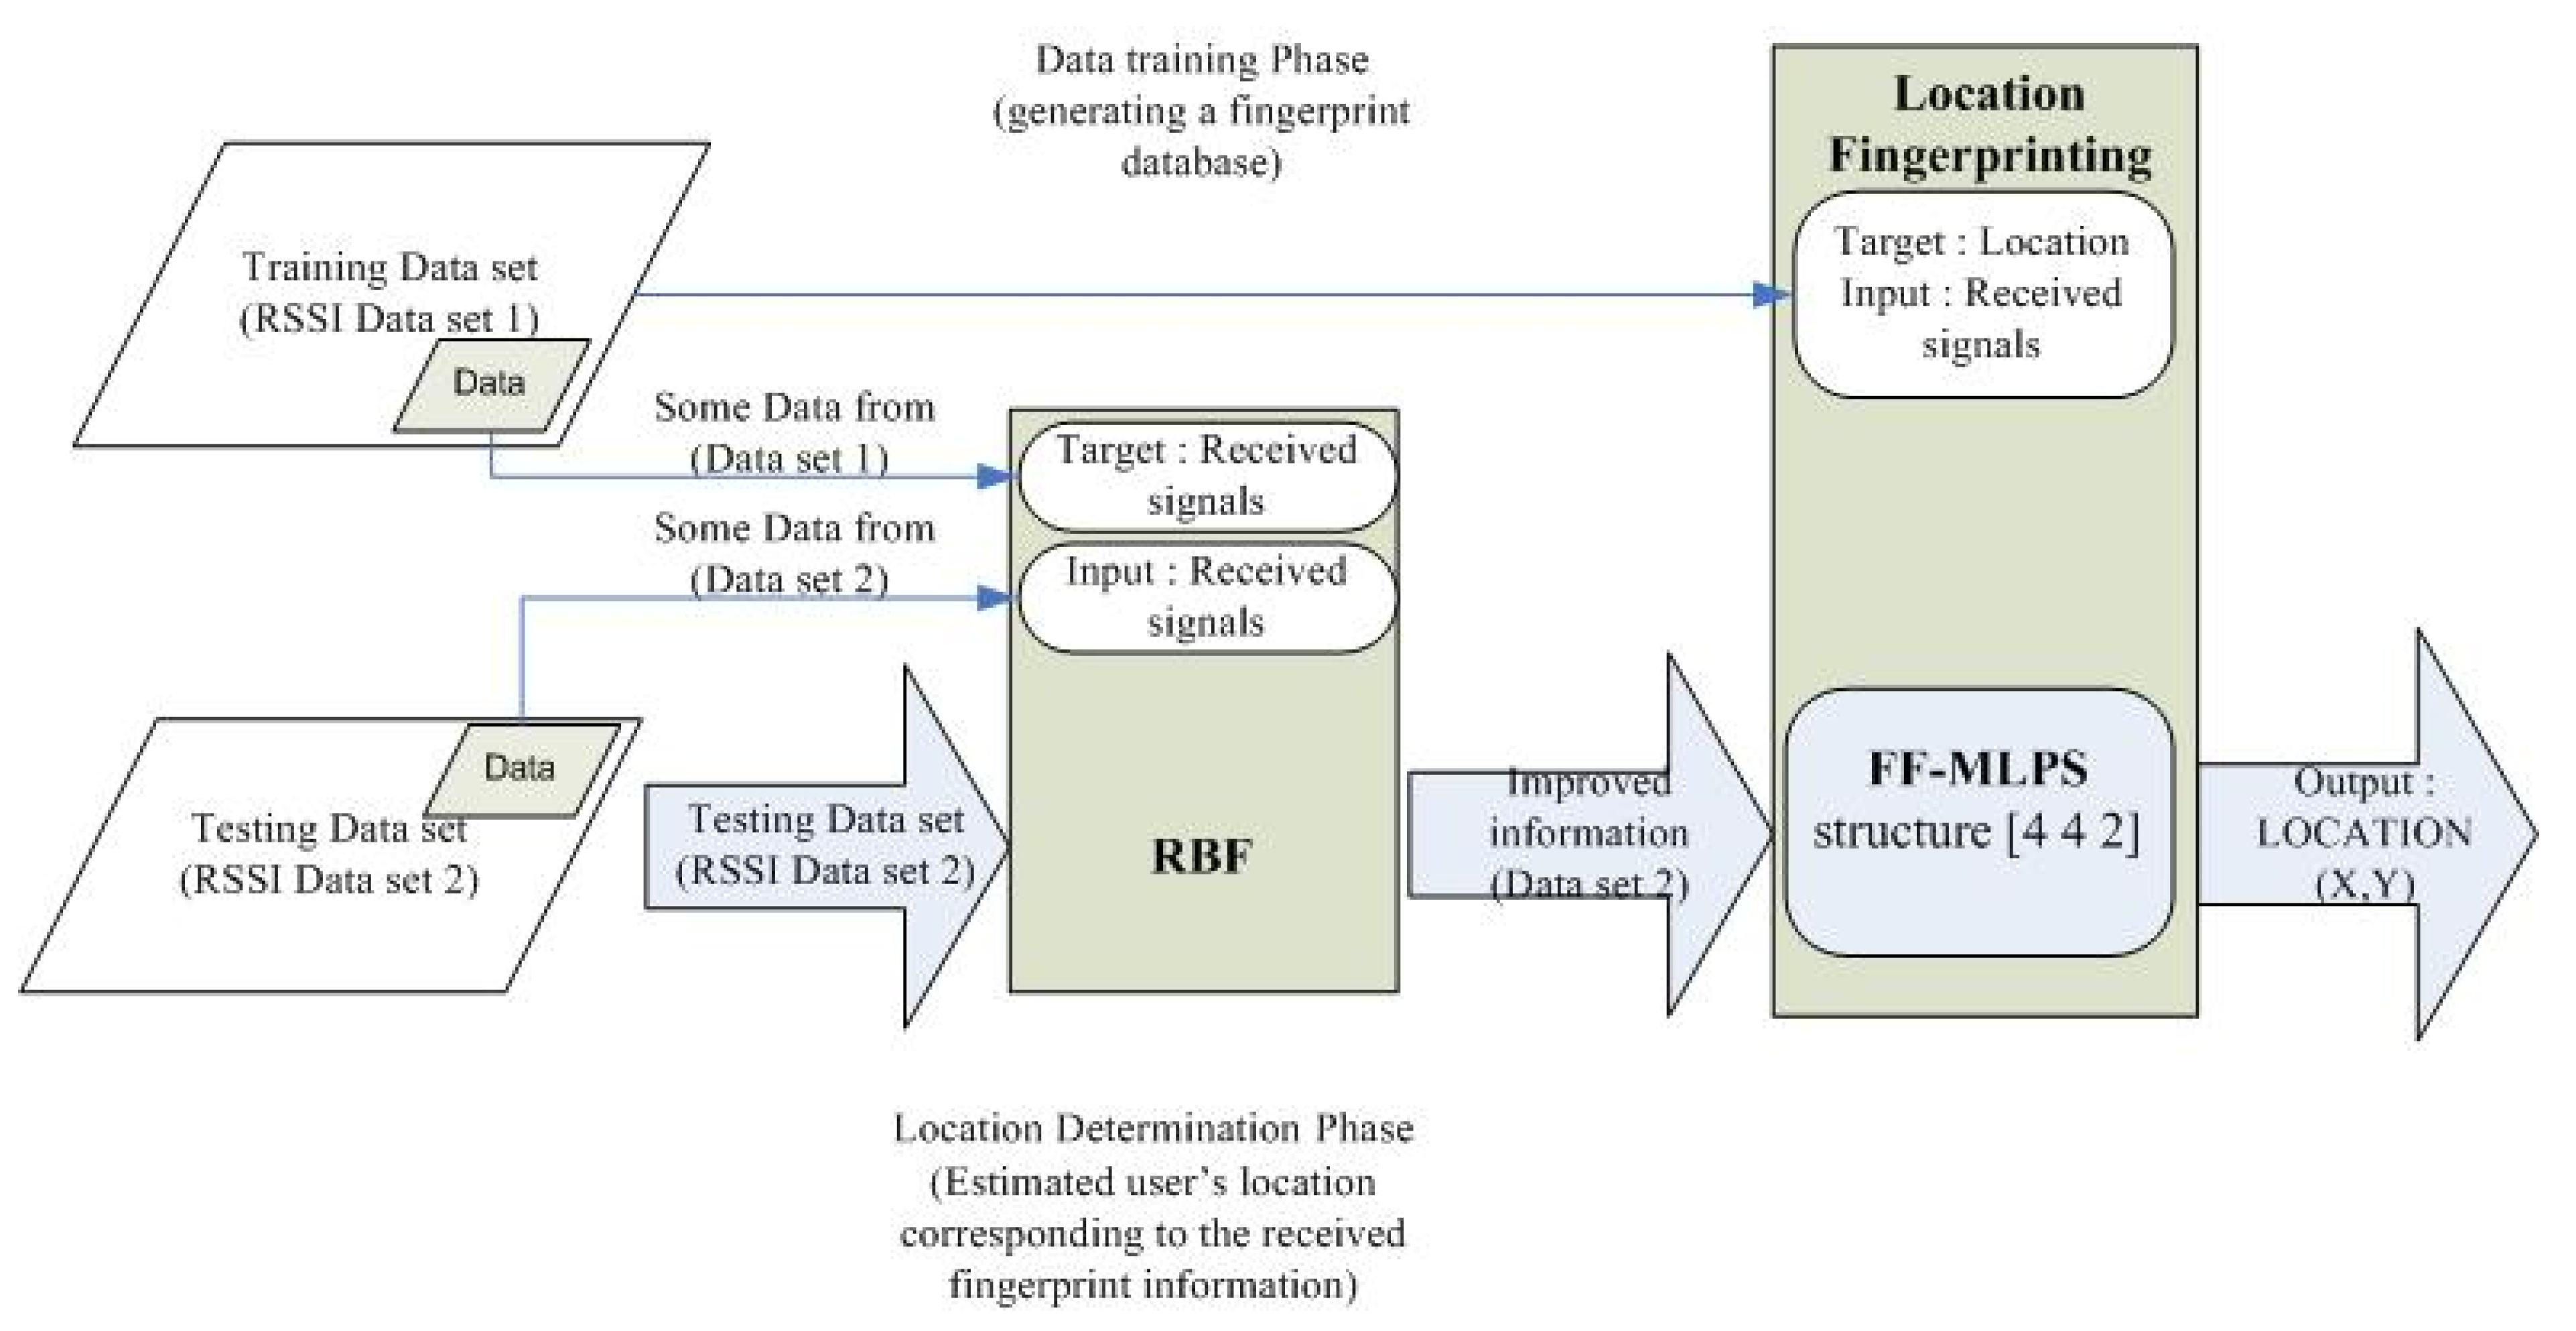
In this research, we proposed a combination of FF-MLP ANN with RBF networks for indoor location estimation. RBF is typically used for finding relationships (mappings) between inputs and outputs [14]. From the substructure of the RBF, which is different from that of the FF-MLP, the weights of the inputs that feed into the network are calculated and then multiplied by the bias of the network, before being delivered through to the transfer function. The role of the RBF network is to find a function for transmitting the real test data by adjusting the data (using the relationship between data training and data testing) in order to improve the modeling of the test area. Figure 7 illustrates this procedure.

3.6. Database and Web-Based Application for Classroom Attendance Systems

Our database is primarily used to store the data obtained from the Bluetooth stations. This involves some computation, such as aggregating the attendance rate for a particular event. The web server includes the MySQL storage service. The server is a remote attendance record store, and Bluetooth stations can update the MySQL database and retrieve data from the web server. A teacher can modify details about students, but the students are not permitted to change their own records.

4. Result and Discussion

4.1. Results from Location Estimation Framework

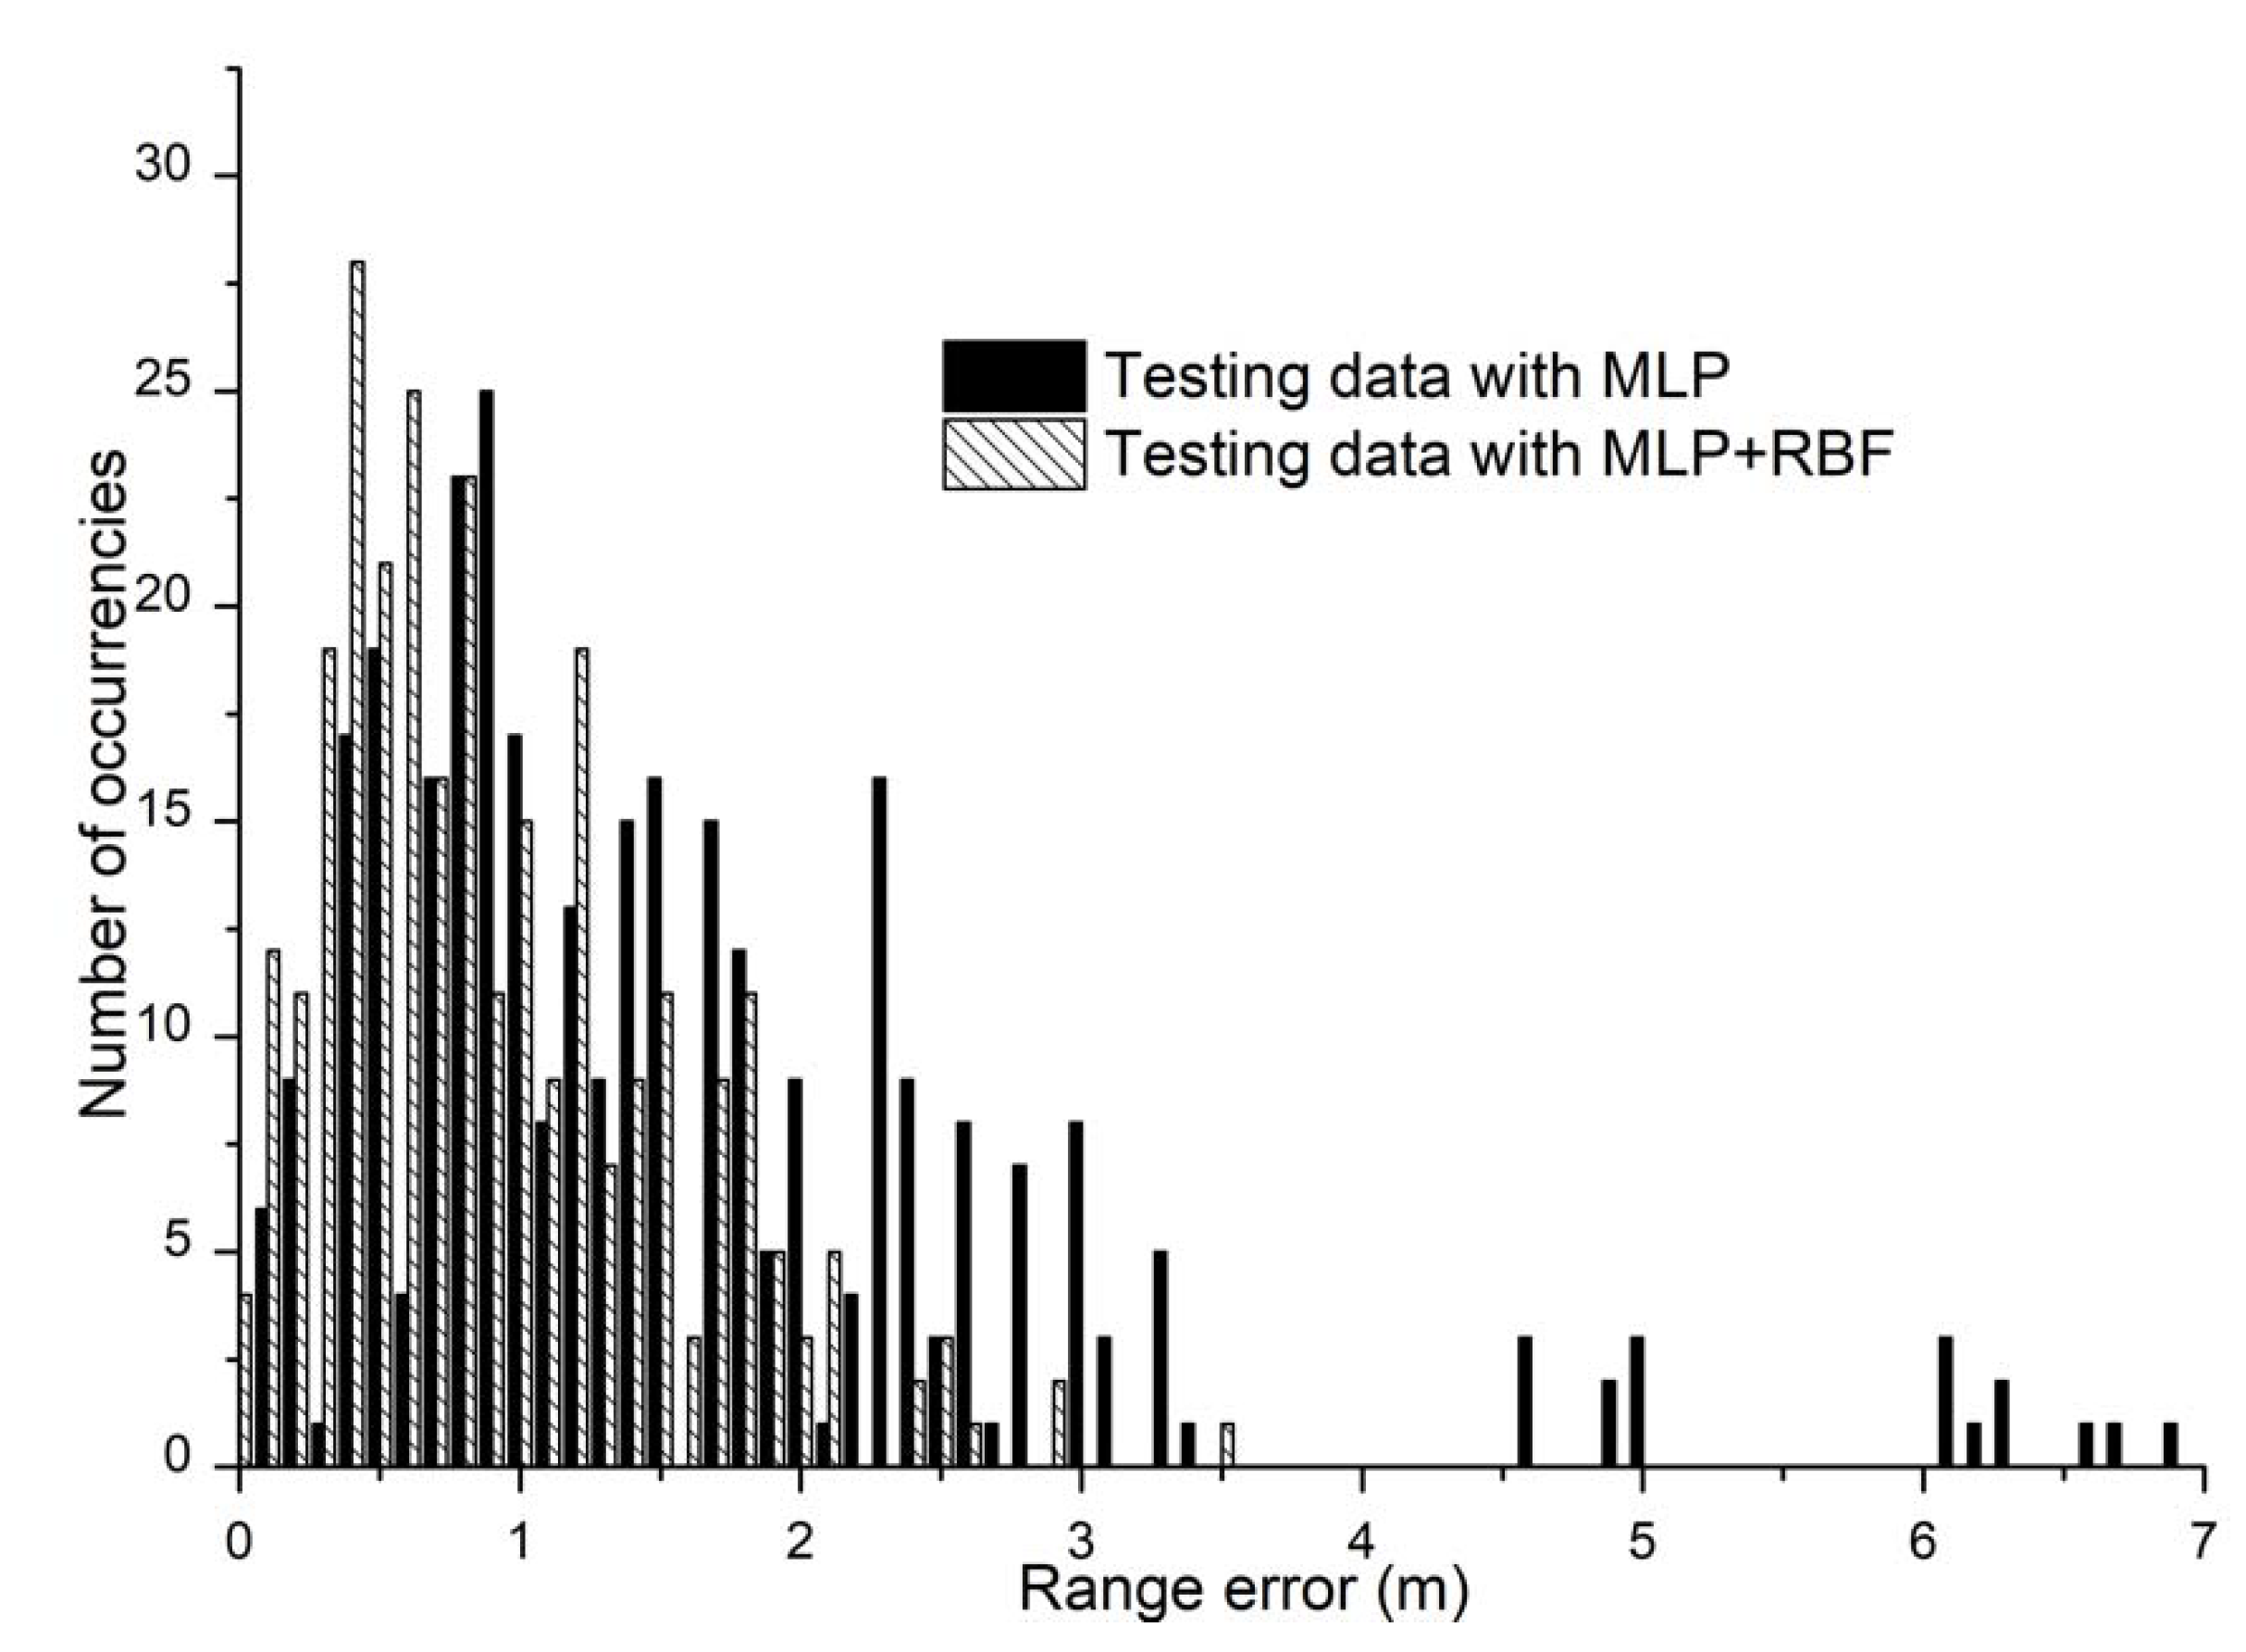
We trained the FF-MLP network with 5000 epochs and calculated the position estimates using this network. The evaluation of the accuracy of the position estimates of the Bluetooth transmitter and the receiver considers the deviations of the actual value from the estimated value based on the Euclidean distance. The results suggest that MLP + RBF yields a lower error and higher accuracy than MLP alone (as illustrated in Figure 8).
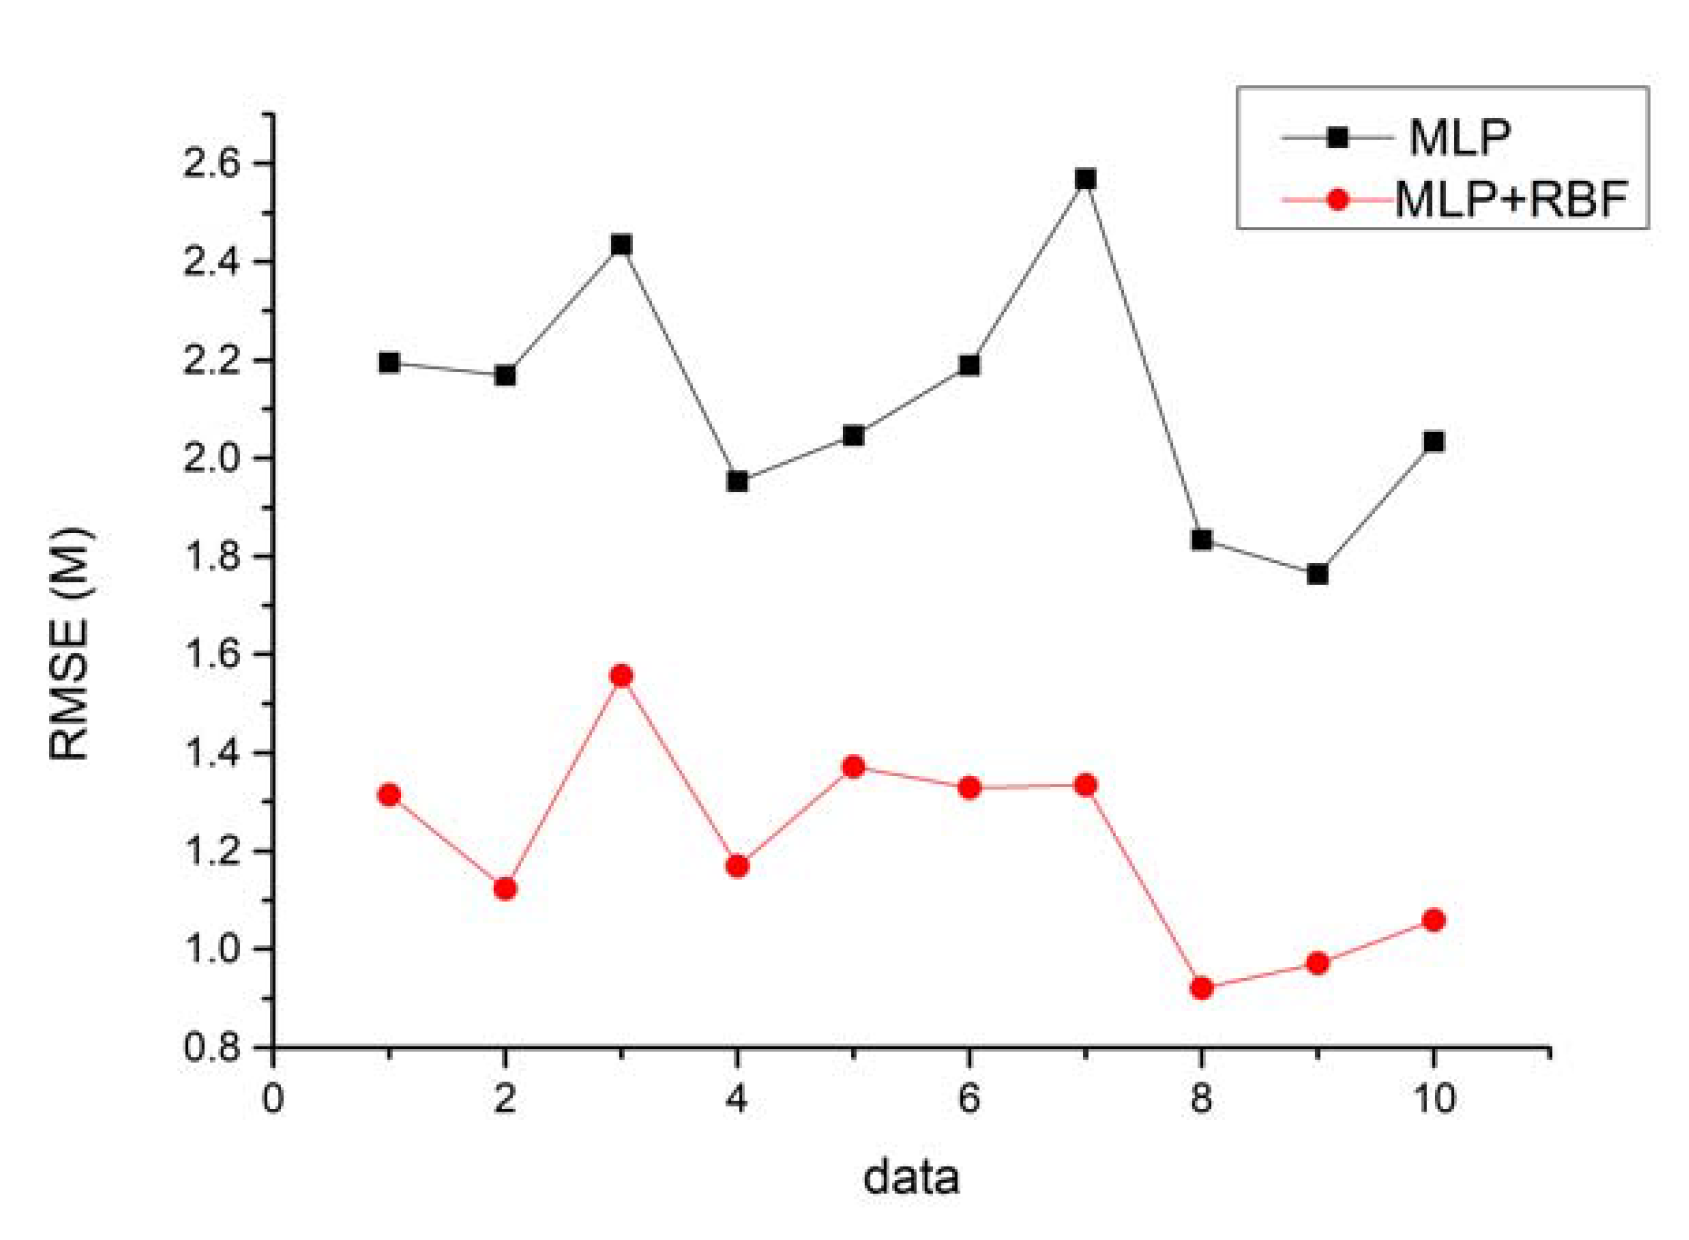
Moreover, we applied the root-mean-squared error (RMSE) for evaluating the errors of predicting position. The two methods (MLPS and FF-MLPS +RBF) were evaluated in terms of accuracy and the error of the estimated distance. Figure 9 illustrates that the MLPS alone yields an average RMSE of 2.031, while the average RMSE of the combination of FF-MLPS and RBF is reduced to 1.2041 This result demonstrates that the combination model (FF-MLPS + RBF) performs better than the MLPS model.
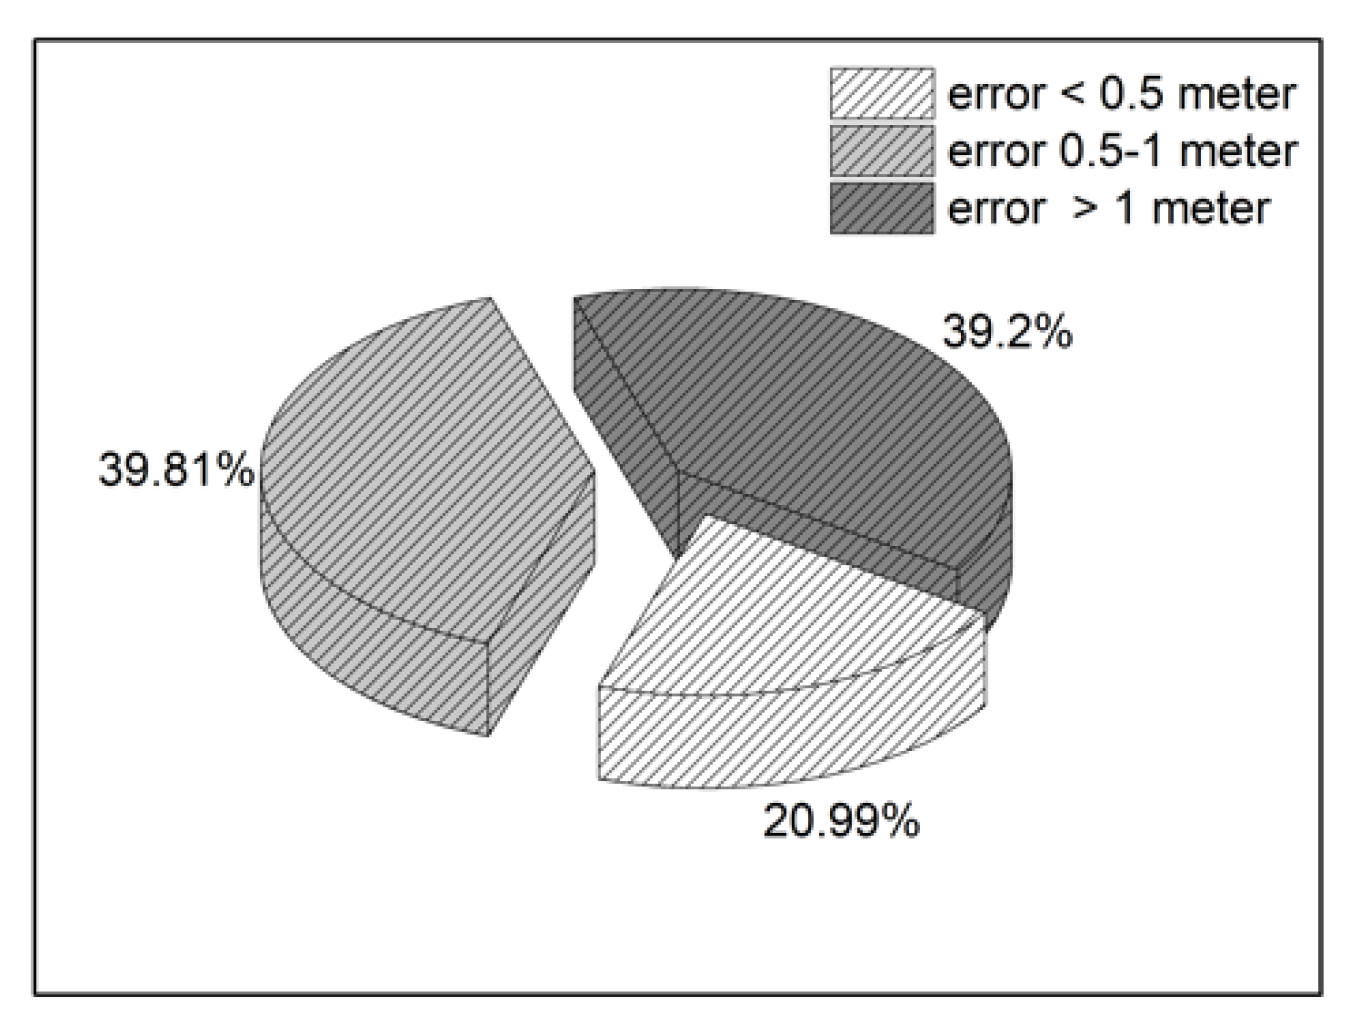
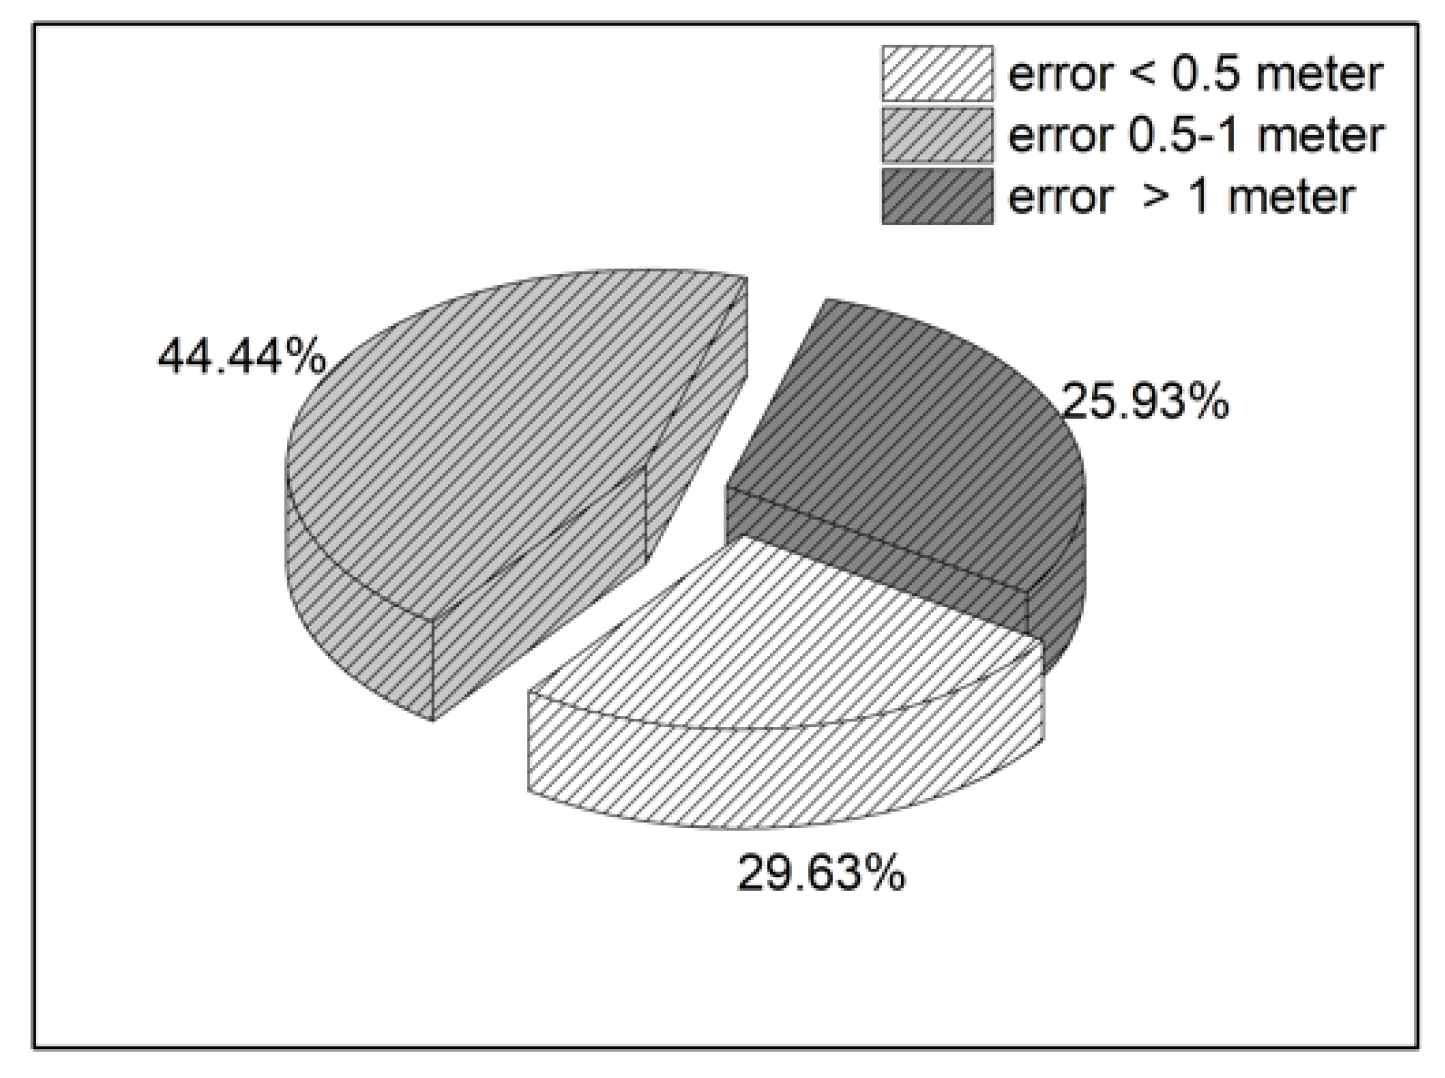
In terms of position calculations, using MLP alone, as illustrated in Figure 10, can produce a position estimate with an error less than 0.5 m in 20.98%, 0.5 m to 1 m in 39.81%, and the maximum error produced by the model is 6.9 m. In contrast, MLP + RBF produces superior results, with an error less than 0.5 m in 29.63%, and 0.5 m to 1 m in 44.44%, as illustrated in Figure 11. These results demonstrate that MLP + RBF outperforms MLP alone, as it yields superior accuracy for position estimation problems.

4.2. Computation of Student Positioning in Classroom

In this section, we deal with the metrology of the position calculation technique that was developed on the experimental site of type I, by applying the developed model to the type II and III.
For the type II, we used the FF-MLP structure (4-4-2) with an RBF network to calculate the positions of students’ chairs in the room. The experiment was repeated 10 times to measure the deviations (based on the Euclidean distance) from the real position of the chairs within the room (see chair number in Figure 2). Table 1 summarizes the results of the experiment.
Table 1 reveals that FF-MLP with the RBF network yields a deviation of less than 0.5 m in 30.6% of the cases and less than 1 m in 72.56% of the cases. The average deviation ranged between 0.5 m and 1.6 m, which is sufficiently effective for identifying students’ positions within the classroom.
For the type III, the experiment was repeated 10 times to measure the deviations (based on the Euclidean distance) from the real position of the chairs within the room (see chair number in Figure 3). Table 2 shows the result from the experiment. The calculation method yields a deviation of less than 0.5 m in 21.87% of the cases and less than 1 m in 49.63% of the cases. The average deviation ranged between 1.22 m and 3.5 m.
The proposed framework was designed and developed with classroom type I before applying on classroom type II. Fairly good accuracy results, which were comparable to those from the classroom type I, were achieved. Both classroom type I and type II have approximate areas of less than 70 m2. The framework was then applied to a larger classroom type III. The result from classroom type III demonstrates a slight increase in terms of RMSE. The comparison between the classrooms was evaluated with RMSE and Table 3 summarizes the results for the system positioning estimation. We also compared these results with a number of existing indoor positioning solutions and services available for Bluetooth technology. Table 4 summarizes these.
This study computed RMSE and Euclidean distance error for the three classrooms. The results of both the RMSE and the Euclidean distance error are correlated in the same direction. The proposed framework gives accuracy at 74.07% of the cases with the deviation less than 1 m for classroom type I; 72.56% and 49.63% for type II and type III, respectively. The positioning error is mainly from the ranging errors introduced by RSS fluctuations. Classroom type III is the largest room when compared with classroom type I and type II; therefore, the distance between Bluetooth stations and smartphones in classroom type III is relatively large as compared to the other types. As a result, the Euclidean distance error in classroom type III is higher than the errors in the other types of classrooms.
Among the listed techniques, iBeacon was introduced using RSSI from iBeacon from a user device, which yielded the best accuracy at 0.95 m. In Indoo.rs, iBeacon is used in the software system to locate a user device within 2 m to 5 m. In this study, the proposed method using fingerprint with ANN outperforms others, achieving the best accuracy in the range of 0.5 m to 1.6 m. Overall, the proposed method achieved an error of less than 1 m in approximately 72.56% of the experiment area.

4.3. Web Attendance System Testing

The Bluetooth functionality in the device was applied to detect the RSSI and MAC address of all the students ‘devices in the classroom. The Bluetooth station scanned all devices in the environment and matched the MAC addresses and RSSI of all devices with the students’ names. This information was then sent to the sever to be processed.
We evaluated the proposed system in two courses at the Computer Engineering Department of Rangsit University. For this purpose, four Bluetooth stations were located in the laboratory where lectures are conducted. The system was deployed and examined for three weeks (a minimum of nine lecture hours per class) and it was found to be able to track student attendance.
The developed server software recorded student attendance during this test period. The server was also able to perform various required operations in relation to the attendance of students. In addition to keeping attendance records, the server software also produced requisite reports based on the records. The records can be produced for each course and lecture period and it can be used to determine the status of the student. For example, the program can produce a report for a given lecture period that lists all students with their entry and exit times. The system also produces a summary report on a weekly or per semester basis, along with a cumulative attendance rate. Furthermore, the system can produce a report that is based on student statistics that include the overall rate of attendance and the days and time periods of attendance.
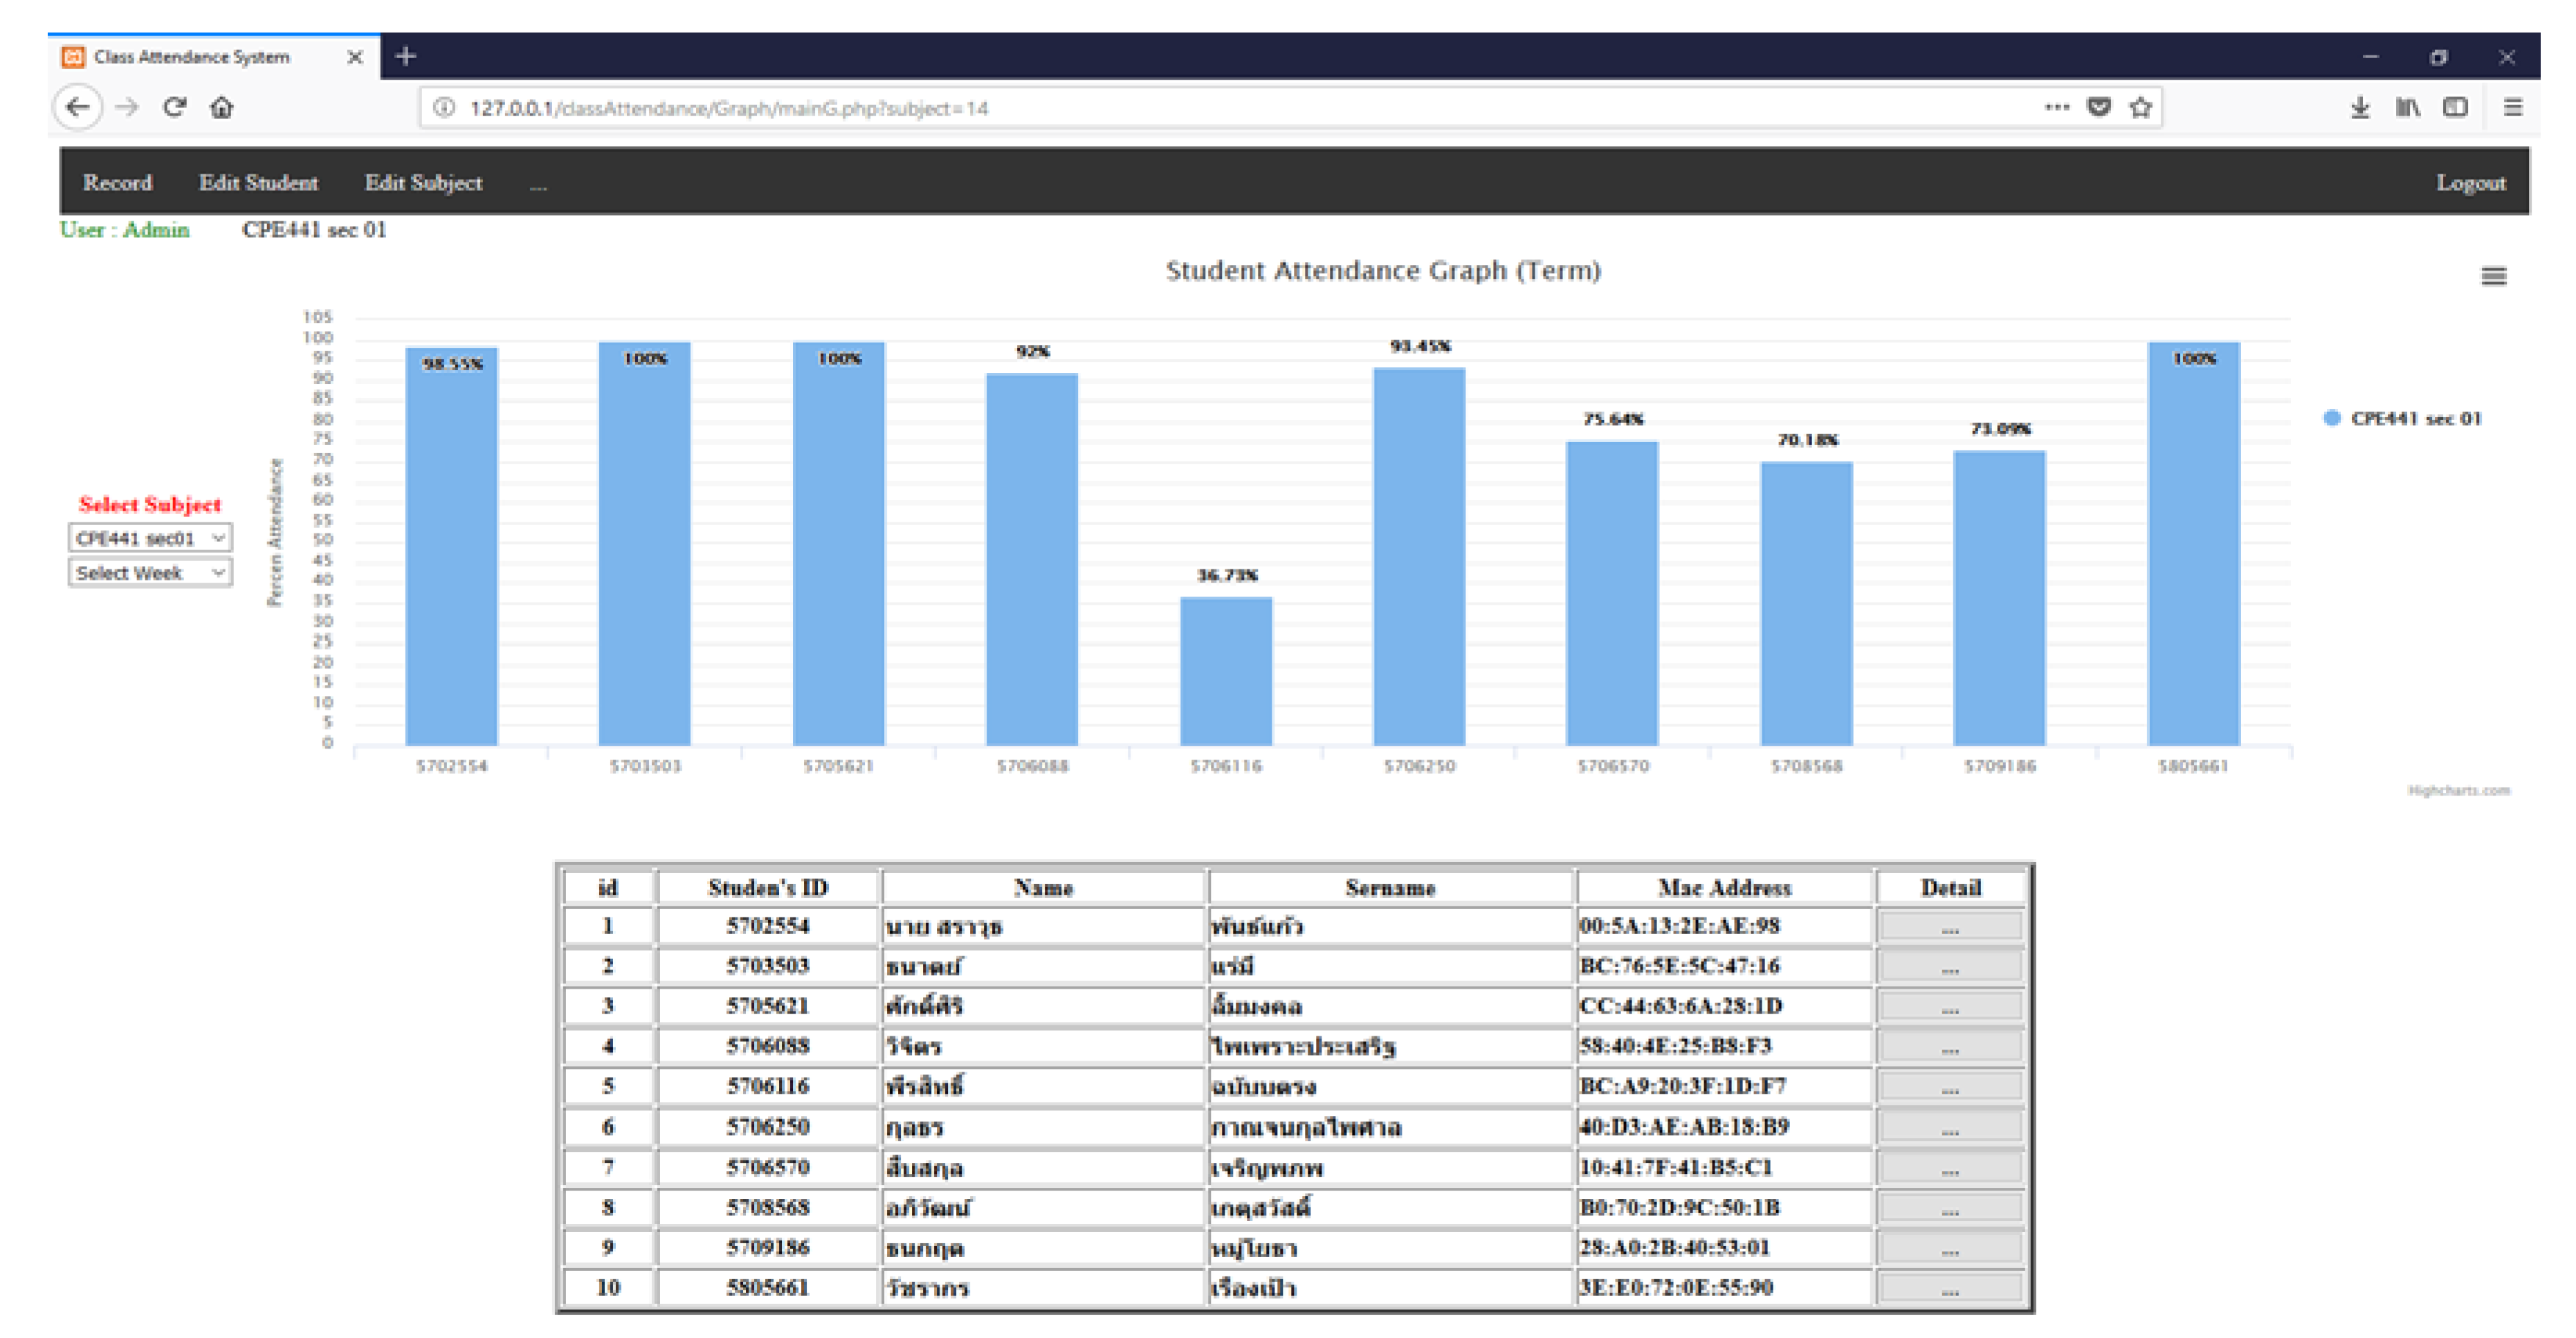
The student attendance results for each class obtained from the proposed model were then displayed via a web application. Figure 12 illustrates student attendance durations on the y-axis (in percentage) and the registered student IDs on the x-axis. The percentage of the attendance duration was calculated from the student attendance time divided by the total student attendance time in one semester multiplied by 100.
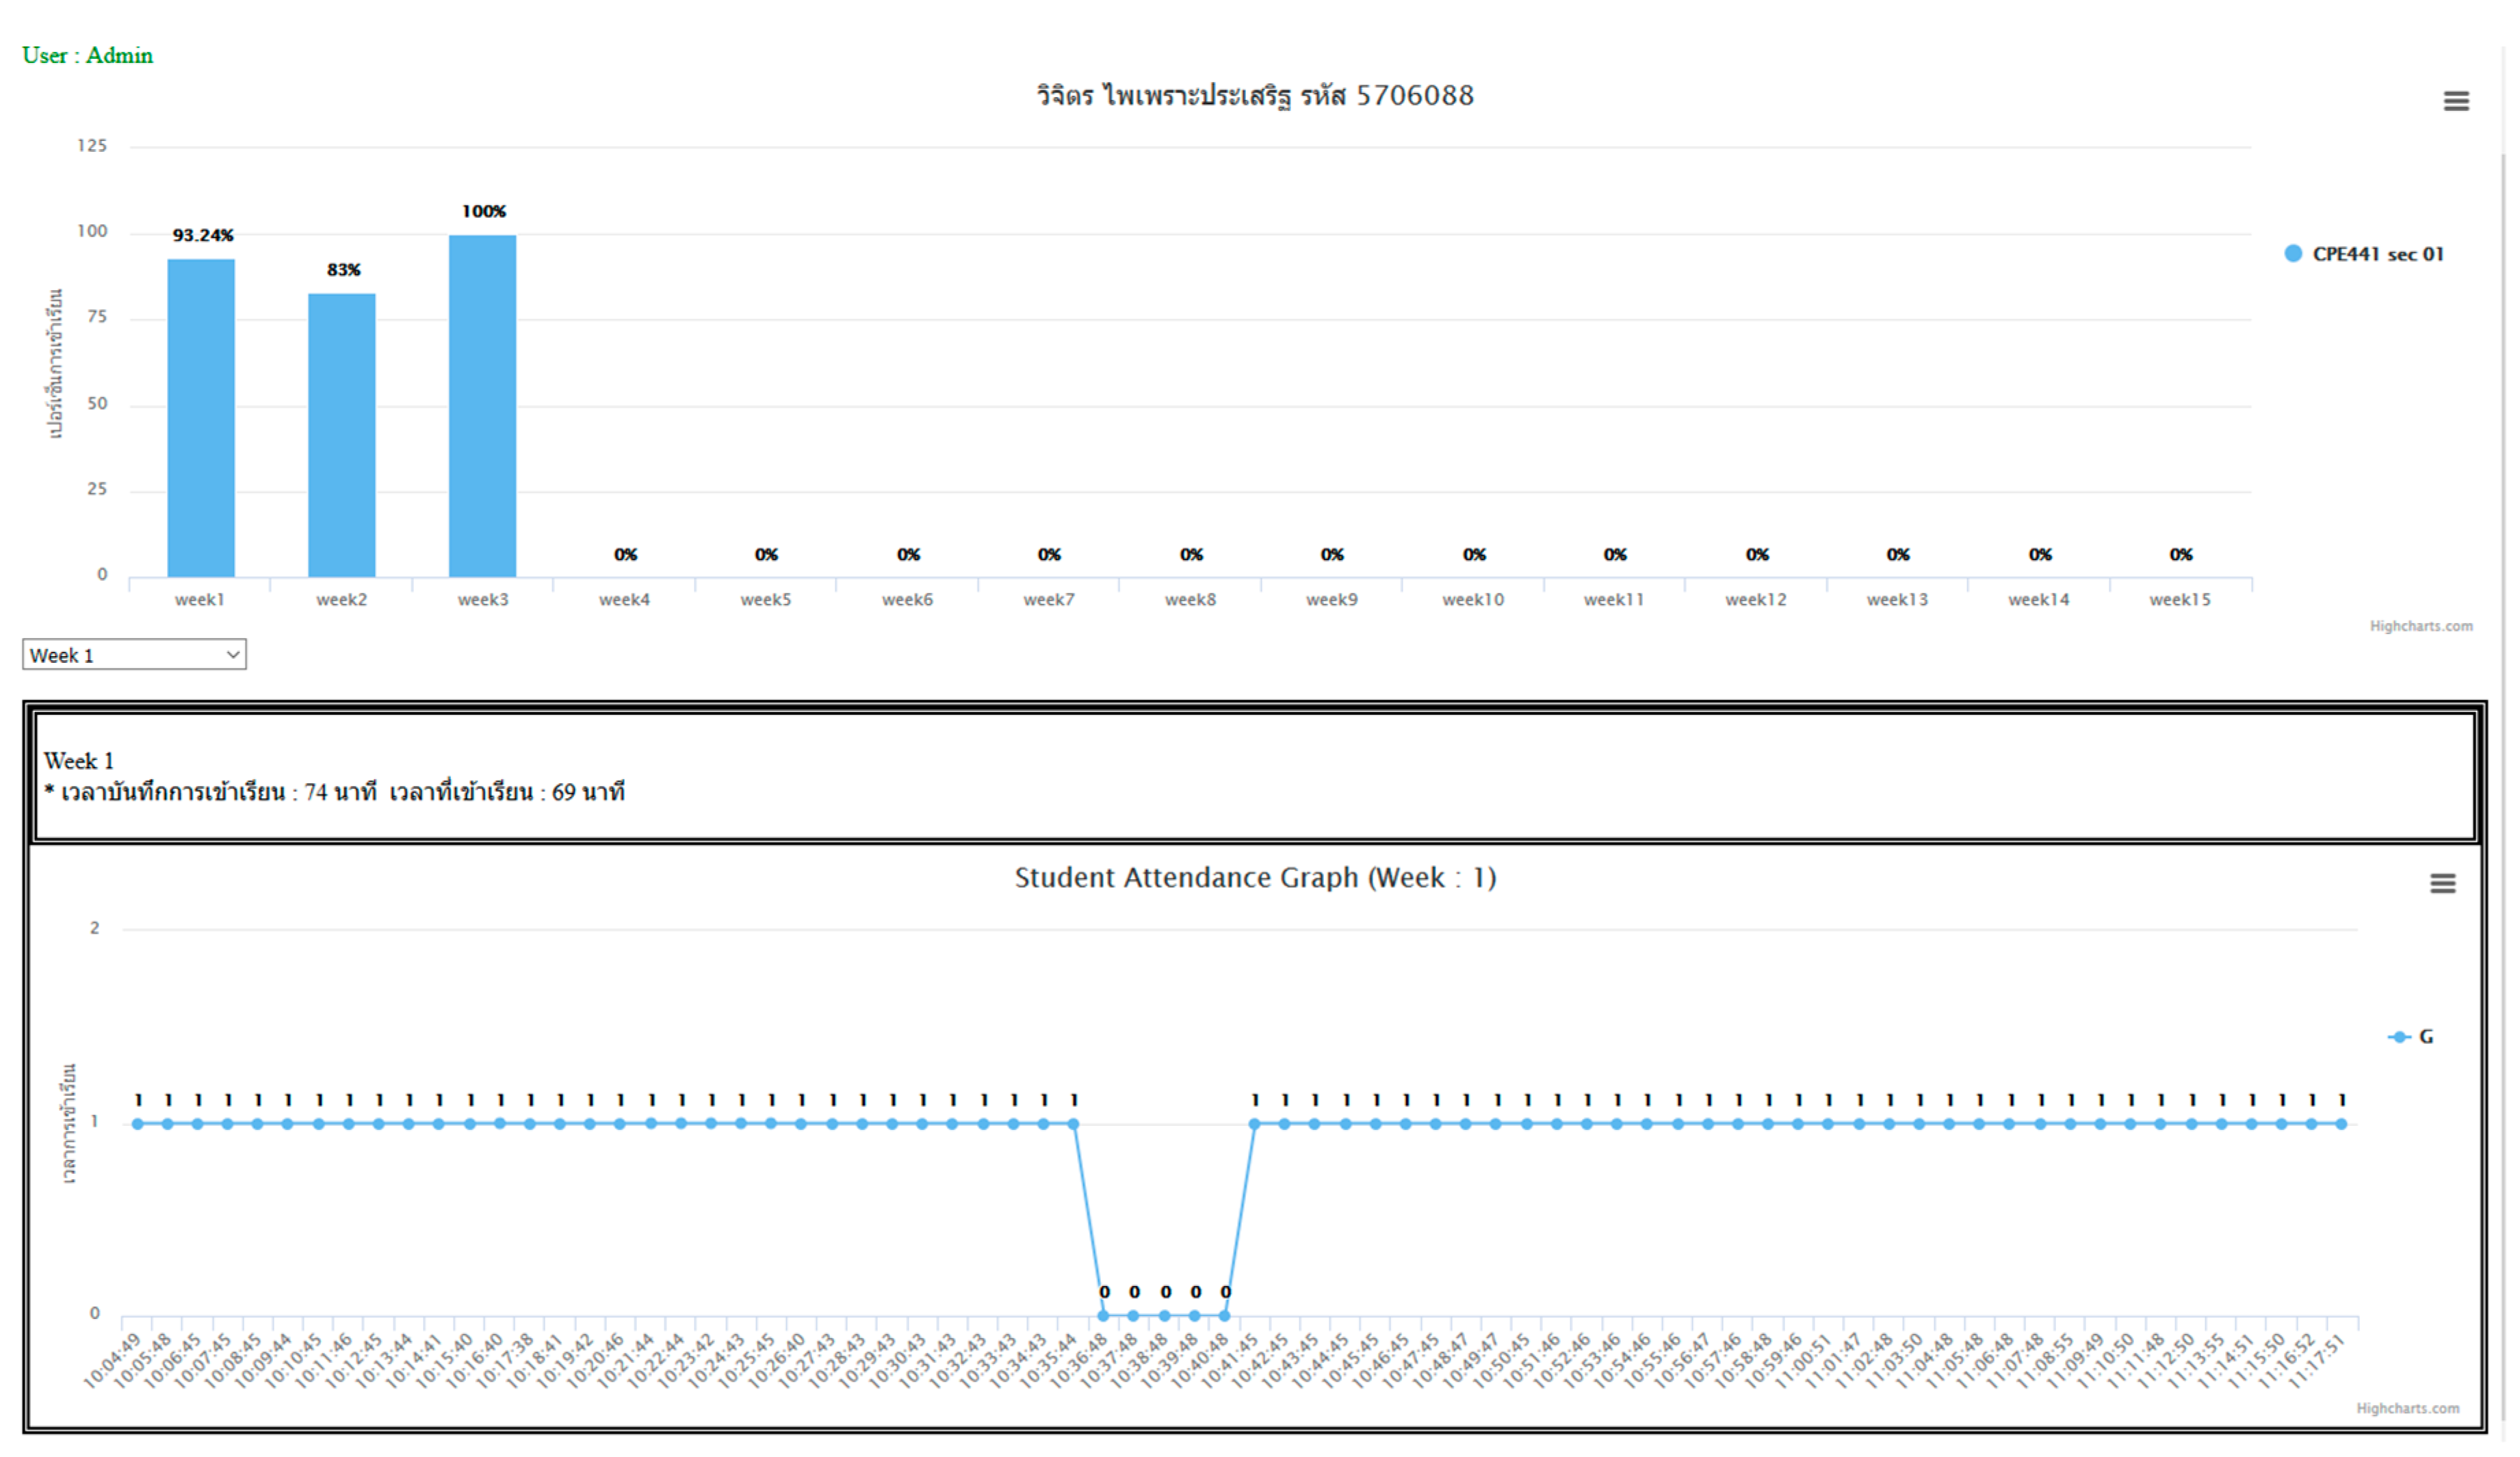
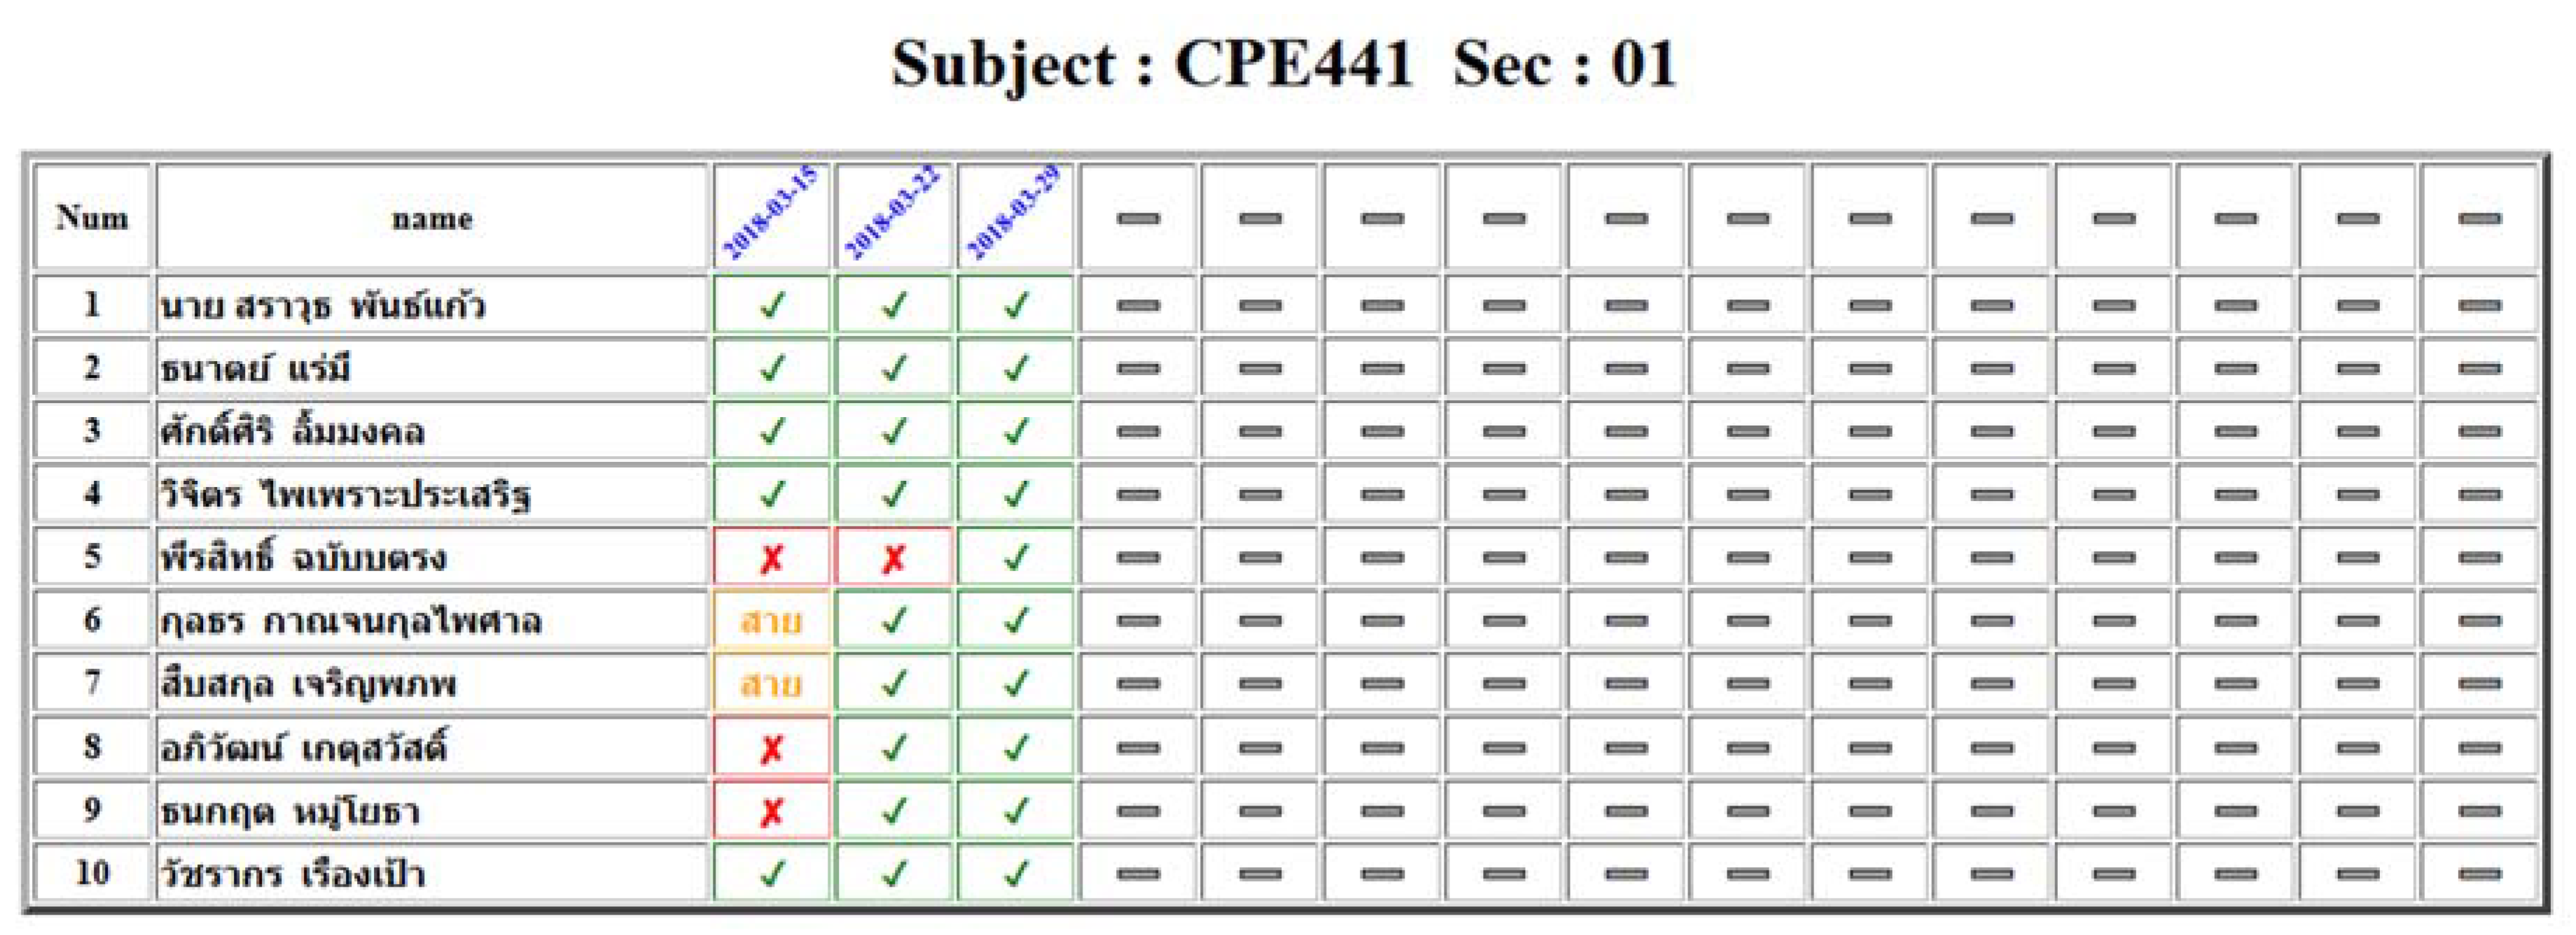
Moreover, the proposed model also provides detailed attendance information for each student in each period, which consists of the total recorded time and the actual times for which the student was in the class. Figure 13 illustrates the status (late/in class/absent) of a student’s attendance for each session, from the beginning until the end of the record. The attendance patterns for each student can then be described by further processing the information, as shown in Figure 14.

4.4. Cost and Benefit

The proposed automated system is considered as a long-term investment. The system setup might cost approximately 120 USD per installation. The manual attendance checking takes approximately 10 min. per class with about 30 students (by observation and manual recording in the system). A regular laboratory class in the Rangsit University, Thailand consists of 15 laboratory classes per semester, which results in a total 150 min. loss per semester in attendance checking. There are normally 10 classes per week of different courses in the same class room, which total the utilization of approximately 150 classes per semester or 300 classes per year. Therefore, there is a loss of 3000 min. in a year. This is quite significant wastage. This system can save it.
The manual system only records attendance, but the proposed automated system records three parameters: attendance, location and time of students, teacher, and support staff. The process requires fraction of a second to record. Attendance scheduled can be programmed by the system manager and multiple attendance record at different times during each session can be taken. Therefore, in addition to saving huge time there is more information to analyses behavior pattern of students, such as:
  • the percentage of the classes attended in the semester;
  • preference of siting location of each student; and,
  • walk-in and walk-out behavior.
If we analyze the cost of the system distributed per class over a period of one year, then it comes out to be just 0.4 USD. After one year, the system is almost free, except a very little expense on maintenance and consumption of electricity as it is low energy device.
Therefore, the Automated Attendance System saves a significant amount of the time that can be utilized by the teachers for more productive academic activities, such as organizing quizzes, discussion sessions, etc.

5. Conclusions

We proposed the class attendance system with the positioning model. The system consists of the Bluetooth signal receiver, a server processing, and recording attendance data through our system. The process requires all users to register their own device’s MAC address into the centralized database. This enforces the accuracy of the data and avoids duplication. The students’ mobile device is used to identify the positioning with our developed combination model between FF-MLPS + RBF, which provided acceptable accuracy. Our positioning system can determine the reliable location in the experimental room, which yields deviation of less than one meter at 72.56%, which has a slightly better result than the existing commercial models. The main purpose of our framework is to solve the burden of laborious manual effort of existing systems as a part of the smart campus in Rangsit University, Thailand. Future work will focus on improving the model’s accuracy and reducing the number of errors, which could allow the system to be implemented in various types of applications, such as store positioning in shopping malls, and smart museums.

Author Contributions

Conceptualization, A.P., N.K.T., A.W., P.S.; methodology, A.P., N.K.T., A.W.; writing—original draft preparation, A.P.; writing—review and editing, A.P., N.K.T., A.W., Supervision, N.K.T. All authors have read and agreed to the published version of the manuscript.

Funding

This research received no external funding.

Conflicts of Interest

The authors declare no conflict of interest.

References

  1. Raj, R.; Das, A.; Gupta, S.C. Proposal of an efficient approach to attendance monitoring system using Bluetooth. In Proceedings of the 9th International Conference on Cloud Computing, Data Science & Engineering (Confluence), Noida, India, 10–11 January 2019; pp. 611–614. [Google Scholar]
  2. Bowen, E.; Price, T.; Lloyd, S.; Thomas, S. Improving the quantity and quality of attendance data to enhance student retention. J. Furth. High. Educ. 2005, 29, 375–385. [Google Scholar] [CrossRef]
  3. Macfarlane, B. The Surveillance of Learning: A Critical Analysis of University Attendance Policies. High. Educ. Q. 2013, 67, 358–373. [Google Scholar] [CrossRef]
  4. Marburger, D.R. Does Mandatory Attendance Improve Student Performance? J. Econ. Educ. 2006, 37, 148–155. [Google Scholar] [CrossRef]
  5. Jacobsen, K.; Meeder, L.; Voskuil, V.R. Chronic Student Absenteeism: The Critical Role of School Nurses. NASN Sch. Nurse 2016, 31, 178–185. [Google Scholar] [CrossRef]
  6. Hannah, R. The Effect of Classroom Environment on Student Learning. Honors Thesis, Western Michigan University, Kalamazoo, MI, USA, 2013; pp. 1–22. [Google Scholar]
  7. Mittal, Y.; Varshney, A.; Aggarwal, P.; Matani, K.; Mittal, V. Fingerprint biometric based Access Control and Classroom Attendance Management System. In Proceedings of the 2015 Annual IEEE India Conference (INDICON), New Delhi, India, 17–20 December 2015. [Google Scholar]
  8. Hoo, S.C.; Ibrahim, H. Biometric-Based Attendance Tracking System for Education Sectors: A Literature Survey on Hardware Requirements. J. Sens. 2019, 2019, 7410478. [Google Scholar] [CrossRef]
  9. Elhoseny, H.; Elhoseny, M.; Abdelrazek, S.; Riad, A.M. Evaluating Learners’ Progress in Smart Learning Environment. In Proceedings of the International Conference on Advanced Intelligent Systems and Informatics 2017; Springer: Cham, Switzerland, 2018; ISBN 978-3-319-64860-6. [Google Scholar]
  10. De Blasio, G.S.; Rodríguez-Rodríguez, J.C.; García, C.R.; Quesada-Arencibia, A. Beacon-Related Parameters of Bluetooth Low Energy: Development of a Semi-Automatic System to Study Their Impact on Indoor Positioning Systems. Sensors 2019, 19, 3087. [Google Scholar] [CrossRef] [PubMed] [Green Version]
  11. Anand, S.; Bijlani, K.; Suresh, S.; Praphul, P. Attendance Monitoring in Classroom Using Smartphone & Wi-Fi Fingerprinting. In Proceedings of the 2016 IEEE Eighth International Conference on Technology for Education (T4E), Mumbai, India, 2–4 December 2016. [Google Scholar]
  12. Tegou, T.; Kalamaras, I.; Tsipouras, M.; Giannakeas, N.; Votis, K.; Tzovaras, D. A Low-Cost Indoor Activity Monitoring System for Detecting Frailty in Older Adults. Sensors 2019, 19, 452. [Google Scholar] [CrossRef] [PubMed] [Green Version]
  13. Stanca, L. The Effects of Attendance on Academic Performance: Panel Data Evidence for Introductory Microeconomics. J. Econ. Educ. 2006, 37, 251–266. [Google Scholar] [CrossRef] [Green Version]
  14. Kumar, P.P. Absenteeism and performance in a quantitative module A quantile regression analysis. J. Appl. Res. High. Educ. 2016, 8, 376–389. [Google Scholar]
  15. Hameed, S.; Saquib, S.M.T.; ul Hassan, M.; Junejo, F. Radio Frequency Identification (RFID) Based Attendance & Assessment System with Wireless Database Records. Procedia-Soc. Behav. Sci. 2015, 195, 2889–2895. [Google Scholar]
  16. Iio, J. Attendance Management System Using a Mobile Device and a Web Application. In Proceedings of the 19th International Conference on Network-Based Information Systems (NBiS), Ostrava, Czech Republic, 7–9 September 2016. [Google Scholar]
  17. Ichimura, T.; Kamada, S. Early Discovery of Chronic Non-attenders by Using NFC Attendance Management System. In Proceedings of the IEEE 6th International Workshop on Computational Intelligence and Applications (IWCIA 2013), Hiroshima, Japan, 13 July 2013; ISBN 978-1-4673-5725-8. [Google Scholar]
  18. Mohandes, M.A. Class Attendance Management System Using NFC Mobile Devices. Intell. Autom. Soft Comput. 2017, 23, 251–259. [Google Scholar] [CrossRef]
  19. Bhalla, V. Bluetooth Based Attendance Management System. J. Innov. Eng. Technol. 2013, 3, 227–233. [Google Scholar]
  20. Lodha, R.; Gupta, S.; Jain, H.; Narula, H. Bluetooth Smart based attendance management system. Procedia Comput. Sci. 2015, 45, 524–527. [Google Scholar] [CrossRef]
  21. Apoorv, R.; Mathur, P. Smart attendance management using Bluetooth Low Energy and Android. In Proceedings of the 2016 IEEE Region 10 Conference (TENCON), Singapore, 22–25 November 2016; pp. 1048–1052. [Google Scholar]
  22. What Are Estimote Stickers. Available online: https://community.estimote.com/hc/en-us/articles/203323543-What-are-Estimote-Stickers- (accessed on 24 April 2020).
  23. Saraswat, G.; Garg, V. Beacon controlled campus surveillance. In Proceedings of the 2016 International Conference on Advances in Computing, Communications and Informatics (ICACCI), Jaipur, India, 21–24 September 2016; pp. 2582–2586. [Google Scholar]
  24. Jacksi, K.; Ibrahim, F.; Zebari, S. Student Attendance Management System. Int. J. Eng. Technol. 2018, 6, 49–53. [Google Scholar]
  25. Topak, F.; Pekeriçli, M.K.; Tanyer, A.M. An Assessment of Bluetooth Low Energy Technology for Indoor Localization. In Proceedings of the International Council for Research and Innovation in Building and Construction—33rd International CIB W78 IT in Construction Conference, Brisbane, Australia, 31 October–2 November 2016. [Google Scholar]
  26. Gomez, C.; Oller, J.; Paradells, J. Overview and Evaluation of Bluetooth Low Energy: An Emerging Low-Power Wireless Technology. Sensors 2012, 12, 11734–11753. [Google Scholar] [CrossRef]
  27. Basiouny, Y.; Arafa, M.; Sarhan, A.M. Enhancing Wi-Fi fingerprinting for indoor positioning system using single multiplicative neuron and PCA algorithm. In Proceedings of the 2017 12th International Conference on Computer Engineering and Systems (ICCES), Cairo, Egypt, 19–20 December 2017; pp. 295–305. [Google Scholar]
  28. Dong, B.; Burgess, T.; Neuner, H.; Fercher, S. Neural Network Based Radio Fingerprint Similarity Measure. In Proceedings of the 2018 International Conference on Indoor Positioning and Indoor Navigation (IPIN), Nantes, France, 24–27 September 2018; pp. 1–8. [Google Scholar] [CrossRef]
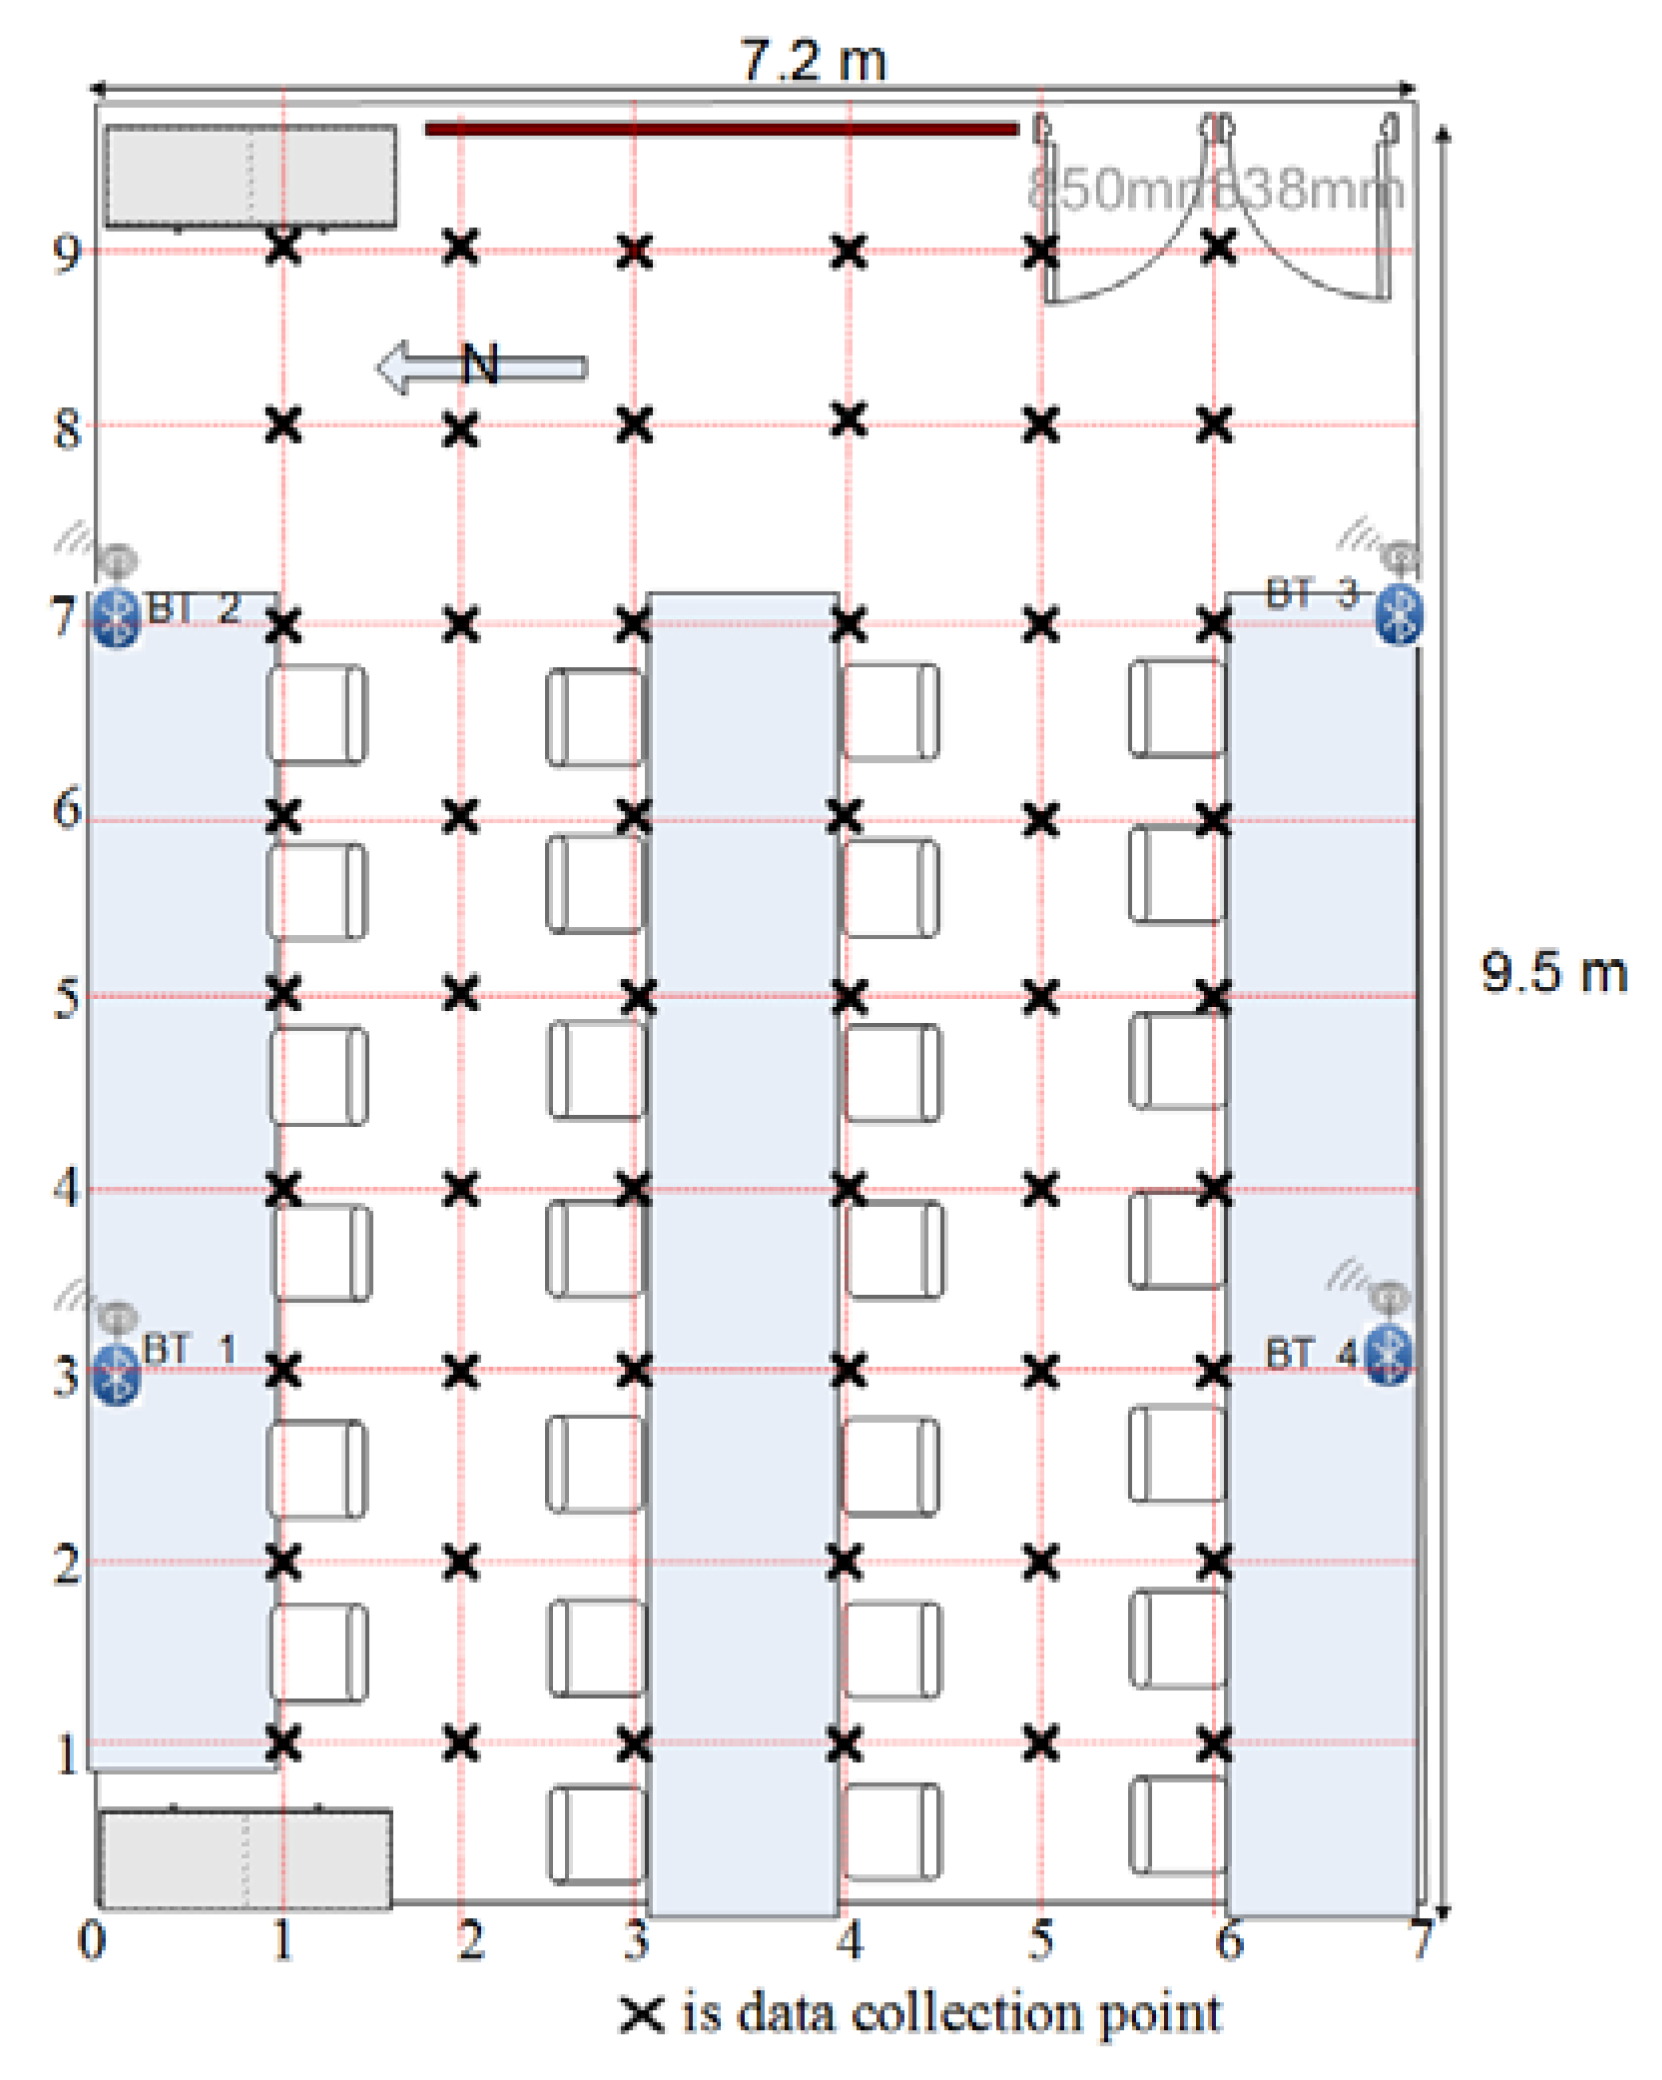
Figure 1. Setup of Bluetooth stations at Experimental site type I.
Information 11 00329 g001
Figure 2. Test site for Bluetooth Low Energy (BLE) indoor positioning (Classroom type II).
Information 11 00329 g002
Figure 3. Test site for BLE indoor positioning (Classroom type III).
Information 11 00329 g003
Figure 4. Attendance monitoring system.
Information 11 00329 g004
Figure 5. Flow chart of Bluetooth inquiry received signal strength Indicator (RSSI).
Information 11 00329 g005
Figure 6. Structure of feedforward multilayer perceptron artificial neural networks (FF-MLP ANN) used to calculate the X and Y positions.
Information 11 00329 g006
Figure 7. Location Estimate by FF-MLP ANN in combination with radial basis function (RBF).
Information 11 00329 g007
Figure 8. Comparison of distribution of errors between MLP and MLP + RBF.
Information 11 00329 g008
Figure 9. Comparison of RMSE of distance errors between MLP and MLP + RBF.
Information 11 00329 g009
Figure 10. Accuracy of positioning results using MLP.
Information 11 00329 g010
Figure 11. Accuracy of positioning results using MLP + RBF.
Information 11 00329 g011
Figure 12. Summary of class attendance by semester.
Information 11 00329 g012
Figure 13. Status of individual student attendance in class.
Information 11 00329 g013
Figure 14. Status of student attendance in class.
Information 11 00329 g014
Table 1. Deviation in position calculations of chairs in the room type II.
ChairDeviation in Position Calculation of Chairs(m)ChairDeviation in Position Calculation of Chairs(m)ChairDeviation in Position Calculation of Chairs(m)
min maxavgmin maxavgmin maxavg
110.1651.3680.528310.1401.1140.534310.1401.1140.534
120.2790.8560.600320.2551.6140.852320.2551.6140.852
130.5391.7221.253330.5152.0381.396330.5152.0381.396
210.0601.5180.605410.3840.8490.578410.3840.8490.578
220.1001.4410.711420.1832.1680.982420.1832.1680.982
230.6411.9341.171430.7552.1951.421430.7552.1951.421
Table 2. Deviation in position calculations of chairs in the room type III.
ChairDeviation in Position Calculation of Chairs(m)ChairDeviation in Position Calculation of Chairs(m)ChairDeviation in Position Calculation of Chairs(m)
min maxavgmin maxavgmin maxavg
002.1373.2452.694250.5671.0540.803500.8224.4932.432
010.2553.2111.674260.2321.5481.061510.7163.6691.632
020.5163.5832.411270.8623.5302.385521.0534.9682.540
030.2862.3921.268280.1613.4692.127530.8315.0601.454
040.7113.8281.896290.2961.8050.959540.8544.0152.142
050.4522.8411.528300.5164.1051.520550.7693.3871.828
060.2132.3661.035310.3413.5701.758560.2931.8690.867
070.6823.1091.848320.0953.3161.683570.6991.4191.069
080.8362.9711.672330.2082.5361.259580.5252.2011.438
090.7372.5531.407340.3981.7761.282590.8905.2252.089
101.1483.4932.045350.1241.4260.751600.3243.5361.144
110.8474.2682.602361.2763.2952.069610.8331.8801.243
120.4672.6611.550370.2072.8861.590620.1393.8821.695
130.2534.7501.732380.3282.8261.311630.5353.9392.211
140.6922.0191.427391.0565.0232.006641.2343.0341.628
150.2942.7111.233400.2472.0611.277650.8533.4541.744
160.4734.1962.146410.3493.1381.528660.6264.9892.223
171.6854.7712.132420.9322.0871.558670.6853.1361.865
180.8093.6231.997431.4232.6972.108680.4084.0231.089
191.5103.9493.115440.8184.1832.703690.4602.9562.079
200.3675.1483.469450.3822.2641.342
210.5103.3261.227460.2182.2581.321
220.0901.9940.849471.4575.1062.677
230.3931.7821.005480.3344.0782.221
240.5075.7951.661491.0243.3352.225
Table 3. Summary result for positioning estimation.
Experiment AreaRMSEPosition Estimation (Euclidean Distance Error)
0 m–0.5 m.0.5 m–1 m.1 m–1.5 m.>1.5 m.
Classroom type I1.204129.63%44.44%15.29%10.64%
Classroom type II1.471630.06%42.5%12.15%15.29%
Classroom type III2.26721.87%26.76%21.06%29.87%
Table 4. Review of Bluetooth positioning systems.
Positioning TechniqueAccuracyAdvantagesDisadvantages
iBeacon [23]97 cm highestGood accuracy and readily available on users’ devicesNot real time, requires extra hardware
Indoo.rs [28]Accuracy from 2 to 5 m.Fair accuracy and readily available on users’ devicesAccuracy can be improved by adding more beacons and requires fingerprinting
FF-MLP and RBF72.56% accuracy within tolerances of less than 1 mLow cost and good accuracyNot real time, requires fingerprinting