Abstract
Observed social networks are often considered as proxies for underlying social networks. The analysis of observed networks oftentimes involves the identification of influential nodes via various centrality measures. This paper brings insights from research on adversarial attacks on machine learning systems to the domain of social networks by studying strategies by which an adversary can minimally perturb the observed network structure to achieve their target function of modifying the ranking of a target node according to centrality measures. This can represent the attempt of an adversary to boost or demote the degree to which others perceive individual nodes as influential or powerful. We study the impact of adversarial attacks on targets and victims, and identify metric-based security strategies to mitigate such attacks. We conduct a series of controlled experiments on synthetic network data to identify attacks that allow the adversary to achieve their objective with a single move. We then replicate the experiments with empirical network data. We run our experiments on common network topologies and use common centrality measures. We identify a small set of moves that result in the adversary achieving their objective. This set is smaller for decreasing centrality measures than for increasing them. For both synthetic and empirical networks, we observe that larger networks are less prone to adversarial attacks than smaller ones. Adversarial moves have a higher impact on cellular and small-world networks, while random and scale-free networks are harder to perturb. Also, empirical networks are harder to attack than synthetic networks. Using correlation analysis on our experimental results, we identify how combining measures with low correlation can aid in reducing the effectiveness of adversarial moves. Our results also advance the knowledge about the robustness of centrality measures to network perturbations. The notion of changing social network data to yield adversarial outcomes has practical implications, e.g., for information diffusion on social media, influence and power dynamics in social systems, and developing solutions to improving network security.
1. Introduction
Social network analysis (SNA) is a common approach for studying interactions between entities, such as social agents, information, and technology in complex systems. A typical starting point for a SNA is to construct a social network based on observed data, with the assumption being that the resulting network reflects or closely approximates the true, underlying network. A common next step is to identify influential or powerful entities or nodes in the network by calculating centrality measures. The most central nodes can be further analyzed and their network position interpreted based on the given research question and content domain.
In this paper, we study a scenario in which a target node in the underlying network is being used or aims to manipulate the observed network data (see Figure 1) in order to change (increase or decrease) its observed ranking based on commonly used centrality measures (henceforth referred to as a node’s centrality rank). This study is motivated by three aspects. First, we aim to advance the body of knowledge about the susceptibility of centrality measures to noisy network data [1]. Second, we leverage recent progress with studying adversarial attacks on automated systems, in particular prior literature on fooling machine learning systems built for classifying images [2,3], audio data [4], text data [5], and network data [6], to examine the impact of adversarial attacks on the perception of the power and influence of individual nodes in networks. We identify cost-efficient adversarial attacks based on an exhaustive search as opposed to gradient based measures, which are common in the machine learning literature. This paper focuses on studying an adversary’s ability to manipulate a target node’s centrality rank with respect to other nodes in the network as opposed to any node’s classification label. The experimental framework that we provide for this work allows for studying the susceptibility of targets to these attacks.
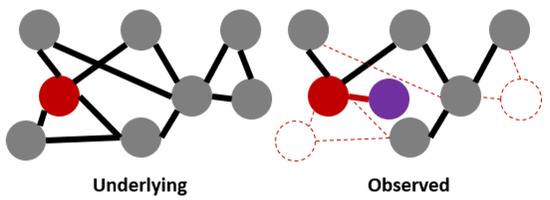
Figure 1.
Example: network analysis of an observed network. The adversarial actions on the target node (red) are: adding a new node not present in the underlying network (e.g., creating a fake account), hiding ties to other nodes (e.g., unfriending accounts), and preventing two nodes from being observed (e.g., getting other accounts deactivated or deleted). Refer to Figure 2 for legend.Motivating example
Manipulating the perception of a node’s influence has real-world applications, e.g., for boosting the ranking of a website. Similarly, there are use cases for aiming to appear less influential, e.g., authorities may want to understand adversarial strategies for concealing influence in networks, vulnerable agents or organizations may wish to diminish their measurable relevance, and individuals may seek increased privacy protection through obfuscating their power rankings [7]. Third, we explore strategies to prevent adversarial attacks on the perception of power and influence in graphs. In general, this can be done by putting securing measures in place to protect the structure of networks, or by designing measures or measurement strategies that are less susceptible to the kind of attack studied herein. We focus on the latter strategy because it operates on the graph analysis level.
In a previous study [8], we conducted a set of systematic and controlled experiments in which we tested the impact of parameter settings for network topology, adversarial moves, and node centrality rank change direction (increase or decrease) on changes in centrality measures. These experiments focused on finding a single adversarial move that results in promoting a node from the bottom (0–10th) percentile by increasing its centrality, and demoting a node from the upper (90–100th) percentile by decreasing its centrality in small and synthetic networks with 20 nodes (synthetic-small networks). The current paper further expands our understanding of adversarial attacks on network data by testing our approach on a larger variety of synthetic and empirical network data in order to arrive at more generalizable conclusions. More specifically, this paper extends Avram et al. [8] as follows:
- Experimentation on synthetic networks with 200 nodes (synthetic-large network).
- Experimentation on empirical networks with less than 1000 nodes (empirical-small network).
- Experimentation on empirical network with more than 1000 nodes (empirical-large network).
- Comparison of change in centrality measures across network topologies and sizes.
- Correlation between changes in centrality measures and node centrality ranks across attacks to explore an attack mitigation strategy.
Overall, our findings suggest that a small set of adversarial local and global moves can drastically increase or decrease a target node’s centrality rank across various network types and centrality measures. Furthermore, our study provides insights into the effectiveness of adversarial attacks on graphs of different size and origin (synthetic or empirical). For both synthetic and empirical network data sets, we observe that larger networks are less prone to adversarial attacks than smaller networks. For increasing ranks and centralities, more moves were identified than for decreasing them. Adversarial moves have a higher impact on cellular and small-world networks, while random and scale-free networks are harder to perturb. Also, empirical networks are harder to attack than synthetic networks. Finally, using a combination of betweenness centrality and eigenvector centrality measures can help to mitigate the effects of adversarial attacks on all networks.
We implemented our approach in a tool [9] that allows researchers to simulate adversarial attacks and explore mitigation strategies on their network data.
Our study advances the knowledge about the robustness of centrality measures in presence of adversarial attacks on network data. Furthermore, we establish a bridge between existent work on adversarial attacks on machine learning systems and the robustness of network centrality measures to changes in network data, and explore the mitigation of adversarial attacks on graph data by combining centrality measures with low correlation values.
2. Related Work
2.1. Adversarial Attacks
The analysis of adversarial attacks has been popularized in the field of machine learning, owing to the theory of Generative Adversarial Networks (GANs) [2]. GANs utilize a generator and a discriminator, with each aiming at increasing the loss of the other by changing its output. Work in this area has led to research on generating adversarial examples [10] by manipulating the input data in ways that are imperceptible to humans (e.g., the change in features is small as measured by some distance metric). These adversarial examples can cause a machine learning classifier to predict a label of their choice. For example, Eykholt et al. [3] have shown that minimal modifications to a stop road sign, e.g., with stickers or graffiti, can trick a classifier into interpreting the image as a speed limit sign. This approach has been popularized in the domain of computer vision, and its general notion has also been applied to other fields, such as text classification [5], speech recognition [4], and node classification in networks [11]. For text classification models, adversarial attacks have been used to change text elements, such as (characters in) words, to fool a machine learning algorithm into flipping the sentiment label for a piece of text data, e.g., from positive to negative [5]. In speech to text recognition, adversarial attacks have been used to perturb an audio waveform to change the output of the model to any desired text [4]. These approaches are often called targeted attacks. A comparison of various approaches is presented in Table 1. In this paper, we build upon this prior research by searching for strategies for generating minimal modifications of network data that result in changing the assessment of the power and influence of individual nodes in networks.

Table 1.
Comparison of Adversarial attacks in different domains.
2.2. Adversarial Attacks on Social Networks
The notion of changing social network data to yield various adversarial outcomes has practical implications, e.g., for information diffusion on social media and in offline networks, power dynamics in social systems, recommender systems, link prediction, and network security.
Waniek et al. [7] used a method called ROAM (Remove One, Add Many) to hide nodes from detection based on various ranking measures in social networks. Our study is closely related to theirs in that both papers model the notion of node hiding via changes to the local neighborhood of a node. However, our approach is broader as we also consider changes to the whole network, as well as aiming to make the target node more prominent in the network. Our experimental framework can also be extended to study strategies for making other network metrics more robust against adversarial pertubations. A brief comparison of Waniek’s and our approach is provided in Table 2. Yu et al. [11] modeled a social network as a Stackelberg game between a defender and an attacker to represent targeted information propagation in a network. Zhang et al. [12] modified the PageRank algorithm to render it insensitive to collusion attempts. Wang et al. [13] proposed GraphGAN, which uses a GAN to boost the performance of various graph analysis tasks, such as recommendation systems, link prediction, and node classification. Entezari et al. [14] proposed a method for perturbing neural network node/graph embeddings using a low-rank attack. Tang et al. [15] measured the social influence of nodes on co-author networks by combining network data with topic models from texts generated by these nodes. Based on that and inspired by the design of viral marketing strategies, they created an analysis framework for identifying a set of individual nodes that can be targeted for spreading content to maximize influence in a social network.
Table 2.
Comparison of our approach to Waniek et al. [7]
2.3. Network Robustness
A social network is represented as a graph (sets of vertices and edges) . An adversary’s goal can be assumed to be measured by some target function (e.g., ), and might be subject to some constraints (e.g., ). The purpose of an adversary might be to change the perception of the power and influence of some (groups of) nodes and edges. Prior literature has looked at the robustness of graph analysis metrics to various changes.Borgatti et al. [1] tested the impact of adding and removing nodes and edges on centrality measures. We borrow ideas from this approach, but focus on creating targeted attacks to change a specific (target) node’s rank. Valente et al. [16] found that centrality measures are on average strongly correlated, but provide distinct information in symmetric networks. Moreover, Schoch et al. [17] suggested that the correlation between various centrality measures is confounded by the network structure. Meo et al. [18] observed a correlation of centrality measures for question answering network data to measure the helpfulness ranking of a person, and found that Eigenvector centrality influences the helpfulness ranking the most. We used the same idea to conduct a correlation analysis between measures, which we then used to further investigate the correlation of the change of node centrality measures (and ranks) after performing adversarial moves across the synthetic and empirical networks of varying sizes. Karrer et al. [19] used an information-theoretic distance method called variation of information to test the robustness of network community structure to network perturbations. We used the same idea, defined the set of moves as possible perturbations, and distinguished the moves into ego level moves (local moves) versus moves anywhere in the network, including local moves (global moves, of which local moves are a subset).
Author name disambiguation also plays a key role in constructing networks from observed data. Kim and colleagues [20,21] evaluated the impact of insufficient or incorrect author name disambiguation on scholarly network metrics, the detection of key players and network topologies, and assumptions about underlying social processes on applicable theories of link formation in co-author networks. This idea was also extended to email networks in Diesner et al. [22]. Mishra et al. [23] have shown how flawed author name disambiguation can lead to false conclusions about gender biases in scientific publishing. Our study is related to this area of research, which examines how flaws in network data representation and pre-processing can incorrectly inflate or discredit the influence of nodes.
3. Methods
3.1. Experimental Design
In our previous study [8], we implemented an experimental framework that allowed us to find an optimal adversarial move that resulted in the maximal change in a given centrality measure for a target node (decreasing centrality measure from the top 10 percent centrality rank or increasing centrality measure from the bottom 10 percent centrality rank). We then used those optimal moves to carry out statistical analysis and draw inferences. Moreover, we also developed a tool to automate the proposed workflow. This experimental framework allows us to understand the effects of an adversarial attack on a network, and to find the perturbations that manipulate the graph data according to given target criteria. In this paper, we further expand this framework to accommodate for the analysis of larger as well as empirical networks, and explore an attack mitigation strategy. On a high level, our experiments can be described as: (a) simulating an adversary making changes to the network via a set of moves, (b) evaluating changes in the target node’s centrality, and (c) selecting the optimal (based on criteria described below) move set that can achieve the adversary’s goal of either increasing or decreasing the target node’s centrality sufficiently. For each optimal move per centrality measure, the framework calculates the correlation between the change in the node’s centrality rank for different centrality measures. High correlations make attacks harder to detect and low correlations make them harder to conceal, such that this step of considering multiple mainstream measures provides a mitigation mechanism against such attacks. A more detailed description of the framework is provided next.
3.1.1. Target Node Sampling
For a given network, we identify a target node by randomly selecting a node from a pre-specified percentile for a centrality measure of choice. For each network, we select a node from among the top x (=10) or bottom y (=10) percentile per centrality measure.
3.1.2. Adversarial Moves
In general, a network can be changed by either adding or removing nodes or edges. However, in practice, each of these changes may have associated costs that vary depending on the location of the node in the network, network structure, node evaluation metrics, and social context. Costs can represent, for example, feasibility and effort. For instance, dropping the link to an immediate friend from one’s online social network on services such as Facebook requires one click, and does not need the permission of the other party or multiple users. In offline settings, breaking the tie to a friend might involve higher costs. In our experiments, we classify the set of allowed moves as local moves, which can be performed within an ego network, or global moves, which are performed anywhere in the network. Examples of possible local and global moves are shown in Figure 2.
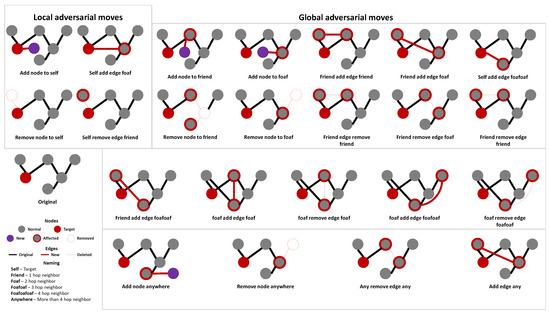
Figure 2.
Possible set of moves imposed on the target node (red) in a network.
3.1.3. Execution Time Limit
Besides the costs for adversarial moves, the size of the network (number of nodes) can affect the execution runtime for adversarial attack analysis. Searching for an optimal move in a large network can take a long time. Therefore, we introduced an execution time limit parameter to keep our adversarial attacks bounded, and set the value of this parameter to 15 min for each type of move for our experiments. If no eligible move that achieves the target function is found within this time limit, the experiment ends with no solution to the attack. Furthermore, the framework is built to prioritize attacks on nodes with higher centrality measures within the reach of the target node to limit the computational complexity of an experiment.
3.1.4. Evaluation of Perturbed Networks
Using the set of possible adversarial moves as a reference, the experimental framework tries each move, and computes the evaluation metrics for the target node. Each move results in a reduction in budget for future moves based on the move’s cost. Successive moves are applied to the updated network until the move budget is exhausted or the experiment times out. The move set causing the largest change in the evaluation metric for the target node is recorded. If multiple moves result in the same change in evaluation metrics, all moves are recorded in the results file and are considered for analysis. An important subtlety here is that, for each eligible move, the framework takes a greedy approach to carrying out that move. For example, on a move self_remove_edge_friend with the goal being a decrease in closeness centrality, the framework will try all possible changes for the target node, and execute the move that is equivalent to removing an edge to the immediate friend of the target node. The move that satisfies the evaluation criterion the most (decreasing closeness centrality) is selected as the optimal move, and the adversarial perturbation is considered a success. This methodology extends to all of the moves and sets of moves that result in a perturbation, and to all perturbations found by our framework.
3.2. Data Sets
We ran our experiments on a mix of synthetic (ideal topologies) and empirical (possibly mixed topologies) networks of varying sizes.
3.2.1. Synthetic Networks
We generated small networks with 20 nodes and large networks with 200 nodes to understand if the size of the network affects adversarial moves. For each synthetic network, we considered the following topologies:
- Small-World Networks: A small-world network is parameterized via k and p. The parameter k defines the number of neighbors that a new node can be further connected to during graph generation. The parameter p defines the probability of rewiring an edge. We used and for generating small-world networks [24,25].
- Scale-Free Networks: Scale-free networks are parameterized via m, where m represents the number of edges that are preferentially attached to existing nodes based on their degree. We used for generating scale-free networks [26].
- Random Networks: A random network is parametrized via p. Here, p is the probability of creating a new edge when generating the network. We used for generating random networks [27].
- Cellular Networks: We generate cellular networks by generating five random networks (with as discussed previously) with 20 nodes each (total of 100 nodes) for small networks, and 40 nodes each (total 200 nodes) for large networks. Each pair of networks is then connected by an edge between a randomly selected pair of nodes in those networks.
We generated 50 networks for each topology. This results in 800 (50*4*2*2) experiments per topology across centrality measures (4), change direction (2), and reach (2).
3.2.2. Empirical Networks
We leveraged existing empirical network data sets as outlined in Table 3. Similar to the synthetic network data, we divided the selected empirical data sets into small and large networks. To increase the number of experimentation samples, the framework randomly picks up to five nodes from each network as the target node for each attack type.
Table 3.
Details on empirical network data sets.
In real-world scenarios, adversarial moves can have a different meaning and costs depending on the given context. For example, in the drug network, an added node represents a new drug addict, and a removed node can represent a person going into rehab, among other options. Similarly, adding an edge can mean making acquaintance with another drug user, while removing an edge means having two users stop their relationship. In a transportation network, such as the U.S. flights graph, adding or dropping a node can mean opening or closing an airport, respectively; and adding or removing an edge would mean to release or discontinue a flight route.
Our experimental framework makes two assumptions. First, we assume undirected networks. As a consequence, we convert empirical directed networks into undirected ones. Changing this to handle directed graphs would require additional complexity for computing centrality measures. Second, we only consider static networks (one snapshot per graph). As a consequence, for over-time empirical networks, we only consider the latest state of the network for analysis.
3.3. Experimental Setup
We aim to identify if patterns of cheap (cost = 1) adversarial perturbations (across moves with uniform costs) can be identified across common network topologies. Our goal is to identify if we can increase or decrease four commonly used centrality measures (degree, closeness, betweenness, and eigenvector) via such moves from the set of eligible local and global moves for a randomly selected target node. Our generated experimental data will be available from [39].
3.3.1. Centrality Measurement
We measure the network-based power and influence of a target node using the following standard centrality measures:
- Degree centrality: counts the number of neighbors per node;
- Closeness centrality: measures how close a node is to other nodes in the network;
- Betweenness centrality: measures the number of times a node is located on the shortest path between a pair of nodes;
- Eigenvector centrality: is recursively defined as a node being connected to other influential nodes with respect to node degree.
3.3.2. Sampling Tier
We used a random sampling strategy for each experiment to pick a target node. We rank-ordered the nodes in a given network based on their percentile ranks for a given centrality measure (node’s centrality rank). The percentiles were divided into 10 tiers, and nodes were placed into their respective tier. Nodes were then randomly sampled from the specified tier. In this study, we experimented with performing adversarial perturbations of nodes from the lowest percentile (0–10th%) and highest percentile (90–100th%). The goal for the adversarial attack is to maximize either the increase or decrease of the target node’s rank.
3.3.3. Reach Type
We evaluated the effect of the adversarial attack for two types of moves (reach type):
- Local moves: performing an adversarial attack on the adversary’s ego network.
- Global level moves: performing an adversarial attack anywhere in the network, including within the target node’s ego-network.
4. Experimentation Tool for Testing and Mitigating Adversarial Attacks on Networks
In order to allow other researchers to test and use our adversarial attack framework for analyzing their network data, we have developed a tool [9] that supports the simulations of adversarial attacks on networks with analysis, visualization of results, and centrality measure comparison for attack mitigation. This tool can be utilized for running exhaustive searches for adversarial moves with varying move costs on small to medium sized networks. The tool is implemented in Python, supports parallel processing, and leverages the NetworkX [40] library for loading graph data. In general, this tool has four main functions:
- (1)
- Generate synthetic networks: The tool can import predefined network data (in edge list format) through the configuration file. Alternatively, the user can generate synthetic graphs with a script. The script allows the user to tweak the parameters for generating graphs, including the type and number of graphs. This script uses NetworkX Graph Generators, which provides documentation for how these generators work. In this version, we support the construction of four network types: scale-free, small-world, random, and cellular, as defined in Section 3.2.1.
- (2)
- Generate experiment configuration: Once an edge list is created, we can generate a configuration file for our experiment network tool. We prepared a script that creates bulk/batch configuration files to run experiments. The configuration files follow a specific data model that is saved as a JSON structure (more details in the repository). This script generates many configuration files and folders in the output-experiments target folder. One configuration file represents one experiment.
- (3)
- Adversarial attack framework runtime: The runtime script is the main implementation of the experimental framework we proposed in Section 3.1. This script executes an experiment based on the configuration file provided. Depending on what moves and goals were specified in the configuration file, the tool will find all possible adversarial moves given the adversarial budget, available moves, and respective cost, within the time limit period. All experiment configurations will be executed in parallel. After moves have been executed and evaluation metrics have been calculated, the tool chooses the optimal move based on the largest change in the evaluation metric for the target node. The runtime will save the optimal move, the network data, and centrality measures before and after adversarial attack execution as the result of each experiment.
- (4)
- Result analysis and visualization: Besides the experimental framework, we also provide a Jupyter Notebook script that helps to visualize the results of these experiments. The notebook will aggregate all experimental results from the runtime, and plot the set of optimal moves for each network type and change in centrality measure. The analysis also includes the move and cross-measures comparison and correlation between centrality measures and ranks for the purpose of attack mitigation.
The detailed workflow for the experimental design executed by this tool is presented in Figure 3. This tool enables the reproducibility of our framework and results, and can facilitate further research in this area.
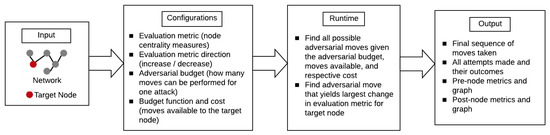
Figure 3.
Adversarial network experimentation tool workflow.
5. Results and Discussion
Before delving into the analysis, it is important to note that the centrality measures we consider for our analysis are highly correlated with each other as shown in [16]. Hence, it is natural that if an adversarial move results in the change of a centrality measure in a specific direction, the change might be similar for other centrality measures.
5.1. Optimal Moves across Configurations
5.1.1. Optimal Moves for Synthetic Networks
Our first analysis identifies the frequency of various optimal moves across different combinations of network type, centrality measures, tier change direction, and reach type, as shown in Figure 4.
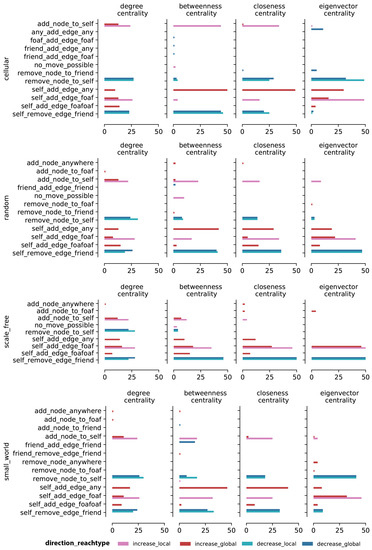
Figure 4.
Optimal move counts per centrality measure and topology for small synthetic networks. The graph shows the frequency counts aggregated across 50 experiments for the optimal moves for small (20 nodes) synthetic networks across different centrality measures and network topologies. The x-axis shows the frequency counts for the optimal moves and the y-axis shows the different optimal moves.
Unsurprisingly, we observe that decreasing centrality measures is mostly accomplished by removing an edge or a node, while increasing centrality measures is mostly accomplished by adding an edge or a node. There are additional common trends across all four topologies, as shown in Figure 5: self_remove_edge_friend and remove_node_to_self are two common moves for decreasing centrality measures; add_node_to_self, self_add_edge_foaf, and self_add_edge_any are three common moves for increasing centrality measures.
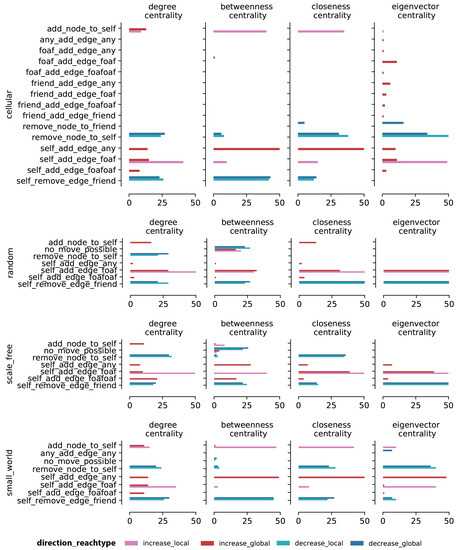
Figure 5.
Optimal move counts per centrality measure and topology for large synthetic networks. The graph shows the frequency counts aggregated across 50 experiments for optimal moves for big (200 nodes) synthetic networks across different centrality measures and topologies. The x-axis shows the frequency counts for the optimal moves and the y-axis shows the different optimal moves.
The remove_node_to_self (106 cases over 400 experiments) and self_remove_edge_friend (292 cases over 400 experiments) are the most frequent optimal adversarial moves across all centrality measures for decreasing influence, both locally and globally, in random networks. In a couple of experiments, no_move_possible was found for betweenness centrality. This result can be explained by the fact that node degree is normally distributed in a random graph, meaning that there is only a small group of nodes that falls within the top and bottom 10 percent of degree centrality. To increase or decrease betweenness centrality means to increase or decrease the number of shortest paths that pass through these target nodes. This can be done, ideally, by connecting a target node to a high degree node because there is a high chance that such a node will serve as a shortcut to other nodes. However, given the normal node degree distribution, adding or removing a node or an edge might not have a meaningful impact on the number of shortest paths through the target node, unless there is a move that allows the target node to connect to or to be disconnected from a high degree node. The pattern is more diverse for increasing influence, where the most prominent move sets differ for local and global reach type: Since the majority of nodes in a random graph has similar centrality measures, the low degree nodes just need to get connected to high degree nodes in order to boost their importance within the network. The best move depends on the position of the target node, i.e., on how many steps it is away from high degree nodes. To increase influence, adding an edge outside of the ego network is most effective.
For scale-free graphs, optimal adversarial moves that boost centrality measures are more local compared to random graph (see Figure 4). The bottom 10 percent degree centrality nodes make up the majority of nodes in this topology because node degree in scale-free networks follows a power-law distribution. To move up the centrality measure ladder, the target node needs to connect to the small ratio of nodes that are high in degree centrality. This centrality distribution pattern is similar to the degree distribution on the random networks, where the nodes of high importance only make up a small percent of all nodes. For the scale-free topology, a couple of experiments also resulted in no_move_possible for betweenness centrality. With most nodes having a low degree centrality, it might be hard for a target node to move across the centrality gradient. The self_remove_edge_friend is the most frequently selected adversarial move for decreasing most centrality measures except for degree.
For small-world networks, the patterns for decreasing centrality measures are similar to those for random graphs, except for eigenvector centrality, where the most prominent move is remove_node_to_self. A node can have high eigenvector centrality if it is connected to other important nodes, even if the node itself does not have a high degree. Hence, the removal of a node’s highly connected neighbor will cause more damage to the ego’s eigenvector centrality than removing an edge. The diversity of moves for increasing centrality measures is similar for small-world and random graphs.
Finally, for cellular networks, the patterns are similar to those for small-world networks, with slightly more prominence of add_node_to_self for decreasing eigenvector centrality. Note that we are adding a node in order to decrease centrality: A node having high eigenvector centrality means that this node is directly linked to other important nodes such that if a node is added, the additional link to this extra node will dilute the target node’s eigenvector centrality.
5.1.2. Optimal Moves Comparison between Small and Large Synthetic Networks
As shown in Figure 4 and Figure 5, optimal adversarial move results are similar for small and large synthetic networks. However, our framework often failed to return an optimal move for larger networks, which might be due to the framework reaching the timeout limit. This can be seen in the number of in the chart. In particular, the attack failed for almost half of the experiments for betweenness centrality on random and scale-free networks.
The results from these experiments provide three insights: First, given the constraints we imposed on our experiments, smaller networks are more susceptible to adversarial attacks than larger networks. This is expected for large networks as a simple one-step move might not affect the target node’s centrality measure. Second, in larger networks, betweenness centrality ranks are harder to manipulate than ranks based on other centrality measures since for betweenness, centrality ranks depend on connections between network clusters, and manipulating those can be costly. Finally, for large networks, random and scale-free networks are harder to attack compared to small-world and cellular networks due to their network structure: As the node degree follows a Gaussian distribution in random graphs and a power-law distribution in scale-free networks, the effort to change centrality measures increases with network size, potentially beyond our execution time limit.
From these results, we can also conclude that to defend a network from an adversarial attack, we can (a) enhance the robustness of a network’s structure, e.g., by adding nodes and/or edges, or (b) provide network metrics that are harder to manipulate, as explored later in this paper.
Overall, we find that the dominant moves for decreasing a target node’s centrality measure are removing a node connected to the target node (ego) and removing an edge between ego and an immediate neighbor. This pattern is consistent across various repetitions of combinations of network types, centrality measures, change directions, and reach types. For increasing centrality measures, we observe a slightly higher diversity in the best adversarial moves across our experimental settings. It is important to note that an adversarial move may not only affect the centrality measures of an ego and its neighbors, but also the measures of other nodes in the network. For example, removing the edge between two nodes not only affects their degree centrality, but may also affect closeness, betweeness, and eigenvector centrality of other nodes, thereby changing the overall node’s centrality ranks.
5.1.3. Optimal Moves for Empirical Networks
We used eleven empirical network data sets from various domains, e.g., transportation and social media. The results show that the optimal moves identified by the framework are the same as those for synthetic networks, with lower variability in the move types. As shown in Figure 6, 11 types of optimal moves are recorded for all empirical networks data, whereas, for synthetic networks (Figure 4), 21 different moves were recorded as optimal moves. and are the most frequently picked moves for decreasing degree, closeness, and eigenvector centrality. In addition, and are the most frequently picked local moves for increasing all centralities for the target node. Decreasing betweenness centrality is hard to achieve for large empirical networks, given the frequent result of . These findings are consistent with our findings for large synthetic networks. Since the empirical network data sets (more than 1000 nodes in each of them) are bigger than the synthetic ones, the framework might time out before finding a solution.
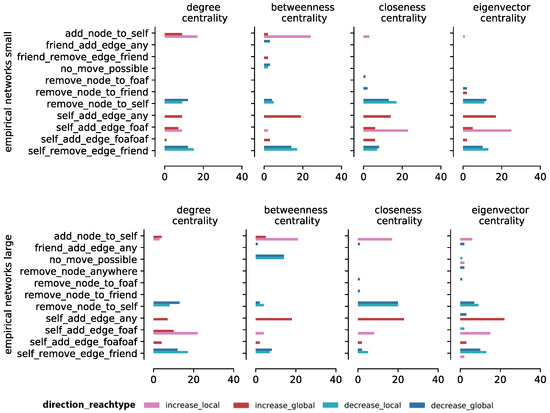
Figure 6.
Optimal move counts per centrality measure for small and large empirical network data sets. The top graphs show the frequency of the optimal move counts for small empirical networks and the bottom graphs show the frequency of the optimal move counts for large empirical networks. The x-axis shows the frequency counts for the optimal moves, and the y-axis shows the different optimal moves.
Structure has an important impact on network robustness: Networks with higher clustering coefficients tend to be less prone to attacks on betweenness centrality. A high clustering coefficient occurs when many of a node’s friend know each other. For instance, in the U.S. flights network, a high clustering coefficient means that an airport offers flights to other airports that also run flights to each other, such that if a flight gets cancelled, passengers can book an alternative route to reach the same destination. For this reason, it is hard to decrease the betweenness centrality of an airport since betweenness is a function of the percentage of shortest paths that go through the node such that dropping one edge has only a minor impact on that node’s betweenness centrality.
5.2. Change in Centrality Measures after Adversarial Moves
For our second set of analysis, we focus on the absolute change in the centrality measure of the target node after an attack. This helps to identify (a) the impact of an adversarial strategy on the centrality measure, and (b) the sensitivity of centrality measures to these strategies. The change in centrality measures or outcome differences is the absolute difference between the centrality measure of the target node in the original and perturbed network.
5.2.1. Change in Centrality Measures for Synthetic Networks
In Figure 7, we show the distribution of change in the target node’s centrality measures after the optimal adversarial moves have been executed. The figure does not contain degree centrality changes as these changes after optimal moves are either for all cases (add 1 for adding an edge and subtract 1 for deleting an edge).
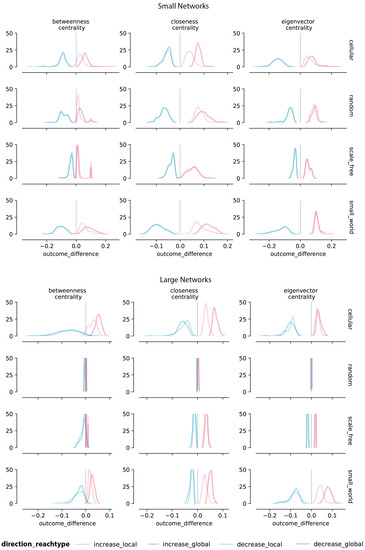
Figure 7.
Distribution of changes in centrality measures (outcome_difference) of the target node before and after an attack across 50 randomly generated small (20 nodes) and large (200 nodes) synthetic networks per topology (row). Colors represent directionality, reach type, and size per experiment, as shown in the key.
For decreasing centrality measures, we observe similar patterns for local and global moves. This outcome is also due to the fact that global moves are a super-set of local moves, resulting in a local move being selected in both cases if this move is indeed optimal. However, for increasing centrality measures, significantly larger changes were observed for global moves compared to local ones. As we can see from Figure 7, the outcome distribution for global moves is shifted to the right side of the outcome distribution of the local moves for cellular and small-world networks.
Figure 7 also shows the change in centrality measures for large synthetic networks. As the measures turnover plot shows, there are significant differences in the change of centrality measures (outcome difference) between small and large networks. First, from the outcome difference (x-axis) of the histogram plot, we can see that attacks on larger networks have less effect on centrality measures compared to smaller networks. Small networks have about a 0.1 turnover mean from the original centrality measures, while for large networks, the turnover mean is less than 0.05. Thus, compared to the small network experiments that have outcome differences ranging from –0.2 to 0.2, the range for the large network experiments is smaller (from –0.1 to 0.1). Furthermore, the outcome differences for large random and scale-free networks are concentrated around 0.01. As we can see, for these networks, the histograms are narrowed close to the 0 value for all centrality measures, meaning that with a budget of = 1, these attacks have only a minor impact on shifts in centrality measures (see Table 4).
Table 4.
Evaluation and percentile difference across synthetic network results. is the mean difference in centrality measure before and after an attack; is the mean difference in target node centrality ranks (percentiles) before and after an attack.
Besides changing the target node’s centrality measures, the optimal move is also changing the target node’s centrality rank. We compute the centrality ranks before and after the optimal adversarial moves, and compare the rank differences as moving percentiles. Table 4 summarizes how the network type and size affect the evaluation metrics and moving percentiles. On average, the optimal moves for increasing centrality measure can move the target node’s ranking percentile by 40–80% for cellular and small-world networks, and by 16–30% for random and scale-free networks. An exception are large random networks, where we found a smaller impact on centrality ranks (only 2–3% rank shift) compared to the other types of large networks.
Decreasing a node’s centrality rank is harder than increasing its centrality rank, as can be seen in Table 4. For cellular and small-world networks, the decrease in percentage ranking for betweenness and closeness centralities ranges from 25–50% after the adversarial attack, which is comparatively less than the changes in ranking for increasing centrality (40–80%). Random and scale free data are subject to less of a change with 4–25% for the decrease in the percentage ranking, and 2–38% changes for the increase percentage ranking for all centrality measures. This observation suggests that for random and scale-free networks, it is comparably harder to perturb the target node’s centrality ranking with a single move compared to small-world and cellular networks.
5.2.2. Change in Centrality Measures for Empirical Networks
The changes in centrality measures of target nodes after an attack in empirical networks exhibit the same pattern as we saw for synthetic networks (Figure 8). For increasing centrality measures, global moves lead to larger outcome differences for all centrality measures compared to local moves. For decreasing centrality measures, the global and local moves exhibit similar outcome differences. The empirical networks (both small and large) also exhibit smaller changes in outcome difference patterns for larger networks compared to smaller networks. This pattern is more prominent for eigenvector and betweenness centrality. As we can see, the distribution peak of outcome differences for large networks is close to 0 compared to small networks. This also confirms our finding for synthetic networks, where perturbing these two measures in large networks was harder than in small networks.
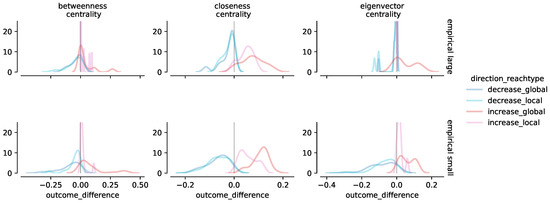
Figure 8.
Distribution of change in centrality measures (outcome_difference) of the target node before and after an attack across small and large empirical network. Colors represent directionality and reach type.
Table 5 summarizes optimal moves for empirical networks depending on network size and centrality measures. The results for increasing centrality measures are largely consistent with the findings for synthetic networks, where optimal moves have a higher impact on changes in centrality measures compared to decreasing centrality measures. Experiments for decreasing centrality measures exhibit a 4% to 28% change in target node centrality ranks, whereas experiments for increasing centrality measures exhibit a 17% to 78% change in node centrality ranks. Specifically, the change in ranking for increasing centrality measures via global moves is consistently greater than that via local moves across all centrality measures; ranging from 45% to 78% of changes in node centrality ranks.
Table 5.
Evaluation and percentile difference across empirical network results. is the mean difference in centrality measures before and after an attack; is the mean difference in node’s centrality rank (percentile) before and after an attack.
5.3. Centrality Measures Correlation Analysis as a Strategy for Mitigation of Attacks
Identifying the effectiveness of attacks depending on various parameters is a precondition for exploring strategies for preventing such attacks. The strategy we test herein is to compute multiple centrality measures on the original and manipulated data. For each experiment, we compute all centrality measures of the target node before and after the attack. This includes the original measure that is used to find the optimal move as well as the other centrality measures. Using this method, we can compare the effect of an optimal move for one centrality measure, and see if this is also an optimal move to change the other centrality measures. Since the scales of centrality measures might not be the same, instead of using the measures, we assess the change in node centrality ranks (as measured in percentiles). We then calculate the change in target node centrality ranks for every optimal move, and compute the Spearman correlation coefficient between changes for all pairs of centrality measures. Figure 9 shows the correlation between the four centrality measures for different graph types.
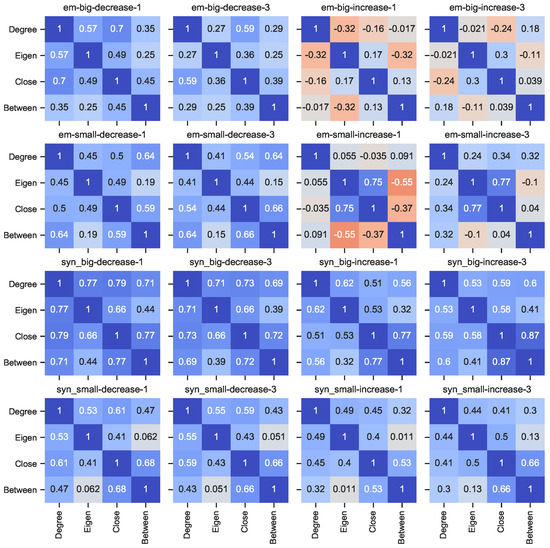
Figure 9.
Heat map of correlation between change in target node centrality ranks (percentiles) for all four centrality measures per network size and origin. Syn stands for synthetic networks and em stands for empirical networks. 1 indicates local reach type and 3 indicates global reach type.
For decreasing a target node’s centrality rank, in general, the results for both empirical and synthetic networks show a positive correlation across centrality measures for the optimal moves. This correlation means that an optimal move that demotes the target node’s centrality rank on one centrality measure also demotes the rank of the same node based on other centrality measures. We also found that the correlation between centrality measures for empirical networks is lower than for synthetic networks. This indicates that attacks on empirical networks can be efficient for one centrality measure but not on other centrality measures, making it easier to prevent such attacks. Besides that, for all tested networks, betweenness and eigenvector centrality measures have a low correlation with each other(below 0.5). This indicates that the optimal move that changes the target node’s eigenvector centrality rank may not necessarily change its betweenness centrality rank by the same amount, and vice versa.
For increasing the centrality measure of a target node, our results suggest that there is a high variance in the correlation between various node centrality rank changes, meaning that the adversarial move may not change all the centrality measures in the same direction. For synthetic networks, there is a positive correlation between all node centrality rank changes for big and small networks, which indicates that optimal moves that promote the rank of a target node on one measure also promote the node’s centrality rank based on other measures. Similar to decreasing centrality measure of a target node, the delta in a node’s centrality rank for betweenness and eigenvector centrality has a low correlation compared to that for degree and closeness centrality. For empirical networks, degree centrality has a negative correlation with eigenvector, closeness, and betweenness centrality. Moreover, eigenvector centrality is negatively correlated with betweenness centrality. For example, for large empirical networks, when executing optimal local moves, the correlation of degree with eigenvector (–0.32), closeness (–0.16), and betweenness (–0.017) centrality is negative. This indicates that a move that most impacts a shift in a target node’s degree centrality rank does not change the target node’s rank based on other centrality metrics in the same direction.
Based on these observations, combining low correlated centrality measures might help to mitigate adversarial attacks on changes in target node centrality ranks. One possible solution to implement this strategy is to use both betweenness and eigenvector centrality as they have a low (or negative) correlation for synthetic and empirical networks in both change directions. Specifically for empirical networks, combining these two centrality measures can be effective in mitigating the type of attack studied in this paper because these two measures have low correlation with each other. One possible reason for the different patterns of correlation of change in node centrality ranks for empirical networks might be that such networks might entail a mix of topologies.
6. Conclusions
In this study, we have designed, implemented, and tested an experimental framework that allows network analysis researchers to experimentally identify patterns and insights related to manipulating network data such that a node’s centrality rank is altered, and suggest how to mitigate such an adversarial data manipulation. Specifically, we analyzed adversarial attempts to boost or demote the degree to which others perceive a target node as powerful and influential in a network. The introduced framework allows us to study the impact of adversarial attacks on targets and victims, and to design strategies for boosting security and mitigating adversarial network perturbations. With this framework, an experiment can be executed to study how a target node in a network can change its centrality rank by perturbing the network data via local or global moves.
Our experimental results revealed how an adversary might manipulate a network using a limited set of moves across common network types, possible reach types, and centrality measures. We also found that ego-level moves are often sufficient to achieve the adversary’s objective. Finally, most of the tested network topologies are susceptible to the outlined attacks. Our findings also validate the approach taken by Waniek and colleagues [7] for decreasing node ranking.
Furthermore, our study provides insights into the effectiveness of adversarial attacks depending on different features of a graph. We observed that larger networks are less prone to adversarial attacks than smaller networks, for both synthetic and empirical data sets. Moreover, the set of moves that enable the largest changes in centrality measures are similar for both small and large empirical networks across different centrality measurements. These results advance our knowledge on how network size and structure impact network resilience to adversarial attacks.
Our study also explores a possible solution to defend a network against the analyzed type of attacks by combining multiple measures that are weakly correlated with each other. More work is needed to identify how these measures can be best combined to prevent an adversary from changing the a target node’s centrality rank.
Overall, our framework focuses on the effect of adversarial attacks on social network data. Optimal adversarial moves might require different ’costs’ in different real-world scenarios. For example, in an online social network, adding a friend can be harder than deleting a friend since it requires approval or action from both sides, while deleting a friend consists only of a single-sided decision of pressing the ’delete’ button. Therefore, non-uniform costs for adversarial moves can be added into the evaluation of empirical networks. Moreover, in real-world networks, it is often hard to capture complete network data. Therefore, in the future, we plan to expand our work to run experiments on partially observable networks to understand the degree of confidence of the observed optimal moves given certain levels of missing data (nodes and edges).
Author Contributions
Conceptualization, N.N.P., S.M., and J.D.; Formal analysis, N.N.P., T.L., S.M., and J.D.; Software, N.N.P., S.M., and M.A.; Supervision, J.D.; Visualization, N.N.P., T.L., and S.M.; Writing—original draft, N.N.P., T.L., S.M., M.A., and J.D.; Writing—review and editing, S.M. and J.D. All authors have read and agreed to the published version of the manuscript.
Funding
Research reported in this paper was sponsored in part by the Army Research Laboratory under Cooperative Agreement W911NF-17-2-0196. The views and conclusions contained in this document are those of the authors and should not be interpreted as representing the official policies, either expressed or implied, of the Army Research Laboratory or the U.S. Government. The U.S. Government is authorized to reproduce and distribute reprints for Government purposes notwithstanding any copyright notation from here on. We also acknowledge Alaine Martaus’ help with editing this manuscript.
Conflicts of Interest
The authors declare no conflict of interest.
Abbreviations
The following abbreviations are used in this manuscript:
| SNA | Social Network Analysis |
| GAN | Generative Adversarial Network |
| ROAM | Remove One, Add Many |
| GraphGAN | Graph Generative Adversarial Network |
| CS | Computer Science |
| PhD | Doctor of Philosophy |
| U.S. | United States |
| HIV | Human Immunodeficiency Virus |
| JSON | Java Script Object Notation |
References
- Borgatti, S.P.; Carley, K.M.; Krackhardt, D. On the robustness of centrality measures under conditions of imperfect data. Soc. Netw. 2006, 28, 124–136. [Google Scholar] [CrossRef]
- Goodfellow, I.; Pouget-Abadie, J.; Mirza, M.; Xu, B.; Warde-Farley, D.; Ozair, S.; Courville, A.; Bengio, Y. Generative adversarial nets. In Proceedings of the Neural Information Processing Systems 2014, Montreal, QC, Canada, 8–13 December 2014; pp. 2672–2680. [Google Scholar]
- Eykholt, K.; Evtimov, I.; Fernandes, E.; Li, B.; Rahmati, A.; Xiao, C.; Prakash, A.; Kohno, T.; Song, D. Robust Physical-World Attacks on Deep Learning Visual Classification. In Proceedings of the IEEE Conference on Computer Vision and Pattern Recognition (CVPR), Salt Lake City, UT, USA, 18–23 June 2018. [Google Scholar]
- Carlini, N.; Wagner, D. Audio adversarial examples: Targeted attacks on speech-to-text. In Proceedings of the 2018 IEEE Security and Privacy Workshops (SPW), San Francisco, CA, USA, 24 May 2018; IEEE: Piscataway, NJ, USA, 2018; pp. 1–7. [Google Scholar]
- Ebrahimi, J.; Rao, A.; Lowd, D.; Dou, D. HotFlip: White-Box Adversarial Examples for Text Classification. In Proceedings of the 56th Annual Meeting of the Association for Computational Linguistics (Volume 2: Short Papers); Association for Computational Linguistics: Melbourne, Australia, 2018; pp. 31–36. [Google Scholar] [CrossRef]
- Chen, J.; Wu, Y.; Xu, X.; Chen, Y.; Zheng, H.; Xuan, Q. Fast gradient attack on network embedding. arXiv 2018, arXiv:1809.02797. [Google Scholar]
- Waniek, M.; Michalak, T.P.; Wooldridge, M.J.; Rahwan, T. Hiding individuals and communities in a social network. Nat. Hum. Behav. 2018, 2, 139–147. [Google Scholar] [CrossRef]
- Avram, M.V.; Mishra, S.; Parulian, N.N.; Diesner, J. Adversarial perturbations to manipulate the perception of power and influence in networks. In Proceedings of the 2019 IEEE/ACM International Conference on Advances in Social Networks Analysis and Mining, Vancouver, BC, Canada, 27–30 August 2019; pp. 986–994. [Google Scholar]
- Avram, M.V.; Mishra, S.; Parulian, N.N.; Chin, C.L.; Diesner, J. Social Network Adversarial Perturbations. 2019. Available online: https://github.com/uiuc-ischool-scanr/social-network-adversarial-perturbations (accessed on 1 June 2020).
- Goodfellow, I.; Shlens, J.; Szegedy, C. Explaining and Harnessing Adversarial Examples. In Proceedings of the International Conference on Learning Representations, San Diego, CA, USA, 7–9 May 2015. [Google Scholar]
- Yu, S.; Vorobeychik, Y.; Alfeld, S. Adversarial Classification on Social Networks. In Proceedings of the 17th International Conference on Autonomous Agents and MultiAgent Systems, AAMAS ’18, Stockholm, Sweden, 10–15 July 2018; International Foundation for Autonomous Agents and Multiagent Systems: Richland, SC, USA, 2018; pp. 211–219. [Google Scholar]
- Zhang, H.; Goel, A.; Govindan, R.; Mason, K.; Roy, B.V. Making Eigenvector-Based Reputation Systems Robust to Collusion. In Algorithms and Models for the Web-Graph Lecture Notes in Computer Science; Springer: Berlin/Heidelberg, Germany, 2004; pp. 92–104. [Google Scholar] [CrossRef]
- Wang, H.; Wang, J.; Wang, J.; Zhao, M.; Zhang, W.; Zhang, F.; Xie, X.; Guo, M. GraphGAN: Graph Representation Learning With Generative Adversarial Nets. In Proceedings of the Thirty-Second AAAI Conference on Artificial Intelligence, New Orleans, LA, USA, 2–7 February 2018. [Google Scholar]
- Entezari, N.; Al-Sayouri, S.A.; Darvishzadeh, A.; Papalexakis, E.E. All You Need Is Low (Rank) Defending Against Adversarial Attacks on Graphs. In Proceedings of the 13th International Conference on Web Search and Data Mining, Houston, TX, USA, 3–7 February 2020; pp. 169–177. [Google Scholar]
- Tang, J.; Sun, J.; Wang, C.; Yang, Z. Social influence analysis in large-scale networks. In Proceedings of the 15th ACM SIGKDD International Conference on Knowledge Discovery and Data Mining, Paris, France, 28 June –1 July 2009; ACM: New York, NY, USA, 2009; pp. 807–816. [Google Scholar]
- Valente, T.W.; Coronges, K.; Lakon, C.; Costenbader, E. How Correlated Are Network Centrality Measures? Connect (Tor) 2008, 28, 16–26. [Google Scholar] [PubMed]
- Schoch, D.; Valente, T.W.; Brandes, U. Correlations among centrality indices and a class of uniquely ranked graphs. Soc. Netw. 2017, 50, 46–54. [Google Scholar] [CrossRef]
- Meo, P.D.; Musial-Gabrys, K.; Rosaci, D.; Sarnè, G.M.; Aroyo, L. Using centrality measures to predict helpfulness-based reputation in trust networks. ACM Trans. Internet Technol. (TOIT) 2017, 17, 1–20. [Google Scholar] [CrossRef]
- Karrer, B.; Levina, E.; Newman, M.E.J. Robustness of community structure in networks. Phys. Rev. E 2008, 77. [Google Scholar] [CrossRef] [PubMed]
- Kim, J.; Diesner, J. Distortive effects of initial-based name disambiguation on measurements of large-scale coauthorship networks. J. Assoc. Inf. Sci. Technol. 2015, 67, 1446–1461. [Google Scholar] [CrossRef]
- Kim, J.; Diesner, J. The effect of data pre-processing on understanding the evolution of collaboration networks. J. Inf. 2015, 9, 226–236. [Google Scholar] [CrossRef]
- Diesner, J.; Evans, C.; Kim, J. Impact of Entity Disambiguation Errors on Social Network Properties. In Proceedings of the International AAAI Conference on Web and Social Media, Oxford, UK, 26–29 May 2015. [Google Scholar]
- Mishra, S.; Fegley, B.D.; Diesner, J.; Torvik, V.I. Self-citation is the hallmark of productive authors, of any gender. PLoS ONE 2018, 13, e0195773. [Google Scholar] [CrossRef] [PubMed]
- Barrat, A.; Weigt, M. On the properties of small-world network models. Eur. Phys. J. B-Condens. Matter Complex Syst. 2000, 13, 547–560. [Google Scholar] [CrossRef]
- Humphries, M.D.; Gurney, K. Network ‘small-world-ness’: A quantitative method for determining canonical network equivalence. PLoS ONE 2008, 3, e0002051. [Google Scholar] [CrossRef] [PubMed]
- Magner, A.; Janson, S.; Kollias, G.; Szpankowski, W. On symmetry of uniform and preferential attachment graphs. Electron. J. Comb. 2014, 21, 3–32. [Google Scholar] [CrossRef]
- Yates, P.D.; Mukhopadhyay, N.D. An inferential framework for biological network hypothesis tests. BMC Bioinform. 2013, 14, 94. [Google Scholar] [CrossRef] [PubMed]
- Weeks, M.R.; Clair, S.; Borgatti, S.P.; Radda, K.; Schensul, J.J. Social networks of drug users in high-risk sites: Finding the connections. AIDS Behav. 2002, 6, 193–206. [Google Scholar] [CrossRef]
- Grund, T.U.; Densley, J.A. Ethnic homophily and triad closure: Mapping internal gang structure using exponential random graph models. J. Contemp. Crim. Justice 2015, 31, 354–370. [Google Scholar] [CrossRef]
- Freeman, L.C. Finding Social Groups: A Meta-Analysis of the Southern Women Data; The National Academies Press: Washington, DC, USA, 2003. [Google Scholar]
- Knuth, D.E. The Stanford GraphBase: A Platform for Combinatorial Computing; AcM Press: New York, NY, USA, 1993. [Google Scholar]
- Zachary, W.W. An information flow model for conflict and fission in small groups. J. Anthropol. Res. 1977, 33, 452–473. [Google Scholar] [CrossRef]
- Rossi, R.A.; Ahmed, N.K. The Network Data Repository with Interactive Graph Analytics and Visualization. In Proceedings of the Twenty-Ninth AAAI Conference on Artificial Intelligence, Austin, TX, USA, 25–30 January 2015. [Google Scholar]
- Johnson, D.S. The genealogy of theoretical computer science: A preliminary report. ACM SIGACT News 1984, 16, 36–49. [Google Scholar] [CrossRef]
- Opsahl, T.; Agneessens, F.; Skvoretz, J. Node centrality in weighted networks: Generalizing degree and shortest paths. Soc. Netw. 2010, 32, 245–251. [Google Scholar] [CrossRef]
- Morris, M.; Rothenberg, R. HIV Transmission Network Metastudy Project: An Archive of Data From Eight Network Studies, 1988–2001; Inter-university Consortium for Political and Social Research: Ann Arbor, MI, USA, 2011. [Google Scholar]
- Guimera, R.; Danon, L.; Diaz-Guilera, A.; Giralt, F.; Arenas, A. Self-similar community structure in a network of human interactions. Phys. Rev. E 2003, 68, 065103. [Google Scholar]
- Leskovec, J.; Mcauley, J.J. Learning to discover social circles in ego networks. In Proceedings of the 26th Annual Conference on Neural Information Processing Systems 2012, Lake Tahoe, NV, USA, 3–6 December 2012; pp. 539–547. [Google Scholar]
- Avram, M.V.; Mishra, S.; Parulian, N.N.; Diesner, J. Simulation Data for Adversarial Perturbations to Manipulate the Perception of Power and Influence in Networks; University of Illinois at Urbana-Champaign: Champaign, IL, USA, 2019. [Google Scholar] [CrossRef]
- Hagberg, A.; Swart, P.; S Chult, D. Exploring Network Structure, Dynamics, and Function Using NetworkX; Technical Report; Los Alamos National Lab. (LANL): Los Alamos, NM, USA, 2008. [Google Scholar]
© 2020 by the authors. Licensee MDPI, Basel, Switzerland. This article is an open access article distributed under the terms and conditions of the Creative Commons Attribution (CC BY) license (http://creativecommons.org/licenses/by/4.0/).