Article

Dynamics-Preserving Graph Embedding for Community Mining and Network Immunization

1
School of Cyberspace, Hangzhou Dianzi University, Hangzhou 310000, China
2
School of Computer Science and Technology, Nanjing Tech University, Nanjing 211800, China
*
Authors to whom correspondence should be addressed.
Information 2020, 11(5), 250; https://doi.org/10.3390/info11050250
Submission received: 14 March 2020 / Revised: 20 April 2020 / Accepted: 29 April 2020 / Published: 2 May 2020

Abstract

:
In recent years, the graph embedding approach has drawn a lot of attention in the field of network representation and analytics, the purpose of which is to automatically encode network elements into a low-dimensional vector space by preserving certain structural properties. On this basis, downstream machine learning methods can be implemented to solve static network analytic tasks, for example, node clustering based on community-preserving embeddings. However, by focusing only on structural properties, it would be difficult to characterize and manipulate various dynamics operating on the network. In the field of complex networks, epidemic spreading is one of the most typical dynamics in networks, while network immunization is one of the effective methods to suppress the epidemics. Accordingly, in this paper, we present a dynamics-preserving graph embedding method (EpiEm) to preserve the property of epidemic dynamics on networks, i.e., the infectiousness and vulnerability of network nodes. Specifically, we first generate a set of propagation sequences through simulating the Susceptible-Infectious process on a network. Then, we learn node embeddings from an influence matrix using a singular value decomposition method. Finally, we show that the node embeddings can be used to solve epidemics-related community mining and network immunization problems. The experimental results in real-world networks show that the proposed embedding method outperforms several benchmark methods with respect to both community mining and network immunization. The proposed method offers new insights into the exploration of other collective dynamics in complex networks using the graph embedding approach, such as opinion formation in social networks.

1. Introduction

Complex networks have been widely used to represent the heterogeneous relationships among interactive elements in many real-world systems, such as social networks [1], neuronal networks [2], protein–protein interaction networks [3], and the World Wide Web [4]. In the past decades, extensive studies have focused on investigating the statistical mechanisms of network structure [5], as well as various dynamics in complex networks [6]. Accordingly, a series of network analytic tasks have been proposed, among which community mining ([7,8,9,10,11]) and node importance identification ([12,13,14]) have drawn extensive attention. The purpose of community mining is to identify groups of nodes with relatively dense connections in terms of network structure, while node importance is usually related to specific dynamics on networks [15,16]. For example, identifying influential nodes is essential for network immunization to contain epidemic spreading in complex networks [17,18,19]. In this paper, we focused mainly on investigating how epidemic dynamics on networks can promote community mining and network immunization.

1.1. Motivation

In the past decades, community mining has drawn a lot of attention in the field of complex networks. Many metrics have been proposed to guide the process of community mining. For example, the Kernighan-Lin method literally divides network nodes into smaller subgroups based on normalized cut [20]. There are also many other methods that rely on user-defined heuristics, such as modularity [21,21] and graph spectrum [22]. Meanwhile, in the field of machine learning, researchers have been focusing on developing various unsupervised clustering algorithms. However, due to the high dimensionality of network structure, most of them cannot be used directly on clustering network elements. In this line, the graph-embedding approach has been proposed to automatically encode network elements into a low-dimensional vector space such that downstream machine learning algorithms can be used to solve specific network analytic tasks, such as community mining [23,24,25,26,27].
To date, many graph embedding methods have been proposed with the purpose of preserving various structural properties of complex networks (e.g., [28,29,30]), even with heterogeneous node/edge types [31,32]. However, most existing studies focused mainly on representing static network information, such as structural proximity, equivalence, and identity [33,34,35,36]. Little attention has been paid to characterizing the properties of dynamics on networks, such as epidemic/information spreading. The challenge lies in that a dynamic process on networks is usually nonlinear, and its operation is jointly determined by both the network structure and the nature of the dynamics itself. When focusing only on structural properties, it would be difficult to characterize various dynamics operating on the network, let alone manipulate the dynamic processes based on the generated embeddings.
In the field of complex networks, epidemic spreading is one of the most typical dynamics on networks. Existing studies have shown that epidemic spreading on a network is jointly determined by network structure and dynamic characteristics of the spreading [37]. Given an initially infected node (called source node), the next infections depend on the location and status of all infected nodes during the spreading. On the one hand, the neighbors of an infectious node are more likely to be infected. Therefore, the generated embeddings can by nature preserve the proximity of network nodes. On the other hand, by taking into consideration the time of infection in the propagation sequences, the embeddings can also reflect the infectiousness and vulnerability of network nodes in the face of epidemic spreading. In this case, a dynamics-preserving graph embedding method can offer new insights into, as well as new tools for epidemic intervention and control on networks.

1.2. Related Work

One type of dimension reduction technique, the graph (or network) embedding approach has been extensively studied in the past decade [23,24,25,26,27]. Several methods have been proposed to exploit the spectral property of network adjacency and its variants, such as IsoMap [38], LLE [39], and Laplacian eigenmaps [40]. These methods try to preserve the local relationships (i.e., the first-order proximity) of each node in the network. The key step lies in how to construct the first-order proximity of each node by finding its k nearest neighbors. Along this line, a great deal of graph embedding methods have been proposed to preserve the structural properties of complex networks. For example, several factorization-based embedding methods have been proposed to preserve the first-order proximity [41], as well as higher-order proximities of networks [42]. The basic idea is to learn embeddings of each node such that the inner product between any two learned vectors approximates certain measures of structural proximity (i.e., community-based embeddings [43]). Besides community-based embedding methods, many researchers have also been focusing on learning latent representations of higher-order structural properties of large-scale networks, such as structural equivalence [34,36,44], and role-based similarity/identity [35,45].
In recent years, many random-walks based embedding methods have also been proposed to preserve various order of structural proximities [30,33,46,47]. Such methods usually take two steps: first, a set of node sequences are sampled via random walks on a network, where densely connected nodes are more likely to be sampled in the same sequence. Then, node embeddings can be obtained by maximizing the co-occurrence probability of nodes appearing nearby in the sampled sequences. In doing so, such co-occurred nodes are more likely to have similar embeddings and thus be clustered into the same community. The difference lies in the neighborhood sampling strategies starting from each target node. For example, the DeepWalk method used the depth-first sampling strategy to sample the set of nodes [30], while the node2vec method further introduced a biased random walk procedure to balance the depth-first and breadth-first sampling strategies [33]. Extensive studies have shown that the random-walks based graph embedding methods can perform well in node clustering and classification tasks. Nevertheless, random walks are artificially designed and cannot depict any real-world dynamic processes on networks.
As another well known dynamic process on networks, epidemic spreading can also be treated as a sampling strategy to solve graph embedding problems. Similarly to random walks, to represent the epidemic spreading on networks, it would be natural to first simulate the epidemic process on a network and generate a set of propagation sequences [48,49]. However, epidemic spreading is completely different from random walks. First of all, the Markov property holds for random walks on networks: conditional on the present, the future is independent of the past. While for the epidemic dynamics on networks, things are different: Starting from an infected node, a sequence of nodes can be generated based on the time of infection. Given a set of infectious nodes at any time, the next node that will be infected depends on the locations and states of all the infectious nodes in the network. In this case, the Markov property does not hold anymore. To solve this problem, in this paper, we aimed to tackle the dynamics-preserving graph-embedding problem to represent the infectiousness and vulnerability of network nodes with respect to the dynamics of epidemic spreading on networks. In doing so, the node representations or embeddings can further be used to identify important nodes for network immunization.
Network immunization is one of the effective methods to suppress the epidemic dynamics on networks [6,50]. Typical network immunization strategies include random immunization [18], target immunization [18], and acquaintance immunization [51]. Max-degree immunization [52] is the first proposed target immunization strategy, in which a proportion of nodes with the highest degree are selected for vaccination before epidemic spreads. The main idea behind this is that nodes with a higher degree are more likely to spread disease. Since then, different target immunization strategies have been proposed based on node importance and various measures of centrality, such as degree [52], betweenness [53], eigenvector centrality [15]. However, most existing studies focus mainly on the structural properties of the network, which ignore the characteristics of epidemic dynamics on networks. It is expected that the dynamics-preserving node embeddings can help improve the efficiency of network immunization by taking into consideration of the characteristics of epidemic dynamics.

1.3. Our Contributions

In this paper, we present a dynamics-preserving graph embedding problem that aims to generate node representations by preserving both the structural and dynamic properties of networks. The main contributions of this paper are as follows:
  • We develop a dynamics-preserving graph embedding method (EpiEm) to generate node representations that preserve the dynamic characteristics of the epidemic spreading on networks. Specifically, we first generate a set of propagation sequences by simulating the Susceptible-Infectious process on a network, and then learning node representations from an influence matrix using the singular value decomposition method.
  • We propose an embedding-based network immunization strategy to immunize network nodes based on the preserved infectiousness and vulnerability in their representations. Such representations embed not only the structural properties of the network, but also the epidemic dynamics on the network.
  • By conducting experiments on both synthetic and real-world networks, we demonstrate that the proposed embedding method outperforms the state-of-the-art graph embedding methods in terms of community mining tasks. Moreover, we also show that the embedding-based network immunization strategy outperforms several typical network immunization strategies by considering the dynamic characteristics of epidemic spreading.
The remainder of this paper is organized as follows. In Section 2, we first introduce the dynamics-preserving graph embedding problem. Then, we propose an embedding method of learning node representations based on singular value decomposition. Accordingly, we present an embedding-based network immunization algorithm in the face of epidemic spreading on networks. In Section 3, we evaluate the performance of the proposed methods in terms of node clustering in both synthetic and real-world networks. Moreover, we also evaluate the performance of the embedding-based network immunization algorithm by comparing with several benchmark algorithms. Finally, we conclude this work in Section 4.

2. EpiEm: A Dynamics-Preserving Graph Embedding Method

In this section, we develop a graph embedding method to preserve the dynamic properties of epidemic spreading on networks. First, we generate a set of propagation sequences by simulating the Susceptible-Infectious (SI) epidemic dynamics on networks using the Gillespie algorithm (Section 2.1). Based on the generated propagation sequences, we then build an asymmetric influence matrix and learn node representations using a singular value decomposition method (Section 2.2). Finally, based on the obtained representations about node infectiousness and vulnerability, we proposed an embedding-based network immunization strategy to identify important nodes of a network with respect to epidemic dynamics (Section 2.3).

2.1. Generating Propagation Sequences

Without loss of generality, we simulate epidemic dynamics based on the Susceptible-Infectious (SI) model [54]. Under the SI model, the population is divided into two categories, i.e., S and I, to represent the proportion of susceptible and infected individuals respectively. Accordingly, S + I = 1 . In a well-mixed population, the model can be formulated as an ordinary differential equation:
d S d t = r S I , d I d t = r S I ,
where r is the transmission rate representing the number of effective contacts per susceptible individual per unit time that are sufficient to spread the disease.
Given a network G = ( V , E ) , where V = { 1 , , n } is the set of nodes and E = { e i j | i , j V } is the set of edges, each propagation sequence is simulated under the SI model based on the Gillespie algorithm [55,56], given as follow. At the beginning, one node is chosen to be infected.
  • Calculate the state transition rates of each node. The rate at which a susceptible individual i becomes infected is t r a n s _ r a t e i ( t ) = r × number of his/her infected neighbors. The infected individuals remain infected. The total transition rate at time t is λ ( t ) = i t r a n s _ r a t e i ( t ) .
  • After time Δ t , determine the next node to change its state, where Δ t is sampled from an exponential distribution with mean 1 / λ ( t ) . The node k will change its state if
    j = 1 k 1 t r a n s _ r a t e j ( t ) λ ( t ) < v < j = 1 k t r a n s _ r a t e j ( t ) λ ( t )
    where v is a random number generated from the uniform distribution U [ 0 , 1 ) .
  • Repeat (1) and (2) until a predetermined time period.
Starting from each node i V , a set of K disease propagation sequences P S i k | 1 k K will be sampled respectively. In total, there will be K | V | propagation sequences. Each propagation sequence P S i k = { ( i l , t l ) | t l 1 t l } consists of node-time pairs ( i l , t l ) ordered by infection time t l . Here it should be emphasized that the propagation sequences are essentially different from random walks. As the node orders in the sequences reflect the order of infection, two adjacent nodes are not necessarily neighboring nodes in G. In doing so, the node embedding learned based on the propagation sequences can well preserve the epidemic dynamics. The pseudocode for generating the propagation sequences is given in Algorithm 1.
Algorithm 1: generateSequence(G,r,i,k,T)
Input: Network G, Transmission rate r, Starting node i, Sequence ID k, Termination time T
Output: Propagation sequence P S i k
1  Initialize t = 0 ;
2  Initialize P S i k = [ ( i , t ) ] ;
3  while t T ;
4        Calculate λ ( t ) based on Step (1);
5        Generate Δ t based on λ ( t ) ;
6        Determine the next node v based on Step (2);
7         t = t + Δ t ;
8        Append v to the sequence P S i k = [ P S i k , ( v , t ) ] ;
9  return P S i k ;

2.2. Learning Node Representations

Our learning algorithm is inspired by the widely used representation learning method Glove [57]. The Glove method uses a local sliding window on the sentences to count adjacent words that co-occur in a sliding window. Based on that, a global word co-occurrence matrix is constructed and each element counts the number of co-occurrences of the corresponding two words. Then, the words are embedded as low-dimensional vectors, which are fed into non-linear functions and optimized to fit the co-occurrence matrix. That is, to maximize the possibility of each co-occurred case. As a result, frequently co-occurred words have similar representations. However, the order of words in each word pair is not considered and the matrix is symmetric. Meanwhile, the nodes appearing in propagation sequences are naturally ordered by time, thus the Glove method can not be directly adopted.
Here, we first construct an asymmetric influence matrix. In particular, let X be a matrix of dimension | V | × | V | . Initially, the elements in matrix X are set to be 0. Then, we traverse the sampled propagation sequences. In a propagation sequence P S i k , the co-occurrence of the source node i and a later infected node j P S i k indicates a case that node i influenced node j, which makes X i j + = 1 . Note that we set a global time threshold and nodes appearing above the threshold in the propagation sequences are not considered as the corresponding strength of influence is weak. When we traverse all the propagation sequences, we can obtain the matrix X . Here, we adopt singular value decomposition (SVD) [58], one of the commonly used matrix decomposition methods to encode the nodes into a low dimensional space. The SVD algorithm is an effective mathematical model for data compression and dimension reduction. Through the formula X = U Σ Z T , matrix decomposition is carried out for the high-dimensional matrix X . U , Z are square matrices with dimension | V | , and each column corresponds to one left/right singular eigenvector. Σ is a diagonal matrix, and the values on the diagonal are the corresponding eigenvalues for these eigenvectors, ordered in descending order. The eigenvalue is a measure of the importance of the eigenvector, and the dimension reduction is performed accordingly. Suppose the resulting vector dimension is set as d, then matrices U , Z , Σ are generated by taking the first d eigenvectors of U and Z respectively, as well as the first d dimensions of Σ . The SVD method has been adopted in recommendation systems [59,60] to encode user and product matrices respectively. In this paper, the product of matrices U and Σ represents the infectiousness embeddings, denoted as Inf . Moreover, Z represents vulnerability embeddings, denoted as Vul . If the inner product of the vectors Inf i and Vul j is larger, then the node i has a great impact on node j. Meanwhile, if the vectors Inf i and Inf j are close to each other in the low-dimensional vector space, the nodes i and j should have similar impact on other nodes. The pseudocode for learning infectiousness embeddings and vulnerability embeddings is given in Algorithm 2.
Algorithm 2: The EpiEm Algorithm
Input: Network G, Transmission rate r, Dimension d, Number of propagation sequences per node K, Termination time T, Influence matrix X
Output: Infectiousness Embedding Inf , vulnerability Embedding Vul
1  for each node i V ;
2        for k = 1 to K do;
3               P S i k = g e n e r a t e S e q u e n c e ( G , r , i , k , T ) ;
4              for ( j , t ) P S i k do;
5                     X i j + = 1
6   U , Σ , Z = S V D ( X , d ) ;
7   Inf = U Σ ;
8   Vul = Z ;
9  return Inf , Vul ;

2.3. An Embedding-Based Network Immunization Strategy

We propose a static immunization strategy based on the learned node embeddings. Traditional static target immunization strategies, such as max-degree immunization [52] and eigenvector centrality immunization [15], vaccinate nodes with the highest score based on corresponding measures of centrality. For instance, in max-degree immunization, nodes with the highest degree are vaccinated before epidemics spreads. The main reason behind is that the nodes with a higher degree are assumed to be more likely to infect other nodes as they are connected to more nodes. In this paper, we argue that the dynamic characteristics of epidemic dynamics can be summarized with learned embeddings based on past propagation sequences, and used for important node identification before new epidemic outbreaks.
Given the node representations, we can calculate the influence strength for each node pair accordingly. In particular, we denote an influence strength matrix as W , in which each element W i j represents node i’s ability to transmit an epidemic to node j. The higher the value, the more likely that node j is in the propagation sequence triggered by node i. Each entry w i j of the influence strength matrix W can be calculated by the inner product of corresponding node representations, i.e., w i j = Inf i · Vul j . Further, we define w i = j V w i j for each node i as its influence score in terms of all nodes in the network. The higher the score, the more critical the node is in the process of epidemic propagation. We rank the nodes based on w i , and target the nodes with the highest scores for immunization given a limited number of vaccines.

3. Experiments

In this section, we carried out a series of experiments to evaluate the performance of our proposed EpiEm algorithm for learning node representations. Two network analysis tasks were evaluated, including node clustering and network immunization. Specifically, we first visualize the effect of the EpiEm method on community mining based on two small networks and then use cluster indicators on three air-traffic networks for quantitative evaluation. Furthermore, simulations were carried out on three air-traffic networks and one paper citation network for network immunization. The effectiveness of our method was verified via comparison with other classical vaccination methods.

3.1. Node Clustering and Visualization

3.1.1. Clustering Visualization on Barbell and Karate Networks

The barbell graph b a r ( m , n ) is a synthetic network which connects two complete m-node subgraphs ( G 1 and G 2 ) linked by a path P of length n, and all nodes of the two complete subgraphs are isomorphic. Without loss of generality, we use the barbell graph b a r ( 10 , 10 ) in our experiments (see Figure 1). In this section, we adopt the EpiEm method to generate the nodes’ infectiousness embeddings, and achieve node clustering through a k-means algorithm. For visualization purposes, we directly set the dimension of node embeddings in b a r ( 10 , 10 ) as d = 2 . As each node in the propagation sequence is associated with an infection time, we carefully set the termination time T = 0.1 to reflect the early stage of an epidemic such that the maximum length of the propagation sequences is 10. We generate K = 80 propagation sequences for each node with transmission rate r = 0.5 .
Figure 1 visualizes the node representations and clustering results for the b a r ( 10 , 10 ) network obtained by the EpiEm method. The nodes are divided into three clusters by the k-means algorithm, as shown in Figure 1b, in which different clusters are represented with different colors. It can be observed that the nodes in the complete subgraph of G 1 and G 2 , and the nodes on the path P can be completely separated. As the neighbors of an infectious node are more likely to be infected, the generated embeddings can by nature preserve the proximity of network nodes. The Euclidean distance represented by the nodes in the embedding space can reflect the ability of the nodes to influence each other during the spread of the disease, as shown in Figure 1a. For example, once node 10 is infected, the outbreak may spread rapidly to G 1 , or it may spread gradually through path P to G 2 . A similar conclusion applies to G 2 . Moreover, we can see two special nodes 10 and 19 in the 2D plane. If there exists an outbreak in subgraph G 1 (resp., G 2 ), it must first infect node 10 (resp., node 19) before causing new infections in G 2 (resp., G 1 ).
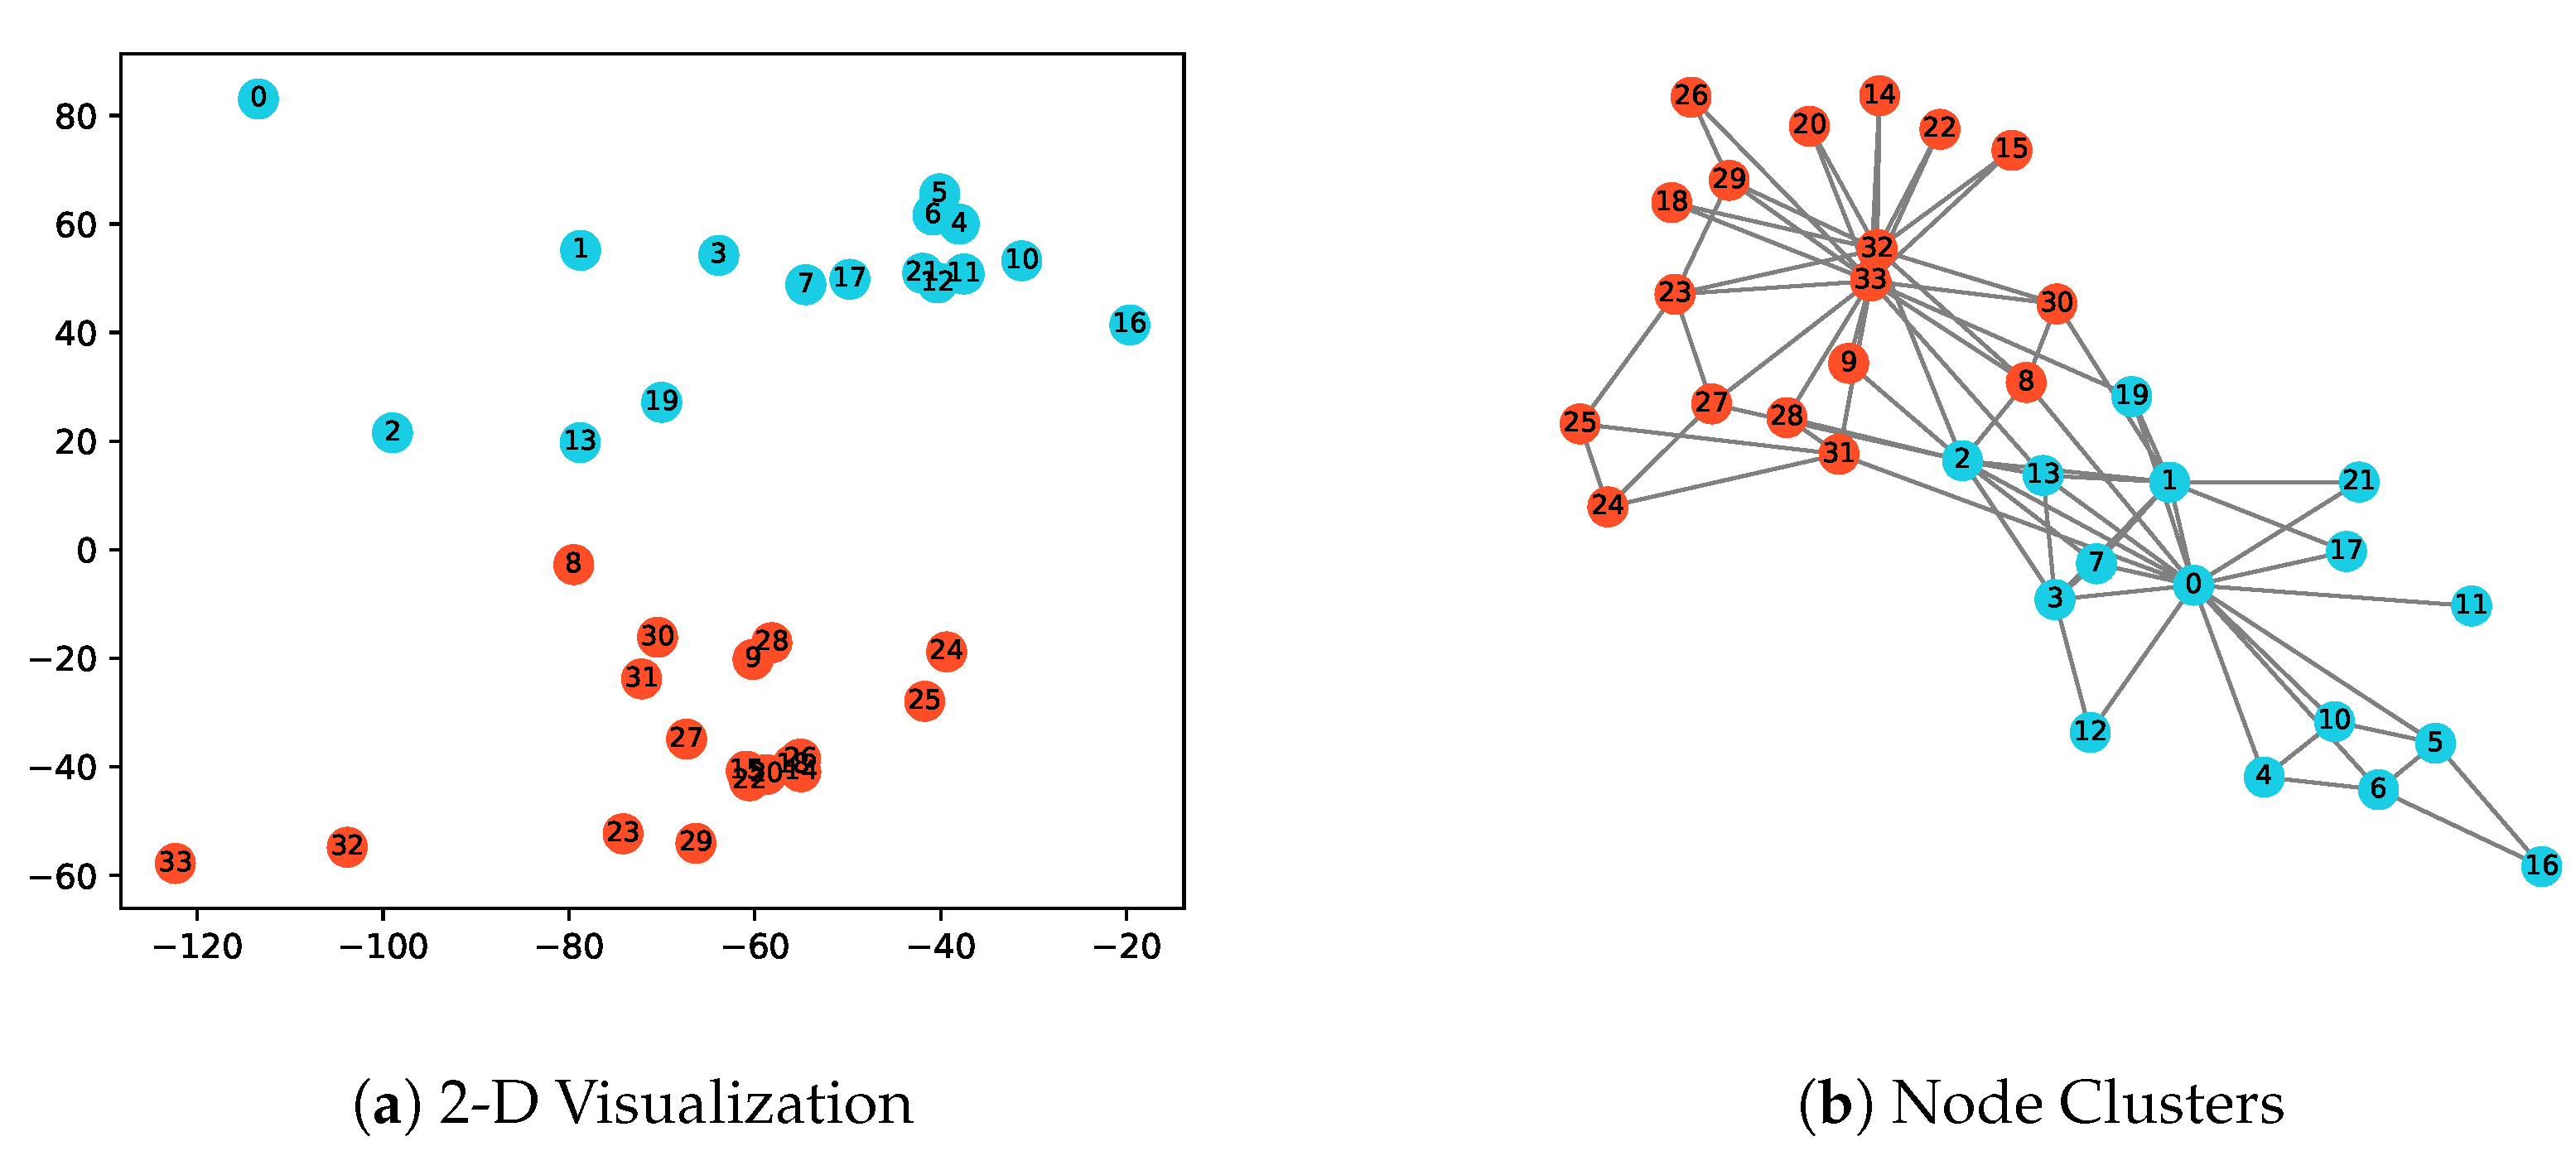
Zachary’s karate network is a representative real-world social network, which consists of 34 nodes and 78 edges. Each node represents a member of the karate club, and each edge represents the relationship between members inside the club. Many community mining algorithms are evaluated based on this data set, and two clusters can be identified by these algorithms based on the structure information. In this paper, we apply the EpiEm method to generate node representations. The parameters are set as r = 0.5 , K = 80 and d = 2 , so that the node embedding result can be directly displayed in the 2-D vector space. The nodes are divided into two clusters by the k-means algorithm, and are marked with different colors in Figure 2b. It can be observed that the clustering results are consistent with those of the well-known community mining methods. Furthermore, more interesting findings can be observed from the epidemic dynamics perspective in Figure 2a. For example, node 0, 33 are in the center of their respective cluster. The two center nodes can easily spread epidemics to all the nodes in their cluster, while other nodes are more likely to spread to a limited set of nodes. Obviously, the center nodes have different infectiousness abilities compared with other nodes. As a consequence, their node embeddings are placed on the far left corner. Meanwhile, some nodes bridge together two clusters, such as node 2, 8, 13, 19. They play the role of mediating the process of epidemic propagation from one cluster to another, and thus their corresponding embeddings are similar as shown in the center. Moreover, nodes 4, 5, 6, 10, 11, 12 are densely connected but far away from other nodes. The epidemics can then spread quickly among them, instead of spreading to other nodes. As a result, their embeddings are close in the vector space. A similar phenomenon can be observed for node 14, 15, 18, 20 and 22.

3.1.2. Quantitative Evaluation for Clustering on Real Networks

Since both epidemic spreading and random walks are typical dynamics on networks, we compare our EpiEm method with several random-walks based graph embedding methods. In addition, as the EpiEm method adopts matrix factorization to achieve dimension reduction, we also compare with the spectral clustering method which reduces dimension using matrix factorization approach.
  • Spectral Clustering [40]: This is a matrix factorization approach to calculate the d smallest eigenvectors of the normalized Laplacian matrix of graph G as the feature representation of nodes.
  • DeepWalk [30]: This approach is one of the first attempts to apply the word2vec approach for network embedding. The neighbor information of the nodes is captured via simulating uniform random walks. (We use the code provided by the author, Source: https://github.com/phanein/deepwalk)
  • Node2vec [33]: This is another random-walks based network embedding method. The random walks are balanced between breadth-first and depth-first sampling strategies with hyperparameters p and q. If there is no specific explanation, we adopt the default values of p and q in the authors’ paper. (We use the code provided by the author, Source: https://github.com/aditya-grover/node2vec)
The experiments are carried out in three real-world air-traffic networks, which are widely used for evaluation representation learning methods. The details of the data sets are listed as follows.
  • Brazilian air-traffic network [35]: The network has 131 nodes and 1038 edges. The data counts airport activities by the National Civil Aviation Administration (ANAC) from January to December 2016, which records the total number of landings and takeoffs in 2016. The dataset has four node labels.
  • European air-traffic network [35]: The network has 399 nodes and 5995 edges. The data counts airport activities by the Statistical Office of the European Union (Eurostat) from January to November 2016. The dataset has four node labels.
  • USA air-traffic network [35]: The network has 1190 nodes and 13 , 599 edges. The data counts airport activity by the Bureau of Transportation Statistics from January to October. The dataset has four node labels.
We quantitatively compare the node clustering performance in terms of two entropy-based clustering indicators.
  • Homogeneity [61]: It measures the percentage of detected clusters containing only a single class label through conditional entropy.
  • Completeness [61]: It measures the percentage of nodes with the same class label allocated to the same cluster through conditional entropy.
It is expected that the nodes with the same class labels are clustered into the same cluster. Therefore, the larger the two indicators, the better the embedding method. Specifically, the parameter settings of the benchmark methods are given in Table 1. Notably, for the node2vec method, we adopt a grid search method to determine the best p and q for our experiments. During the experiments, different graph embedding methods are first used to generate node representations/embeddings, then the k-means method is used to cluster network nodes into four clusters, which is the same as the number of node labels.
Table 2 shows that for all of these networks, Deepwalk, Node2vec and Spectral Clustering perform poorly, with scores significantly lower than the EpiEm method. The reason behind this is that Deepwalk and Node2vec methods conduct random walks on the network, so they focus on capturing the adjacency between network nodes through a Markov process. Moreover, the spectral clustering method calculates eigenvectors of the normalized Laplacian matrix of the adjacency matrix. Therefore, these methods tend to preserve the structural proximity of the network. Nevertheless, the node labels are not necessarily related to network proximity. For instance, two hubs may not be directly connected, while under the EpiEm method, propagation sequences are sampled based on the epidemic dynamics, and hub nodes tend to affect a large proportion of nodes. Therefore, two hubs nodes, especially those with similar neighborhood structures, may affect similar sets of nodes although they are not directed connected. As a result, they have similar representations. Note that the performance result is to demonstrate those epidemic models are better choices than proximity-based methods to characterize dynamic properties of air-traffic networks, it does not mean that our methods are superior to others in other networks.

3.2. Network Immunization

In this section, we evaluate the performance of the proposed immunization strategy based on the EpiEm method for network immunization. Simulations are carried out on the above mentioned three air-traffic networks and one paper citation network named Cora network. The Cora network [62] network data set consists of machine learning papers. It has 2708 nodes and 5429 edges. In this corpus, each paper is quoted or referenced by at least one other paper. The papers are divided into seven categories. We compared with benchmark static immunization strategies, including random immunization, max-degree immunization, and eigenvector centrality immunization. The detailed description of the benchmark methods are shown as follows:
  • Random immunization [18]: A proportion of nodes in the network are randomly selected for vaccination before epidemic spreads. The probabilities to select different nodes are the same.
  • Max-degree immunization [52]: A widely used target immunity strategy. A proportion of nodes with the highest degree are selected for vaccination before epidemic spreads.
  • Eigenvector centrality immunization [15]: Another widely used target immunity strategy. Eigenvector centrality is defined as the main eigenvector of the network adjacency matrix, in which each element indicates the eigenvector centrality for the corresponding node. The nodes with the largest eigenvector centrality are selected for vaccination before epidemic spreads.
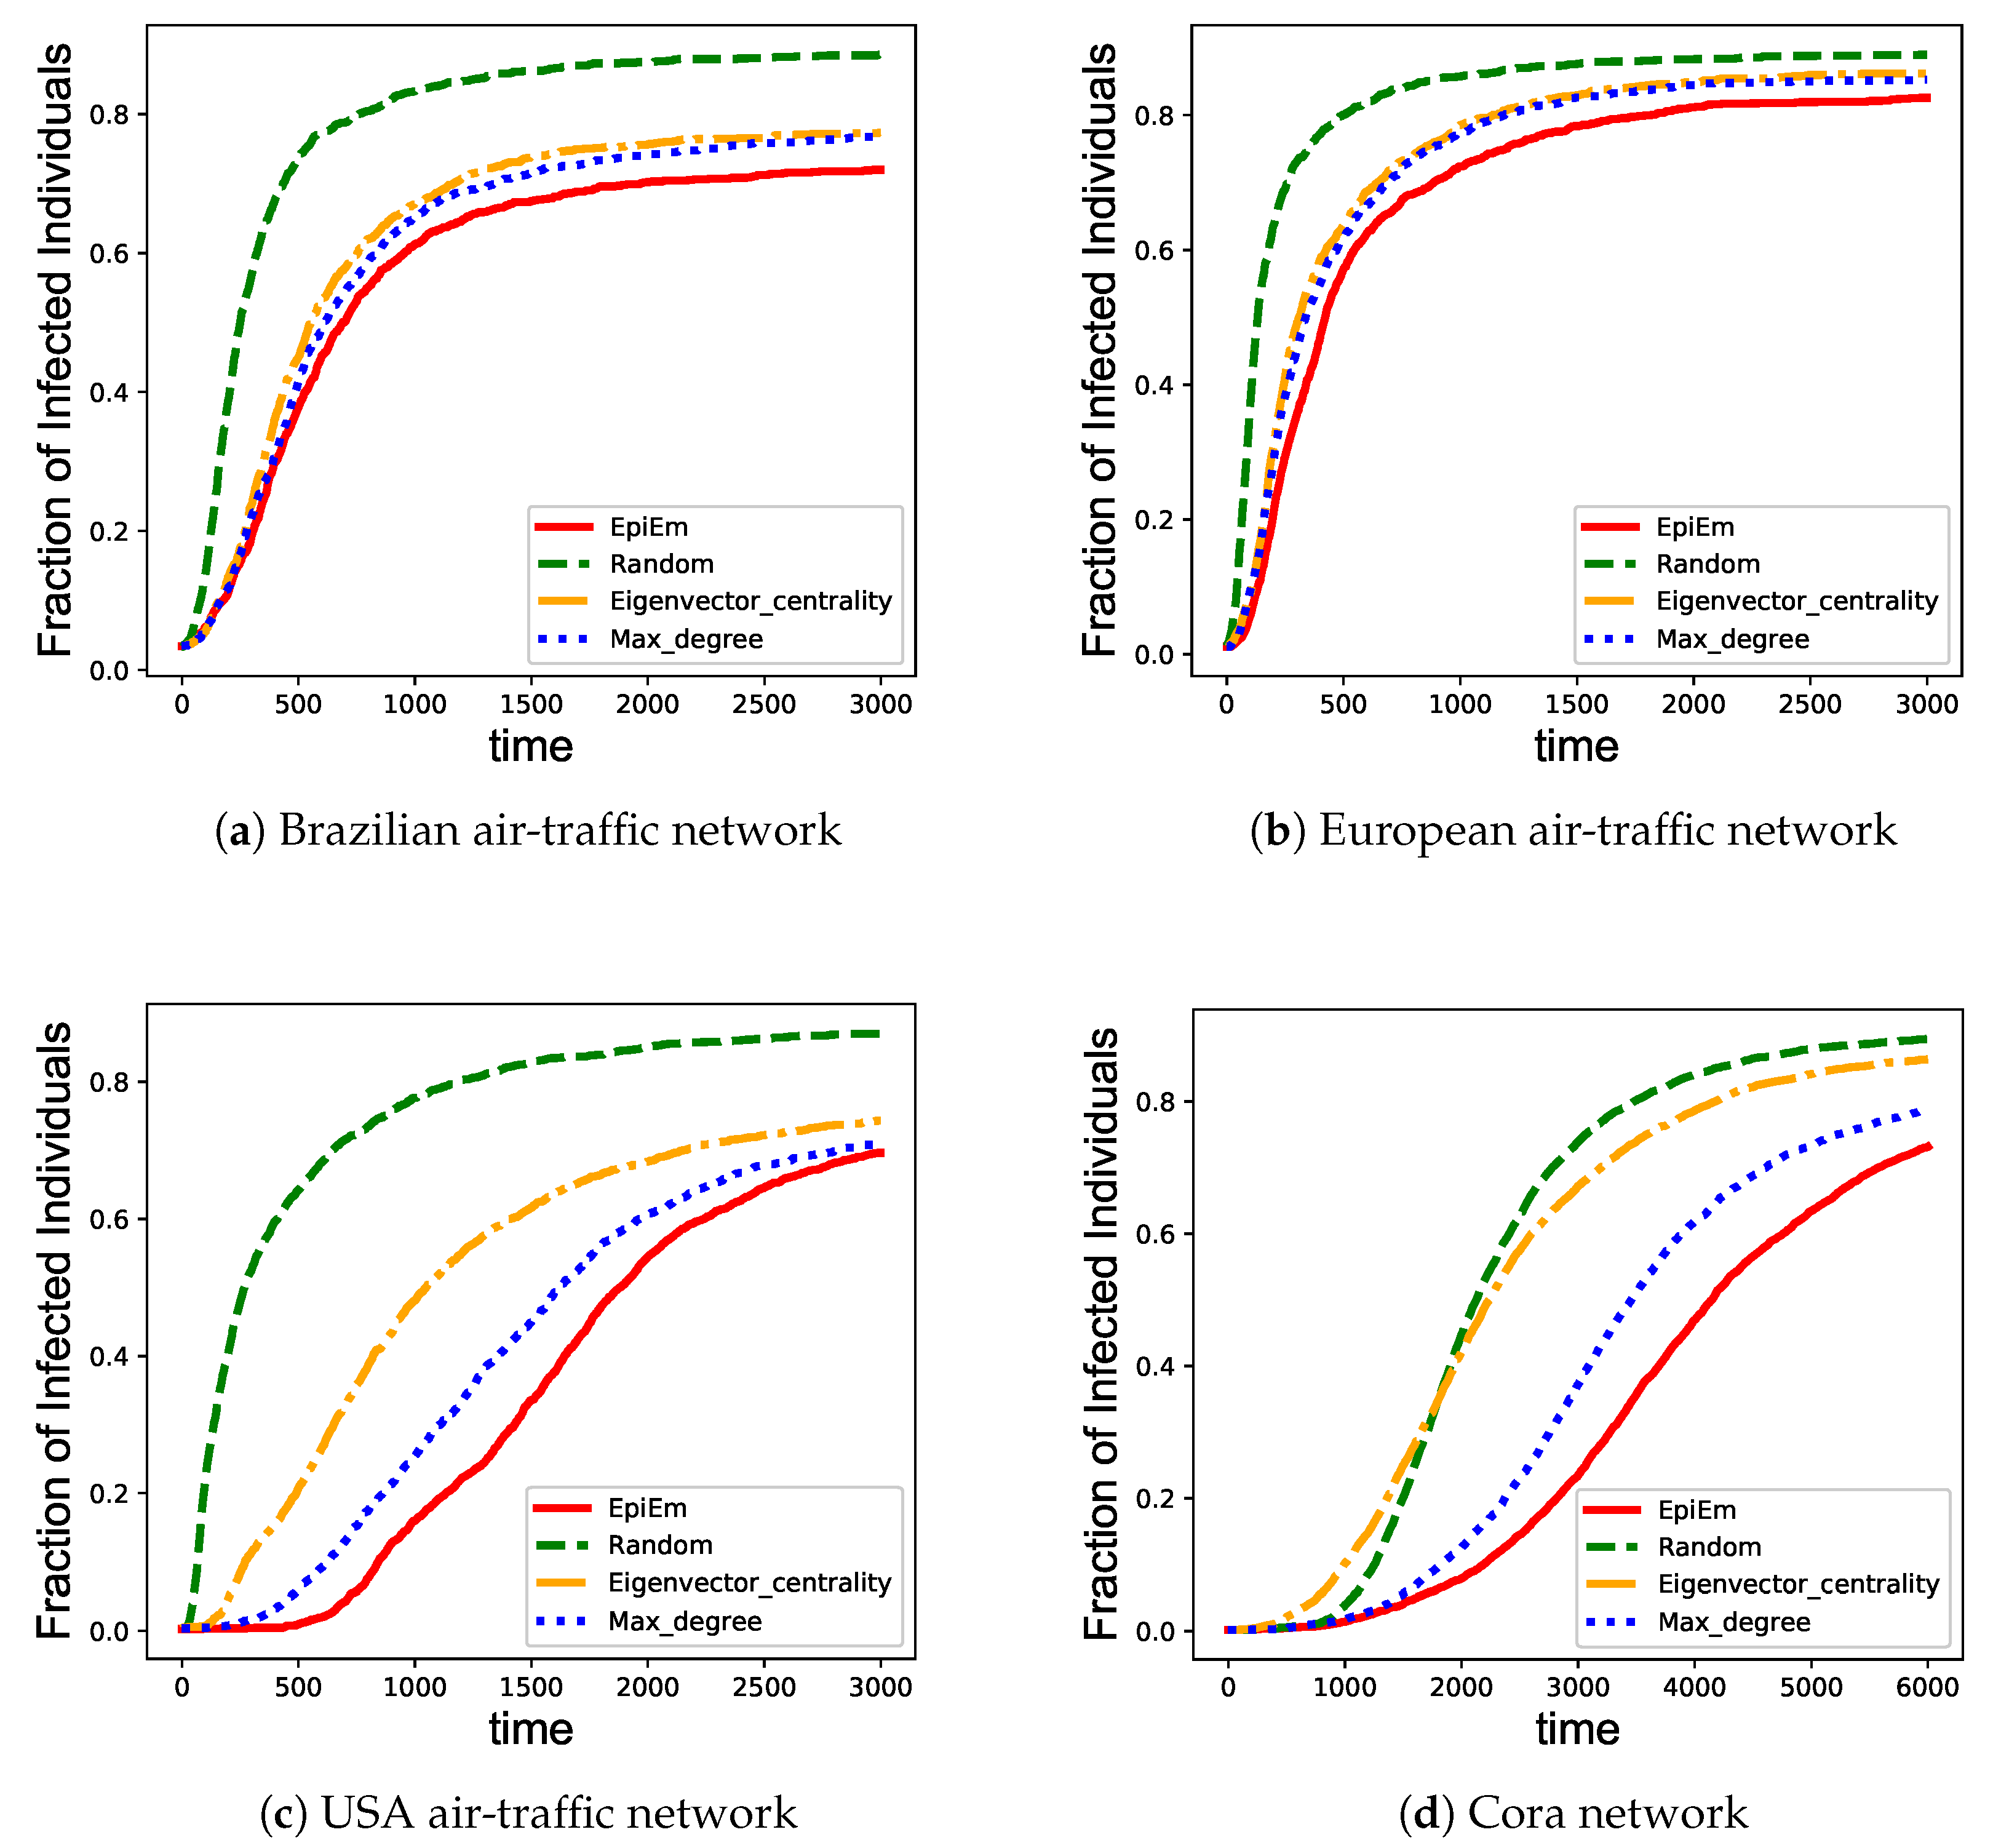
For this experiment, we performed simulations based on the infectiousness embeddings and vulnerability embeddings obtained, and compare the results with benchmarks. The transmission rate is set as r = 1.0 . The vaccine coverage is set as M = 10 % for the three air-traffic networks and M = 1 % for the Cora network as the last network is large. We performed 10 rounds of simulations, and take the average to obtain final results. Figure 3 shows the fraction of infected nodes as the epidemics spread with time under the four immunization strategies. The number of infected nodes increases with time and remains stable after a certain proportion of nodes infected. Among all the immunization strategies, random immunization performs apparently worst and results in the highest fraction of infected nodes in all the data sets. The result is in line with the fact that random immunization does not take the relative importance of different nodes into consideration. Meanwhile, EpiEm are most effective in all the data sets, slowing down the increase of infections in the early stage of the epidemic outbreak, and controls the epidemic outbreak. In comparison, the max-degree immunization and eigenvector centrality immunization do not specifically consider the critical nodes in terms of the process of epidemic propagation, and are outperformed by EpiEm.
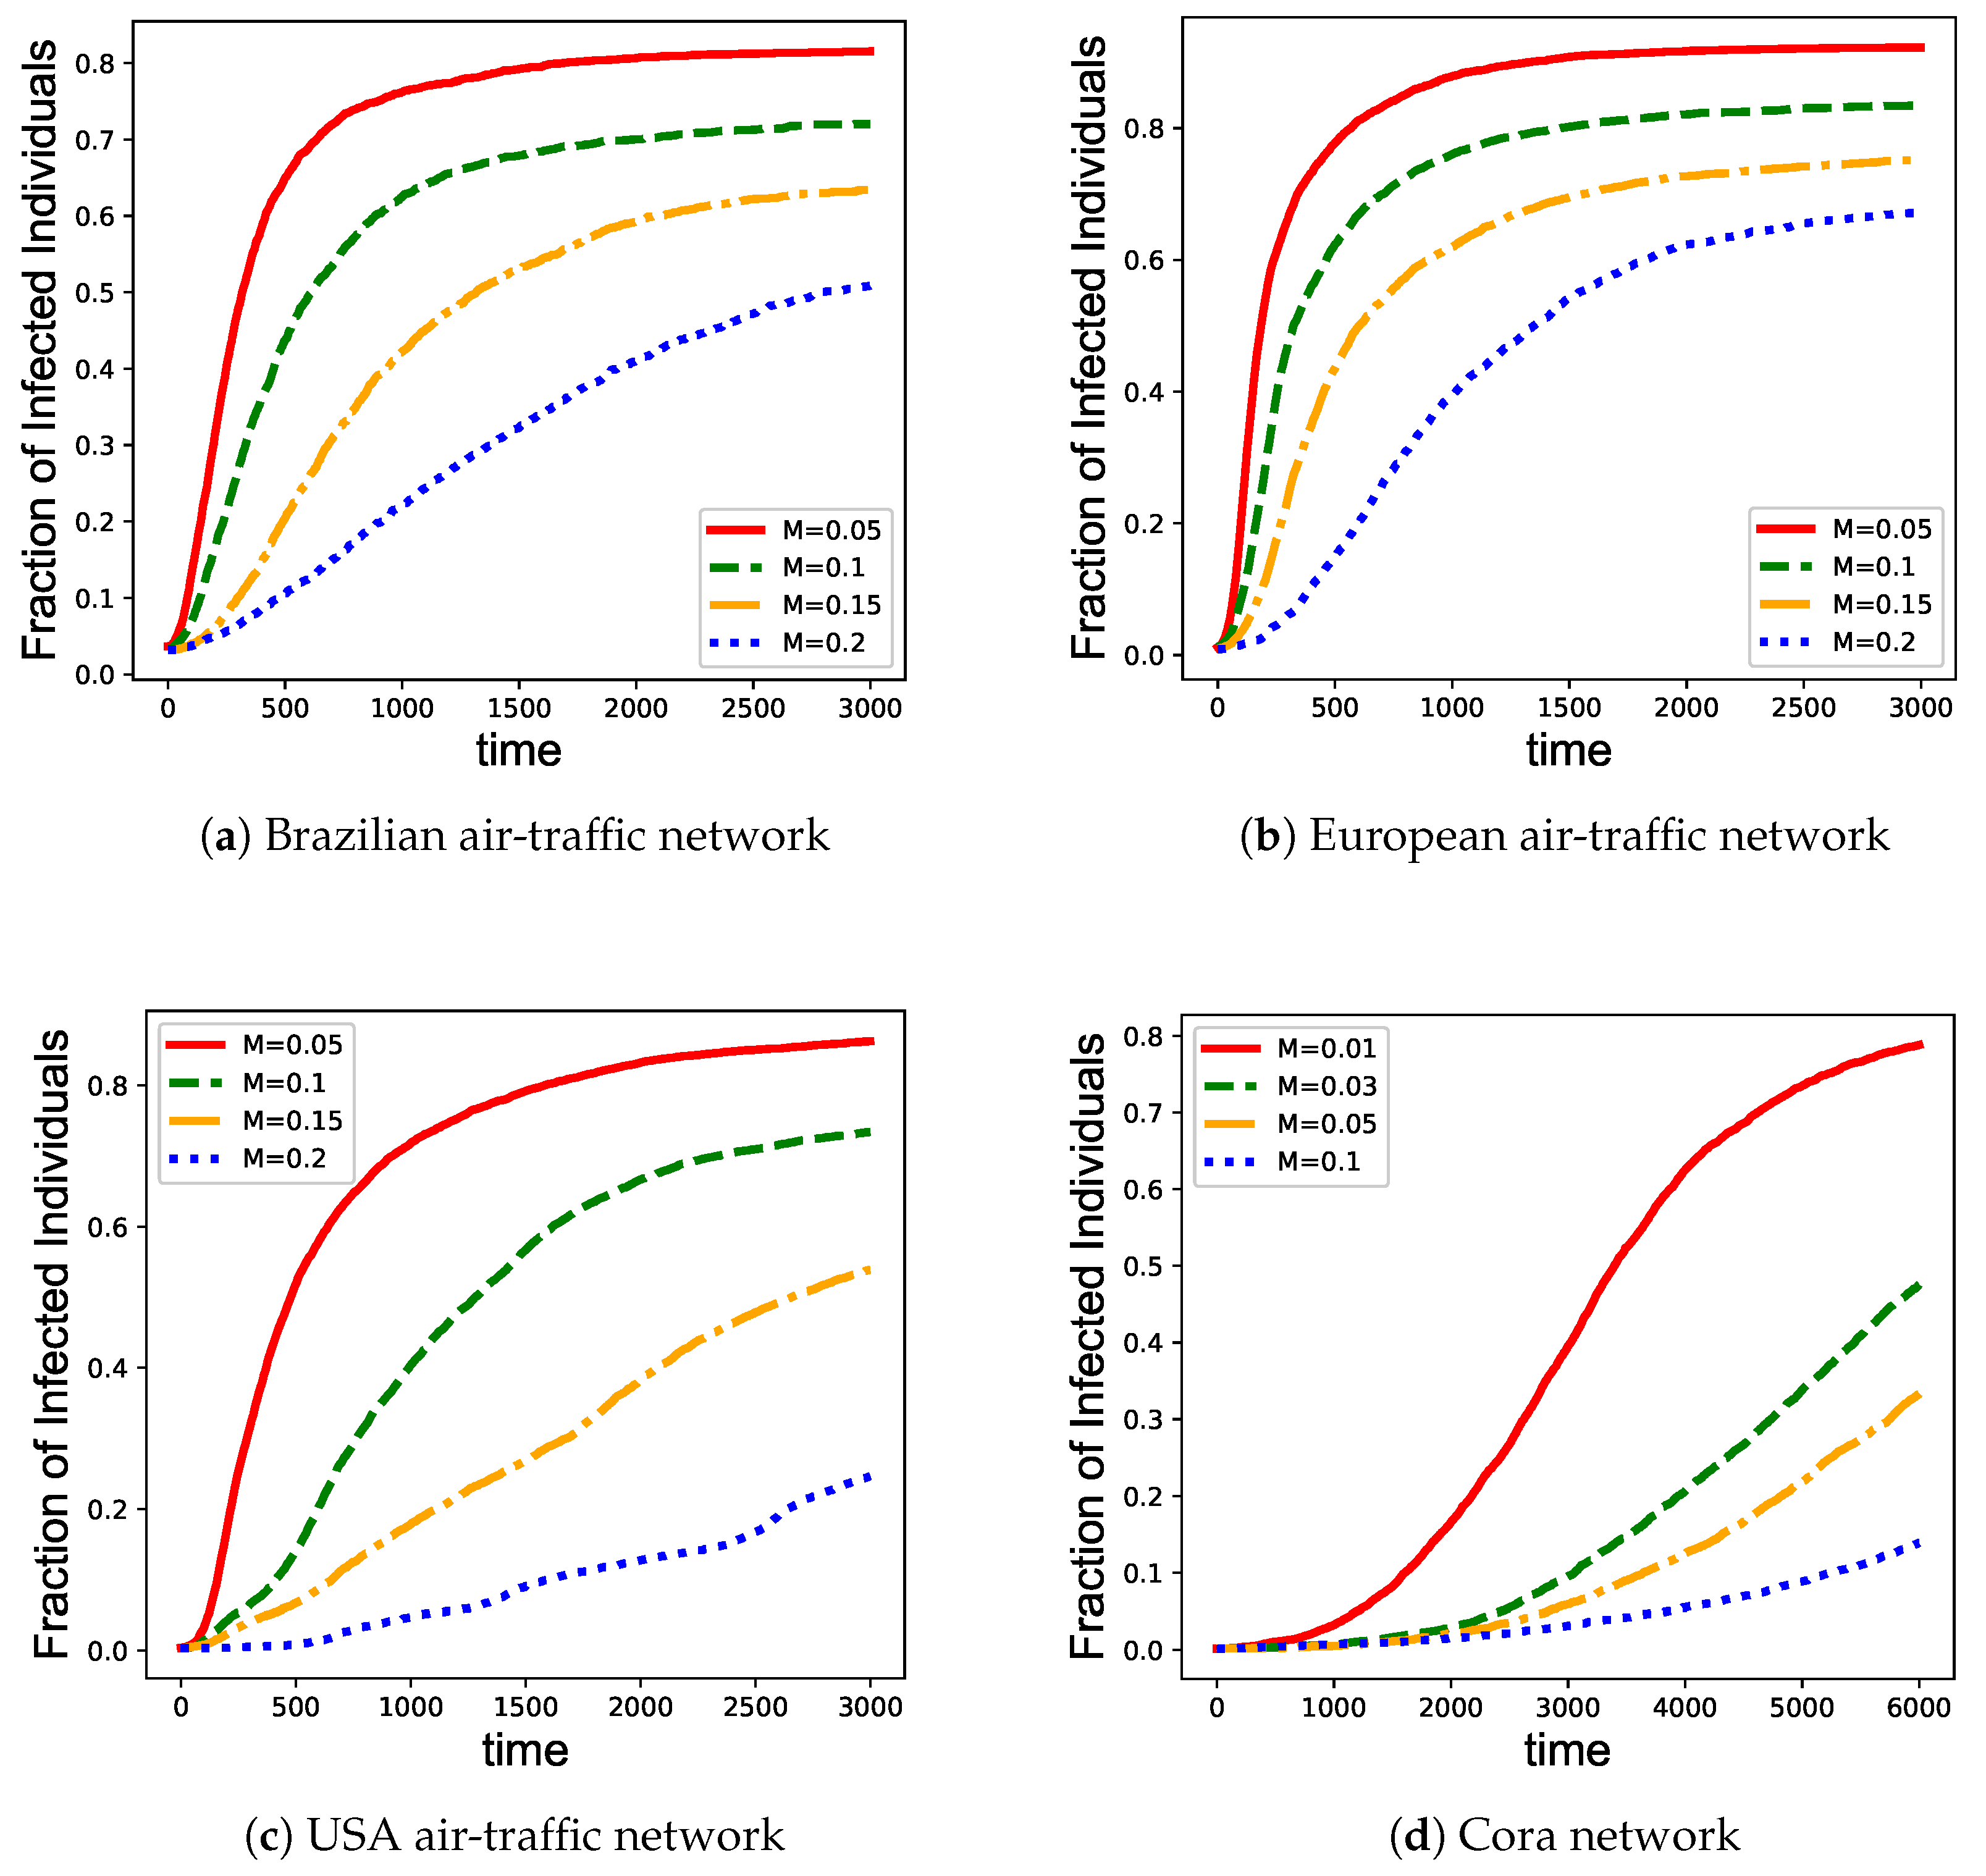
We further investigate the performance of the proposed EpiEm immunization strategy with varying vaccine coverage. We set the vaccine coverage M = 5 % , 10 % , 15 % , 20 % for the three air-traffic networks and M = 1 % , 3 % , 5 % , 10 % for Cora network as this network is relatively larger, to simulate real situations where limited vaccines can be given. Figure 4 shows that for the three air-traffic networks, when the vaccine coverage reaches 20%, the number of infected nodes increases very slowly. For the Cora network, only 10% of vaccine coverage will slow down the growth of infections.
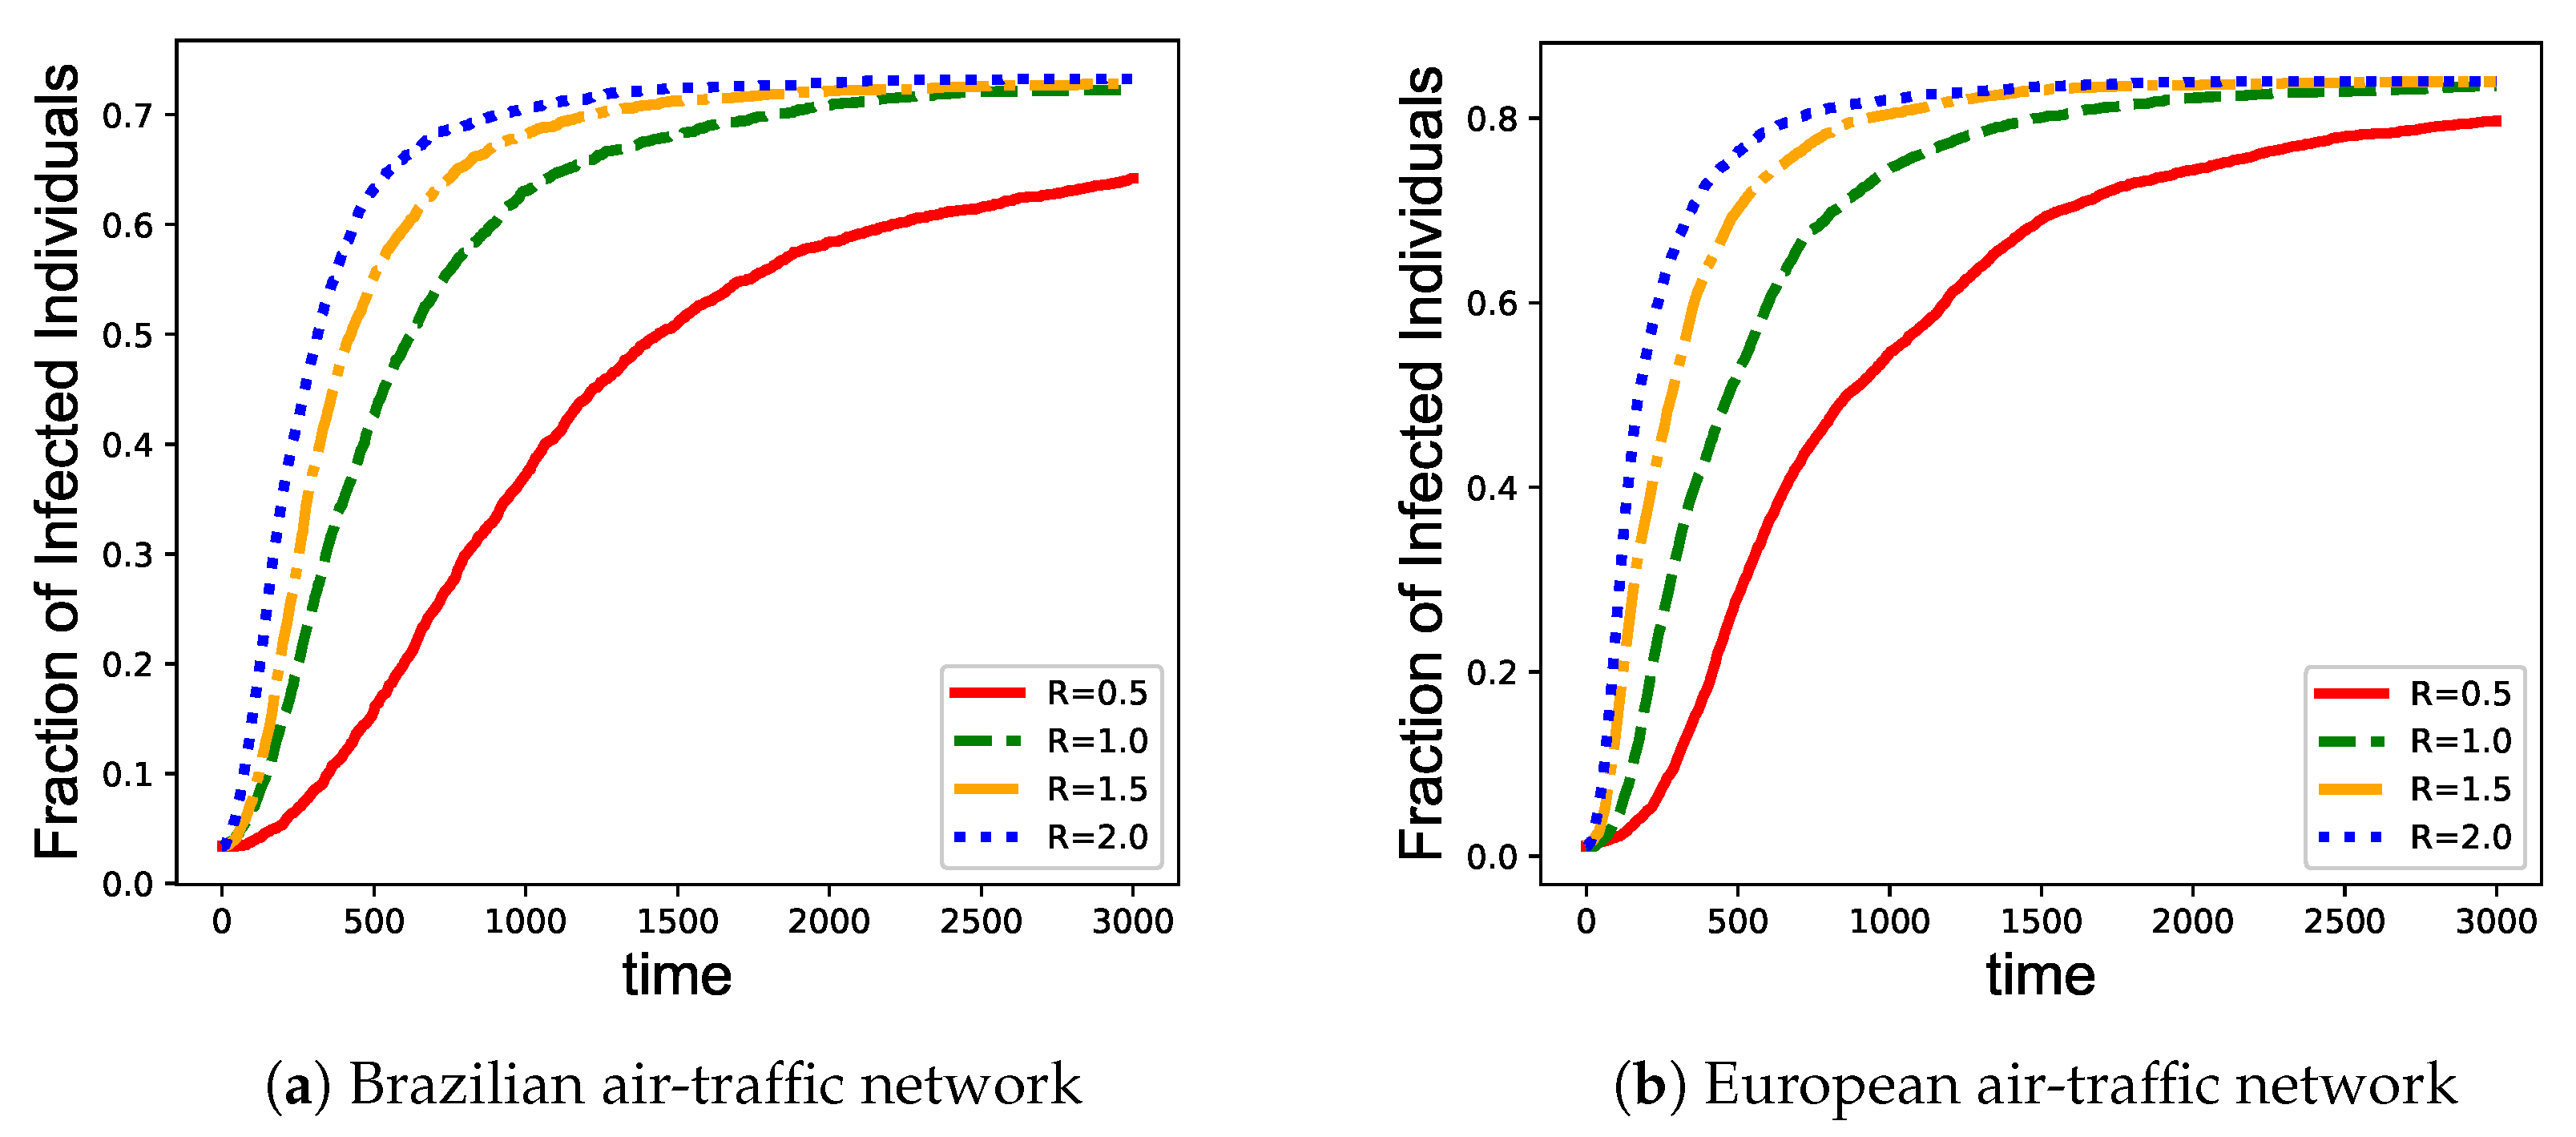
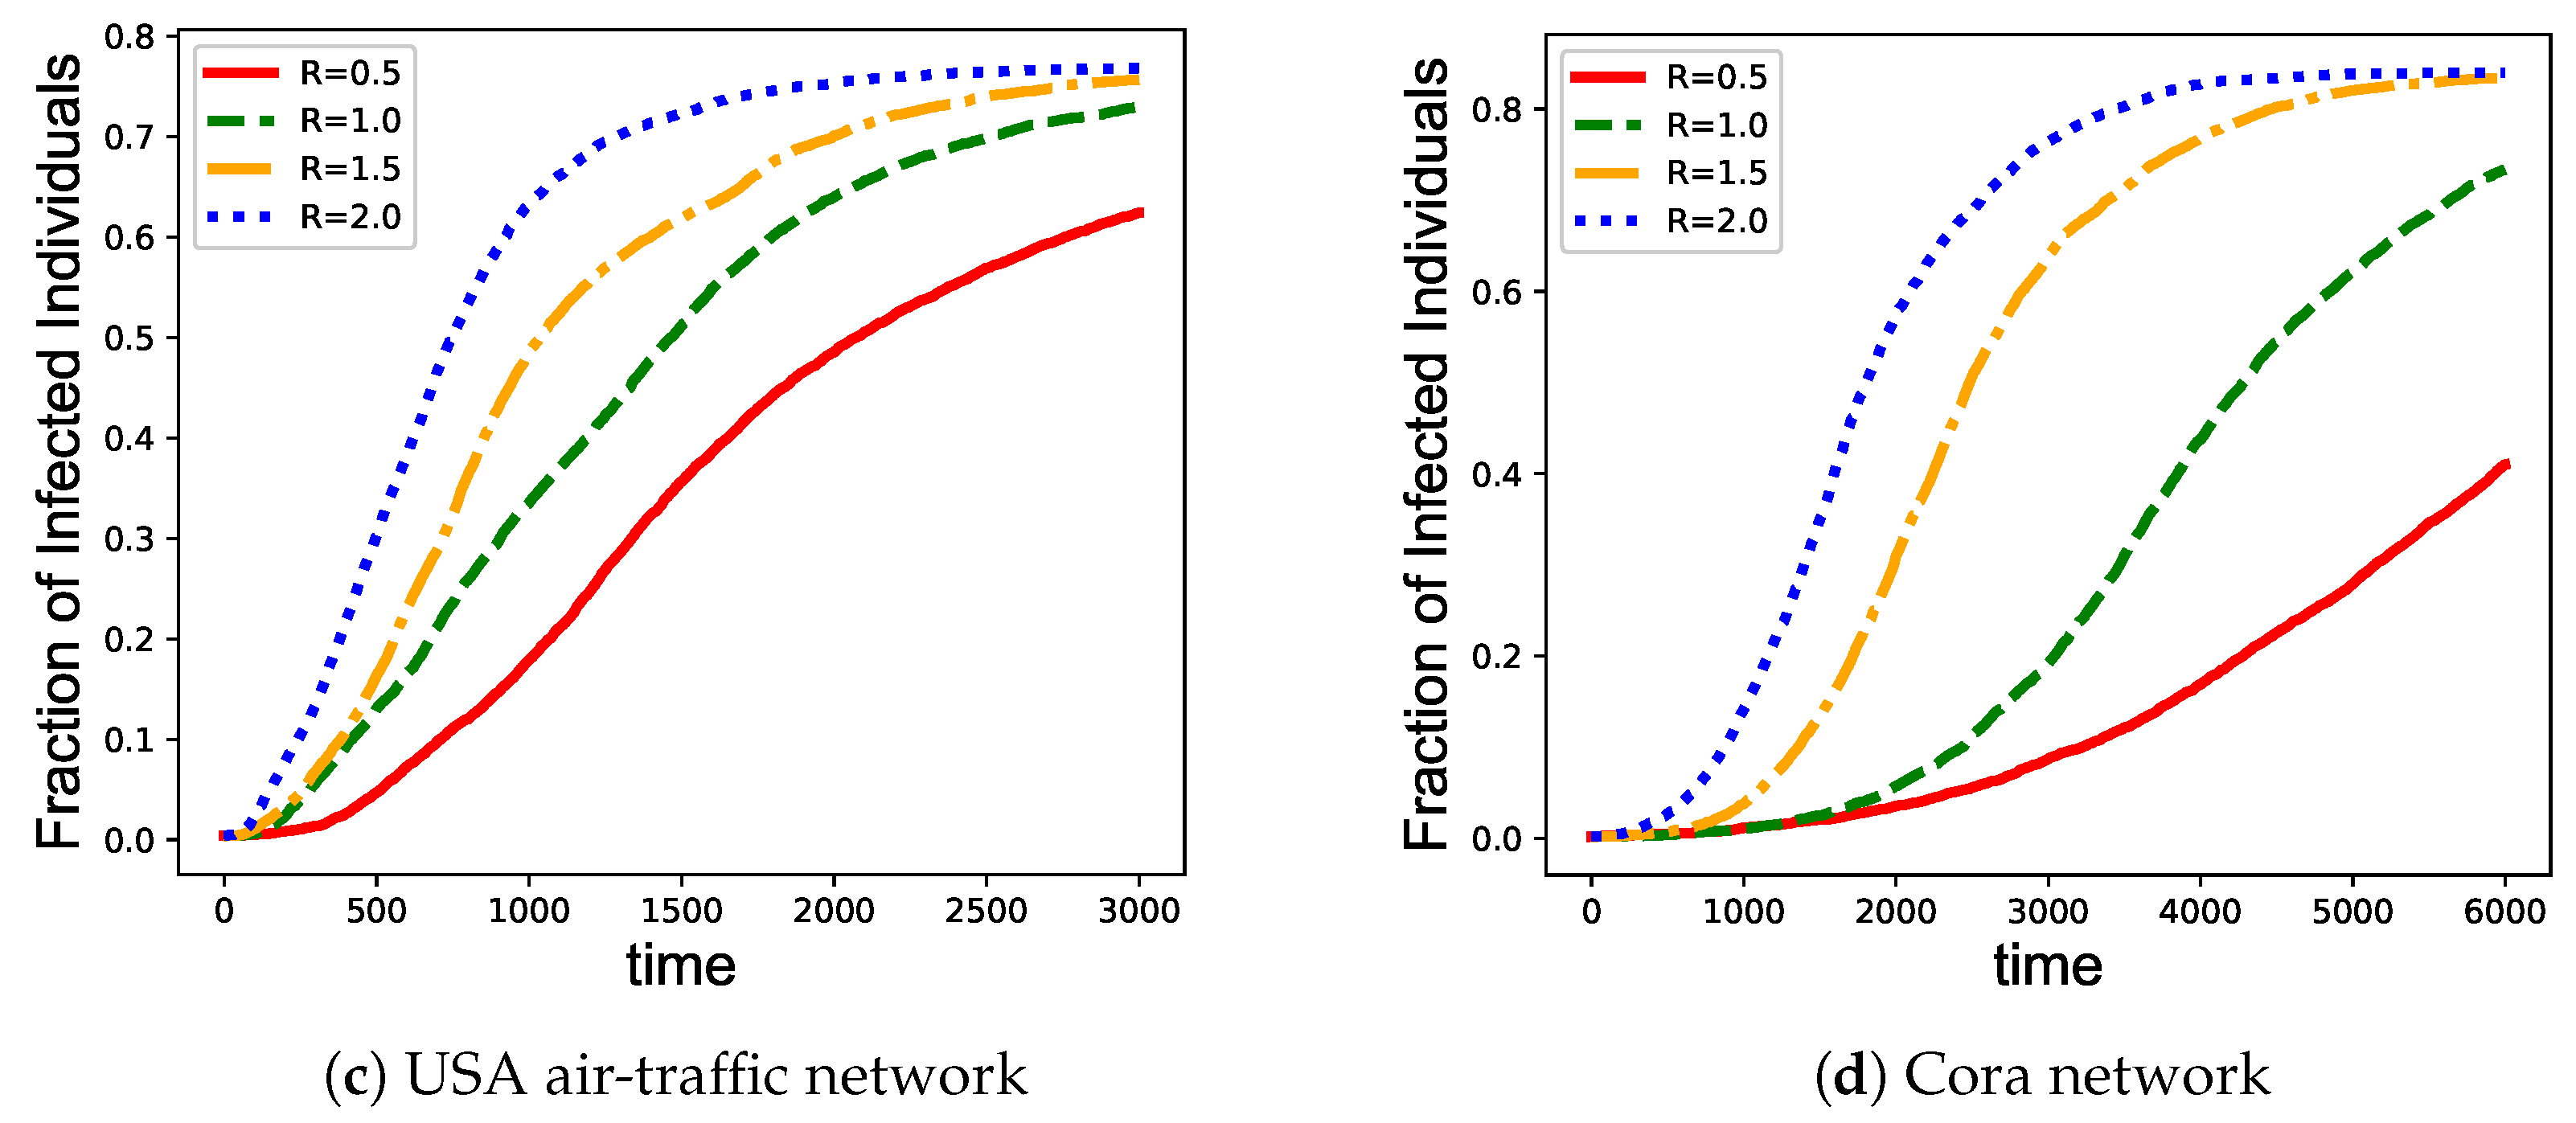
We also investigate the immunization efficiency of EpiEm strategy at different transmission rates. The vaccine coverage M are set to be 10%, and the epidemic transmission rate are chosen from r { 0.5 , 1.0 , 1.5 , 2.0 } . As shown in Figure 5, increasing the transmission rates speeds up the increase of infections, which in turn results in a higher fraction of infected nodes. Therefore, we should enlarge vaccine coverage when the transmission rate becomes higher.

4. Conclusions

In this paper, we have proposed a dynamics-preserving graph embedding method, EpiEm, which preserves both network structure and dynamic properties of the epidemic spreading on networks. The learned network embedding can be applied for node clustering, as well as network immunization before epidemic outbreaks. Different from existing random-walks based embedding methods, EpiEm samples propagation sequences by simulating epidemic dynamics on networks. We have adopted the Gillespie algorithm to simulate the Susceptible-Infectious dynamics on networks. Using a singular value decomposition method, we have encoded the node interactions during the epidemic spreading by two sets of node representations, i.e., the infectiousness and vulnerability. Experiments on both synthetic and real-world networks have shown that our proposed embedding method outperforms several benchmark methods in terms of node clustering and network immunization. The results and findings can offer new insights into, as well as new tools for investigating more complicated and realistic dynamics in complex networks.
In the future, the proposed method can be extended in the following directions: First, the SI model used in this paper is relatively simple. To solve other complex network analytic tasks, it would be possible to generate node embeddings based on more complicated epidemic dynamics on networks, such as SIS and SIR epidemic models. Second, the singular value decomposition method used in this paper have high computational complexity. To deal with large-scale networks, it would be necessary to develop more efficient embedding methods. One possible way is to extend the word2vec algorithm to our EpiEm method. Finally, it is expected that the dynamics-preserving graph embedding approach can also be used to investigate other types of dynamics on networks, such as opinion formation in social networks.

Author Contributions

Conceptualization, B.S. and H.Q.; methodology, B.S., H.Q. and J.Z.; formal analysis, B.S., H.Q. and J.Z.; investigation, B.S. and J.Z.; writing—original draft preparation, B.S. and J.Z.; writing—review and editing, B.S., H.Q. and J.Z.; visualization, B.S., H.Q. and J.Z. All authors have read and agreed to the published version of the manuscript.

Funding

This work was supported in part by the Zhejiang Provincial Natural Science Foundation of China under Grant LQ19F030011.

Conflicts of Interest

The authors declare no conflict of interest. The funders had no role in the design of the study; in the collection, analyses, or interpretation of data; in the writing of the manuscript, or in the decision to publish the results.

References

  1. Borgatti, S.P.; Mehra, A.; Brass, D.J.; Labianca, G. Network analysis in the social sciences. Science 2009, 323, 892–895. [Google Scholar] [CrossRef] [PubMed] [Green Version]
  2. Bassett, D.S.; Sporns, O. Network neuroscience. Nat. Neurosci. 2017, 20, 353. [Google Scholar] [CrossRef] [PubMed] [Green Version]
  3. Theocharidis, A.; Van Dongen, S.; Enright, A.J.; Freeman, T.C. Network visualization and analysis of gene expression data using BioLayout Express 3D. Nat. Protoc. 2009, 4, 1535. [Google Scholar] [CrossRef] [PubMed]
  4. Lawrence, S.; Giles, C.L. Searching the world wide web. Science 1998, 280, 98–100. [Google Scholar] [CrossRef] [PubMed] [Green Version]
  5. Albert, R.; Barabási, A.L. Statistical mechanics of complex networks. Rev. Mod. Phys. 2002, 74, 47. [Google Scholar] [CrossRef] [Green Version]
  6. Boccaletti, S.; Latora, V.; Moreno, Y.; Chavez, M.; Hwang, D.U. Complex networks: Structure and dynamics. Phys. Rep. 2006, 424, 175–308. [Google Scholar] [CrossRef]
  7. Schaeffer, S.E. Graph clustering. Comput. Sci. Rev. 2007, 1, 27–64. [Google Scholar] [CrossRef]
  8. Fortunato, S. Community detection in graphs. Phys. Rep. 2010, 486, 75–174. [Google Scholar] [CrossRef] [Green Version]
  9. Ying, J.C.; Shi, B.N.; Tseng, V.S.; Tsai, H.W.; Cheng, K.H.; Lin, S.C. Preference-aware community detection for item recommendation. In Proceedings of the 2013 Conference on Technologies and Applications of Artificial Intelligence, Taipei, Taiwan, 6–8 December 2013; pp. 49–54. [Google Scholar] [CrossRef]
  10. Harenberg, S.; Bello, G.; Gjeltema, L.; Ranshous, S.; Harlalka, J.; Seay, R.; Padmanabhan, K.; Samatova, N. Community detection in large-scale networks: A survey and empirical evaluation. Wiley Interdiscip. Rev. Comput. Stat. 2014, 6, 426–439. [Google Scholar] [CrossRef] [Green Version]
  11. Choudhury, D.; Paul, A. Community detection in social networks: An overview. Int. J. Res. Eng. Technol. 2013, 2, 6–13. [Google Scholar] [CrossRef] [Green Version]
  12. Borgatti, S.P. Centrality and network flow. Soc. Netw. 2005, 27, 55–71. [Google Scholar] [CrossRef]
  13. Hu, P.; Fan, W.; Mei, S. Identifying node importance in complex networks. Phys. A Stat. Mech. Appl. 2015, 429, 169–176. [Google Scholar] [CrossRef]
  14. Cao, J.; Ding, C.; Shi, B. Motif-based functional backbone extraction of complex networks. Phys. A Stat. Mech. Appl. 2019, 526, 121123. [Google Scholar] [CrossRef]
  15. Restrepo, J.G.; Ott, E.; Hunt, B.R. Characterizing the dynamical importance of network nodes and links. Phys. Rev. Lett. 2006, 97, 094102. [Google Scholar] [CrossRef] [PubMed] [Green Version]
  16. Zhang, J.; Xu, X.K.; Li, P.; Zhang, K.; Small, M. Node importance for dynamical process on networks: A multiscale characterization. Chaos Interdiscip. J. Nonlinear Sci. 2011, 21, 016107. [Google Scholar] [CrossRef] [Green Version]
  17. Pastor-Satorras, R.; Vespignani, A. Epidemic spreading in scale-free networks. Phys. Rev. Lett. 2001, 86, 3200. [Google Scholar] [CrossRef] [Green Version]
  18. Pastor-Satorras, R.; Vespignani, A. Immunization of complex networks. Phys. Rev. E 2002, 65, 036104. [Google Scholar] [CrossRef] [Green Version]
  19. Nowzari, C.; Preciado, V.M.; Pappas, G.J. Analysis and control of epidemics: A survey of spreading processes on complex networks. IEEE Control Syst. Mag. 2016, 36, 26–46. [Google Scholar] [CrossRef] [Green Version]
  20. Kernighan, B.W.; Lin, S. An efficient heuristic procedure for partitioning graphs. Bell Syst. Tech. J. 1970, 49, 291–307. [Google Scholar] [CrossRef]
  21. Newman, M.E. Modularity and community structure in networks. Proc. Natl. Acad. Sci. USA 2006, 103, 8577–8582. [Google Scholar] [CrossRef] [Green Version]
  22. Tremblay, N.; Borgnat, P. Graph wavelets for multiscale community mining. IEEE Trans. Signal Process. 2014, 62, 5227–5239. [Google Scholar] [CrossRef]
  23. Bengio, Y.; Courville, A.; Vincent, P. Representation learning: A review and new perspectives. IEEE Trans. Pattern Anal. Mach. Intell. 2013, 35, 1798–1828. [Google Scholar] [CrossRef] [PubMed]
  24. Hamilton, W.L.; Ying, R.; Leskovec, J. Representation learning on graphs: Methods and applications. arXiv 2017, arXiv:1709.05584. [Google Scholar]
  25. Cui, P.; Wang, X.; Pei, J.; Zhu, W. A survey on network embedding. IEEE Trans. Knowl. Data Eng. 2018. [Google Scholar] [CrossRef] [Green Version]
  26. Goyal, P.; Ferrara, E. Graph embedding techniques, applications, and performance: A survey. Knowl. Based Syst. 2018, 151, 78–94. [Google Scholar] [CrossRef] [Green Version]
  27. Cai, H.; Zheng, V.W.; Chang, K.C.C. A comprehensive survey of graph embedding: Problems, techniques, and applications. IEEE Trans. Knowl. Data Eng. 2018, 30, 1616–1637. [Google Scholar] [CrossRef] [Green Version]
  28. Tang, J.; Qu, M.; Wang, M.; Zhang, M.; Yan, J.; Mei, Q. LINE: Large-scale information network embedding. In Proceedings of the 24th International Conference on World Wide Web, Florence, Italy, 18–22 May 2015; pp. 1067–1077. [Google Scholar] [CrossRef] [Green Version]
  29. Wang, D.; Cui, P.; Zhu, W. Structural deep network embedding. In Proceedings of the 22nd ACM International Conference on Knowledge Discovery and Data Mining; ACM: New York, NY, USA, 2016; pp. 1225–1234. [Google Scholar] [CrossRef]
  30. Perozzi, B.; Al-Rfou, R.; Skiena, S. Deepwalk: Online learning of social representations. In Proceedings of the 20th ACM International Conference on Knowledge Discovery and Data Mining; ACM: New York, NY, USA, 2014; pp. 701–710. [Google Scholar] [CrossRef] [Green Version]
  31. Dong, Y.; Chawla, N.V.; Swami, A. metapath2vec: Scalable representation learning for heterogeneous networks. In Proceedings of the 23rd ACM International Conference on Knowledge Discovery and Data Mining; ACM: New York, NY, USA, 2017; pp. 135–144. [Google Scholar] [CrossRef]
  32. Zitnik, M.; Leskovec, J. Predicting multicellular function through multi-layer tissue networks. Bioinformatics 2017, 33, i190–i198. [Google Scholar] [CrossRef] [Green Version]
  33. Grover, A.; Leskovec, J. node2vec: Scalable feature learning for networks. In Proceedings of the 22nd ACM International Conference on Knowledge Discovery and Data Mining; ACM: New York, NY, USA, 2016; pp. 855–864. [Google Scholar]
  34. Lyu, T.; Zhang, Y.; Zhang, Y. Enhancing the network embedding quality with structural similarity. In Proceedings of the ACM Conference on Information and Knowledge Management; ACM: New York, NY, USA, 2017; pp. 147–156. [Google Scholar] [CrossRef]
  35. Ribeiro, L.F.; Saverese, P.H.; Figueiredo, D.R. struc2vec: Learning node representations from structural identity. In Proceedings of the 23rd ACM International Conference on Knowledge Discovery and Data Mining; ACM: New York, NY, USA, 2017; pp. 385–394. [Google Scholar] [CrossRef] [Green Version]
  36. Shi, B.; Zhou, C.; Qiu, H.; Xu, X.; Liu, J. Unifying structural proximity and equivalence for network embedding. IEEE Access 2019, 7, 106124–106138. [Google Scholar] [CrossRef]
  37. Madar, N.; Kalisky, T.; Cohen, R.; Ben-avraham, D.; Havlin, S. Immunization and epidemic dynamics in complex networks. Eur. Phys. J. B 2004, 38, 269–276. [Google Scholar] [CrossRef]
  38. Tenenbaum, J.B.; De Silva, V.; Langford, J.C. A global geometric framework for nonlinear dimensionality reduction. Science 2000, 290, 2319–2323. [Google Scholar] [CrossRef]
  39. Roweis, S.T.; Saul, L.K. Nonlinear dimensionality reduction by locally linear embedding. Science 2000, 290, 2323–2326. [Google Scholar] [CrossRef] [PubMed] [Green Version]
  40. Belkin, M.; Niyogi, P. Laplacian eigenmaps and spectral techniques for embedding and clustering. In Proceedings of the NIPS 2002 Advances in Neural Information Processing Systems, Vancouver, BC, Canada, 9–14 December 2002; pp. 585–591. [Google Scholar]
  41. Ahmed, A.; Shervashidze, N.; Narayanamurthy, S.; Josifovski, V.; Smola, A.J. Distributed large-scale natural graph factorization. In Proceedings of the 22nd International Conference on World Wide Web; ACM: New York, NY, USA, 2013; pp. 37–48. [Google Scholar] [CrossRef] [Green Version]
  42. Ou, M.; Cui, P.; Pei, J.; Zhang, Z.; Zhu, W. Asymmetric transitivity preserving graph embedding. In Proceedings of the 22nd ACM International Conference on Knowledge Discovery and Data Mining; ACM: New York, NY, USA, 2016; pp. 1105–1114. [Google Scholar] [CrossRef]
  43. Wang, X.; Cui, P.; Wang, J.; Pei, J.; Zhu, W.; Yang, S. Community Preserving Network Embedding. In Proceedings of the Thirty-First AAAI Conference on Artificial Intelligence AAAI, San Francisco, CA, USA, 4–9 February 2017; pp. 203–209. [Google Scholar]
  44. Tu, K.; Cui, P.; Wang, X.; Yu, P.S.; Zhu, W. Deep recursive network embedding with regular equivalence. In Proceedings of the 24th ACM International Conference on Knowledge Discovery & Data Mining; ACM: New York, NY, USA, 2018; pp. 2357–2366. [Google Scholar] [CrossRef]
  45. Donnat, C.; Zitnik, M.; Hallac, D.; Leskovec, J. Learning structural node embeddings via diffusion wavelets. In Proceedings of the 24th ACM International Conference on Knowledge Discovery and Data Mining; ACM: New York, NY, USA, 2018; pp. 1320–1329. [Google Scholar] [CrossRef] [Green Version]
  46. Cao, S.; Lu, W.; Xu, Q. GraRep: Learning graph representations with global structural information. In Proceedings of the 24th ACM International on Conference on Information and Knowledge Management; ACM: New York, NY, USA, 2015; pp. 891–900. [Google Scholar] [CrossRef]
  47. Masuda, N.; Porter, M.A.; Lambiotte, R. Random walks and diffusion on networks. Phys. Rep. 2017, 716, 1–58. [Google Scholar] [CrossRef]
  48. Keeling, M.J.; Eames, K.T. Networks and epidemic models. J. R. Soc. Interface 2005, 2, 295–307. [Google Scholar] [CrossRef] [PubMed] [Green Version]
  49. Witten, G.; Poulter, G. Simulations of infectious diseases on networks. Comput. Biol. Med. 2007, 37, 195–205. [Google Scholar] [CrossRef] [PubMed]
  50. Newman, M.E. The structure and function of complex networks. SIAM Rev. 2003, 45, 167–256. [Google Scholar] [CrossRef] [Green Version]
  51. Cohen, R.; Havlin, S.; Ben-Avraham, D. Efficient immunization strategies for computer networks and populations. Phys. Rev. Lett. 2003, 91, 247901. [Google Scholar] [CrossRef] [Green Version]
  52. Hadidjojo, J.; Cheong, S.A. Equal graph partitioning on estimated infection network as an effective epidemic mitigation measure. PLoS ONE 2011, 6. [Google Scholar] [CrossRef]
  53. Schneider, C.M.; Mihaljev, T.; Havlin, S.; Herrmann, H.J. Suppressing epidemics with a limited amount of immunization units. Phys. Rev. E 2011, 84, 061911. [Google Scholar] [CrossRef] [Green Version]
  54. Allen, L.J. Some discrete-time SI, SIR, and SIS epidemic models. Math. Biosci. 1994, 124, 83–105. [Google Scholar] [CrossRef]
  55. Gillespie, D.T. Exact stochastic simulation of coupled chemical reactions. J. Phys. Chem. 1977, 81, 2340–2361. [Google Scholar] [CrossRef]
  56. Shi, B.; Liu, G.; Qiu, H.; Wang, Z.; Ren, Y.; Chen, D. Exploring voluntary vaccination with bounded rationality through reinforcement learning. Phys. A Stat. Mech. Appl. 2019, 515, 171–182. [Google Scholar] [CrossRef]
  57. Pennington, J.; Socher, R.; Manning, C.D. Glove: Global vectors for word representation. In Proceedings of the 2014 conference on empirical methods in natural language processing (EMNLP), Doha, Qatar, 25–29 October 2014; pp. 1532–1543. [Google Scholar] [CrossRef]
  58. Kalman, D. A singularly valuable decomposition: The SVD of a matrix. Coll. Math. J. 1996, 27, 2–23. [Google Scholar] [CrossRef]
  59. Sarwar, B.; Karypis, G.; Konstan, J.; Riedl, J. Application of Dimensionality Reduction in Recommender System—A Case Study; Technical Report; Minnesota Univ Minneapolis Dept of Computer Science: Minneapolis, MN, USA, 2000. [Google Scholar] [CrossRef]
  60. Zhang, Z.; Cui, P.; Wang, X.; Pei, J.; Yao, X.; Zhu, W. Arbitrary-order proximity preserved network embedding. In Proceedings of the 24th ACM SIGKDD International Conference on Knowledge Discovery & Data Mining; ACM: New York, NY, USA, 2018; pp. 2778–2786. [Google Scholar]
  61. Rosenberg, A.; Hirschberg, J. V-measure: A conditional entropy-based external cluster evaluation measure. In Proceedings of the 2007 Joint Conference on Empirical Methods in Natural Language Processing and Computational Natural Language Learning (EMNLP-CoNLL), Prague, Czech Republic, 28–30 June 2007. [Google Scholar] [CrossRef]
  62. McCallum, A.K.; Nigam, K.; Rennie, J.; Seymore, K. Automating the construction of internet portals with machine learning. Inf. Retr. 2000, 3, 127–163. [Google Scholar] [CrossRef]
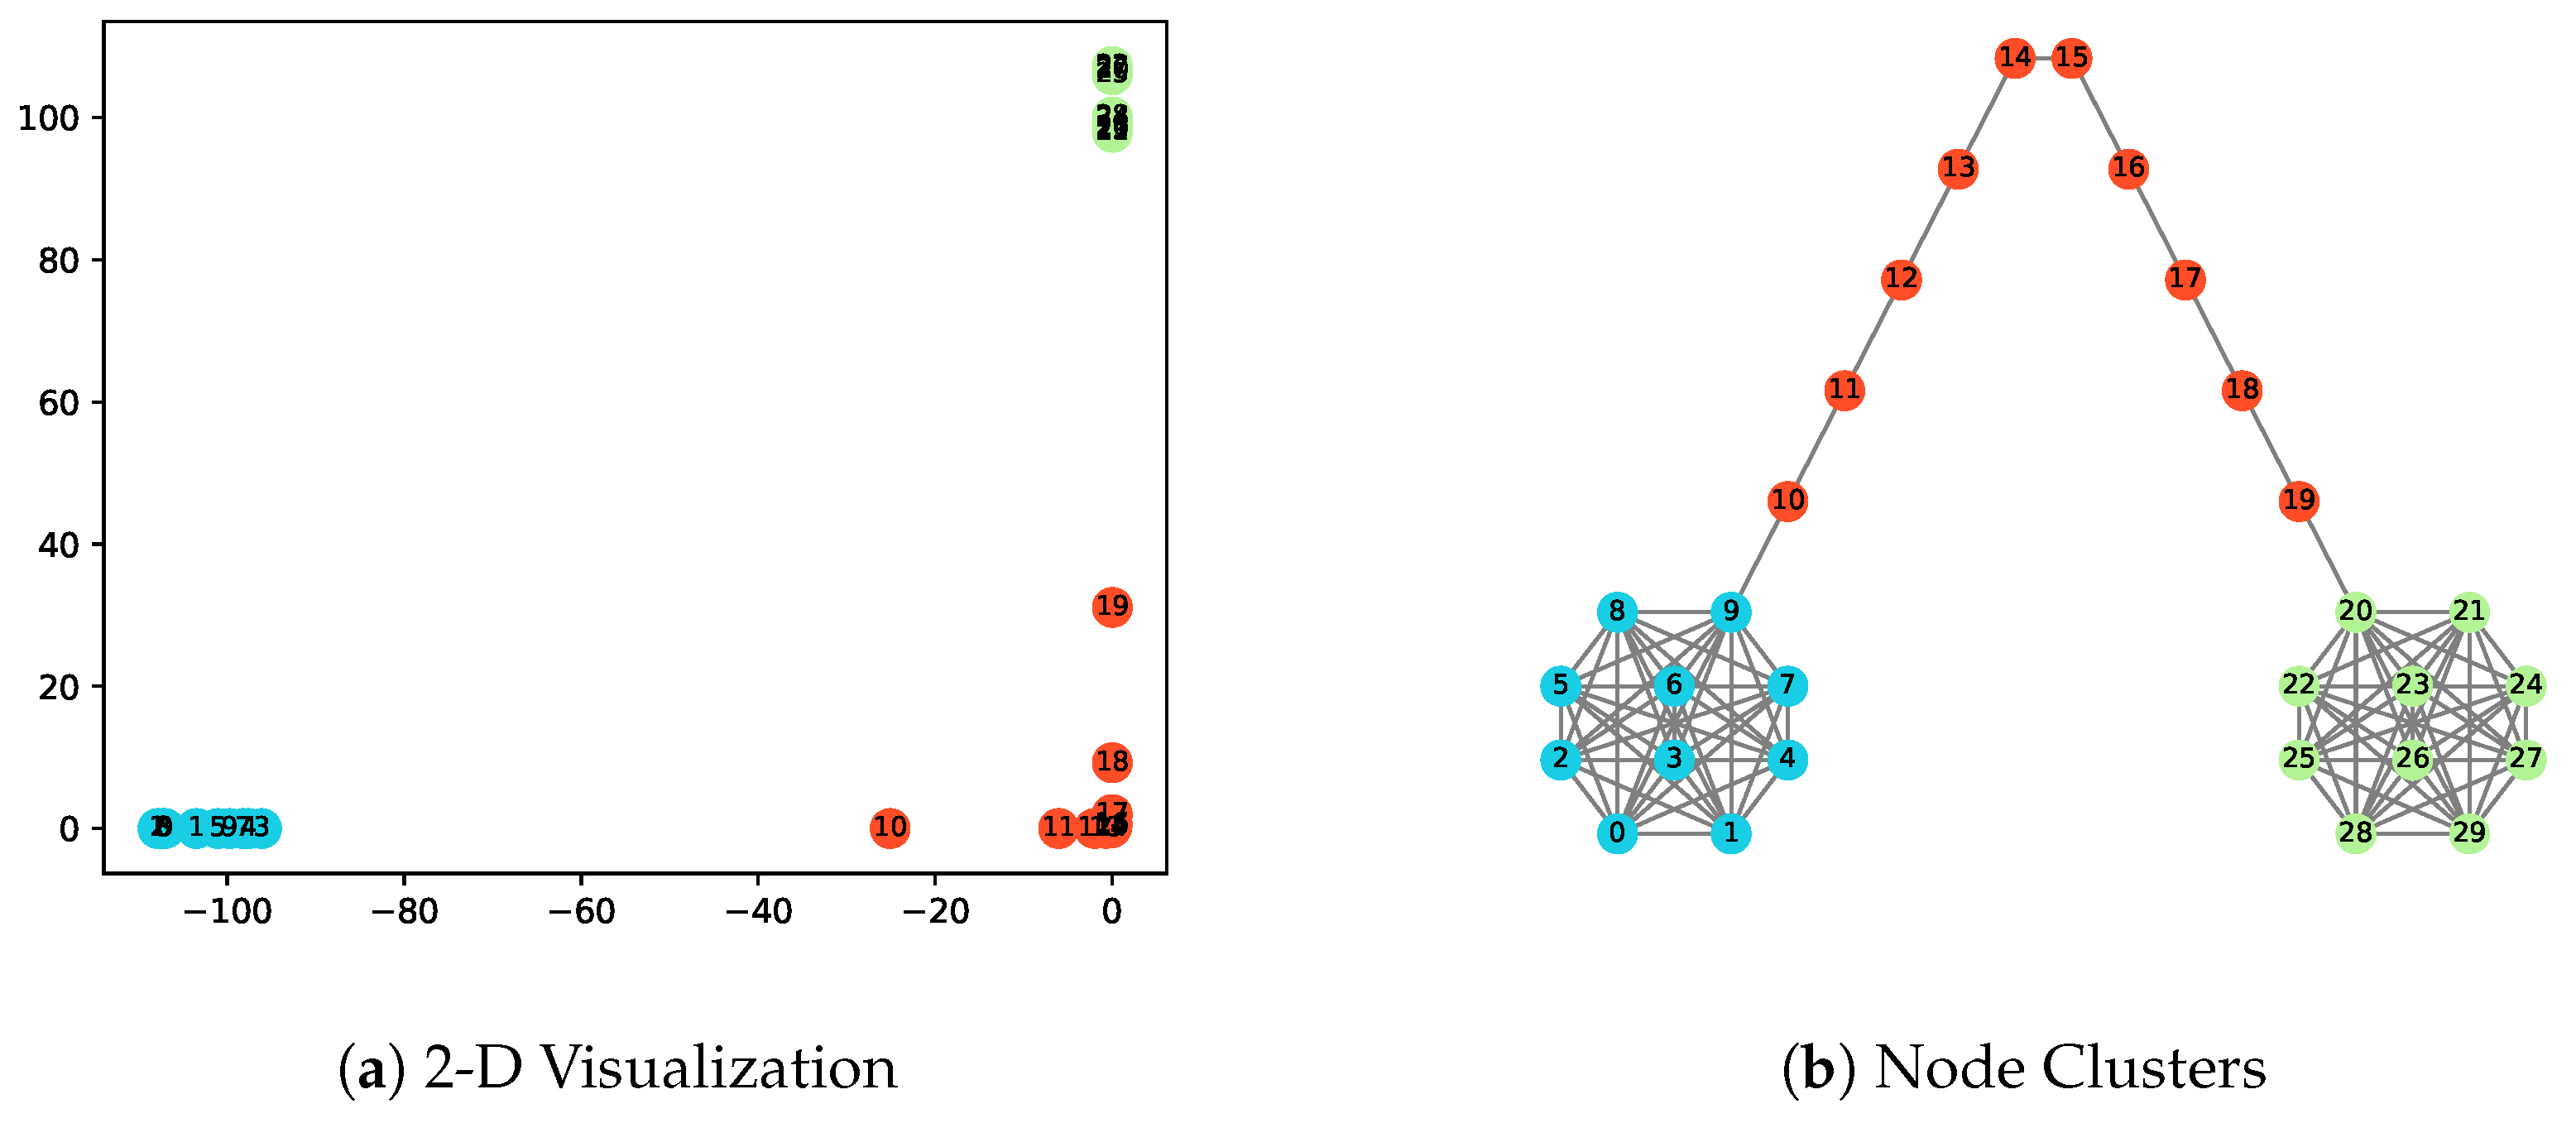
Figure 1. The illustration of the barbell network and obtained node representations in 2-dimensional space with r = 0.5 . Nodes in different clusters obtained by the k-means algorithm are marked in different colors.
Information 11 00250 g001
Figure 2. The illustration of the karate network and obtained node representations in 2-dimensional space with r = 0.5 . Nodes in different clusters obtained by the k-means algorithm are marked in different colors.
Information 11 00250 g002
Figure 3. Performance comparison among different immunization strategies on four benchmark networks. (a) Brazilian air-traffic network; (b) European air-traffic network; (c) USA air-traffic network; and (d) Cora network. The x axis represents the infection time of the nodes. The y axis represents the fraction of infected nodes in the network.
Information 11 00250 g003
Figure 4. Performance comparison among different immunization strategies on four benchmark networks given different vaccinate coverage. (a) Brazilian air-traffic network; (b) European air-traffic network; (c) USA air-traffic network; and (d) Cora network. The x axis represents the infection time of the nodes. The y axis represents the fraction of infected nodes in the network.
Information 11 00250 g004
Figure 5. Performance comparison among different immunization strategies on four benchmark networks given different transmission rates. (a) Brazilian air-traffic network; (b) European air-traffic network; (c) USA air-traffic network; and (d) Cora network. The x axis represents the infection time of the nodes. The y axis represents the fraction of infected nodes in the network.
Information 11 00250 g005aInformation 11 00250 g005b
Table 1. Parameter settings for different networks.
NetworkSpectral ClusteringDeepWalkNode2vecEpiEm
Braziliand = 16d = 16d = 16, p = 4, q = 4d = 16, r = 0.5, K = 10
Europeand = 128d = 128d = 128, p = 1, q = 0.25d = 128, r = 0.5, K = 10
USAd = 128d = 128d = 128, p = 2, q = 1d = 128, r = 0.5, K = 10
Table 2. Performance of different network embedding methods on three air-traffic networks in terms of homogeneity and completeness.
NetworkMethodHomogeneityCompleteness
BrazilianDeepWalk0.0560.076
air-trafficNode2vec0.0480.057
networkSpectral0.0620.106
EpiEm0.2930.361
EuropeanDeepWalk0.0250.019
air-trafficNode2vec0.0300.024
networkSpectral0.0220.084
EpiEm0.2070.243
UsaDeepWalk0.0620.115
air-trafficNode2vec0.0870.112
networkSpectral0.0070.120
EpiEm0.2500.444