Using UAV Based 3D Modelling to Provide Smart Monitoring of Road Pavement Conditions


Abstract
1. Introduction
1.1. The Growing Need for Low-Cost Automated Distress Detection Systems
1.2. The Current State of Pavement Distress Detection Applications
1.3. The Rising Use of 3D Image-Based Modelling and Drones to Detect and Analyse Pavement Distresses
1.4. Utilizing Segmentation to Analyse 3D Models of Pavement Sections
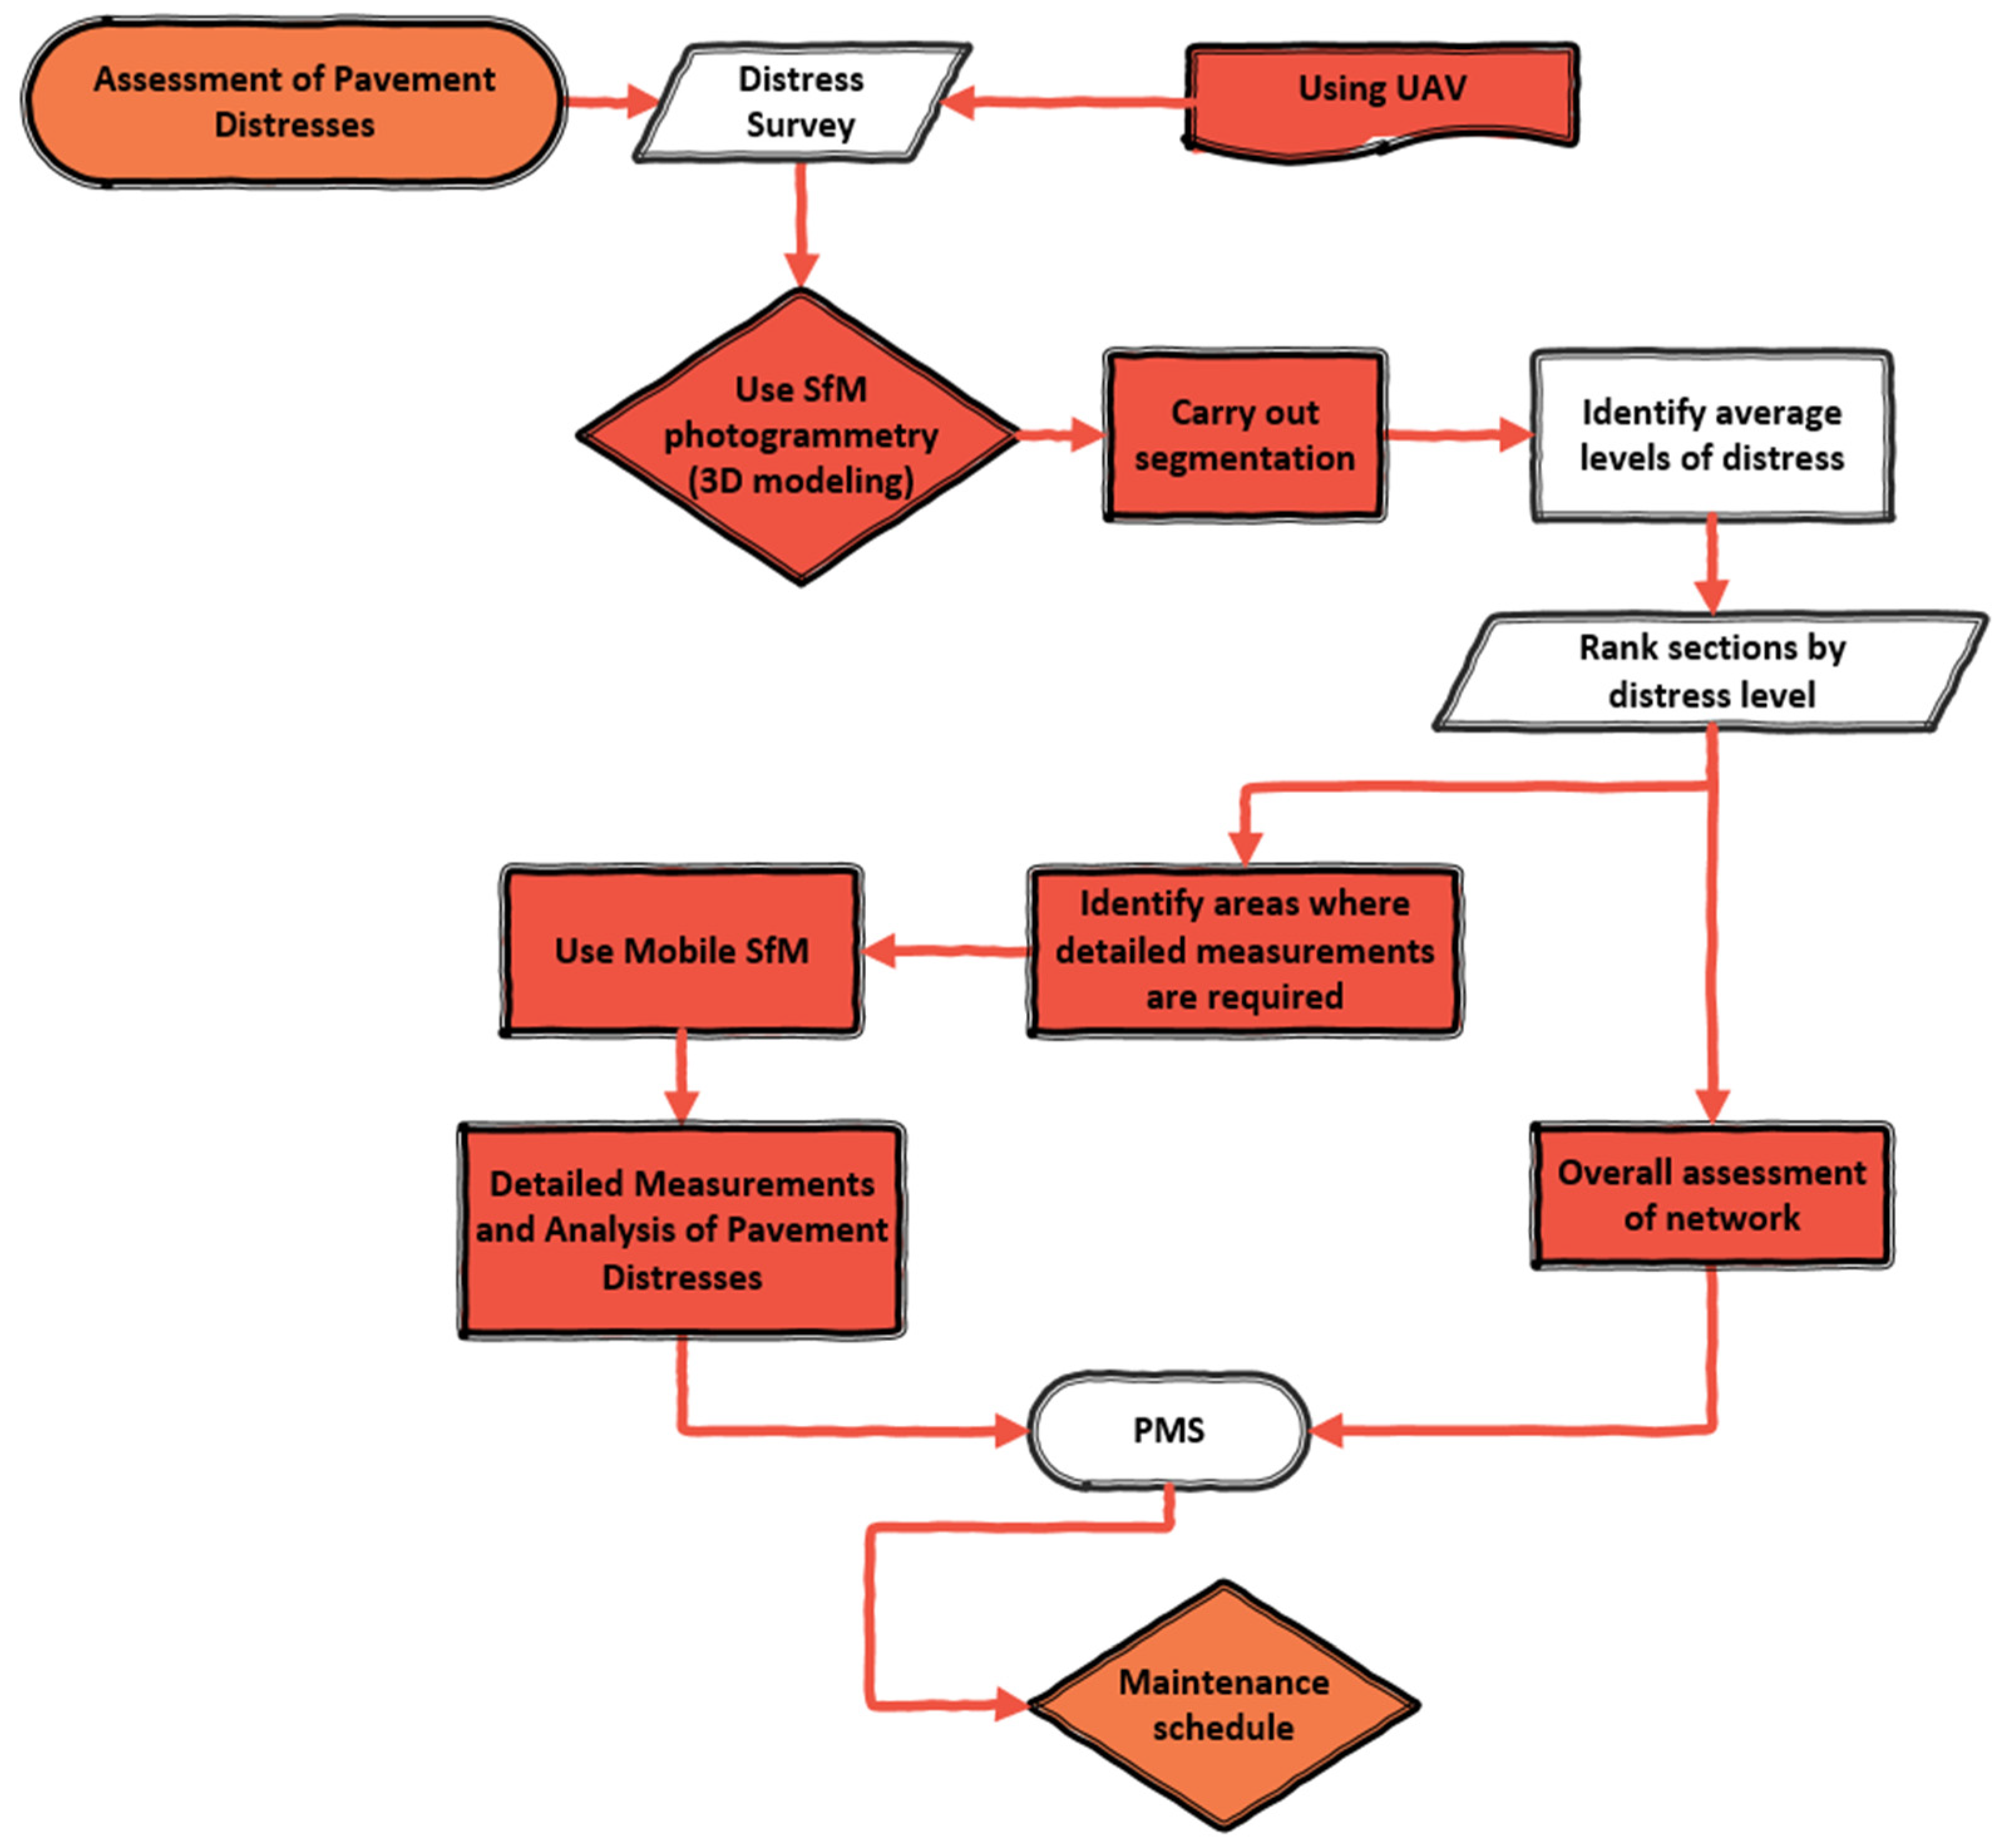
1.5. The Specific Aim of the Study
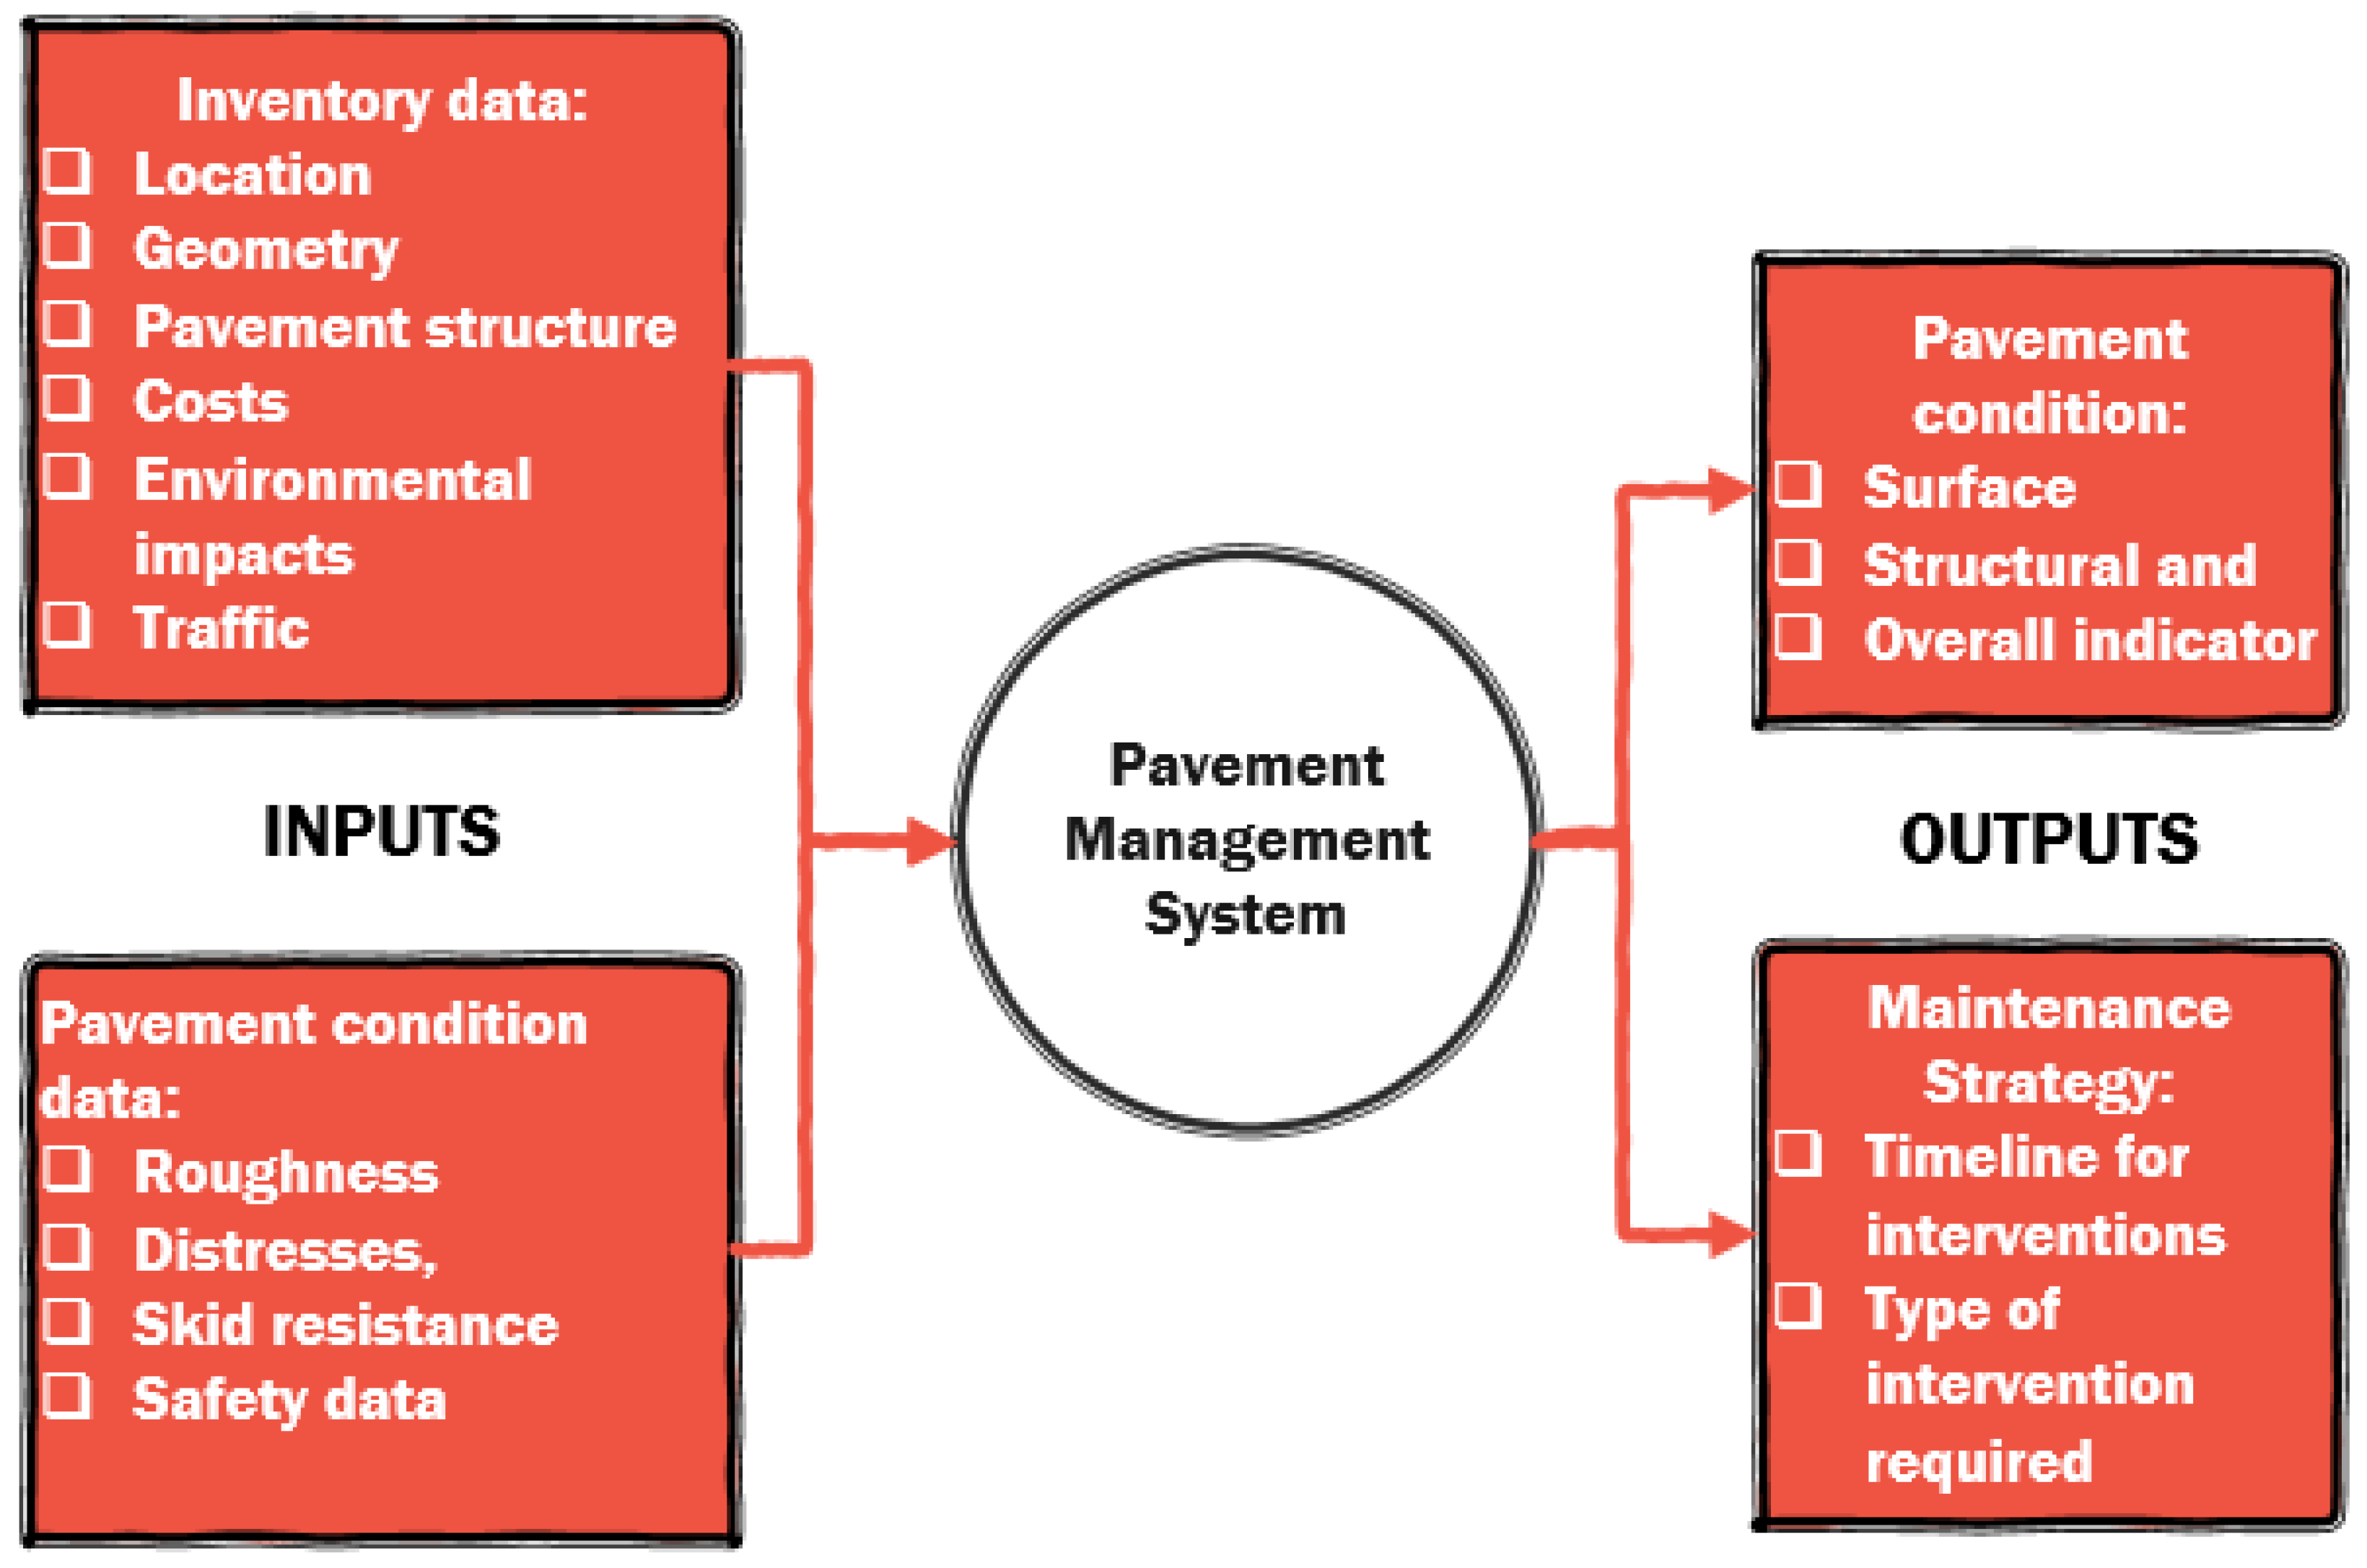
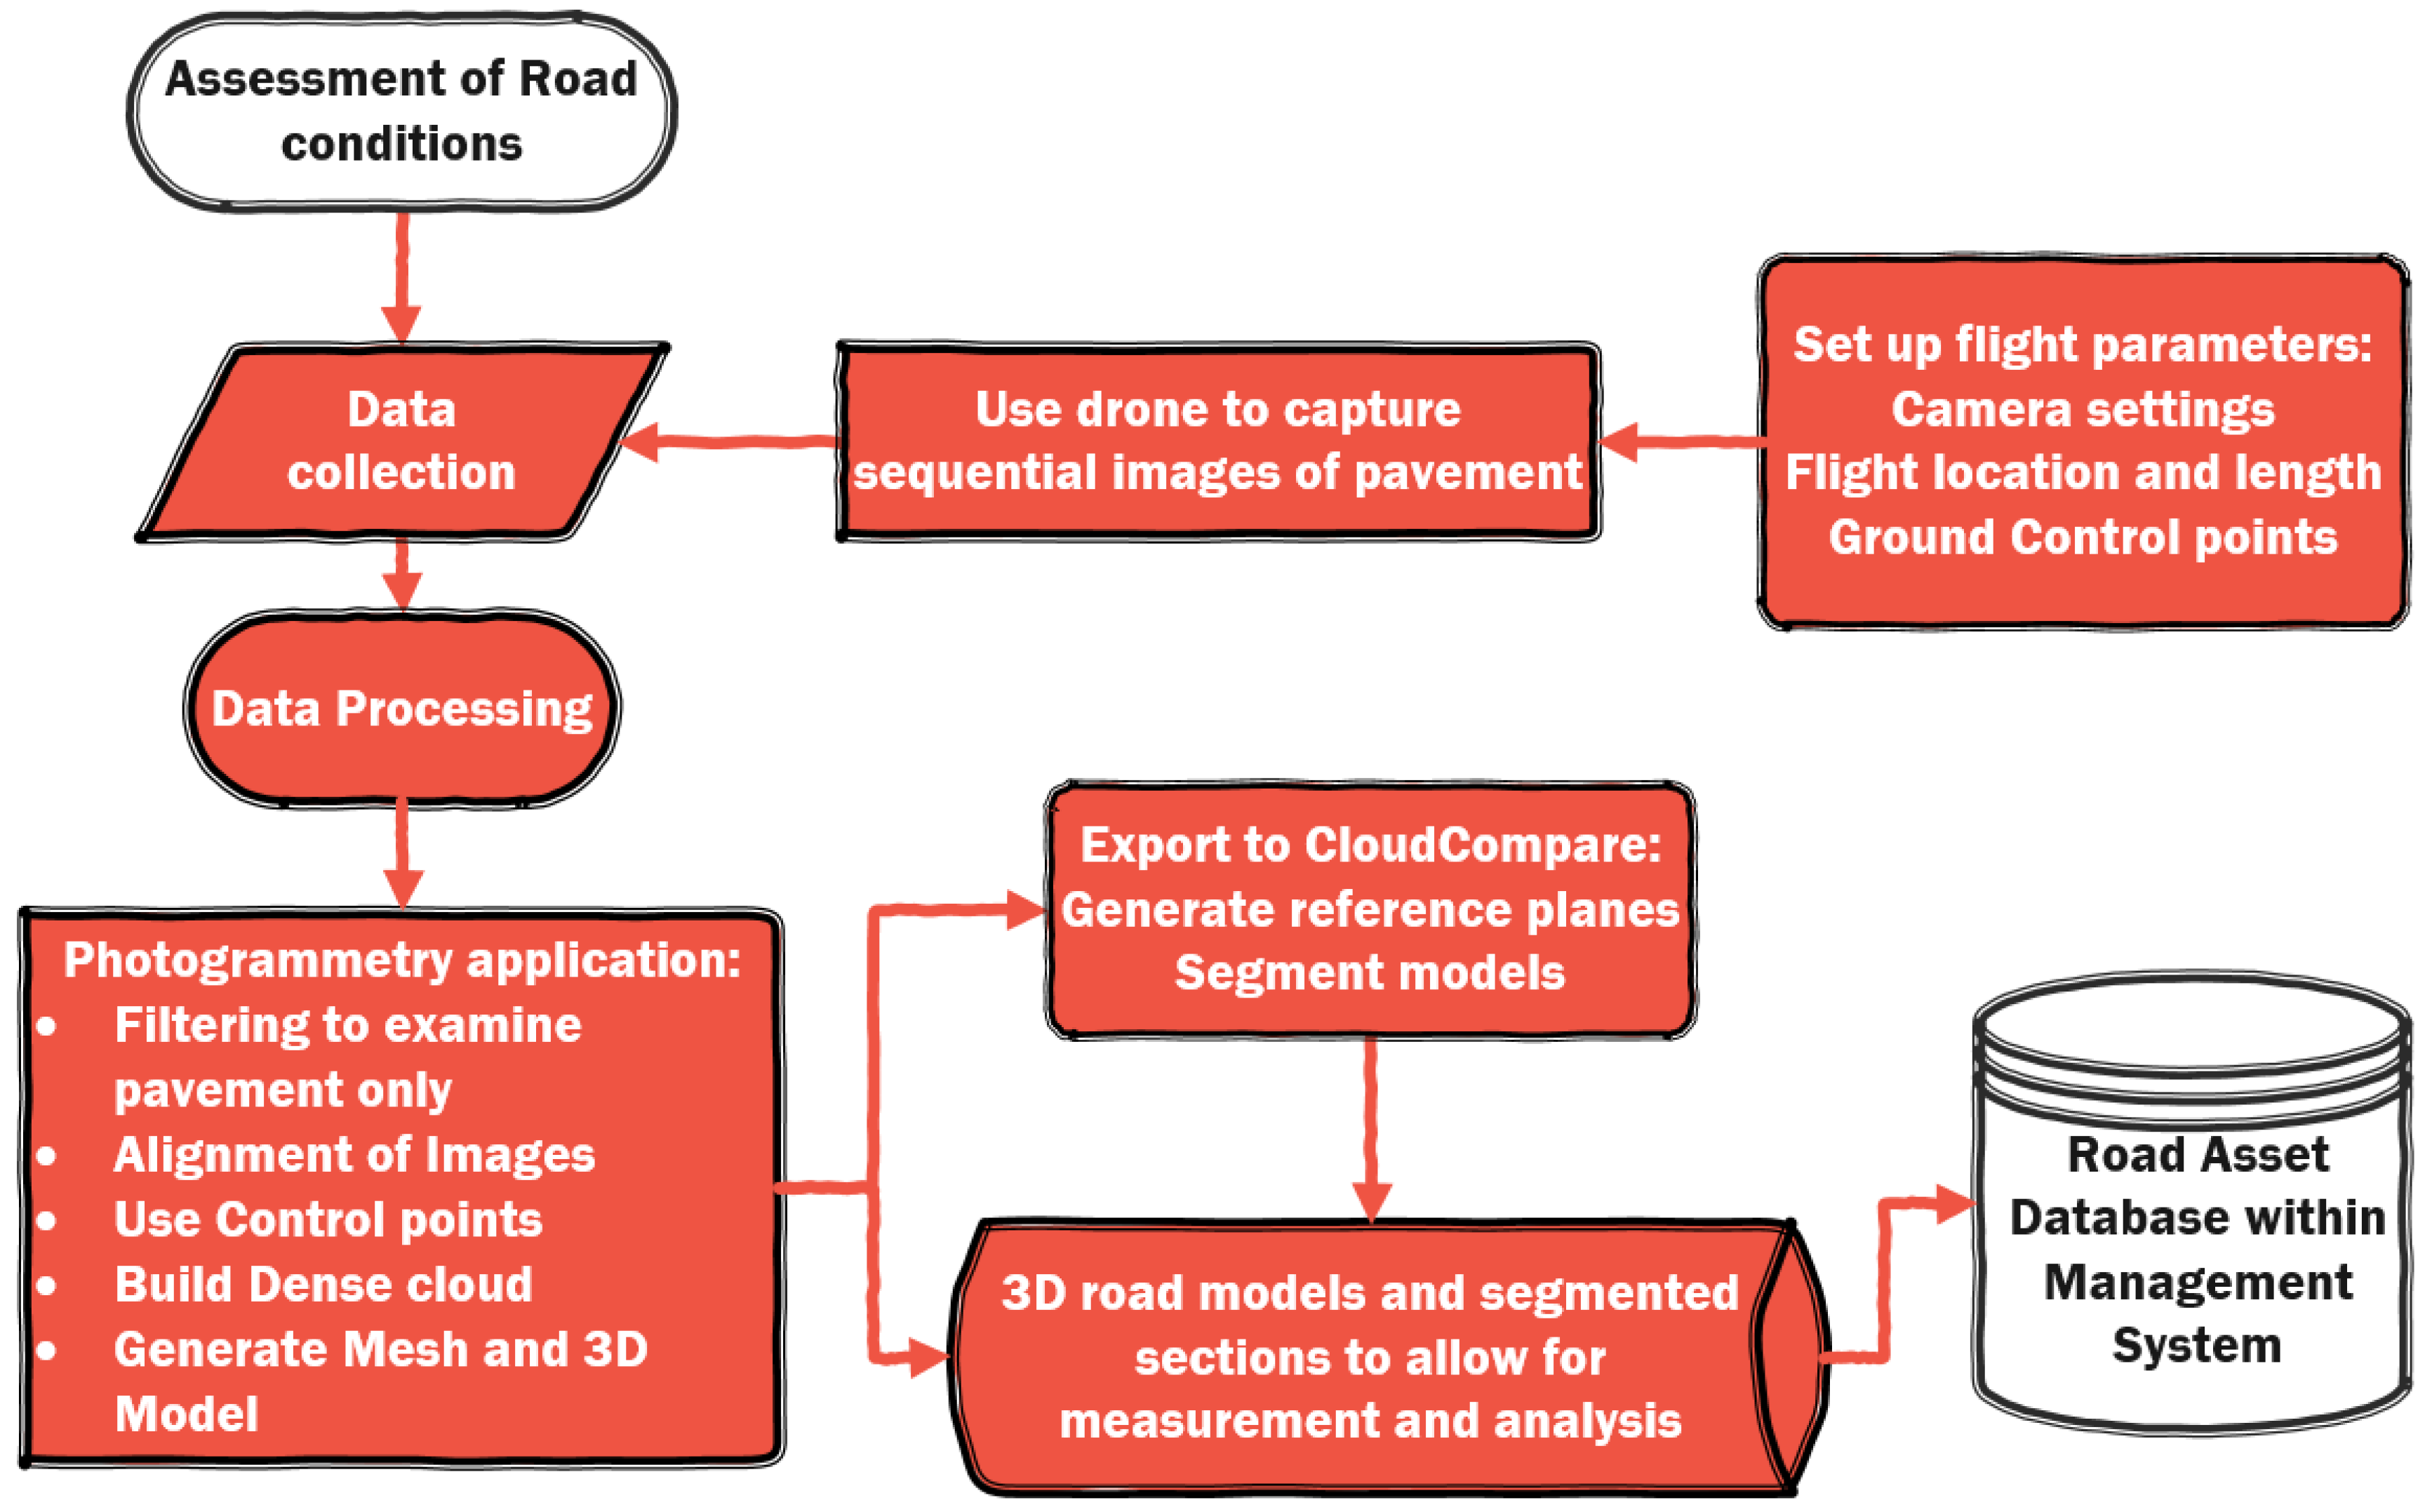
2. Materials and Methods
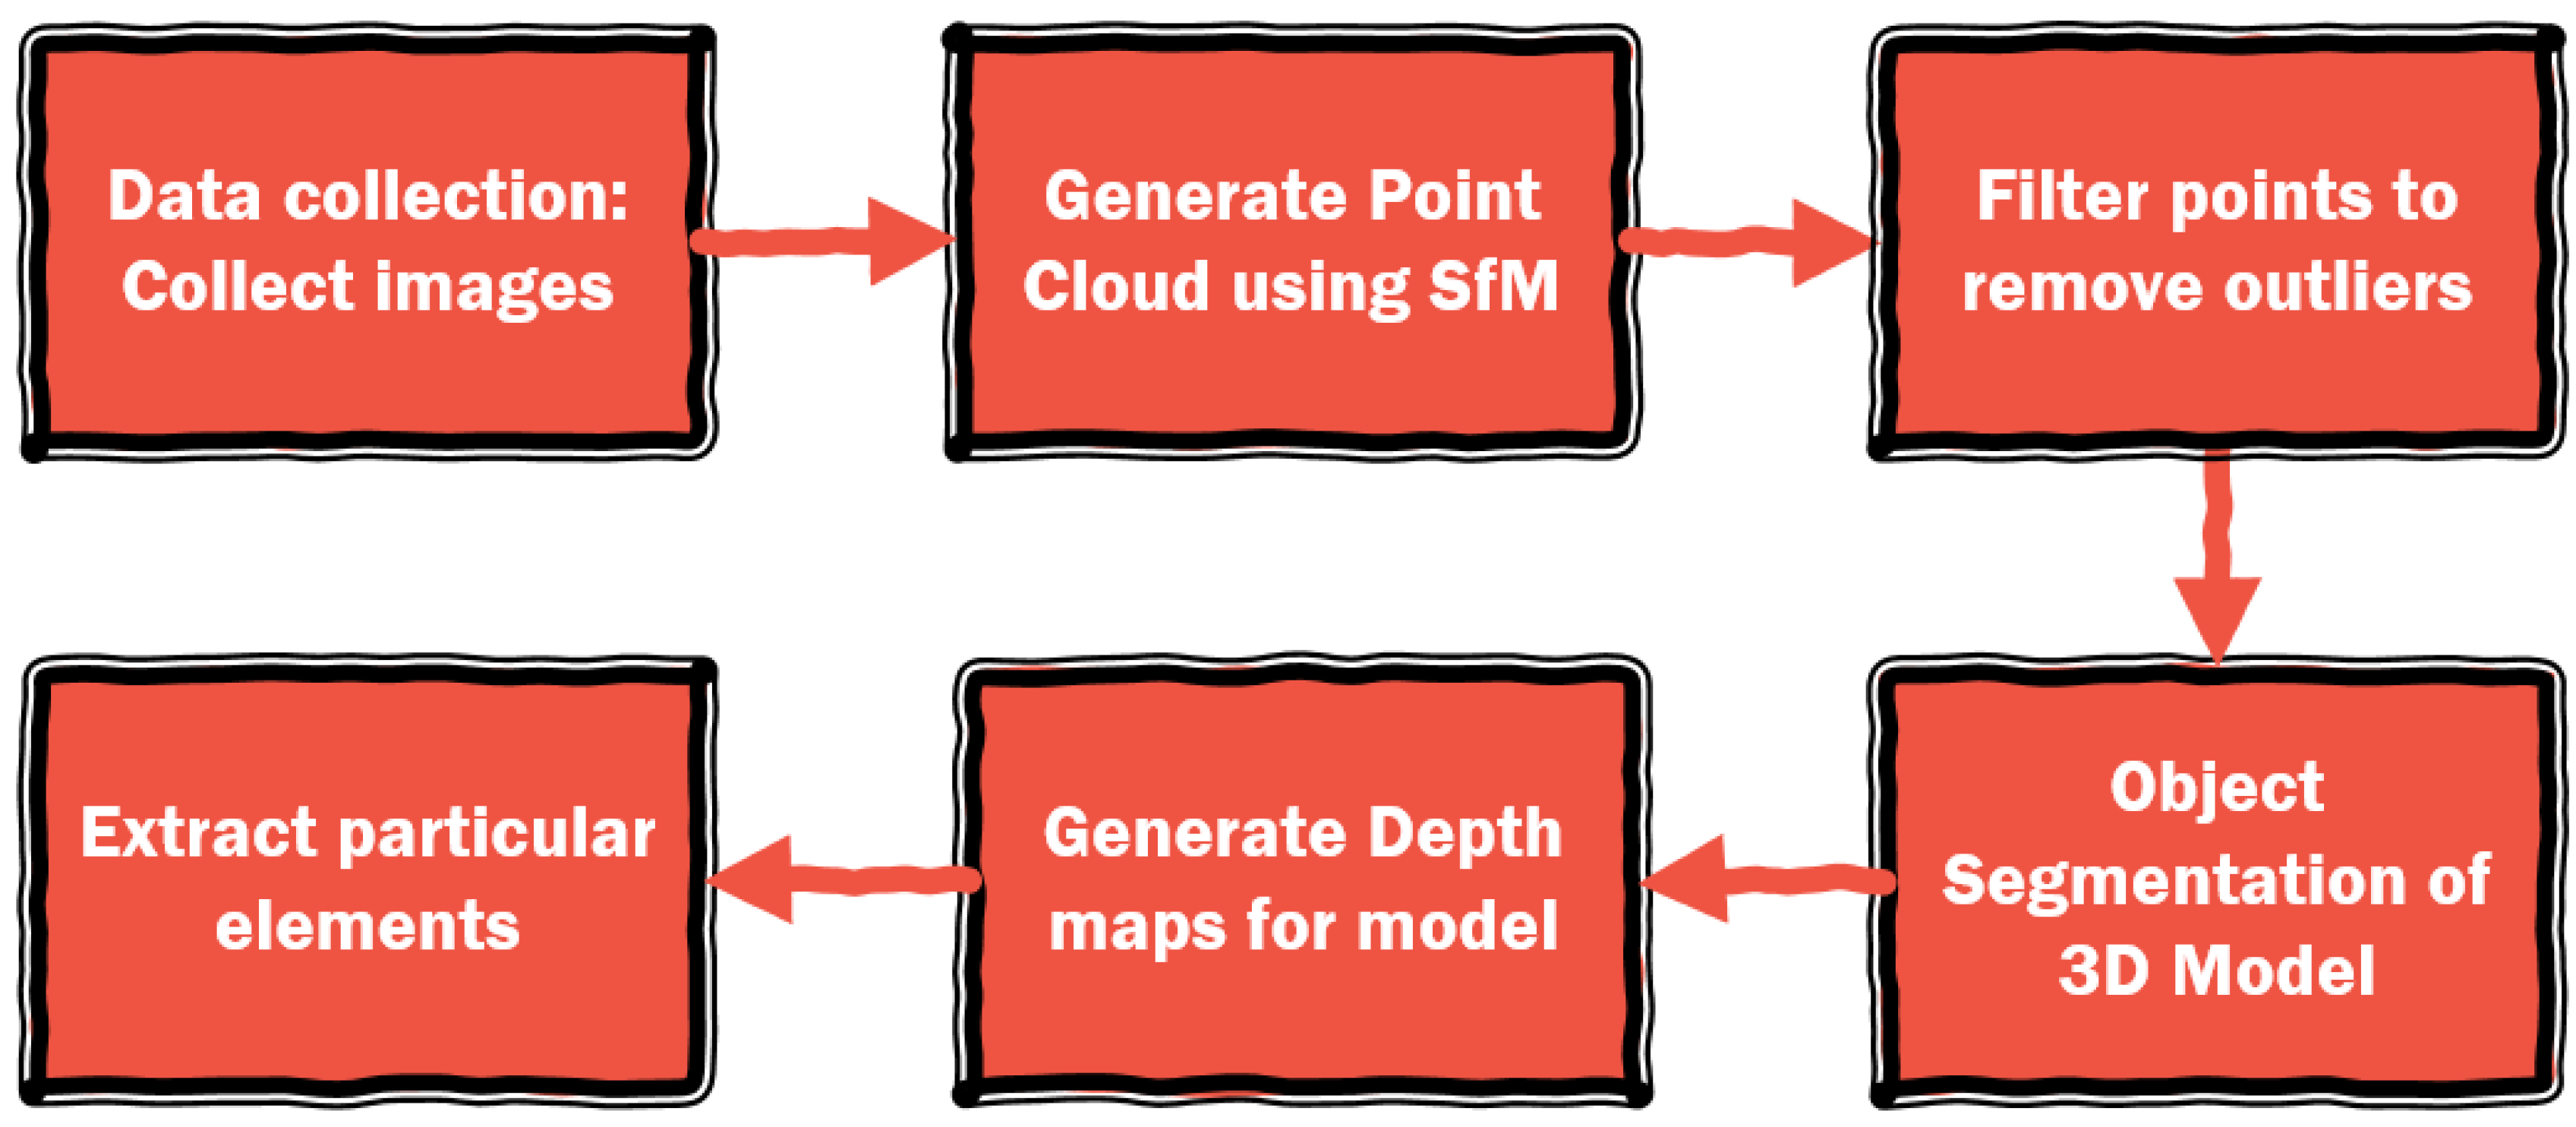
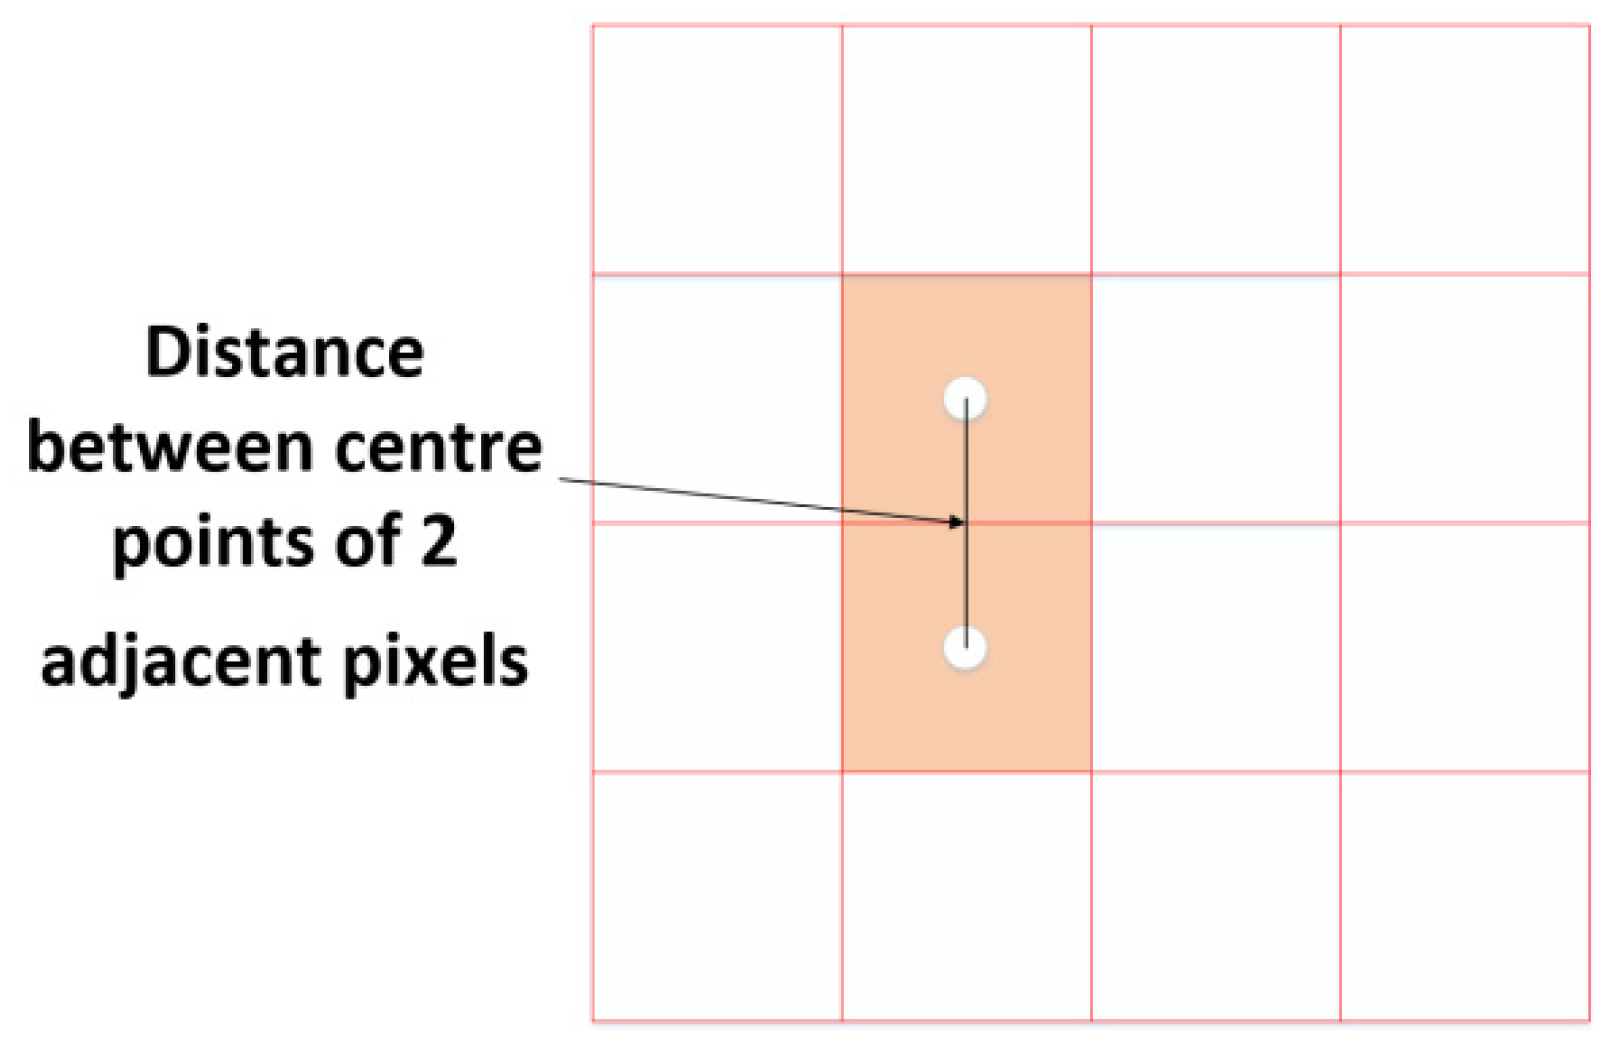
2.1. Structure-From-Motion Technique and Pipeline
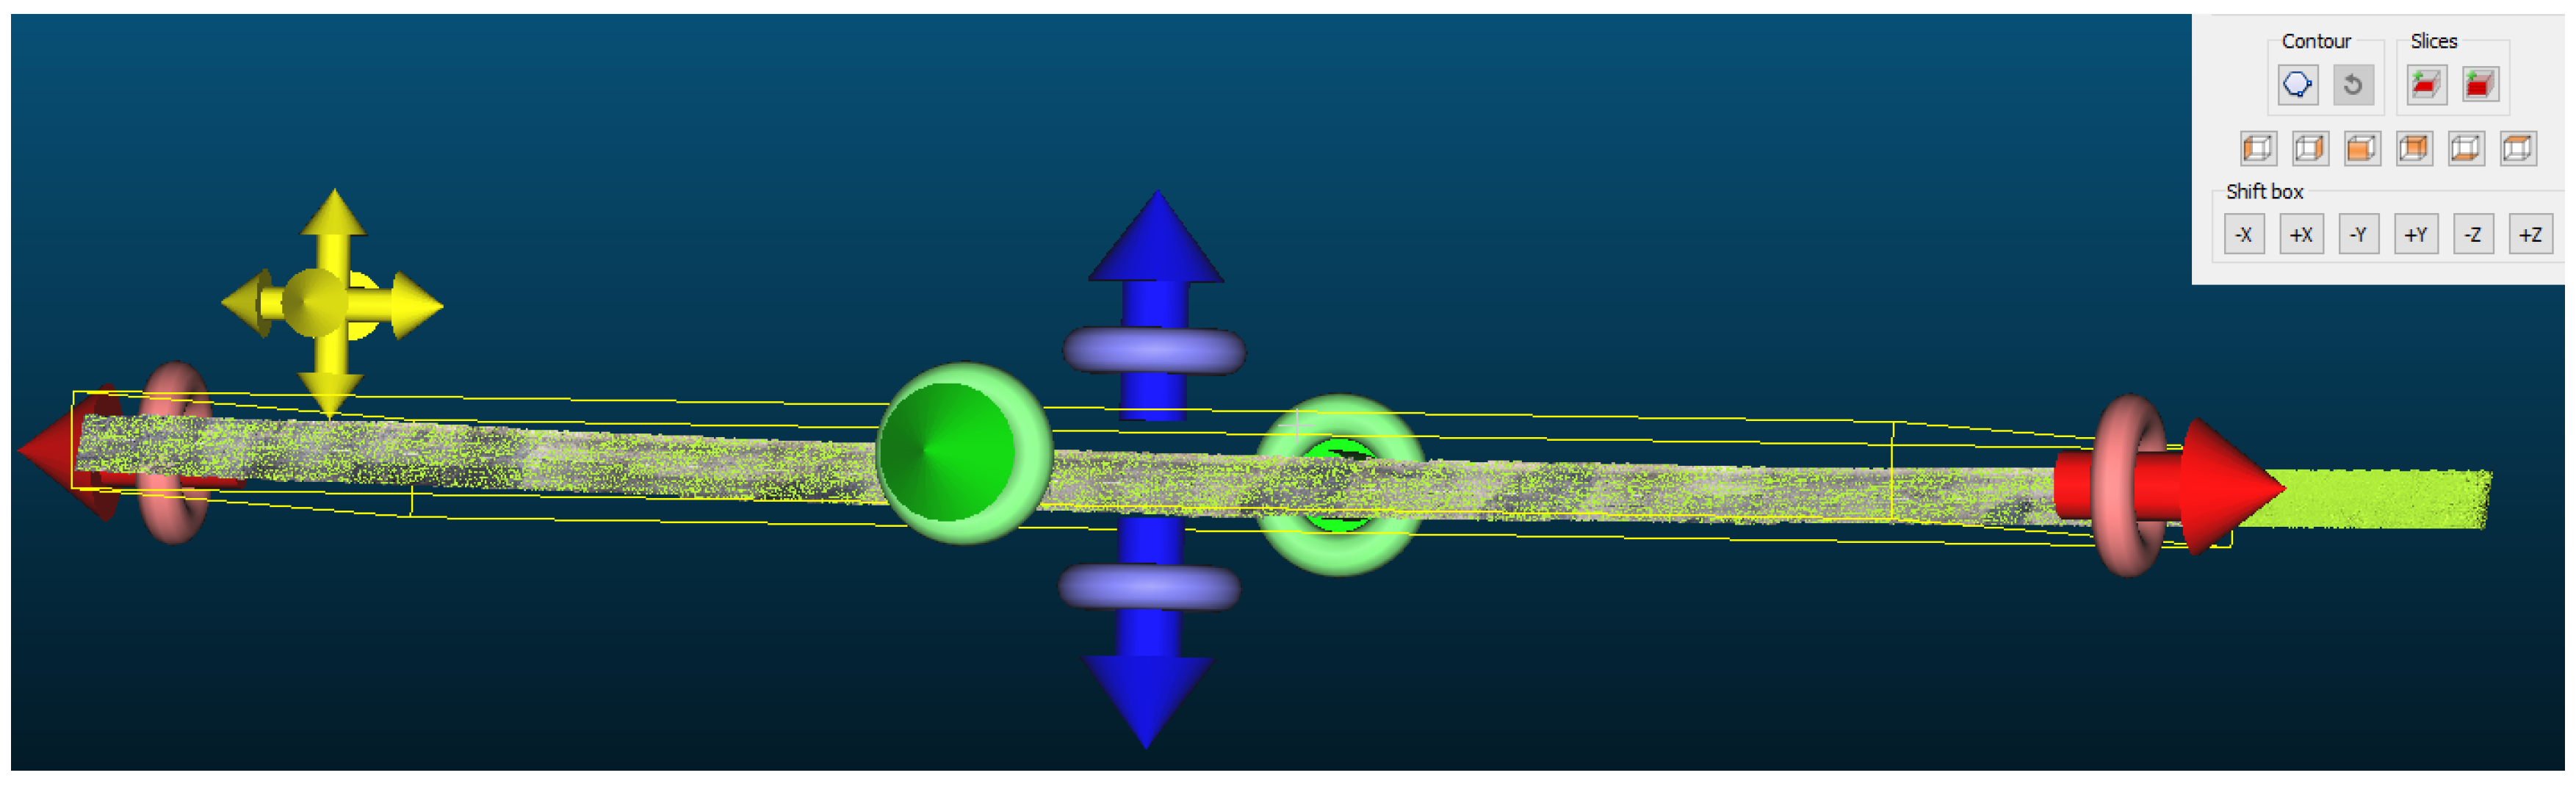
2.2. Application of RANSAC(RANdom SAmple Consensus) Segmentation Algorithm
| Algorithm 1 Extracting Shapes in point Cloud P |
| 1: Ψ ← Ø {extracted shapes} |
| 2: C ← Ø {shape candidates} |
| 3: repeat |
| 4: C ← C ∪ new Candidates () |
| 5: m ← best Candidate (C) |
| 6: if P(|m|, |C|> pt then |
| 7: P ← P\Pm {remove points} |
| 8: Ψ ← Ψ ∪ m |
| 9: C ← C\Cm {remove invalid candidates} |
| 10: end if |
| 11: until P(τ, |C|> pt |
| 12: return Ψ |
2.3. Application of 2.5D Quadric Fit Algorithm
2.4. Assessment of Level of Distress
3. Results and Discussions
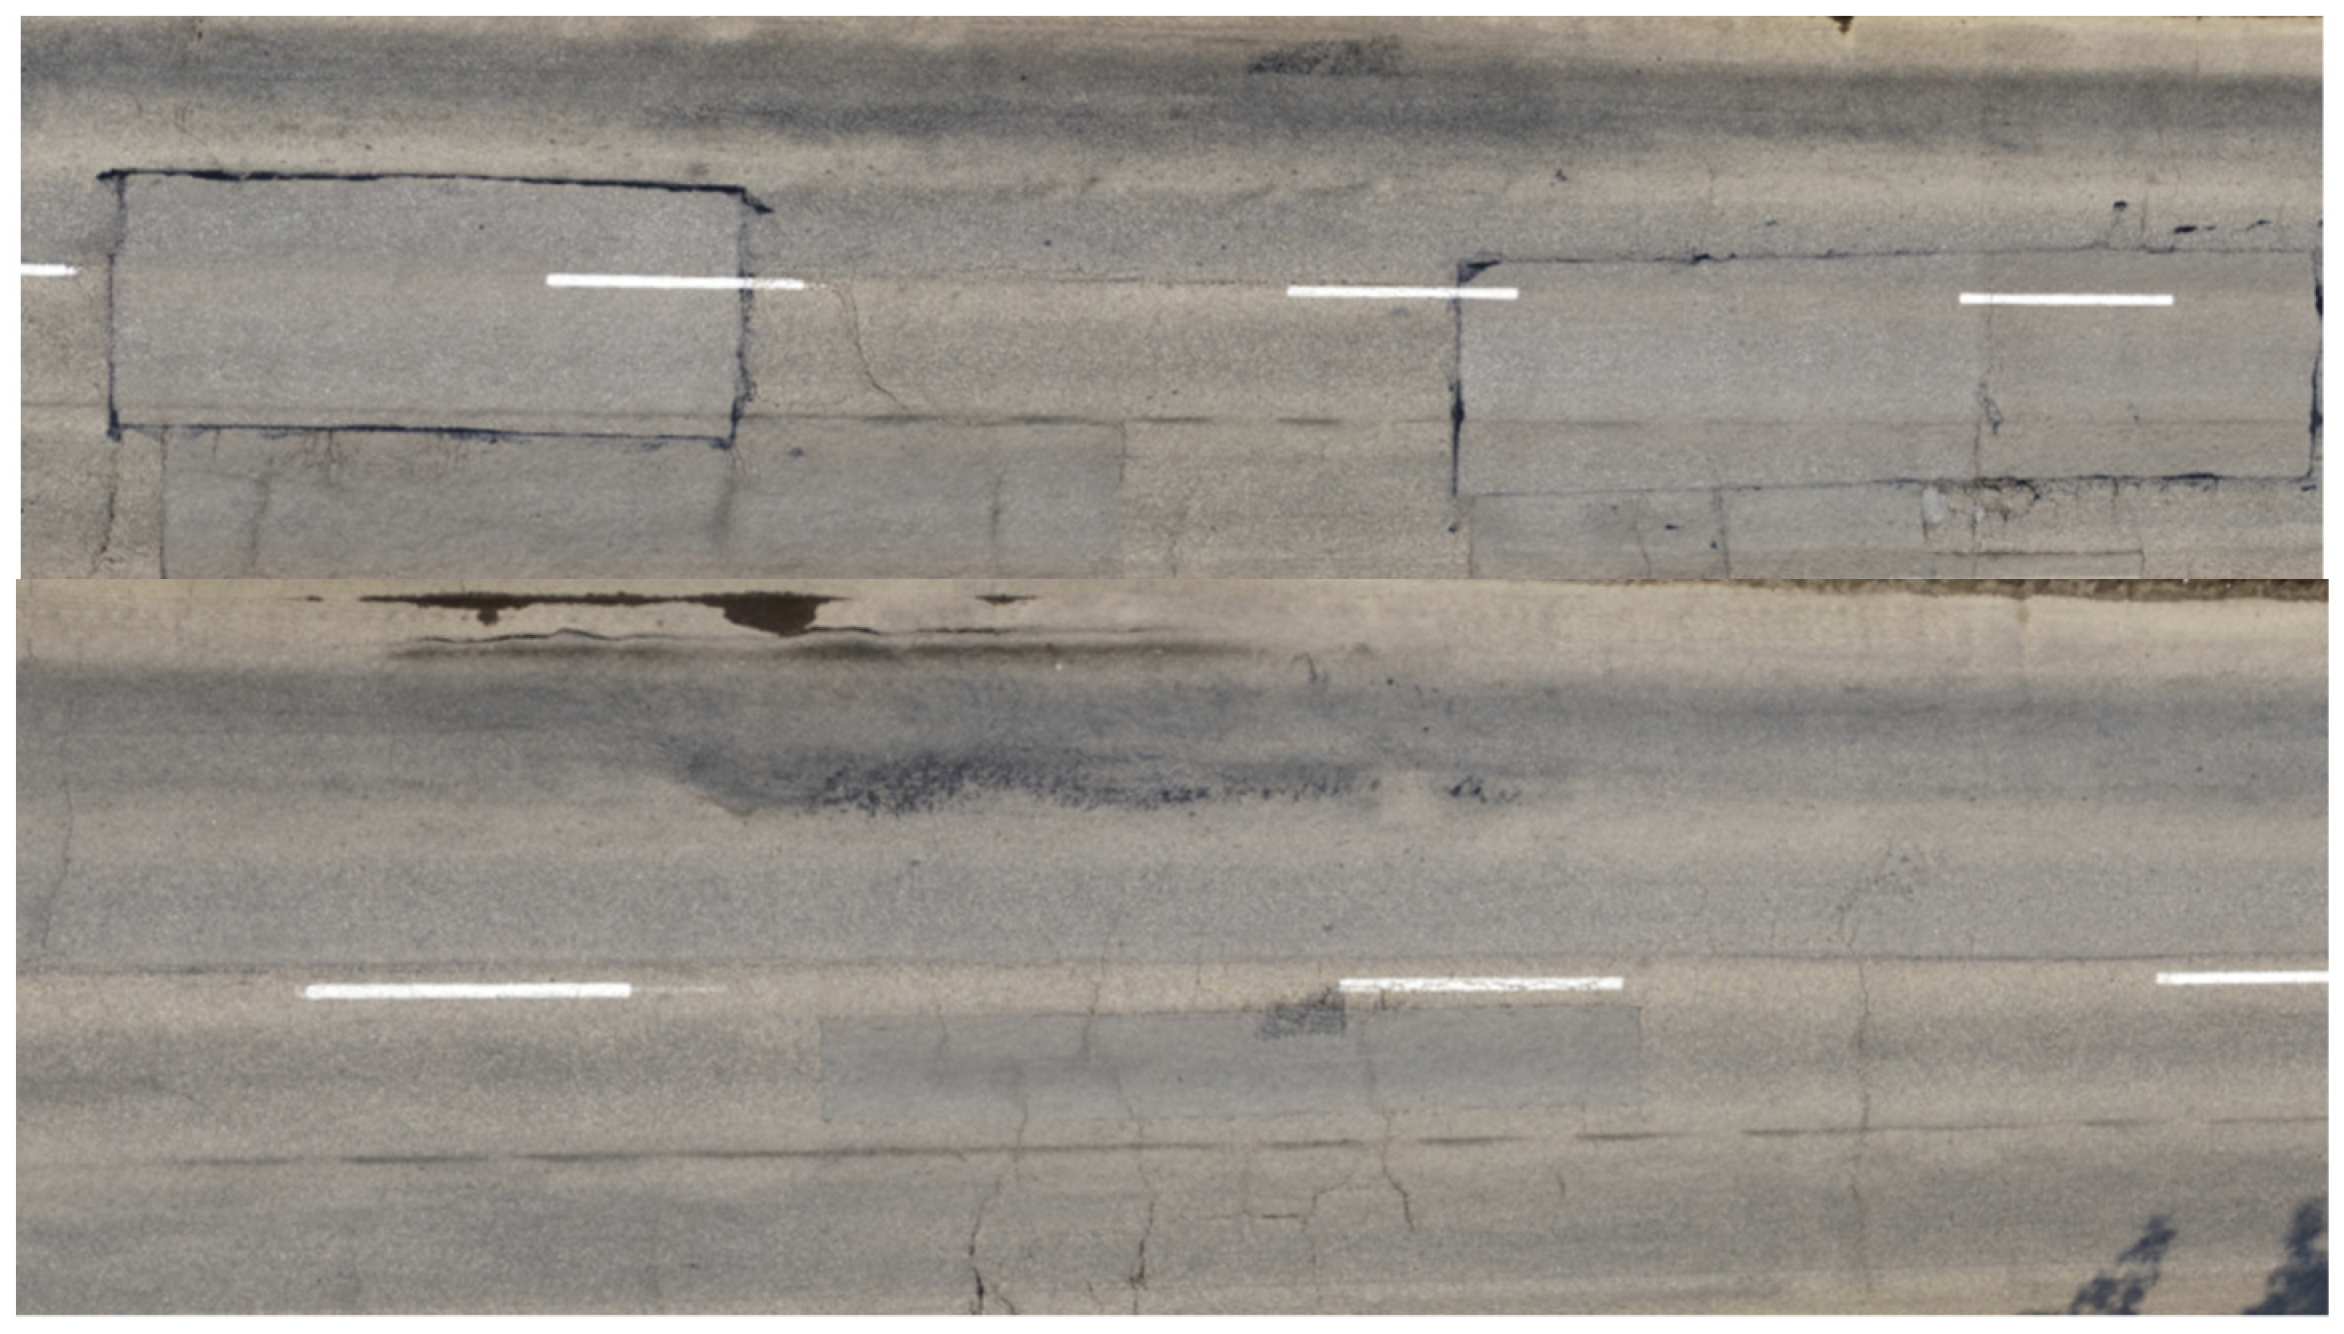
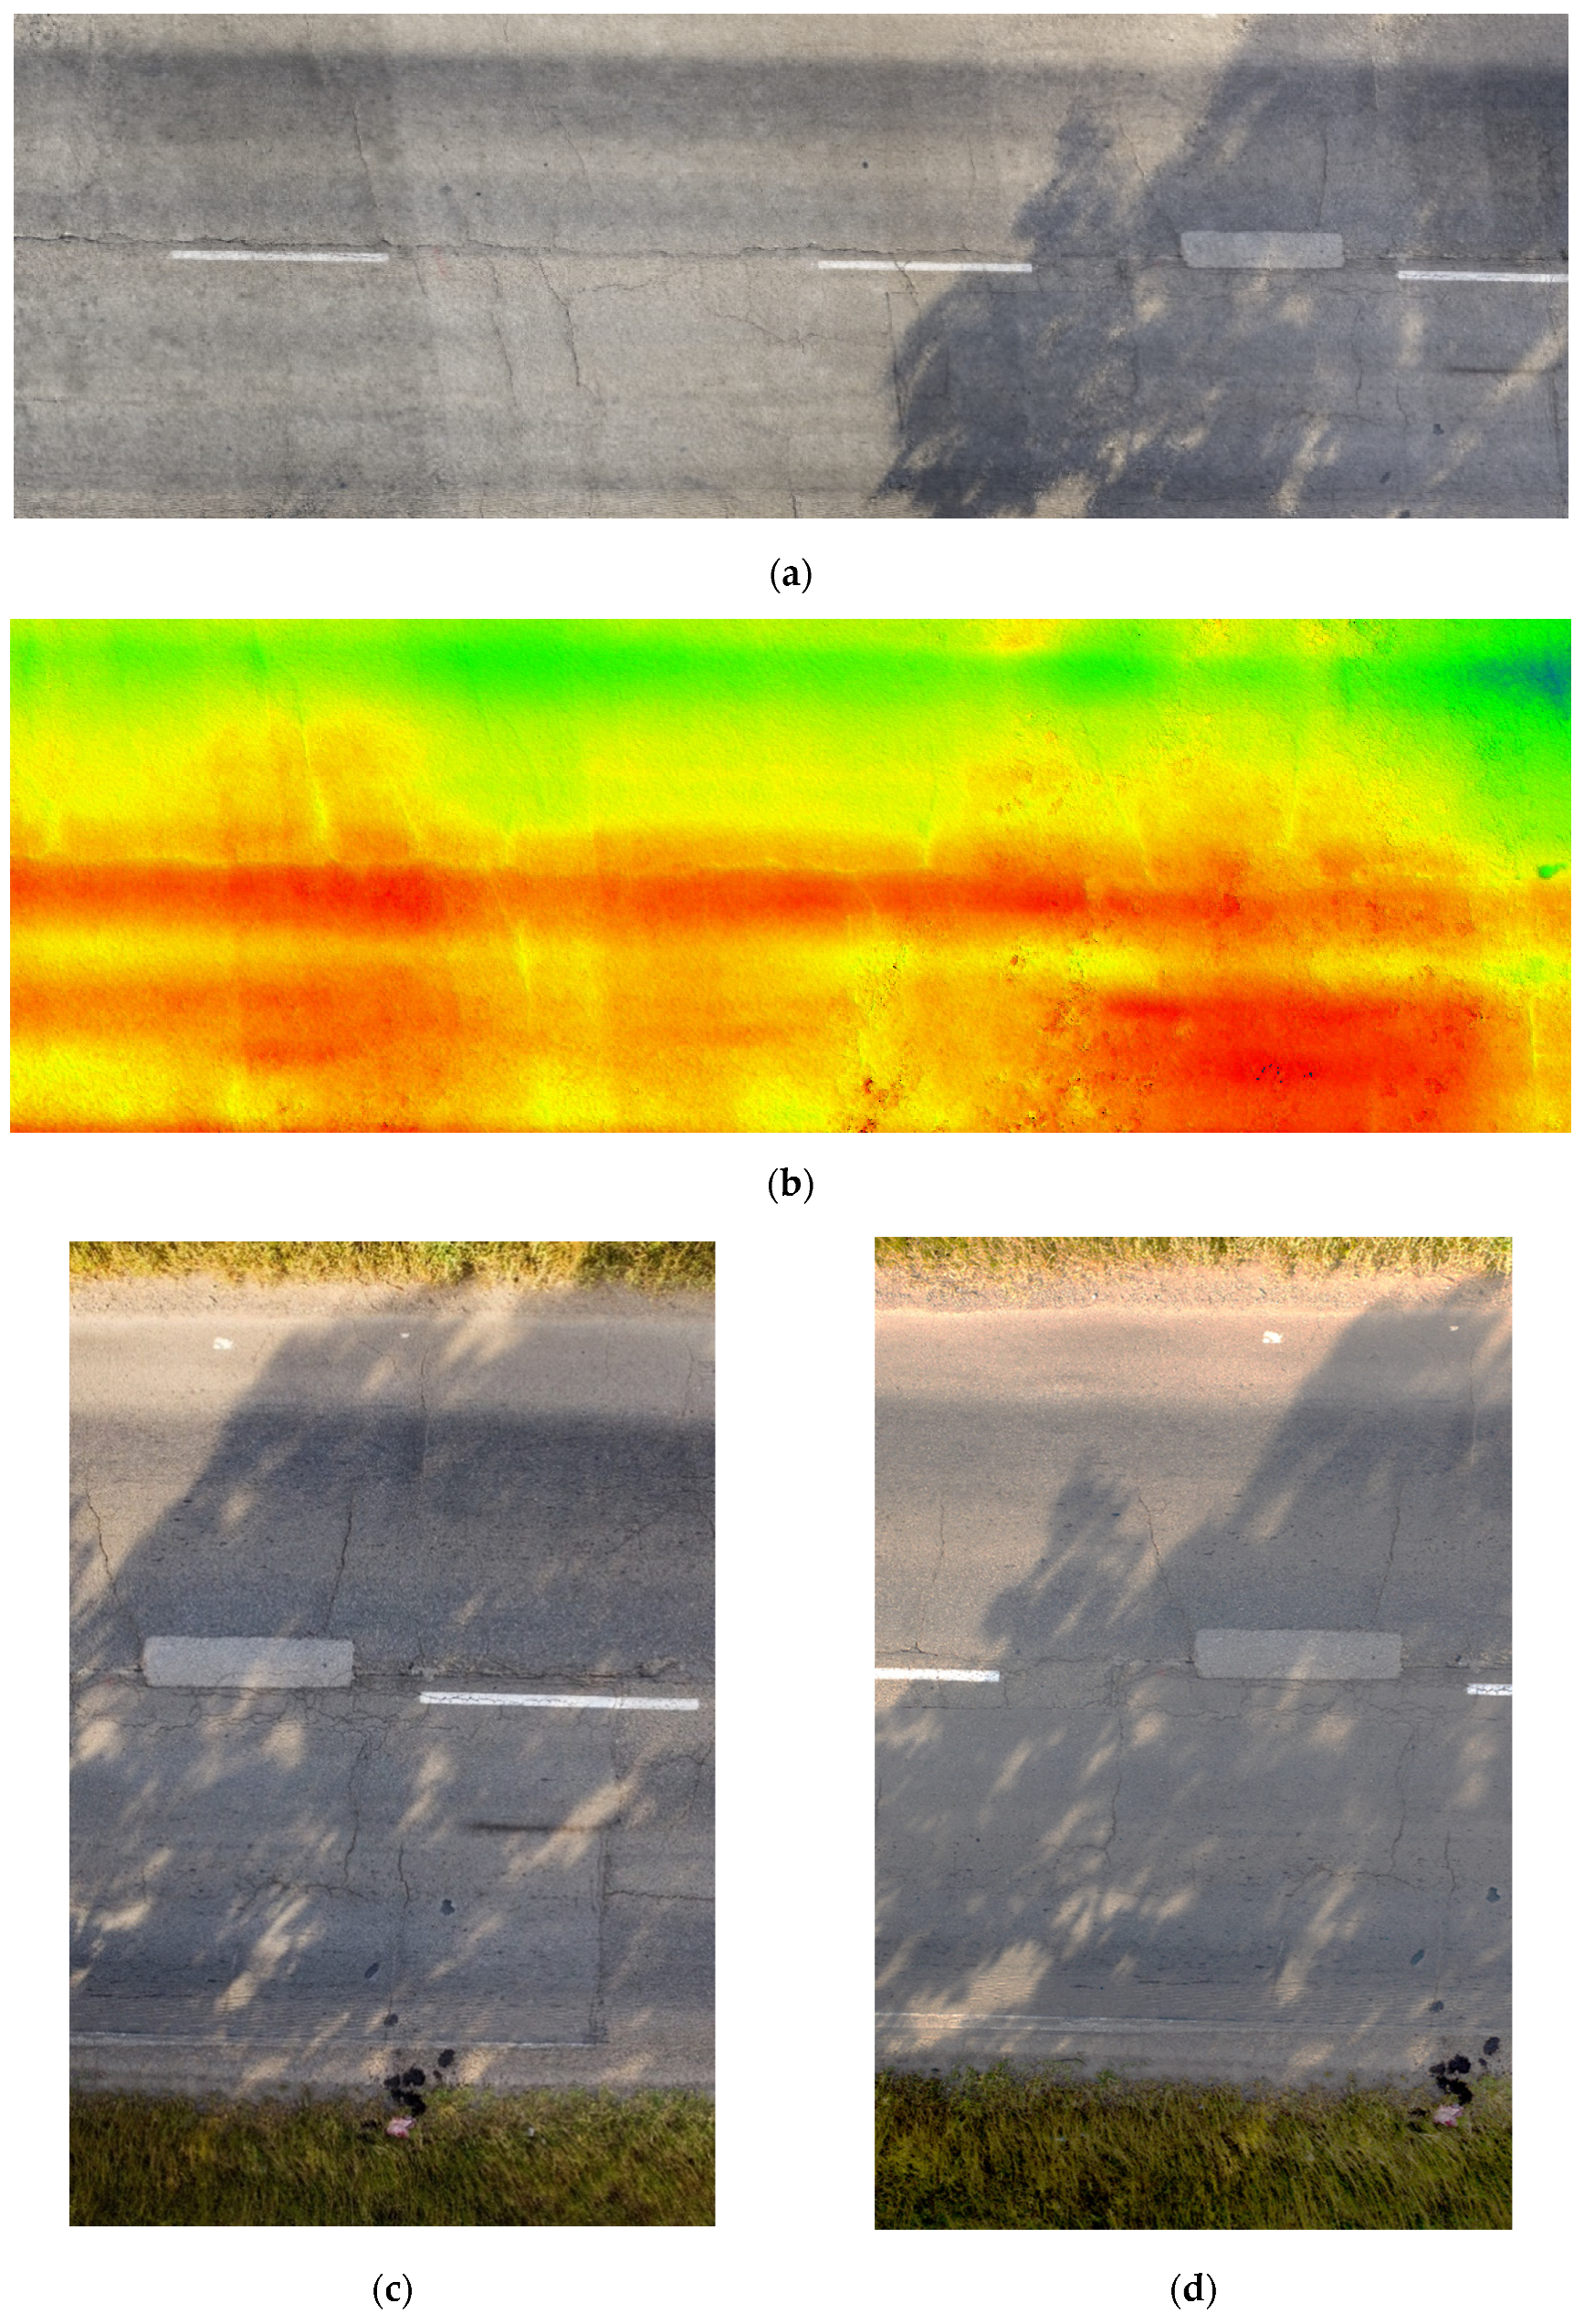
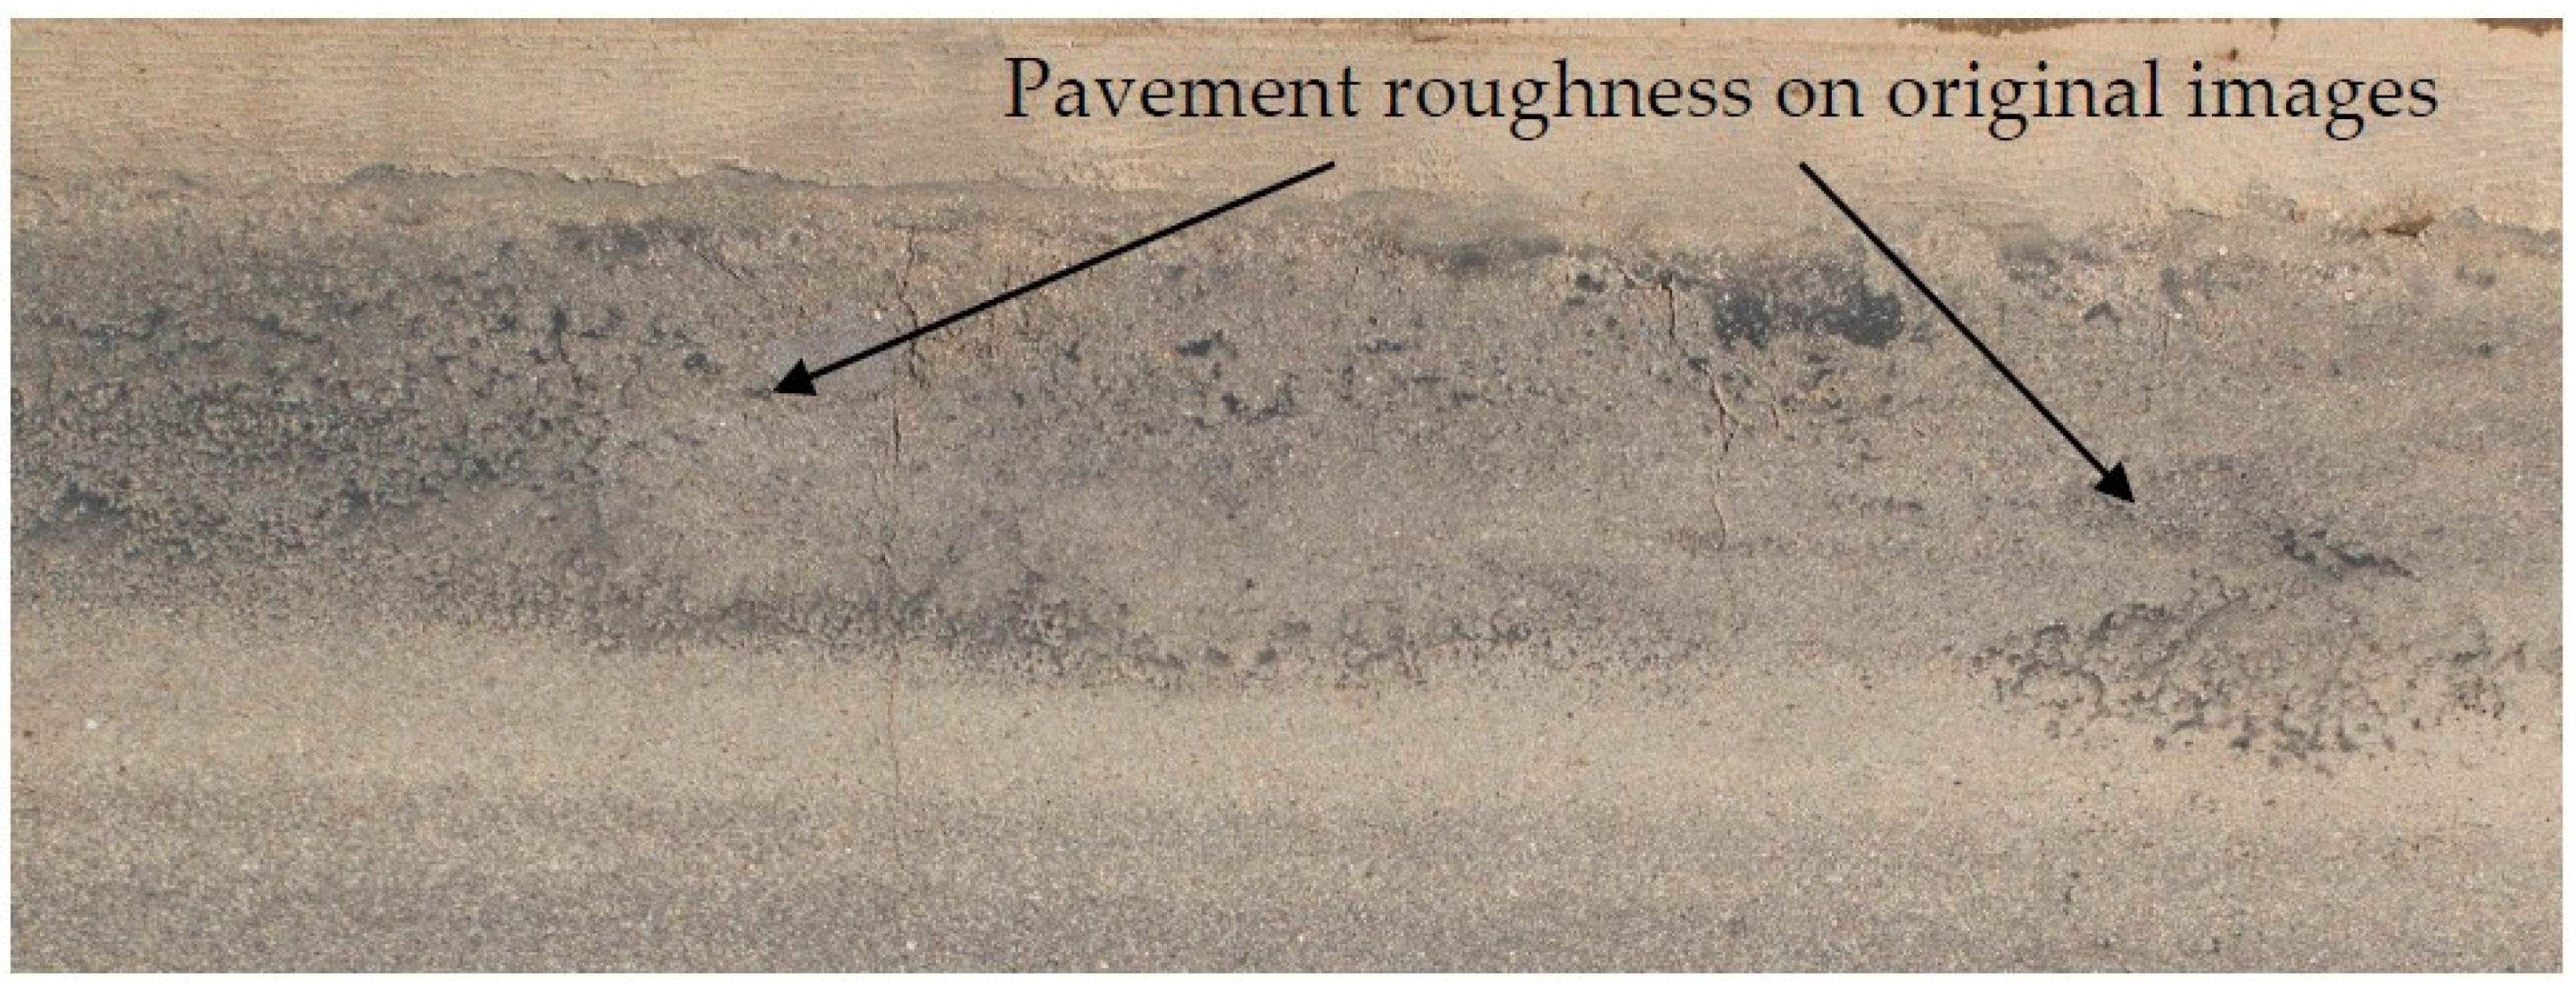
3.1. 3D Pavement Models
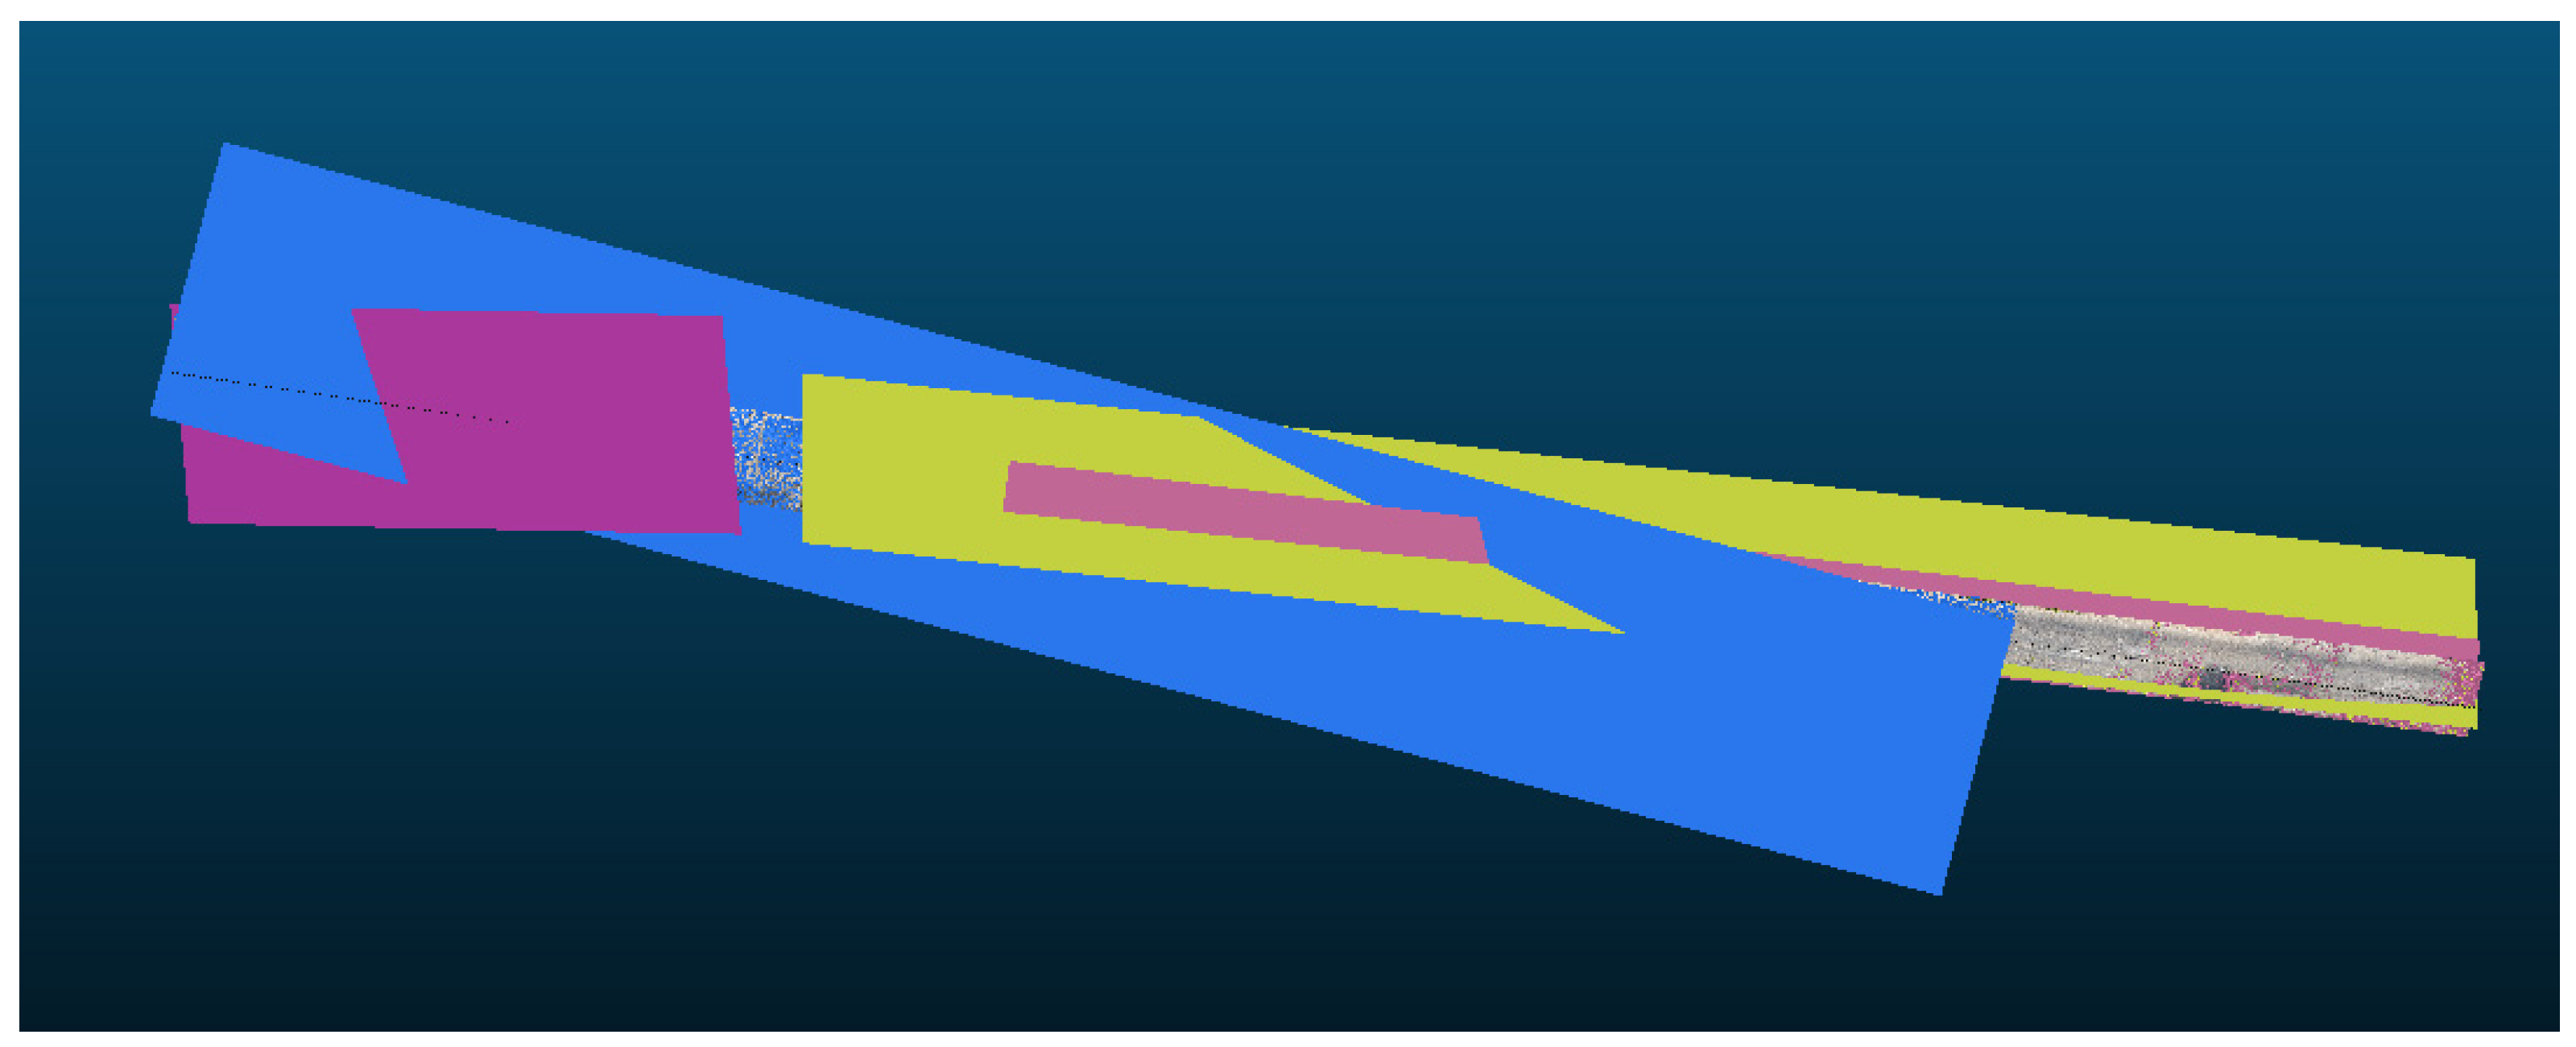
3.2. Application of RANSAC Segmentation
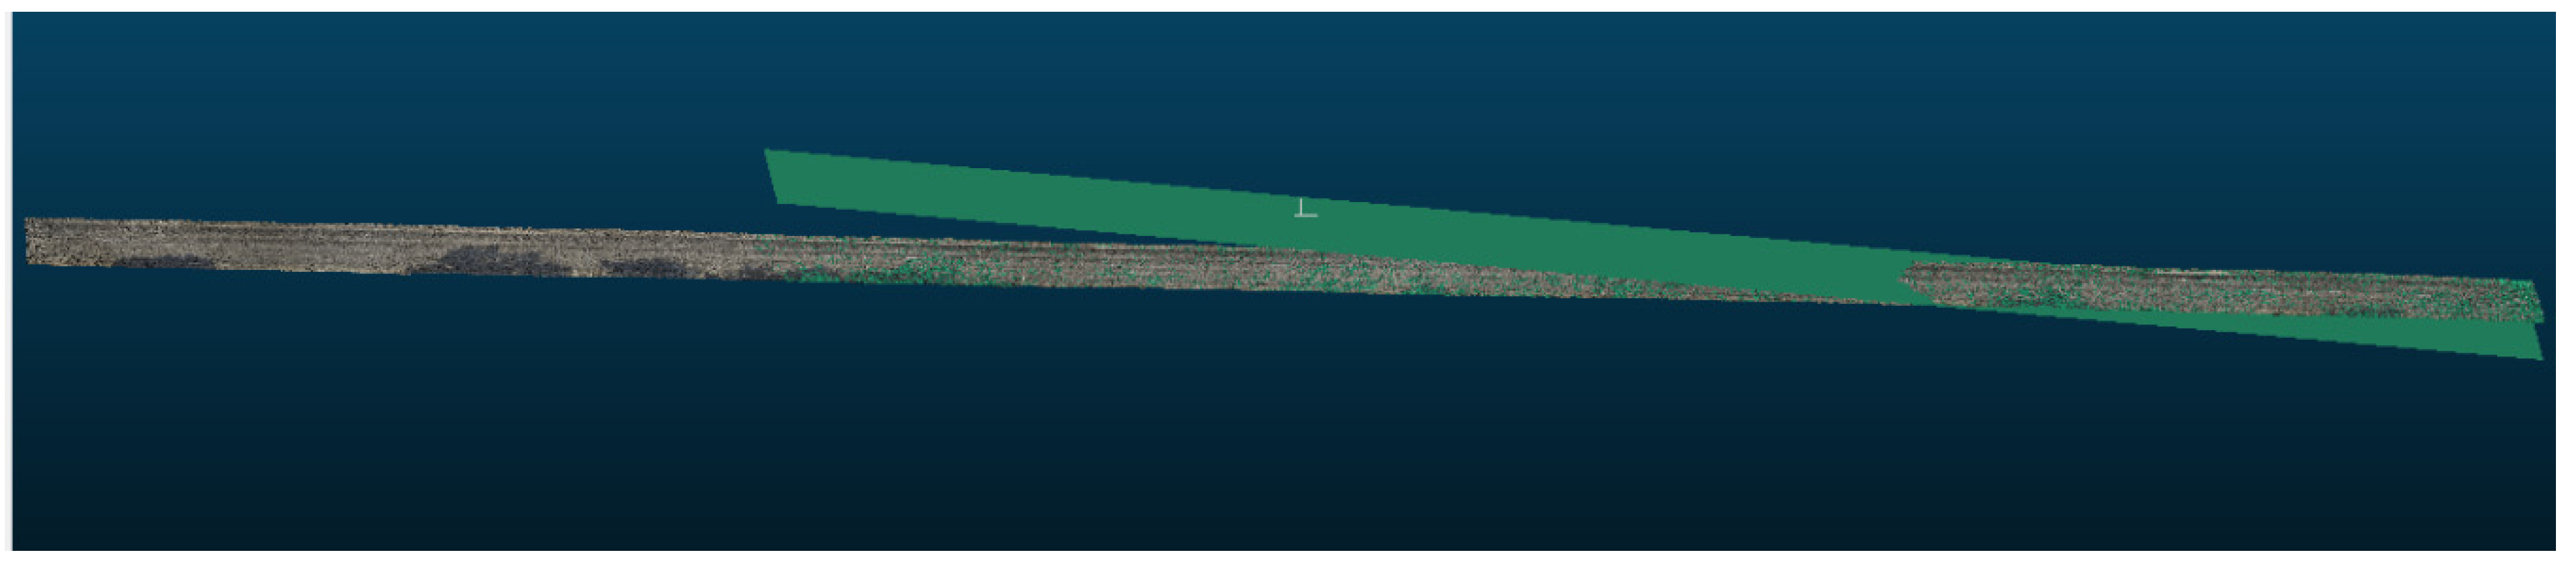
3.3. Application of Quadric Plane and Subsequent Segmentation
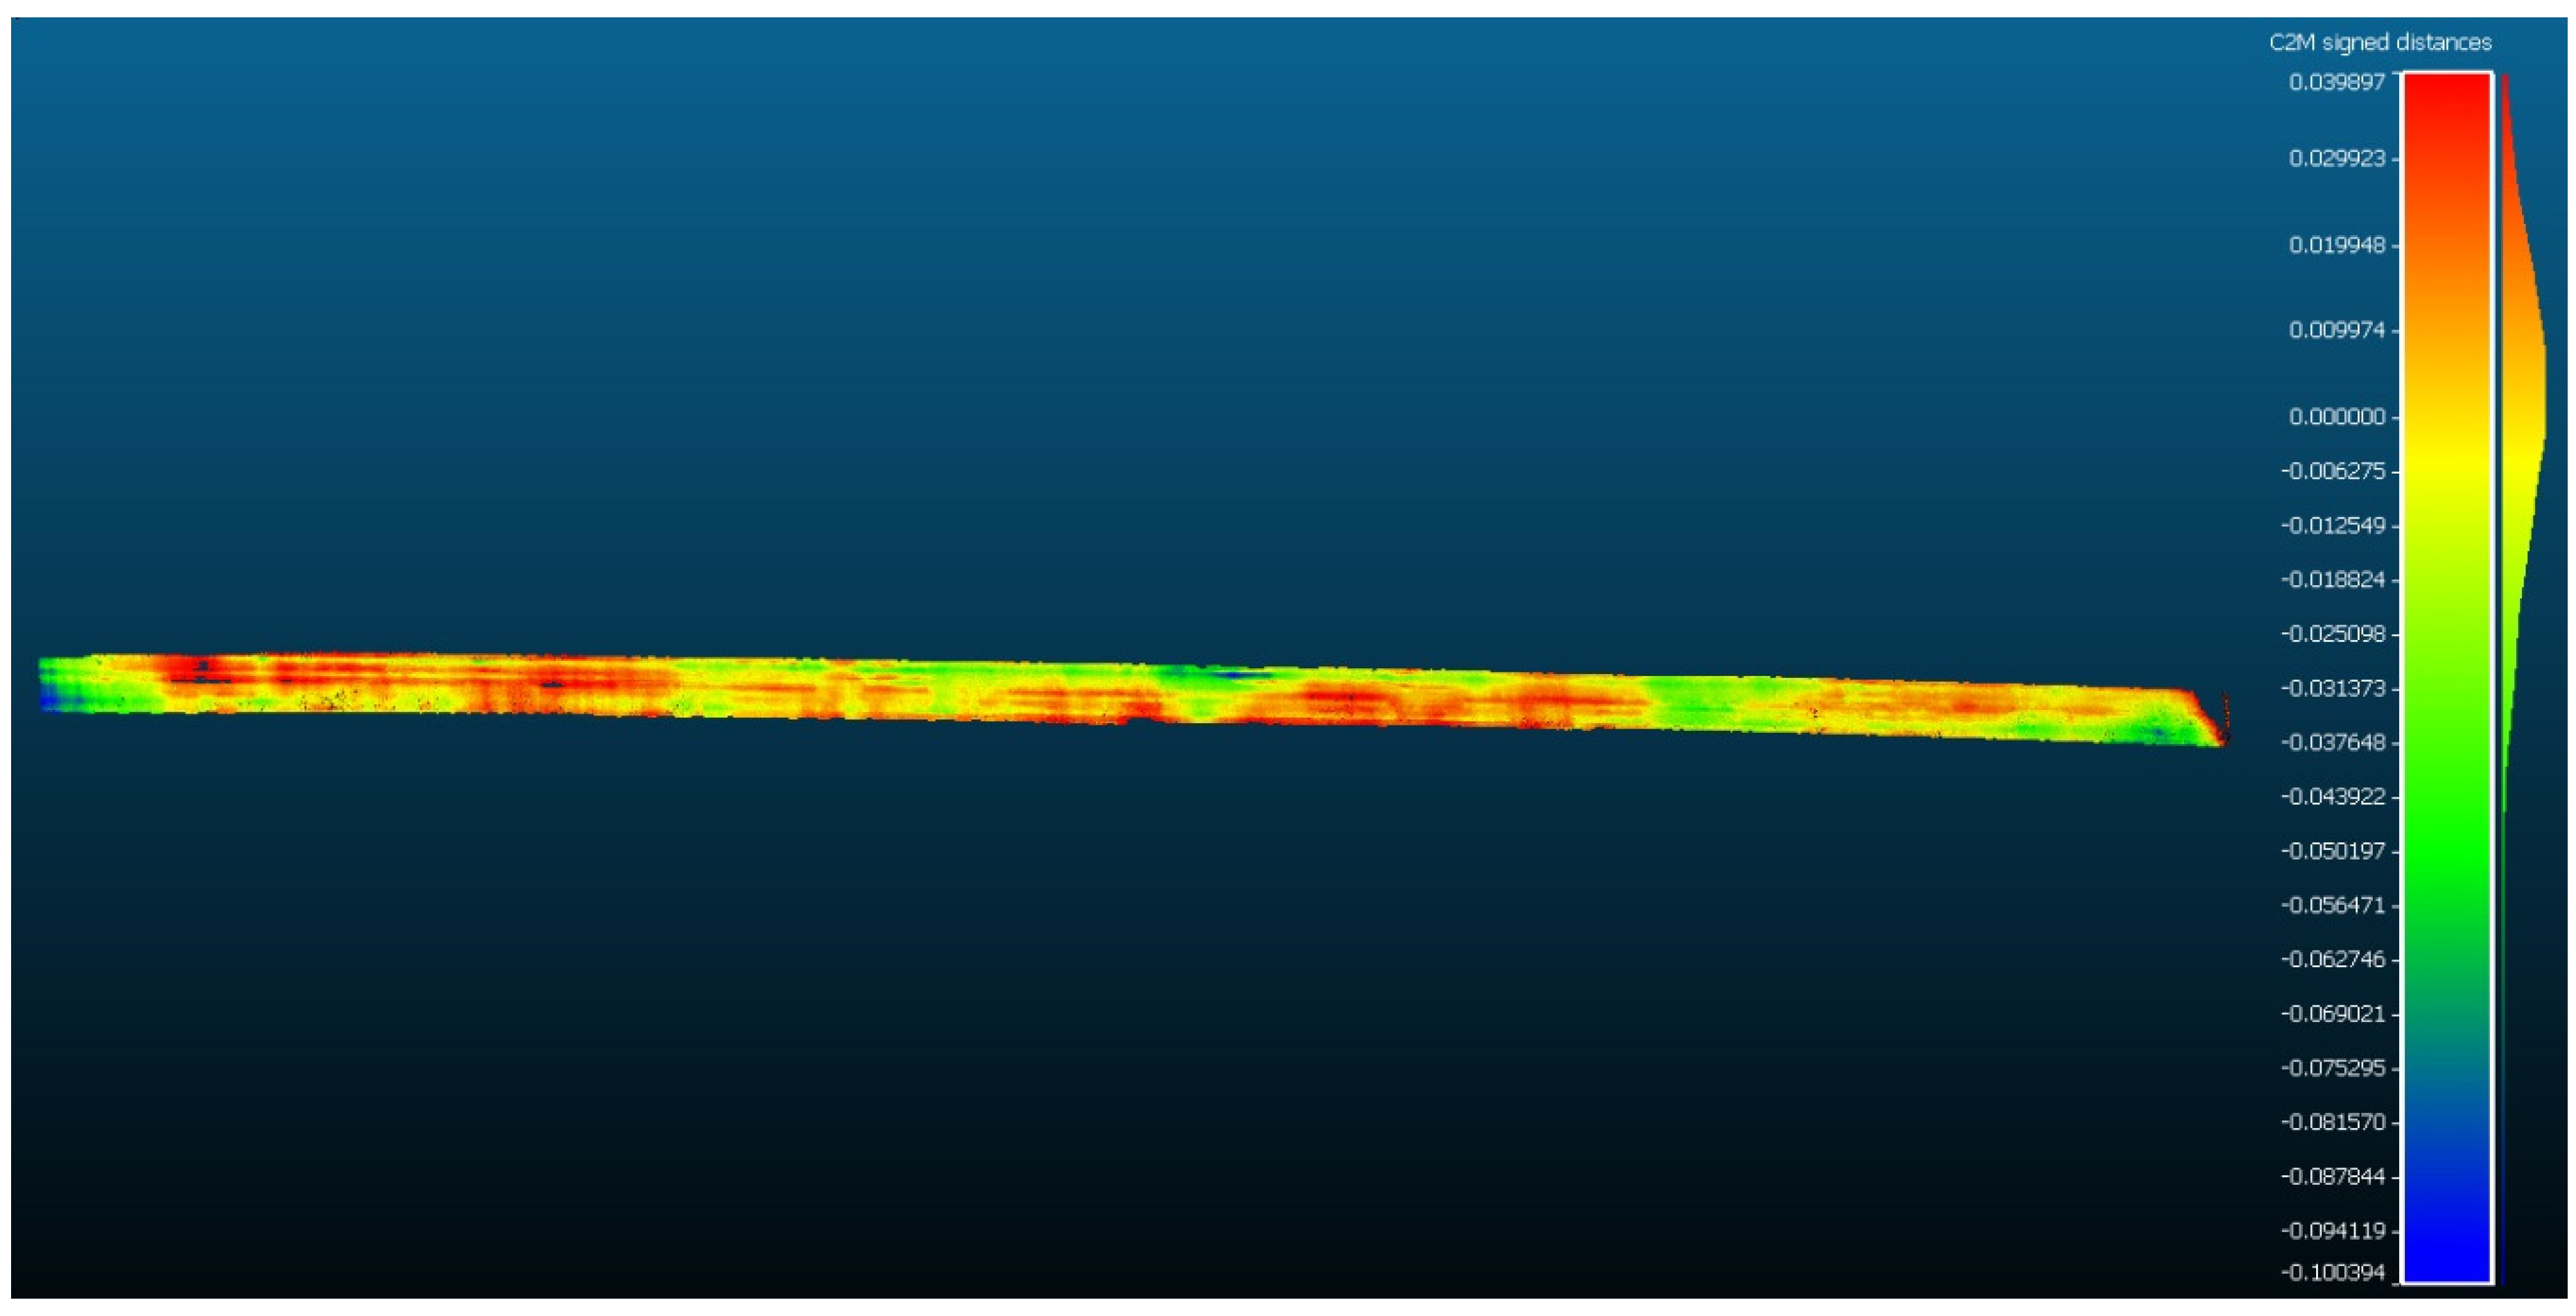
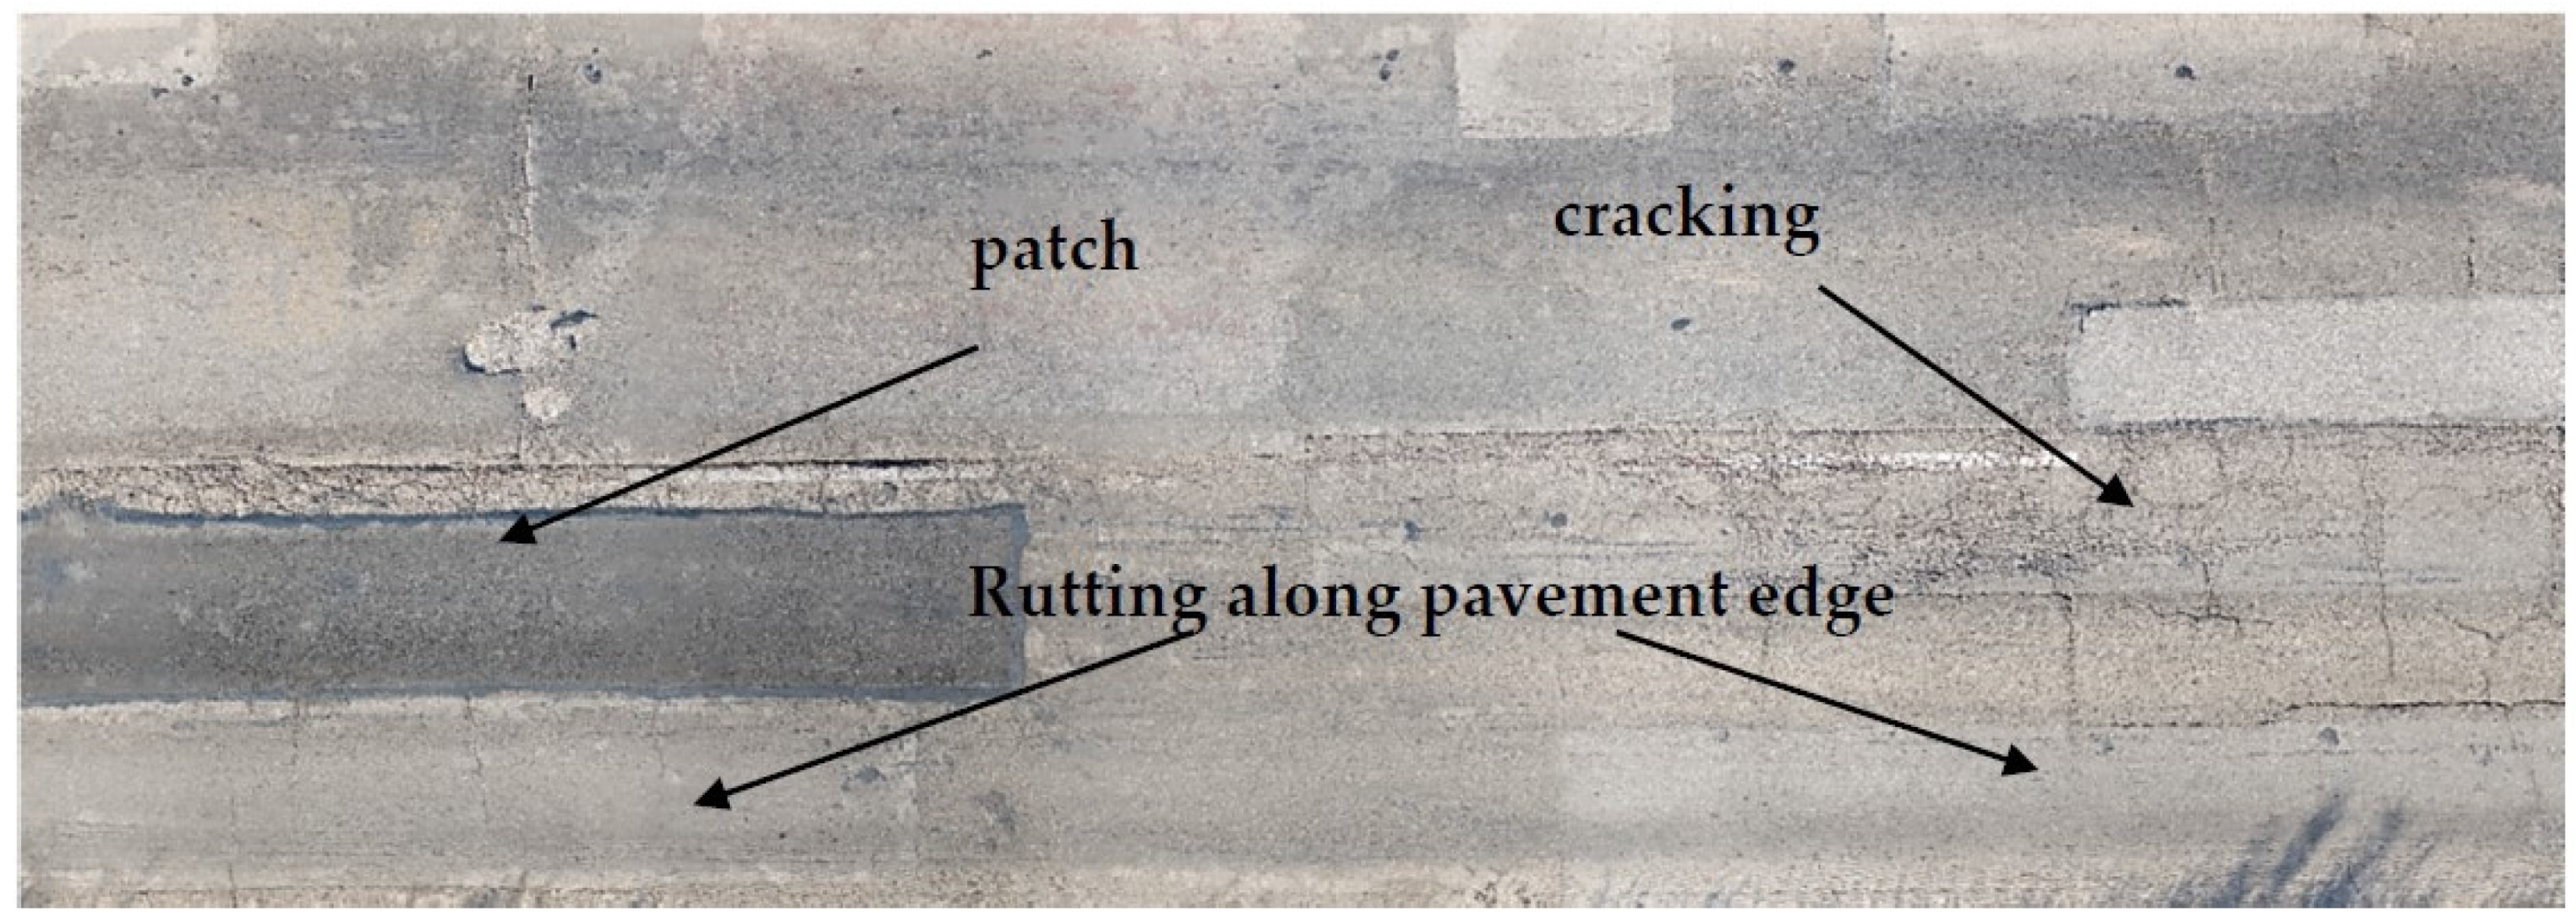
3.4. Analysis of the Level of Distress over Pavement Sections
4. Conclusions
Author Contributions
Funding
Acknowledgments
Conflicts of Interest
References
- Vandam, T.J.; Harvey, J.T.; Muench, S.T.; Smith, K.D.; Snyder, M.B.; Al-Qadi, I.L.; Ozer, H.; Meijer, J.; Ram, P.V.; Roesier, J.R.; et al. Towards Sustainable Pavement Systems: A Reference Document FHWA-HIF-15-002; Federal Highway Administration: Washington, DC, USA, 2015.
- International Road Federation (IRF). IRF World Road Statistics 2018 (Data 2011–2016); International Road Federation (IRF): Brussels, Belgium, 2018. [Google Scholar]
- Peterson, D. National Cooperative Highway Research Program Synthesis of Highway Practice Pavement Management Practices. No. 135; Transportation Research Board: Washington, DC, USA, 1987; ISBN 0309044197. [Google Scholar]
- Waidelich, W. Guidance on Highway Preservation and Maintenance-Memorandum; U.S. Department of Transportation-Federal Highway Administration: Washington, DC, USA, 2016.
- Mith, K.L.; Peshkin, D.; Wolters, A.; Krstulovich, J.; Moulthrop, J.; Alvarado, C. Guidelines for the Preservation of High-Traffic-Volume Roadways; National Academies of Sciences, Engineering, and Medicine: Washington, DC, USA, 2011; ISBN 9780309128926. [Google Scholar] [CrossRef][Green Version]
- Rouse, P.; Chiu, T. Towards optimal life cycle management in a road maintenance setting using DEA. Eur. J. Oper. Res. 2009, 196, 672–681. [Google Scholar] [CrossRef]
- Schnebele, E.; Tanyu, B.F.; Cervone, G.; Waters, N. Review of remote sensing methodologies for pavement management and assessment. Eur. Transp. Res. Rev. 2015, 7. [Google Scholar] [CrossRef]
- Radopoulou, S.C.; Brilakis, I. Improving Road Asset Condition Monitoring. Transp. Res. Procedia 2016, 14, 3004–3012. [Google Scholar] [CrossRef]
- Coenen, T.B.J.; Golroo, A. A review on automated pavement distress detection methods. Cogent Eng. 2017, 4. [Google Scholar] [CrossRef]
- Ragnoli, A.; De Blasiis, M.; Di Benedetto, A. Pavement Distress Detection Methods: A Review. Infrastructures 2018, 3, 58. [Google Scholar] [CrossRef]
- Pierce, L.M.; McGovern, G.; Zimmerman, K.A. Practical Guide for Quality Management of Pavement Condition Data Collection; U.S. Department of Transportation: Washington, DC, USA, 2013.
- Paterson, W.D.O.; Scullion, T. Information Systems for Road Management: Draft Guidelines on System Design and Data Issues; The National Academies of Sciences, Engineering, and Medicine: Washington, DC, USA, 1990. [Google Scholar]
- Wang, K.C.P.; Gong, W. Automated pavement distress survey: A review and a new direction. In Proceedings of the Pavement Evaluation Conference, Roanoke, VA, USA, 21–25 October 2002; pp. 21–25. [Google Scholar]
- Arhin, S.A.; Williams, L.N.; Ribbiso, A.; Anderson, M.F. Predicting Pavement Condition Index Using International Roughness Index in a Dense Urban Area. J. Civ. Eng. Res. 2015, 5, 10–17. [Google Scholar] [CrossRef]
- Laurent, J.; Hébert, J.F.; Lefebvre, D.; Savard, Y. Using 3D Laser Profiling Sensors for the Automated Measurement of Road Surface Conditions. In Proceedings of the 7th RILEM International Conference on Cracking in Pavements, Delft, The Netherlands, 20–22 June 2012; Scarpas, A., Kringos, N., Al-Qadi, I.A.L., Eds.; Springer: Dordrecht, The Netherlands, 2012; pp. 157–167. [Google Scholar] [CrossRef]
- Landa, J.; Prochazka, D. Automatic Road Inventory Using LiDAR. Procedia Econ. Financ. 2014, 12, 363–370. [Google Scholar] [CrossRef]
- Sairam, N.; Nagarajan, S.; Ornitz, S. Development of Mobile Mapping System for 3D Road Asset Inventory. Sensors 2016, 16, 367. [Google Scholar] [CrossRef]
- Luis, G.; Antunes, C. Road Rutting Measurement Using Mobile LiDAR Systems Point Cloud. ISPRS Int. J. Geo-Inf. 2019, 8, 404. [Google Scholar] [CrossRef]
- Wix, R.; Leschinski, R. Cracking—A Tale of Four Systems. In Proceedings of the 25th Australian Road Research Board Conference, Perth, Australia, 23–26 September 2012; pp. 1–20. [Google Scholar]
- Oliveira, H.; Correia, P.L. Automatic Road Crack Detection and Characterization. IEEE Trans. Intell. Transp. Syst. 2013, 14, 155–168. [Google Scholar] [CrossRef]
- Puan, O.C.; Mustaffar, M.; Ling, T.-C. Automated Pavement Imaging Program (APIP) for Pavement Cracks Classification and Quantification. Malays. J. Civ. Eng. 2007, 19, 1–16. [Google Scholar]
- Chambon, S.; Moliard, J.M. Automatic road pavement assessment with image processing: Review and Comparison. Int. J. Geophys. 2011, 2011. [Google Scholar] [CrossRef]
- Zakeri, H.; Nejad, F.M.; Fahimifar, A. Image Based Techniques for Crack Detection, Classification and Quantification in Asphalt Pavement: A Review. Arch. Comput. Methods Eng. 2017, 24, 935–977. [Google Scholar] [CrossRef]
- Majidifard, H.; Jin, P.; Adu-Gyamfi, Y.; Buttlar, W.G. Pavement Image Datasets: A New Benchmark Dataset to Classify and Densify Pavement Distresses. Transp. Res. Rec. J. Transp. Res. Board 2020, 2674, 328–339. [Google Scholar] [CrossRef]
- Gopalakrishnan, K. Deep Learning in Data-Driven Pavement Image Analysis and Automated Distress Detection: A Review. Data 2018, 3, 28. [Google Scholar] [CrossRef]
- Gopalakrishnan, K.; Khaitan, S.K.; Choudhary, A.; Agrawal, A. Deep Convolutional Neural Networks with transfer learning for computer vision-based data-driven pavement distress detection. Constr. Build. Mater. 2017, 157. [Google Scholar] [CrossRef]
- Inzerillo, L.; Di Mino, G.; Roberts, R. Image-based 3D reconstruction using traditional and UAV datasets for analysis of road pavement distress. Autom. Constr. 2018, 96, 457–469. [Google Scholar] [CrossRef]
- Roberts, R.; Inzerillo, L.; Mino, G. Di Exploiting Low-Cost 3D Imagery for the Purposes of Detecting and Analyzing Pavement Distresses. Infrastructures 2020, 5, 6. [Google Scholar] [CrossRef]
- Roberts, R.; Inzerillo, L.; Di Mino, G. Developing a framework for using Structure-from-Motion techniques for Road Distress applications. Eur. Transp. Transp. Eur. 2020, 77, 1–11. [Google Scholar]
- Westoby, M.J.; Brasington, J.; Glasser, N.F.; Hambrey, M.J.; Reynolds, J.M. “Structure-from-Motion” photogrammetry: A low-cost, effective tool for geoscience applications. Geomorphology 2012. [Google Scholar] [CrossRef]
- Verhoeven, G. Taking computer vision aloft -archaeological three-dimensional reconstructions from aerial photographs with photoscan. Archaeol. Prospect. 2011, 18, 67–73. [Google Scholar] [CrossRef]
- Allegra, D.; Gallo, G.; Inzerillo, L.; Lombardo, M.; Milotta, F.L.M.; Santagati, C.; Stanco, F. Low Cost Handheld 3D Scanning for Architectural Elements Acquisition. In Proceedings of the STAG: Smart Tools and Applications in Graphics 2016, Genova, Italy, 3–4 October 2016. [Google Scholar] [CrossRef]
- Aicardi, I.; Chiabrando, F.; Maria Lingua, A.; Noardo, F. Recent trends in cultural heritage 3D survey: The photogrammetric computer vision approach. J. Cult. Herit. 2018. [Google Scholar] [CrossRef]
- Wang, K.C.P. Elements of automated survey of pavements and a 3D methodology. J. Mod. Transp. 2011, 19, 51–57. [Google Scholar] [CrossRef]
- Martínez, S.; Ortiz, J.; Gil, M.L. Geometric documentation of historical pavements using automated digital photogrammetry and high-density reconstruction algorithms. J. Archaeol. Sci. 2015, 53, 1–11. [Google Scholar] [CrossRef]
- Ahmed, M.; Haas, C.T.; Haas, R. Toward low-cost 3D automatic pavement distress surveying: The Close Range Photogrammetry Approach. Can. J. Civ. Eng. 2011, 38, 1301–1313. [Google Scholar] [CrossRef]
- Giordan, D.; Manconi, A.; Remondino, F.; Nex, F. Use of unmanned aerial vehicles in monitoring application and management of natural hazards. Geomat. Nat. Hazards Risk 2017, 8, 1–4. [Google Scholar] [CrossRef]
- Salvo, G.; Caruso, L.; Scordo, A. Urban Traffic Analysis through an UAV. Procedia-Soc. Behav. Sci. 2014, 111, 1083–1091. [Google Scholar] [CrossRef]
- Pan, Y.; Zhang, X.; Cervone, G.; Yang, L. Detection of Asphalt Pavement Potholes and Cracks Based on the Unmanned Aerial Vehicle Multispectral Imagery. IEEE J. Sel. Top. Appl. Earth Obs. Remote Sens. 2018, 11, 3701–3712. [Google Scholar] [CrossRef]
- Kang, D.; Cha, Y.J. Autonomous UAVs for Structural Health Monitoring Using Deep Learning and an Ultrasonic Beacon System with Geo-Tagging. Comput. Civ. Infrastruct. Eng. 2018, 33, 885–902. [Google Scholar] [CrossRef]
- Zhang, C. An UAV-based photogrammetric mapping system for road condition assessment. Int. Arch. Photogramm. Remote Sens. Spat. Inf. Sci. 2008, 37, 627–632. [Google Scholar]
- Zeybek, M.; Serkan, B. Road Distress Measurements Using UAV. Turk. J. Remote Sens. GIS 2020, 1, 13–23. [Google Scholar]
- Chacra, D.B.A.; Zelek, J.S. Fully Automated Road Defect Detection Using Street View Images. In Proceedings of the 2017 14th Conference on Computer and Robot Vision (CRV), Edmonton, AB, Canada, 16–19 May 2017; pp. 353–360. [Google Scholar] [CrossRef]
- Saad, A.M.; Tahar, K.N. Identification of rut and pothole by using multirotor unmanned aerial vehicle (UAV). Meas. J. Int. Meas. Confed. 2019, 137, 647–654. [Google Scholar] [CrossRef]
- Inzerillo, L.; Roberts, R. 3D Image Based Modelling Using Google Earth Imagery for 3D Landscape Modelling. Adv. Intell. Syst. Comput. 2019, 919, 627–634. [Google Scholar] [CrossRef]
- Zhang, D.; Zou, Q.; Lin, H.; Xu, X.; He, L.; Gui, R.; Li, Q. Automatic pavement defect detection using 3D laser profiling technology. Autom. Constr. 2018, 96. [Google Scholar] [CrossRef]
- Gui, R.; Xu, X.; Zhang, D.; Lin, H.; Pu, F.; He, L.; Cao, M. A component decomposition model for 3D laser scanning pavement data based on high-pass filtering and sparse analysis. Sensors 2018, 18, 2294. [Google Scholar] [CrossRef]
- Li, B.; Wang, K.C.P.; Zhang, A.; Fei, Y. Automatic Segmentation and Enhancement of Pavement Cracks Based on 3D Pavement Images. J. Adv. Transp. 2019, 2019, 1–9. [Google Scholar] [CrossRef]
- Akagic, A.; Buza, E.; Omanovic, S.; Karabegovic, A. Pavement crack detection using Otsu thresholding for image segmentation. In Proceedings of the 2018 41st International Convention on Information and Communication Technology, Electronics and Microelectronics, MIPRO 2018-Proceedings, Croatian Society MIPRO, Opatija, Croatia, 21–25 May 2018; pp. 1092–1097. [Google Scholar] [CrossRef]
- Tan, Y.; Li, Y. UAV Photogrammetry-Based 3D Road Distress Detection. ISPRS Int. J. Geo-Inf. 2019, 8, 409. [Google Scholar] [CrossRef]
- Li, M.; Nan, L.; Smith, N.; Wonka, P. Reconstructing building mass models from UAV images. Comput. Graph. 2016, 54, 84–93. [Google Scholar] [CrossRef]
- Remondino, F.; Nocerino, E.; Toschi, I.; Menna, F. A Critical Review of Automated Photogrammetric Processing of Large Datasets. ISPRS-Int. Arch. Photogramm. Remote Sens. Spat. Inf. Sci. 2017, XLII-2/W5, 591–599. [Google Scholar] [CrossRef]
- Höhle, J. Oblique Aerial Images and Their Use in Cultural Heritage Documentation. ISPRS-Int. Arch. Photogramm. Remote Sens. Spat. Inf. Sci. 2013, XL-5/W2, 349–354. [Google Scholar] [CrossRef]
- Zhang, S.; Lippitt, C.D.; Bogus, S.M.; Neville, P.R.H. Characterizing pavement surface distress conditions with hyper-spatial resolution natural color aerial photography. Remote Sens. 2016, 8, 392. [Google Scholar] [CrossRef]
- Loprencipe, G.; Pantuso, A. A Specified Procedure for Distress Identification and Assessment for Urban Road Surfaces Based on PCI. Coatings 2017, 7, 65. [Google Scholar] [CrossRef]
- Oniga, E.; Breaban, A.; Statescu, F. Determining the optimum number of ground control points for obtaining high precision results based on UAS images. Proceedings 2018, 2, 352. [Google Scholar] [CrossRef]
- Agisoft LLC Agisoft Metashape Professional 2019. Available online: https://www.agisoft.com/ (accessed on 12 July 2020).
- EDF R&D/TELECOM ParisTech (ENST-TSI) CloudCompare 2016. Available online: https://www.danielgm.net/cc/ (accessed on 12 August 2020).
- Schnabel, R.; Wahl, R.; Klein, R. Efficient RANSAC for point-cloud shape detection. Comput. Graph. Forum 2007, 26, 214–226. [Google Scholar] [CrossRef]
- Carballido, J.; Perez-Ruiz, M.; Emmi, L.; Agüera, J. Comparison of positional accuracy between rtk and rtx gnss based on the autonomous agricultural vehicles under field conditions. Appl. Eng. Agric. 2014, 30, 361–366. [Google Scholar] [CrossRef][Green Version]
- Robert McNeel & Associates Rhino3D 2018. Available online: https://www.rhino3d.com/ (accessed on 10 August 2020).
- Liu, Y.; Zheng, X.; Ai, G.; Zhang, Y.; Zuo, Y. Generating a High-Precision True Digital Orthophoto Map Based on UAV Images. ISPRS Int. J. Geo-Inf. 2018, 7, 333. [Google Scholar] [CrossRef]
- Cardenal, J.; Fernández, T.; Pérez-García, J.L.; Gómez-López, J.M. Measurement of road surface deformation using images captured from UAVs. Remote Sens. 2019, 11, 1507. [Google Scholar] [CrossRef]


| Type of Detection | Device |
|---|---|
| Image-based Cameras | CCD (charge-coupled device), infrared, CMOS (metal-oxide-semiconductor sensor), line-scan, video, black-box, smart phone, retro reflectivity meter |
| Accelerometer | The device on: a smartphone, the wheel, the wheel axis, in-car |
| 3D Sensors | Laser profiler, line projection, stereovision, Kinect device, ground penetrating radar, structured light, photometric stereo |
| Microphone | A device placed: on a tyre, near the road, beneath the car |
| Sound propagation | Sonar device |
| Pressure | Pressure sensor |
| Friction | Tyre traction, angled wheel |
| Deflectometer | Falling weight deflectometer (FWD), dynamic rolling weight deflectometer (RWD) |
| Device | DJI Mavic 2 Pro |
|---|---|
| Drone weight (grams) | 907 |
| Camera resolution (megapixel) | 20 |
| Image Size (pixel) | 5568 × 3648 |
| Sensor size (mm) | 13.2 × 8.8 |
| Focal length (35 mm eq.) | 28 |
| ISO Sensitivity | 100 |
| Exposure time | 0.001 (shutter speed of 1/1000) |
| Aperture | f/2.8 |
| Device | DJI Mavic 2 Pro |
|---|---|
| Distance from the pavement (m) | ~8 |
| Number of photos taken (-) | 554 |
| Ground sample distance (GSD) (mm/pixel) | 0.97 |
| Number of points created in SfM software (-) | 90,508,878 |
| Direction | Control Points RMSE (m) | Checkpoints RMSE (m) |
|---|---|---|
| X error | 0.0078 | 0.0095 |
| Y error | 0.0082 | 0.0112 |
| Z error | 0.0079 | 0.0119 |
| Measurement | Full Section | Subsection 1 | Subsection 2 | Subsection 3 |
|---|---|---|---|---|
| Length of section (m) | 1000 | 200 | 250 | 300 |
| Average height of deformation (m) | 0.020 | 0.043 | 0.032 | 0.025 |
| Volume of distressed pavement surface (m3) | 160.80 | 69.02 | 64.50 | 50.20 |
| Average level of distress over section (%) | 20.35 | 43.14 | 32.25 | 25.10 |
Publisher’s Note: MDPI stays neutral with regard to jurisdictional claims in published maps and institutional affiliations. |
© 2020 by the authors. Licensee MDPI, Basel, Switzerland. This article is an open access article distributed under the terms and conditions of the Creative Commons Attribution (CC BY) license (http://creativecommons.org/licenses/by/4.0/).
Share and Cite
Roberts, R.; Inzerillo, L.; Di Mino, G. Using UAV Based 3D Modelling to Provide Smart Monitoring of Road Pavement Conditions. Information 2020, 11, 568. https://doi.org/10.3390/info11120568
Roberts R, Inzerillo L, Di Mino G. Using UAV Based 3D Modelling to Provide Smart Monitoring of Road Pavement Conditions. Information. 2020; 11(12):568. https://doi.org/10.3390/info11120568
Chicago/Turabian StyleRoberts, Ronald, Laura Inzerillo, and Gaetano Di Mino. 2020. "Using UAV Based 3D Modelling to Provide Smart Monitoring of Road Pavement Conditions" Information 11, no. 12: 568. https://doi.org/10.3390/info11120568
APA StyleRoberts, R., Inzerillo, L., & Di Mino, G. (2020). Using UAV Based 3D Modelling to Provide Smart Monitoring of Road Pavement Conditions. Information, 11(12), 568. https://doi.org/10.3390/info11120568