Figure 1.
FGNet annotation [
12].
Figure 2.
FGNet annotation [
12].
Figure 3.
5-point features [
13].
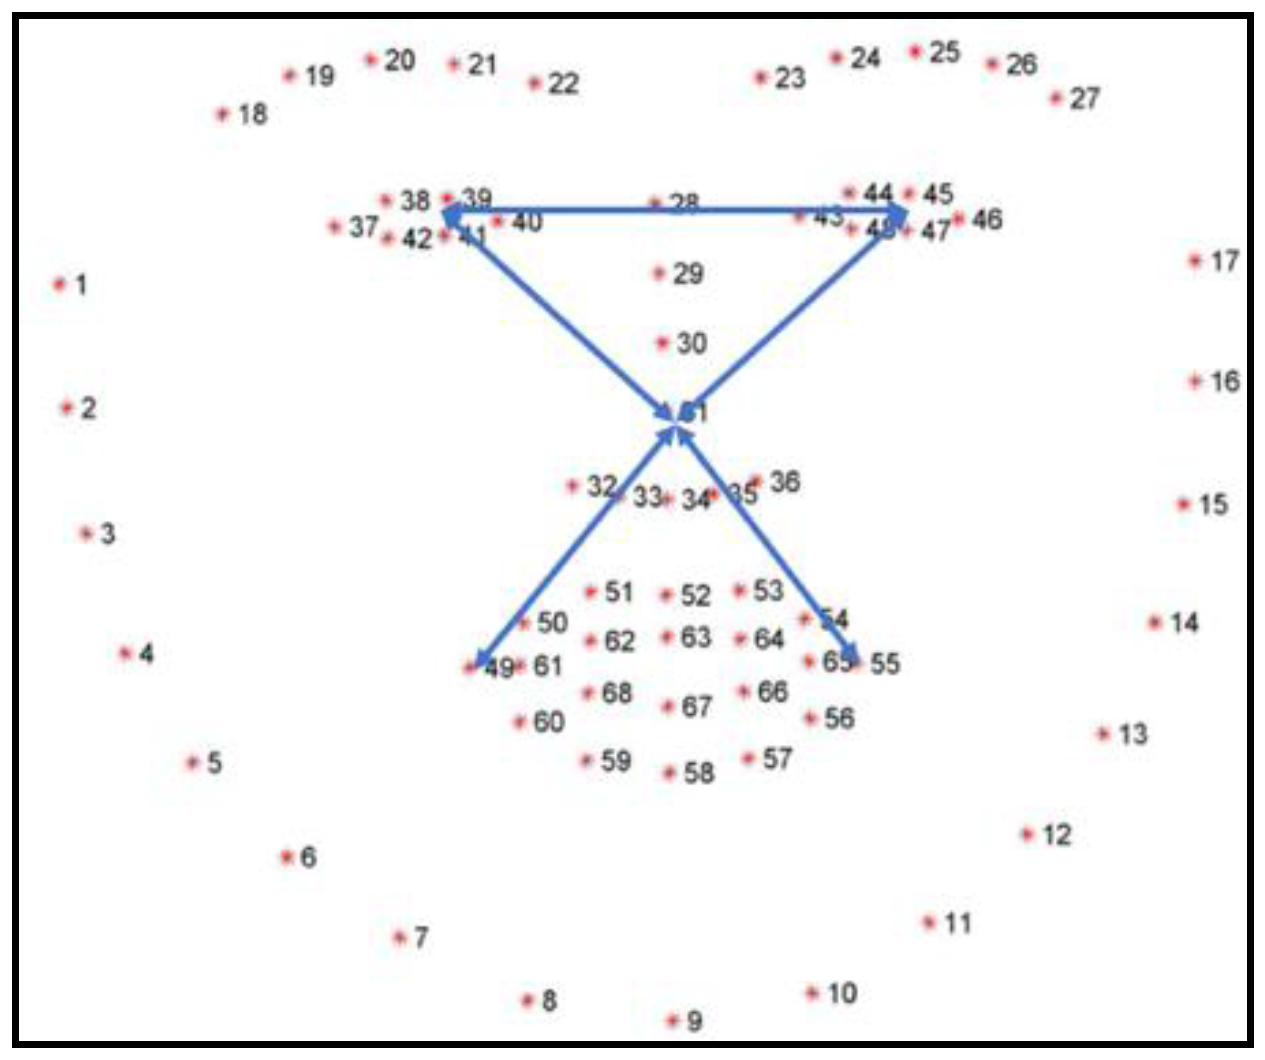
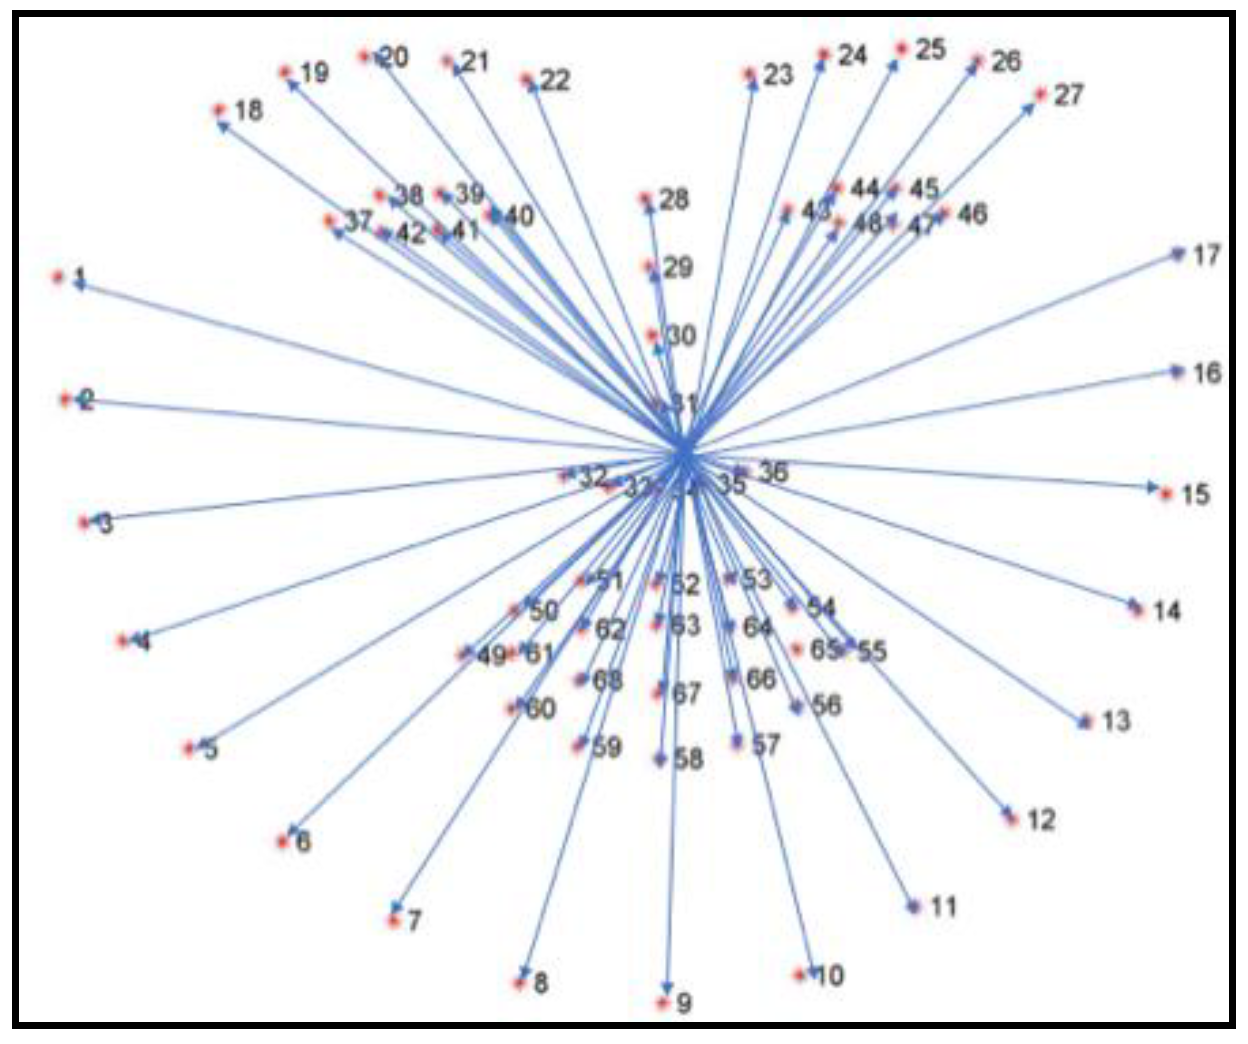
Figure 4.
68-points features [
13].
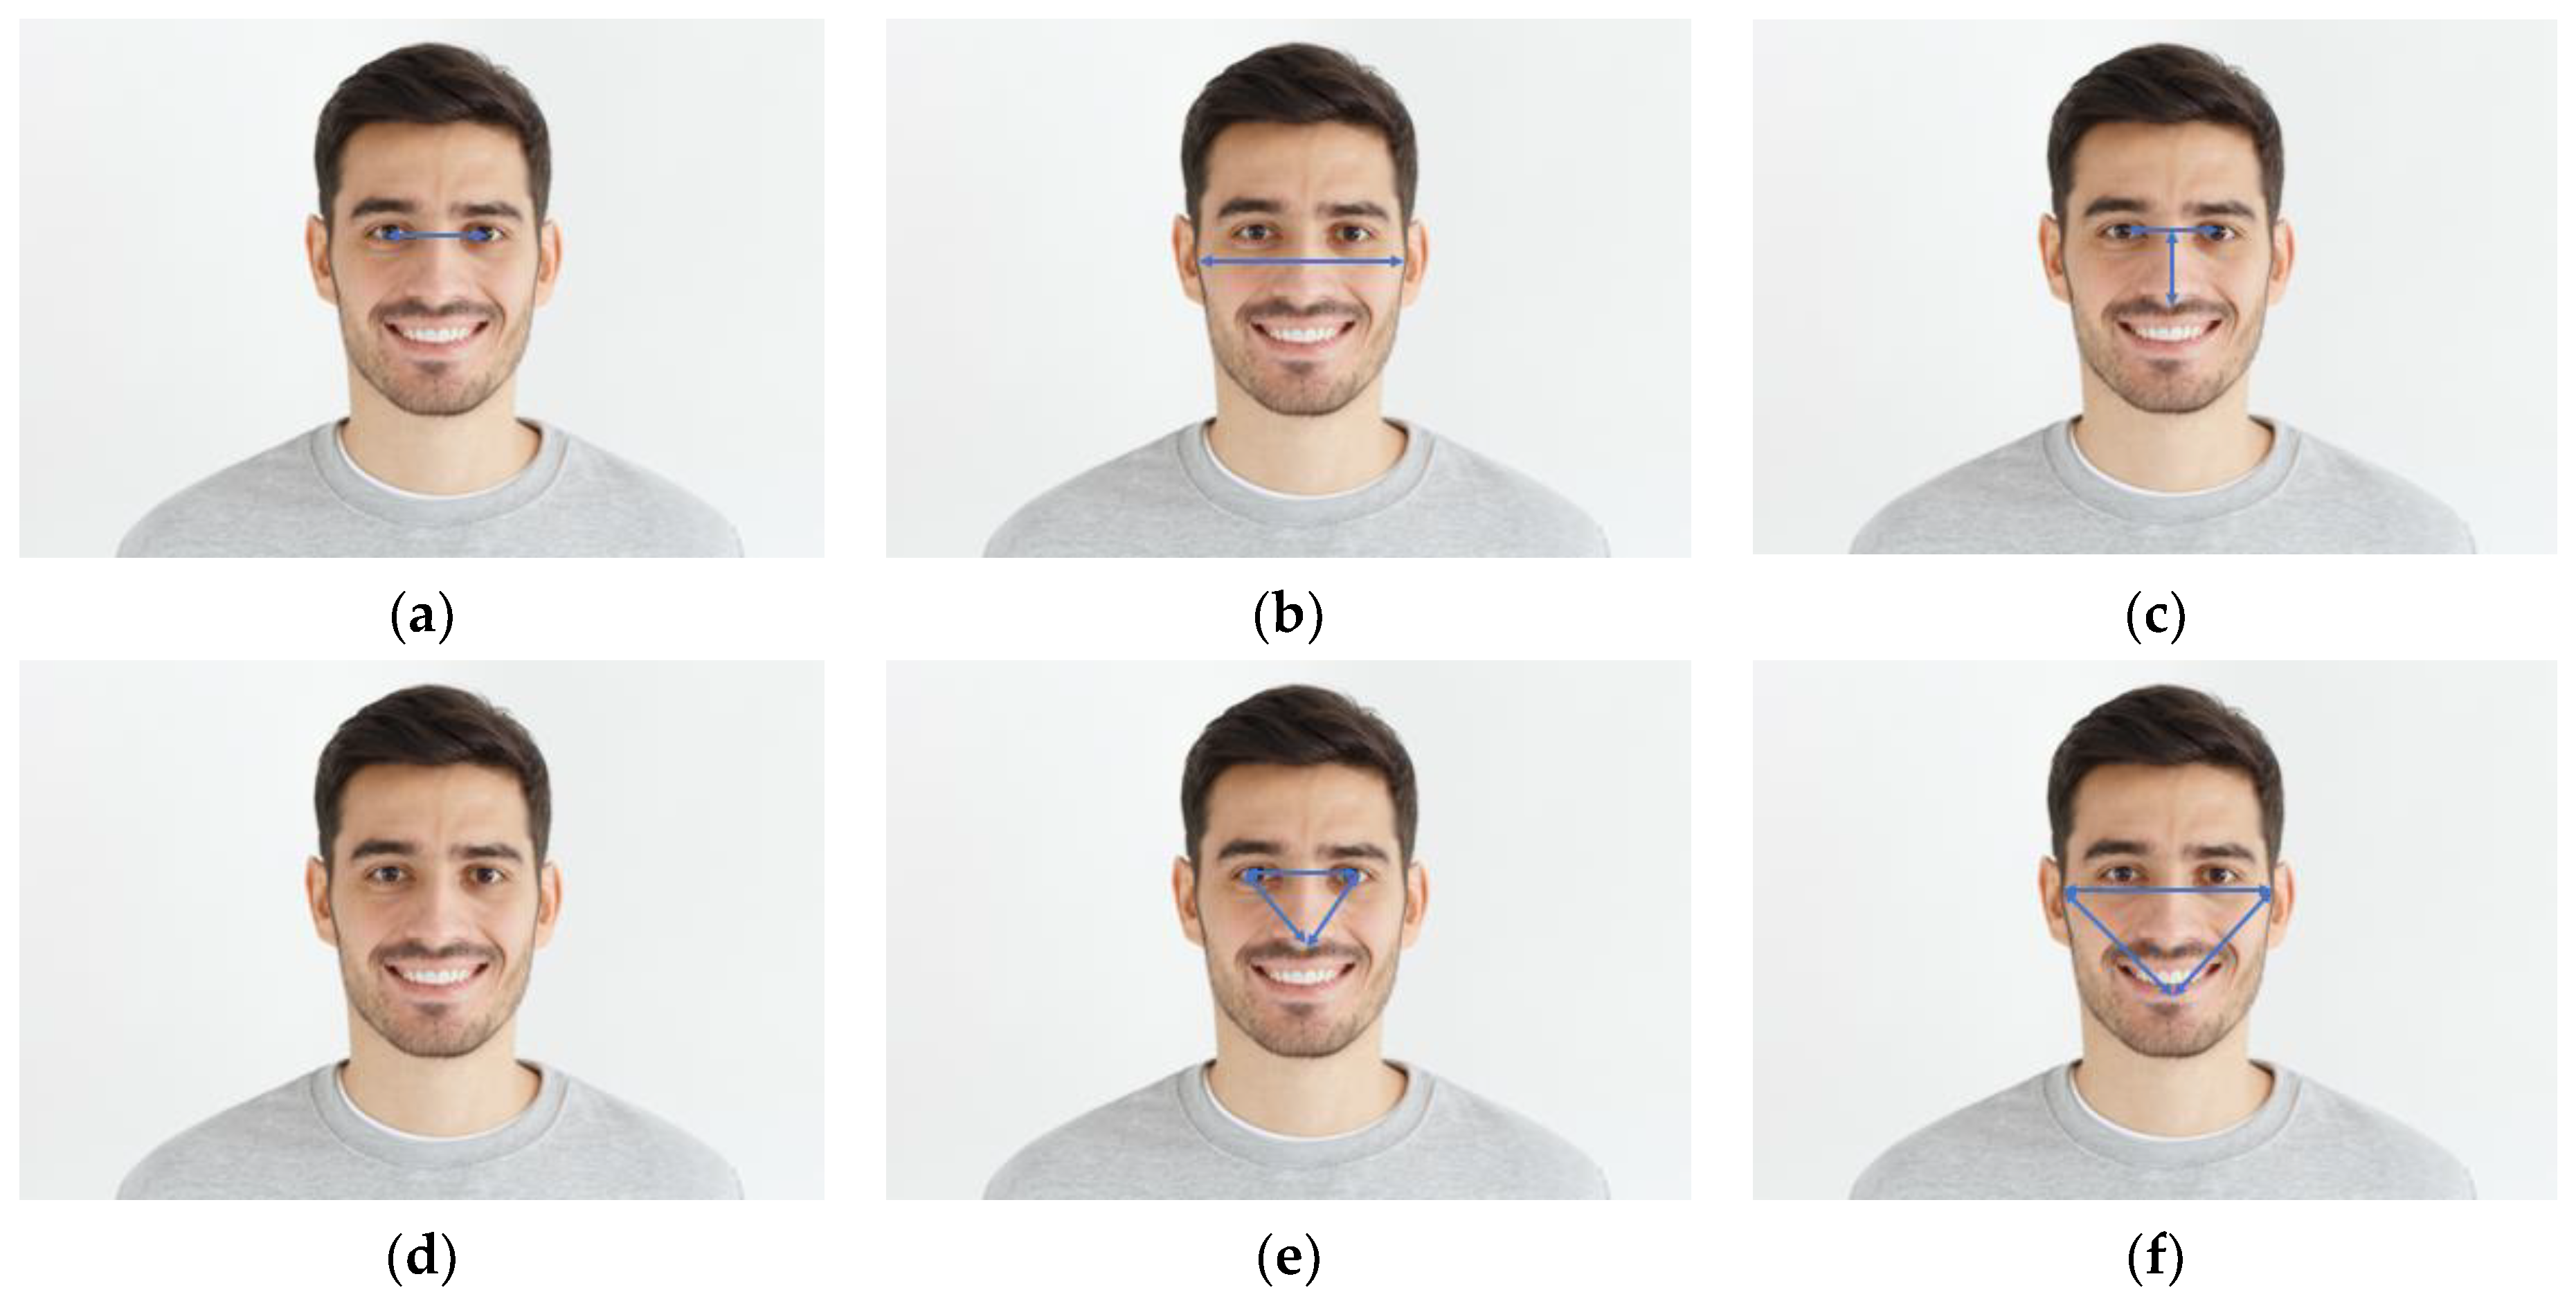
Figure 5.
Selected features by Banerrjee [
15]. (
a) distance between eyes, (
b) distance between ears, (
c) distance between the nose and forehead, (
d) width of the leap, in addition to the following angles where the sum is 180°; (
e) angles between eyes and nose, (
f) angles between ears and mouth. The following were used to measure the distance between the face objects: Euclidian distance (EU), city block metric, Minkowski distance, Chebyshev distance and cosine distance.
Figure 6.
Vector distances in [
16].
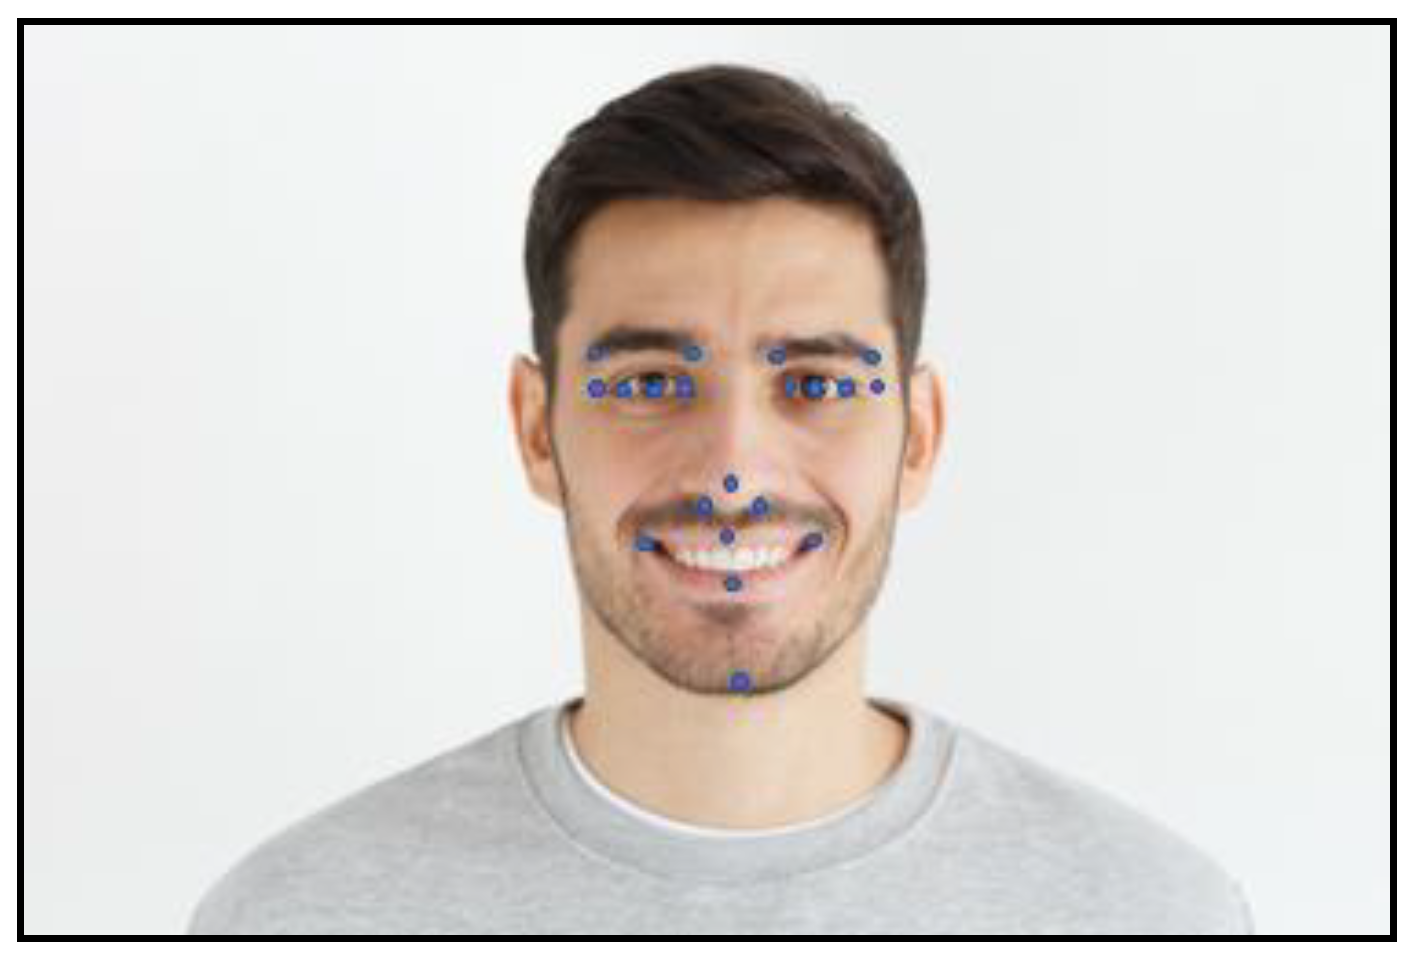
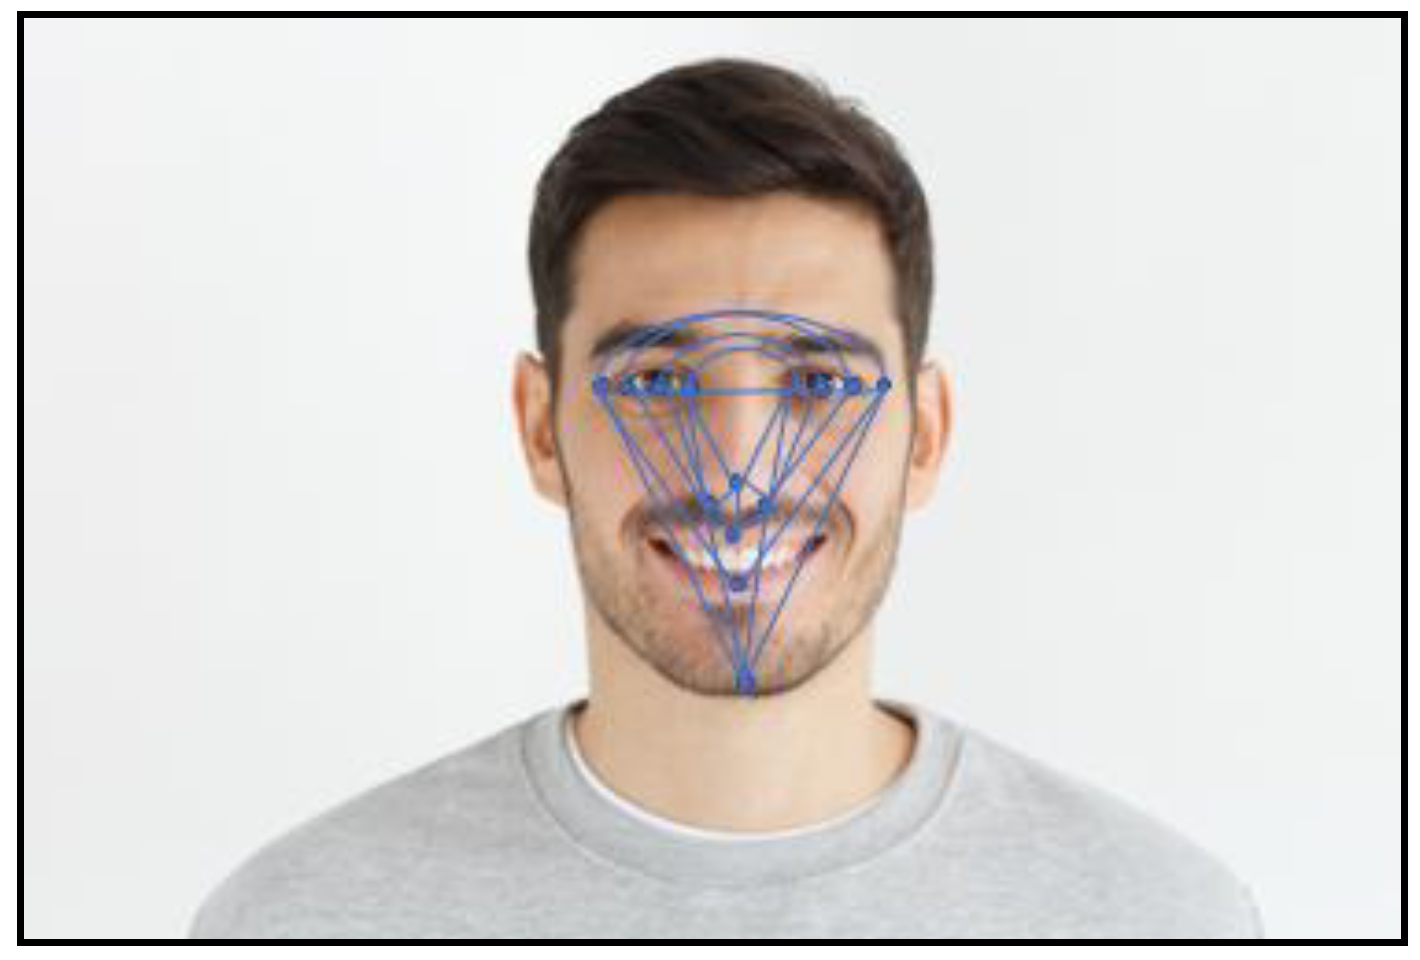
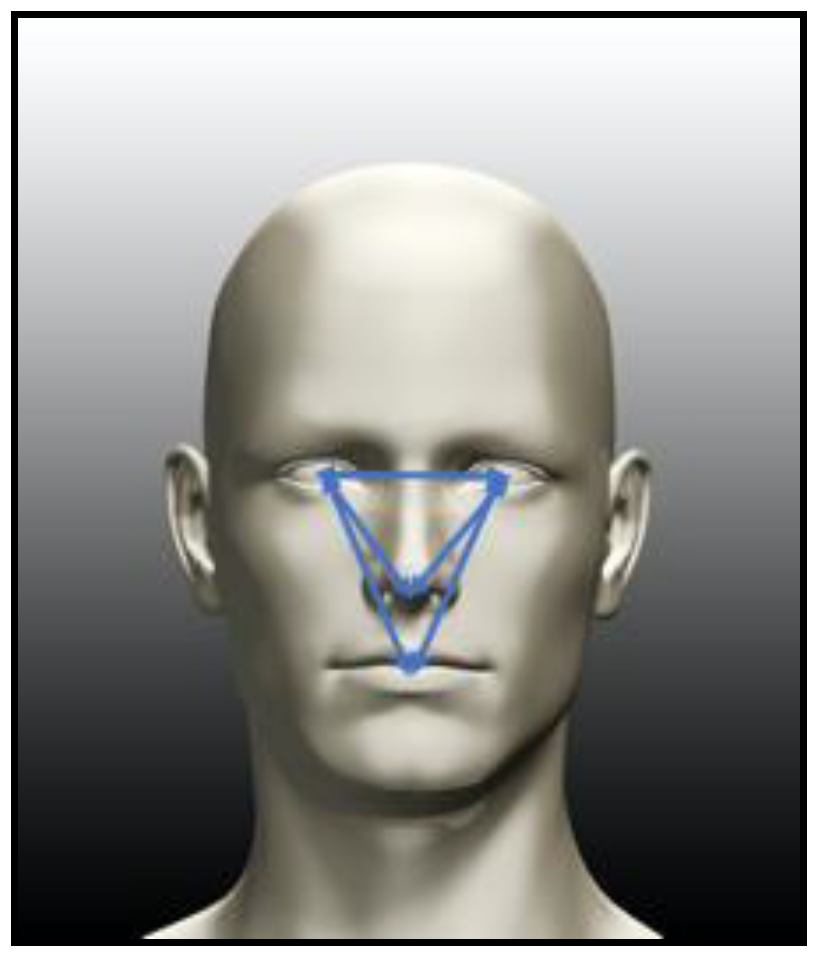
Figure 7.
Triangles in [
16].
Figure 8.
Selected features in [
17].
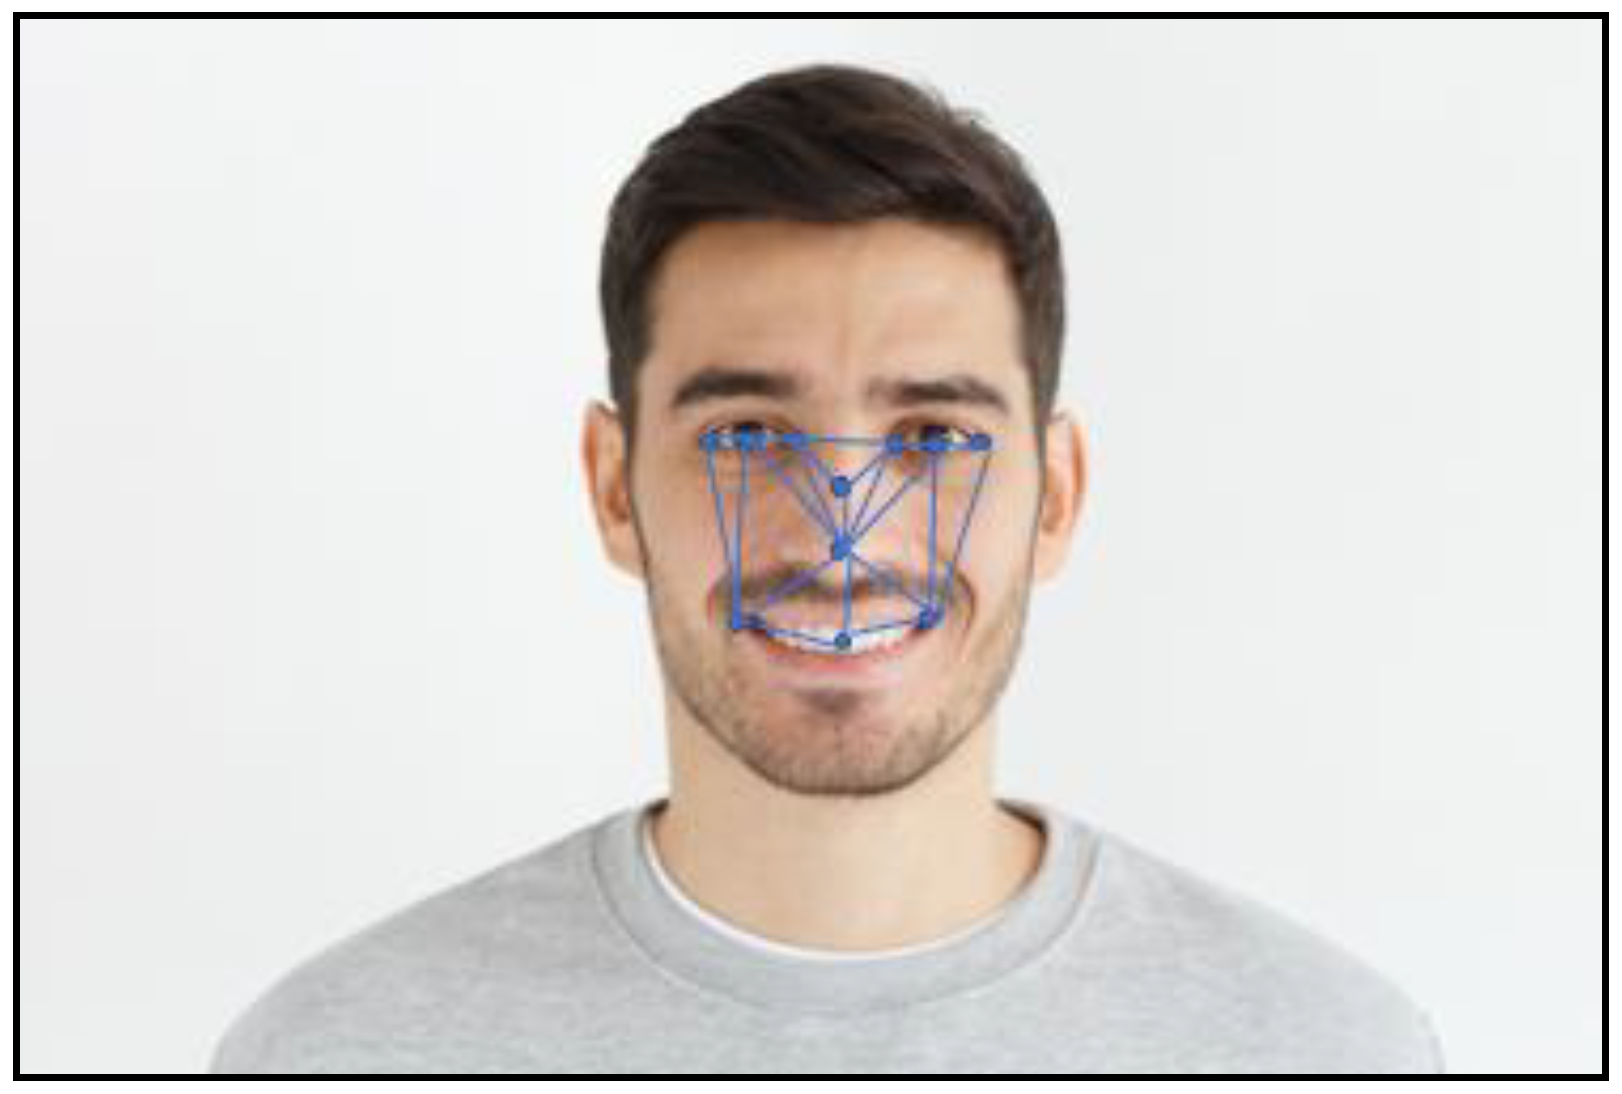
Figure 9.
Selected Features in [
18].
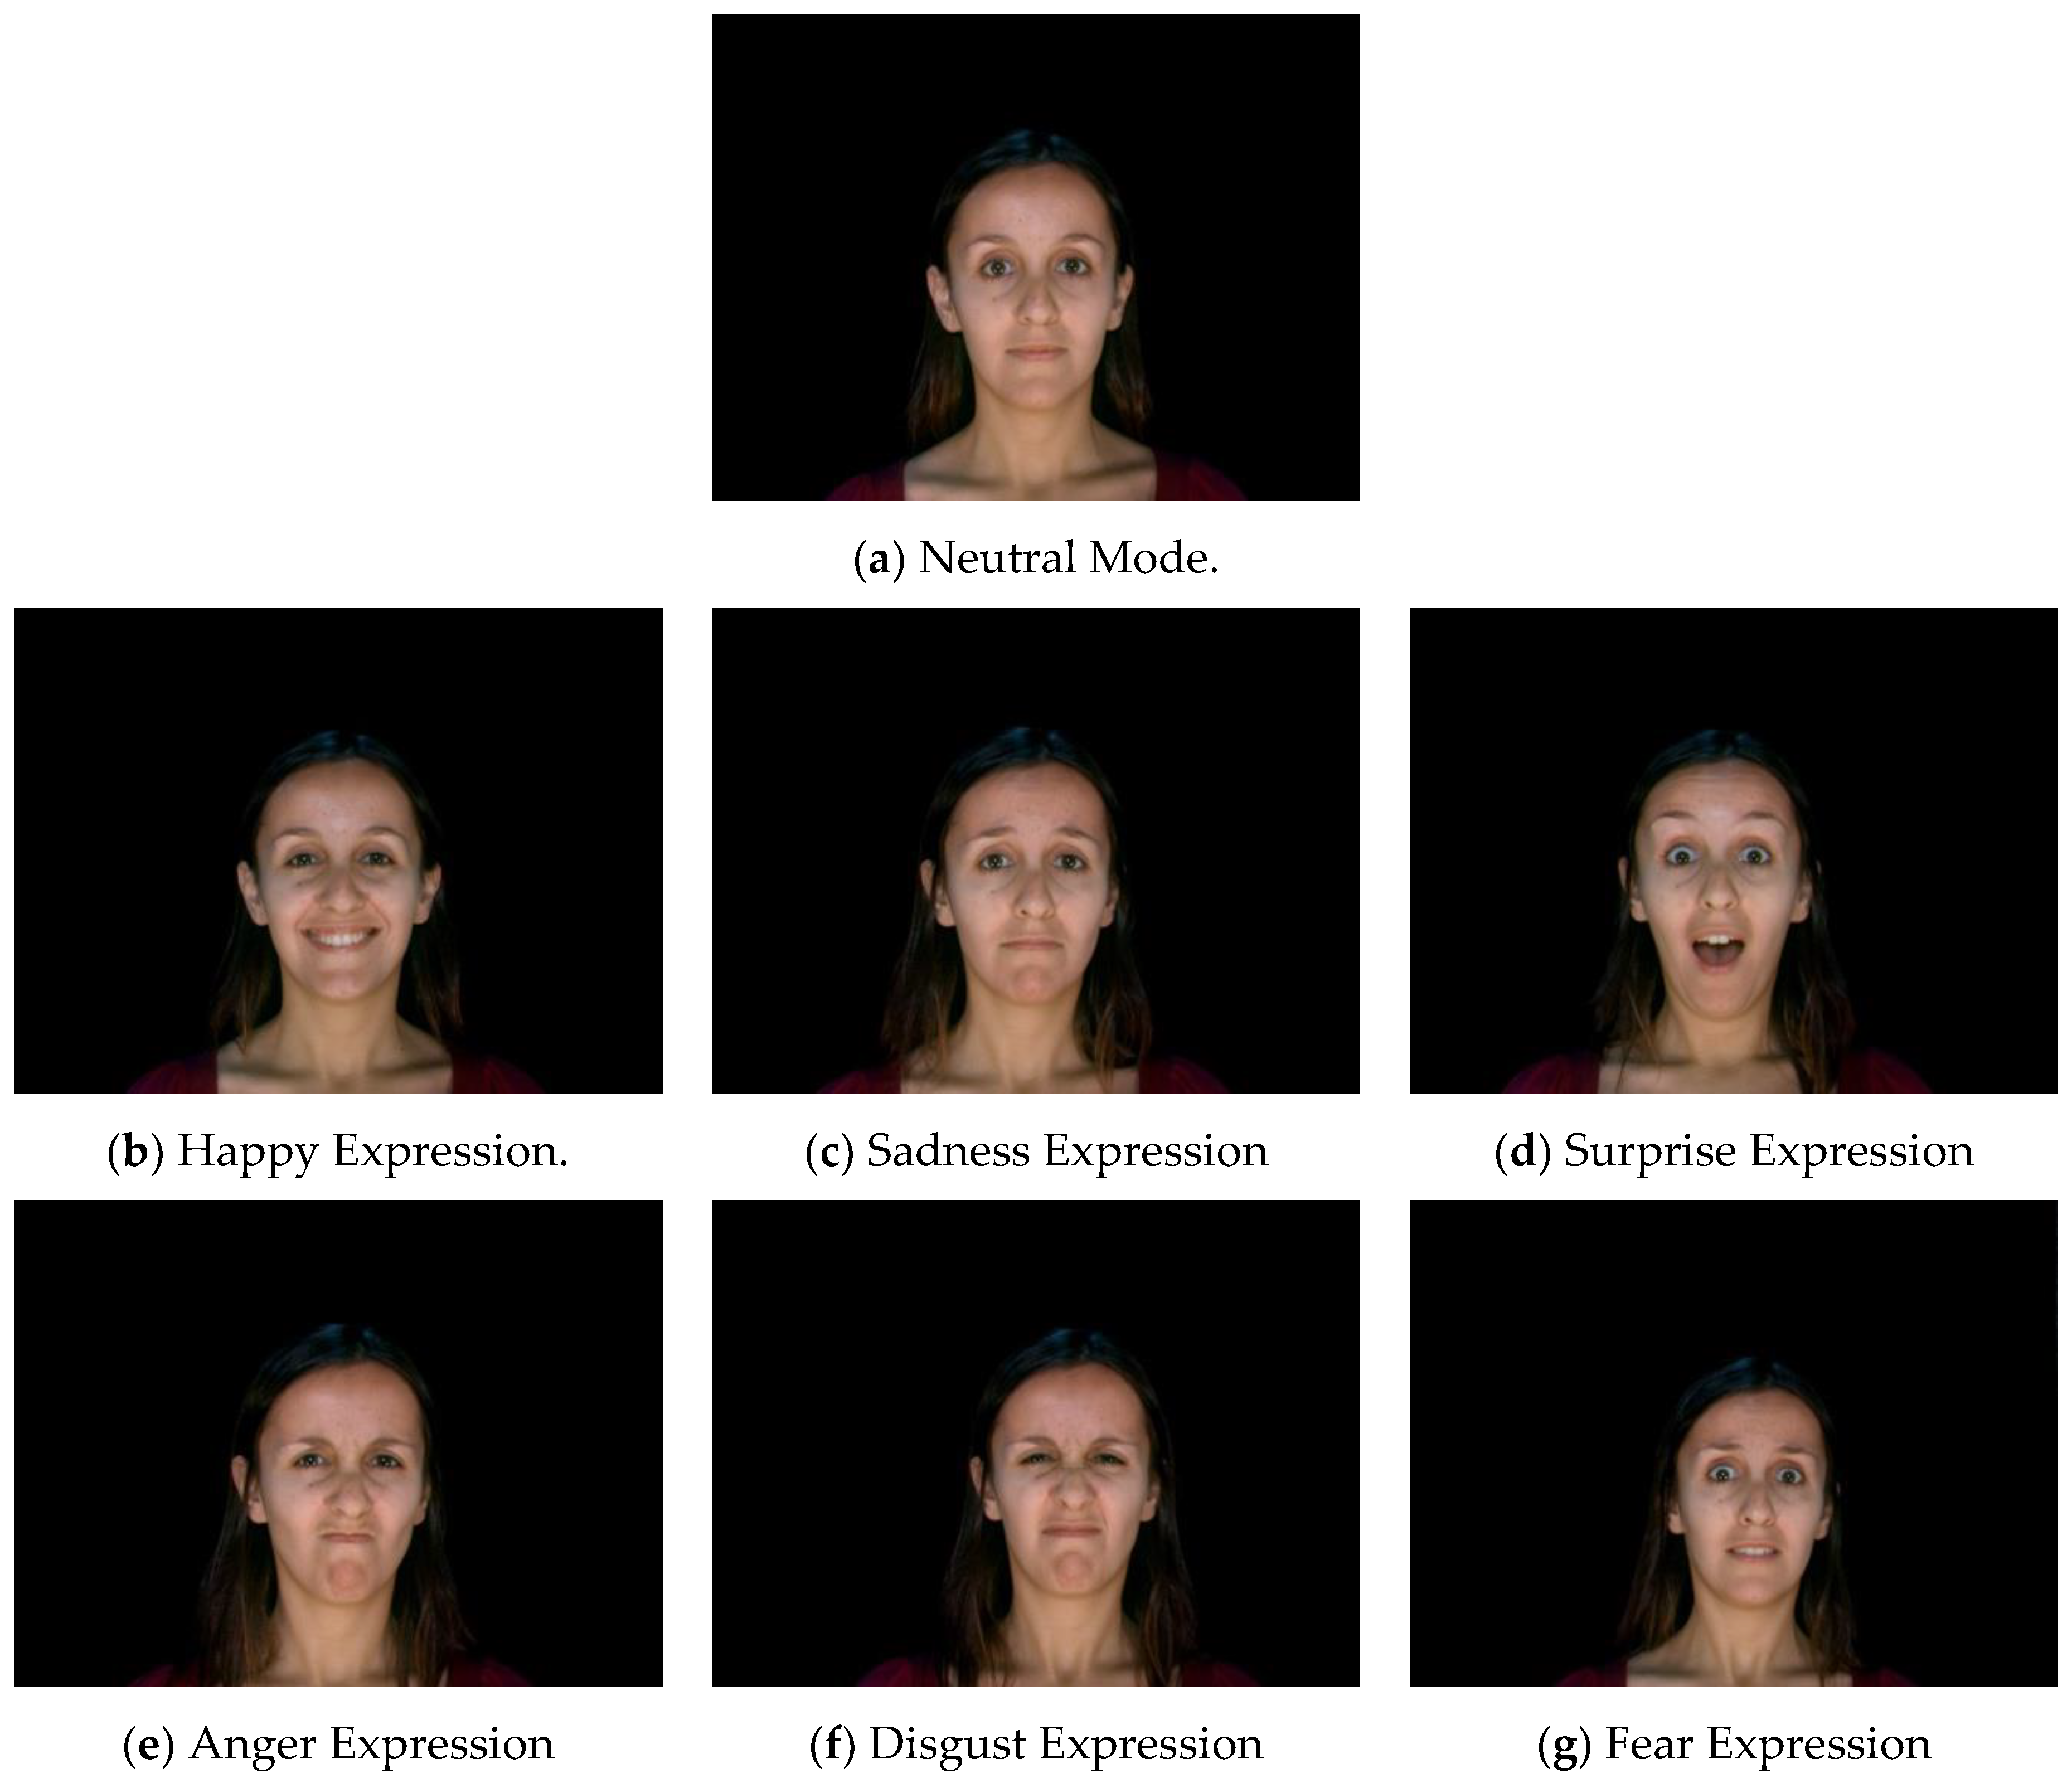
Figure 10.
Subject 1 in IMPA-FACES3D [
37] shows the following expressions: (
a) neutral, (
b) happy, (
c) sadness, (
d) surprise, (
e) anger, (
f) disgust, (
g) fear [
40].
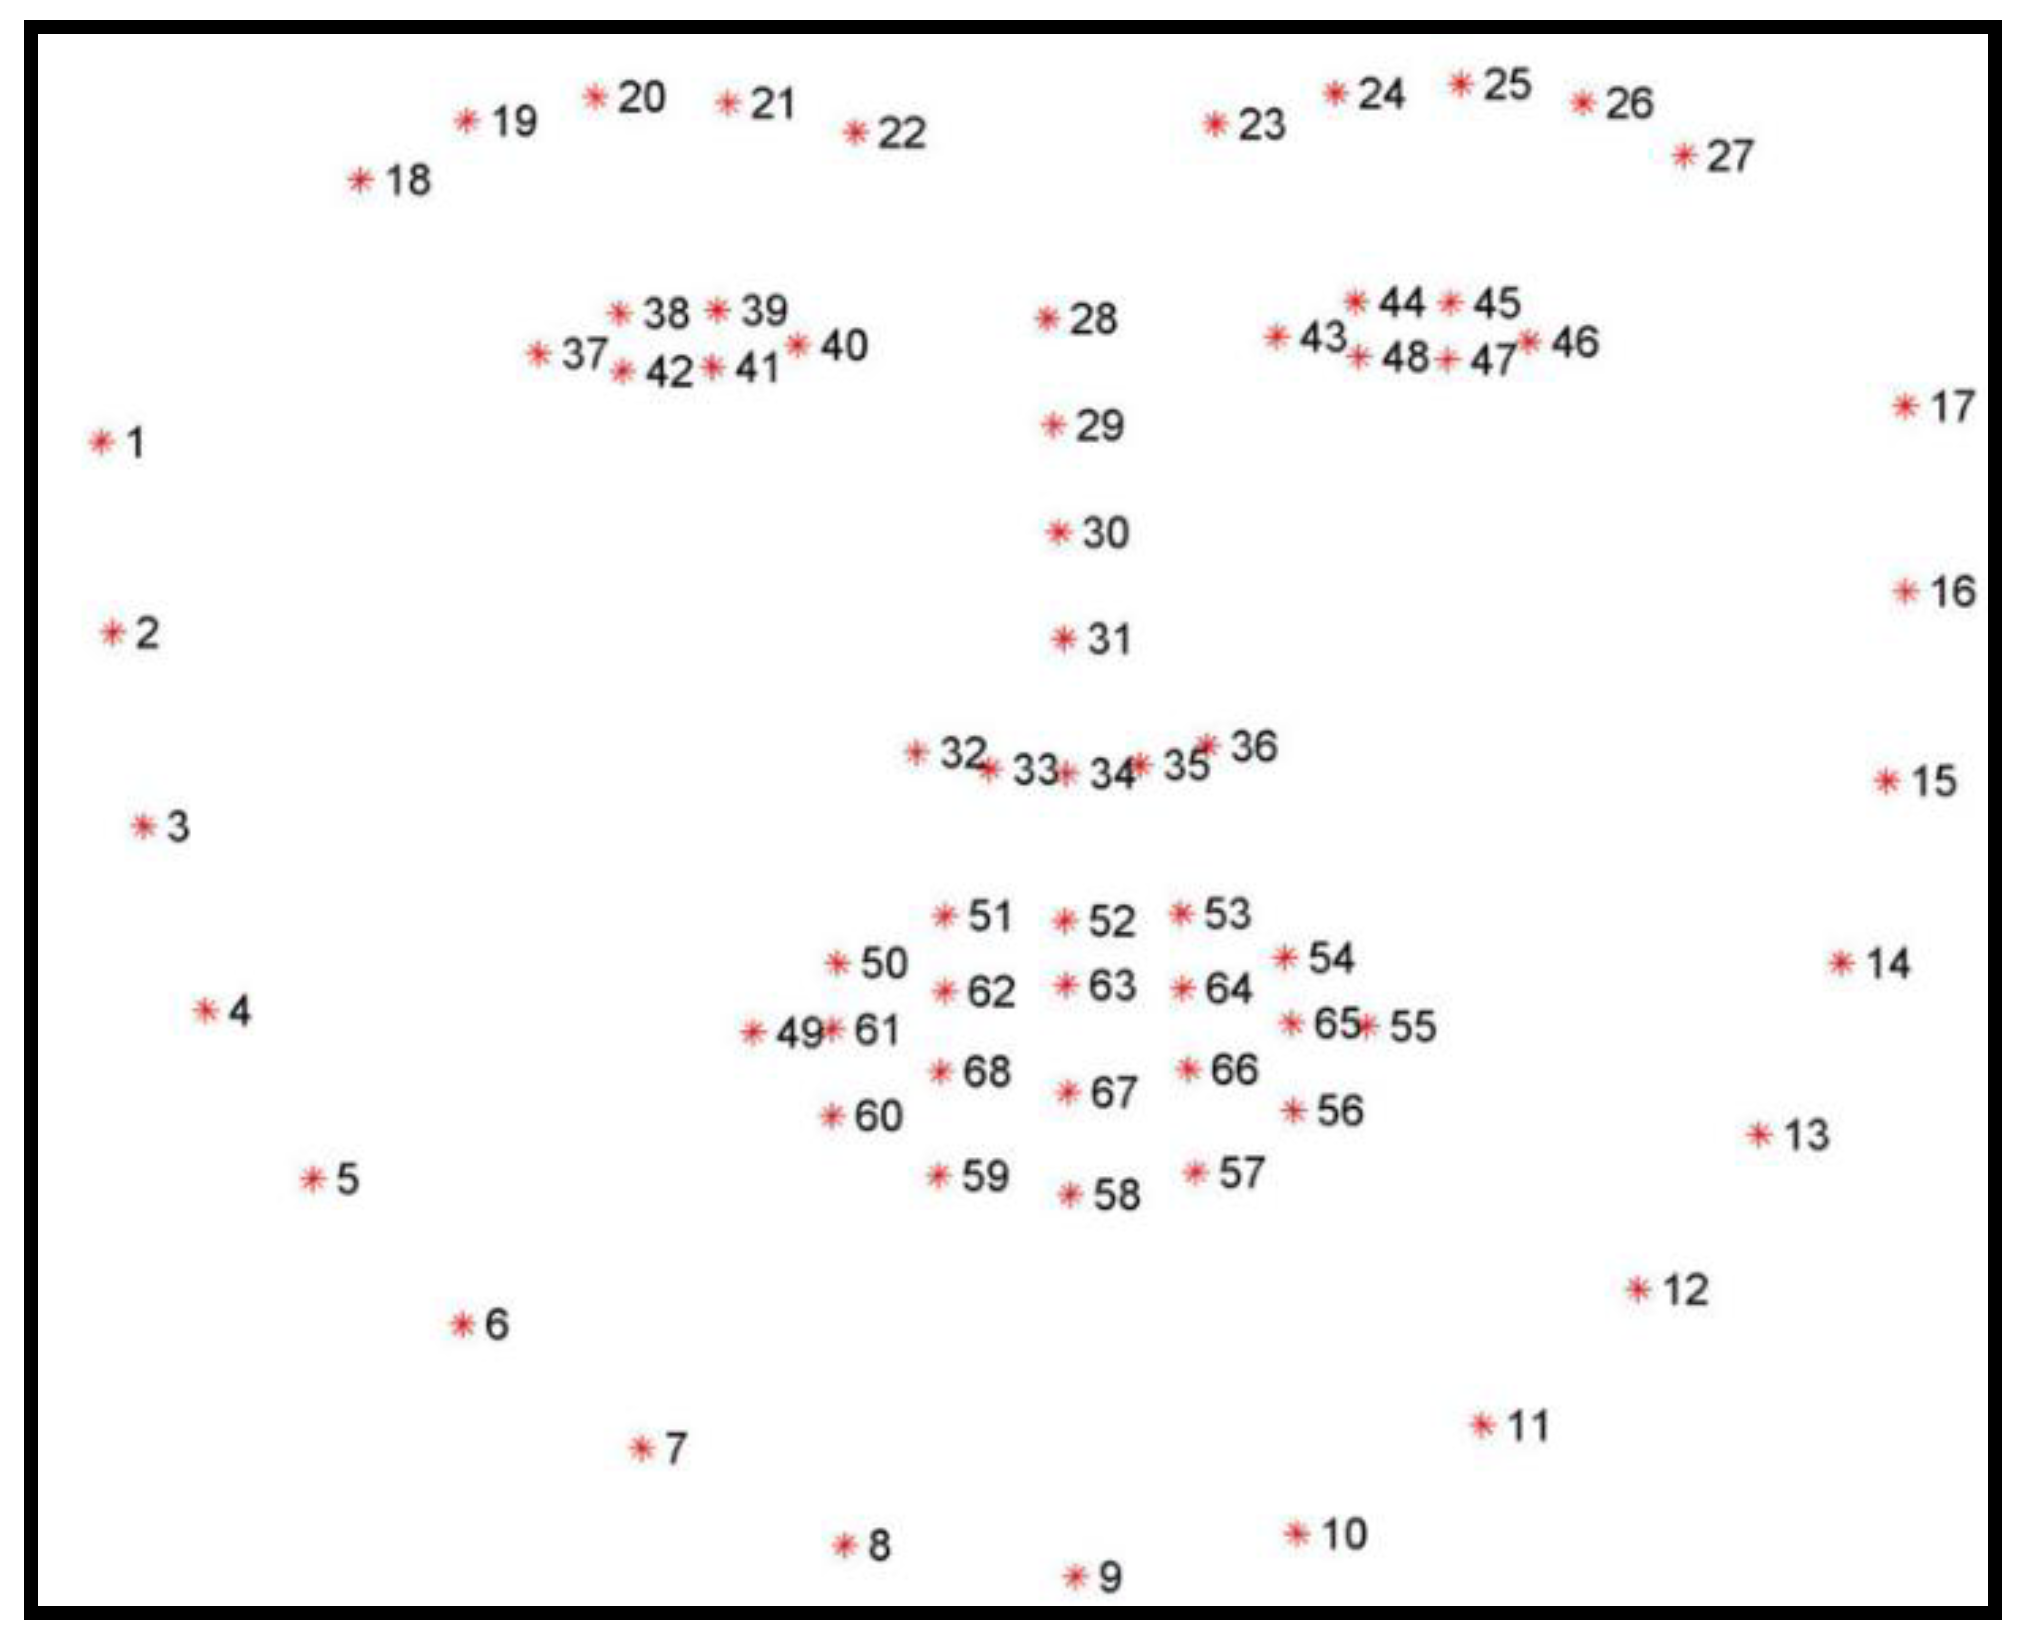
Figure 11.
Template image for face’s landmark detection using 68-points for a frontal view.
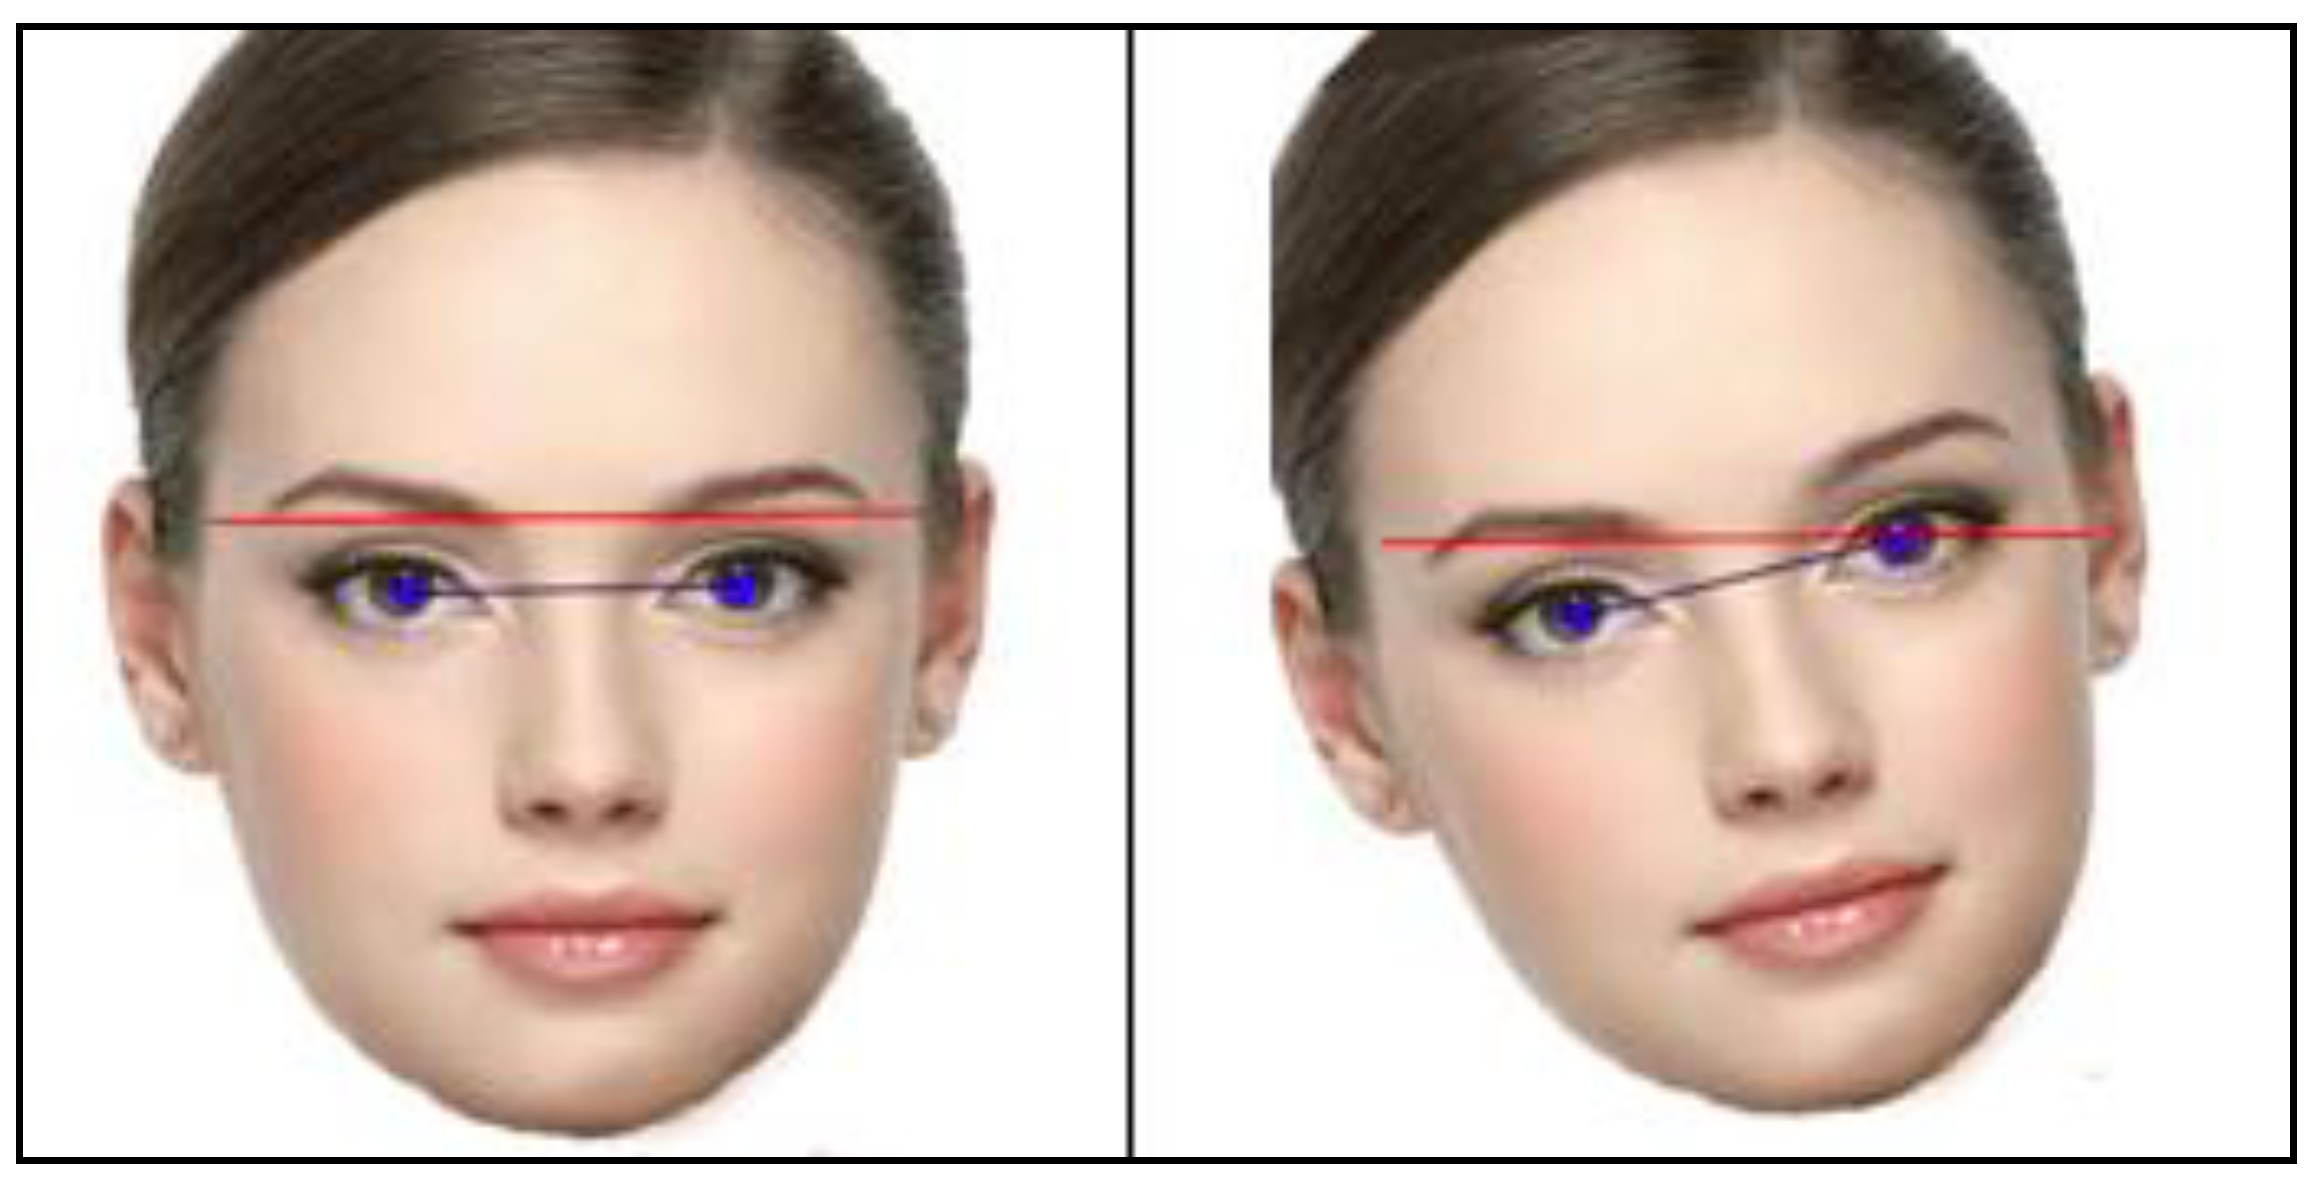
Figure 12.
Face alignment.
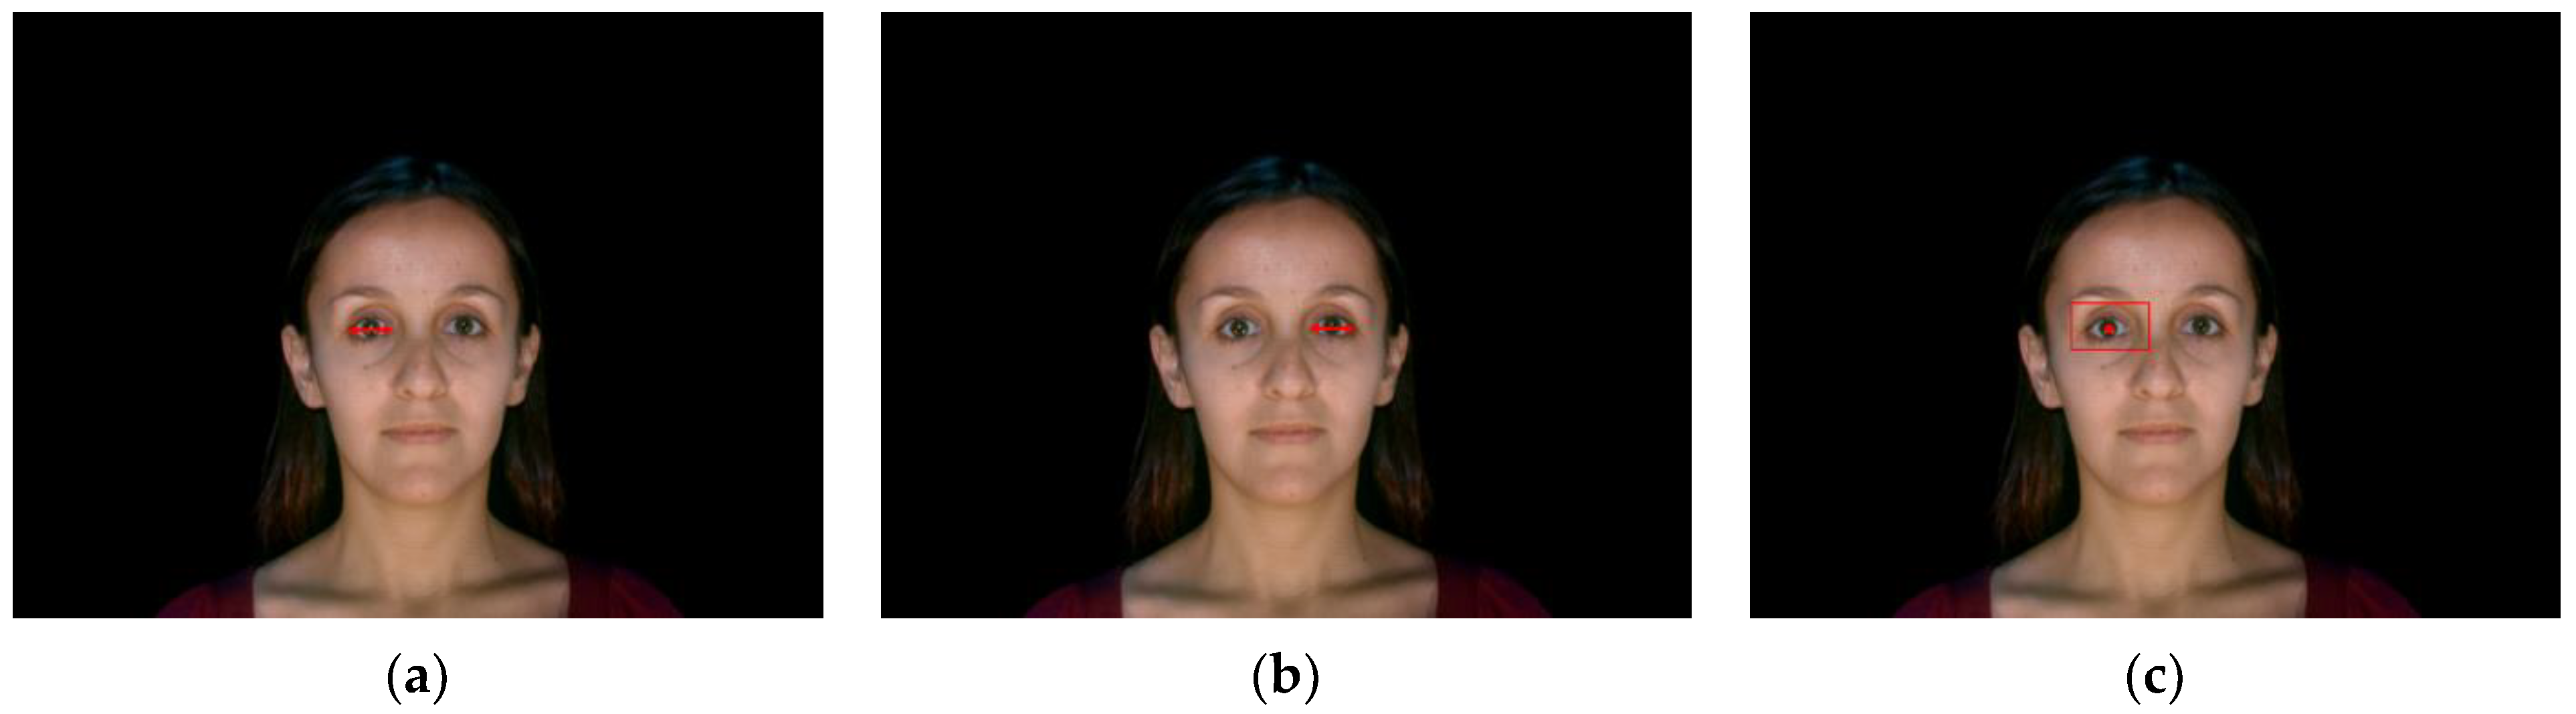
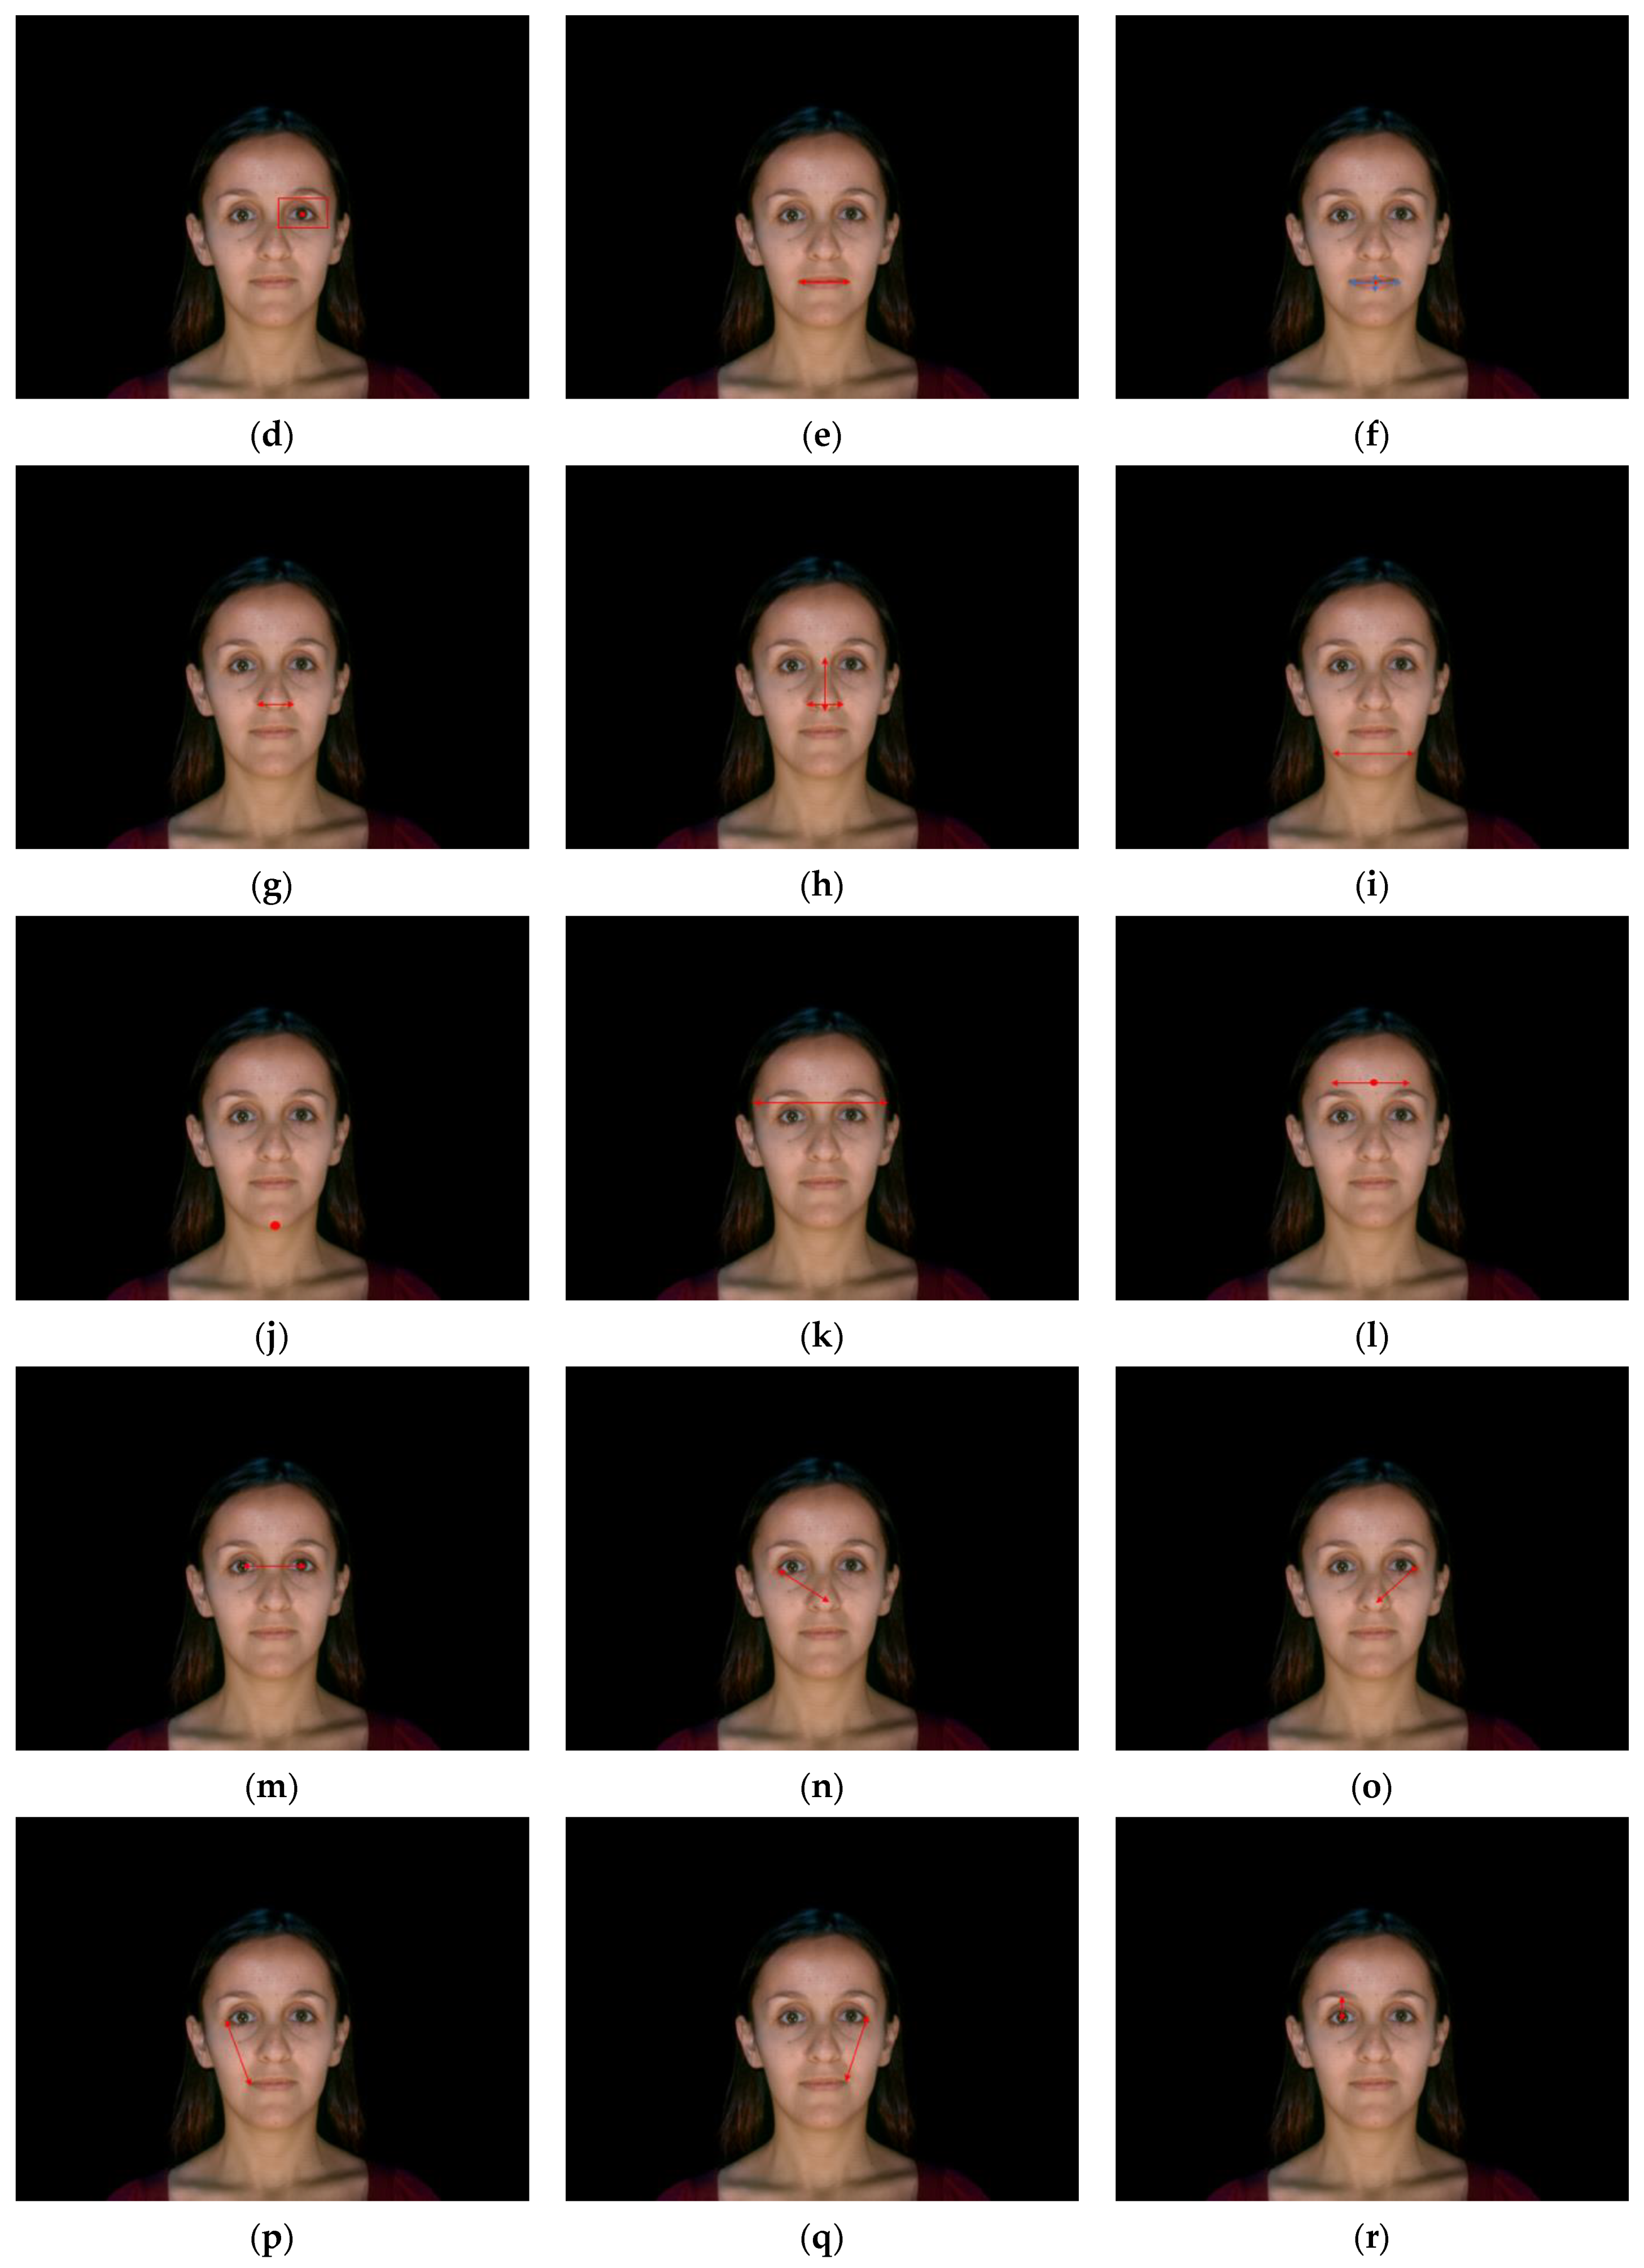
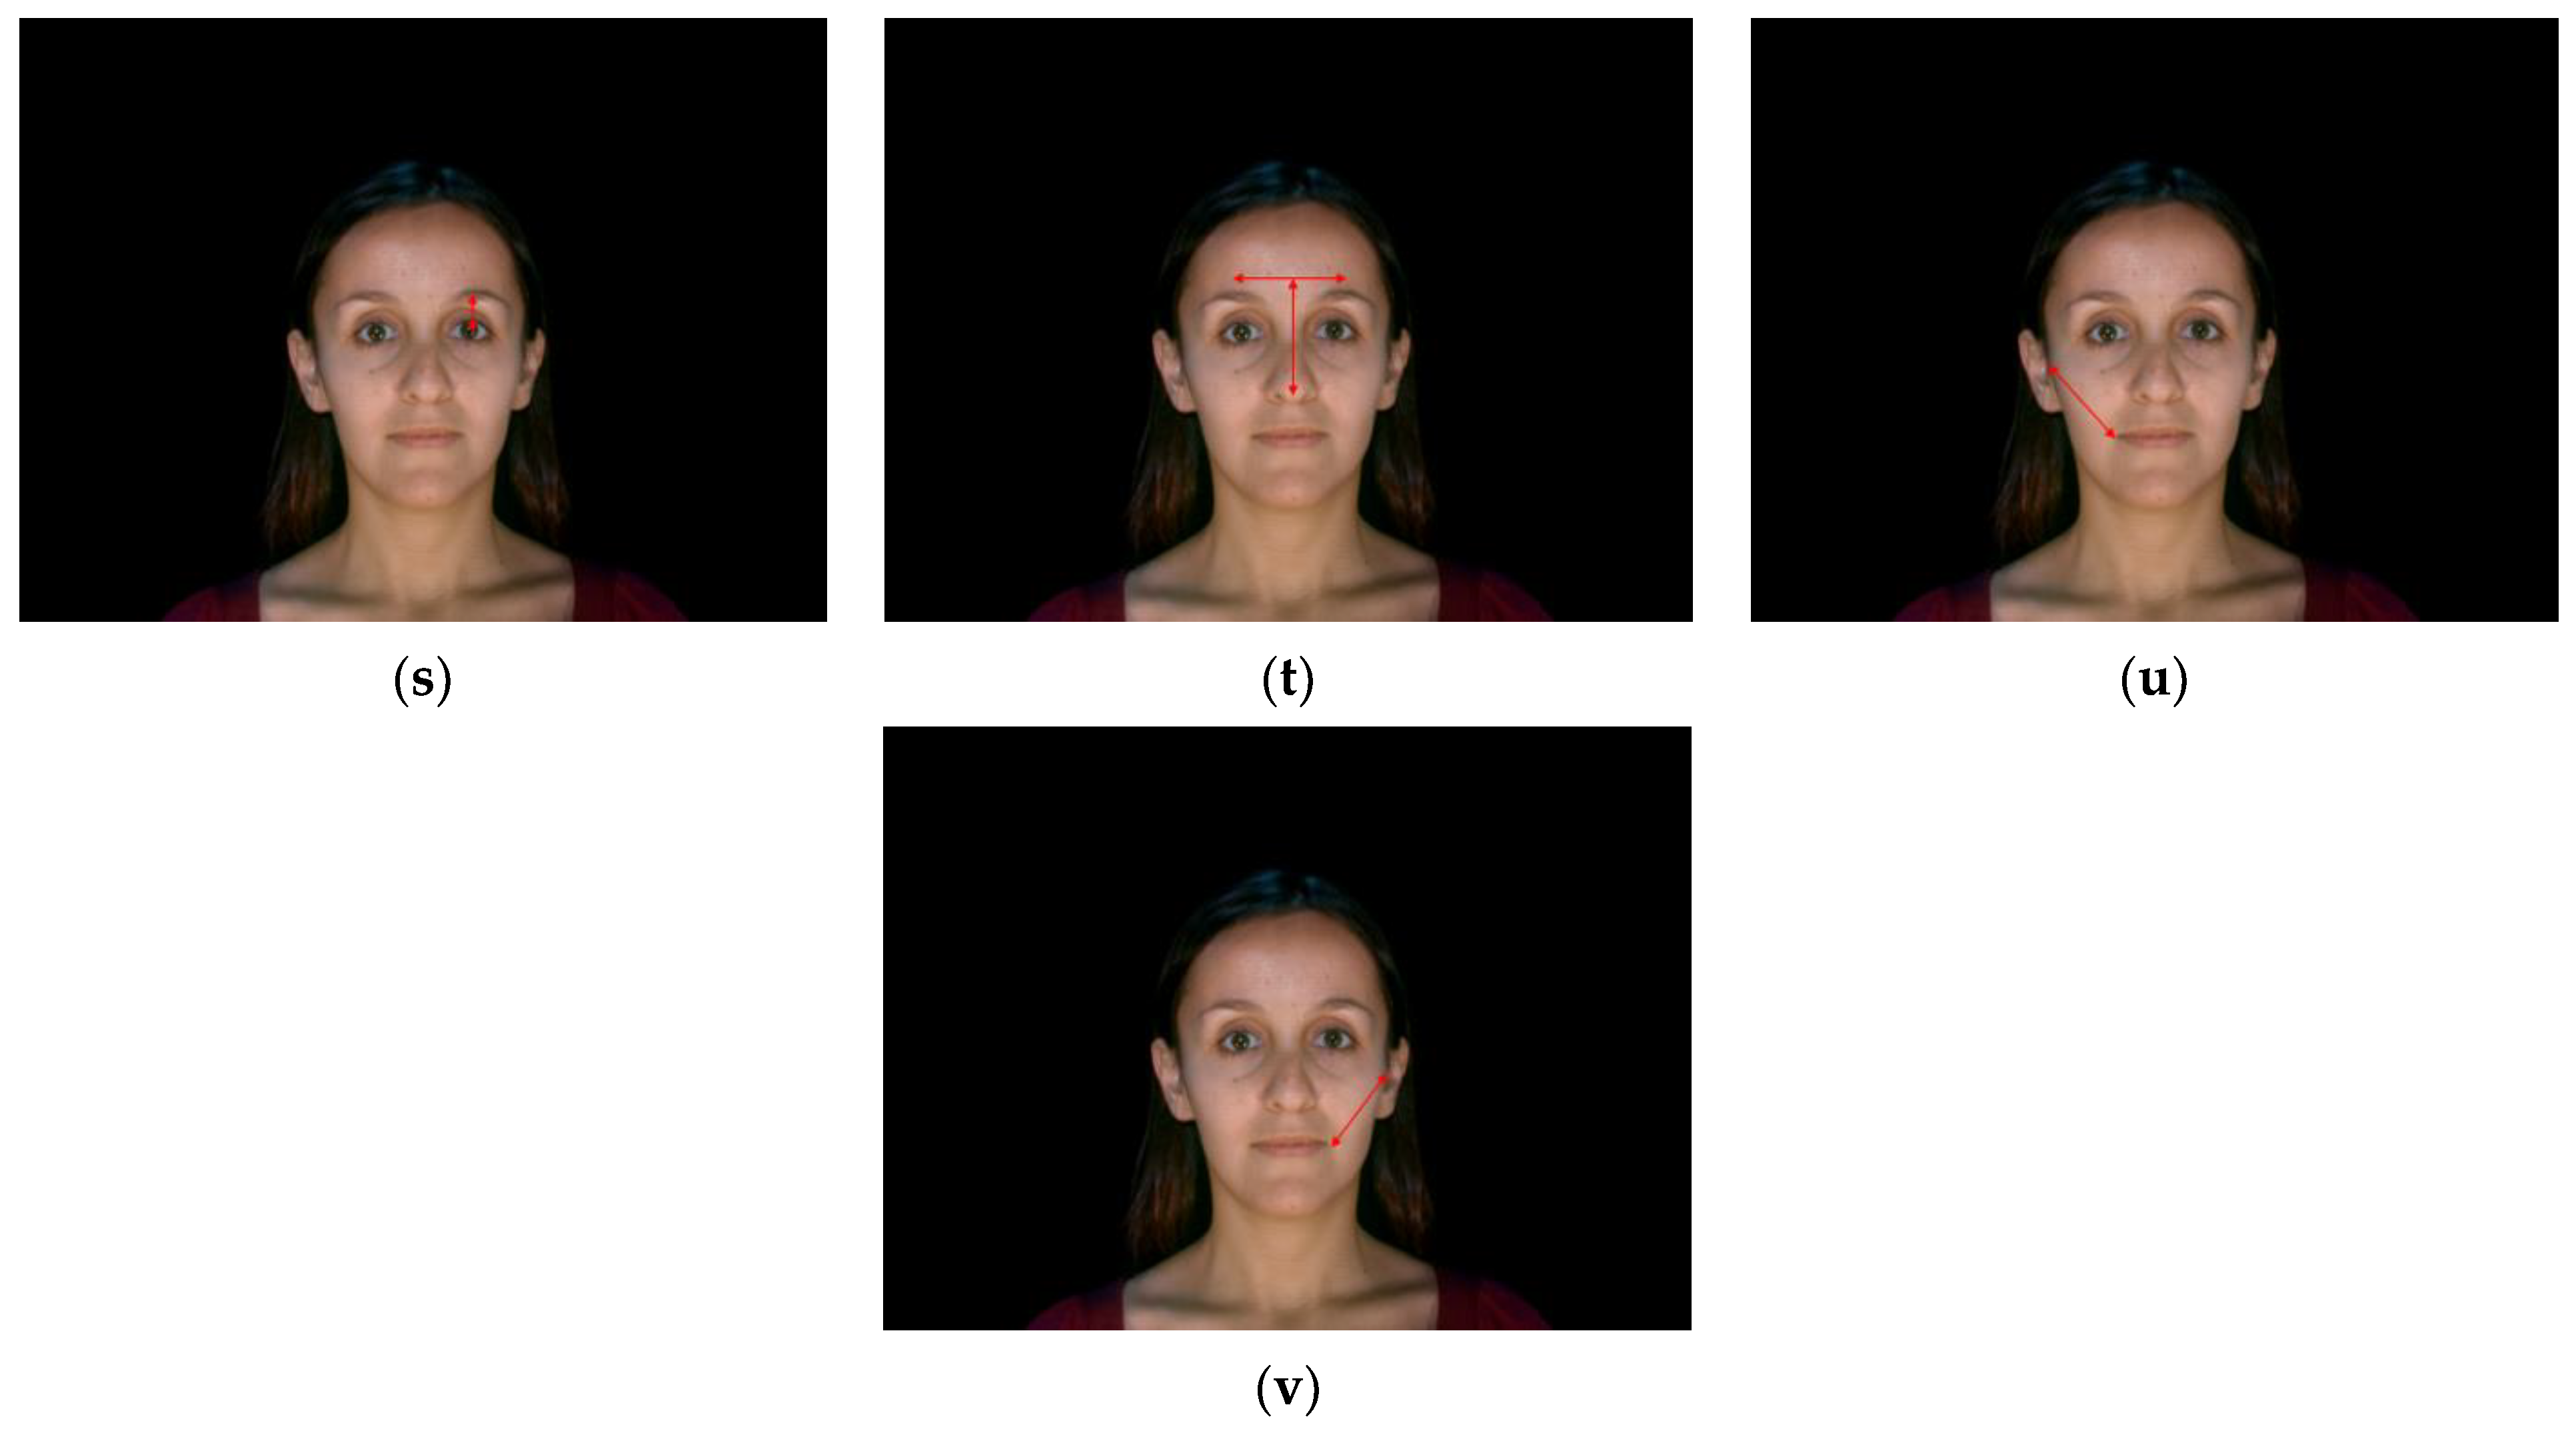
Figure 13.
Illustration of the 22 facial features: (a) left eye width; (b) right eye width; (c) left eye position; (d) right eye position; (e) mouth width; (f) mouth position; (g) nose width; (h) nose position; (i) chin width; (j) chin position; (k) forehead width; (l) forehead position; (m) distance between eyes; (n) distance between left eye and nose; (o) distance between right eye and nose; (p) distance between left eye and mouth; (q) distance between right eye and mouth; (r) distance between left eye and eyebrow; (s) distance between right eye and eyebrow; (t) distance between nose and forehead; (u) distance between left ear and mouth; (v) distance between right ear and mouth.
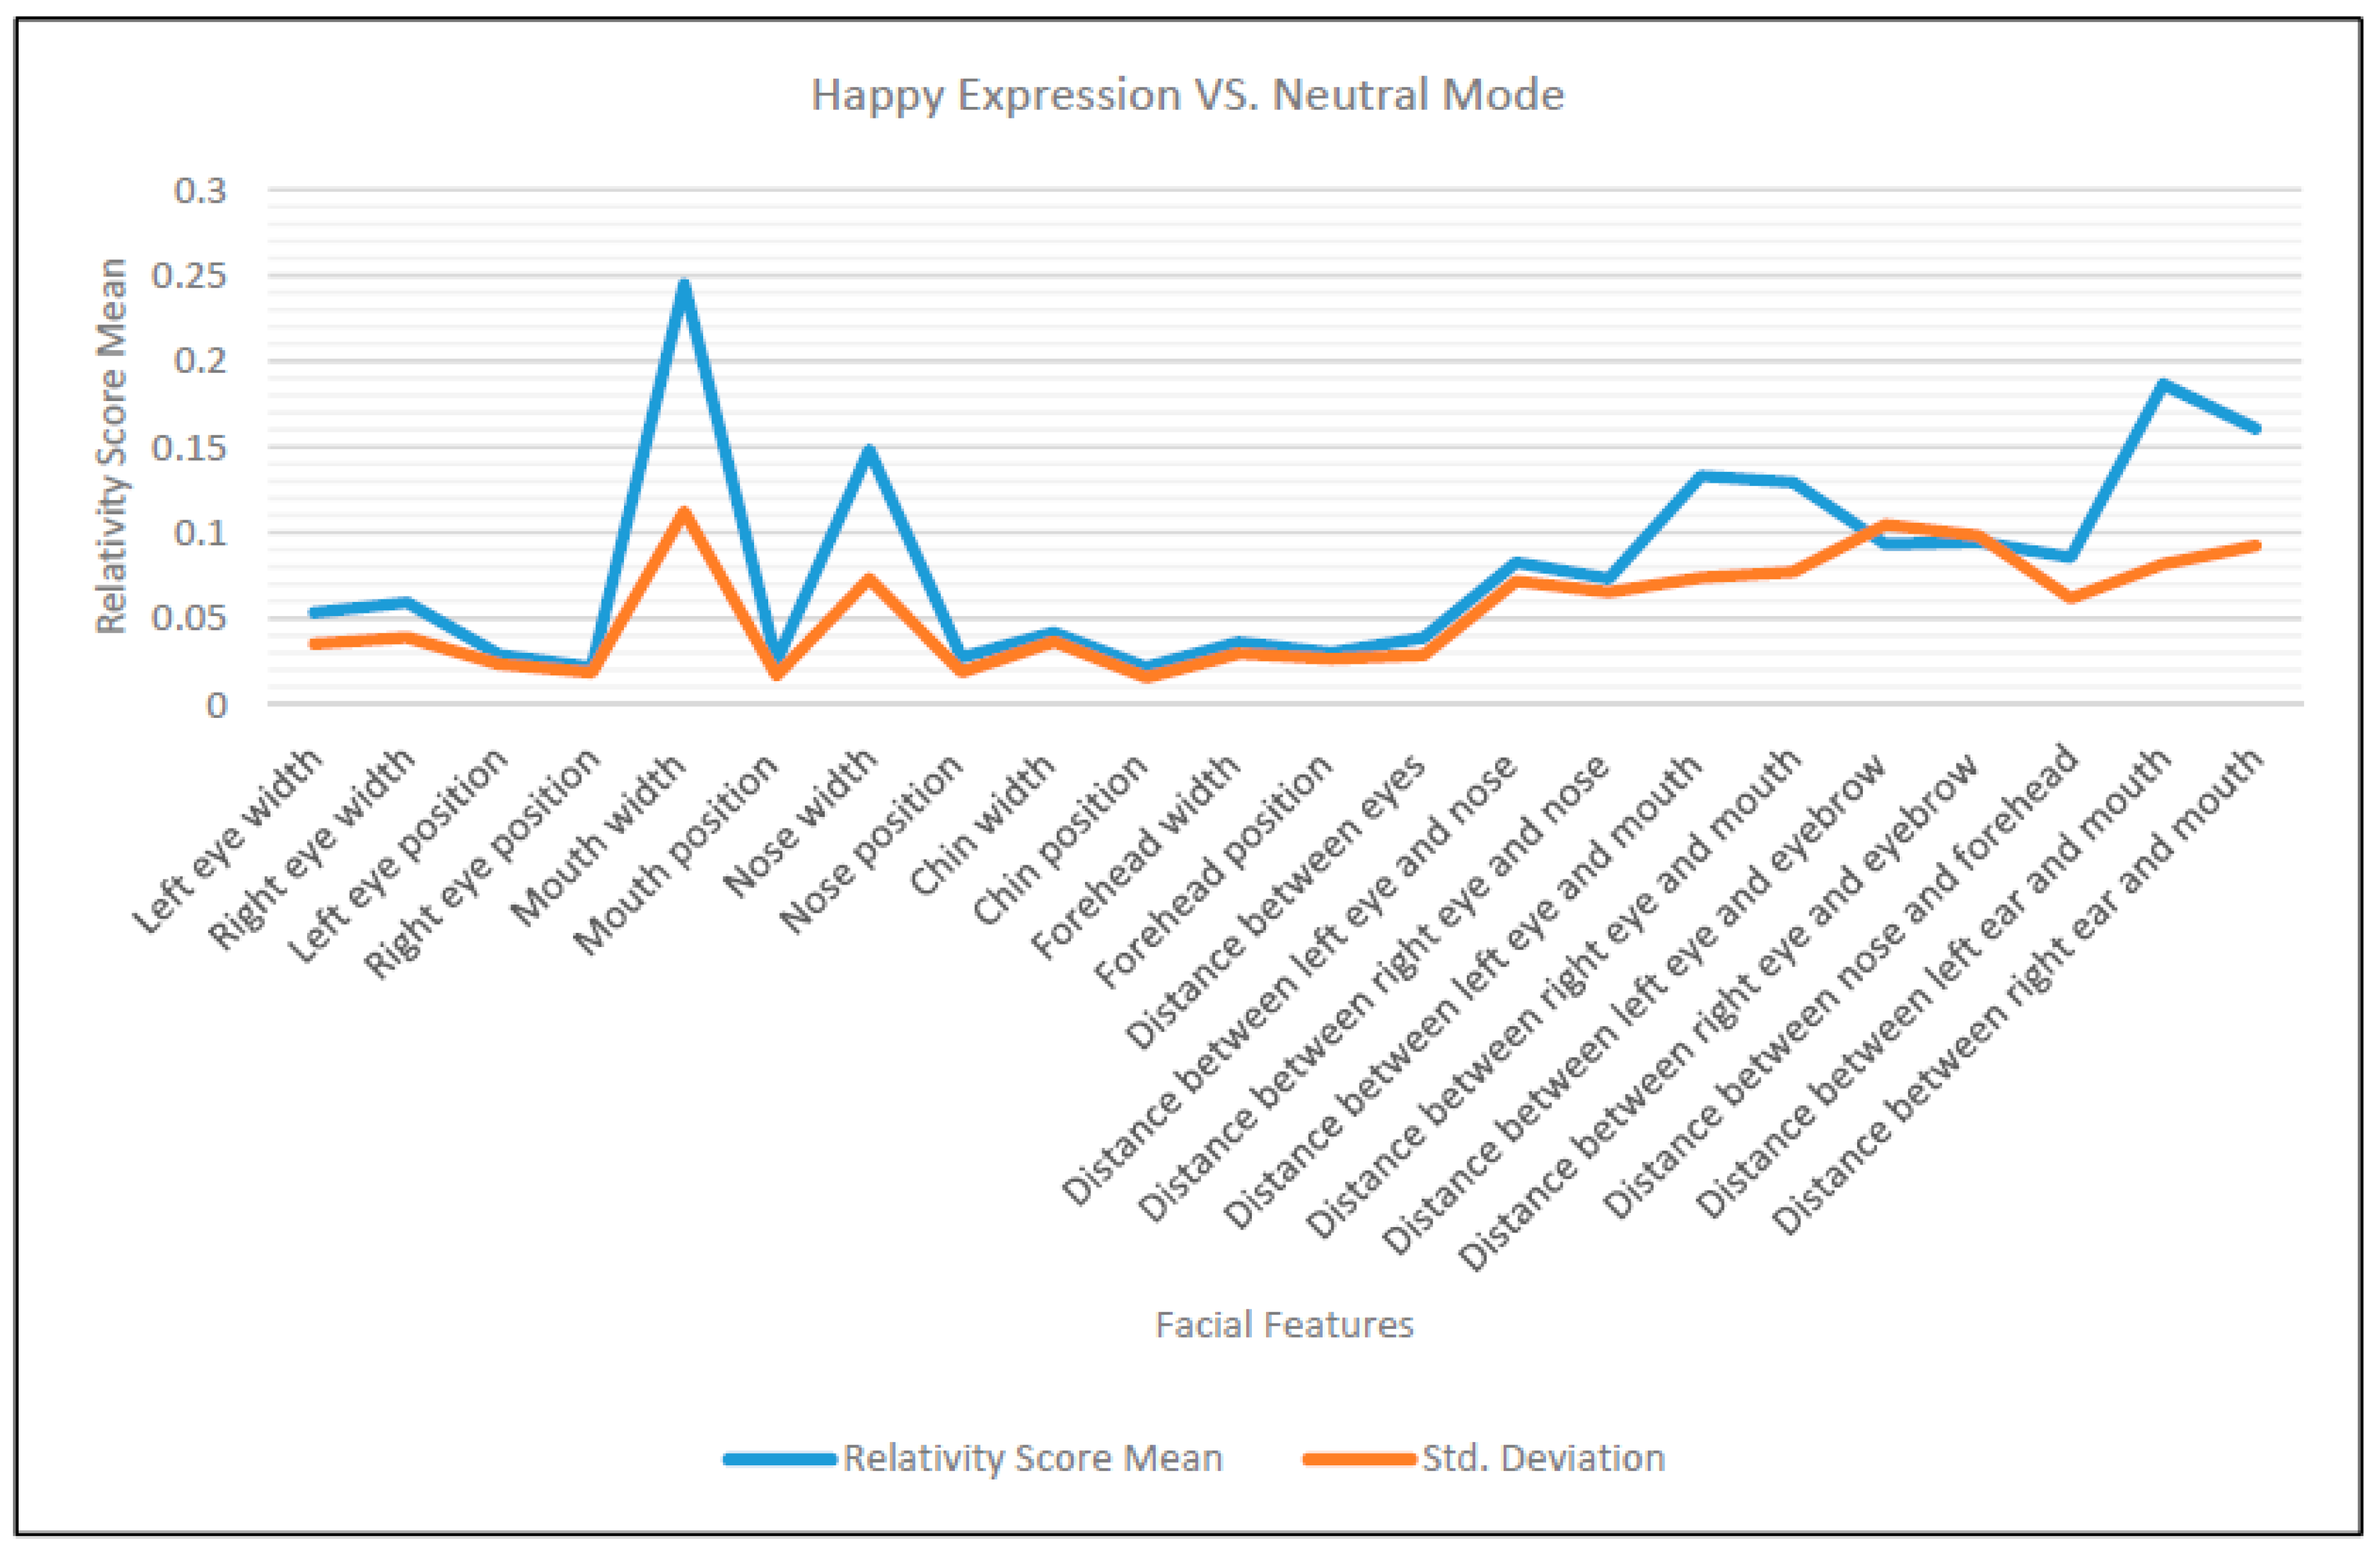
Figure 14.
The means of RSS between happy expression and neutral mode of facial features for 36 subjects.
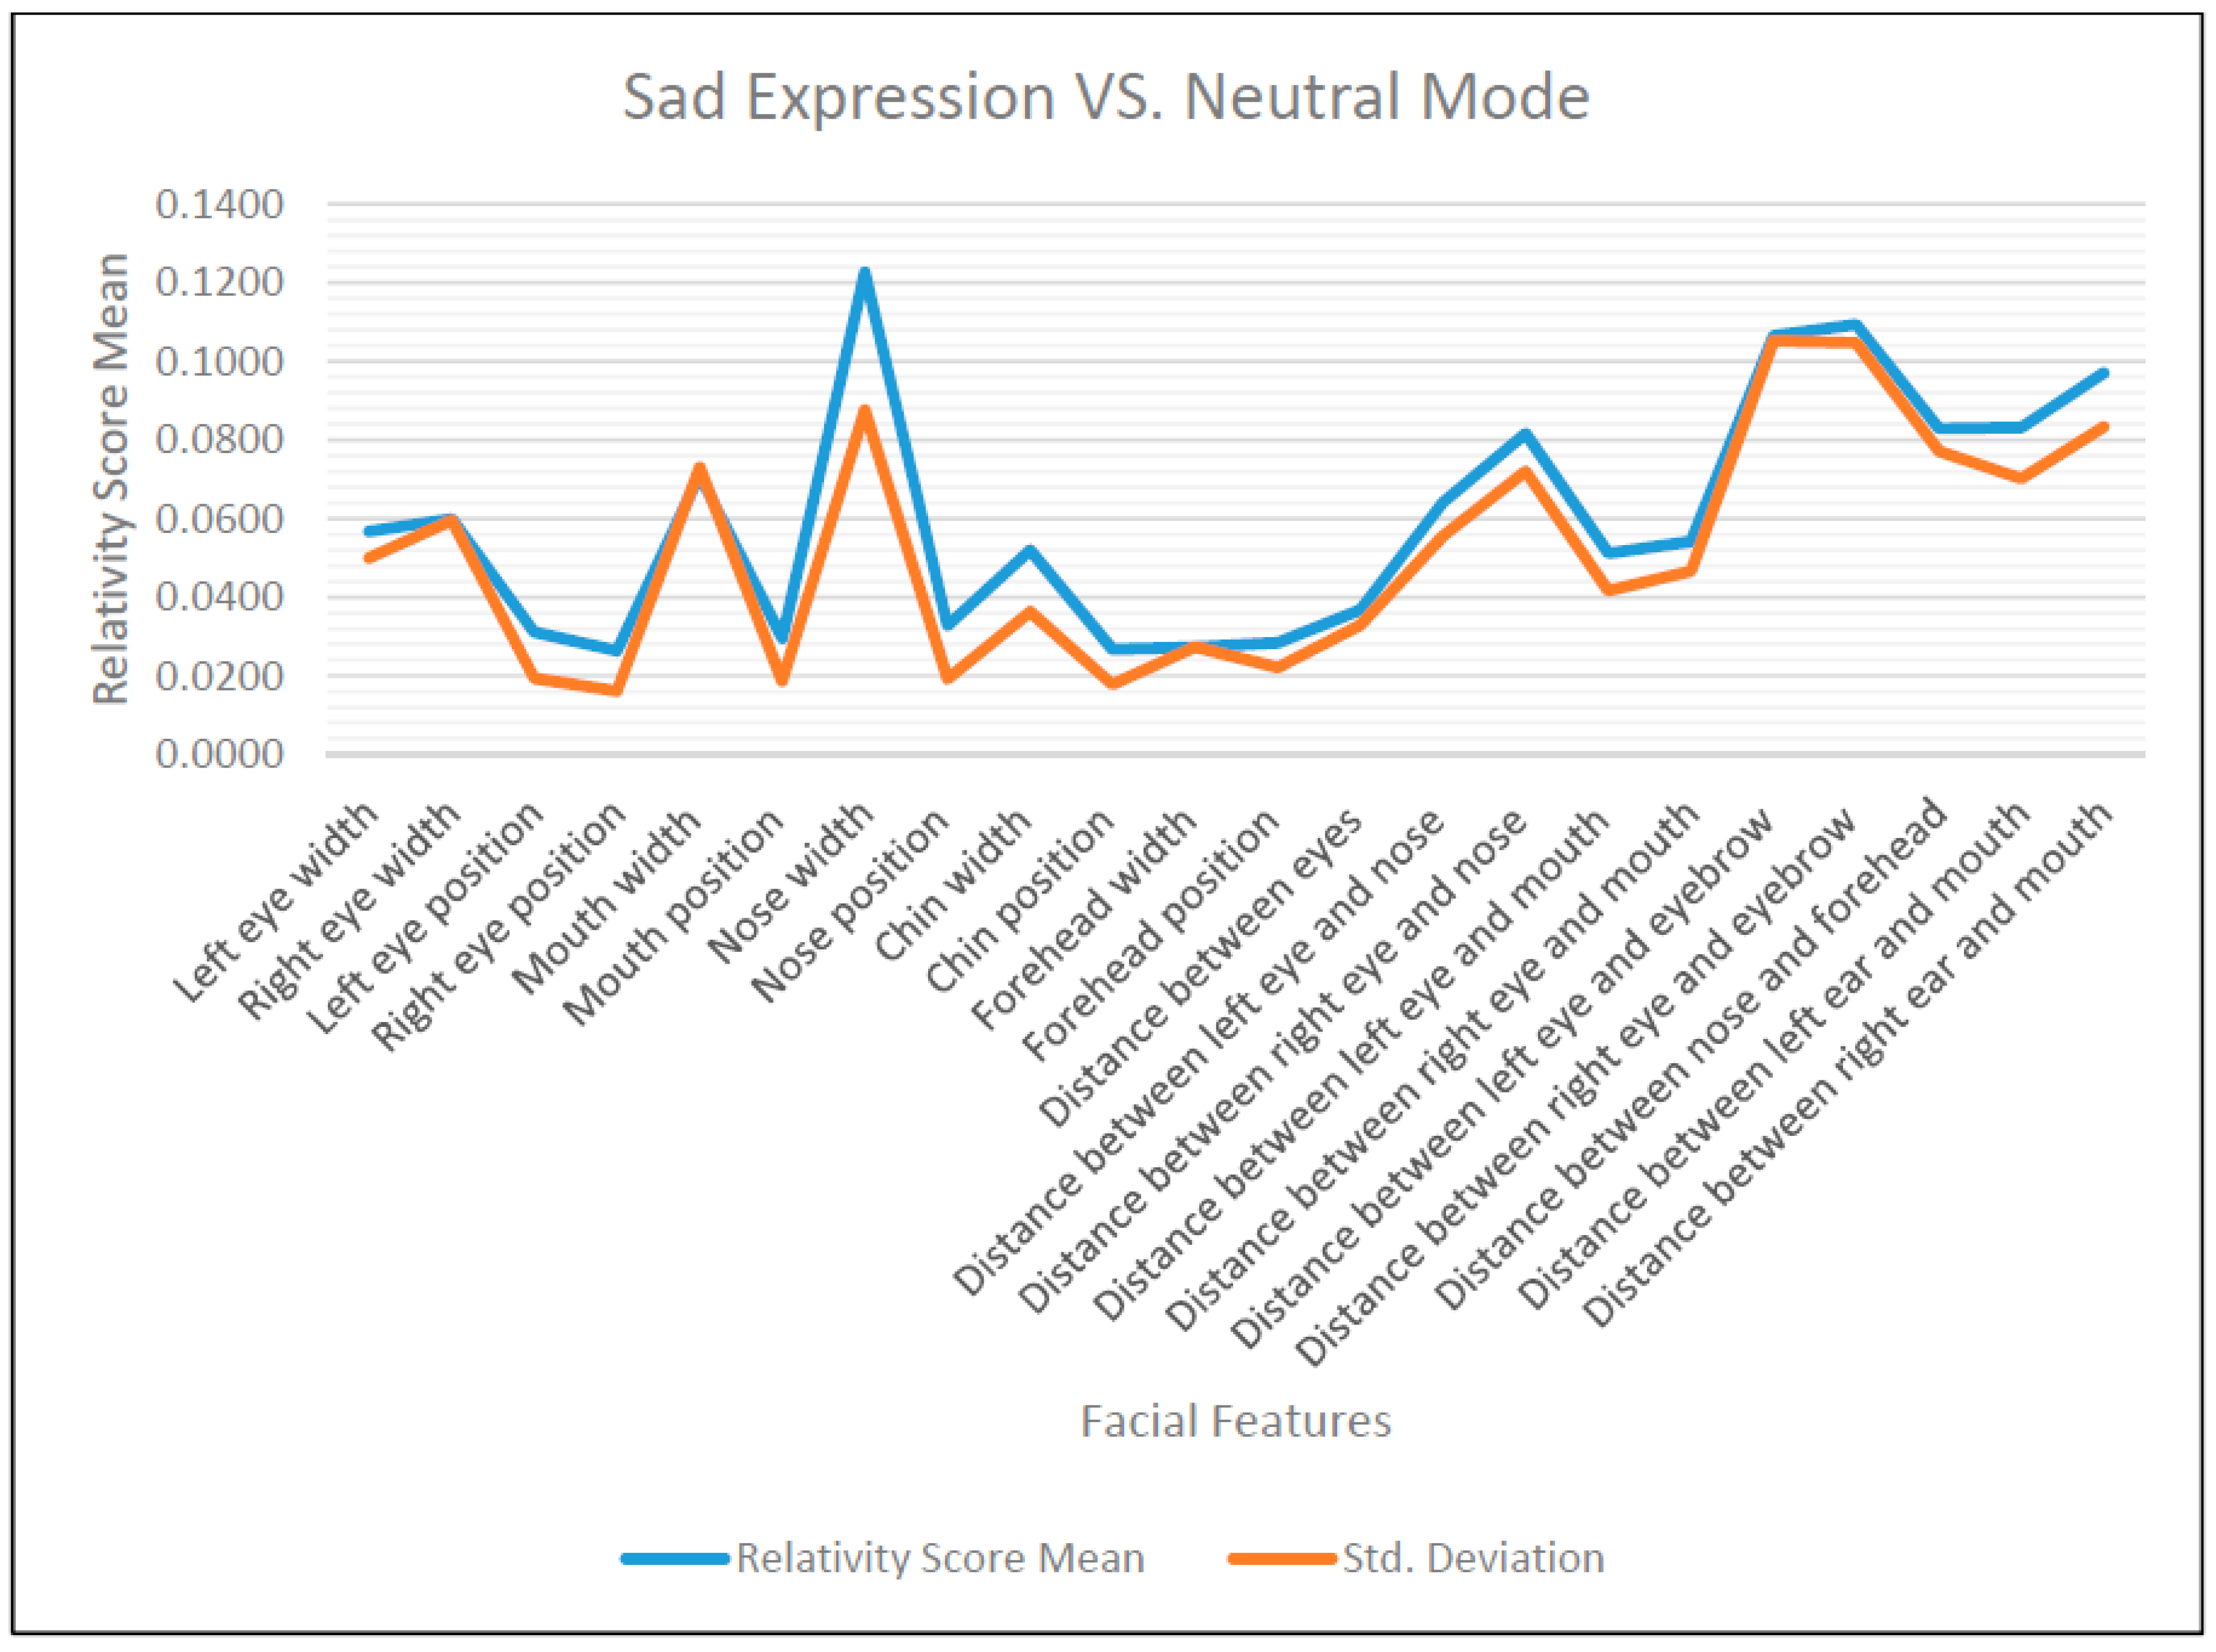
Figure 15.
The means of RSS between sad expression and neutral mode of facial features for 36 subjects.
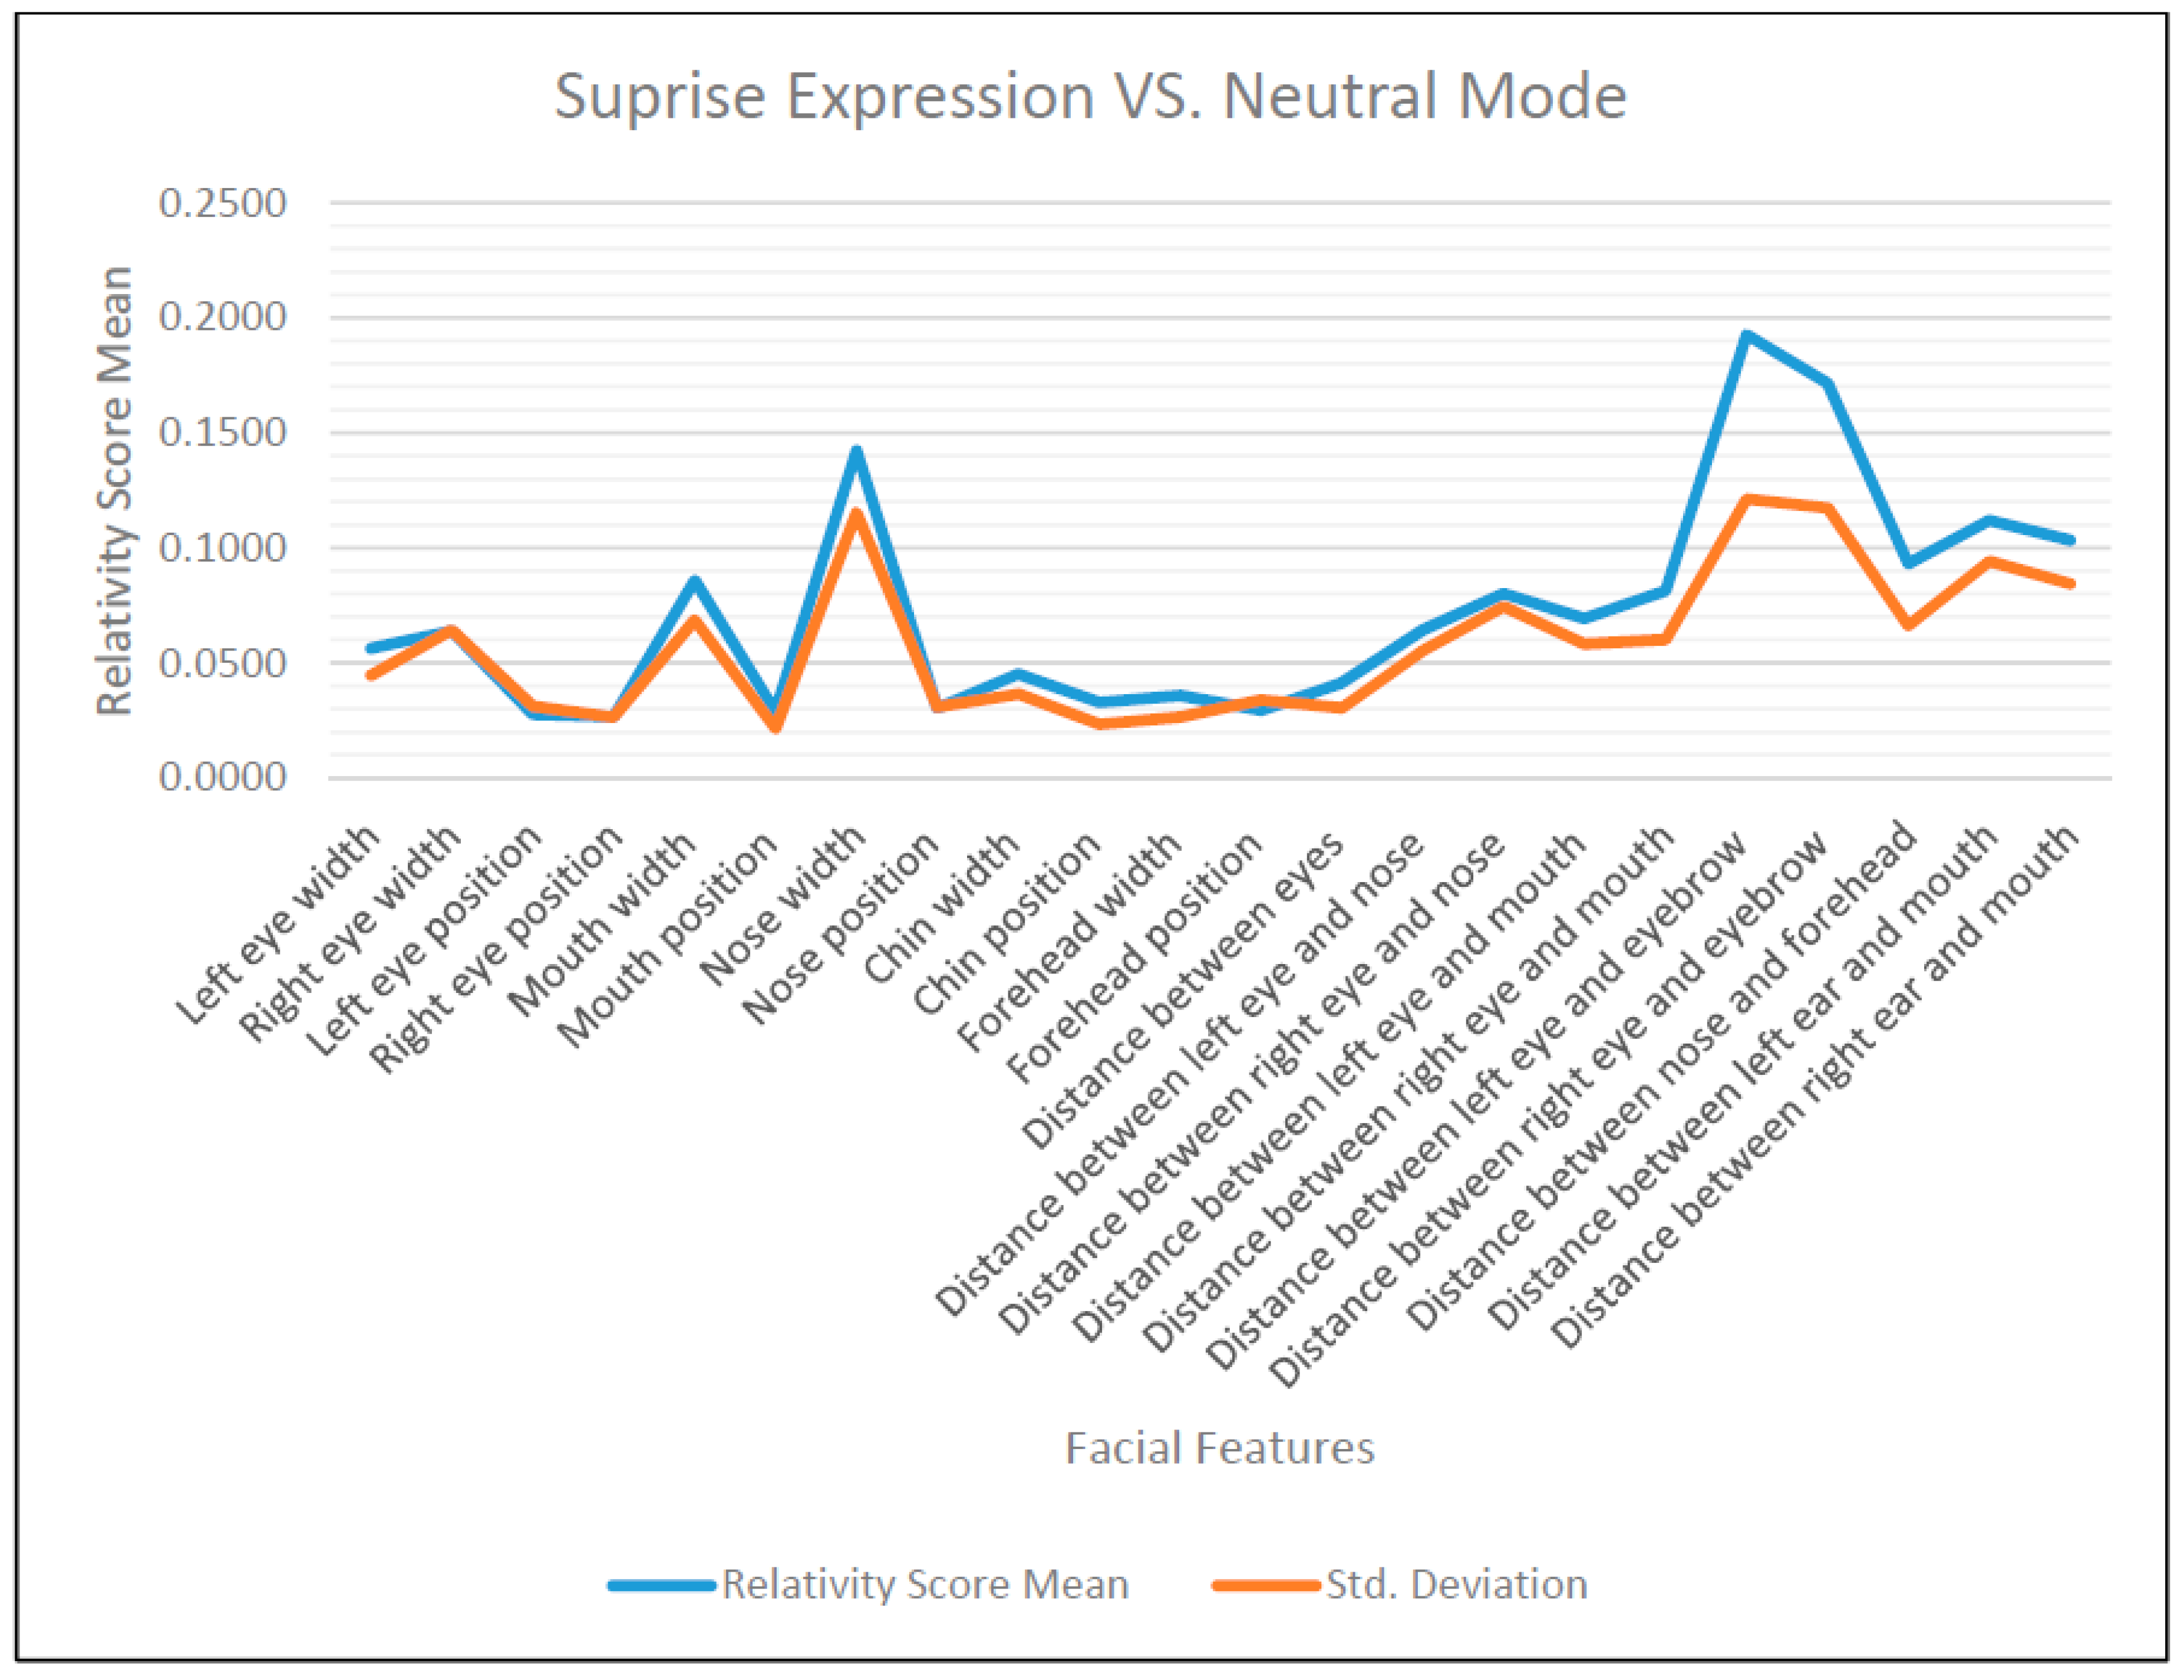
Figure 16.
The means of RSS between surprise expression and neutral mode of facial features for 36 subjects.
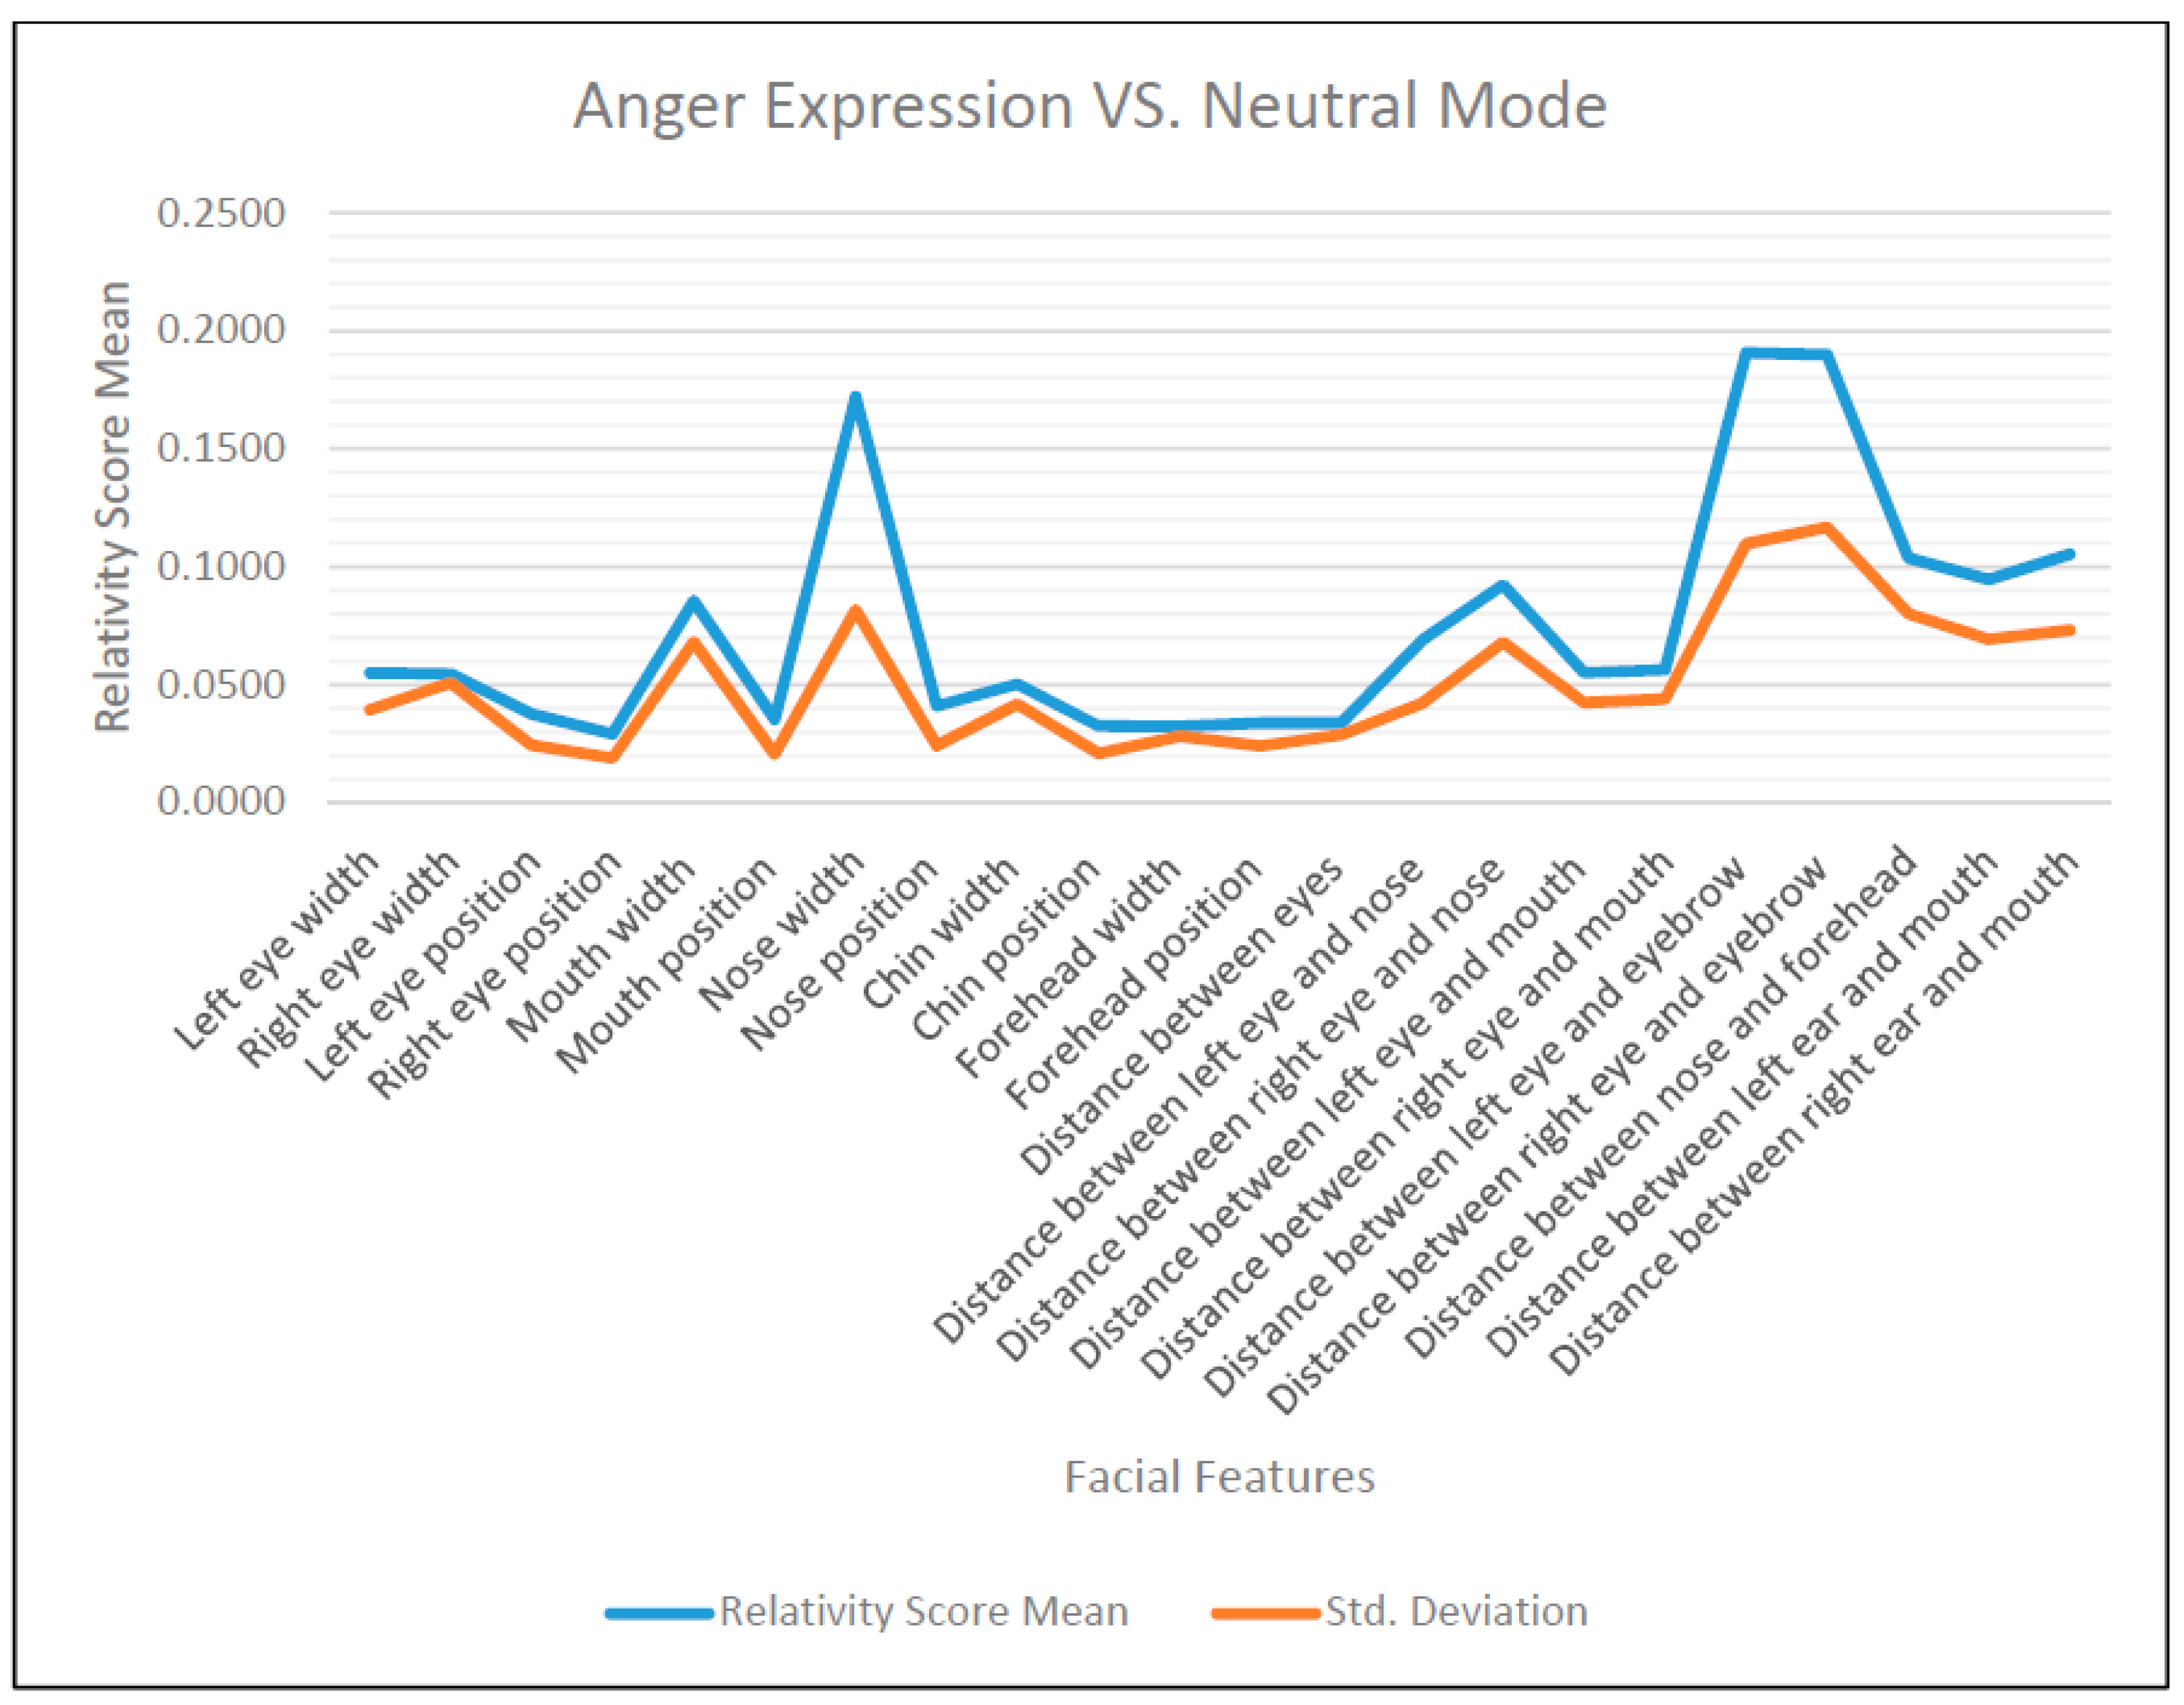
Figure 17.
The means of RSS between anger expression and neutral mode of facial features for 36 subjects.
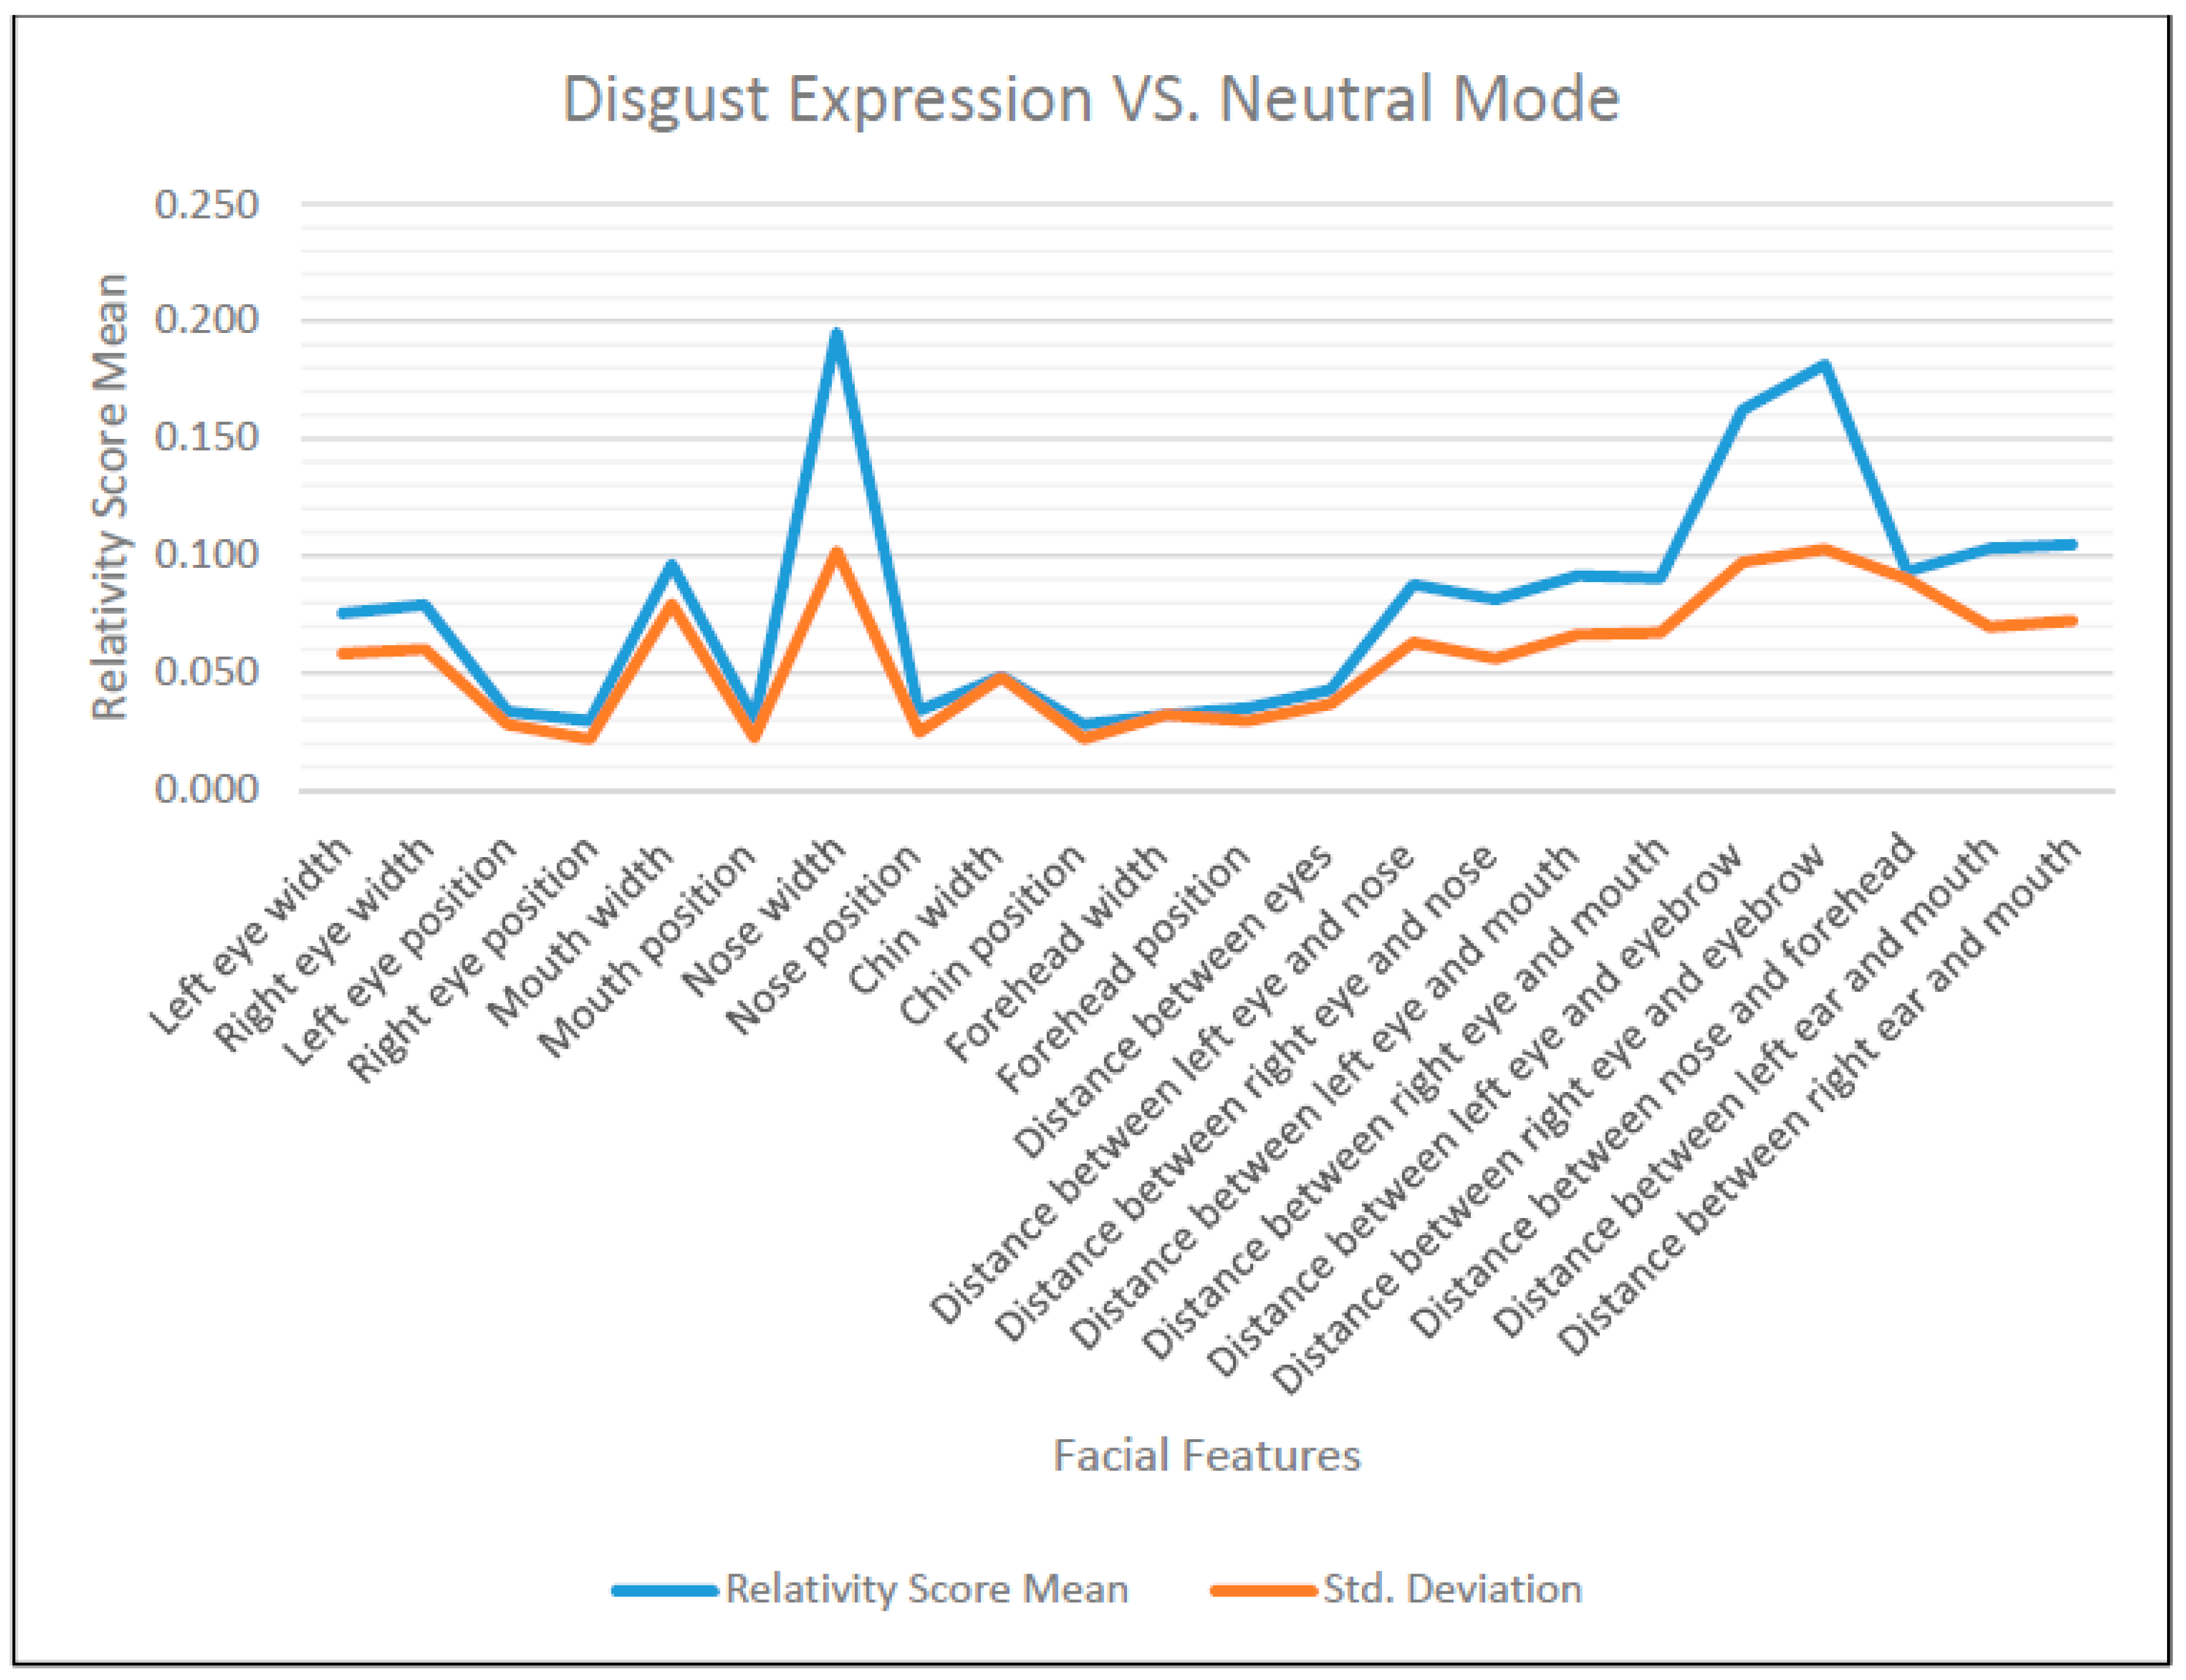
Figure 18.
The means of RSS between disgust expression and neutral mode of facial features for 36 subjects.
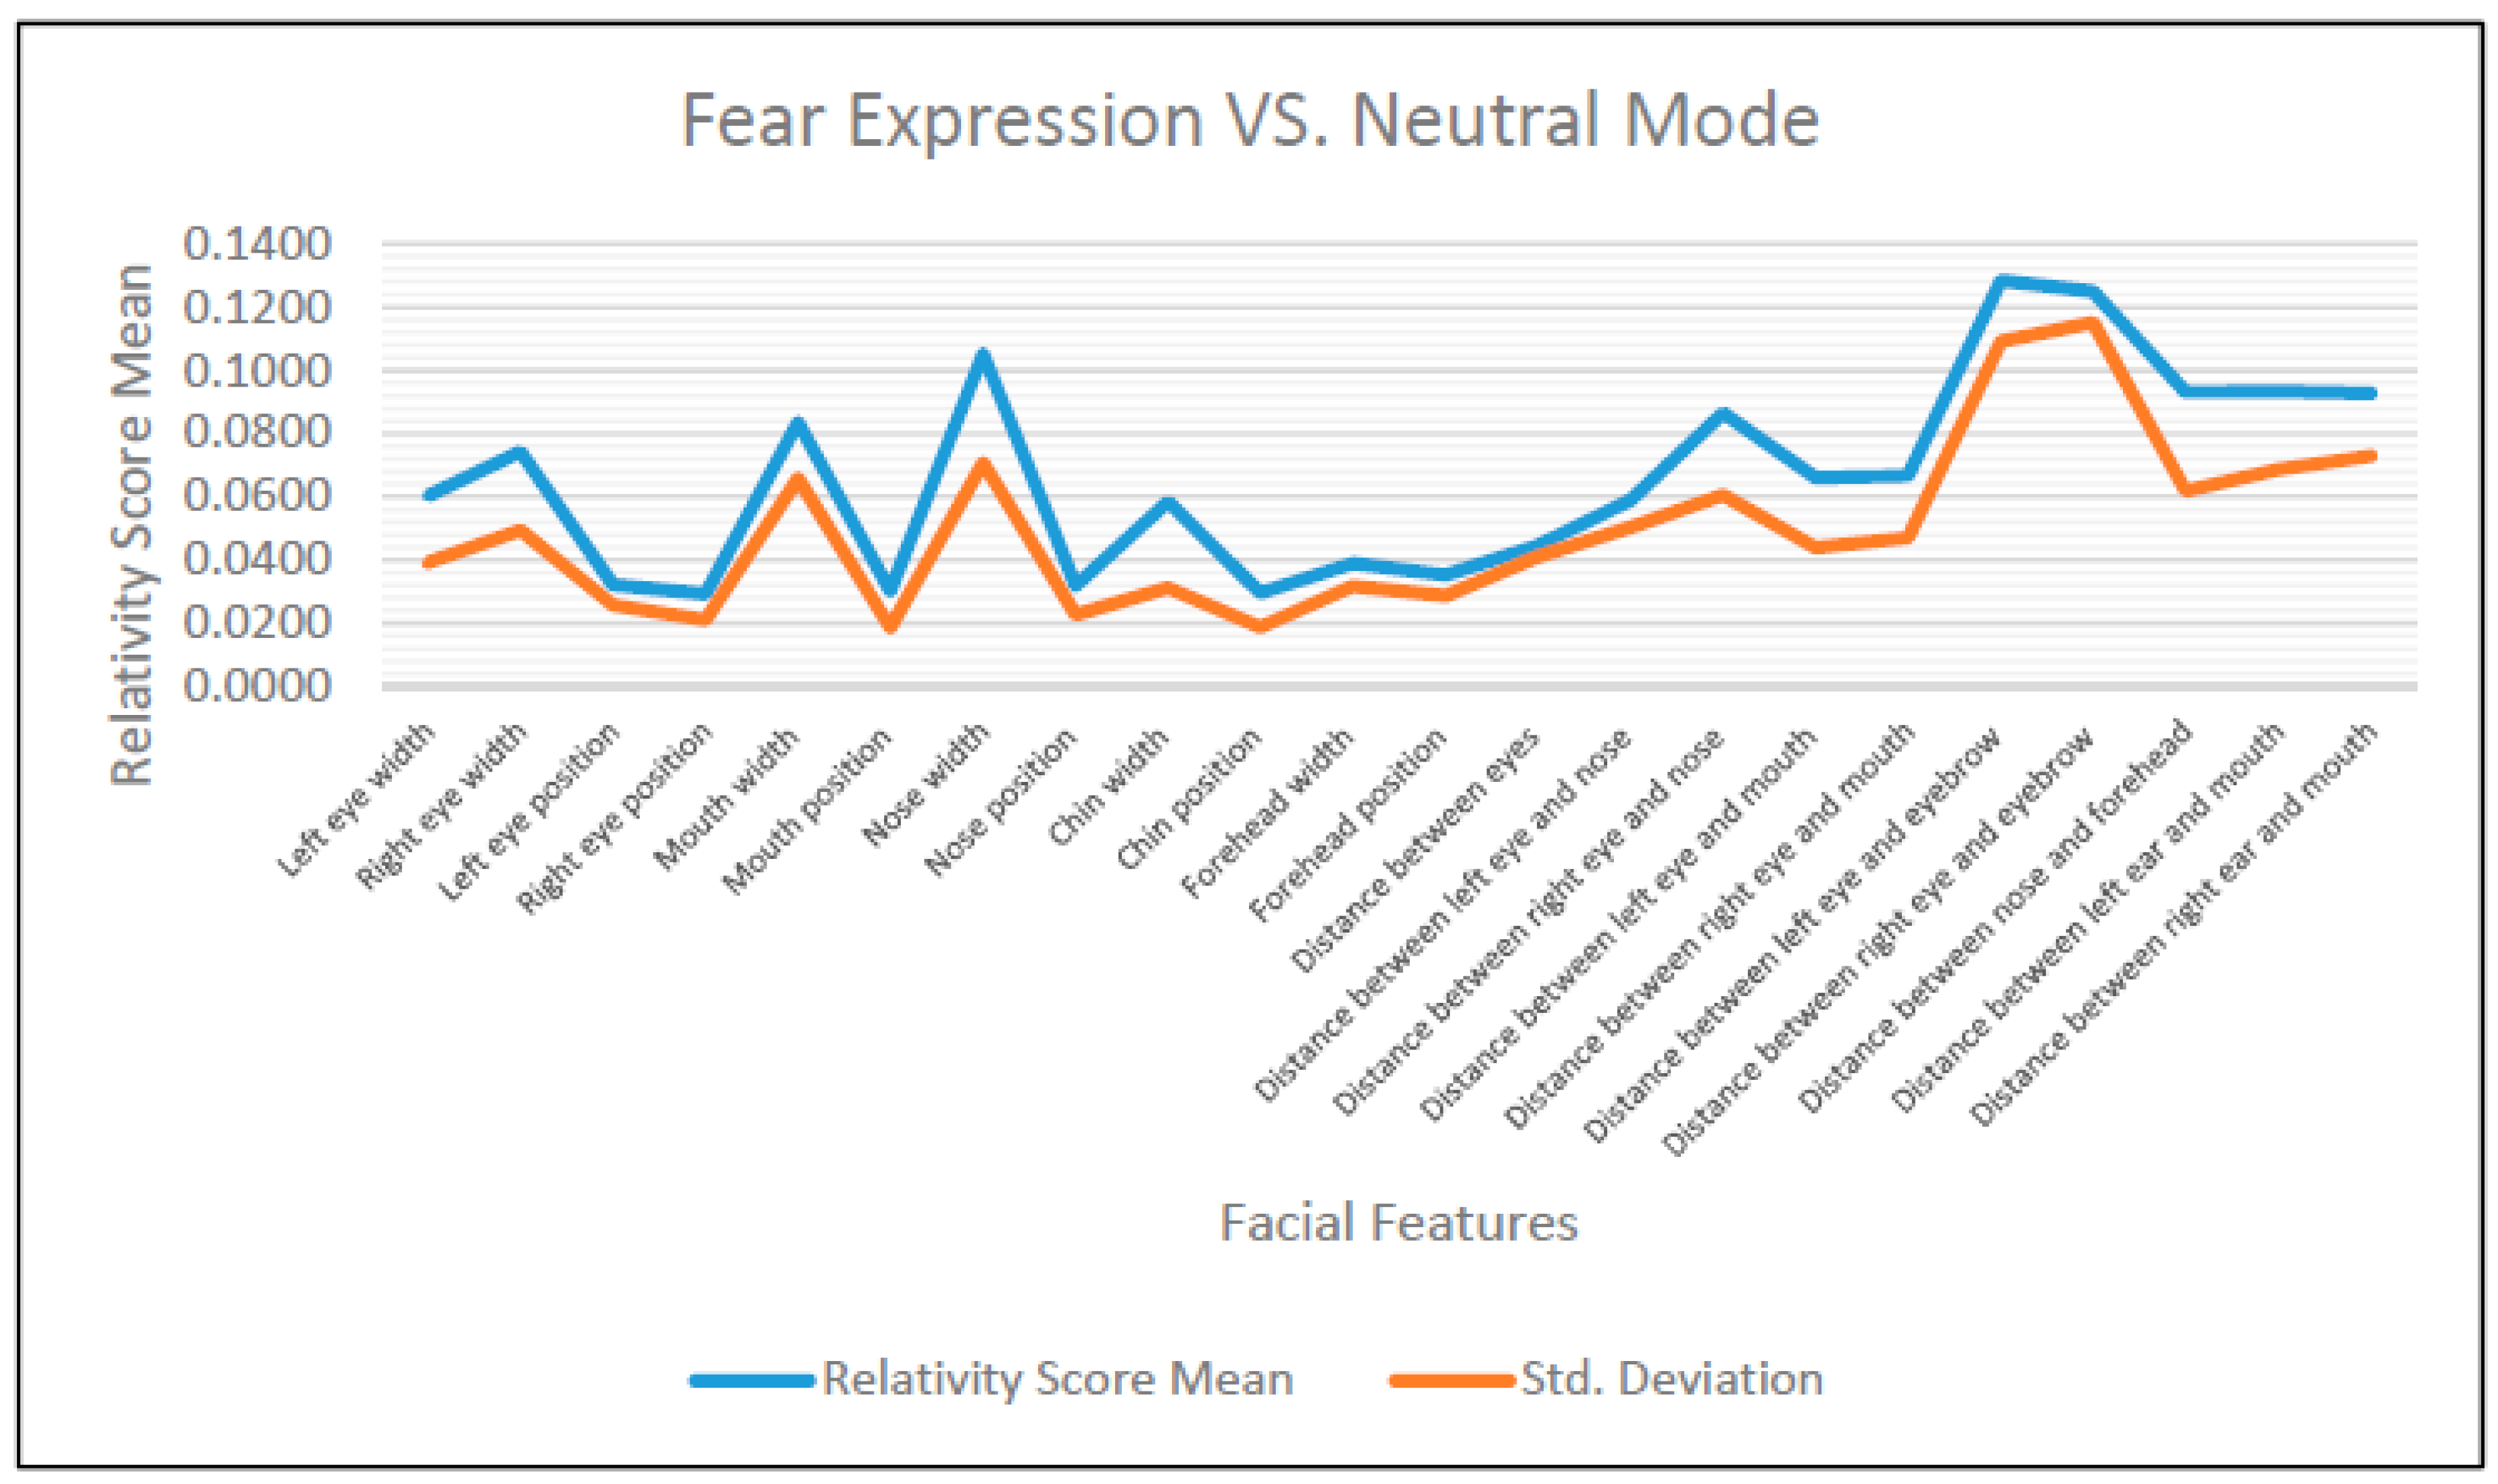
Figure 19.
The means RSS between fear expression and neutral mode of 22 facial features for 36 subjects.
Figure 20.
The similarity score (SS) for all six-expression using all features, top five, top ten, worst ten.
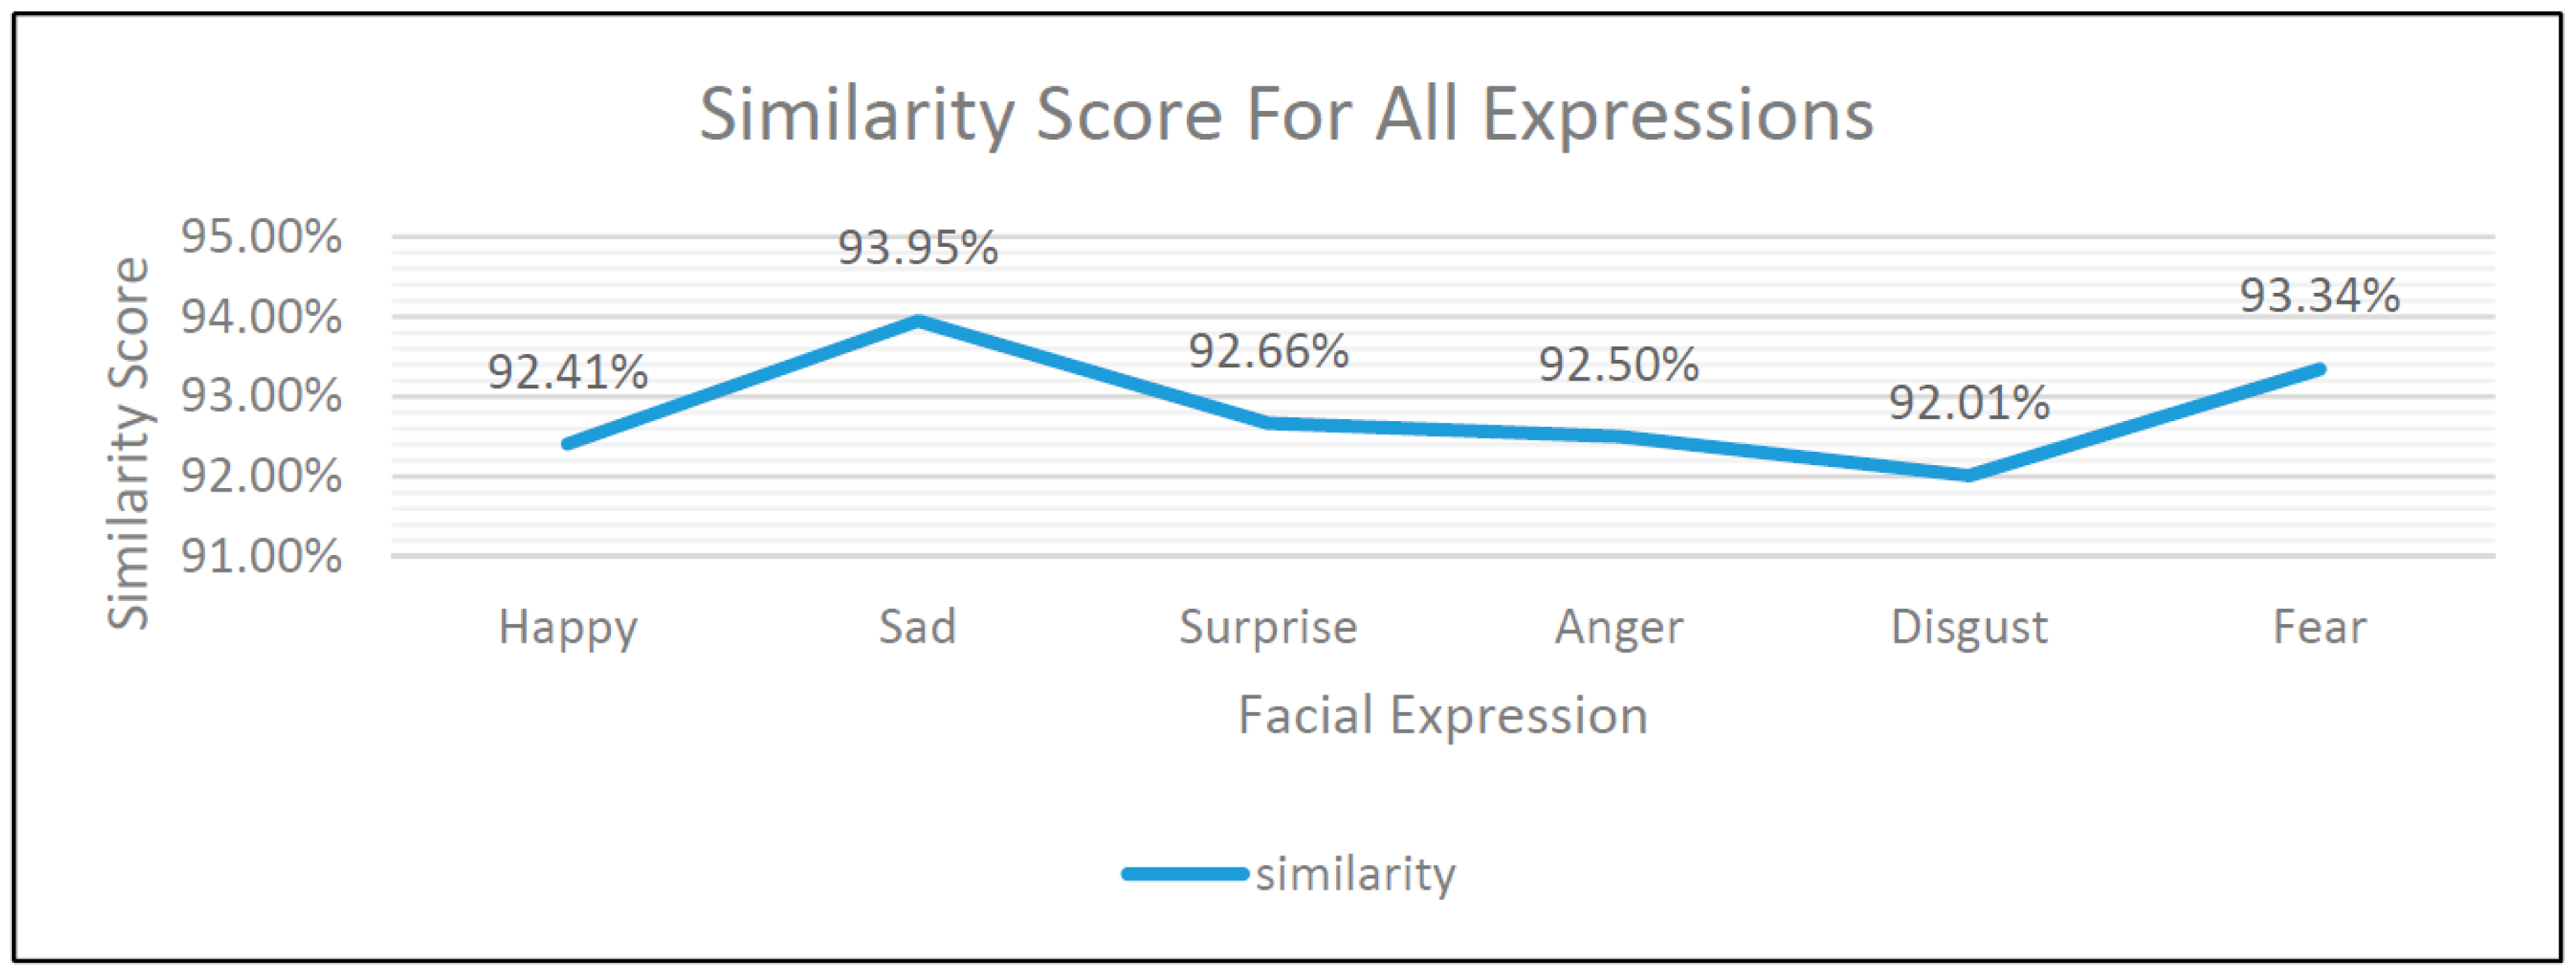
Figure 21.
SS means plot of the 6 FE of 36 subjects in comparison to the neutral mode.
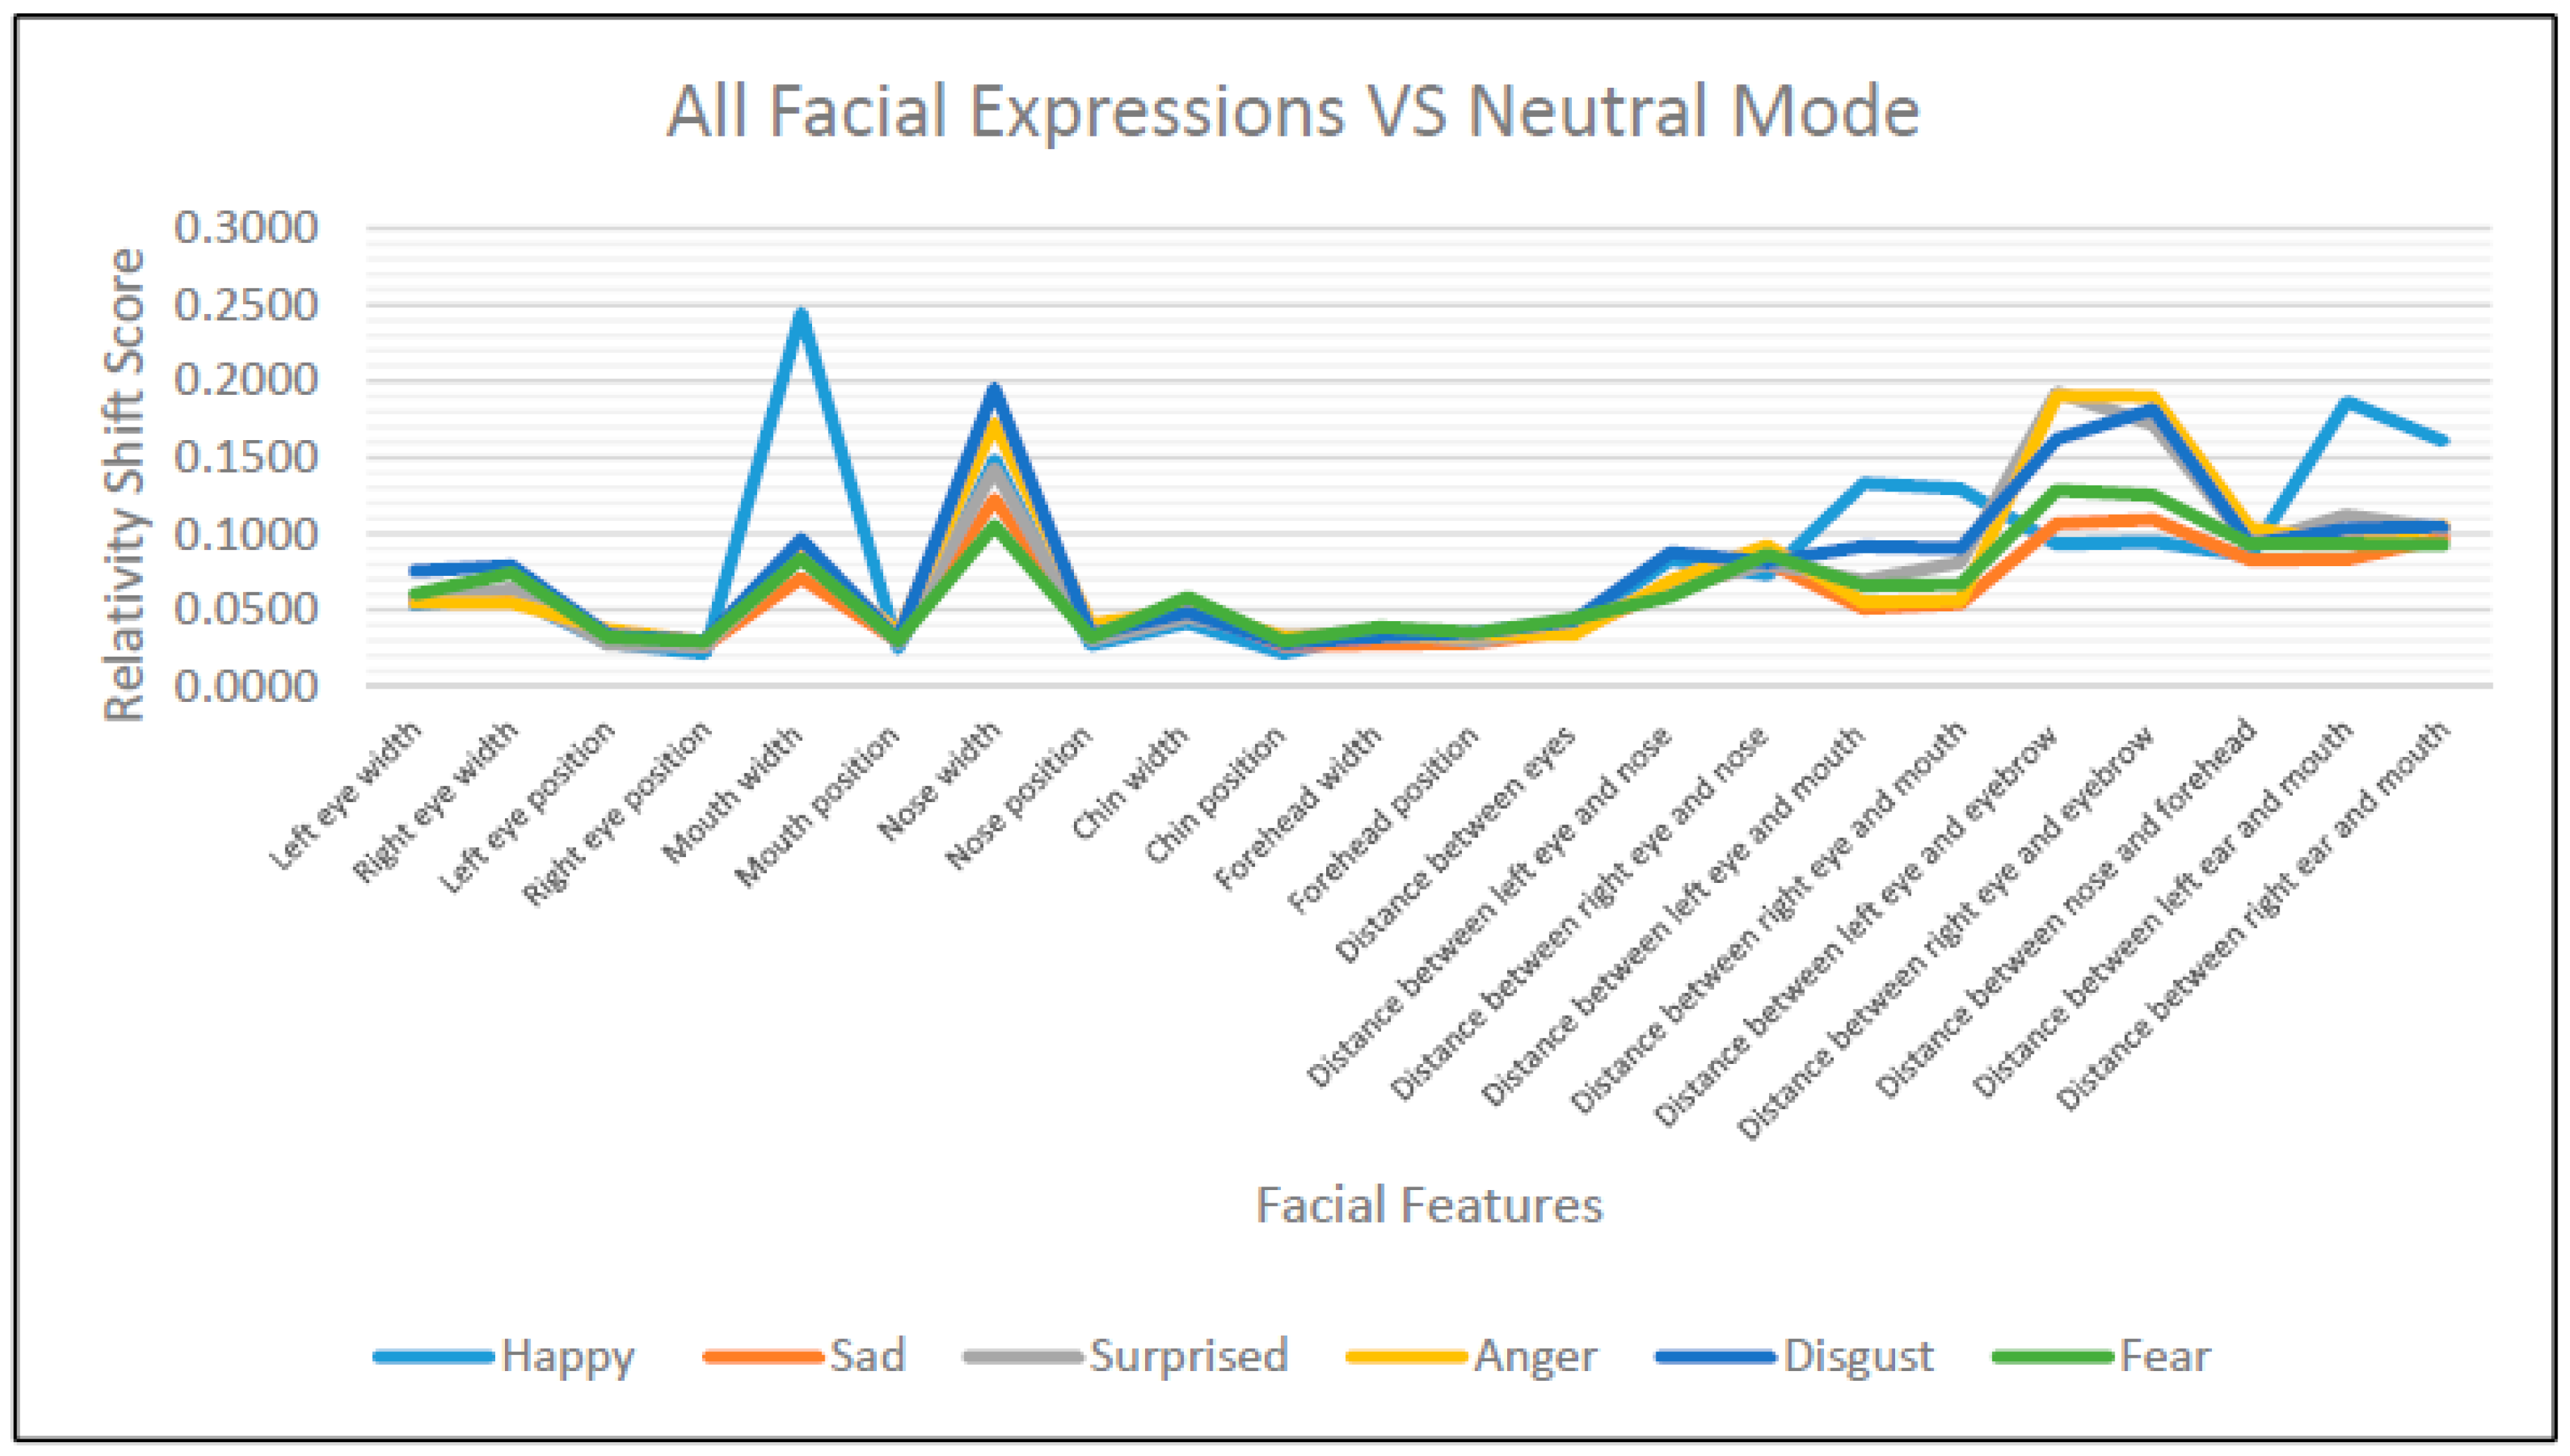
Figure 22.
The mean of RSS of 22 facial features for 36 subjects on all expressions.
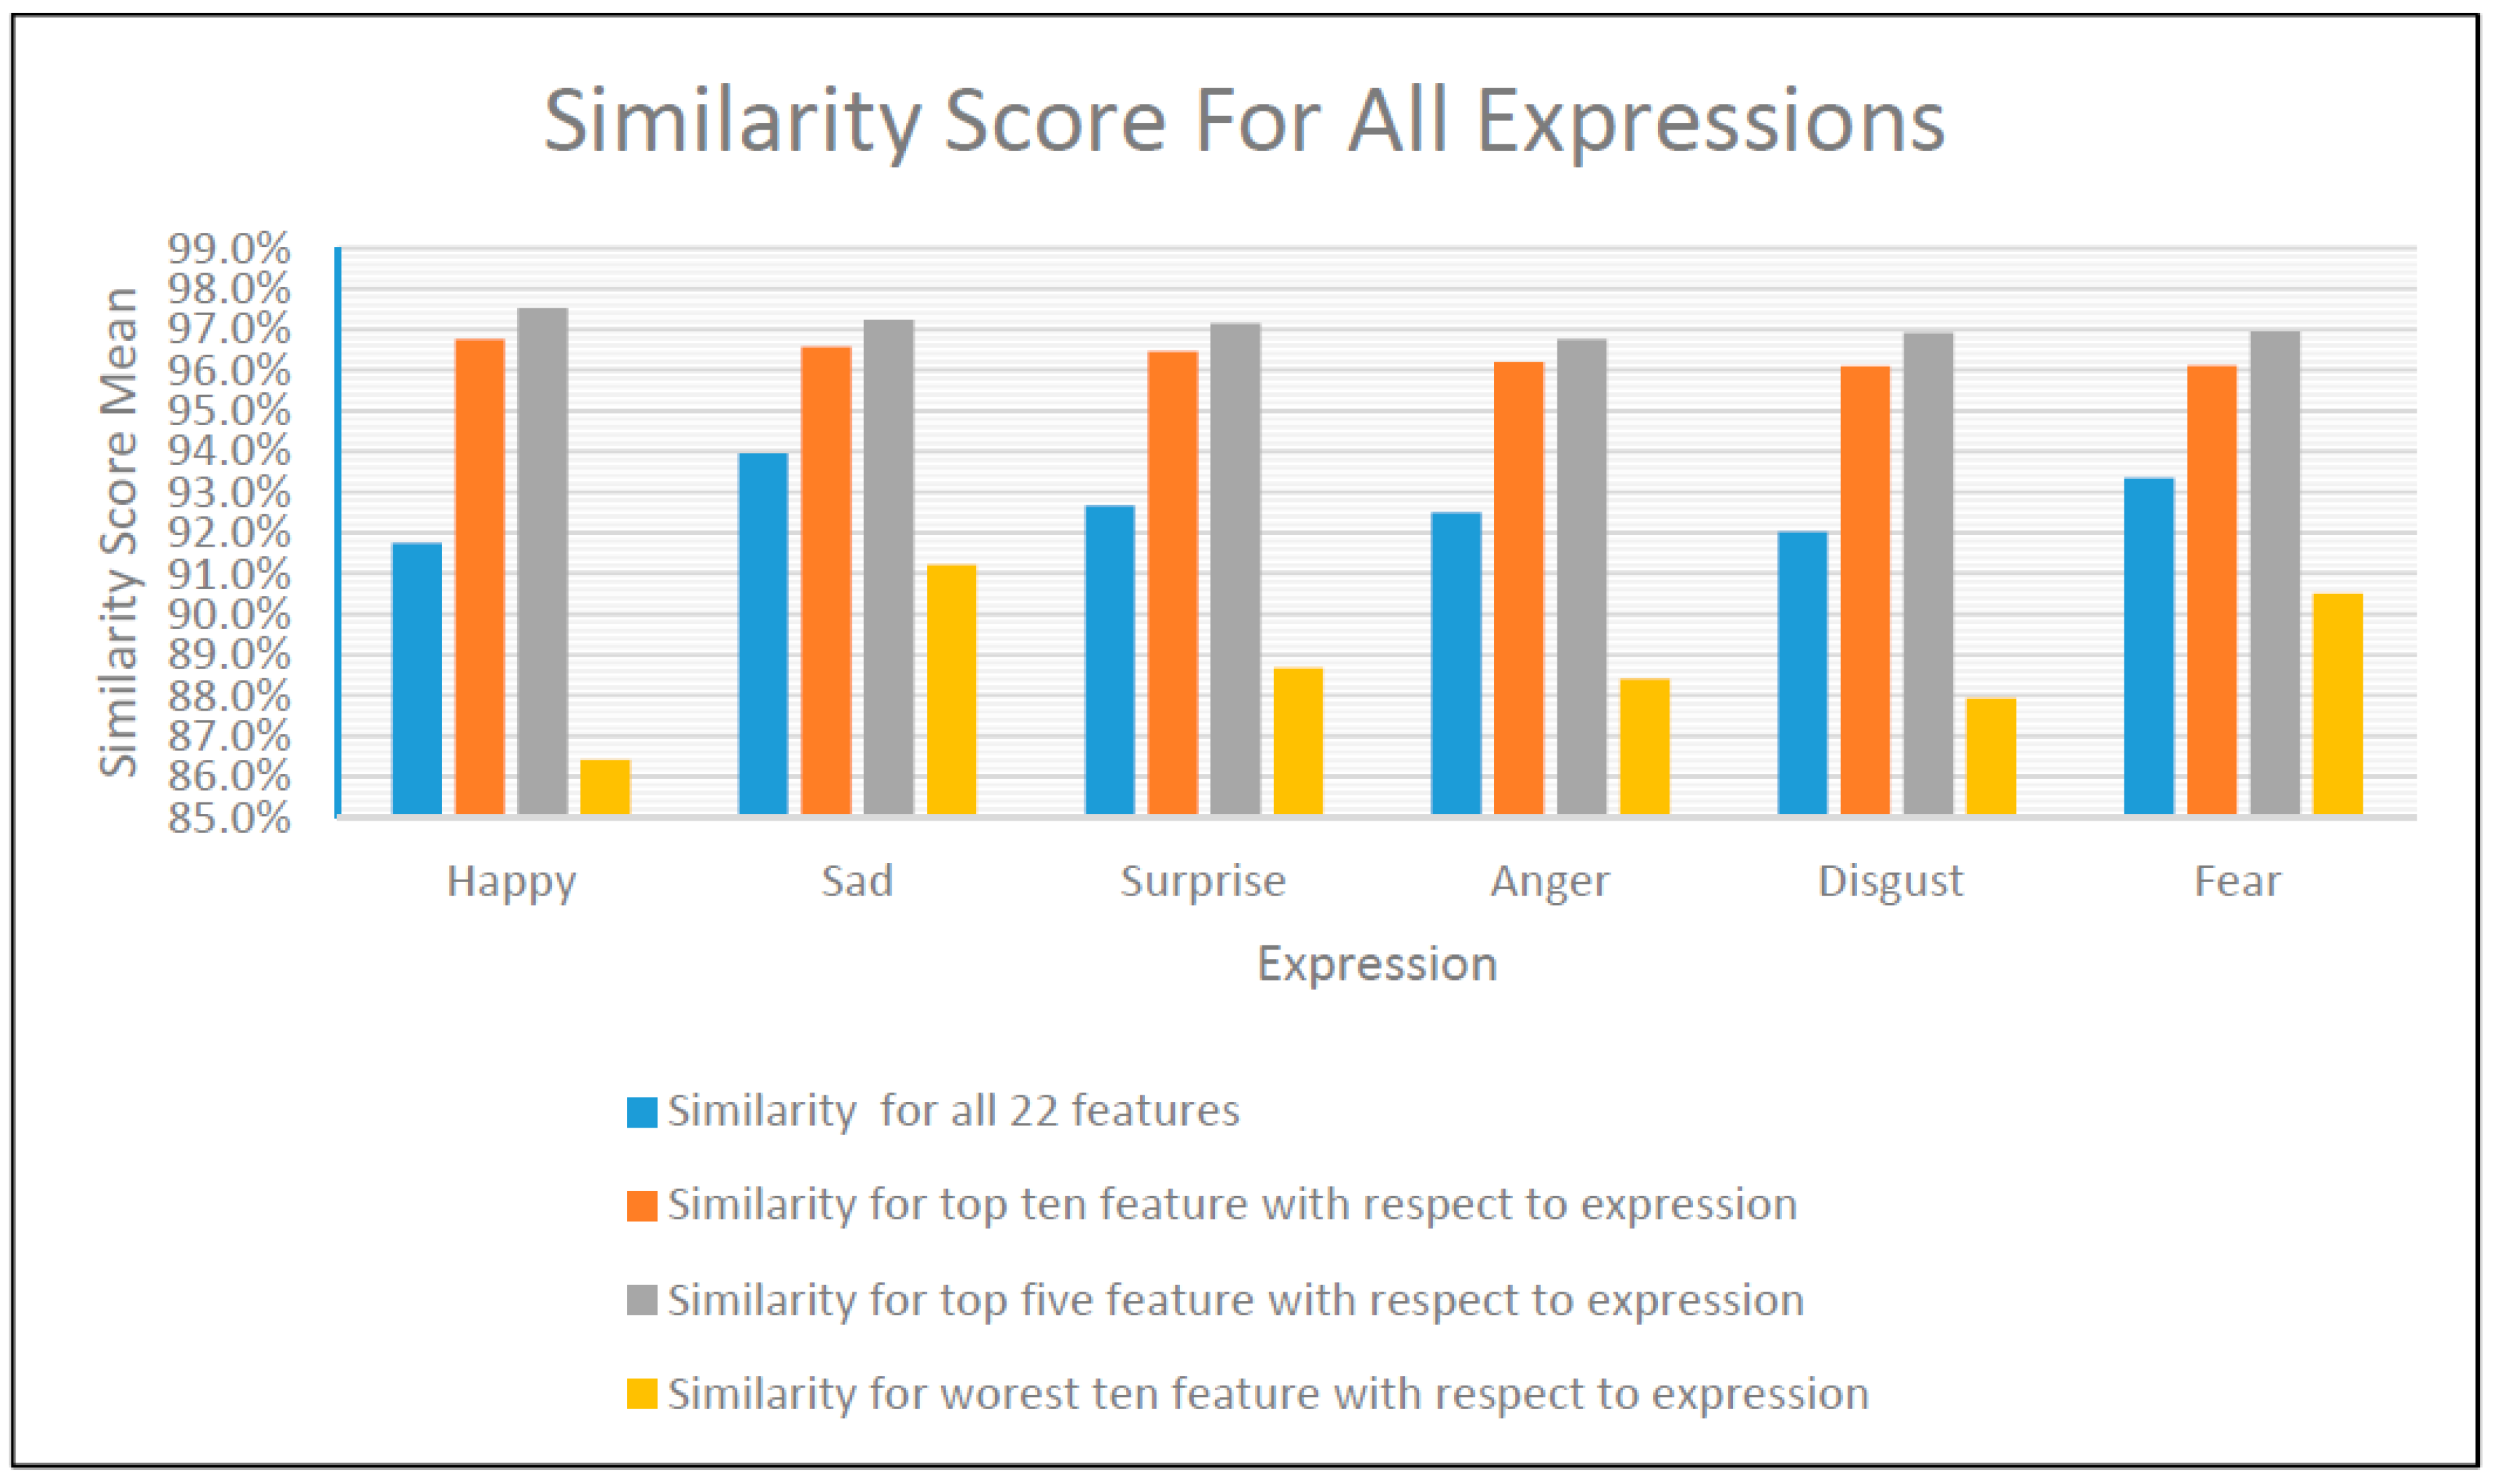
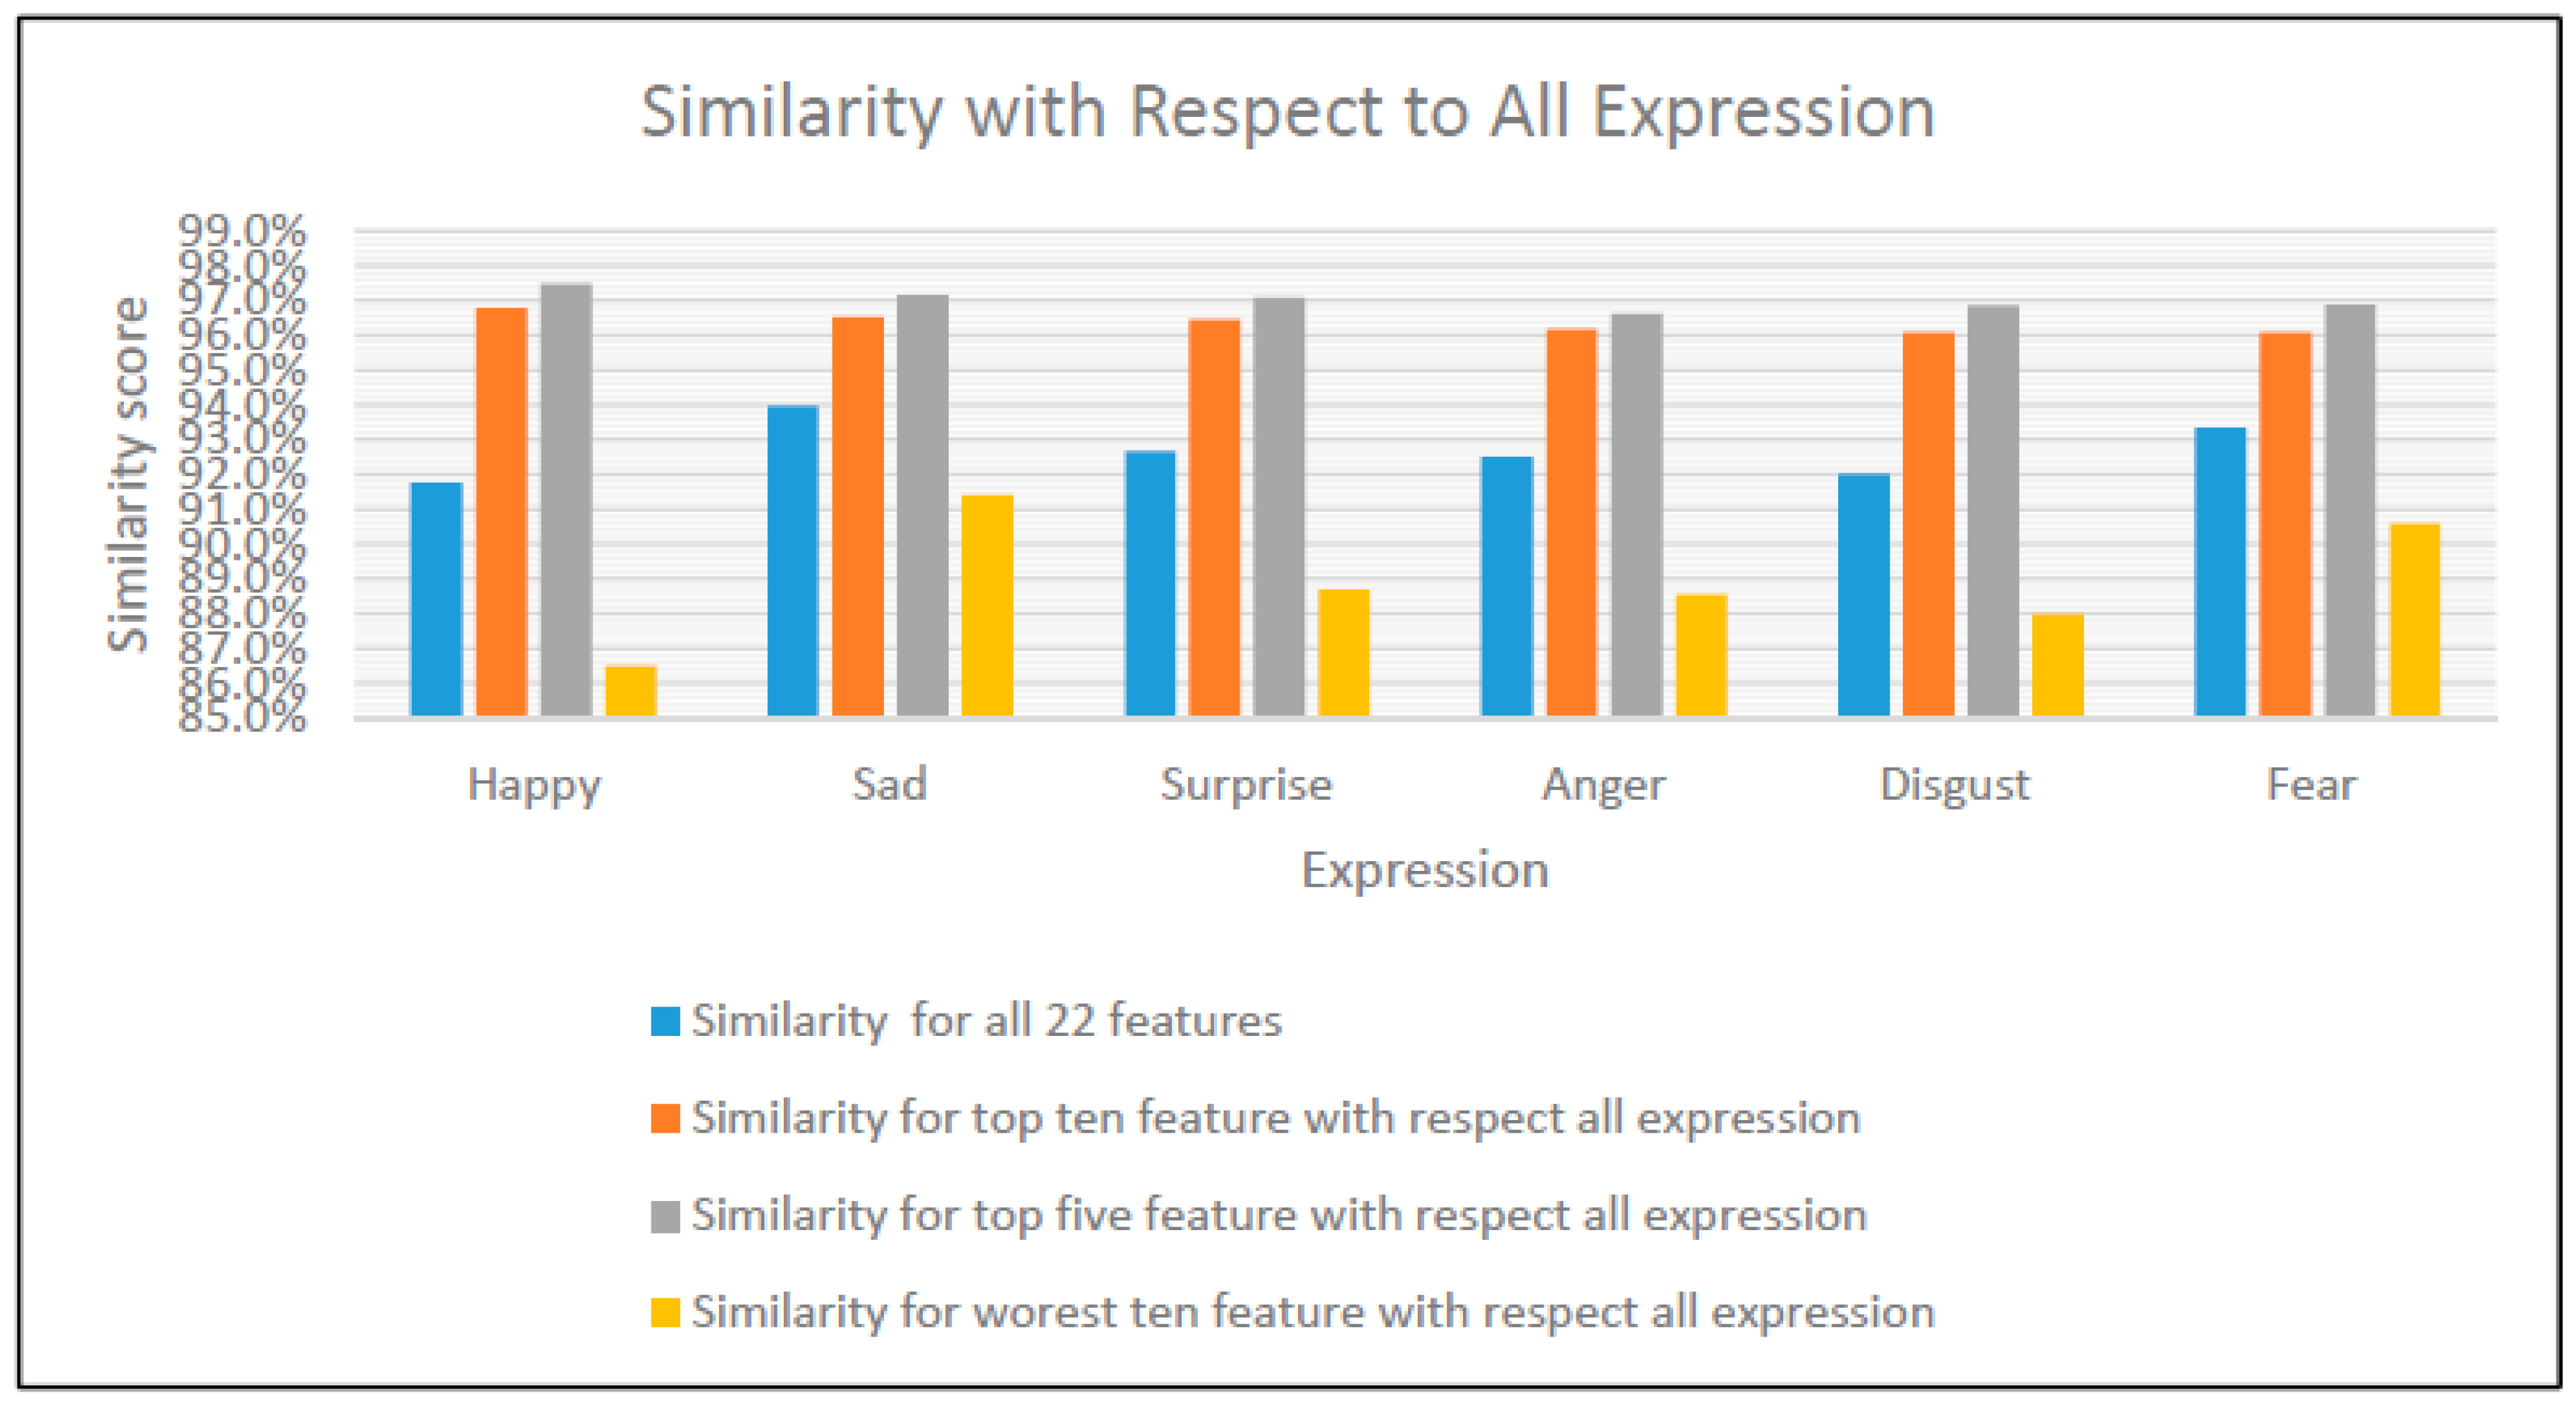
Figure 23.
The SS with respect to all expressions using all 22 features, top five, top ten, worst ten.
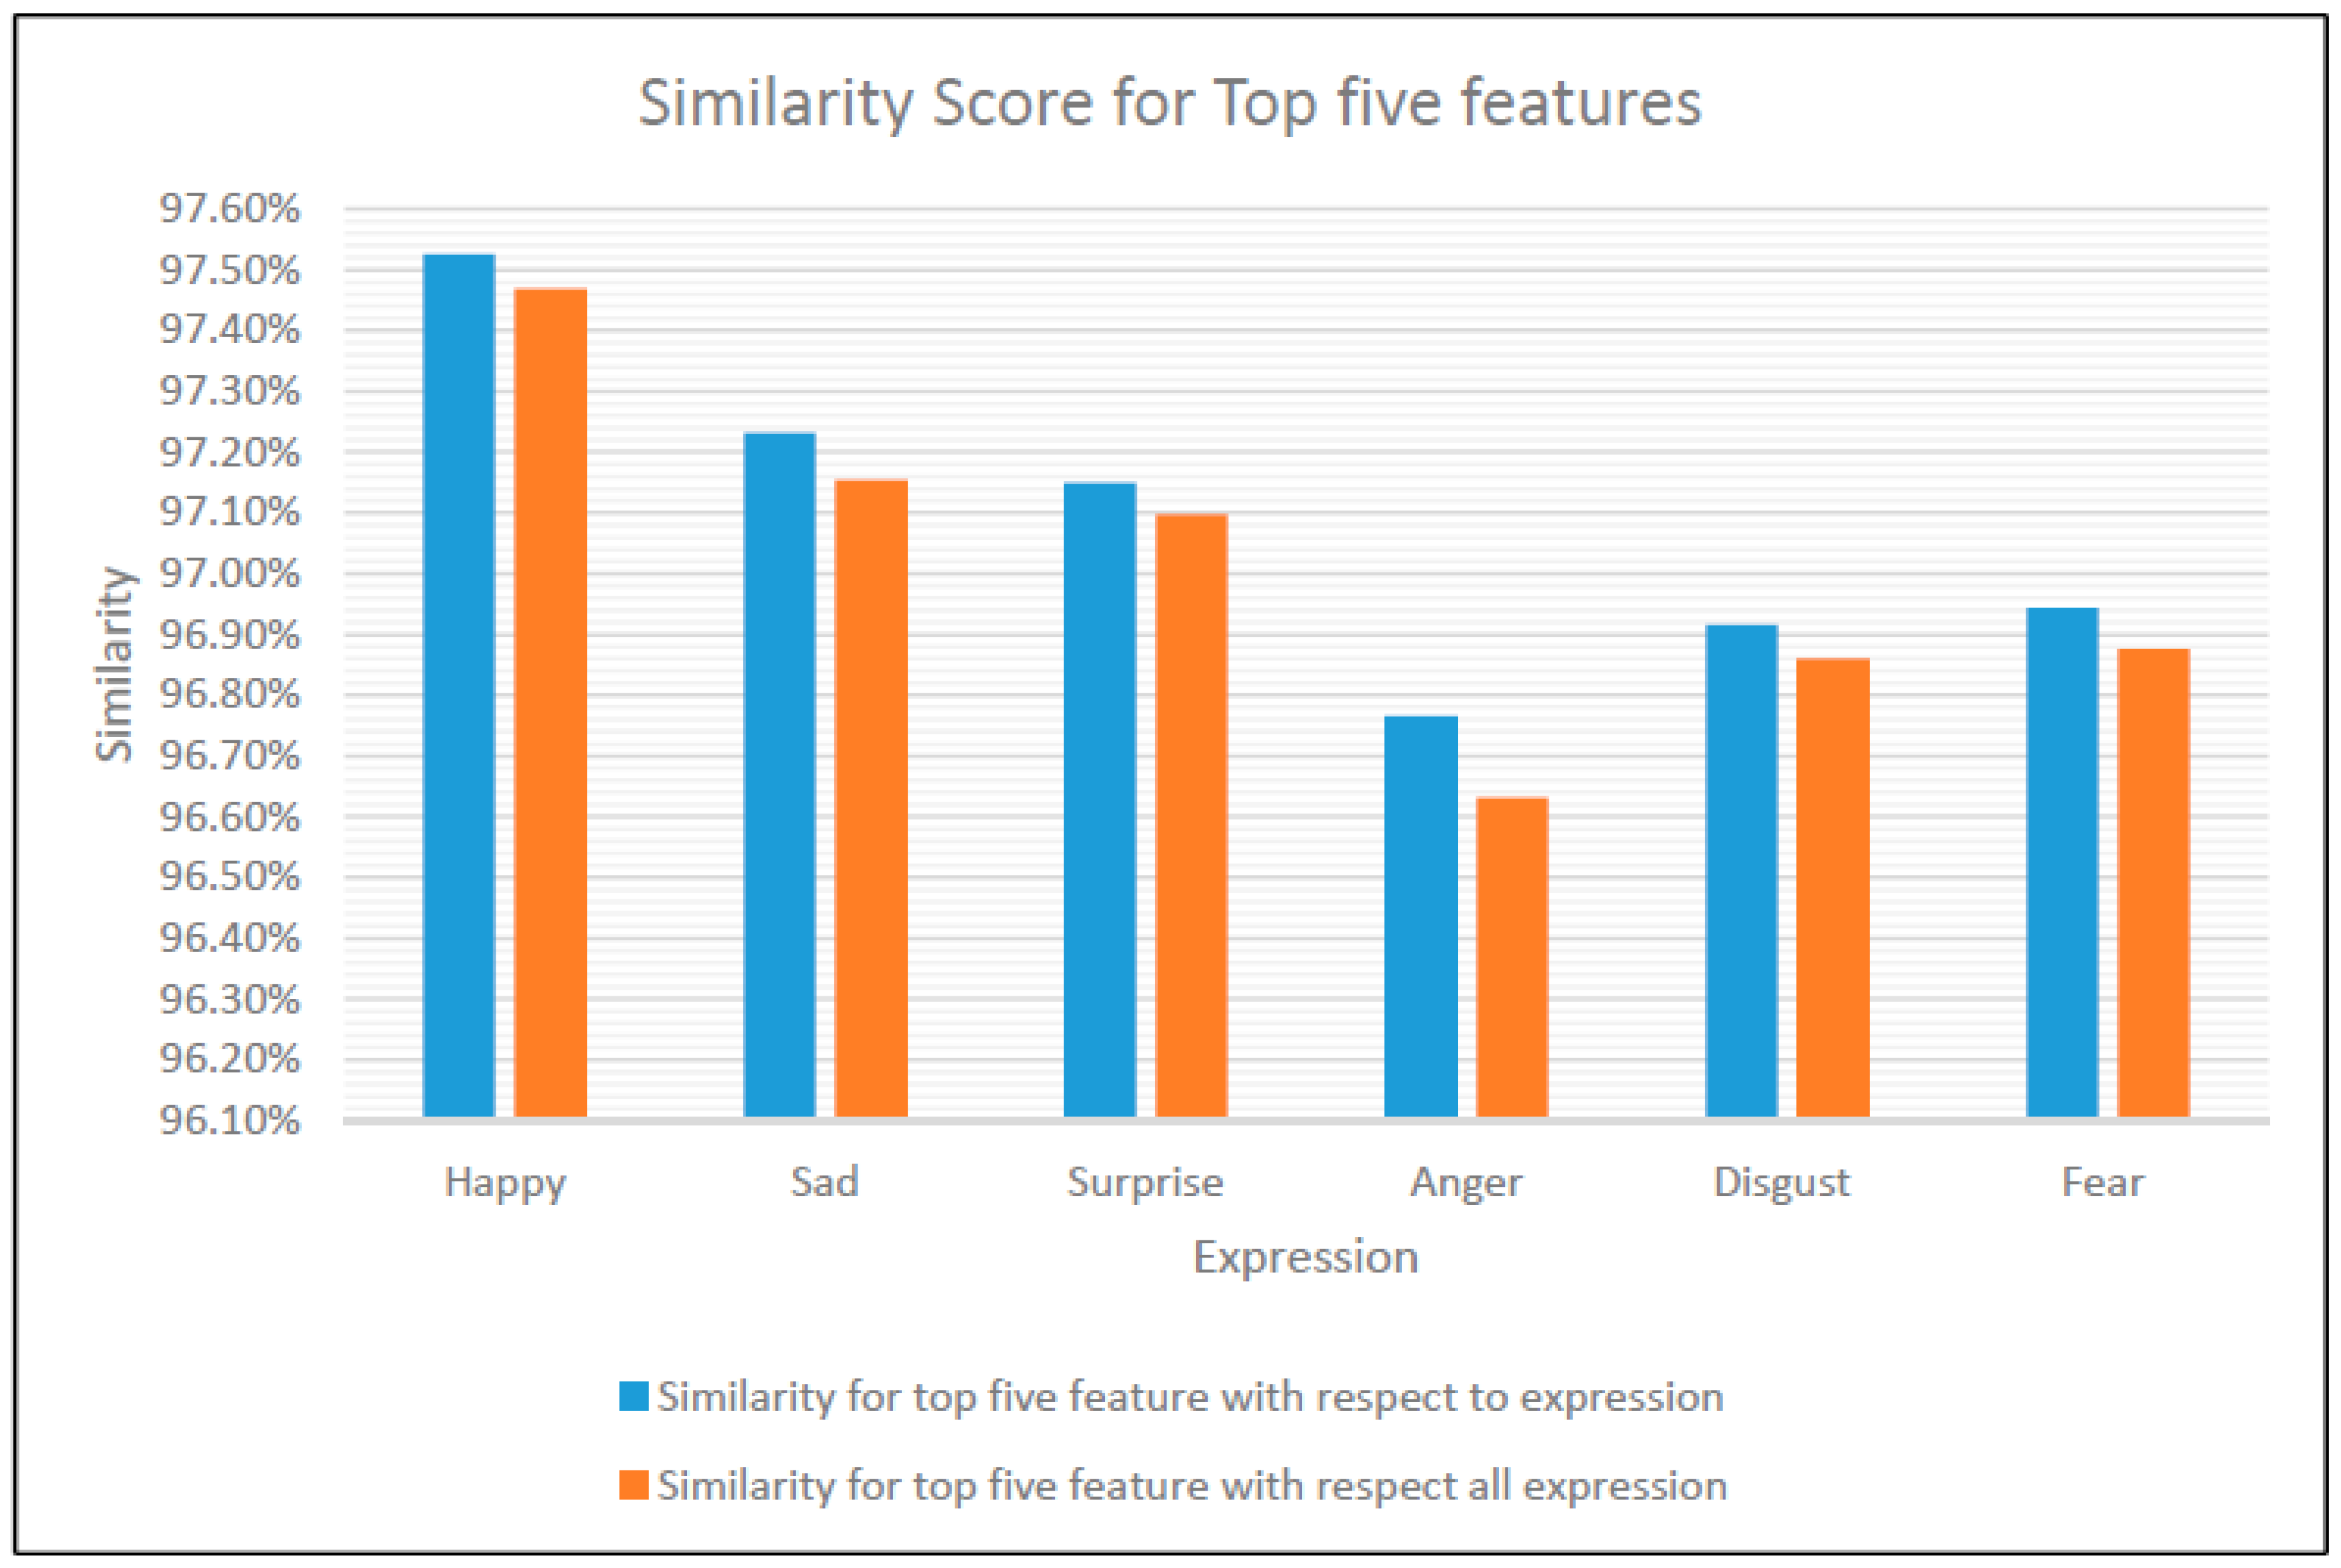
Figure 24.
SS for top five features with respect to each expression vs. all expressions.
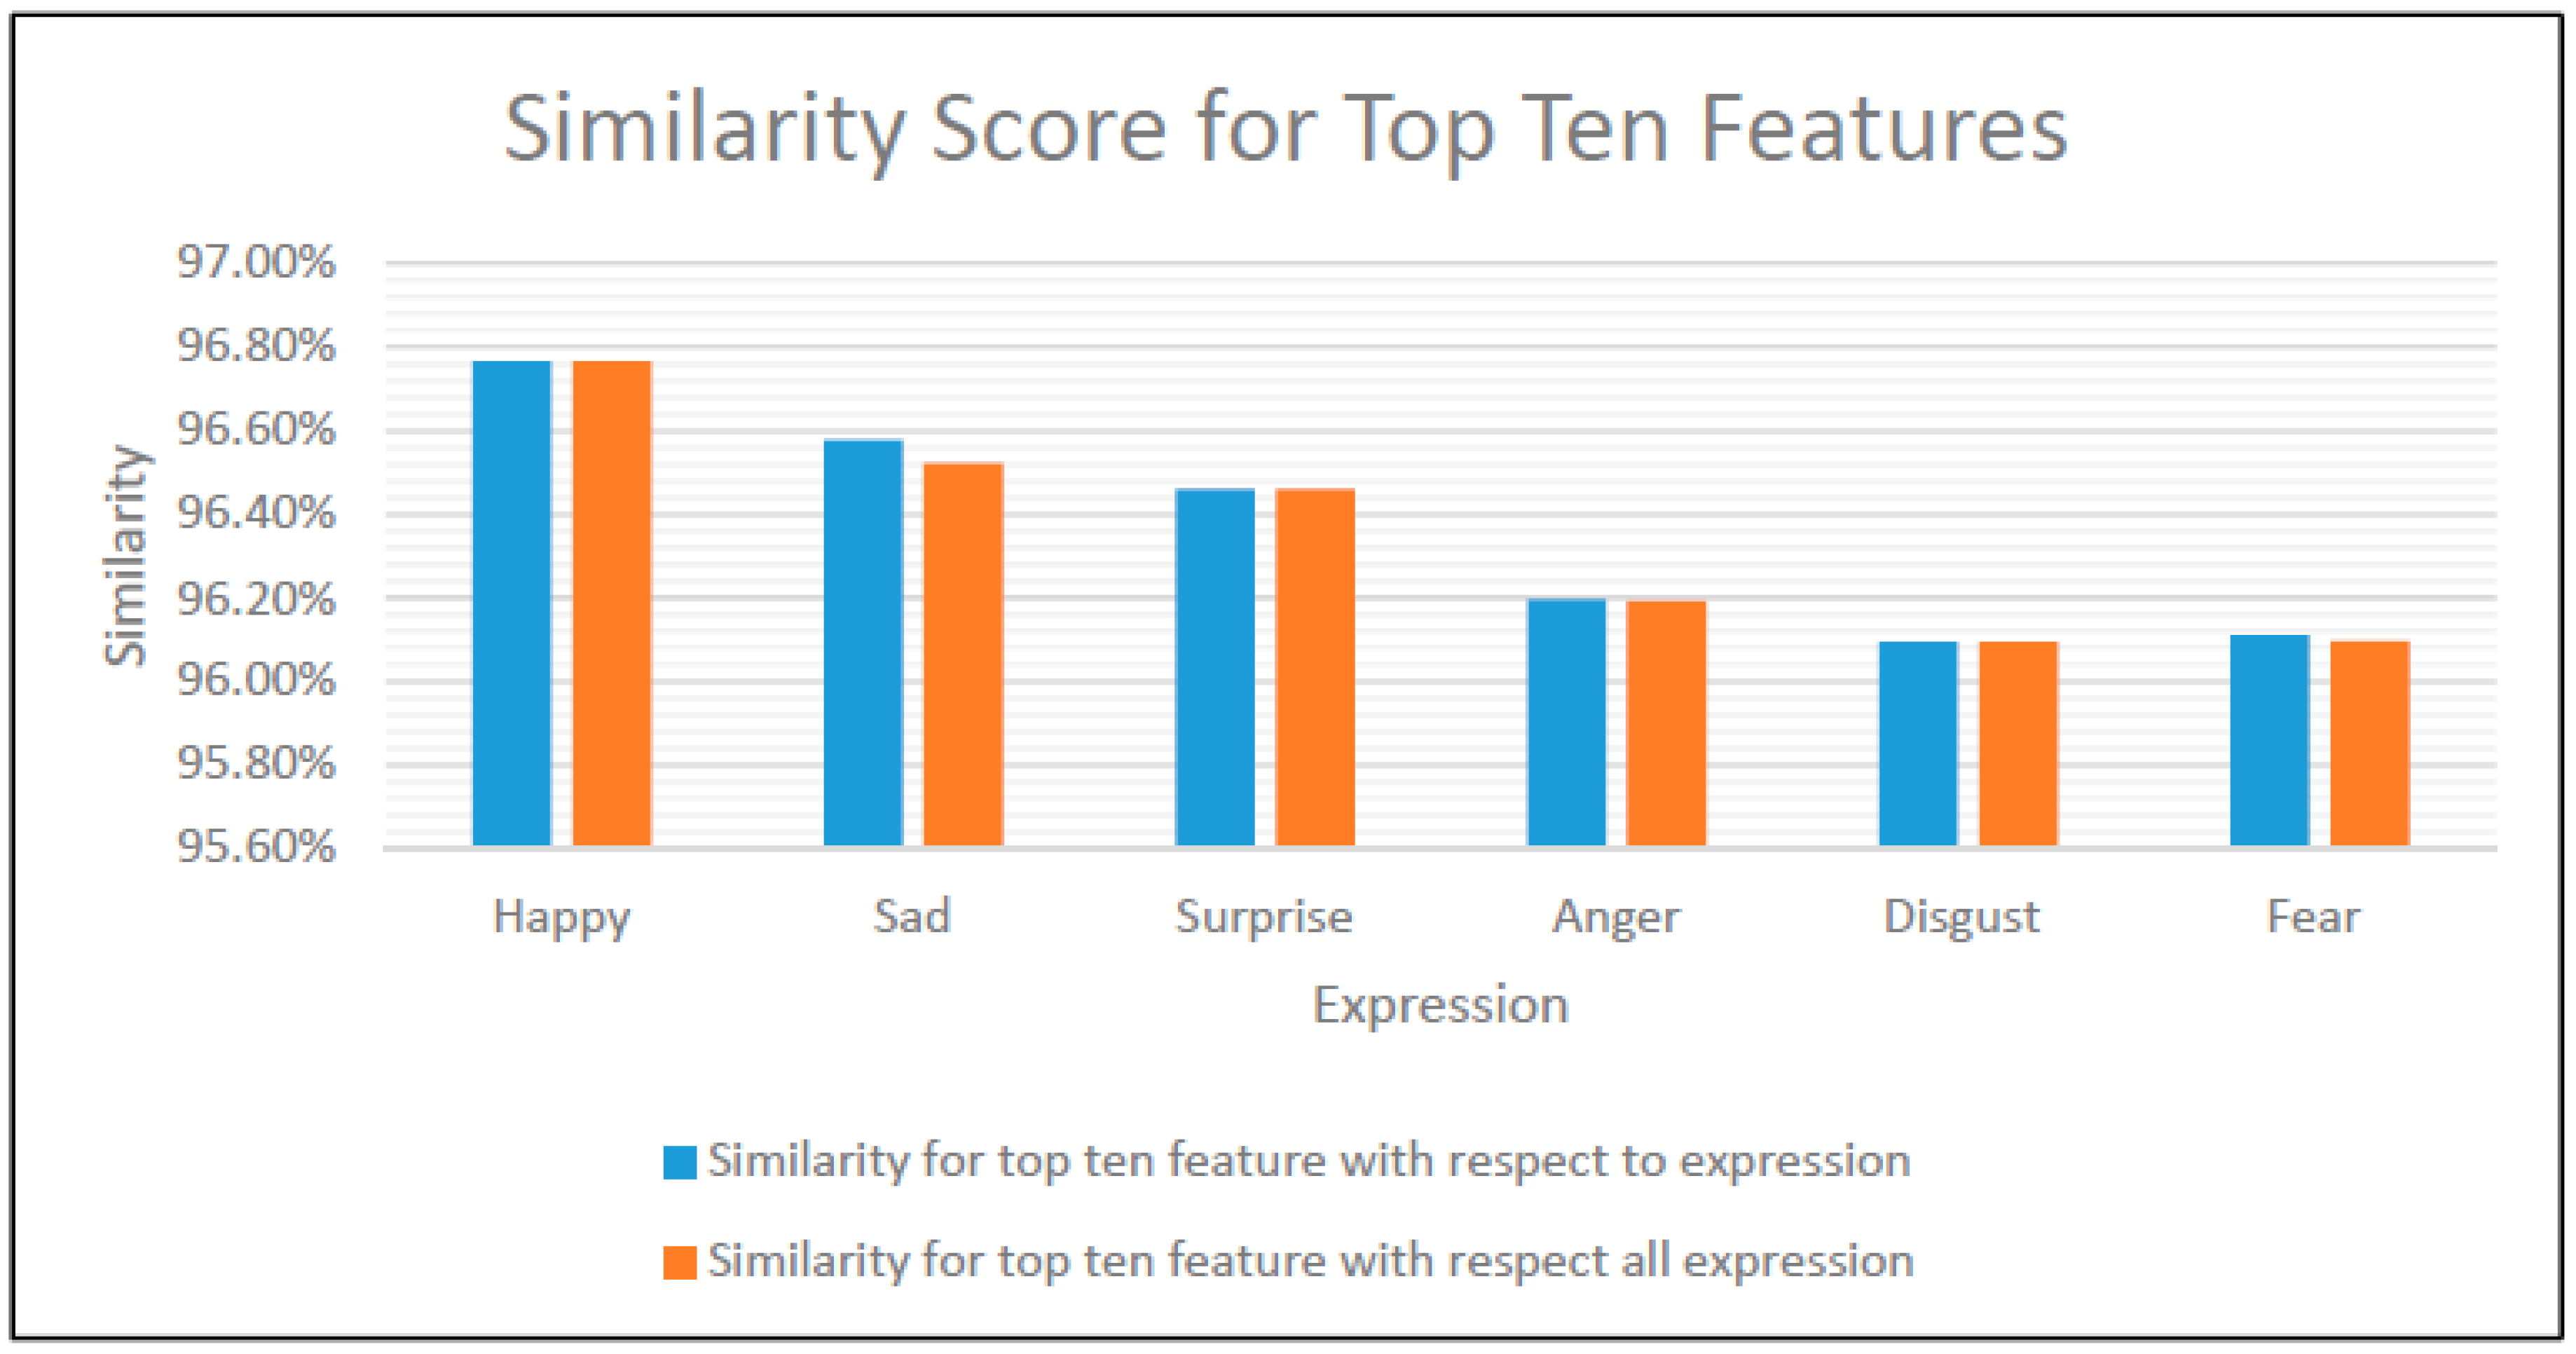
Figure 25.
SS for top ten features with respect to each expression vs. all expressions.
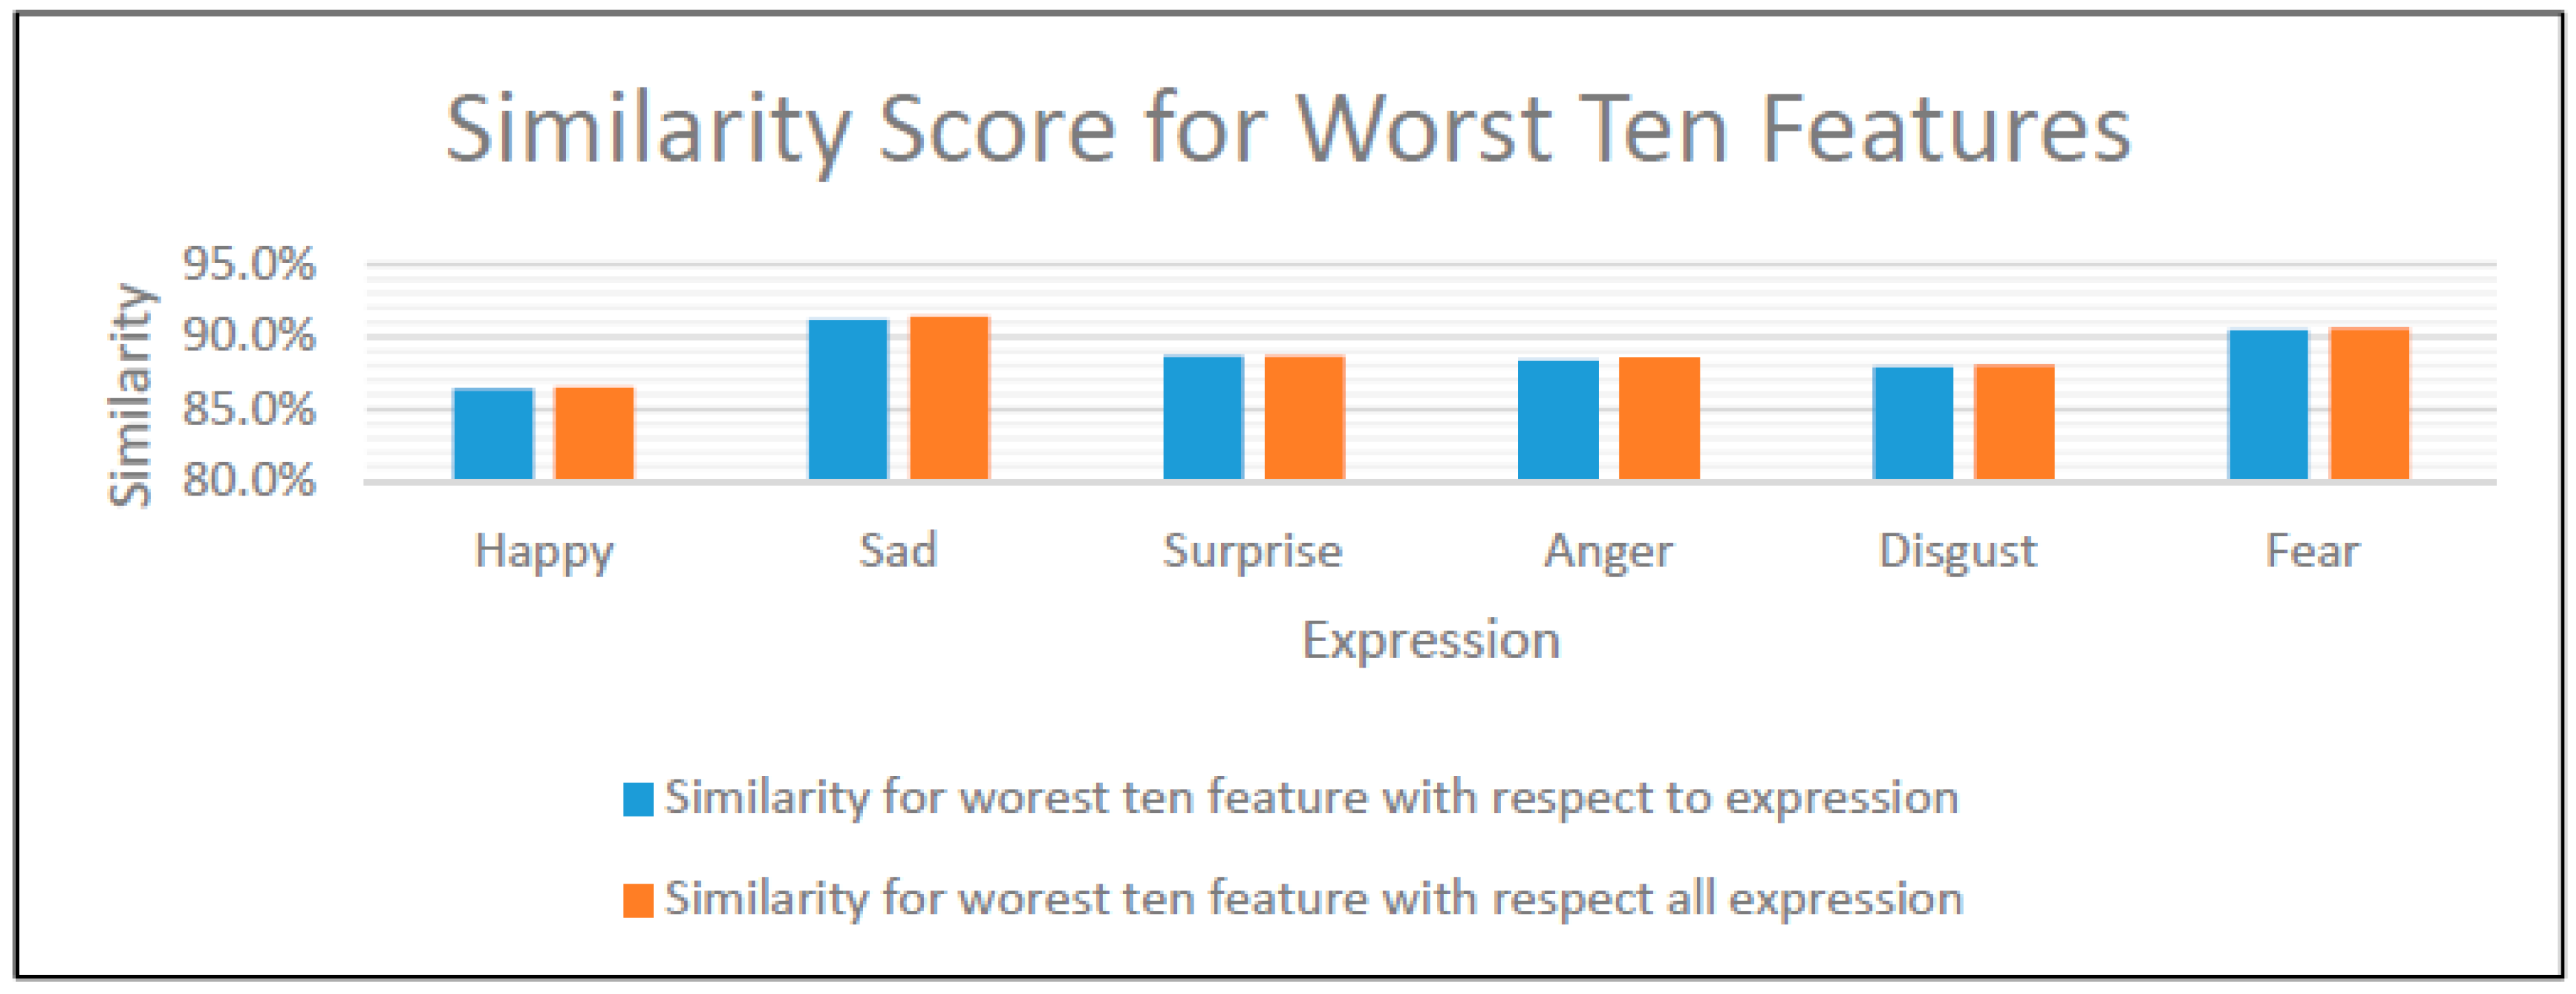
Figure 26.
SS for worst ten features with respect to each expression vs. all expressions.
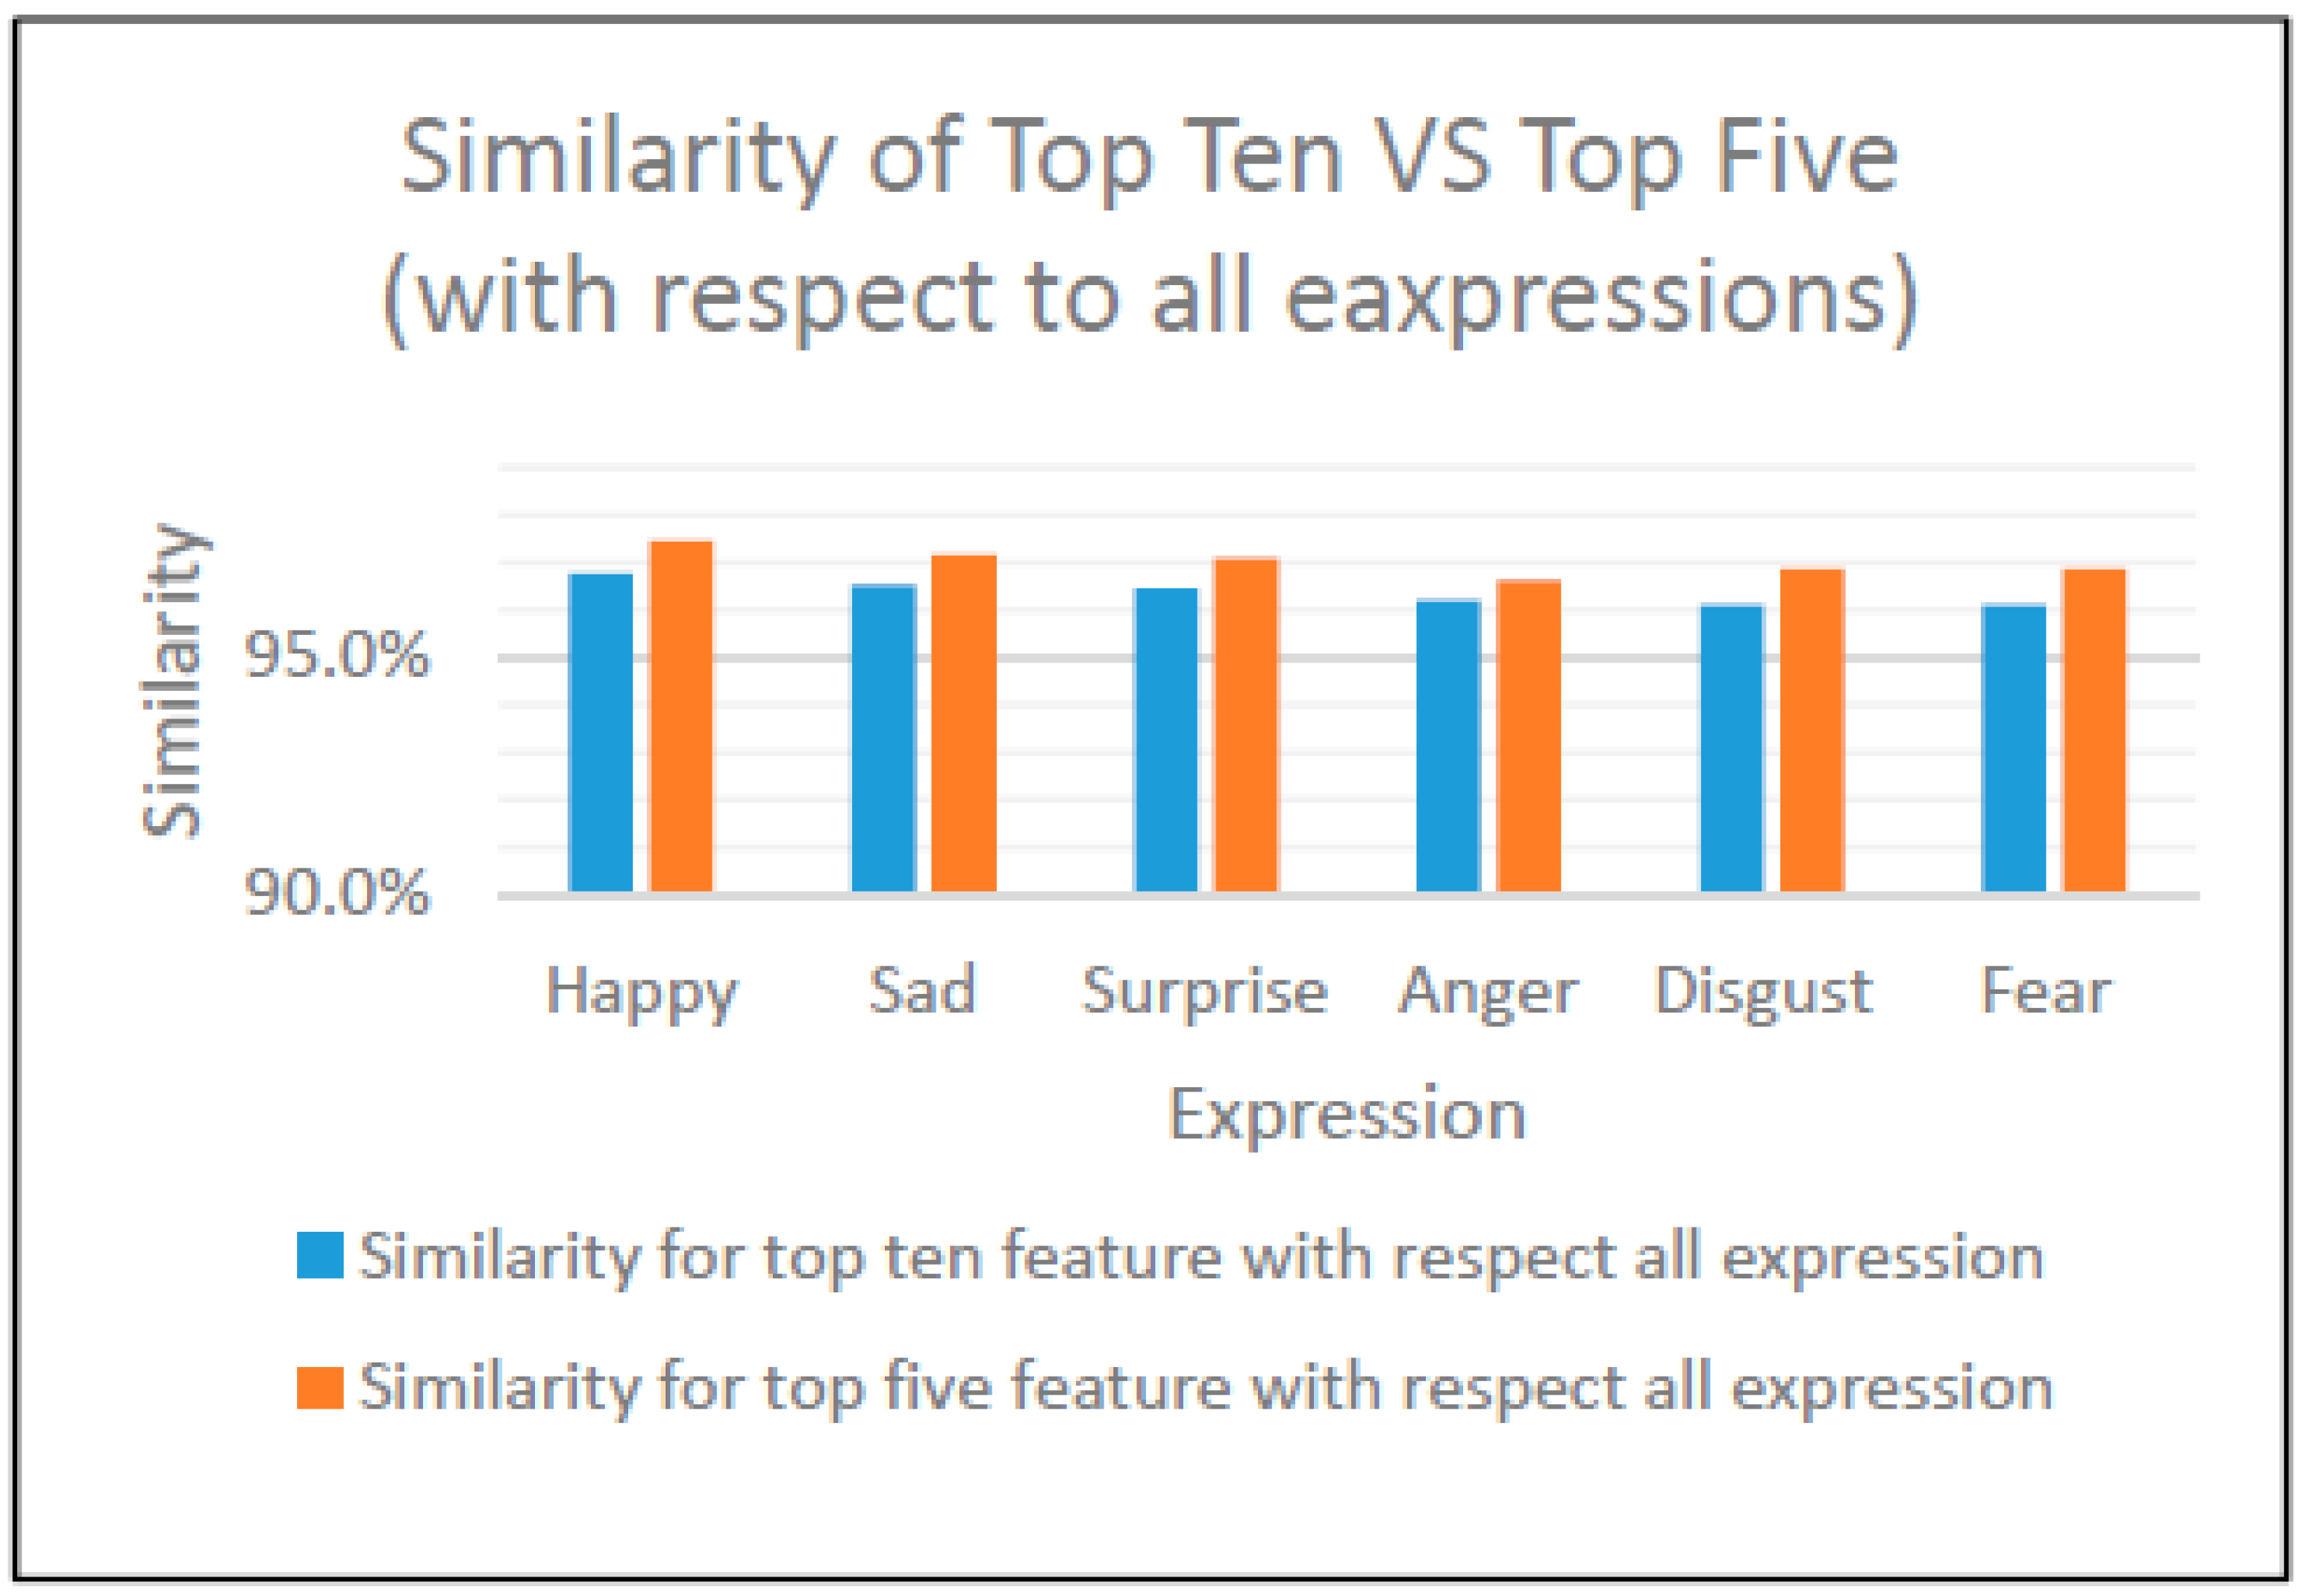
Figure 27.
Top ten vs. top five features.
Table 1.
The points range for each face feature in 68-points face’s landmarks.
| Facial Features | Points Range |
|---|
| Chin | 1–17 | |
| Right Eyebrow | 18–22 |
| Left Eyebrow | 23–27 |
| Nose | 28–36 |
| Left eye | 37–42 |
| Right eye | 43–48 |
| Mouth | 49–68 |
Table 2.
Facial features and the corresponding points in 68 landmarks template.
| # | Facial Features | Points |
|---|
| 1 | Left eye width | Distance between 37 and 40 |
| 2 | Right eye width | Distance between 43 and 46 |
| 3 | Left eye position | The coordinates of the left eye middle |
| 4 | Right eye position | The coordinates of the right eye middle |
| 5 | Mouth width | Distance between 49 and 55 |
| 6 | Mouth position | Coordinates of the intersect of the distance between 49 and 55 and the distance between 52 and 58 |
| 7 | Nose width | Distance between 32 and 36 |
| 8 | Nose position | Coordinates of intersect of the distance between 31 and 34 and the distance between 32 and 36 |
| 9 | Chin width | Distance between 7 and 11 |
| 10 | Chin position | Coordinates of Point 9 |
| 11 | Forehead width | Distance between 1 and 17 |
| 12 | Forehead position | Middle point of the upper line joining 20 and 25 |
| 13 | Distance between eyes | Distance between middle eyes points |
| 14 | Distance between left eye and nose | Distance between 37 and 34 |
| 15 | Distance between right eye and nose | Distance between 46 and 34 |
| 16 | Distance between left eye and mouth | Distance between 37 and 49 |
| 17 | Distance between right eye and mouth | Distance between 46 and 55 |
| 18 | Distance between left eye and eyebrow | Distance between eye middle point and 20 |
| 19 | Distance between right eye and eyebrow | Distance between eye middle point and 25 |
| 20 | Distance between nose and forehead | Coordinates of intersect of the distance between 34 and the middle point of the upper line joining 20 and 25 |
| 21 | Distance between left ear and mouth | Distance between 3 and 49 |
| 22 | Distance between right ear and mouth | Distance between 15 and 55 |
Table 3.
The relativity shift score (RSS) means between happy expression and neutral mode of 22 facial features for 36 subjects.
| Facial Features | N | RSS Mean | Rank | Std. Deviation |
|---|
| Left eye width | 36 | 0.0533 | 10 | 0.0350 |
| Right eye width | 36 | 0.0592 | 11 | 0.0389 |
| Left eye position | 36 | 0.0286 | 5 | 0.0233 |
| Right eye position | 36 | 0.0215 | 1 | 0.0182 |
| Mouth width | 36 | 0.2447 | 22 | 0.1123 |
| Mouth position | 36 | 0.0248 | 3 | 0.0166 |
| Nose width | 36 | 0.1483 | 19 | 0.0731 |
| Nose position | 36 | 0.0271 | 4 | 0.0186 |
| Chin width | 36 | 0.0416 | 9 | 0.0363 |
| Chin position | 36 | 0.0215 | 2 | 0.0155 |
| Forehead width | 36 | 0.0360 | 7 | 0.0294 |
| Forehead position | 36 | 0.0300 | 6 | 0.0263 |
| Distance between eyes | 36 | 0.0387 | 8 | 0.0285 |
| Distance between left eye and nose | 36 | 0.0826 | 13 | 0.0716 |
| Distance between right eye and nose | 36 | 0.0730 | 12 | 0.0651 |
| Distance between left eye and mouth | 36 | 0.1331 | 18 | 0.0737 |
| Distance between right eye and mouth | 36 | 0.1293 | 17 | 0.0771 |
| Distance between left eye and eyebrow | 36 | 0.0931 | 15 | 0.1045 |
| Distance between right eye and eyebrow | 36 | 0.0946 | 16 | 0.0981 |
| Distance between nose and forehead | 36 | 0.0855 | 14 | 0.0617 |
| Distance between left ear and mouth | 36 | 0.1866 | 21 | 0.0816 |
| Distance between right ear and mouth | 36 | 0.1608 | 20 | 0.0924 |
| Average | | 0.0825 | | |
Table 4.
The RSS means between sad expression and neutral mode of 22 facial features for 36 subjects.
| Facial Features | N | RSS Mean | Rank | Std. Deviation |
|---|
| Left eye width | 36 | 0.0568 | 12 | 0.0500 |
| Right eye width | 36 | 0.0599 | 13 | 0.0595 |
| Left eye position | 36 | 0.0311 | 6 | 0.0194 |
| Right eye position | 36 | 0.0264 | 1 | 0.0162 |
| Mouth width | 36 | 0.0710 | 15 | 0.0730 |
| Mouth position | 36 | 0.0296 | 5 | 0.0187 |
| Nose width | 36 | 0.1226 | 22 | 0.0875 |
| Nose position | 36 | 0.0327 | 7 | 0.0192 |
| Chin width | 36 | 0.0520 | 10 | 0.0363 |
| Chin position | 36 | 0.0268 | 2 | 0.0178 |
| Forehead width | 36 | 0.0272 | 3 | 0.0273 |
| Forehead position | 36 | 0.0284 | 4 | 0.0221 |
| Distance between eyes | 36 | 0.0368 | 8 | 0.0329 |
| Distance between left eye and nose | 36 | 0.0641 | 14 | 0.0556 |
| Distance between right eye and nose | 36 | 0.0816 | 16 | 0.0720 |
| Distance between left eye and mouth | 36 | 0.0511 | 9 | 0.0416 |
| Distance between right eye and mouth | 36 | 0.0542 | 11 | 0.0466 |
| Distance between left eye and eyebrow | 36 | 0.1065 | 20 | 0.1052 |
| Distance between right eye and eyebrow | 36 | 0.1094 | 21 | 0.1048 |
| Distance between nose and forehead | 36 | 0.0829 | 17 | 0.0772 |
| Distance between left ear and mouth | 36 | 0.0832 | 18 | 0.0701 |
| Distance between right ear and mouth | 36 | 0.0970 | 19 | 0.0833 |
| | | 0.0605 | | |
Table 5.
The RSS means between surprise expression and neutral mode of 22 facial features for 36 subjects.
| Facial Features | N | RSS Mean | Rank | Std. Deviation |
|---|
| Left eye width | 36 | 0.0563 | 10 | 0.0446 |
| Right eye width | 36 | 0.0639 | 11 | 0.0644 |
| Left eye position | 36 | 0.0276 | 2 | 0.0312 |
| Right eye position | 36 | 0.0265 | 1 | 0.0264 |
| Mouth width | 36 | 0.0858 | 16 | 0.0685 |
| Mouth position | 36 | 0.0288 | 3 | 0.0215 |
| Nose width | 36 | 0.1423 | 20 | 0.1153 |
| Nose position | 36 | 0.0302 | 5 | 0.0309 |
| Chin width | 36 | 0.0452 | 9 | 0.0364 |
| Chin position | 36 | 0.0328 | 6 | 0.0233 |
| Forehead width | 36 | 0.0357 | 7 | 0.0263 |
| Forehead position | 36 | 0.0294 | 4 | 0.0338 |
| Distance between eyes | 36 | 0.0414 | 8 | 0.0304 |
| Distance between left eye and nose | 36 | 0.0643 | 12 | 0.0553 |
| Distance between right eye and nose | 36 | 0.0801 | 14 | 0.0745 |
| Distance between left eye and mouth | 36 | 0.0693 | 13 | 0.0582 |
| Distance between right eye and mouth | 36 | 0.0814 | 15 | 0.0602 |
| Distance between left eye and eyebrow | 36 | 0.1927 | 22 | 0.1212 |
| Distance between right eye and eyebrow | 36 | 0.1716 | 21 | 0.1173 |
| Distance between nose and forehead | 36 | 0.0931 | 17 | 0.0662 |
| Distance between left ear and mouth | 36 | 0.1120 | 19 | 0.0941 |
| Distance between right ear and mouth | 36 | 0.1033 | 18 | 0.0844 |
| Average | | 0.0734 | | |
Table 6.
The RSS means between anger expression and neutral mode of 22 facial features for 36 subjects.
| Facial Features | N | RSS Mean | Rank | Std. Deviation |
|---|
| Left eye width | 36 | 0.0550 | 11 | 0.0394 |
| Right eye width | 36 | 0.0546 | 10 | 0.0508 |
| Left eye position | 36 | 0.0375 | 7 | 0.0243 |
| Right eye position | 36 | 0.0292 | 1 | 0.0189 |
| Mouth width | 36 | 0.0856 | 15 | 0.0681 |
| Mouth position | 36 | 0.0354 | 6 | 0.0205 |
| Nose width | 36 | 0.1722 | 20 | 0.0817 |
| Nose position | 36 | 0.0410 | 8 | 0.0242 |
| Chin width | 36 | 0.0502 | 9 | 0.0417 |
| Chin position | 36 | 0.0326 | 3 | 0.0209 |
| Forehead width | 36 | 0.0324 | 2 | 0.0282 |
| Forehead position | 36 | 0.0338 | 4 | 0.0240 |
| Distance between eyes | 36 | 0.0338 | 5 | 0.0288 |
| Distance between left eye and nose | 36 | 0.0691 | 14 | 0.0422 |
| Distance between right eye and nose | 36 | 0.0924 | 16 | 0.0679 |
| Distance between left eye and mouth | 36 | 0.0551 | 12 | 0.0424 |
| Distance between right eye and mouth | 36 | 0.0563 | 13 | 0.0439 |
| Distance between left eye and eyebrow | 36 | 0.1906 | 22 | 0.1098 |
| Distance between right eye and eyebrow | 36 | 0.1899 | 21 | 0.1167 |
| Distance between nose and forehead | 36 | 0.1038 | 18 | 0.0801 |
| Distance between left ear and mouth | 36 | 0.0945 | 17 | 0.0693 |
| Distance between right ear and mouth | 36 | 0.1053 | 19 | 0.0731 |
| Average | | 0.0750 | | |
Table 7.
The RSS means between disgust expression and neutral mode of 22 facial features for 36 subjects.
| Facial Features | N | RSS Mean | Rank | Std. Deviation |
|---|
| Left eye width | 36 | 0.076 | 10 | 0.0584 |
| Right eye width | 36 | 0.079 | 11 | 0.0602 |
| Left eye position | 36 | 0.034 | 5 | 0.0282 |
| Right eye position | 36 | 0.030 | 2 | 0.0218 |
| Mouth width | 36 | 0.096 | 17 | 0.0794 |
| Mouth position | 36 | 0.030 | 3 | 0.0225 |
| Nose width | 36 | 0.195 | 22 | 0.1019 |
| Nose position | 36 | 0.034 | 6 | 0.0248 |
| Chin width | 36 | 0.049 | 9 | 0.0482 |
| Chin position | 36 | 0.028 | 1 | 0.0221 |
| Forehead width | 36 | 0.032 | 4 | 0.0323 |
| Forehead position | 36 | 0.035 | 7 | 0.0296 |
| Distance between eyes | 36 | 0.043 | 8 | 0.0369 |
| Distance between left eye and nose | 36 | 0.088 | 13 | 0.0630 |
| Distance between right eye and nose | 36 | 0.081 | 12 | 0.0562 |
| Distance between left eye and mouth | 36 | 0.092 | 15 | 0.0665 |
| Distance between right eye and mouth | 36 | 0.090 | 14 | 0.0672 |
| Distance between left eye and eyebrow | 36 | 0.162 | 20 | 0.0973 |
| Distance between right eye and eyebrow | 36 | 0.182 | 21 | 0.1029 |
| Distance between nose and forehead | 36 | 0.093 | 16 | 0.0901 |
| Distance between left ear and mouth | 36 | 0.103 | 18 | 0.0697 |
| Distance between right ear and mouth | 36 | 0.105 | 19 | 0.0723 |
| Average | | 0.080 | | |
Table 8.
The RSS means between fear expression and neutral mode of 22 facial features for 36 subjects.
| Facial Features | N | RSS Mean | Rank | Std. Deviation |
|---|
| Left eye width | 36 | 0.0604 | 11 | 0.0393 |
| Right eye width | 36 | 0.0742 | 14 | 0.0494 |
| Left eye position | 36 | 0.0321 | 5 | 0.0258 |
| Right eye position | 36 | 0.0293 | 1 | 0.0210 |
| Mouth width | 36 | 0.0837 | 15 | 0.0658 |
| Mouth position | 36 | 0.0301 | 3 | 0.0185 |
| Nose width | 36 | 0.1053 | 20 | 0.0707 |
| Nose position | 36 | 0.0318 | 4 | 0.0227 |
| Chin width | 36 | 0.0585 | 9 | 0.0312 |
| Chin position | 36 | 0.0295 | 2 | 0.0188 |
| Forehead width | 36 | 0.0389 | 7 | 0.0318 |
| Forehead position | 36 | 0.0352 | 6 | 0.0287 |
| Distance between eyes | 36 | 0.0446 | 8 | 0.0411 |
| Distance between left eye and nose | 36 | 0.0590 | 10 | 0.0504 |
| Distance between right eye and nose | 36 | 0.0865 | 16 | 0.0607 |
| Distance between left eye and mouth | 36 | 0.0660 | 12 | 0.0439 |
| Distance between right eye and mouth | 36 | 0.0667 | 13 | 0.0471 |
| Distance between left eye and eyebrow | 36 | 0.1285 | 22 | 0.1092 |
| Distance between right eye and eyebrow | 36 | 0.1250 | 21 | 0.1151 |
| Distance between nose and forehead | 36 | 0.0931 | 18 | 0.0618 |
| Distance between left ear and mouth | 36 | 0.0933 | 19 | 0.0687 |
| Distance between right ear and mouth | 36 | 0.0928 | 17 | 0.0729 |
| Average | | 0.0666 | | |
Table 9.
The SS for all six-expression using all features, top five, top ten, worst ten.
| Similarity | Happy | Sad | Surprise | Anger | Disgust | Fear |
|---|
| Similarity for all 22 features | 91.754% | 93.948% | 92.665% | 92.500% | 92.013% | 93.344% |
| Similarity for top five features | 97.526% | 97.232% | 97.149% | 96.765% | 96.917% | 96.943% |
| Similarity for top ten features | 96.767% | 96.578% | 96.461% | 96.196% | 96.094% | 96.110% |
| Similarity for worst ten features | 86.415% | 91.218% | 88.684% | 88.405% | 87.938% | 90.510% |
Table 10.
The mean of the SS for all expressions.
| Mode | N | Mean |
|---|
| Happy | 36 | 92.4066% |
| Sadness | 36 | 93.9482% |
| Surprise | 36 | 92.6649% |
| Anger | 36 | 92.5002% |
| Disgust | 36 | 92.0127% |
| Fear | 36 | 93.3440% |
| Average | | 92.8128% |
Table 11.
The mean of RSS of 22 facial features for 36 subjects on all expressions.
| Features | Happy | Sad | Surprised | Anger | Disgust | Fear | Mean | Rank |
|---|
| Left eye width | 0.0533 | 0.0568 | 0.0563 | 0.0550 | 0.0756 | 0.0604 | 0.0595 | 10 |
| Right eye width | 0.0592 | 0.0599 | 0.0639 | 0.0546 | 0.0790 | 0.0742 | 0.0651 | 11 |
| Left eye position | 0.0286 | 0.0311 | 0.0276 | 0.0375 | 0.0336 | 0.0321 | 0.0318 | 4 |
| Right eye position | 0.0215 | 0.0264 | 0.0265 | 0.0292 | 0.0296 | 0.0293 | 0.0271 | 1 |
| Mouth width | 0.2447 | 0.0710 | 0.0858 | 0.0856 | 0.0963 | 0.0837 | 0.1112 | 18 |
| Mouth position | 0.0248 | 0.0296 | 0.0288 | 0.0354 | 0.0305 | 0.0301 | 0.0299 | 3 |
| Nose width | 0.1483 | 0.1226 | 0.1423 | 0.1722 | 0.1953 | 0.1053 | 0.1477 | 22 |
| Nose position | 0.0271 | 0.0327 | 0.0302 | 0.0410 | 0.0340 | 0.0318 | 0.0328 | 6 |
| Chin width | 0.0416 | 0.0520 | 0.0452 | 0.0502 | 0.0486 | 0.0585 | 0.0493 | 9 |
| Chin position | 0.0215 | 0.0268 | 0.0328 | 0.0326 | 0.0281 | 0.0295 | 0.0286 | 2 |
| Forehead width | 0.0360 | 0.0272 | 0.0357 | 0.0324 | 0.0324 | 0.0389 | 0.0338 | 7 |
| Forehead position | 0.0300 | 0.0284 | 0.0294 | 0.0338 | 0.0352 | 0.0352 | 0.0320 | 5 |
| Distance between eyes | 0.0387 | 0.0368 | 0.0414 | 0.0338 | 0.0429 | 0.0446 | 0.0397 | 8 |
| Distance between left eye and nose | 0.0826 | 0.0641 | 0.0643 | 0.0691 | 0.0877 | 0.0590 | 0.0711 | 12 |
| Distance between right eye and nose | 0.0730 | 0.0816 | 0.0801 | 0.0924 | 0.0814 | 0.0865 | 0.0825 | 15 |
| Distance between left eye and mouth | 0.1331 | 0.0511 | 0.0693 | 0.0551 | 0.0916 | 0.0660 | 0.0777 | 13 |
| Distance between right eye and mouth | 0.1293 | 0.0542 | 0.0814 | 0.0563 | 0.0904 | 0.0667 | 0.0797 | 14 |
| Distance between left eye and eyebrow | 0.0931 | 0.1065 | 0.1927 | 0.1906 | 0.1621 | 0.1285 | 0.1456 | 21 |
| Distance between right eye and eyebrow | 0.0946 | 0.1094 | 0.1716 | 0.1899 | 0.1815 | 0.1250 | 0.1453 | 20 |
| Distance between nose and forehead | 0.0855 | 0.0829 | 0.0931 | 0.1038 | 0.0933 | 0.0931 | 0.0919 | 16 |
| Distance between left ear and mouth | 0.1866 | 0.0832 | 0.1120 | 0.0945 | 0.1031 | 0.0933 | 0.1121 | 19 |
| Distance between right ear and mouth | 0.1608 | 0.0970 | 0.1033 | 0.1053 | 0.1049 | 0.0928 | 0.1107 | 17 |
Table 12.
The SS with respect to all expressions using all 22 features, top five, top ten, worst ten.
| Similarity | Happy | Sad | Surprise | Anger | Disgust | Fear | Average |
|---|
| Similarity for all 22 features | 91.754% | 93.948% | 92.665% | 92.500% | 92.013% | 93.344% | 92.704% |
| Similarity for top five features | 97.469% | 97.154% | 97.097% | 96.631% | 96.860% | 96.876% | 97.014% |
| Similarity for top ten features | 96.767% | 96.521% | 96.461% | 96.192% | 96.094% | 96.096% | 96.355% |
| Similarity for worst ten features | 86.510% | 91.405% | 88.684% | 88.545% | 88.001% | 90.593% | 88.956% |
Table 13.
SS for all 22 facial features, top ten, top 5, worst ten with respect to each expression and with respect to all expressions.
| Similarity | Happy | Sad | Surprise | Anger | Disgust | Fear |
|---|
| Similarity for all 22 features | 91.754% | 93.948% | 92.665% | 92.500% | 92.013% | 93.344% |
| Similarity for top five feature with respect to expression | 97.526% | 97.232% | 97.149% | 96.765% | 96.917% | 96.943% |
| Similarity for top five feature with respect all expression | 97.469% | 97.154% | 97.097% | 96.631% | 96.860% | 96.876% |
| Similarity for top ten feature with respect to expression | 96.767% | 96.578% | 96.461% | 96.196% | 96.094% | 96.110% |
| Similarity for top ten feature with respect all expression | 96.767% | 96.521% | 96.461% | 96.192% | 96.094% | 96.096% |
| Similarity for worst ten feature with respect to expression | 86.415% | 91.218% | 88.684% | 88.405% | 87.938% | 90.510% |
| Similarity for worst ten feature with respect all expression | 86.510% | 91.405% | 88.684% | 88.545% | 88.001% | 90.593% |
Table 14.
False rejection rate (FRR) at different acceptance threshold.
| Similarity Acceptance Threshold | # of Rejection Using All Facial Features (22) | # of Rejection Using Top Ten Features | # of Rejection Using Top Five Features |
|---|
| >99.00% | 216 (100%) | 214 (99.0741%) | 190 (87.9630%) |
| >95.00% | 171 (79.1667%) | 41 (18.9815%) | 34 (15.7407%) |
| >90.00% | 30 (13.8889%) | 1 (0.4630%) | 0 (0.0000%) |


