Article

Distributed Simulation Using Agents for the Internet of Things and the Factory of the Future

1
Department of Industrial Engineering, College of Engineering, King Abdulaziz University, Jeddah 21589, Saudi Arabia
2
Department of Industrial and Systems Engineering, College of Engineering, University of Jeddah, Jeddah 23218, Saudi Arabia
3
College of Business, University of Arkansas, Fort Smith, AR 72904, USA
4
Department of Industrial Engineering, College of Engineering, King Saud University, Riyadh 11451, Saudi Arabia
*
Author to whom correspondence should be addressed.
Information 2020, 11(10), 458; https://doi.org/10.3390/info11100458
Submission received: 22 August 2020 / Revised: 14 September 2020 / Accepted: 21 September 2020 / Published: 24 September 2020
(This article belongs to the Special Issue Distributed Simulation 2020)

Abstract

:
The adoption of the Internet of Things (IoT) and its related technologies has transformed the manufacturing industry and has significantly changed the traditional linear manufacturing supply chains into dynamic and interconnected systems. However, the lack of an approach to assess the economic feasibility and return uncertainties of an IoT system implementation, is blamed as the culprit for hindering its adoption rate. Using two distinctive case studies, this research investigates the use of distributed simulation of agent-based model (ABM) to address such gap in the literature. The first involves the economic feasibility of an IoT implementation in a very large retail warehouse facility, while the second case study proposes a framework able to generate and assess ideal or near-ideal manufacturing configurations and capabilities, and in establishing appropriate information messaging protocols between the various system components by using ABM in distributed simulation.

1. Introduction

The breath taking technological advances of the second half of the 20th century, and the unprecedented breakthroughs in computing and communication technologies witnessed the advent of a new paradigm, or Internet of Things (IoT), where Internet-connected devices or things are empowered to receive instruction and disseminate information with little or no human interaction [1]. With IoT’s applications spanning many economic sectors and industries, its economic impact in the European market is expected to surpass one trillion Euros by 2020 [2].
ABM is a powerful tool to study the behavior of complex distributed systems [3] such as IoT, with the flexibility to move elements of the modeled system [4], the ability to adopt new constrains [5], the capability of incorporating the details of human behavior, and of imitating a system’s interactions and dynamics. One of its distinguished features is the ability to capture emergence, a system property not possessed by any of the system individuals [6], but arises from the individual’s properties within the system. Furthermore, ABM can be a valuable tool to obtain significant insight about a possible solution, explore the dynamical behaviors of the model. Additionally, it helps with testing the dependence of outcomes on assumptions and parameters for a system with a mathematical model that can be written but not solved entirely, or has a numerous equations [7].
Hence, Basingab [8] proposed a conceptual study of IoT business model using multi agent-based simulations to determine the adoption of IoT and life cycle. This study investigates the use of the distributed simulation using agents for the Internet of Things and the factory of the future.

2. Agents as a Distributed Simulation Paradigm

Simulation is a versatile tool that is often used in organizations in order to make better decisions since it allows them to assess the expected impact caused by changes proposed to their process [9]. Simulation tools can be applied in many fields such as education, environment, healthcare, business analysis, and manufacturing. In the education field, ABM has been extensively used as a tool to foster the students’ understanding of technical subjects and manufacturing activities [10]. Also, ABM was used to assess the environmental impact and safety in the chemical industry [11].
In healthcare, ABM can be used to provide a significant result in the process of scheduling patients, community care, organ and tissue transplant management, decision support systems, information access, internal hospital tasks, training, and senior citizen care [12]. In addition, Cabrera, Taboada, Lgelsias, Epelde, and Luque used ABM to optimize the staff configuration of healthcare emergency departments, including doctors, nurses, and admission staff [13]. Moreover, in the field of marketing and market analysis, ABM has been used to explore the possibilities for future markets in orbital space tourism [14]. In epidemic modeling, Carley, Fridsma [15] developed a multi-agent model that can be scaled to cover a whole city. The model has the capability to simulate individual embedded in multiple networks includes social, health, and professional networks. Additionally, it can track the incidence of background and maliciously introduces disease. ABM has been considered as a comprehensive, effective enabler for open, dynamic, and decentralized IoT ecosystems [16].
Furthermore, it has been applied to the Industrial Symbiosis, an emerging concept and crucial for developing circular economy. Industrial symbiosis is about utilizing the wastes and by-products produced by one company as an input or a raw material to other companies. In order to foresee the potential benefits and costs of applying Industrial symbiosis, a multi ABM was used to analyze the cost-benefit of enterprise input–output and to simulate how companies sharing process of the entire economic benefits and advantages stemming from Industrial symbiosis [17]. Examining the importance and impact of redundancy strategy on the overall performance of companies included in Industrial symbiosis networks, Fraccascia, Yazan [18] developed a framework that help to understand the impact of the redundancy strategy on the performance of involved companies. A multi agent-based simulation model was built to investigate the developed framework and a case has been analyzed using an agent-based simulation.
Benefiting from scalable solutions that enable the integration of compound services of multiple-purpose smart objects for the extended use of IoT integrated services in the development of smart, Garcia-Magarino, Gray [19] suggested a multi agent-based simulation for supporting large-scale use of IoT for developing complex integrated services. The results of the simulations that were based on a region in Dublin city revealed an improved organization of electric vehicles in choosing routes and charging stations. As for the remanufacturing industry, an IoT-based multi agent simulation model was used to evaluate the feasibility and the efficiency of the production process as it relates to the condition and the quantity of raw material [20].
During the past couple of months, COVID-19 has been spreading worldwide causing serious health and economic damages. Some countries are forced to place their cities into a complete lockdown resulting in almost economic crisis, while other countries choose to save their economy at the cost of people’s health. Therefore, in order to mitigate both risks, ABM has been used to evaluate the impact of tradeoff between human health and economic situation [21]. ABM was also used to assess the COVID-19 transmission risk in various facilities, such information is crucially important to help the authorities to make an informed decision to partially or completely lockdown their facility [22].
Knowledge sharing is an important success factor for organizations. The effectiveness in knowledge sharing affects organizational performance and trust between organizations. Analyzing the trust, which is an important success factor of knowledge sharing, and the implementation of sharing the knowledge between organizations, Afrin Fauzya and Fadillah [23] used multi-agent simulations. Furthermore, enhancing the security of communication between vehicles and improve protection from virtual hijacking, Garcia-Magarino, Sendra [24] considered the application of prioritization rules, the use of digital certificates, and the application of trust and reputation policies in order to detect hijacked vehicles. The security of vehicle-to-vehicle communications in IoT has been tested using a multi agent-based simulator.

3. Case Study 1

3.1. Description of a Retail Warehousing Environment

A multi-locations retail warehousing company is experiencing unexpected failures in its system of refrigeration units, resulting in an annual food waste and repair cost of around $0.9 million. These losses have been attributed to sudden malfunctions or failures of these refrigeration units. To minimize such losses, management is considering an IoT-based system for the continuous monitoring of the operating conditions of these refrigeration units, and the implementation of Intelligent Sensing Platform with routing capabilities allowing for the adoption of a condition-based predictive maintenance strategy where likely failures are flagged and prevented with proper maintenance.
To assess the economic viability or the return on investment (ROI) of the proposed IoT implementation, a hybrid simulation model combining the use of agent-based modelling (ABM) and discrete events simulation (DES) was developed and validated following Houston et al. [25].

3.2. Description of the Agents in the Simulation Model

3.2.1. Data Analysis

Using historical failure data, the probability distribution for the failure rate of the three types of refrigeration units were determined as Weibull distribution (alpha of 6.01, beta of 0.043) for the type 1, Lognormal (−3.9, 0.239) and Lognormal (−4.79, 0.26) for each of the failure rate for refrigerator types 2 and 3 follow respectively. Table 1 lists the input parameters used in the simulation model including the cost parameter.
Also, the coordinates for each of the 150-warehouse locations were uploaded in the Geographic Information Systems (GIS) functionality in ABM model to define the exact routes and distances between the repair facility and the store location where the service is required.

3.2.2. Building the Simulation Model

AnyLogic software was used to build ABM model. There are four different agents in the simulation model: Warehouse, Manufacturing, Order, and Truck. The Warehouse agent has its statechart to represent their behavior (Figure 1). The population of the Warehouse agent contains 4500 refrigerators in 150 different locations. For the Manufacturing agent, DES is developed. Figure 2 illustrates the processing modeling logic for DES.

3.2.3. Hybrid Simulation Model

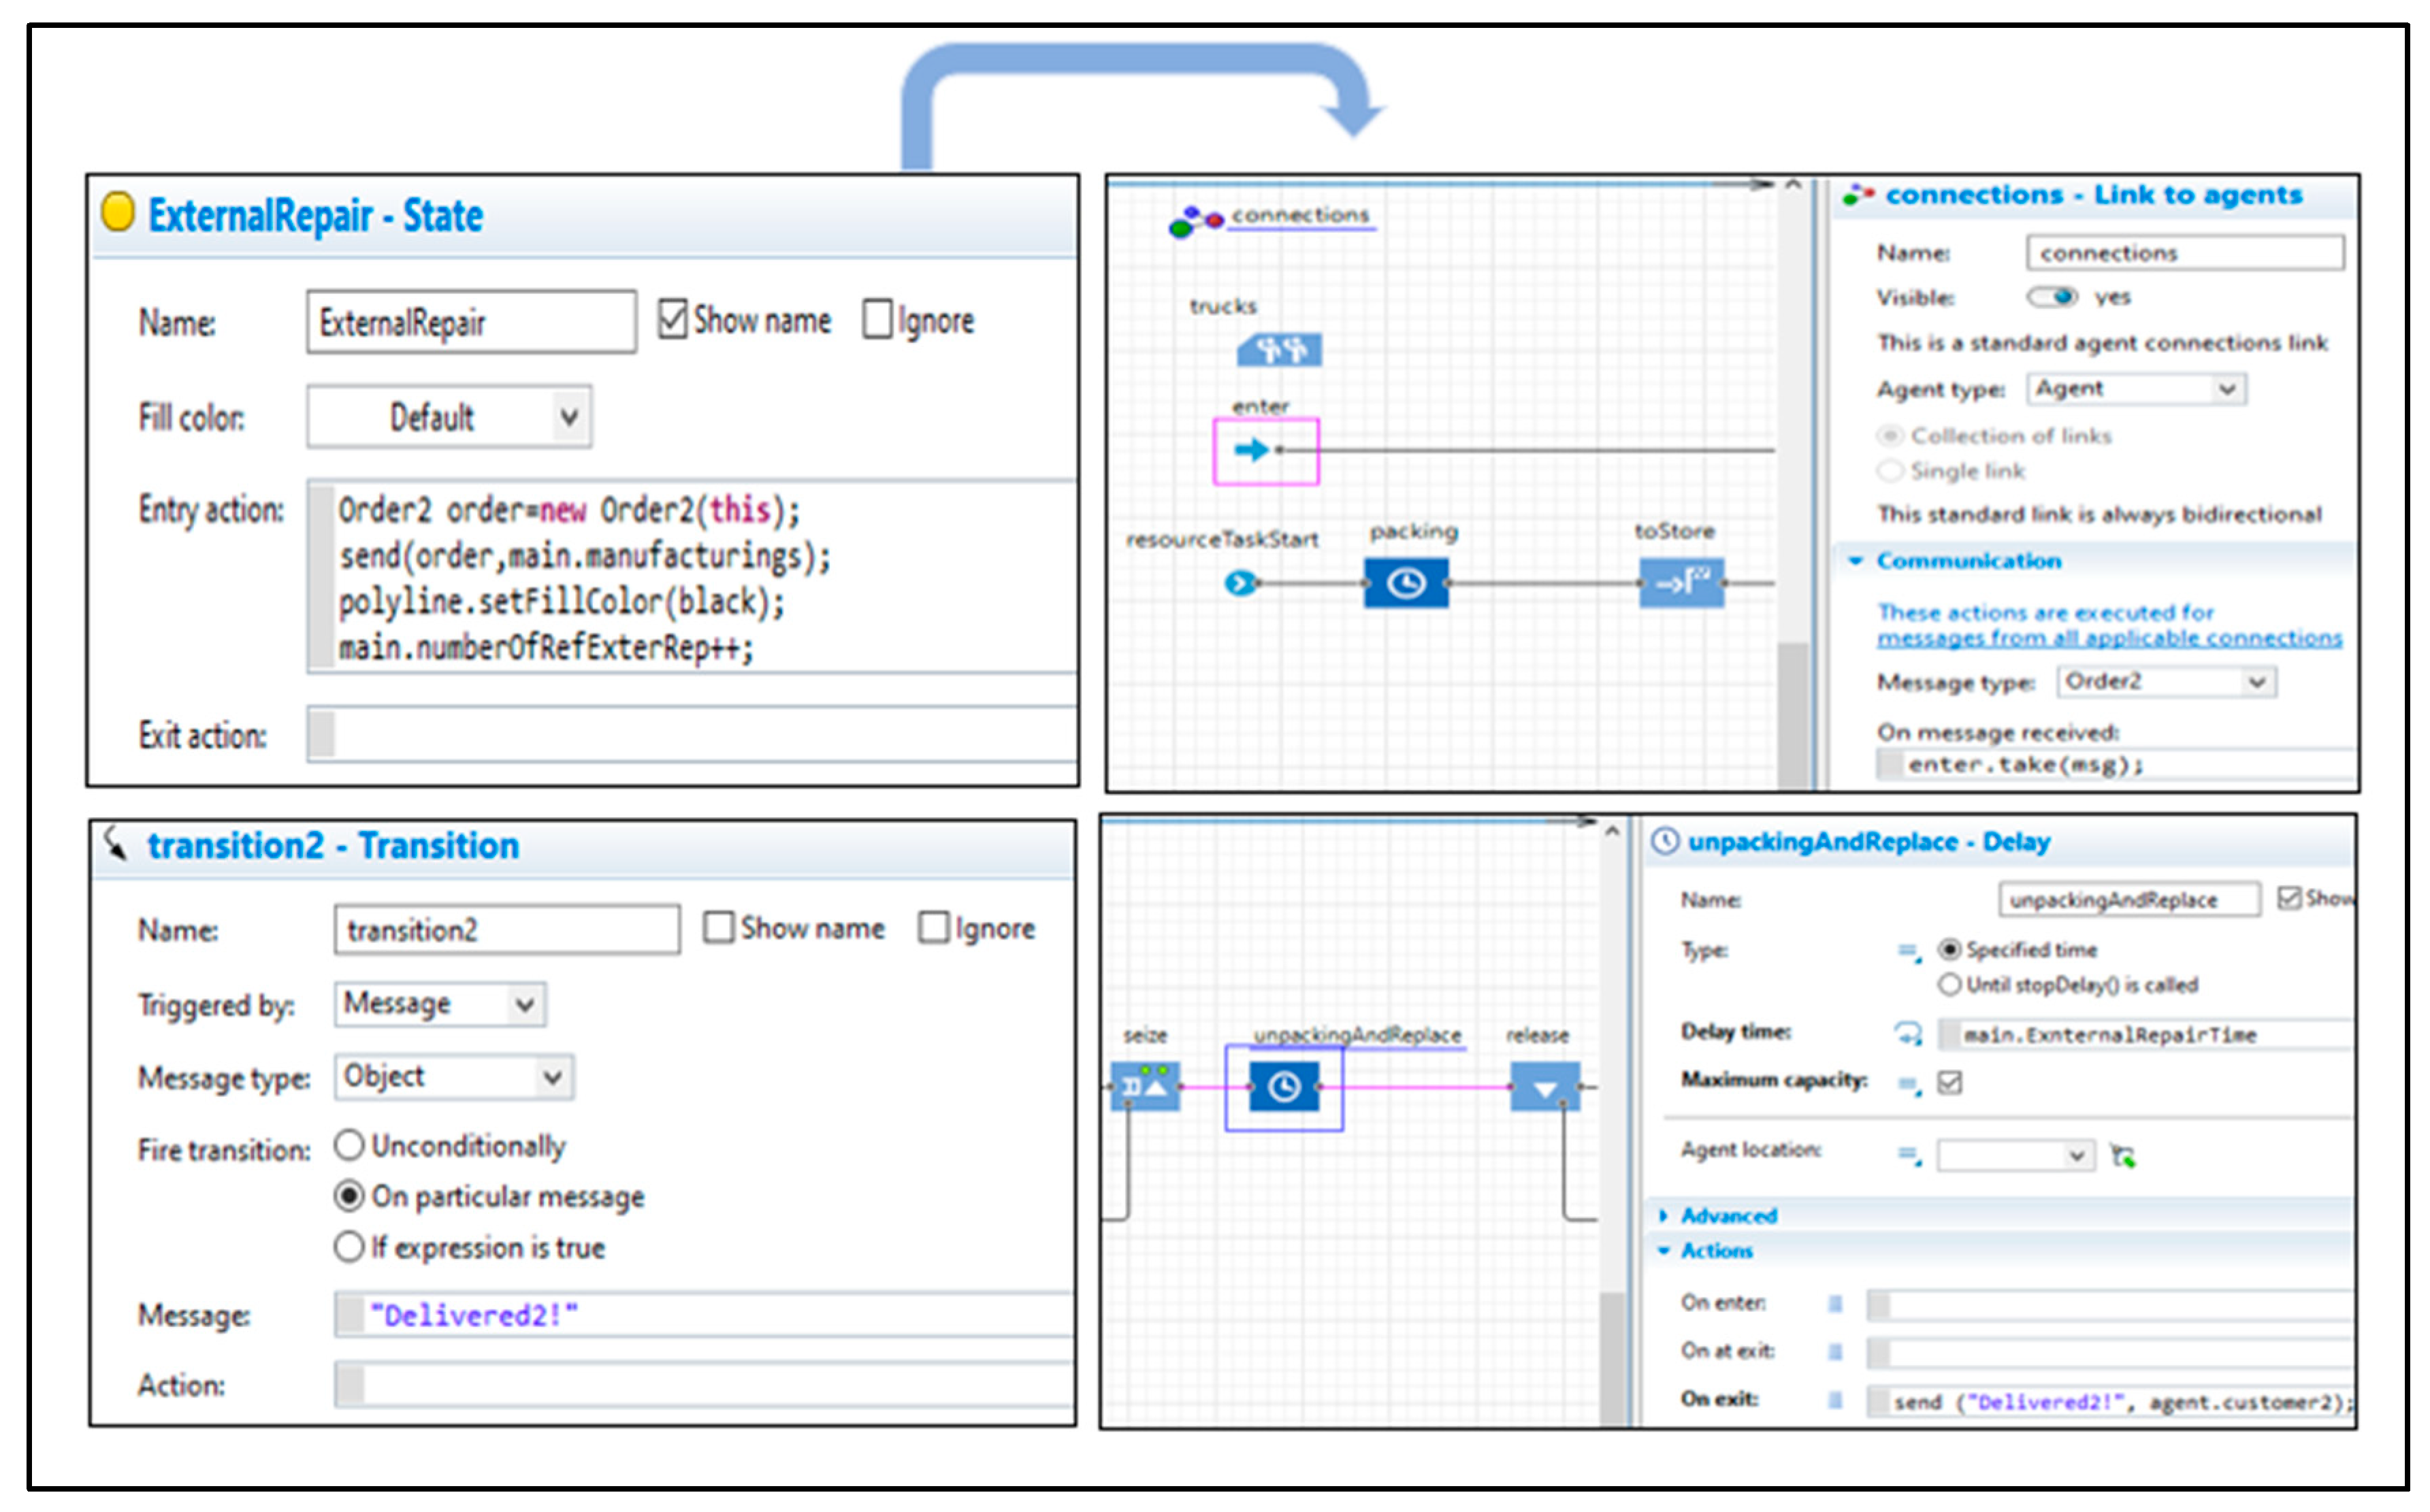
A hybrid model is built to properly capture the system (Figure 3). DES model deals with the orders received by Manufacturing agent and the movement of the trucks. The truck moves from Manufacturing agent to the Warehouse agent based on a certain trigger (message). Then, the truck goes back from Warehouse agent to Manufacturing agent based on a certain time (timeout). Java codes were appropriately used to capture the interactions between ABM and DES in the software.
For the simulation modelling, the following assumptions were considered:
  • Workers are always available;
  • Worker movement time inside the warehouse is ignored;
  • The queue in the model is based on first in first out (FIFO);
  • Trucks are available all the time;
  • The three types of refrigerators inside the Warehouse agent have the same behavior with different failure rate values.

3.2.4. Model Validation

Multiple simulation runs were conducted to validate the ABM model. The model validation followed the approach applied by [26] consisting of:
  • Face validation: the management of the warehouse facility approves the initial results of the simulation model.
  • Statistical validation: A subset of historical data of Out of Service (OOS) time for 400 days was compared with simulation model output. It has been found that there is about a 3% relative difference between the ABM and real data of OOS obtained from the facility which suggests the ABM is practical to be used.

3.3. Results of the Simulation

3.3.1. ABM Results

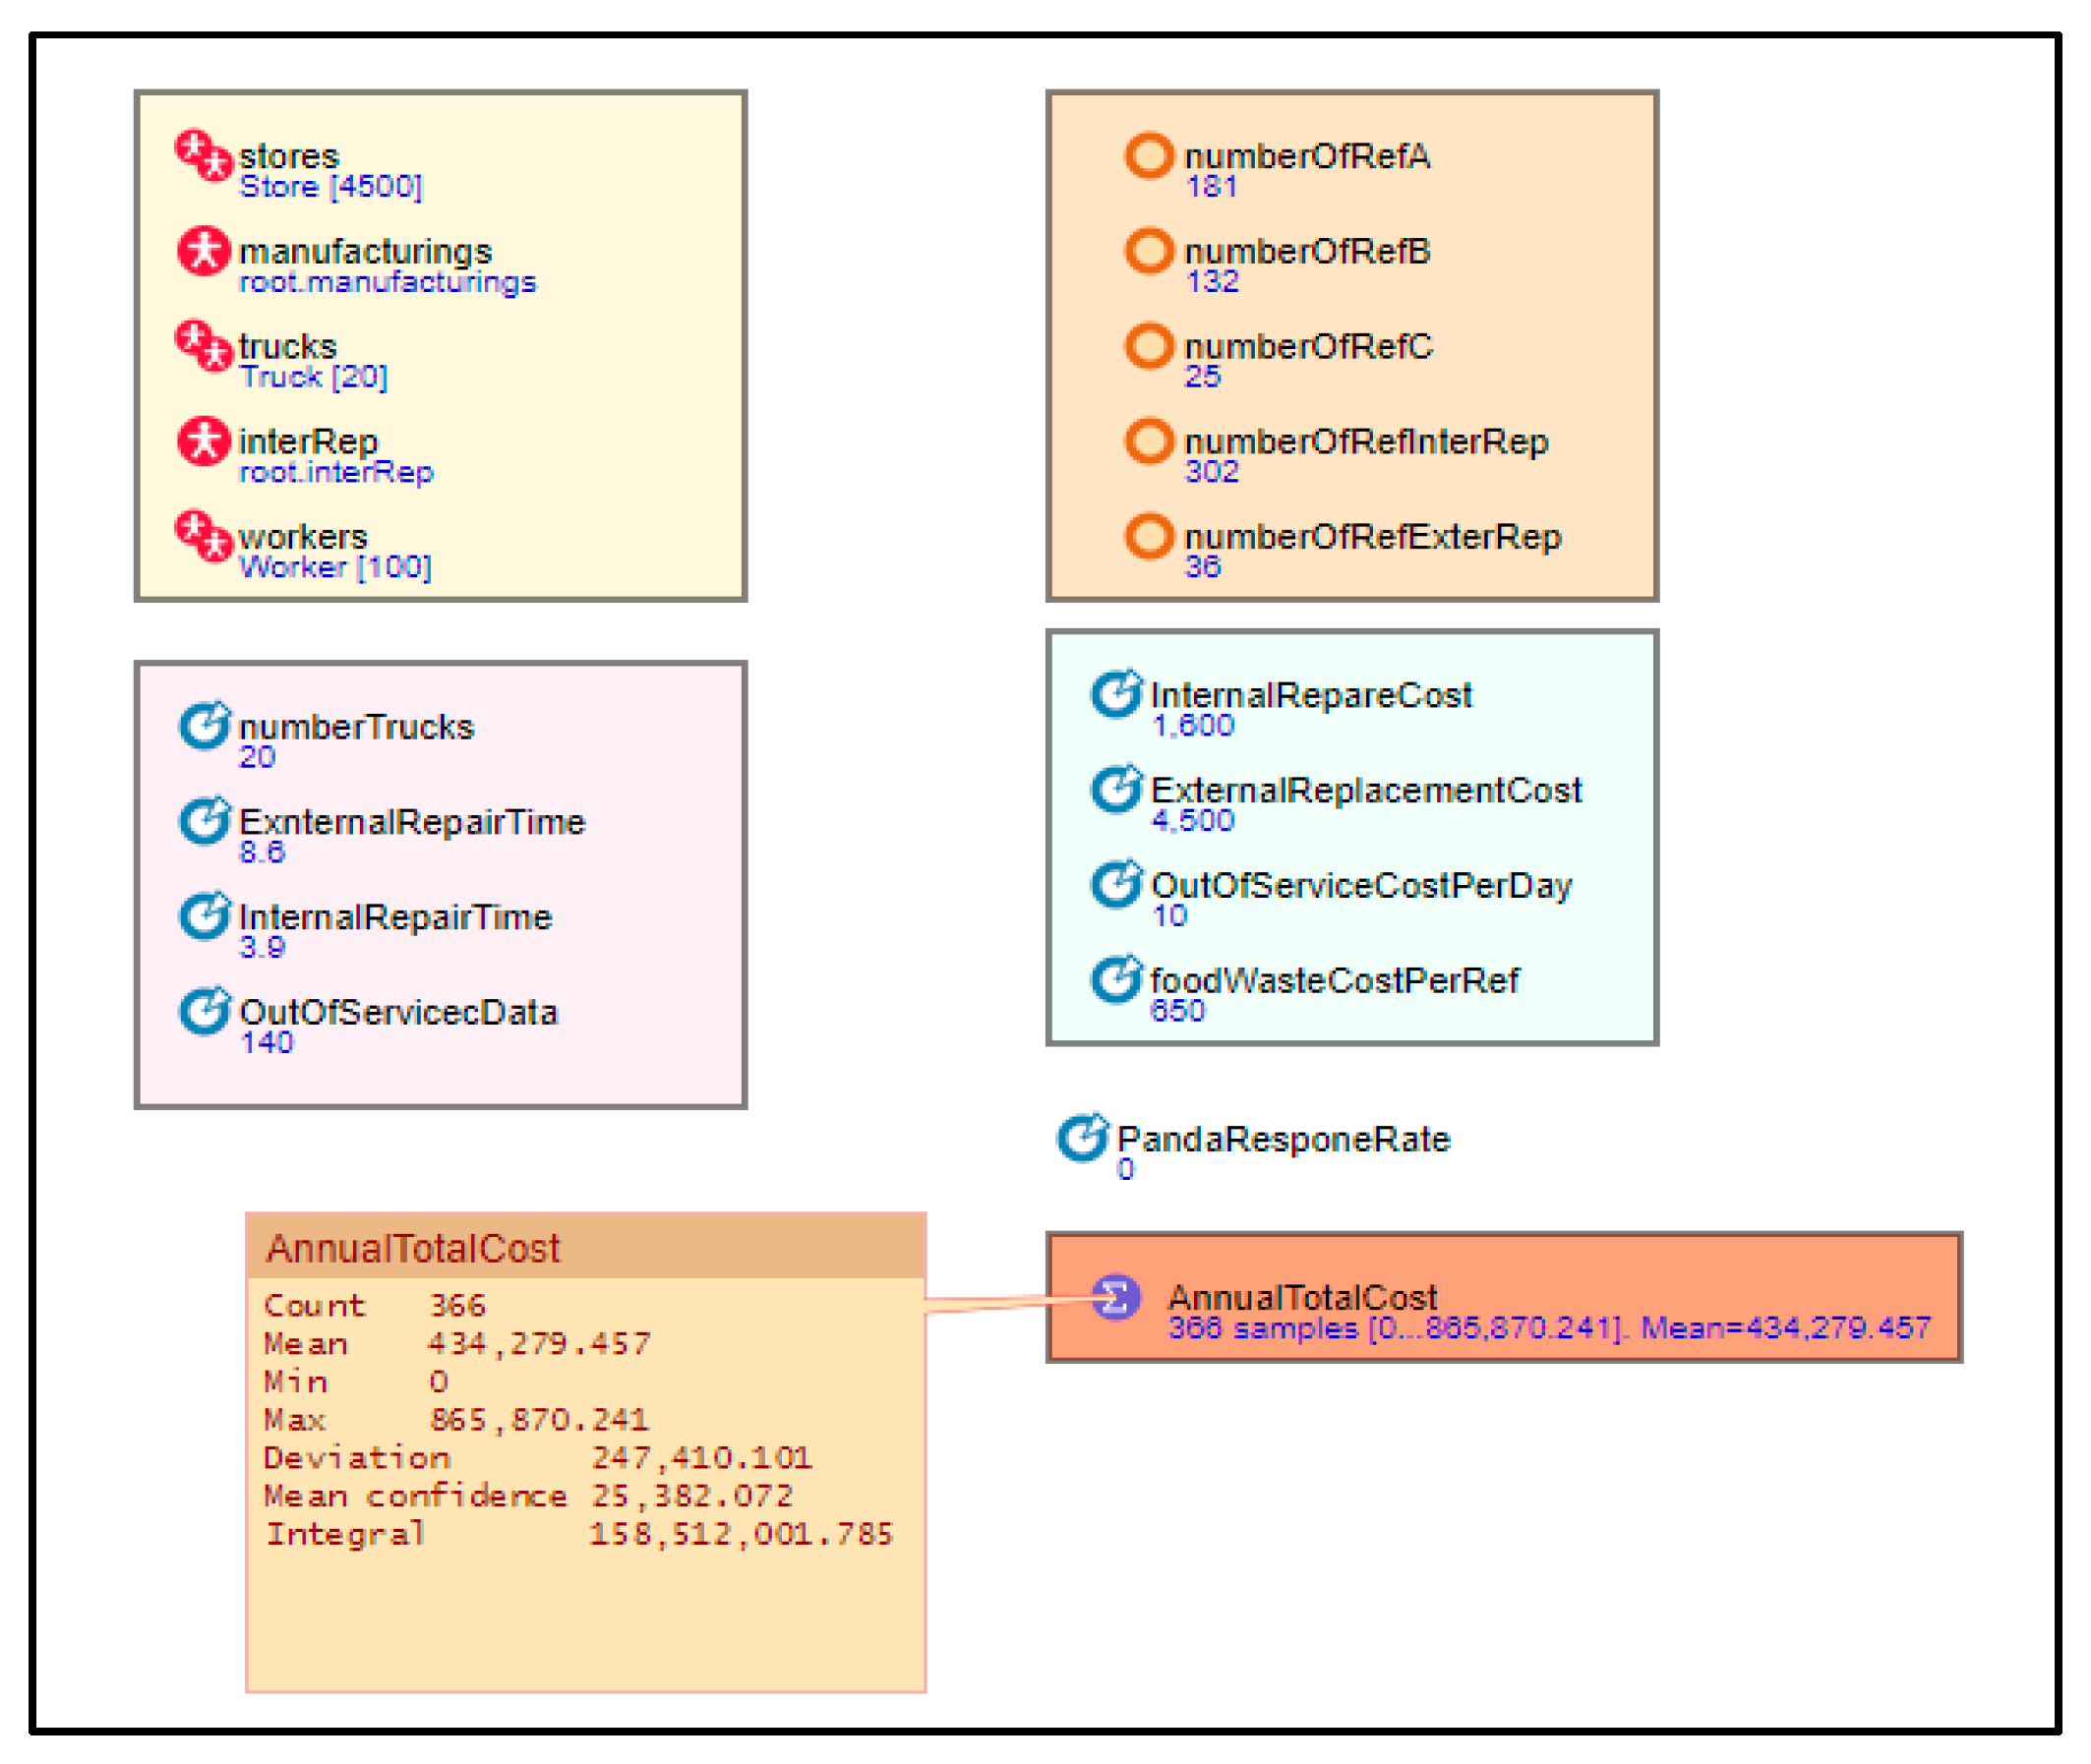
The Base Case model of ABM shows that the annual food waste and repair cost is $865,870.241 ± $25,382.072 with 338 failures per year (Figure 4).
It was estimated that the installation of IoT-based sensors to monitor the operating conditions of the refrigeration units, including the implementation of the predictive maintenance, would require an investment of $4 million.
The warehouse facility managers suggested a response rate to refrigerator failure to vary between 80% and 95%. One hundred simulation runs were conducted for 1 year (356 days) to evaluate the full spectrum of outputs that could be obtained. Table 2 shows that the average annual cost can be significantly reduced with a better failure rate.

3.3.2. Economic Analysis-Return on Investment

The return on investment (ROI) can be determined by:
Discounted   ROI   =   ( PV   cost - saving   PV   Investment ) PV   Investment
All costs including investment cost and cost-saving were discounted to their present value (PV) using an annual standard discount rate of 12.8%. Table 3 shows an example of the ROI calculation and payback period (year 9) when the failure rate is reduced by 90% and with 85% as a response rate considered by the warehouse facility.
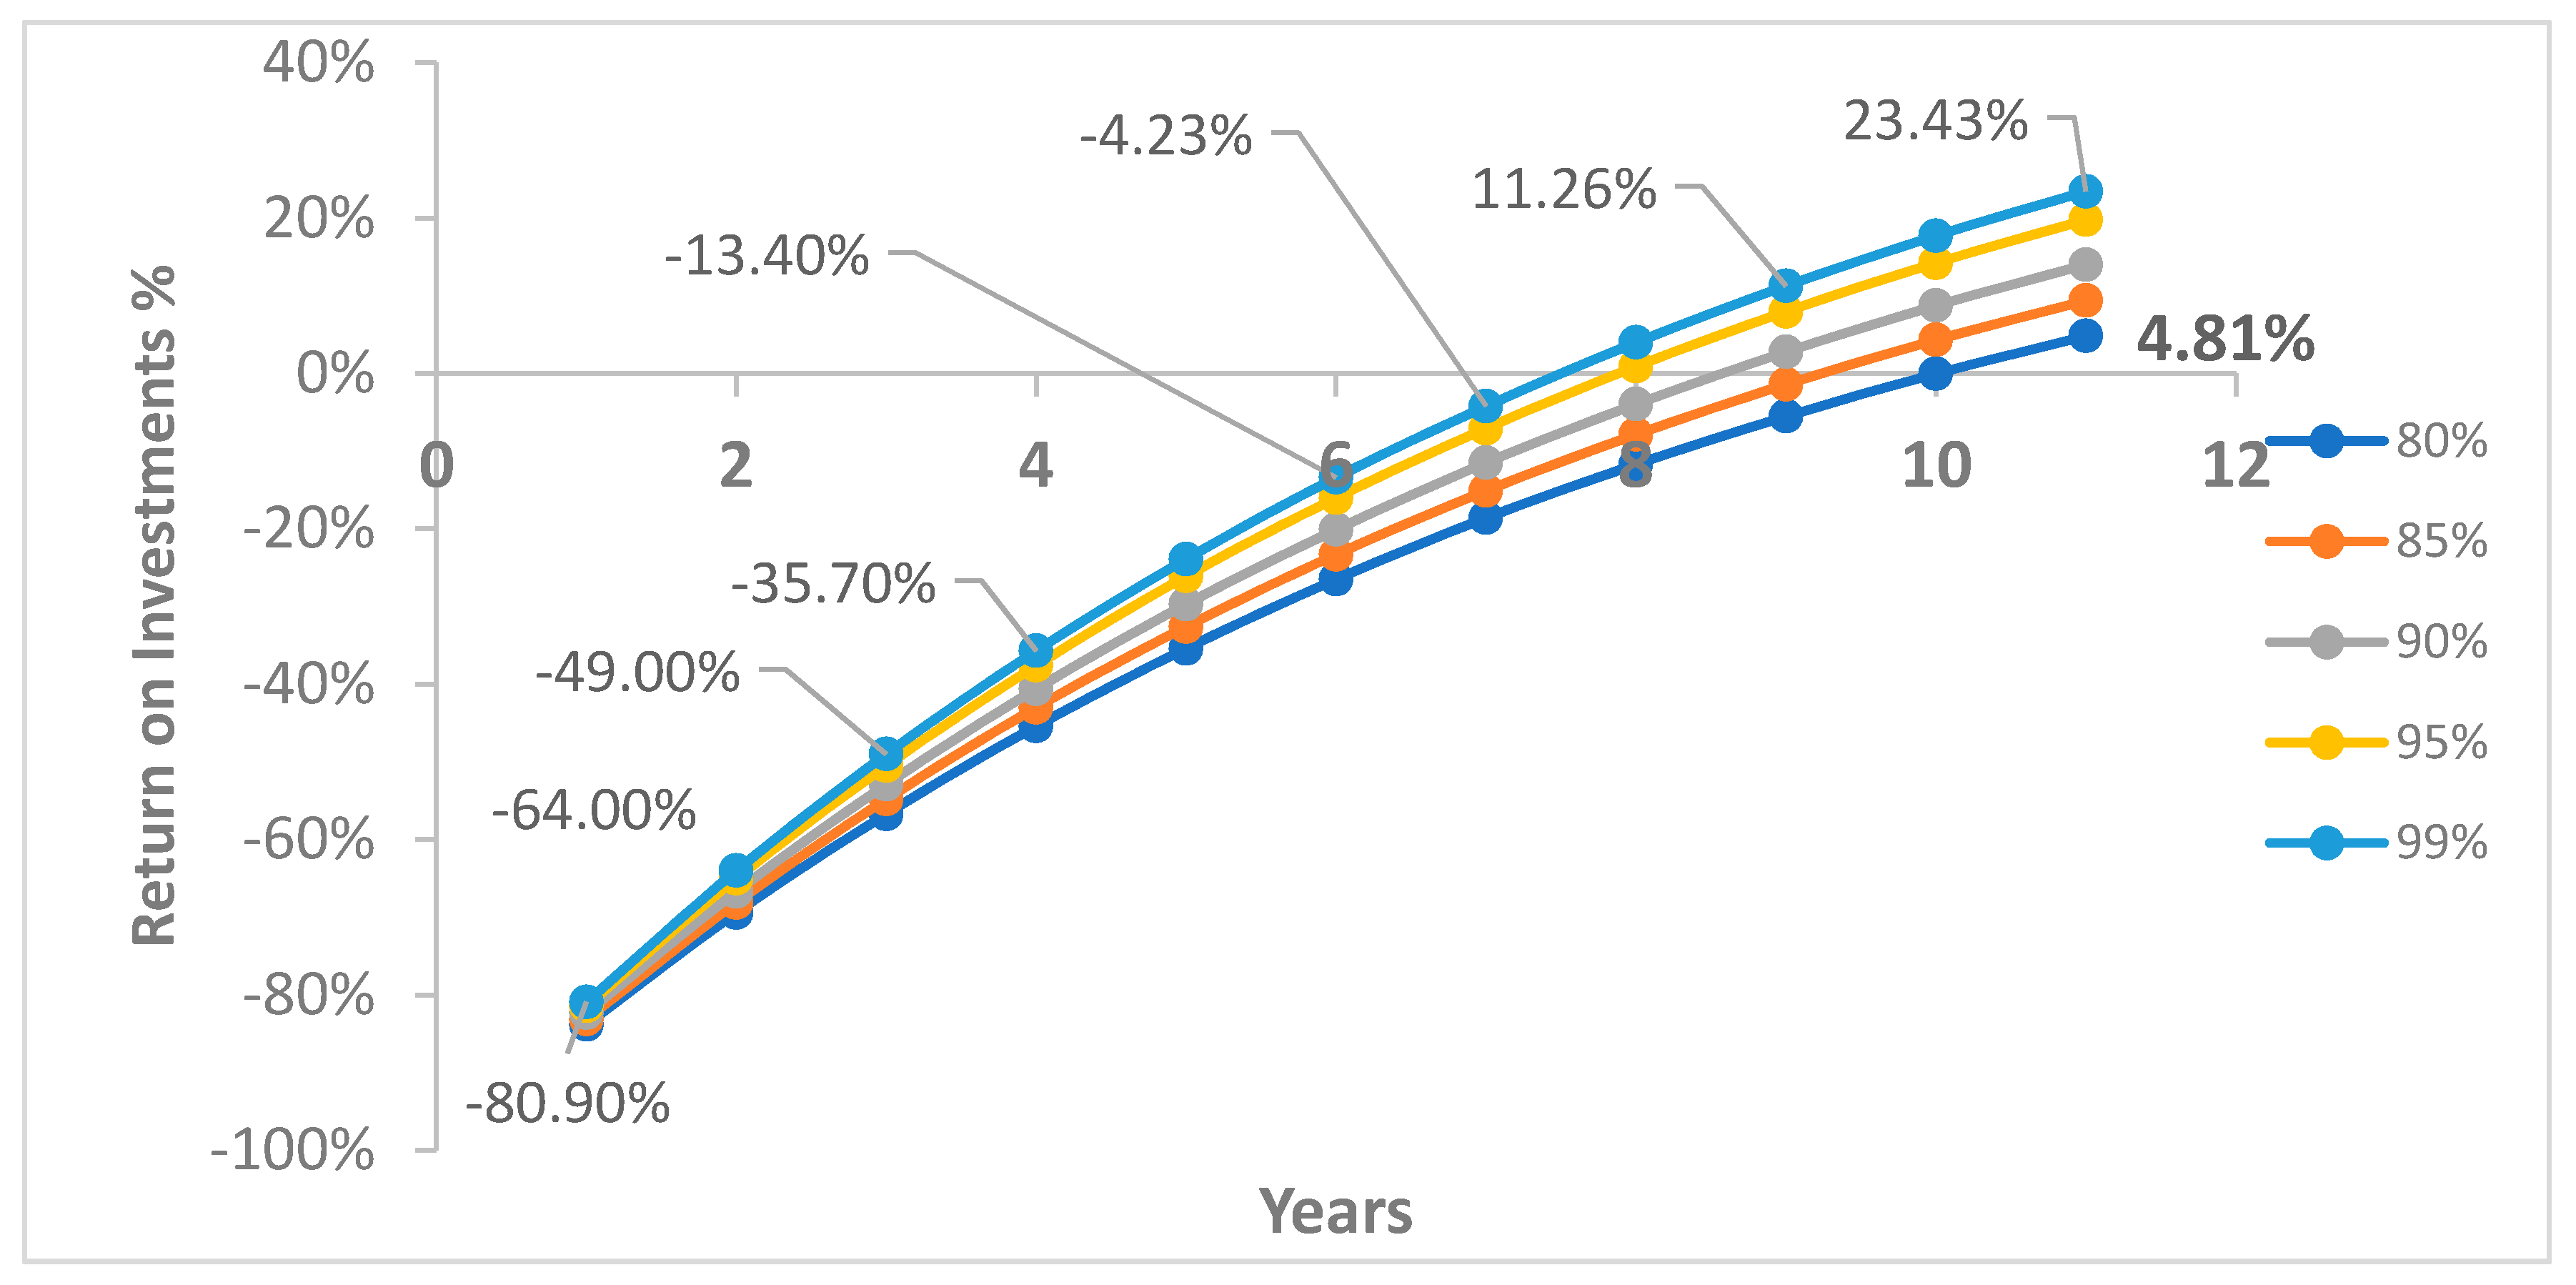
Table 4 and Figure 5 show a summary of Multi-Year ROI values of 85% response rate and Different failure reduction rate. Results show that a low failure reduction rate of 0.80 achieves positive ROI of 4.81% in year 11, while a high failure reduction rate of 0.99 shows an initial positive ROI of 3.98% as early as year 8 regardless of the warehouse facility response rate (given that the warehouse facility maintains its current response rate).

4. Case Study 2

4.1. Description of Manufacturing Environment

This study illustrates the use of distributed simulation in a smart auto-part manufacturing facility to identify the optimal or near optimal systems’ configuration [27]. The process consists of four sequential phases. (1) Shaping customers’ requirements into initial components, (2) capturing the process plan, (3) identifying the autonomous agents and their behavior within the system environment using messaging protocols, and (4) building a distributed simulation model to identify the system configuration. The case study also illustrates the integration of IoT architecture with the framework.

4.2. Description of the Agents in the Simulation Model

4.2.1. First Phase: Initial System Components Configuration

The framework starts with identifying initial system components configuration that consists of machines’ parameters matrix and an expert system’s components matrix to match the job requirements to the required machines’ capabilities and process type to perform the job. Subject matter expert was interviewed to fulfill the required information as shown in Table 5.
The machines’ parameters matrix is filled based on the machines selected in the previous table. Different parameters are taken into consideration in determining the throughput rate. Maintenance and manufacturing engineers are asked to fill these parameters as shown in Table 6. The parameters’ values are then inserted into the simulation model, explained later in phase 4 of the framework. These values serve as characters of each machine (agent). The interaction in the distributed model depends on it.

4.2.2. Second Phase: Process Plan

As shown in Table 6, different machines are required in manufacturing the part. Some operations are using automated machines, and some are manual. Since the case study is based on an existing facility, the study is limited by the available machines. Hence, assisting the utilization current situation is part of the study.

4.2.3. Third Phase: System Behavior

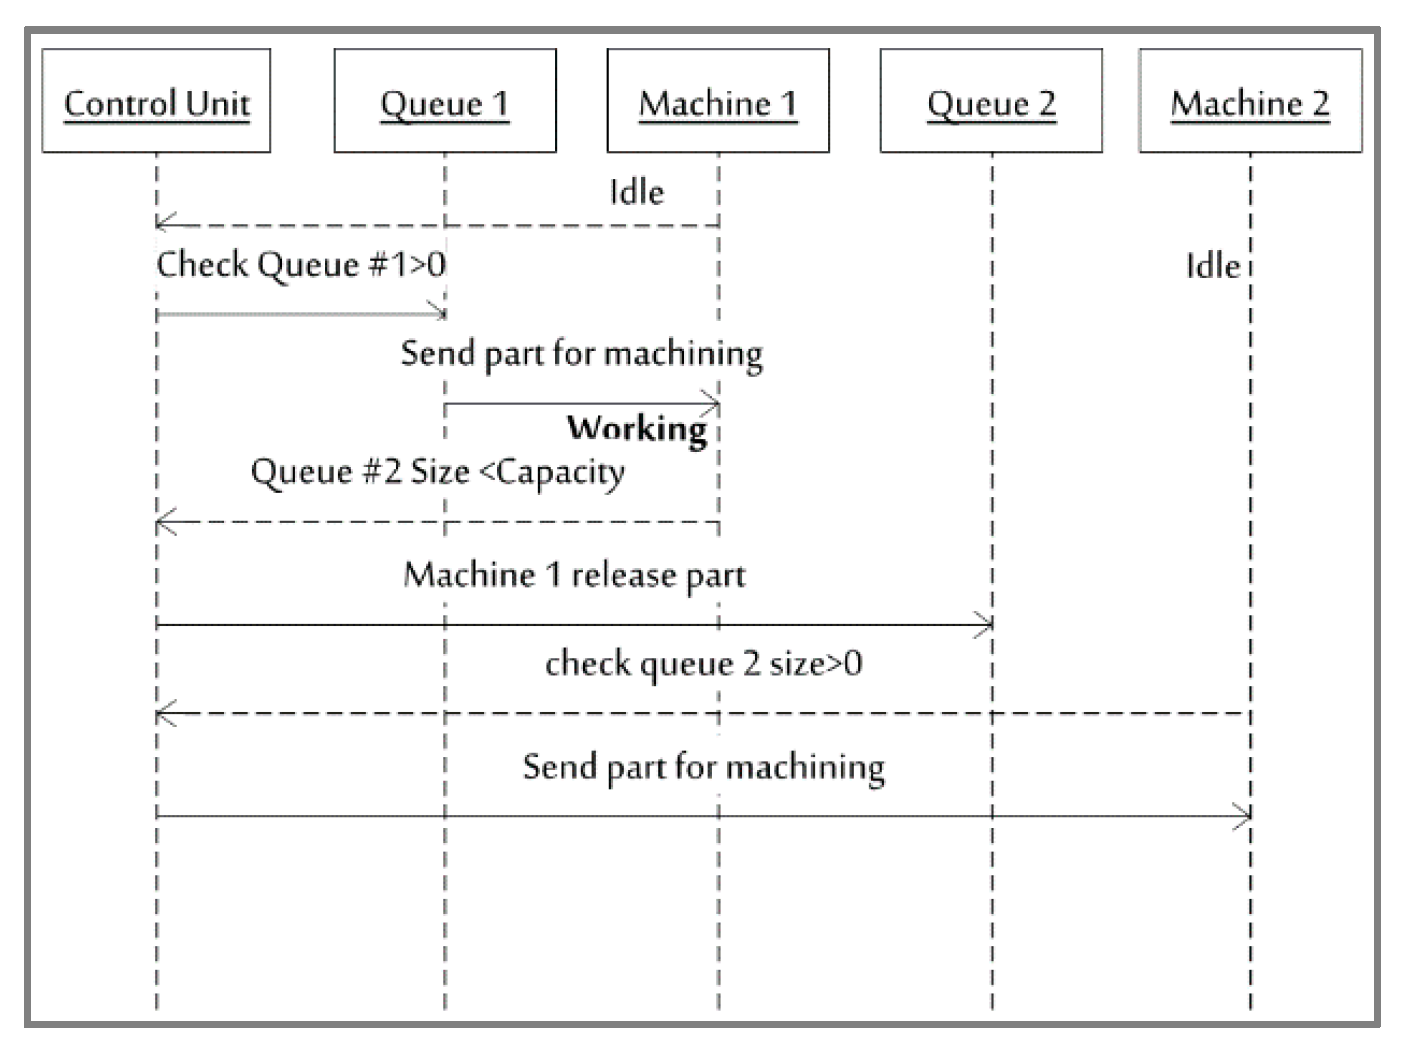
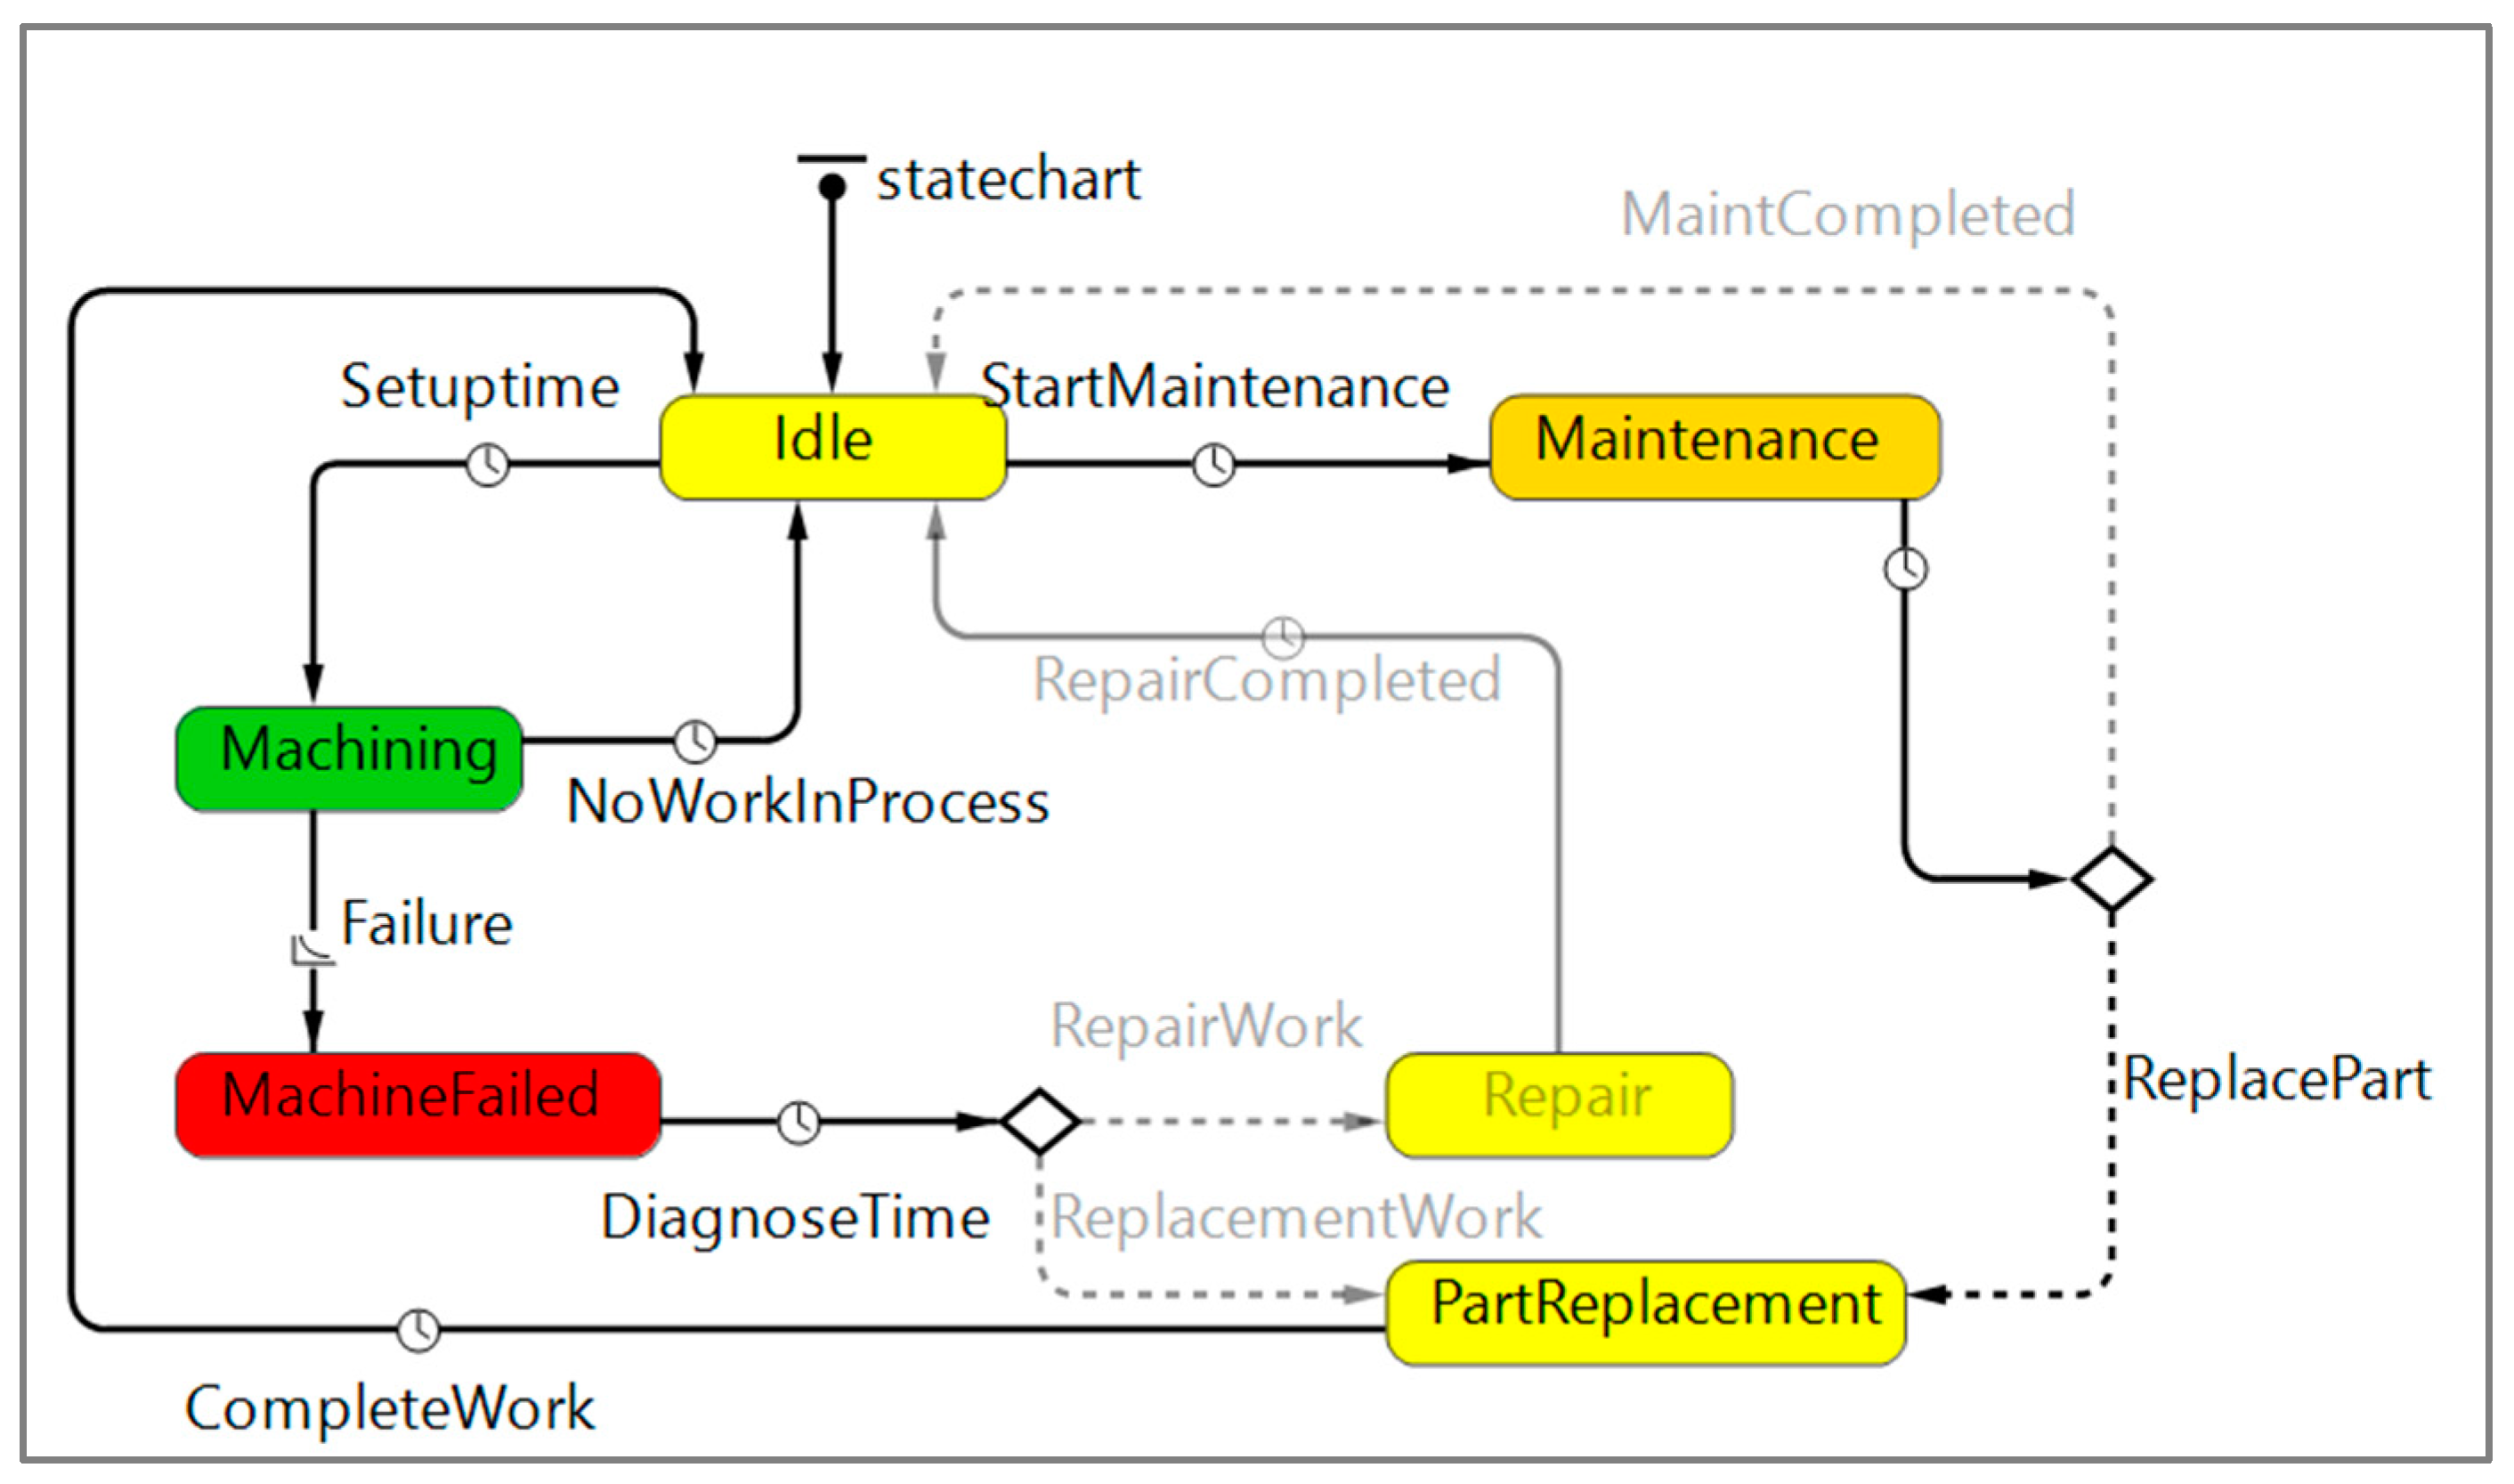
All phases are connected to design the distributed simulation model and, hence building it. Consequently, reaching the desired output. This phase provides the essential input to the model. The communication protocol between agents is designed here where messaging sequence diagram is created using unified modeling language (UML). As illustrated in Figure 6, each agent(machine) is communicating with its queue and the queue of the next machine through the control unit. This unit is responsible for managing the communication within the model. For example, an entity as a machine or queue will check with the control unit prior considering any action.
Statechart is another tool used in this phase. It is the foundation of the distributed model. As it depicts the different states of the agents. Figure 7 shows the transitions between different states. Each transition is triggered by an event or a certain statistical rate. A machine goes from idle to machining state when a part enters the system. However, during the machining process it might fail on average rate between 0.05 and 0.1. Each agent has a different statechart that shape its characteristics.

4.2.4. Forth Phase: System Configuration

At this stage, the fourth and final phase is reached, and a comprehensive view is available. Anylogic is a commercial and academic software used in this study to model the system. Different simulation models are used in mimicking the system that software enable this feature. A discrete event and distributed simulation are used. Different assumptions are considered including:
  • Availability of raw material;
  • Movement time is not considered;
  • First-in-first-out queue system;
  • No rework parts.
Statecharts are used for the agents(machines) and discrete event is used for the queues (Figure 8 and Figure 9) and shows the module respectively.

4.3. Results of the Simulation

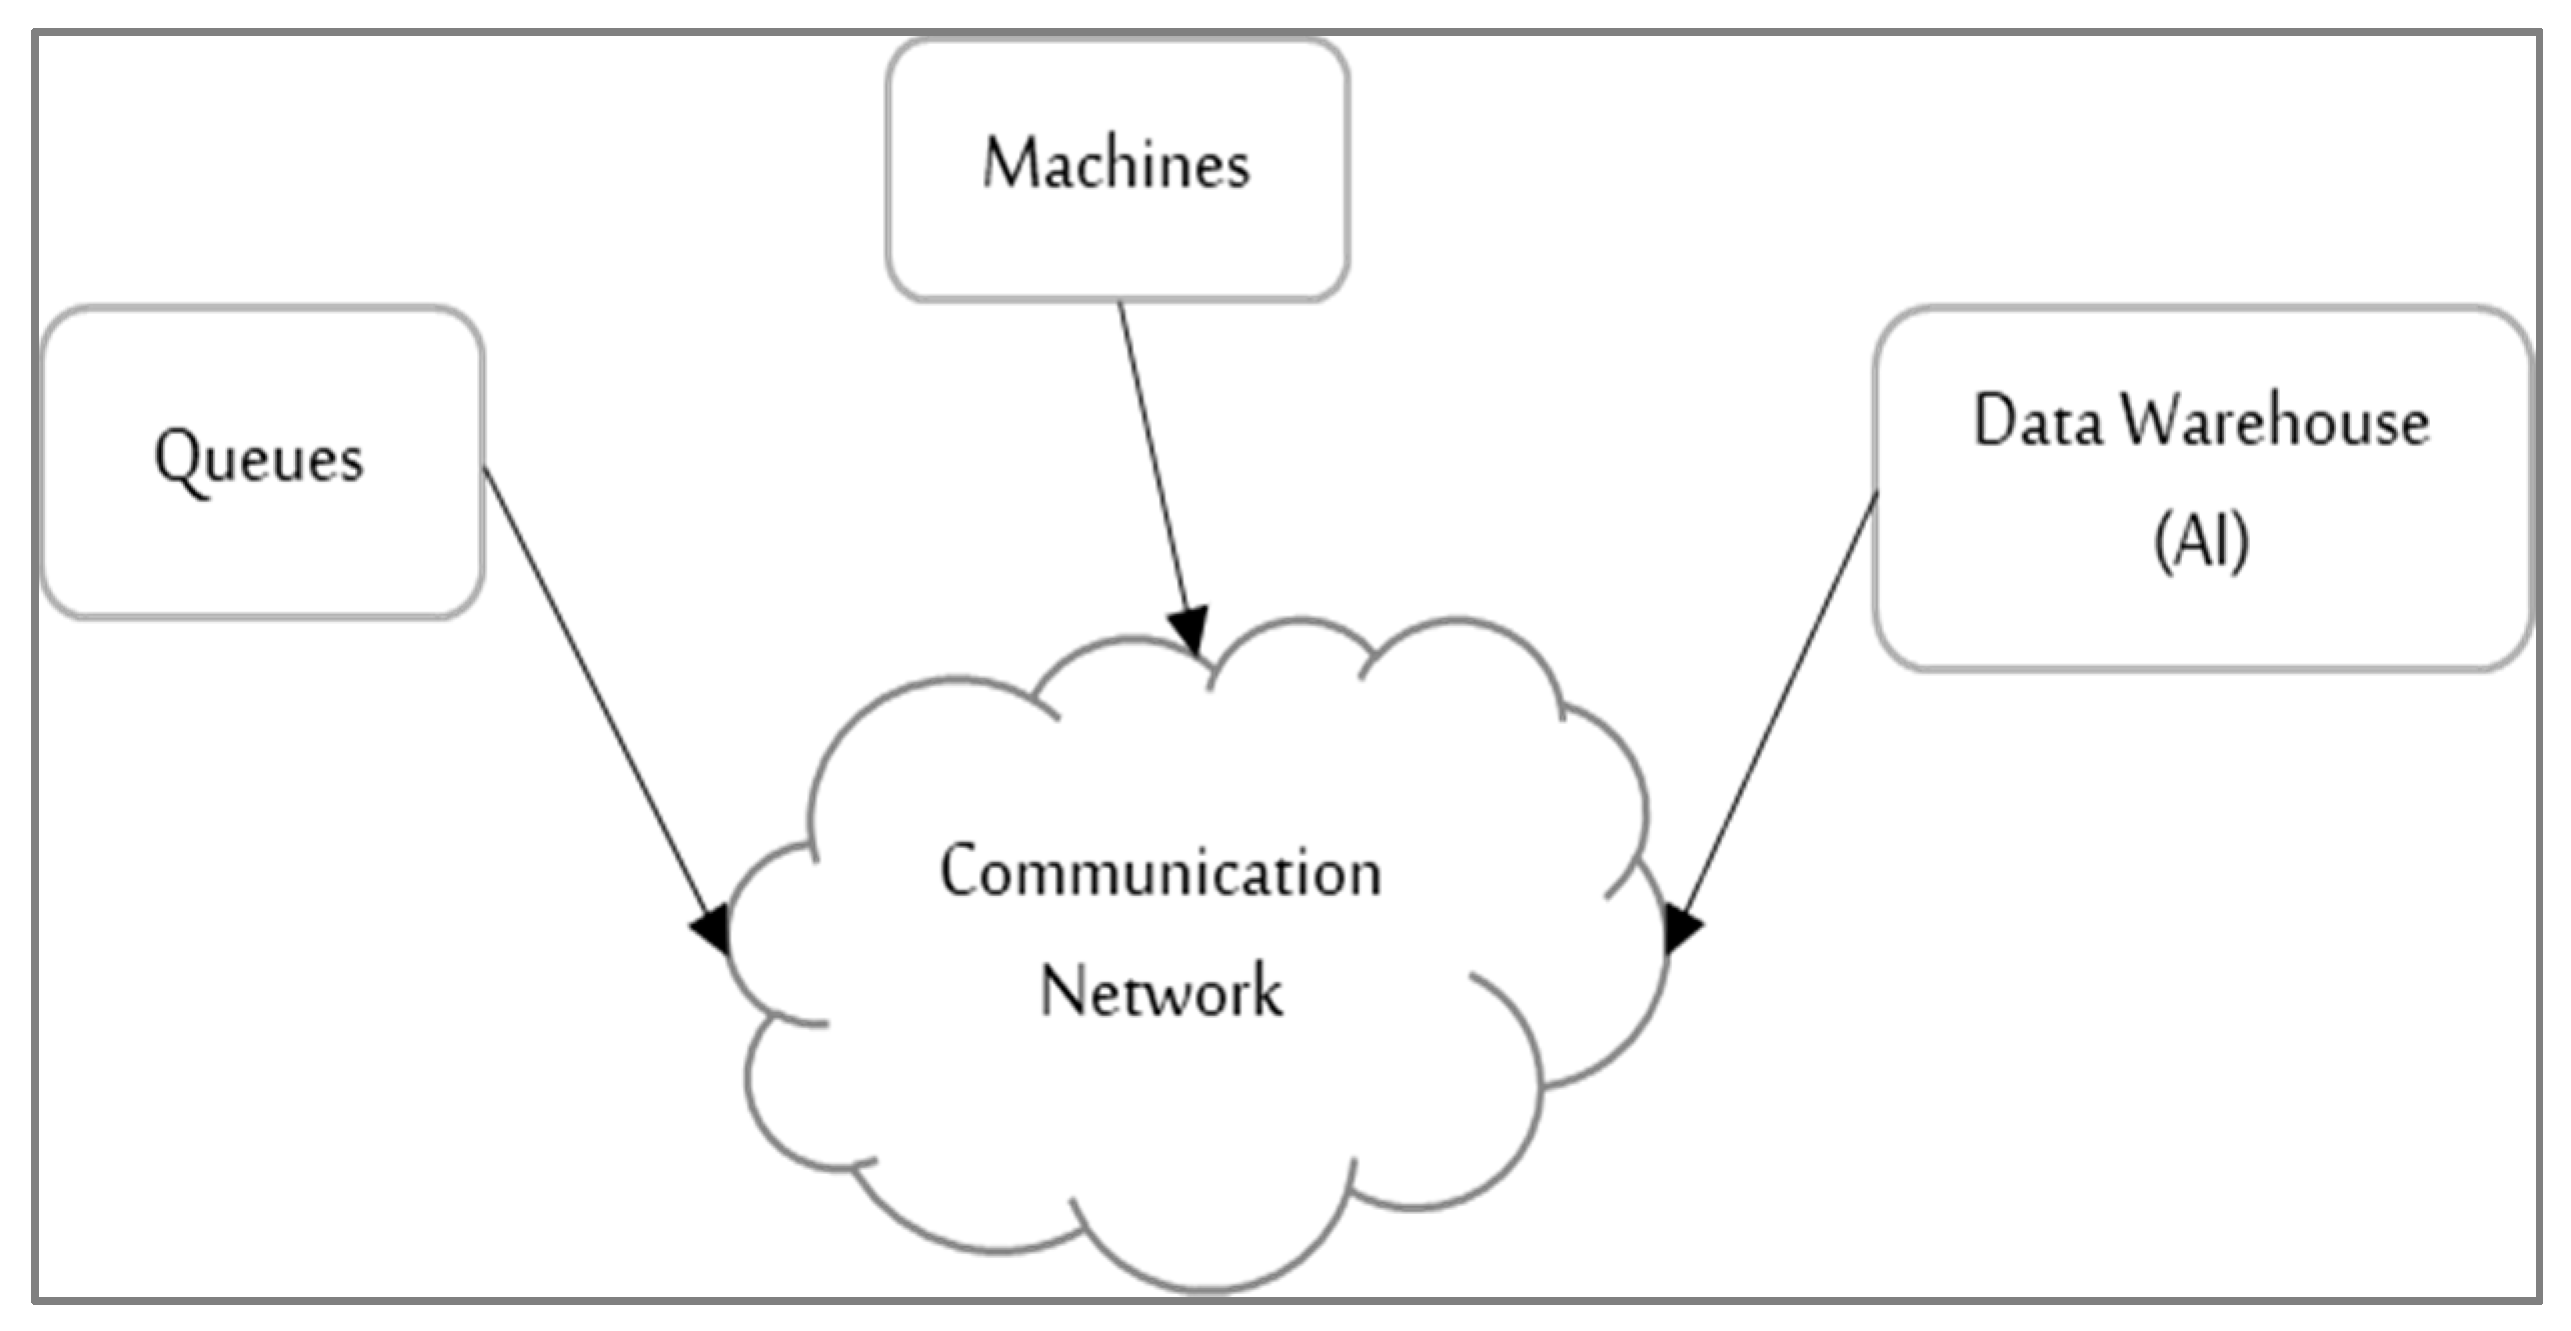
There are different entities where the system interacts (machines, queues, communication network, and data warehouse). Related and required data from the machines are collected including maintenance and failure rates are stored in a data warehouse to predict future events, Figure 10.
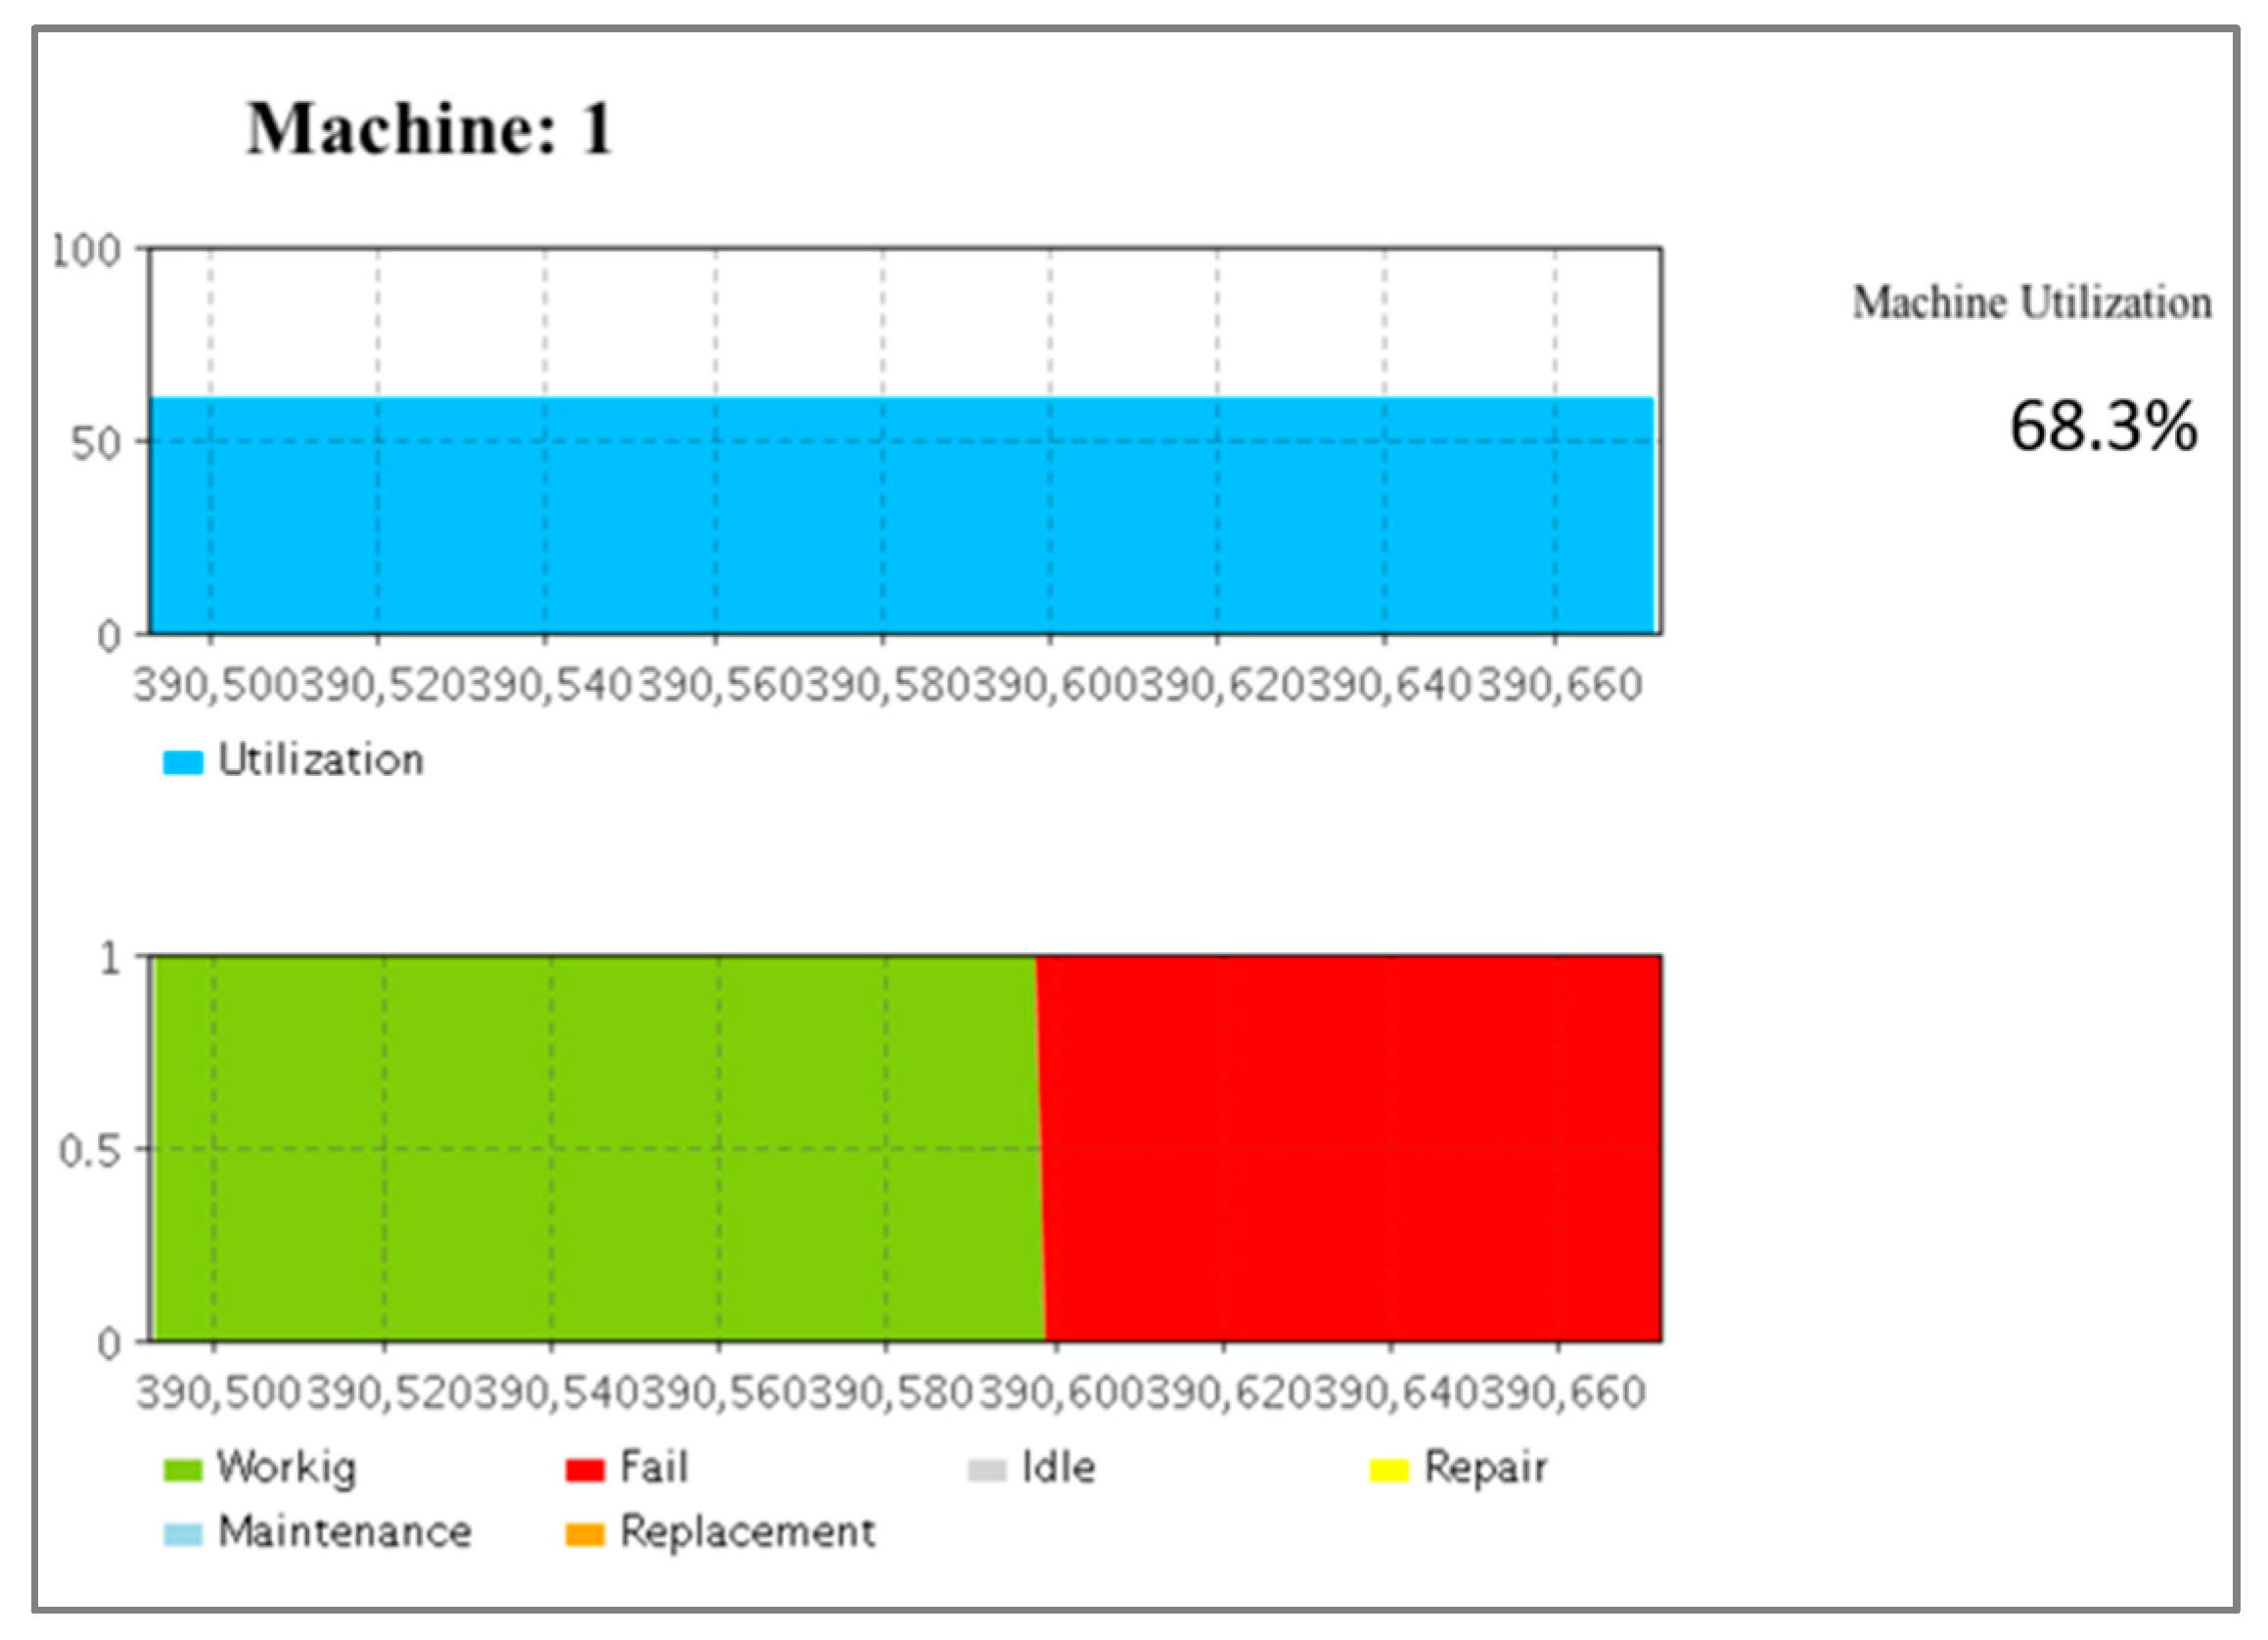
The performance indicators for the system are the throughput, work-in-process, and machines’ utilization. These are the results of the simulation mode. Throughput is calculated by dividing number of the finish parts by the runtime, while the utilization is calculated by dividing the machine’s working time by the availability of the machine.
The capacity of all machines is below 70% while the goal is having them running 85%. Therefore, a better configuration should take place. A sample of a machine utilization output from the model is depicted in Figure 11. Machines parameters are randomly generated based on table-xx (from machine parameters previous section). These parameters produced the characteristics of each agent that allows different agents to interact within the model.
Machines’ failure rate is considerably high. A maintenance predictive model is recommended while implementing IoT. Further financial analysis study needs to be conducted to evaluate the feasibility of the investment and its ROI.

5. Discussion

Two case studies are presented in this study to demonstrate the applicability of using agents as distributed simulation to test the feasibility of IoT technology. The first case study evaluates the economic viability of installing IoT sensors in the refrigeration units of a largest warehouse facility. IoT sensors help to enable predictive maintenance capabilities by constant remote monitoring. A hybrid simulation model includes multi-agent-based model, and discrete events simulation (DES) is developed to simulate the refrigerators behaviors and calculate the ROI of such investment
The second study is a framework that generates and optimizes manufacturing configuration applying ABM simulation model. The study exploits the communication between different agents within the system. The focus is on the utilization rate and system throughput. Therefore, the framework establishes guidelines for the decision maker in configuring a new system or evaluating a current one. The benefit relies on having the needed resources and machines.

Author Contributions

Conceptualization, K.N.; methodology H.B.; software M.B.; validation A.R.; formal analysis F.A.; data curation K.N.; writing—original draft preparation M.B. and K.N.; writing—review and editing A.R. and F.A.; supervision M.B.; project administration H.B. All authors have read and agreed to the published version of the manuscript.

Funding

This research received no external funding.

Conflicts of Interest

The authors declare no conflict of interest.

References

  1. Fortino, G.; Russo, W.; Savaglio, C. Agent-oriented modeling and simulation of IoT networks. In Proceedings of the 2016 Federated Conference on Computer Science and Information Systems, Gdańsk, Poland, 11–14 September 2016; Available online: http://ceur-ws.org/Vol-1664/w2.pdf (accessed on 22 September 2020).
  2. Aguzzi, S.; Bradshaw, D.; Canning, M.; Cansfield, M.; Carter, P.; Cattaneo, G.; Gusmeroli, S.; Micheletti, G.; Rotondi, D.; Stevens, R. Definition of a Research and Innovation Policy Leveraging Cloud Computing and IoT Combination; Final Report; European Commission, SMART: Toronto, ON, Canada, 2013. [Google Scholar]
  3. Van der Hoek, W.; Wooldridge, M. Multi-Agent Systems. Found. Artif. Intell. 2008, 3, 887–928. [Google Scholar]
  4. Andrei, B. From System Dynamics and Discrete Event to Practical Agent Based Modeling: Reasons, Techniques, Tools. In Proceedings of the 22nd International Conference of the System Dynamics Society, Oxford, UK, 25–29 July 2004. [Google Scholar]
  5. Borshchev, A. The Big Book of Simulation Modeling: Multimethod Modeling with AnyLogic 6; AnyLogic North America: Oakbrook Terrace, IL, USA, 2013. [Google Scholar]
  6. Brailsford, S.C. Modeling human behavior—An (id)entity crisis? In Proceedings of the Winter Simulation Conference 2014, Savannah, GA, USA, 7–10 December 2014. [Google Scholar]
  7. Axtell, R. Why Agents?: On the Varied Motivations for Agent Computing in the Social Sciences; Working Paper No. 1; Center on Social and Economic Dynamics: Washington, DC, USA, November 2000. [Google Scholar]
  8. Basingab, M. Investigating The Adoption of Internet of Things Technology Using Agent-Based Simulation. In Proceedings of the International Conference on Industrial Engineering & Operations Management, Bangkok, Thailand, 5–7 March 2019; pp. 1539–1550. [Google Scholar]
  9. Hurtado, N.; Ruiz, M.; Orta, E.; Torres, J. Using simulation to aid decision making in managing the usability evaluation process. Inf. Softw. Technol. 2015, 57, 509–526. [Google Scholar] [CrossRef] [Green Version]
  10. Plaza, S.; Ortega, N.; Celaya, A.; Sánchez, J.A.; López de Lacalle, L.N.; Izquierdo, B. About the importance of simulation tools in the learning process of metal forming and moulding. Mater. Sci. Forum 2011, 692, 1. [Google Scholar] [CrossRef]
  11. Ni, H.; Rui, Y.; Wang, J.; Cheng, L. A Synthetic method for atmospheric diffusion simulation and environmental impact assessment of accidental pollution in the chemical industry in a WEBGIS context. Int. J. Environ. Res. Public Health 2014, 11, 9238–9255. [Google Scholar] [CrossRef] [PubMed]
  12. Nealon, J.; Moreno, A. Agent-based applications in health care. In Applications of Software Agent Technology in the Health Care Domain; Springer: Berlin/Heidelberg, Germany, 2003; pp. 3–18. [Google Scholar]
  13. Cabrera, E.; Taboada, M.; Iglesias, M.L.; Epelde, F.; Luque, E. Optimization of healthcare emergency departments by agent-based simulation. Procedia Comput. Sci. 2011, 4, 1880–1889. [Google Scholar] [CrossRef] [Green Version]
  14. Macal, C.M.; North, M.J. Agent-based modeling and simulation. In Proceedings of the 2009 Winter Simulation Conference (WSC), Austin, TX, USA, 13–16 December 2009. [Google Scholar]
  15. Carley, K.M.; Fridsma, D.B.; Casman, E.; Yahja, A.; Altman, N.; Chen, L.C.; Kaminsky, B.; Nave, D. BioWar: Scalable agent-based model of bioattacks. IEEE Trans. Syst. Man Cybern. Part A Syst. Hum. 2006, 36, 252–265. [Google Scholar] [CrossRef]
  16. Savaglio, C.; Ganzha, M.; Paprzycki, M.; Bădică, C.; Ivanović, M.; Fortino, G. Agent-based Internet of Things: State-of-the-art and research challenges. Future Gener. Comput. Syst. 2020, 102, 1038–1053. [Google Scholar] [CrossRef]
  17. Yazan, D.M.; Fraccascia, L. Sustainable operations of industrial symbiosis: An enterprise input-output model integrated by agent-based simulation. Int. J. Prod. Res. 2020, 58, 392–414. [Google Scholar] [CrossRef]
  18. Fraccascia, L.; Yazan, D.M.; Albino, V.; Zijm, H. The role of redundancy in industrial symbiotic business development: A theoretical framework explored by agent-based simulation. Int. J. Prod. Econ. 2020, 221, 107471. [Google Scholar] [CrossRef]
  19. García-Magariño, I.; Gray, G.; Muttukrishnan, R.; Asif, W. Agent-based IoT Coordination for Smart Cities Considering Security and Privacy. IEEE 2019, 221–226. [Google Scholar] [CrossRef]
  20. Inaba, T. Used Product Acquisition Control by Financial Incentives in Remanufacturing. in 2019 IEEE International Conference on Industrial Engineering and Engineering Management (IEEM). IEEE 2019. [Google Scholar] [CrossRef]
  21. Kano, T.; Yasui, K.; Mikami, T.; Asally, M.; Ishiguro, A. An agent-based model for interrelation between COVID-19 outbreak and economic activities. arXiv 2020, arXiv:2007.11988. [Google Scholar]
  22. Cuevas, E. An agent-based model to evaluate the COVID-19 transmission risks in facilities. Comput. Biol. Med. 2020, 121, 103827. [Google Scholar] [CrossRef] [PubMed]
  23. Afrin Fauzya, R.; Fadillah, R. Multi-Agent simulation in the inter-organizational trust model and knowledge sharing in the automotive industry. J. Tek. Ind. 2019, 20, 161–171. [Google Scholar]
  24. García-Magariño, I.; Sendra, S.; Lacuesta, R.; Lloret, J. Security in Vehicles With IoT by Prioritization Rules, Vehicle Certificates, and Trust Management. IEEE Internet Things J. 2019, 6, 5927–5934. [Google Scholar] [CrossRef]
  25. Houston, C.; Gooberman-Hill, S.; Mathie, R.; Kennedy, A.; Li, Y.; Baiz, P. Case study for the return on investment of internet of things using agent-based modelling and data science. Systems 2017, 5, 4. [Google Scholar] [CrossRef] [Green Version]
  26. Klügl, F. A validation methodology for agent-based simulations. In Proceedings of the 2008 ACM Symposium on Applied Computing, Fortaleza, Ceará, Brazil, 16–20 March 2008. [Google Scholar]
  27. Nagadi, K.; Rabelo, L.; Basingab, M.; Sarmiento, A.T.; Jones, A.; Rahal, A. A hybrid simulation-based assessment framework of smart manufacturing systems. Int. J. Comput. Integr. Manuf. 2018, 31, 115–128. [Google Scholar]
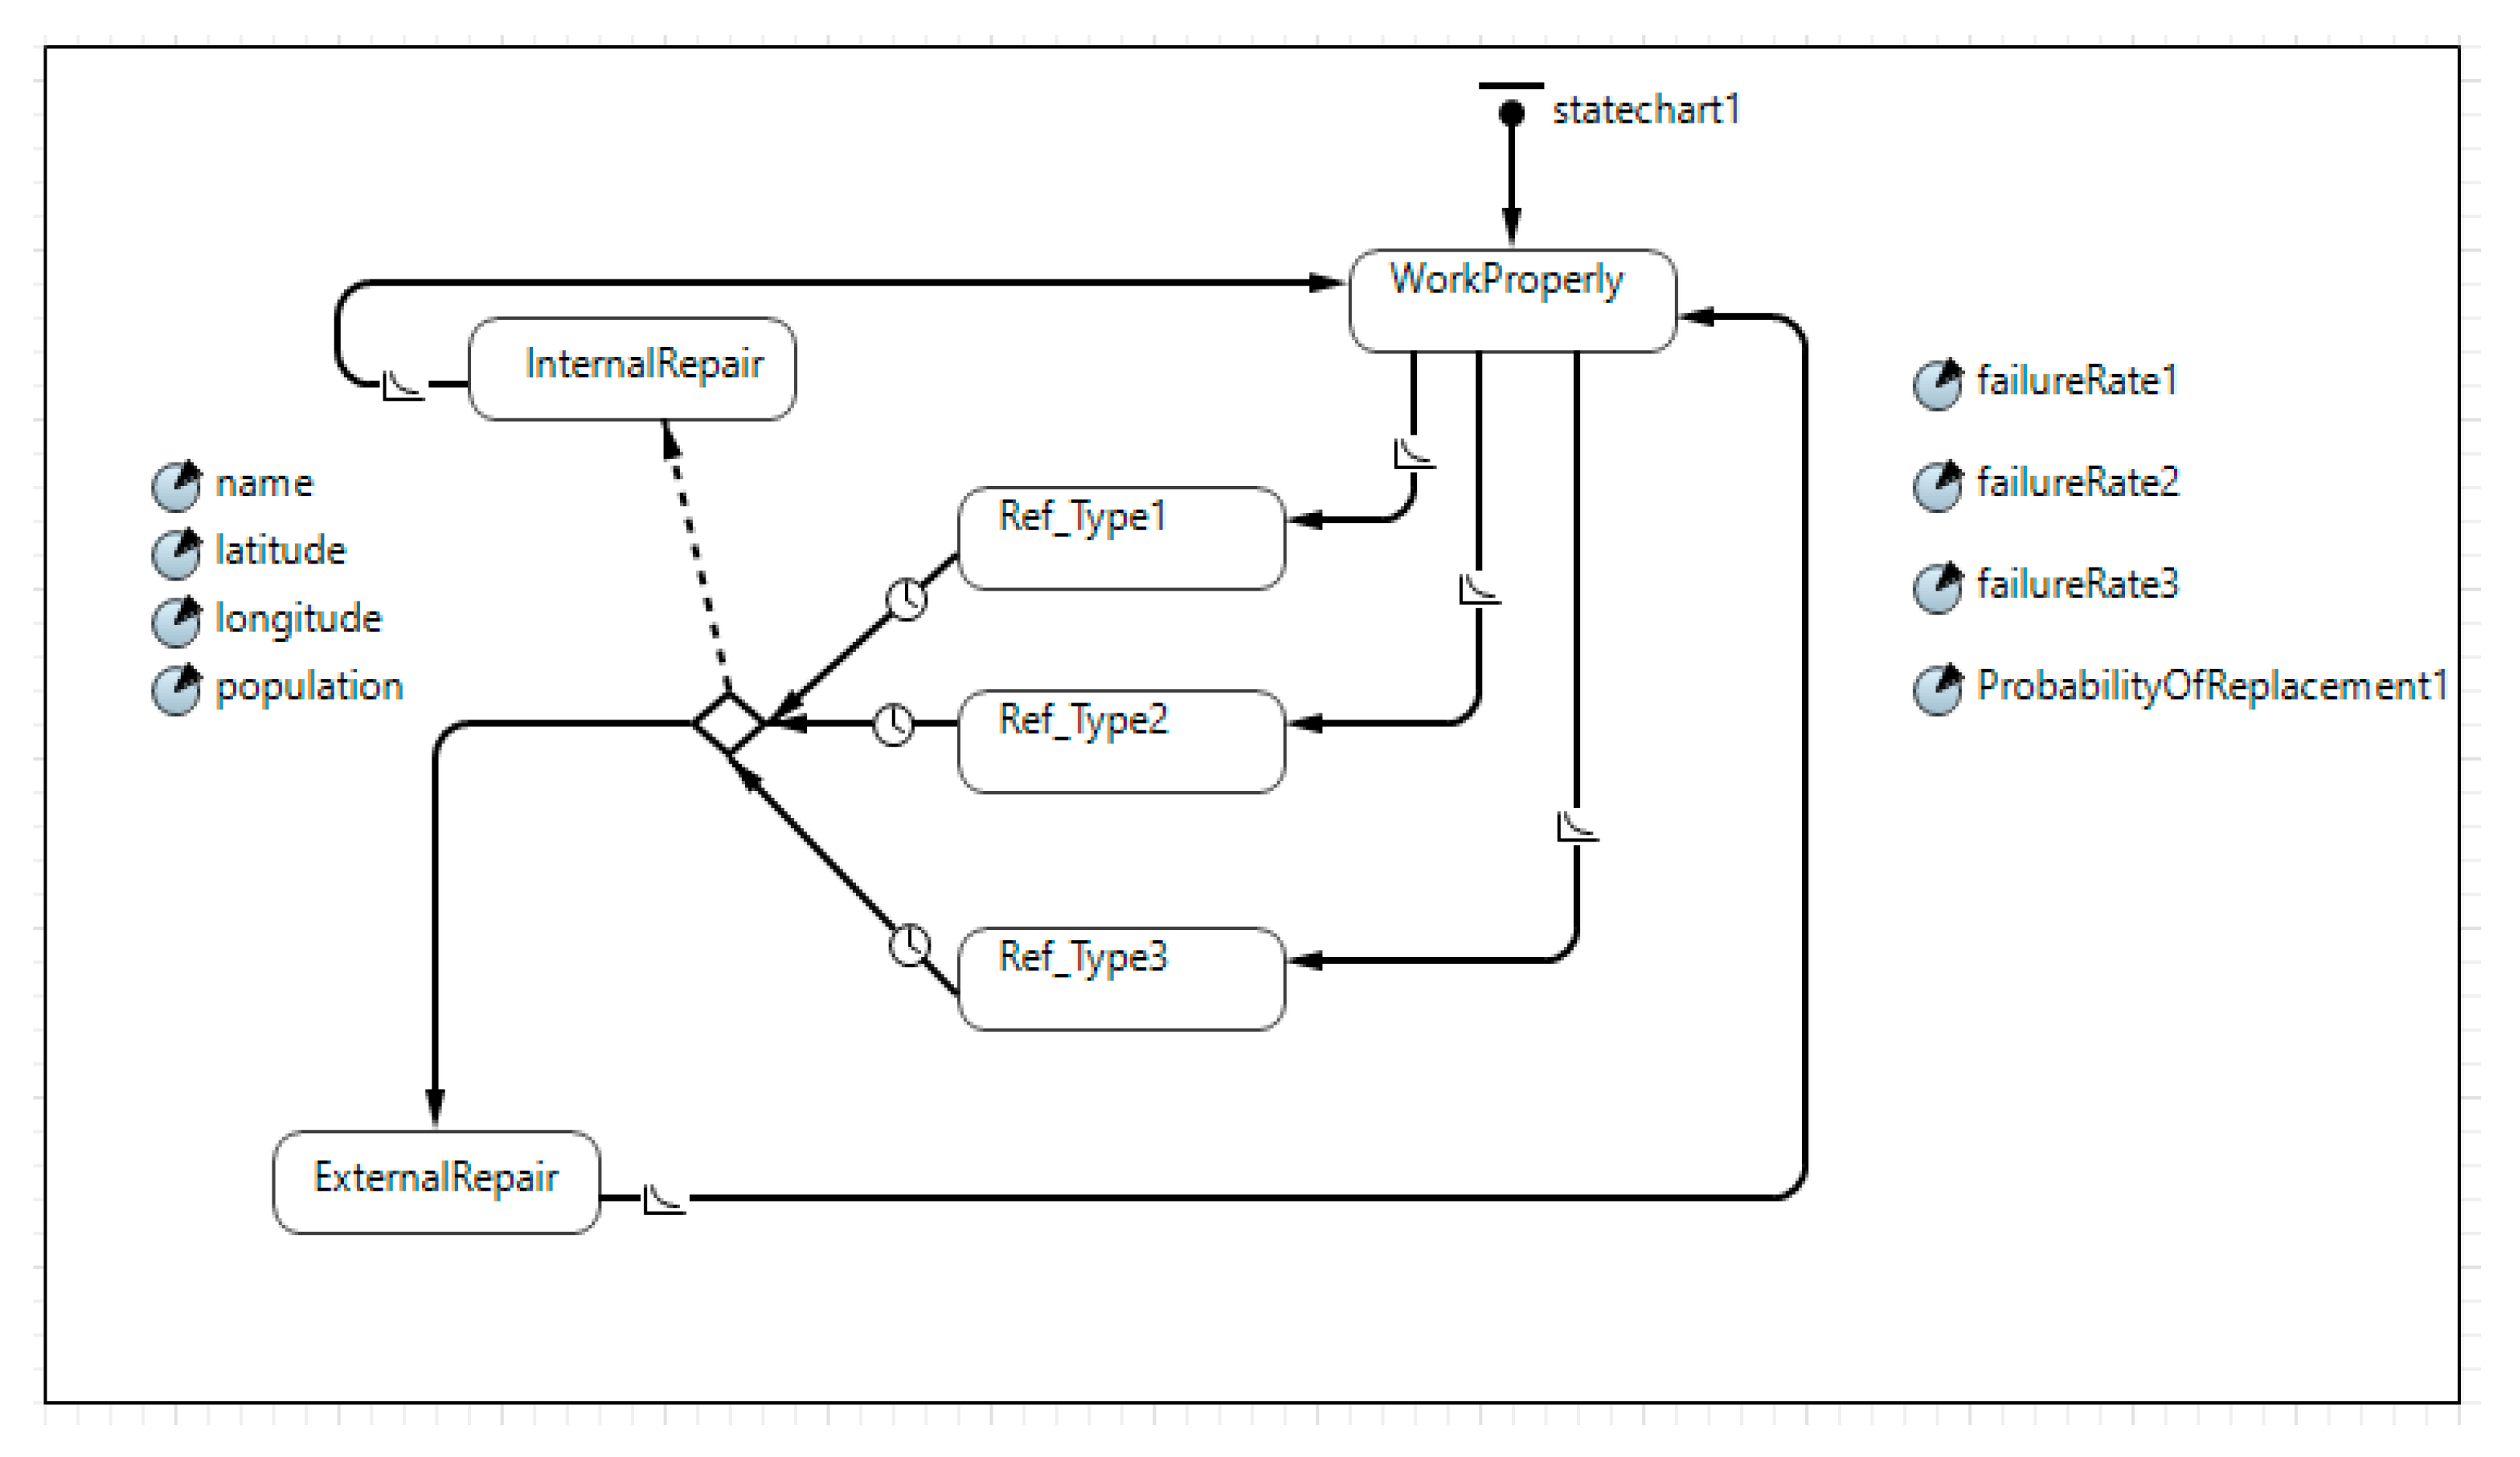
Figure 1. Warehouse agent statechart.
Information 11 00458 g001
Figure 2. Discrete events simulation (DES) processing modeling logic.
Information 11 00458 g002
Figure 3. Hybrid simulation model.
Information 11 00458 g003
Figure 4. Total base case model cost.
Information 11 00458 g004
Figure 5. Summary of multi-year ROI values for different failure reduction rates.
Information 11 00458 g005
Figure 6. Messaging sequence diagram.
Information 11 00458 g006
Figure 7. Statechart.
Information 11 00458 g007
Figure 8. Discrete-event and agent-based model communication.
Information 11 00458 g008
Figure 9. Machine setup transition.
Information 11 00458 g009
Figure 10. Information flow.
Information 11 00458 g010
Figure 11. Machine utilization.
Information 11 00458 g011
Table 1. Simulation input parameters.
ParameterValue
Repair Time5 h
Number of Refrigeration units4500 Refrigerators
Number of Store locations150 Stores
Average Refrigeration unit/Store30 Refrigerators
Truck Loading TimeUniform (2,3) h
Truck Speed60 km/h
Cost of Repair/Refrigerator$3000
Cost of food waste/Refrigerator$650
Table 2. Average annual cost for different response and failure rates.
Response Rate
Failure Rate Reduction80%85%90%95%
80%$137,425 $134,955 $132,485 $130,015
85%$105,801 $103,164 $101,246 $99,329
90%$72,180 $70,850 $69,580 $68,281
95%$31,169 $30,584 $29,999 $29,414
99%$5195 $5098 $5000 $4902
Table 3. Return on investment (ROI) calculation with response rate = 85% and failure reduction rate = 90%.
Years0123456789
Cost Saving $795,020$795,020$795,020$795,020$795,020$795,020$795,020$795,020$795,020
PV(CS) $704,805$624,827$553,925$491,068$435,344$385,943$342,148$303,323$268,903
Total PV(CS) $704,805$1,329,631$1,883,556$2,374,624$2,809,967$3,195,911$3,538,059$3,841,382$4,110,285
Investment4 M
PV(Invest)4 M
ROI −82.38%−66.76%−52.91%−40.63%−29.75%−20.10%−11.55%−3.97%2.76%
Table 4. Summary of multi-year ROI values for different failure reduction rates.
Response Rate = 0.85ROI in Each Year
Failure Reduction Rate1234567891011
80%−83.8%−69.4%−56.7%−45.4%−35.4%−26.5%−18.6%−11.7%−5.53%−0.05%4.81%
85%−83.1%−68.1%−54.8%−43.0%−32.6%−23.3%−15.1%−7.87%−1.42%4.30%9.37%
90%−82.3%−66.7%−52.9%−40.6%−29.7%−20.1%−11.5%−3.97%2.76%8.72%14.00%
95%−81.4%−65.0%−50.5%−37.6%−26.1%−16.0%−7.07%0.90%7.96%14.22%19.77%
99%−80.9%−64.0%−49.0%−35.7%−23.9%−13.4%−4.23%3.98%11.26%17.71%23.43%
Table 5. Type of machines.
Types of MachinesCNC Vertical CNC Horizontal Manual OperationTapping
SectionsMillingDrillingDeburringTapping (Threading)
Operations
Thickness
Alignment
Bolt Holes
Perpendicularity
Table 6. Machines’ parameters.
No.ParametersUnitCNC Horizontal Machine (Drilling)CNC Vertical Machine (Milling)Tapping Machine
Minimum ValueMaximum ValueMinimum ValueMaximum ValueMinimum ValueMaximum Value
1Process Mean TimeSec.100140801003050
2Maintenance PeriodDays8010070905090
3Mean Time of MaintenanceMin.204545602030
4Average Rate of Failure 0.050.10.050.10.050.1
5Mean Time of RepairMin.306030603060
6Mean Time of ReplacementMin.204020402040
7Percentage of Replacement 0.10.20.10.20.10.2
8Diagnose TimeMin.102880102880102880
9Buffer SizePart50 50 50