Interactional and Informational Attention on Twitter


Abstract
1. Introduction
2. Related Work
3. Definitions and Empirical Protocol
3.1. Dataset
3.2. Definitions and Notations
- We are interested in the cognitive filtering process that occurs between followed sources (and followees’ publications) and the actual attention devoted to them. We contend that this constitutes a consistent system that enables us to properly compare what users are exposed to with what they retain. Retweeting is admittedly an ambiguous activity: it has long been considered to be influenced by a variety of temporal and individual factors, either observed [27,28] or hypothesized [29], and has been shown to range from simple acknowledgement to tentative conversation engagement [30]. Yet, it also positively denotes the fact that someone tangibly read a tweet (not necessarily the linked content) among the sources they follow and is minimally interested in the topics evoked in that tweet.
- We jointly consider interactional and informational attention. In this respect, focusing on retweets provides a uniform way to discuss social and semantic attention. In the case of semantic attention, we will nonetheless later show that results are consistent when considering all tweeting activities or just retweets: this further suggests that it remains sound to study both types of attention through retweets only.
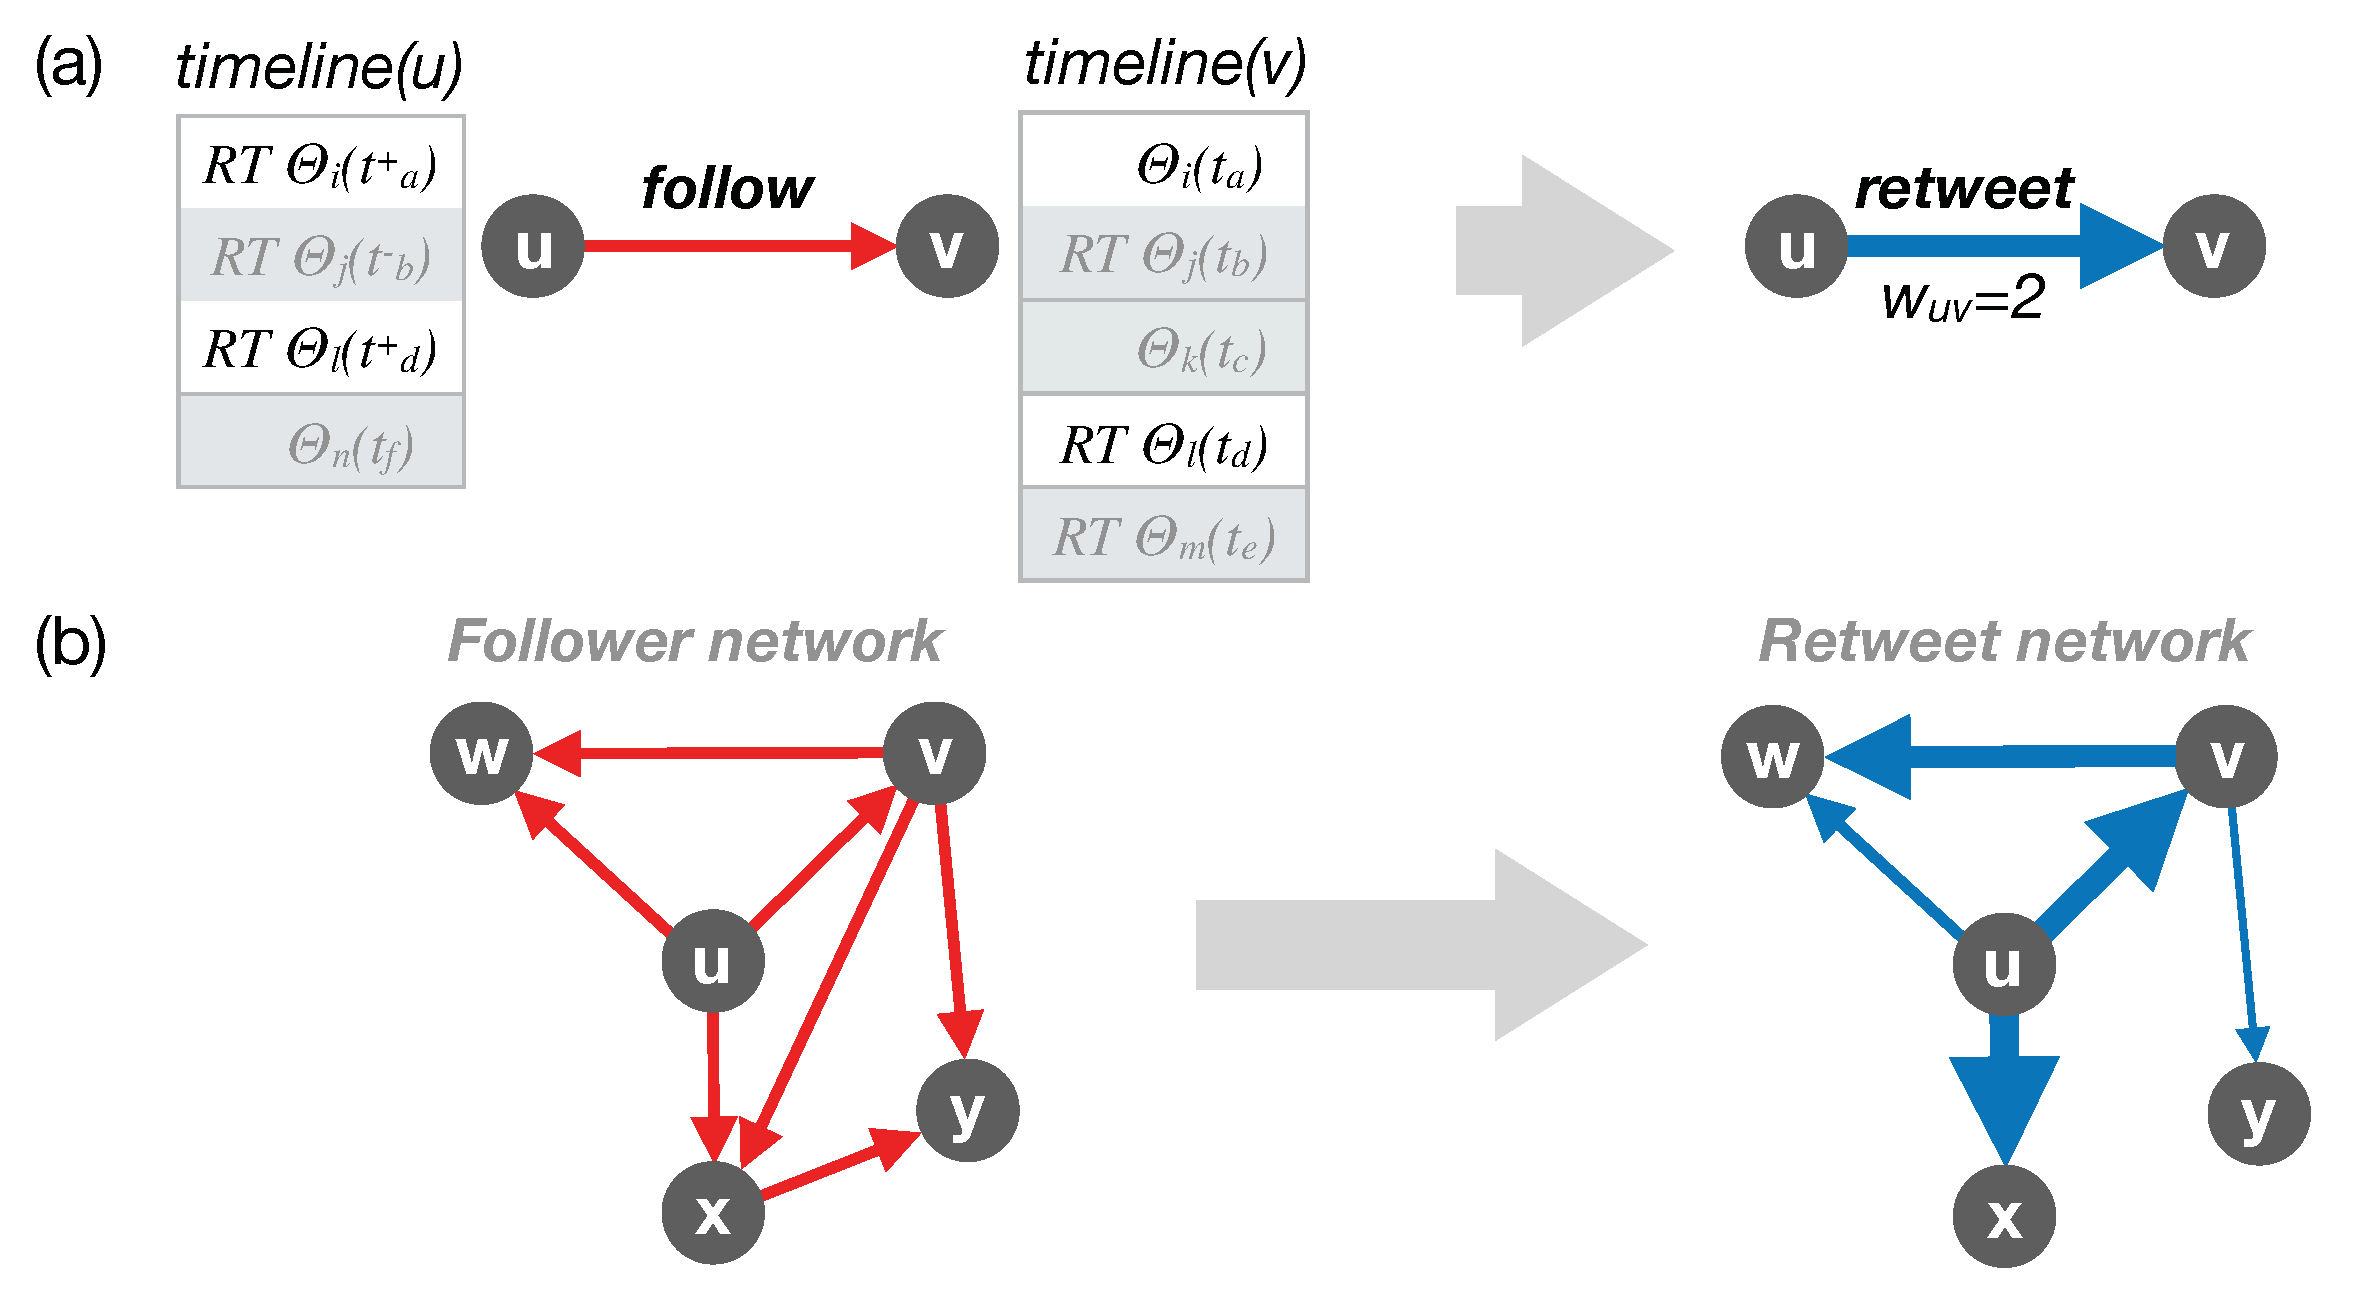
- the follower network at t by adding a directed link if u follows v at t, representing potential attention of u to v (as schematically shown in Figure 1a,b left panels). The out-degree of u in that network directly denotes the number of followees of u, while the in-degree denotes the number of followers of v.
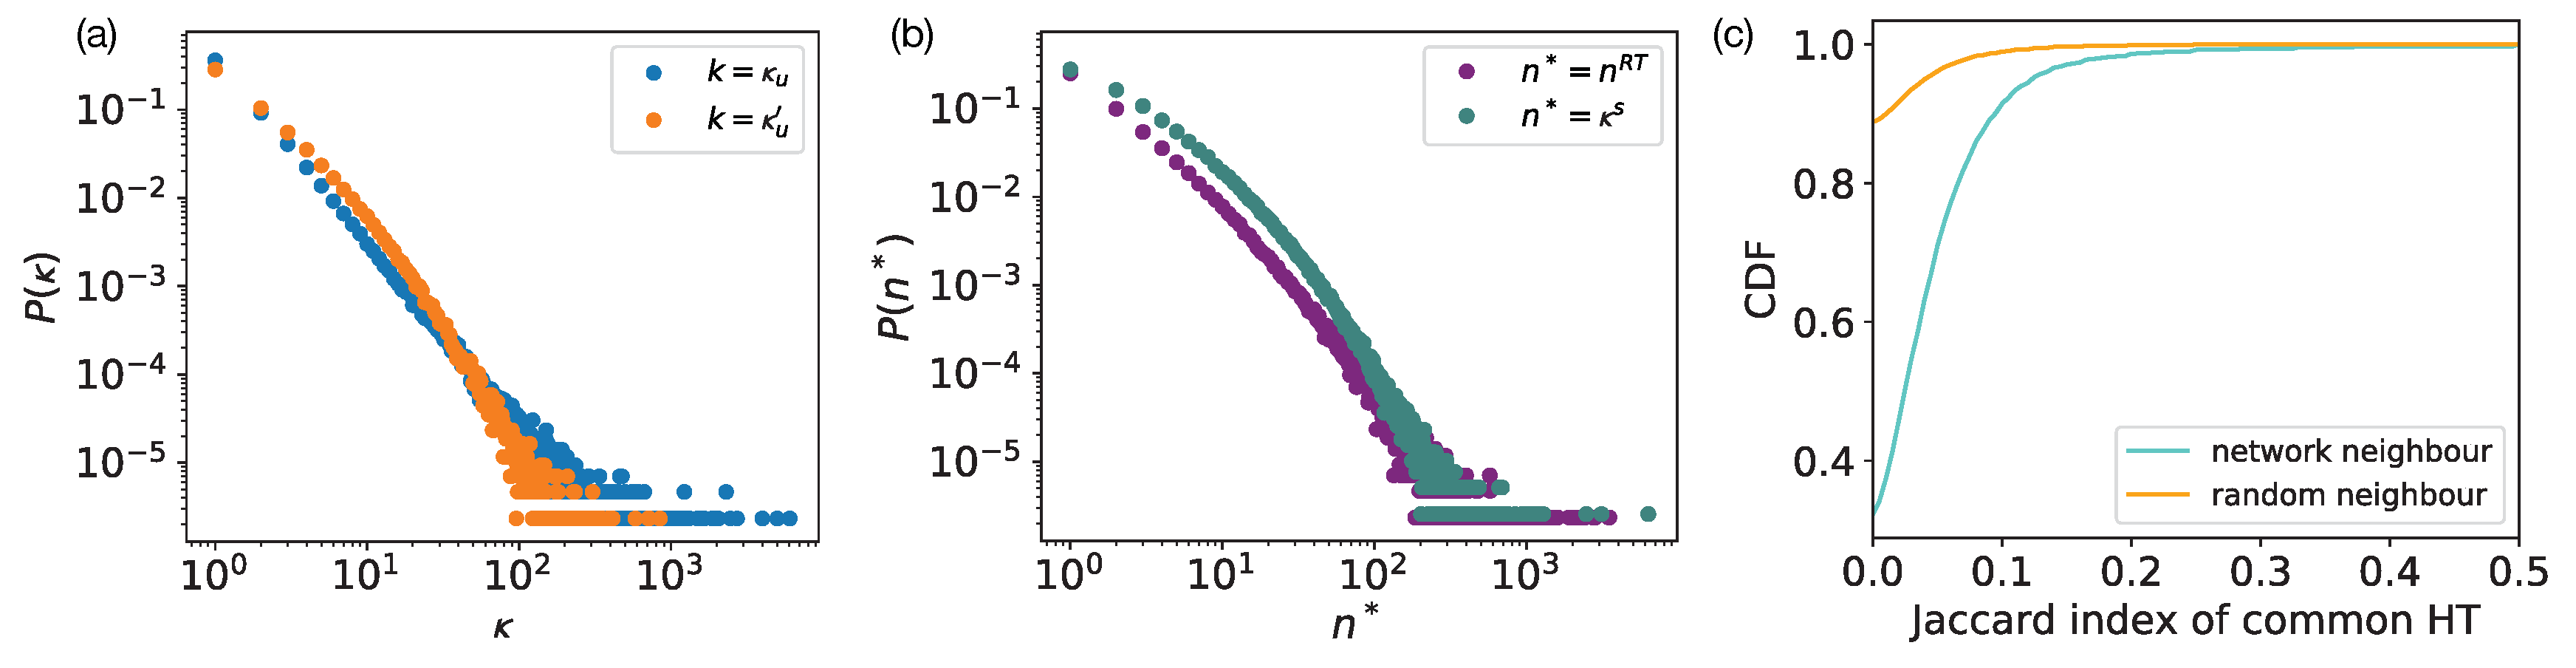
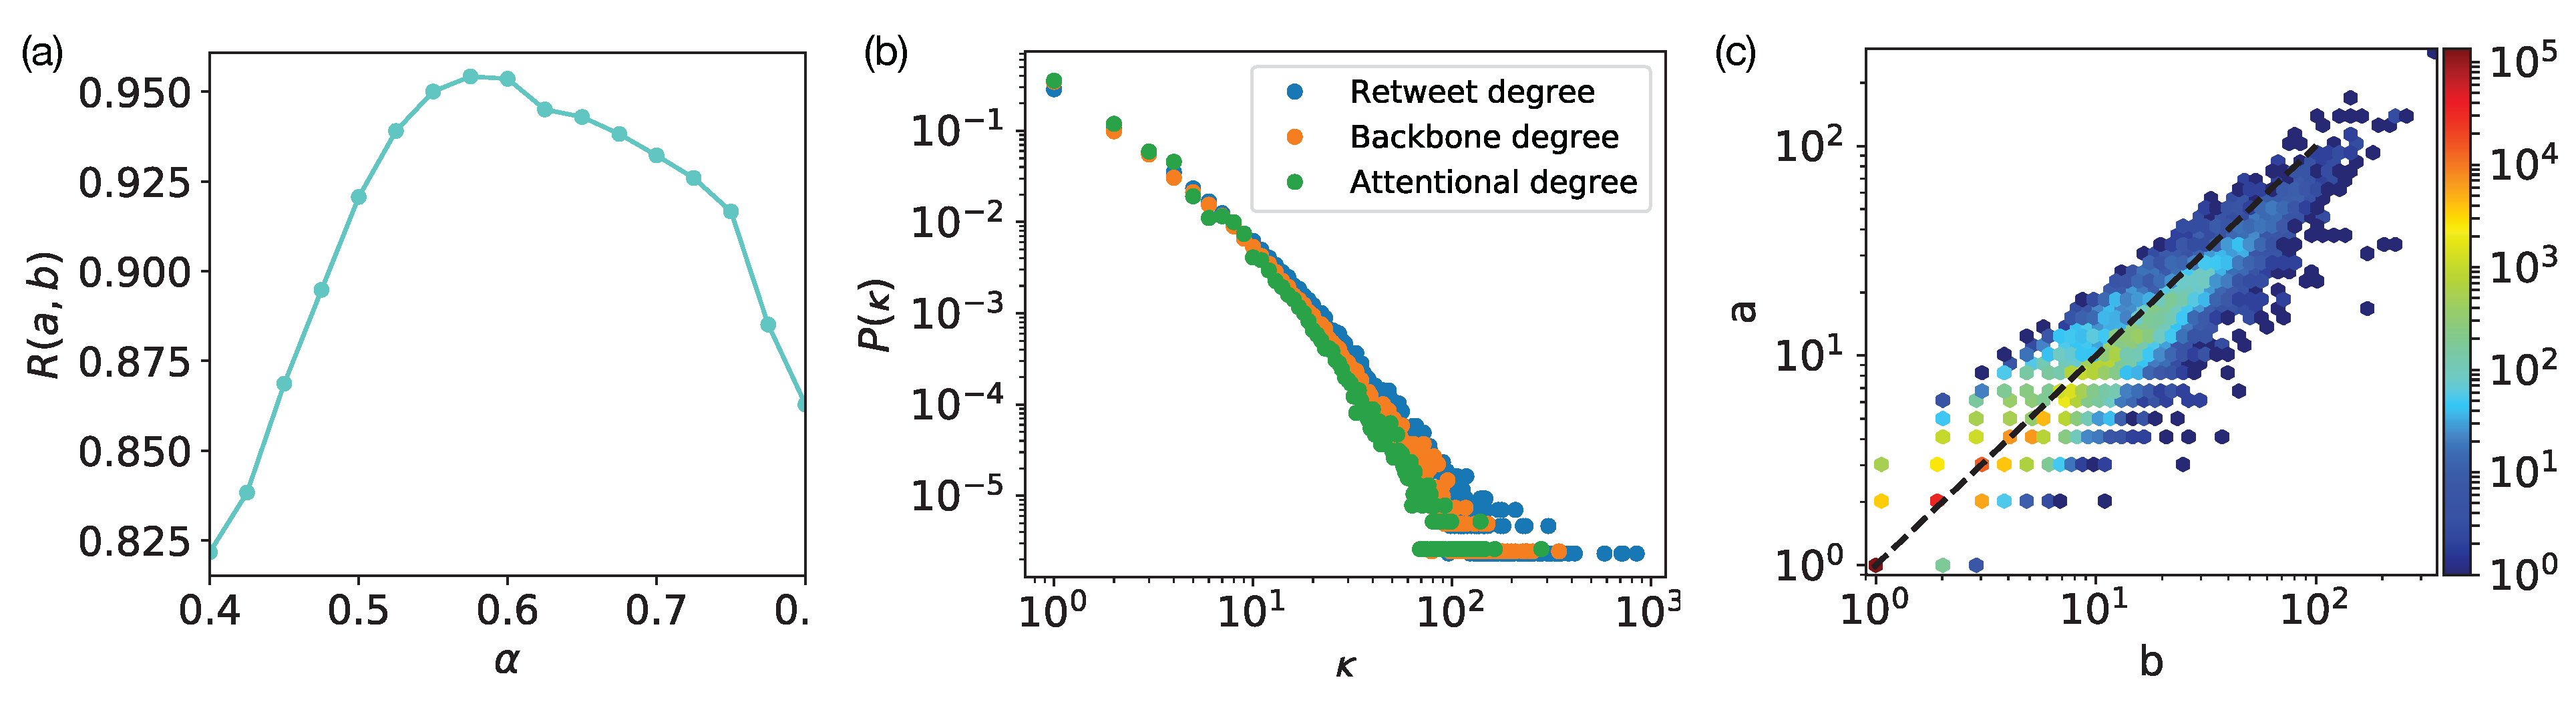
- the retweet network over by focusing on links in , then counting the number of times u retweeted v’s tweets or retweeted a tweet after v published that tweet, over the time period —in what follows, this is precisely what we mean by “retweet”. We add a weighted directed link in with a weight equal to that count (demonstrated in Figure 1b right panels). The out-degree denotes the number of users whom u retweeted while the in-degree denotes the number of users who retweeted v. Distributions of these quantities are shown in Figure 2a. The out-strength denotes the sum of the weights of the out-going links from u, i.e., number of retweets u made of their followees, while the in-strength denotes the total number of times v has been retweeted by their followers.
3.3. Attentional Degree
4. Social Attention
4.1. Distribution of Roles
4.2. Attention Concentration
5. Semantic Attention
5.1. Semantic Attentional Degree
5.2. Socio-Semantic Correlations
6. Limitations
7. Discussion
Author Contributions
Funding
Acknowledgments
Conflicts of Interest
Appendix A. Backbone Networks and Attentional Degrees

References
- Hill, R.A.; Dunbar, R.I. Social network size in humans. Hum. Nat. 2003, 14, 53–72. [Google Scholar] [CrossRef]
- Roberts, S.G.; Dunbar, R.I.; Pollet, T.V.; Kuppens, T. Exploring variation in active network size: Constraints and ego characteristics. Soc. Netw. 2009, 31, 138–146. [Google Scholar] [CrossRef]
- Burke, M.; Kraut, R.; Marlow, C. Social capital on Facebook: Differentiating uses and users. In Proceedings of the SIGCHI Conference on Human Factors in Computing Systems, Vancouver, BC, Canada, 7–12 May 2011; pp. 571–580. [Google Scholar]
- Miritello, G.; Lara, R.; Cebrian, M.; Moro, E. Limited communication capacity unveils strategies for human interaction. Sci. Rep. 2013, 3, 1950. [Google Scholar] [CrossRef]
- Weng, L.; Flammini, A.; Vespignani, A.; Menczer, F. Competition among memes in a world with limited attention. Sci. Rep. 2012, 2, 335. [Google Scholar] [CrossRef]
- Wellman, B. Computer Networks as Social Networks. Science 2001, 293, 2031–2034. [Google Scholar] [CrossRef]
- Wellman, B.; Haase, A.Q.; Witte, J.; Hampton, K. Does the Internet Increase, Decrease, or Supplement Social Capital?: Social Networks, Participation, and Community Commitment. Am. Behav. Sci. 2001, 45, 436–455. [Google Scholar] [CrossRef]
- Orbach, M.; Demko, M.; Doyle, J.; Waber, B.N.; Pentland, A.S. Sensing Informal Networks in Organizations. Am. Behav. Sci. 2015, 59, 508–524. [Google Scholar] [CrossRef]
- Nguyen, G.D.; Lethiais, V. The Impact of Social Networks on Sociability: The Case of Facebook. Réseaux 2016, 195, 165–195. [Google Scholar] [CrossRef]
- Newman, M.E.J. Scientific collaboration networks. I. Network construction and fundamental results. Phys. Rev. 2001, 64, 016131. [Google Scholar] [CrossRef]
- Ebel, H.; Mielsch, L.I.; Bornholdt, S. Scale-free topology of e-mail networks. Phys. Rev. E 2002, 66, 035103. [Google Scholar] [CrossRef]
- Kumar, R.; Novak, J.; Tomkins, A. Structure and evolution of online social networks. In Link Mining: Models, Algorithms, and Applications; Springer: New York, NY, USA, 2010; pp. 337–357. [Google Scholar]
- Mislove, A.; Marcon, M.; Gummadi, K.P.; Druschel, P.; Bhattacharjee, B. Measurement and analysis of online social networks. In Proceedings of the 7th ACM SIGCOMM conference on Internet measurement, San Diego, CA, USA, 24–26 October 2007; pp. 29–42. [Google Scholar]
- Gonçalves, B.; Perra, N.; Vespignani, A. Modeling Users’ Activity on Twitter Networks: Validation of Dunbar’s Number. PLoS ONE 2011, 6, e22656. [Google Scholar] [CrossRef]
- Lehmann, J.; Gonçalves, B.; Ramasco, J.; Cattuto, C. Dynamical Classes of Collective Attention in Twitter. In Proceedings of the 21st International Conference on World Wide Web, Lyon, France, 16–20 April 2012; pp. 251–260. [Google Scholar]
- Sanlı, C.; Lambiotte, R. Local variation of hashtag spike trains and popularity in twitter. PLoS ONE 2015, 10, e0131704. [Google Scholar] [CrossRef]
- Backstrom, L.; Bakshy, E.; Kleinberg, J.M.; Lento, T.M.; Rosenn, I. Center of attention: How facebook users allocate attention across friends. In Proceedings of the Fifth International AAAI Conference on Weblogs and Social Media, Barcelona, Spain, 17–21 July 2011. [Google Scholar]
- Saramäki, J.; Leicht, E.A.; López, E.; Roberts, S.G.; Reed-Tsochas, F.; Dunbar, R.I. Persistence of social signatures in human communication. Proc. Natl. Acad. Sci. USA 2014, 111, 942–947. [Google Scholar] [CrossRef]
- Lin, Y.R.; Keegan, B.; Margolin, D.; Lazer, D. Rising tides or rising stars?: Dynamics of shared attention on Twitter during media events. PLoS ONE 2014, 9, e94093. [Google Scholar] [CrossRef]
- Golder, S.A.; Huberman, B.A. Usage patterns of collaborative tagging systems. J. Inf. Sci. 2006, 32, 198–208. [Google Scholar] [CrossRef]
- Wu, F.; Huberman, B.A. Novelty and collective attention. Proc. Natl. Acad. Sci. USA 2007, 104, 17599–17601. [Google Scholar] [CrossRef]
- Weng, L.; Menczer, F.; Ahn, Y.Y. Virality Prediction and Community Structure in Social Networks. Sci. Rep. 2013, 3, 2522. [Google Scholar] [CrossRef]
- Romero, D.M.; Meeder, B.; Kleinberg, J. Differences in the Mechanics of Information Diffusion Across Topics: Idioms, Political Hashtags, and Complex Contagion on Twitter. In Proceedings of the 20th International Conference on World Wide Web, Hyderabad, India, 28 March–1 April 2011. [Google Scholar]
- Hodas, N.O.; Lerman, K. How visibility and divided attention constrain social contagion. In Proceedings of the 2012 International Conference on Privacy, Security, Risk and Trust (PASSAT), and 2012 International Conference on Social Computing (SocialCom), Amsterdam, The Netherlands, 3–5 September 2012; pp. 249–257. [Google Scholar]
- Rodriguez, M.G.; Gummadi, K.; Schoelkopf, B. Quantifying information overload in social media and its impact on social contagions. arXiv 2014, arXiv:1403.6838. [Google Scholar]
- Unicomb, S.; Iñiguez, G.; Karsai, M. Threshold driven contagion on weighted networks. Sci. Rep. 2018, 8, 3094. [Google Scholar] [CrossRef]
- Suh, B.; Hong, L.; Pirolli, P.; Chi, E.H. Want to be retweeted? Large-Scale analytics on factors impacting retweet in twitter network. In Proceedings of the 2010 IEEE Second International Conference on Social Computing, Minneapolis, MN, USA, 20–22 August 2010; pp. 177–184. [Google Scholar]
- Yang, Z.; Guo, J.; Cai, K.; Tang, J.; Li, J.; Zhang, L.; Su, Z. Understanding retweeting behaviors in social networks. In Proceedings of the 19th ACM International Conference on Information and Knowledge Management, Toronto, ON, Canada, 26–30 October 2010; pp. 1633–1636. [Google Scholar]
- Zaman, T.R.; Herbrich, R.; Van Gael, J.; Stern, D. Predicting Information Spreading in Twitter. In Proceedings of the Computational Social Science and the Wisdom of Crowds Workshop (Colocated with NIPS 2010), Whistler, BC, Canada, 10 December 2010. [Google Scholar]
- boyd, D.; Golder, S.; Lotan, G. Tweet, tweet, retweet: Conversational aspects of retweeting on twitter. In Proceedings of the 2010 43rd Hawaii International Conference on System Sciences, Honolulu, HI, USA, 5–8 January 2010; pp. 1–10. [Google Scholar]
- Myers, S.A.; Leskovec, J. The bursty dynamics of the twitter information network. In Proceedings of the 23rd International Conference on World Wide Web, Seoul, Korea, 7–11 April 2014; pp. 913–924. [Google Scholar]
- Rhoades, S.A. The herfindahl-hirschman index. Fed. Res. Bull. 1993, 79, 188. [Google Scholar]
- González-Bailón, S.; Borge-Holthoefer, J.; Moreno, Y. Broadcasters and hidden influentials in online protest diffusion. Am. Behav. Sci. 2013, 57, 943–965. [Google Scholar] [CrossRef]
- Gabielkov, M.; Ramachandran, A.; Chaintreau, A.; Legout, A. Social clicks: What and who gets read on Twitter? In Proceedings of the 2016 ACM SIGMETRICS International Conference on Measurement and Modeling of Computer Science, Antibes Juan-les-Pins, France, 14–18 June 2016; Volume 44, pp. 179–192. [Google Scholar]
- Morstatter, F.; Pfeffer, J.; Liu, H. When is it biased?: Assessing the representativeness of twitter’s streaming API. In Proceedings of the 23rd International Conference on World Wide Web, Seoul, Korea, 7–11 April 2014; pp. 555–556. [Google Scholar]
- Berelson, B.; Gaudet, H.; Lazarsfeld, P.F. The People’s Choice: How the Voter Makes up his Mind in a Presidential Campaign; Columbia University Press: New York, NY, USA, 1968. [Google Scholar]
- Katz, E.; Lazarsfeld, P.F.; Roper, E. Personal Influence: The Part Played by People in the Flow of Mass Communications; Routledge: Abingdon, UK, 2017. [Google Scholar]
- Weng, L.; Karsai, M.; Perra, N.; Menczer, F.; Flammini, A. Attention on weak ties in social and communication networks. In Complex Spreading Phenomena in Social Systems; Springer: Cham, Switzerland, 2018; pp. 213–228. [Google Scholar]
- Serrano, M.Á.; Boguñá, M.; Vespignani, A. Extracting the multiscale backbone of complex weighted networks. Proc. Natl. Acad. Sci. USA 2009, 106, 6483–6488. [Google Scholar] [CrossRef]


| n | [1, 40[ | [40, 200[ | [200, 600[ | [600, 6107] |
|---|---|---|---|---|
| R | 0.137 | 0.253 | 0.309 | 0.238 |
| p | <0.05 | <0.05 | <0.05 | <0.05 |
© 2019 by the authors. Licensee MDPI, Basel, Switzerland. This article is an open access article distributed under the terms and conditions of the Creative Commons Attribution (CC BY) license (http://creativecommons.org/licenses/by/4.0/).
Share and Cite
Baltzer, A.; Karsai, M.; Roth, C. Interactional and Informational Attention on Twitter. Information 2019, 10, 250. https://doi.org/10.3390/info10080250
Baltzer A, Karsai M, Roth C. Interactional and Informational Attention on Twitter. Information. 2019; 10(8):250. https://doi.org/10.3390/info10080250
Chicago/Turabian StyleBaltzer, Agathe, Márton Karsai, and Camille Roth. 2019. "Interactional and Informational Attention on Twitter" Information 10, no. 8: 250. https://doi.org/10.3390/info10080250
APA StyleBaltzer, A., Karsai, M., & Roth, C. (2019). Interactional and Informational Attention on Twitter. Information, 10(8), 250. https://doi.org/10.3390/info10080250