Article

Author Cooperation Network in Biology and Chemistry Literature during 2014–2018: Construction and Structural Characteristics

1
School of Maritime Economics and Management, Dalian Maritime University, Dalian 116026, China
2
Logistics Research Institute, Dalian Maritime University, Dalian 116026, China
*
Author to whom correspondence should be addressed.
Information 2019, 10(7), 236; https://doi.org/10.3390/info10070236
Submission received: 30 April 2019 / Revised: 7 June 2019 / Accepted: 24 June 2019 / Published: 9 July 2019

Abstract

:
How to explore the interaction between an individual researcher and others in scientific research, find out the degree of association among individual researchers, and evaluate the contribution of researchers to the whole according to the mechanism and law of interaction, is of great significance to grasp the overall trend of the field. Scholars mostly use bibliometrics to solve these problems and analyze the citation and cooperation among academic achievements from the dimension of “quantity”. However, there is still no mature method for scholars to explore the evolution of knowledge and the relationship between authors; this paper tries to fill this gap. We narrow down the scope of research and focus the research content on the literature in biology and chemistry, collect all the papers from PubMed system (a very comprehensive authoritative database of biomedical papers) during 2014–2018, and take year as a specific analysis unit so as to improve the accuracy of the analysis. Then, we construct the author cooperation networks. Finally, through the above methods and steps, we identify the core authors of each year, analyze the recent cooperative relationships among authors, and predict some changes in the cooperative relationship among the authors based on the networks’ analytical data, evaluating and estimating the role that authors play in the overall field. Therefore, we expect that the cooperative authorship networks supported by the complex network theory can better explain the author’s cooperative relationship.

1. Introduction

The development of scientific research is never monopolized by a specific country, and it is always created by all the scholars in the world. Scholars differ greatly due to many causes such as countries, research facilities and conditions, research preferences and teams, and so on [1]. The study on the cooperative relationship among authors has been widely used in statistics [2], bibliometrics [3], social sciences [4] and humanities [5]. Focusing on academic papers from a quantitative perspective is an effective way to study the cooperative relationship among authors [6].
Of course, due to the diversity of research methods and analytical perspectives, the results and emphases of different methods are varied. Therefore, choosing the right method for an author cooperation network is very important for effectively reflecting the final result and reasonable explanation. Knowledge graph has shown unparalleled advantages in data analysis since its birth; with its continuous evolution and development, it has gradually evolved into different forms of expression. Researchers found that as an important manifestation of knowledge graph, complex network is a powerful method in the mining and exploration of an authors’ cooperative relationship and integrates a large number of discrete things and finds out general rules for scholars. Obviously, the complex network theory is mostly used in dealing with the cooperative relationship among authors. For example, Rego et al. [7] introduced the link strength theory into the author’s network formation model, taking efficiency and stability as the basis for judging the network model. Singh et al. [8] constructed the co-authorship network of Indian physicists to analyze the structure and evolution of the network at 5-year intervals. For the groups to which the co-authors belong, Geraei et al. [9] used social network analysis and small group analysis to investigate the collaboration between different departments and research centers and analyzed and discussed the importance and status of scientific collaboration in medical research. Medina [10] constructed a co-authorship network to assess the collaborative model between ecologists, focusing on the impact of distance and reputational asymmetry on author collaboration. Furthermore, it has been confirmed that there is a relationship among the status of scientists in the collaborative network and their research performance in the fields of pharmacology and nanoscience [11]. Some scholars have taken a different approach. For the research performance of scholars, co-authorship is an important indicator of researcher collaboration skills [12] and is used to study the relationship among journal impact factors [13]. Based on social network analysis, Bellotti [14] studied the relationship between individual and organizational characteristics to reflect the individual’s position and value in the team. Andrade, et al. [15] divided the indicators into unweighted, weighted with the weight of the edges, and weighted with weights of the edges and the nodes’ attributes to further study the attributes of cooperative networks. Cimenler et al. [16] collected collaborative output data of researchers in a self-reporting way, which can provide some instructions on whether collaborative research is important or not, and improved the authenticity and accuracy of the results to a certain extent. More specifically, Souza et al. [17] used a co-author network to assess the mechanisms of human interaction and productivity performance in specific groups with changes in various network indicators.
The digitization and documentation of scientific papers have enabled the scientific community to establish scientific collaboration and citation networks, and track their proceedings [18]. At present, citation analysis, co-author analysis, co-word analysis, and network analysis of other indicators in the form of knowledge production and scientific discovery are still important methods for bibliometric analysis [19]. Social network analysis has become an important sociological method for discovering network topology attributes [20]. References related to the author cooperation network have provided a reference for the study of academic cooperation. However, there are still some shortcomings in the current cooperative research among authors based on statistical methods and bibliometrics.
Our contributions are to innovatively apply knowledge graph for analyzing the author cooperation relationship, and use the yearly data to track the evolution. Meanwhile, our methods can be easily extended to other fields. We emphasize capturing the evolution of author cooperation in each year to accommodate rapid knowledge updates and focus our attention on the strength of the relationship among authors, then we draw 5 years’ author cooperation networks. Finally, we discuss the phenomenon reflected by the networks from five important analytical perspectives.

2. Materials and Methods

2.1. Data Collection

In this paper, Google scholar [21] was used to find out the top 100 journals cited most in 2018. Then, we employed the PubMed system [22] to query all papers of these journals during 2014–2018, and papers without authors and abstracts were removed. Finally, a total of 77 journals (see in Table 1) and 466,118 papers were obtained because some journals are not included in PubMed system. Subsequently, we extracted authors’ names from these papers, which were abbreviations. However, there are too many papers and authors, and it will be very difficult to judge whether there are the same names among different authors, the reasons of which can be presented into two aspects: (1) There may be researchers with the same name even in the same department in the same institute, and only the mailbox can be used to determine whether it is the same person. (2) Many papers only contain the corresponding author’s email; not all papers contain all authors’ mailboxes. Therefore, in order to simplify the experiment process, we did not consider the issue of the authors with the same name in this paper.
The author cooperation networks based on these 466,118 papers were constructed and the structural characteristics were analyzed according to the process given in Figure 1.

2.2. Author Segmentation and High-Yield Authors

Most of papers have more than three authors, and the total number of authors in these 466,118 papers is close to 1.4 million. We divided the authors of each paper by semicolons and extracted the authors of all papers. All source codes of this study are in the supplementary files. Suppose N is the number of papers in one year, ci represents the ith author, and ni represents number of papers published by ci in this year. Then the probability of author ci in N papers was calculated by pi = ni/N. We make the authors sort in descending order of ni, ensuring ninj for ∀i < j (equivalent to pipj), and the top M authors were selected as high-yield authors. Because of the large number of papers collected, the number of authors is significantly huge. Therefore, in order to make the research results more representative, improve the efficiency of network construction, and simplify the construction process, we ultimately chose high-yield authors to build cooperative networks rather than general authors.

2.3. Cooperation Matrix and Cooperation Networks of High-Yield Authors

The cooperative relationship between any two high-yield authors was represented by mutual information in information theory, which describes the degree of cooperation between two authors inspired by Ref. [23]. The mutual information, representing the strength of the relationship between variables [24], was calculated by Equation (1).
I i , j = log 2 P i , j P i P j
where Ii,j represents the mutual information of authors ci and cj, Pi,j denotes the probability that both of the high-yield authors ci and cj are authors of one paper, and Pi and Pj represent the probability of ci and cj being authors, respectively. The greater the value of Ii,j, the greater the cooperation degree between ci and cj. The matrix (Ii,j)K×K is a high-yield author cooperation matrix (considering the symmetric relationship, Ii,j = Ij,i), and it’s a diagonal matrix.
In general, we assume that the number of nodes in the cooperation network of high-yield authors is N, and the cooperation of authors was expressed as a binary adjacent matrix A (N, N). If there is a cooperative relationship between two high-yield authors i and j, the value of element aij is 1, otherwise its value is 0. A (N, N) is a symmetric matrix that can be used to calculate features, such as scale-free effect, small-world feature, hierarchical organization feature, closeness centrality, betweenness centrality, and so on.

2.4. The Structural Characteristics of Author Cooperation Networks

2.4.1. Scale-Free Effect

The scale-free network was first proposed by Barabasi and Alber to explain the origin of power law in networks [25]. The degree distribution of complex networks is represented by the probability distribution of node degrees, which offers an effective method for discussing the features of complex networks. The topology and dynamic behavior of complex networks rely on the analysis of their degree distribution [26]. Let p(k) denote the ratio of the number of nodes with degree k to all nodes, then the scale-free effect of the network is expressed by the relationship of p(k) and k, satisfying the power-law distribution: p(k) ~ k−γ. A typical feature of a scale-free network is that only a few core nodes can be connected to a large number of other nodes, and most of the other nodes can only be connected to a small number.

2.4.2. Small-World Feature

In the process of exploring the network model, Watts found that some systems can be highly aggregated like a regular lattice, but have a small feature path length like a random graph. Analogous to the small world phenomenon, he firstly called these systems "small world" networks [27]. The criterion for a small world network is that any two nodes in the network can be reached from each other by a few steps [28]. The small-world feature in a complex network is measured by two indicators, namely the average path length and the clustering coefficient. The average of the shortest distances between all pairs of nodes in the network is called the average path length, where the distance between nodes refers to the minimum number of edges to be connected to these two nodes. The average path length is calculated by Equation (2).
L = i j d i j N ( N 1 )
where dij represents the shortest distance between nodes i and j in a cooperation network. The aggregation coefficient of a network describes the probability when two neighbor nodes of a node are each other’s neighbor nodes, which reflects the partial clustering characteristics of the network. Clustering coefficient is calculated by Equation (3).
C = 1 N i N i k i ( k i 1 ) / 2
where ki is the degree of node i, and Ni indicates the number of edges among neighbors of i. We assume that the average path length of a Random Network with the same number of nodes and edges to our network is defined as Lrandom, while its clustering coefficient is defined as Crandom. If the average path length and clustering coefficient satisfy the following two conditions, the network exhibits small world feature: LLrandom, and C >> Crandom.

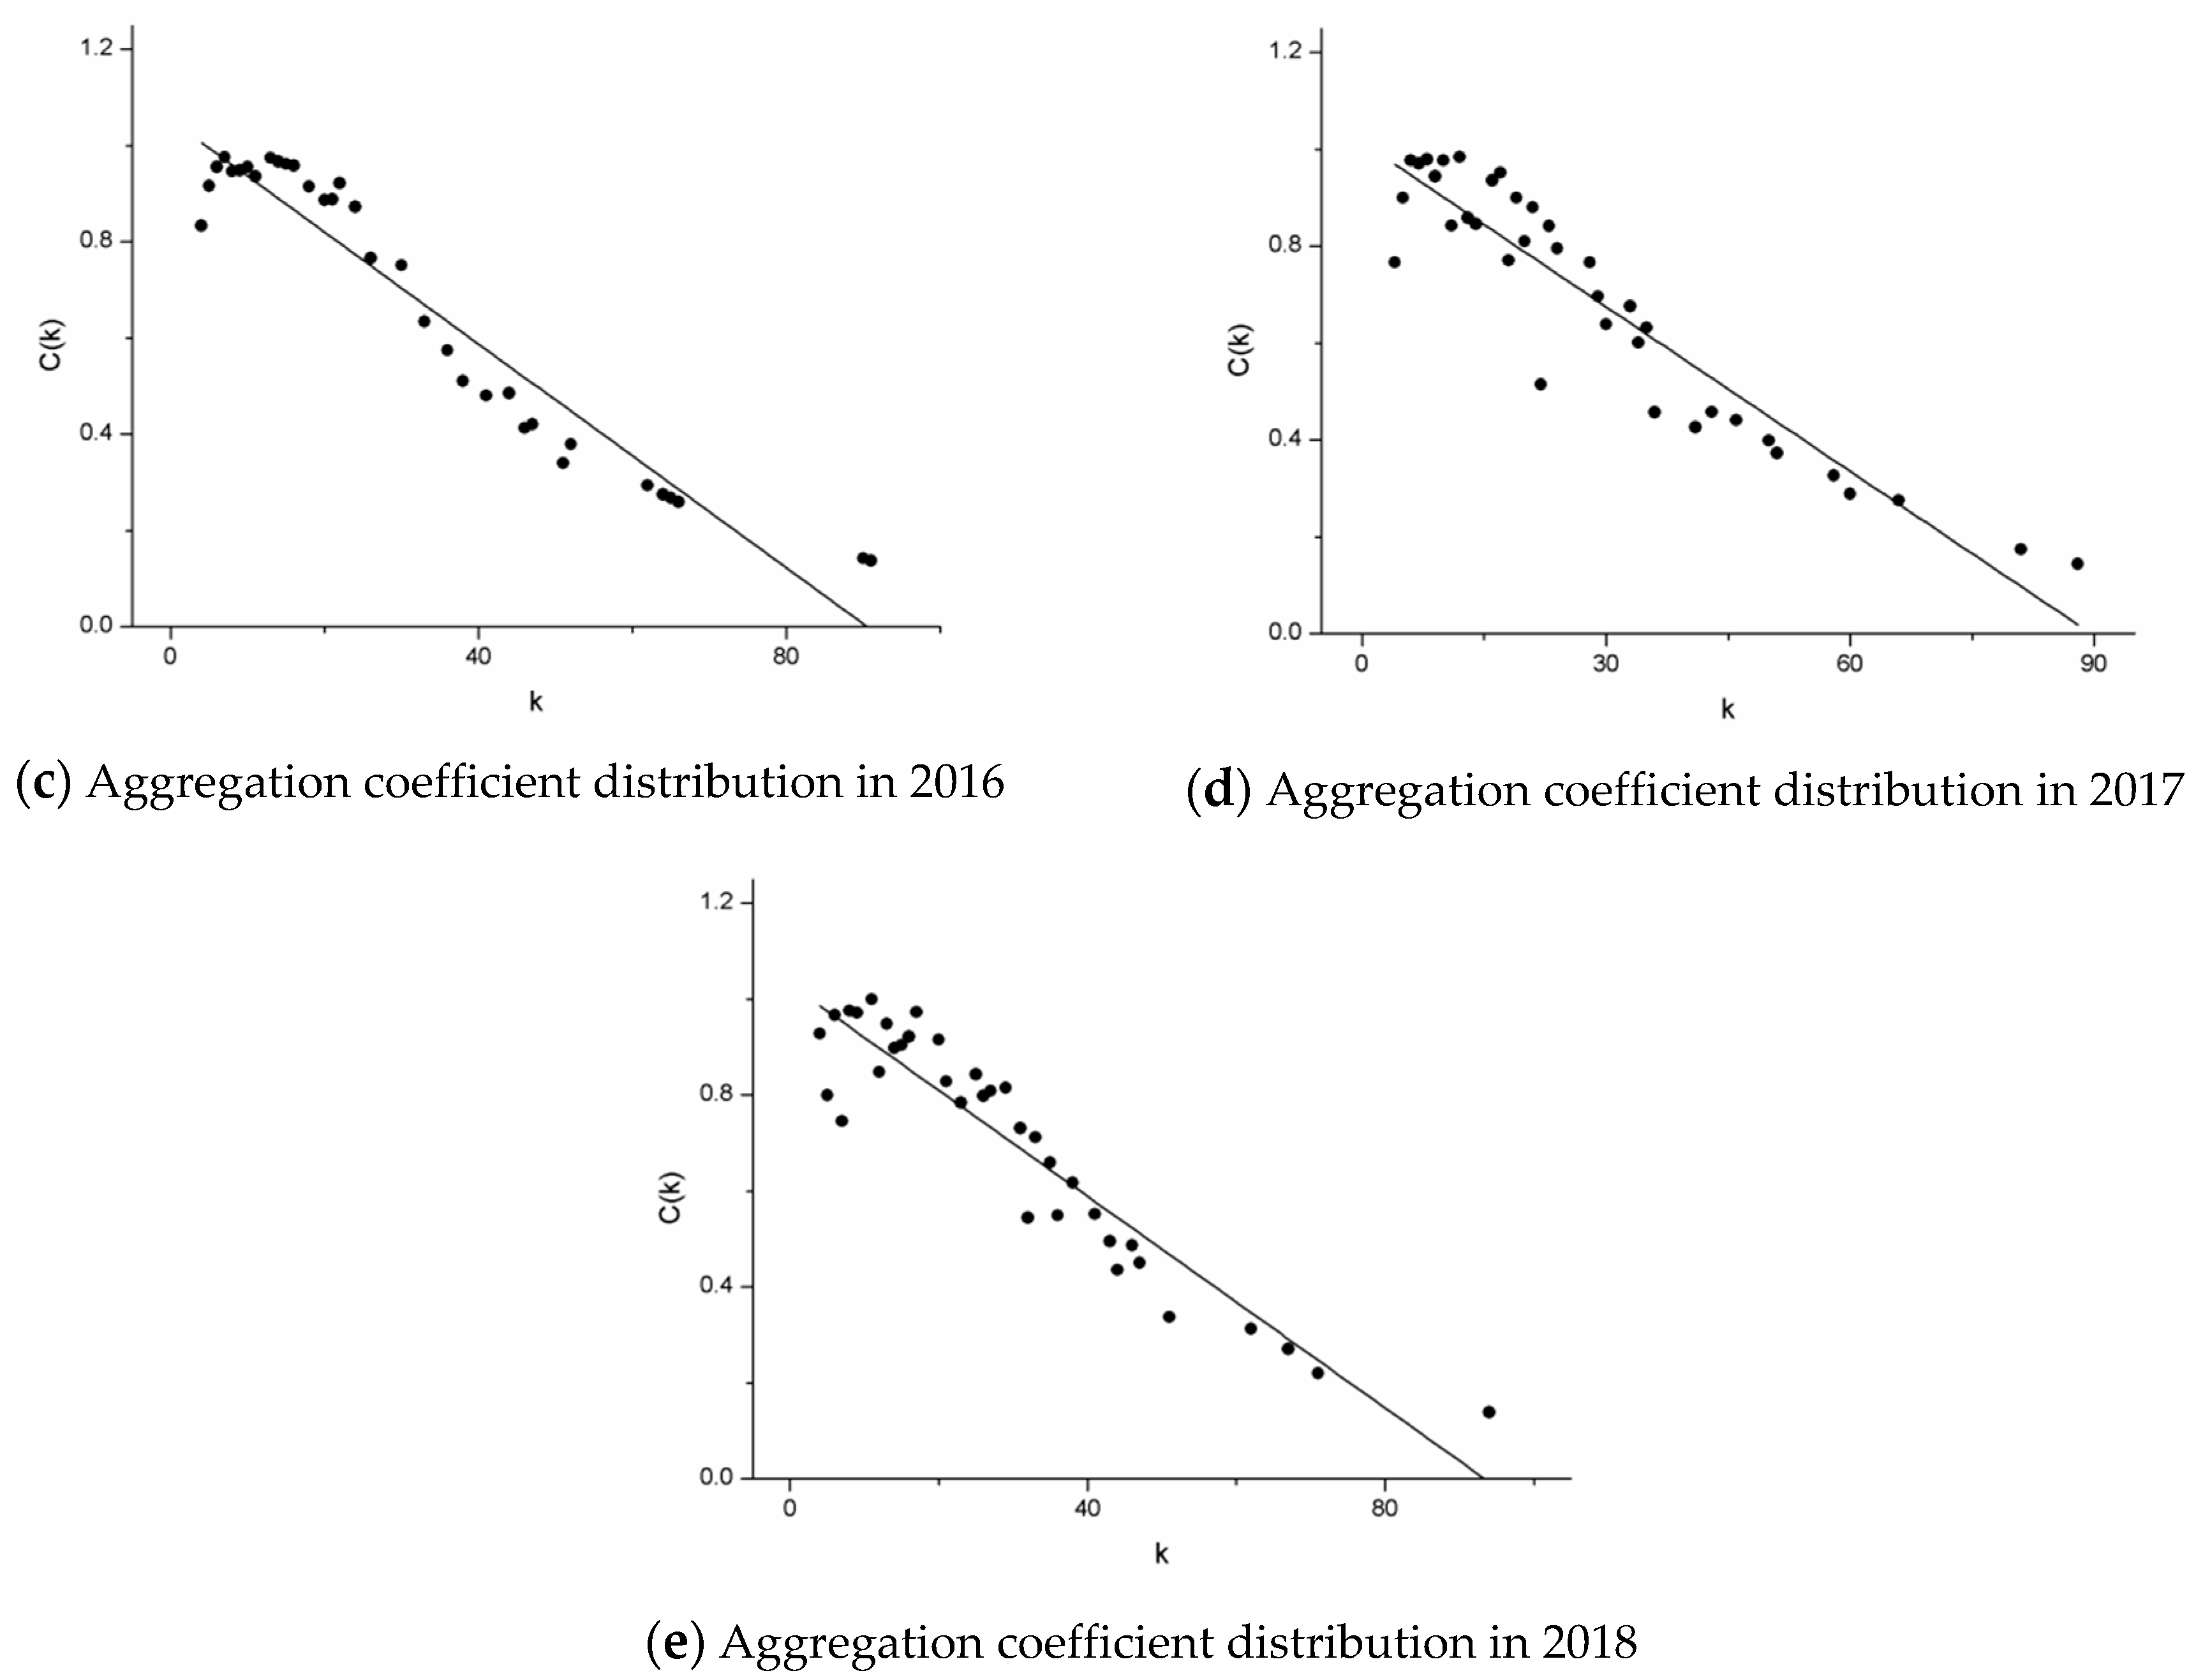
2.4.3. Hierarchical Organization Feature

Hierarchical organization is an organizational structure where every entity in the organization, except one, is subordinate to a single other entity [29]. Hierarchical network represents the connectivity among nodes of the real world network. The change of the average degree k and its corresponding clustering coefficient C(k) follow the power-law distribution: C(k) ~ k−θ, where θ > 0, which is a condition in which the network has a hierarchical structure. This formula describes the fact that if the degree of some nodes is lower and the aggregation coefficient is higher, they are high-connected modules. However, some nodes belong to low-connected modules even if they have a higher degree and lower aggregation coefficient. In a hierarchical organization network, some nodes in small scale are loosely connected to form larger modules.

2.4.4. Closeness Centrality

The concept of closeness centrality was first proposed by American sociologist Freeman who put forward closeness as a measure of global centrality in terms of the distance among various nodes. The closeness centrality reflects the center extent of a node and its indirect influence on other nodes, and it is expressed as the reciprocal of the cumulative shortest path from one node to other nodes [30]. When information begins to spread from the central nodes, it will be transmitted from the network center to other corners at a fast speed [31]. A node has a high closeness centrality, which means that it is located at the center of the network and is closer to other nodes. The Equation (4) for calculating the closeness centrality of node i is as follows.
C C ( i ) = N j N d i j

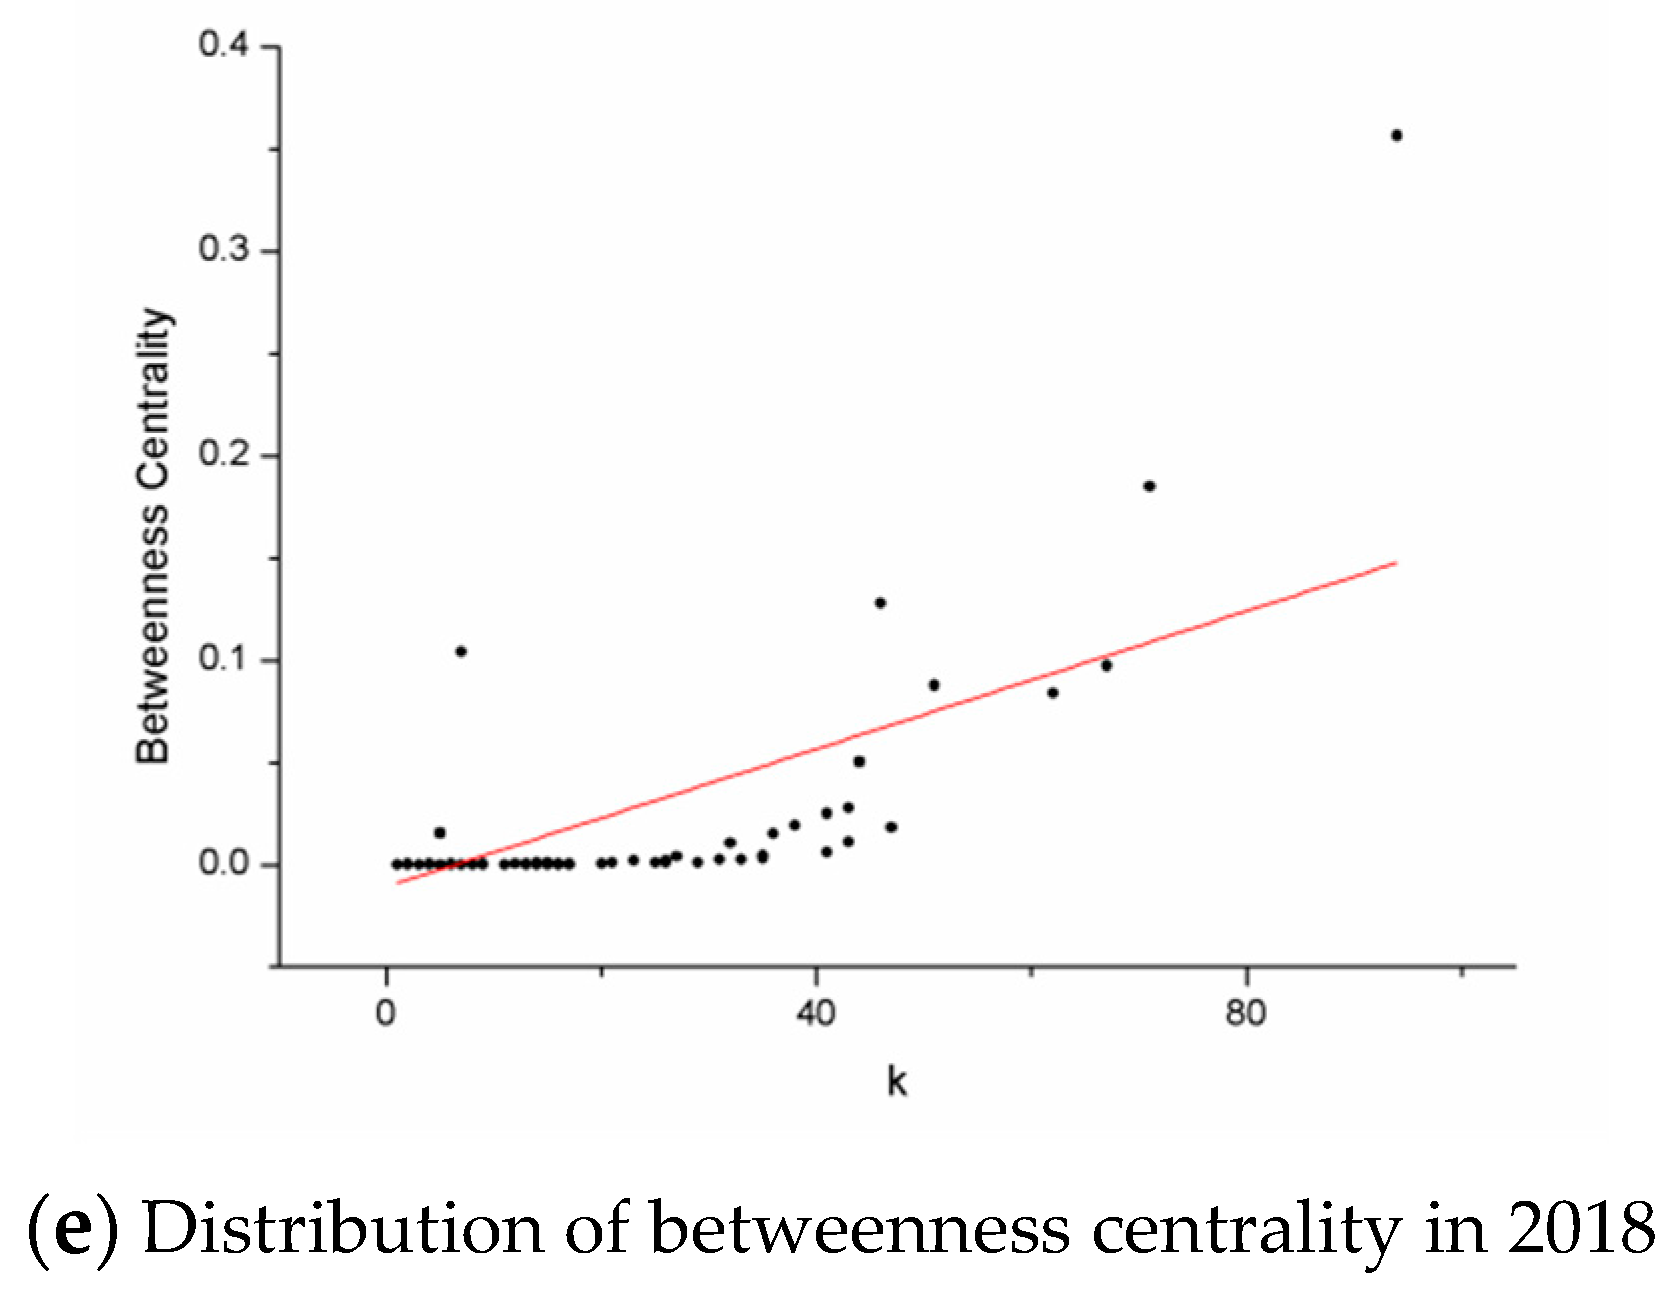
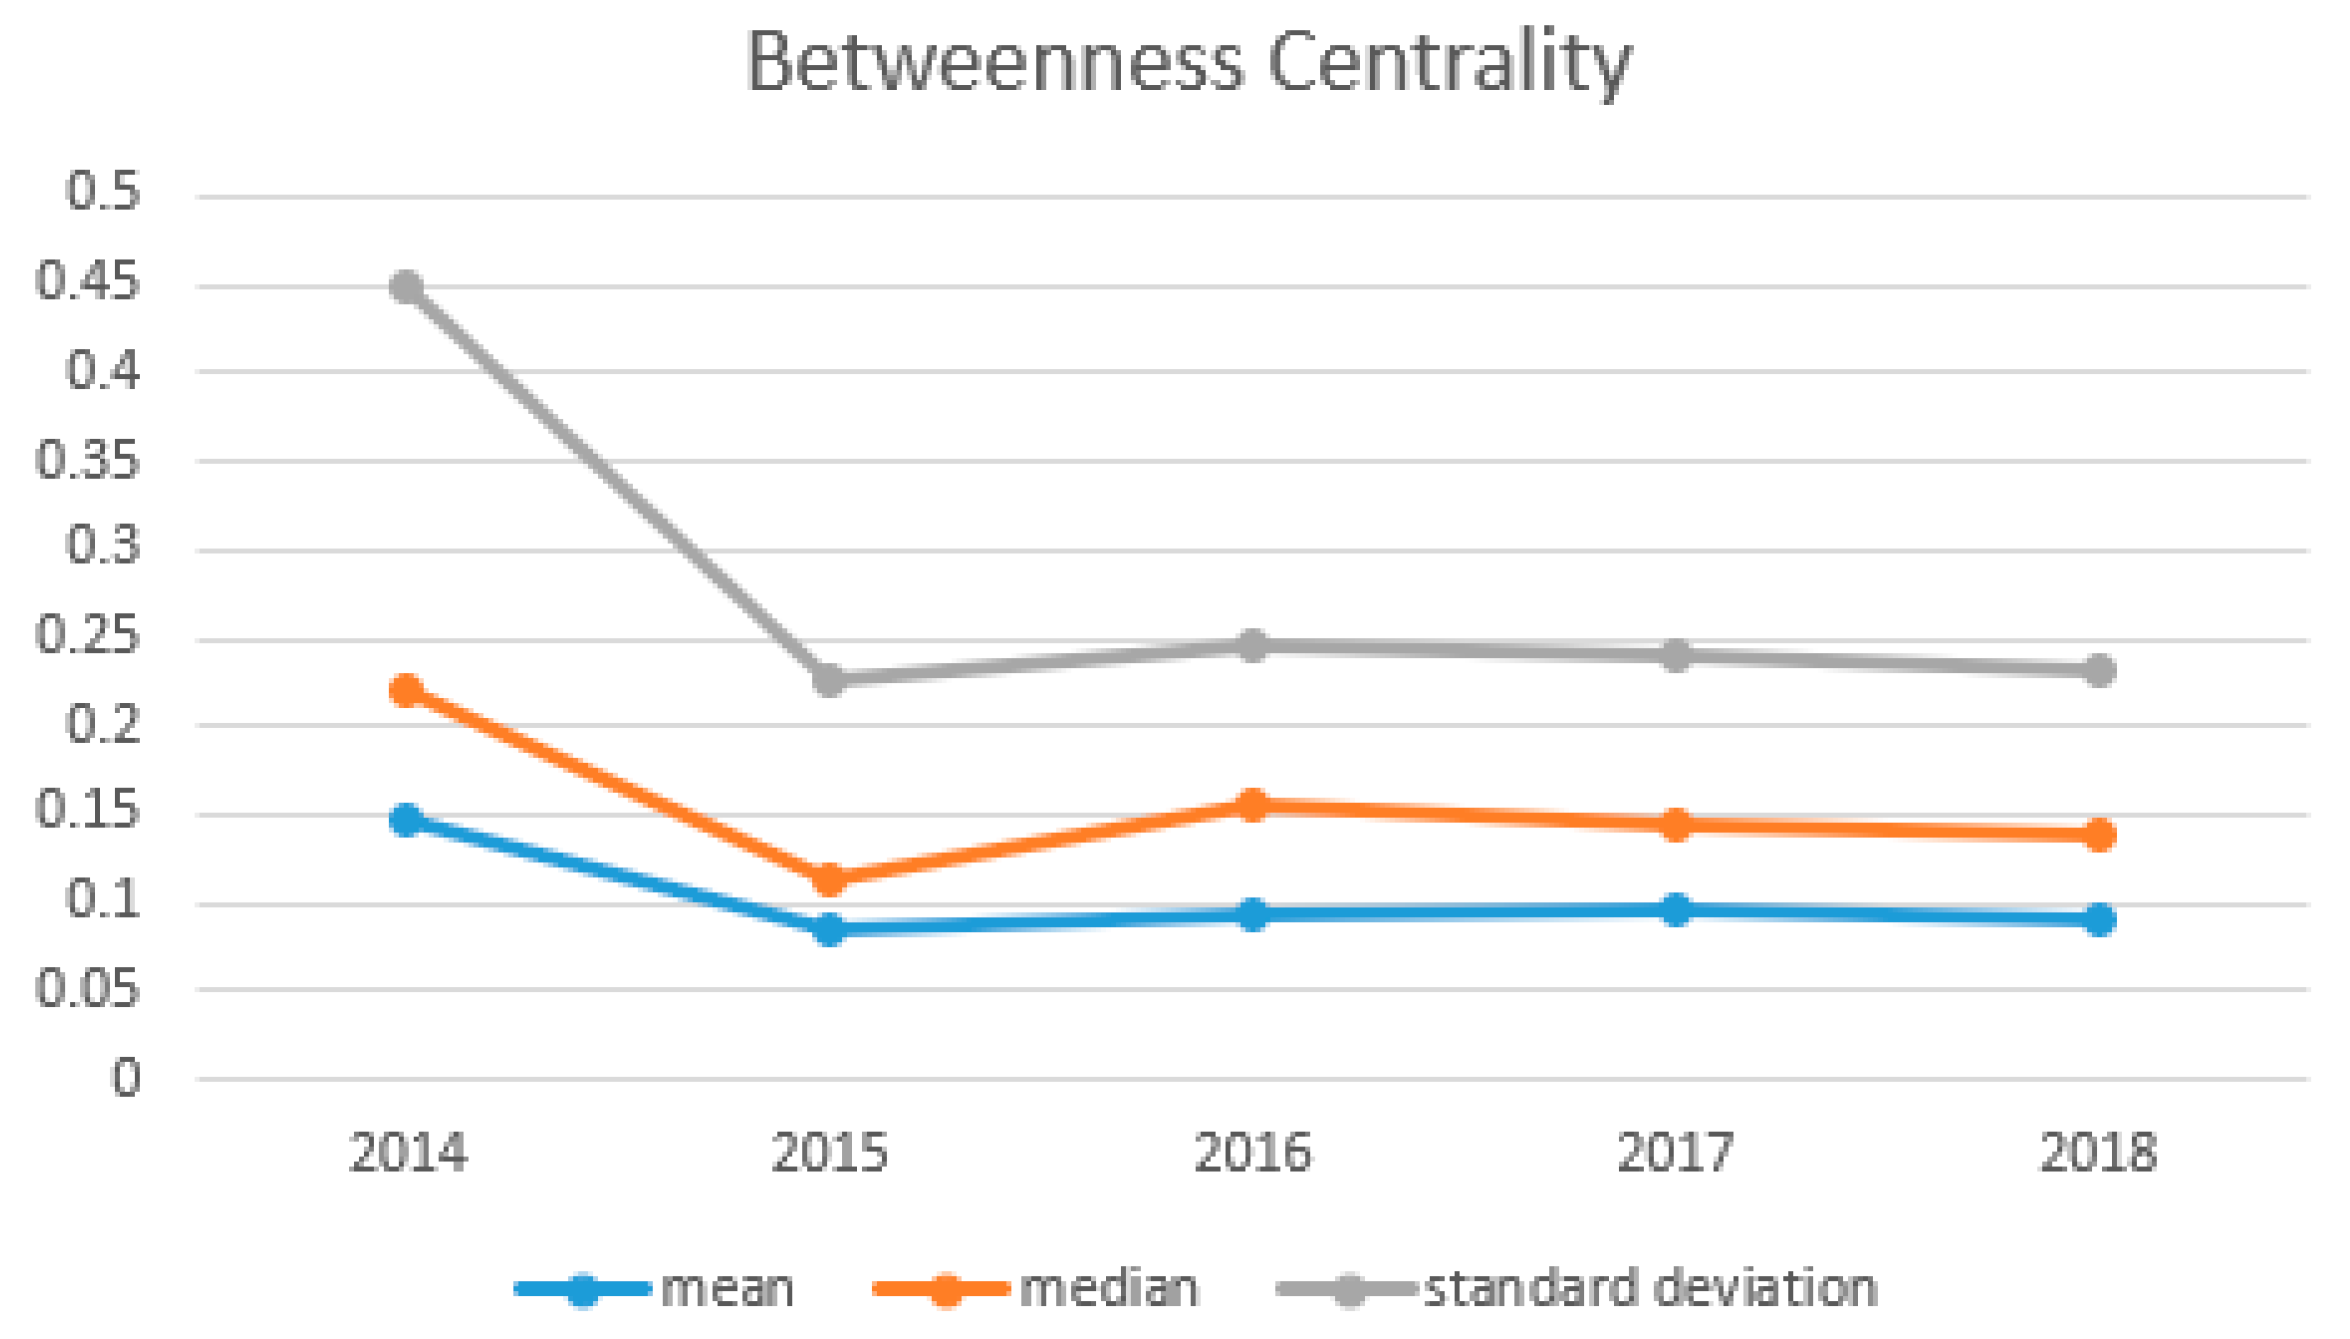
2.4.5. Betweenness Centrality

The betweenness centrality of node v is calculated by Equation (5):
C B ( v ) = i v j N d i j ( v ) d i j
where dij(v) represents the number of paths through node v in dij. It is another concept of node centrality proposed by Freeman, which measures the extent to which a node is located in the middle of other “node pairs” in the network [30]. To be more precise, for a given node, it measures how many of the shortest paths pass through it [32]. The betweenness centrality reflects the importance of a node to information transfer. A node with a high betweenness centrality means that it acts as an indispensable “mediator” in the process of information dissemination.

3. Results and Discussion

3.1. Cooperation Network of High-Yield Authors in Biology and Chemistry

In descending order of cooperation matrix and mutual information, the threshold of cooperation between high-yield authors was set to E, and then the top E cooperation became the number of edges of the network. The authors corresponding to these E edges act as nodes, the number of these authors is represented by the letter M, and the network composed of these authors and edges is the cooperation network of high-yield authors. In this paper, the authors of 466,118 papers were used to extract the top 1000 high-yield authors each year and construct networks, which mean that the value of M was 1000. In addition, we chose 800 as the value of E. Through comparative experiments, it was found that when M was fixed, increasing E had a little effect on network characteristics; when E was fixed and M was increased, the network remained unchanged. When the values of M and E increased simultaneously, compared with the network of E = 800 and M = 1000, the visualization was poor due to too many nodes and edges. Simultaneously, added nodes and edges increased the complexity of the network making some structural features not clearly reflected. As a result, the top 1000 high-yield authors were selected. Among these 1000 high-yield authors, the largest 800 mutual information were selected as the edges. The nodes and edges obtained above were used to build five cooperation networks by year. The final network graphs are shown in Figure 2.
In Figure 2, the value of M is 1000 and the threshold E is 800; the number of nodes in the network ranges from 120 to 140, which is relatively stable. Network density can be used to characterize the degree of interconnection between nodes, defined as the ratio of the number of edges actually present in the network to the upper limit of the number of edges that can be accommodated. The density of the network in each year is 0.092, 0.085, 0.098, 0.105, and 0.091, respectively, which means that the values of the extent of potential relationship realization in the cooperation network from 2014 to 2018 are 9.2%, 8.5%, 9.8%, 10.5%, and 9.1%, respectively. The range of variation is around 1%. First, the interaction of the research team is the antecedent of the author’s cooperation network. Active participation in scientific collaboration can affect the density of the network relationship structure. Second, when the density is higher, the more connections, information and human resources the author can get, and vice versa. Thirdly, retirement/appointment, enrollment/graduation, research team turnover, and internal staff mobilization are the main factors affecting the density of the network structure, which further influences interactive behavior and knowledge dissemination. All in all, the withdrawal of some people is always accompanied by the addition of others, keeping the network density in a dynamic and stable state.

3.2. Scale-Free Effect

The distribution of node degrees of the graphs during 2014–2018 and the change of statistical indicators of degree centrality are shown in Figure 3 and Figure 4 respectively. In Figure 3, the abscissa in the coordinate axis of the graph represents the degree of the node, and the ordinate represents the proportion of nodes having degrees greater than or equal to k to the number of total nodes. It is obvious that the cumulative degree distribution from 2014 to 2018 is not a straight line but a curved curve that conformed to the power-law distribution. Therefore, the cooperation networks from 2014 to 2018 are all scale-free networks.
In a complex network, the phenomenon that the degree is divided into two different segments implies the existence of a nuclear dictionary [33]. Despite the small portion of nodes, they are connected to a large number of other nodes, and most of the remaining nodes are connected to only a few nodes. Similarly, in the cooperation network, the curve is divided into two stages, which means that there are core authors in the biological and chemical papers. The advancement of scientific study relies to a large extent on individual scholars who have made tremendous contributions to the discipline by conducting their research teams. Although they are few in number, they have extensive cooperation with other authors. In Figure 3, the annual curve has not changed significantly compared with the previous year, which indicates that the scale-free effect of the cooperation network is stable year by year. We tried to use the scale-free structure to screen out the leading core authors. Table 2 contains the core authors of individual year durign 2014–2018. For instance, the top three authors in 2014, the author “Zhang, Y.”, who ranked first in the ranking of core authors in 2014–2016, slipped to second in 2017. Author “Wang, J.”, ranked second before 2015 and third in 2016. Similarly, author “Li, Y.” has floated between third and fourth place since 2016. Other authors, such as author “Wang, Y.”, have taken the top spot since 2017. Due to the large number of authors in this paper, it is unavoidable that there are authors with the same abbreviated names. In this case, we use the authors’ names and the affiliations in Table 2 as the search conditions, and calculate the number of papers published by authors under the same abbreviated names shown in Table 3. Although there are authors with the same name in Table 3, it can be seen from the number of published papers that each name has an author who clearly publishes more papers than others, so the conclusions studied in this paper are still valid. It is easy to find that the number of papers by a few authors is significantly higher than that by other authors. Therefore, we believe that the high-yield authors in this paper come from those who have a significantly higher volume of publications. Figure 4 shows the degree centrality of the nodes in the network. We can observe that since 2015, the centrality has shown a slow upward trend. The greater the degree centrality, the more nodes in the network that have direct contact with other nodes, and the higher the author participation in the network. Also, it proves that the core authors in the network are more and more concentrated, and the number of connections between them far exceeds that of connections between other nodes. In addition, according to the changes of the three lines given in Figure 4, although the mean of degree centrality has increased slightly over the years, the median of degree centrality has remained stable, which shows that the distribution of degree centrality has become more and more asymmetric over the years. Table 4 gives the exponential change of the power-law distribution shown in Figure 3. The value of exponent γ has a slight downward trend, meaning the curve decreases in amplitude. In the case of increased network complexity, the increase in nodes with higher degrees is slightly larger than the increase in nodes with low degrees.
Without changing the network density, the author cooperation network is composed of a small number of core authors and a large number of non-core authors. The cooperation relationship extended by the core authors constitutes the framework of the whole network. Knowledge exchange in the network is mostly accomplished through the transformation between the main paths in the framework. Meanwhile, among the biology and chemistry papers, the core authors have not changed much in recent years and are likely to remain stable in the next few years. Only the ranking order of core authors changed. Since some authors are unable to publish papers because of many reasons, some change the research areas owing to the extension and shift of the research direction. At the same time, authors who have a relatively stable research work in the field and a close group connection have also increased the number of published papers. These have resulted in changes in the ranking order of core authors. However, due to the improvement of the education level of various countries, the emphasis on knowledge and the treatment of scientific research talents have been strengthened. When some high-level and creative talents emerge in the field, such a situation may be broken. In addition, with the general increase of degree centrality of nodes, the complexity of a whole network is strengthened, leading the cooperation between authors to increase. This is an inevitable trend of vigorous development in the field of biology and chemistry.

3.3. Small-World Feature

For the cooperation networks of high-yield authors in 2014–2018, the average path length and clustering coefficient are shown in Table 5. If the average path length and clustering coefficient satisfy the following conditions simultaneously, it is a small-world network: LLrandom, and C >> Crandom.
In Table 5, the average path length in each year is about 2.1, and the clustering coefficient is between 0.6 and 0.7. Compared with ER random network, the above two conditions are satisfied. Therefore, the cooperation networks from 2014 to 2018 are typical small-world networks, and all of them almost remain at the same level. The average path length reflects the distance and efficiency of knowledge transfer between authors in the network. Small-world network with an average path length of close to 2 confirms that if there is a direct or indirect cooperative relationship between any two authors, there are at most two other authors in the path of connection, which ensures that nodes can be connected to each other within short paths, and is of great significance for knowledge transfer and dissemination. In the case where the clustering coefficient and the average path length are both stable, the small world feature of the network illustrates the cooperation between authors as a means of information transmission in the context of biological and chemical research, and information spreads between authors at a steady rate. When an author has the conditions to collaborate with other authors, his approach to the latest theory in the field is to directly or indirectly contact two or three peer authors. It provides an opportunity to grasp whether individual authors share the same research orientation. Furthermore, it offers a reference for discovering the author’s group and core figures in the field. For example, if you want to search the information about author “Wang, Y.”, the search system can directly recommend “Zhang, Y.” and “Wang, J.” because these three authors not only have a large number of papers published from 2014 to 2018, but also have direct cooperative relationship in many papers; they probably belong to one research group.

3.4. Hierarchical Organization Feature

Let C(k) denote the average aggregation coefficient of nodes with degree k. If C(k) ~ k−θ and θ > 0, the network has a hierarchical organization [34]. Figure 5 shows the aggregation coefficient of the cooperation network for each year. Table 6 lists the θ of each year. As can be seen from the figure, in 2014–2015, the θ of the network is greater than 0, and decreases gradually along the year. Therefore, the average aggregation coefficient distribution of above five cooperation networks conforms to the power-law distribution, and the networks present a hierarchical organization characteristic. The distribution of the aggregation coefficient shows a downward trend, which means that there are not only nodes with a low degree and high aggregation coefficient in the cooperation network, but also nodes with a high degree and low aggregation coefficient. Simultaneously, θ decreases year by year, which means that more and more nodes with low degree are connected to high-connection nodes making the scale of high-connection module larger.
In the cooperation network of high-yield authors, nodes with higher connectivity constitute high-connection modules, while nodes with lower connectivity constitute low-connection modules. We can infer that when some high-yield authors belong to the same group, they often possess consistent research directions and creative content, so they are more likely to have a partnership. Furthermore, the exchange of ideas between some large-scale research groups directly improves the connectivity of the network, and these authors constitute some higher connectivity modules. A part of small-scale research groups or individuals interact and cooperate to some extent constituting low-connected modules. In addition, it is worth noting that the number of authors constituting the high-connection module is steadily expanding. The connectivity module reflects the distribution and interconnection of small networks that are clustered in a large network. We believe that due to the influence of diversification and complication on some high-yield authors, part of research groups work together to form a larger high-linking module to promote the development of biology and chemistry in a more stable direction.

3.5. Closeness Centrality

For a node in the network, its closeness centrality varies from 0 to 1. The node is far away from other nodes while the closeness centrality approaches 0. Conversely, when the closeness centrality approaches 1, the node is close to other nodes [35]. The relationship between the degree of the node and closeness centrality is shown in Figure 6. The phenomenon embodied in the figure is that the closeness centrality of most nodes is positively correlated with the degree. With 0.6 as the demarcation, nodes with closeness centrality higher than 0.6 are closer to all nodes, and such nodes occupy a small portion of the cooperation network. Figure 7 shows how closeness-centralized statistical indicators change over the years. It is not difficult to see that since 2015, the indicators have experienced a brief rise and finally shown a stable state.
The shortest distance from one node to the other decreases as its closeness centrality increases. Such a node is near the center of the network. The central nodes can quickly transmit information to other nodes in the network. There are more than half of the high-yield authors on the edge of the cooperation network, while a small number of authors occupy the center and have a relatively short distance from other nodes. In the biology and chemistry papers, some of the latest innovations and discoveries are proposed and published by high-yield authors at the network center. Through direct or indirect communication and cooperation with other high-yield authors, the new theories and achievements can be rapidly disseminated. From the change of the data in Figure 6, this situation remains stable within a certain range, indicating that in the most recent 5 years, the authors of the network center have indeed promoted the dissemination of the latest research results in the field of biology and chemistry. Similarly, the data in Figure 7 also confirm the stable state of the networks’ closeness centrality, and the authors in the network center will not change significantly in a short time.

3.6. Betweenness Centrality

Figure 8 shows the relationship between betweenness centrality and node degree. The betweenness centrality of each network is less than 0.3. From the perspective of quantitative changes, there is no significant difference in the trend of each year except for a few nodes. Nodes with a large degree usually have a higher level of betweenness centrality. Betweenness centrality of nodes with degree less than 30 is almost zero, while that of nodes with degree higher than 30 increases with the increase of node degree. Figure 9 shows the change in the betweenness centrality more intuitively.
Since biology and chemistry are two disciplines with a large extent of knowledge overlap and interoperability, their research subjects will involve many sub-disciplines such as cell biology, medical informatics, biochemistry, and molecular biology, etc. As a result, there must be intersection between these branches. Some nodes with high degree in the cooperation network have strong intermediation, and the high-yield authors corresponding to these nodes are on the shortest path in which some other authors cooperate. These authors play a role in connecting sub-disciplines throughout the cooperation network, and they have extensive communication with authors of different branches and publish papers with them. Figure 9 shows the change of the betweenness centrality more intuitively. From the perspective of various indicators, since 2015, the betweenness centrality has always been in the same state, which shows that among the authors, there are people who always play the role of bridges between others, ensuring that most branches of the field in biology and chemistry are able to communicate with each other and coordinating development, promoting the diversity and vitality of the advance in biology and chemistry

4. Conclusions

Investigation and exploration of cooperation relationships in the current field can help scientific decision makers to determine research priorities, improve the structure of human and material resources, and further enhance their contributions to advanced theories, experiments and applications. In order to show the cooperation accurately, we analyzed the change of each year’s characteristics and discussed the reasons by using the relevant methods of knowledge graphs. The data we got has been counted and were mapped into networks. The network structure from five perspectives, including scale-free effect, small-world feature, hierarchical organization characteristic, closeness centrality, and betweenness centrality is evaluated, and the conclusions are drawn as following:
  • The cooperation density of the network has not changed significantly by year, and it is in a state of dynamic balance.
  • The cooperation network is a small-world network with scale-free effect. There are a small number of core authors in the network.
  • The direct or indirect cooperative relationship between any two authors goes through at most two other authors.
  • Authors in large-scale research groups in the network connect with each other to form high connectivity modules, while some relatively smaller groups or authors form low connectivity modules.
  • More than half of the authors are on the edge of the network; by spreading from the center of the network, the latest theories and achievements can be quickly passed to other authors.
  • There are always some authors who act as intermediaries, linking various branches of biology and chemistry in the network.
However, we did not consider the question of the same name among different scholars in this paper. In future work, we will consider adding the mailbox for judging if the authors with the same name are the same person.

Supplementary Materials

The following are available online at https://www.mdpi.com/2078-2489/10/7/236/s1.

Author Contributions

Conceptualization: J.Z. and X.Y.; methodology: T.L.; validation: X.Y. and J.Z.; formal analysis: X.Y.; investigation: J.Z.; resources: J.Z.; data curation: T.L.; writing—original draft preparation: X.Y.; writing—review and editing: J.Z. and X.H.; visualization: X.Y.; supervision: T.L.; project administration: J.Z.; funding acquisition: J.Z.

Funding

This research was funded by the National Natural Science Foundation of China, grant number 71271034, the National Social Science Foundation of China, grant number 15CGL031, the Fundamental Research Funds for the Central Universities, grant numbers 3132019028, 3132019175 and 3132019233, the Program for Dalian High Level Talent Innovation Support, grant number 2015R063, the National Natural Science Foundation of Liaoning Province, grant number 20180550307, the China Postdoctoral Science Foundation, grant number 2016M591421, and the National Scholarship Fund of China for Studying Abroad.

Acknowledgments

We thank the editor and reviewers for their thorough reviews, thoughtful comments and constructive suggestions.

Conflicts of Interest

The authors declare no conflict of interest.

References

  1. Chuan, P.M.; Son, L.H.; Ali, M.; Khang, T.D.; Huong, L.T. Link prediction in co-authorship networks based on hybrid content similarity metric. Appl. Intell. 2018, 48, 2470–2486. [Google Scholar] [CrossRef]
  2. Moreira, A.A.; Andrade, J.S.; Amaral, L.A.N. Extremum statistics in scale-free network models. Phys. Rev. Lett. 2002, 89, 268703. [Google Scholar] [CrossRef] [PubMed]
  3. Arango, C.R.; Alvarado, R.U. Co-words network in Mexican Bibliometrics. Investig. Bibliotecol. 2017, 31, 17–45. [Google Scholar] [CrossRef]
  4. Borgatti, S.P.; Mehra, A.; Brass, D.J.; Labianca, G. Network Analysis in the Social Sciences. Science 2009, 323, 892–895. [Google Scholar] [CrossRef] [PubMed] [Green Version]
  5. Tang, M.C.; Cheng, Y.J.; Chen, K.H. A longitudinal study of intellectual cohesion in digital humanities using bibliometric analyses. Scientometrics 2017, 113, 985–1008. [Google Scholar] [CrossRef]
  6. Germano, A.; Scibilia, A.; Raffa, G.; Esposito, F. Website-visibility of Neurosurgical Centers in Europe. A necessary tool for enhancing scientific network cooperation and information distribution: Letter to the editor. Acta Neurochir. 2018, 160, 1493–1495. [Google Scholar] [CrossRef] [PubMed]
  7. Rêgo, L.C.; Dos Santos, A.M. Co-authorship model with link strength. Eur. J. Oper. Res. 2018, 272, 587–594. [Google Scholar] [CrossRef]
  8. Singh, C.K.; Jolad, S. Structure and evolution of Indian physics co-authorship networks. Scientometrics 2019, 118, 385–406. [Google Scholar] [CrossRef] [Green Version]
  9. Geraei, E.; Mazaheri, E.; Karimi, M. Intradepartment scientific collaboration in Journal of Research in Medical Sciences: A co-authorship study. J. Res. Med. Sci. 2018, 23. [Google Scholar] [CrossRef] [PubMed]
  10. Medina, A.M. Why do ecologists search for co-authorships? Patterns of co-authorship networks in ecology (1977–2016). Scientometrics 2018, 116, 1853–1865. [Google Scholar] [CrossRef]
  11. Bordons, M.; Aparicio, J.; Gonzalez-Albo, B.; Diaz-Faes, A.A. The relationship between the research performance of scientists and their position in co-authorship networks in three fields. J. Informetr. 2015, 9, 135–144. [Google Scholar] [CrossRef] [Green Version]
  12. Abbasi, A.; Altmann, J.; Hossain, L. Identifying the effects of co-authorship networks on the performance of scholars a correlation and regression analysis of performance measures and social network analysis measures. J. Informetr. 2011, 5, 594–607. [Google Scholar] [CrossRef]
  13. Bales, M.E.; Dine, D.C.; Merrill, J.A. Associating co-authorship patterns with publications in high-impact journals. J. Biomed. Inform. 2014, 52, 311–318. [Google Scholar] [CrossRef] [PubMed] [Green Version]
  14. Kumar, S. Co-authorship networks: A review of the literature. Aslib J. Inf. Manag. 2015, 67, 55–73. [Google Scholar] [CrossRef]
  15. Bellotti, E. Getting funded. multi-level network of physicists in Italy. Soc. Netw. 2012, 34, 215–229. [Google Scholar] [CrossRef]
  16. Andrad, R.L.d.; Rêgo, L.C. Exploring the co-authorship network among cnpq’s productivity fellows in the area of industrial engineering. Pesqui. Oper. 2017, 37, 277–310. [Google Scholar] [CrossRef]
  17. Souza, F.C.d.; Amorim, R.M.; Rêgo, L.C. A Co-authorship network analysis of CNPq’s productivity research fellows in the probability and statistic area. Perspectivas em Ciência da Informação 2016, 21, 29–47. [Google Scholar] [CrossRef]
  18. Cimenler, O.; Reeves, K.A.; Skvoretz, J. A regression analysis of researchers’ social network metrics on their citation performance in a college of engineering. J. Informetr. 2014, 8, 667–682. [Google Scholar] [CrossRef]
  19. Zhu, J.; Jin, W.W.; He, C.F. On evolutionary economic geography: A literature review using bibliometric analysis. Eur. Plan. Stud. 2019, 27, 639–660. [Google Scholar] [CrossRef]
  20. Xing, Z.Y.; Cao, X. Promoting Strategy of Chinese Green Building Industry: An Evolutionary Analysis Based on the Social Network Theory. IEEE Access. 2019, 7, 67213–67221. [Google Scholar] [CrossRef]
  21. Available online: https://scholar.google.com/citations?view_op=top_venues& hl=zh-CN (accessed on 24 June 2019).
  22. Available online: https://www.ncbi.nlm.nih.gov/pubmed (accessed on 24 June 2019).
  23. Li, T.Y.; Bai, J.; Yang, X.; Liu, Q.Y.; Chen, Y. Co-Occurrence Network of High-Frequency Words in the Bioinformatics Literature: Structural Characteristics and Evolution. Appl. Sci. 2018, 8, 1994. [Google Scholar] [CrossRef]
  24. Yuan, H.L.; Li, J.; Lai, L.L.; Tang, Y.Y. Joint sparse matrix regression and nonnegative spectral analysis for two-dimensional unsupervised feature selection. Pattern Recognit. 2019, 89, 119–133. [Google Scholar] [CrossRef]
  25. Barabasi, A.L.; Albert, R. Emergence of scaling in random networks. Science 1999, 286, 509–512. [Google Scholar] [CrossRef] [PubMed]
  26. Zhong, X.; Liu, J.; Gao, Y.; Wu, L. Analysis of co-occurrence toponyms in web pages based on complex networks. Physica A 2017, 466, 462–475. [Google Scholar] [CrossRef]
  27. Watts, D.J.; Strogatz, S.H. Collective dynamics of ‘small-world’ networks. Nature 1998, 393, 440–442. [Google Scholar] [CrossRef] [PubMed]
  28. Leon, D.A.; Valdivia, J.A.; Bucheli, V.A. Modeling of Colombian Seismicity as Small-World Networks. Seismol. Res. Lett. 2018, 89, 1807–1816. [Google Scholar] [CrossRef]
  29. Garg, M.; Kumar, M. The structure of word co-occurrence network for microblogs. Physica A 2018, 512, 698–720. [Google Scholar] [CrossRef]
  30. Freeman, L.C. Centrality in social networks conceptual clarification. Soc. Netw. 1979, 1, 215–239. [Google Scholar] [CrossRef] [Green Version]
  31. Liu, H.L.; Ma, C.; Xiang, B.B.; Tang, M.; Zhang, H.F. Identifying multiple influential spreaders based on generalized closeness centrality. Physica A 2018, 492, 2237–2248. [Google Scholar] [CrossRef]
  32. Iyer, S.V.; Dange, P.P.; Alam, H.; Sawant, S.S.; Ingle, A.D.; Borges, A.M.; Shirsat, N.V.; Dalal, S.N.; Vaidya, M.M. Attack Robustness and Centrality of Complex Networks. PLoS ONE 2013, 8, e59613. [Google Scholar] [CrossRef]
  33. Xu, Z.P.; Li, K.Z.; Sun, M.F.; Fu, X.C. Interaction between epidemic spread and collective behavior in scale-free networks with community structure. J. Theor. Biol. 2019, 462, 122–133. [Google Scholar] [CrossRef] [PubMed]
  34. Ravasz, E.; Barabasi, A.L. Hierarchical organization in complex networks. Phys. Rev. E 2003, 67, 261121–261127. [Google Scholar] [CrossRef] [PubMed]
  35. Goldstein, R.; Vitevitch, M.S. The Influence of Closeness Centrality on Lexical Processing. Front. Psychol. 2017, 8, 1683. [Google Scholar] [CrossRef] [PubMed] [Green Version]
Figure 1. The process of constructing and analyzing the author cooperation network.
Information 10 00236 g001
Figure 2. Cooperation network graphs among authors during 2014–2018. Figure 2 contains five graphs, which are arranged by year as: (a) 2014, (b) 2015, (c) 2016, (d) 2017, (e) 2018.
Information 10 00236 g002aInformation 10 00236 g002b
Figure 3. Degree cumulative distribution curve during 2014–2018. Figure 3 contains five graphs, which are arranged by year as: (a) 2014, (b) 2015, (c) 2016, (d) 2017, (e) 2018.
Information 10 00236 g003aInformation 10 00236 g003b
Figure 4. The statistical indicators of degree centrality curve during 2014–2018.
Information 10 00236 g004
Figure 5. Aggregation coefficient distribution during 2014–2018. Figure 5 contains five graphs, which are arranged by year as: (a) 2014, (b) 2015, (c) 2016, (d) 2017, (e) 2018.
Information 10 00236 g005aInformation 10 00236 g005b
Figure 6. Distribution of closeness centrality during 2014–2018. Figure 5 contains five graphs, which are arranged by year as: (a) 2014, (b) 2015, (c) 2016, (d) 2017, (e) 2018.
Information 10 00236 g006
Figure 7. The statistical indicators of closeness centrality curve during 2014–2018.
Information 10 00236 g007
Figure 8. Distribution of betweenness centrality during 2014–2018. Figure 8 contains five graphs, which are arranged by year as: (a) 2014, (b) 2015, (c) 2016, (d) 2017, (e) 2018.
Information 10 00236 g008aInformation 10 00236 g008b
Figure 9. The statistical indicators of betweenness centrality curve during 2014–2018.
Information 10 00236 g009
Table 1. Overview of the 77 journals.
NoJournal NameIF(5years)RankArea(s)Press
1Nature44.958JCR1Multidisciplinary ScienceMacmillan Journals ltd.
2Chemical Society reviews41.27JCR1Chemistry and MultidisciplinaryChemical Society.
3Cell33.796JCR1BiologyMIT Press.
4Nature Communications13.691JCR2Multidisciplinary ScienceNature Pub. Group
5Chemical Reviews55.198JCR1Chemistry and MultidisciplinaryAmerican Chemical Society.
6Journal of the American Chemical Society13.613JCR1Chemistry and MultidisciplinaryEaston, Pa. [etc.]
7Nucleic Acids Research10.235JCR1Biochemistry and Molecular BiologyInformation Retrieval ltd.
8ACS Nano14.82JCR1Chemistry and MultidisciplinaryAmerican Chemical Society
9Physical Review Letters7.888JCR1Physics MultidisciplinaryAmerican Physical Society
10Nano Letters14.201JCR1Chemistry and MultidisciplinaryAmerican Chemical Society
11Nature Genetics31.154JCR1 Genetics and HeredityNature Pub. Co.
12Journal of the American College of Cardiology18.737JCR1Cardiac and Cardiovascular SystemsElsevier Biomedical
13Plos One3.352JCR3BiologyPublic Library of Science
14Nature Materials47.534JCR1Chemistry and MultidisciplinaryNature Pub.
15Nature Medicine33.409JCR1Biochemistry and Molecular BiologyNature Pub. Co.
16Circulation17.902JCR1Medical InformaticsAmerican Heart Association
17Accounts of Chemical Research22.361JCR1Chemistry and MultidisciplinaryAmerican Chemical Society.
18The Astrophysical Journal5.402JCR1Astronomy and AstrophysicsThe University of Chicago Press for the American Astronomical Society.
19Nature Nanotechnology45.815JCR1Materials Science and MultidisciplinaryNature Pub.
20Nature Biotechnology43.271JCR1Biotechnology and Applied MicrobiologyNature Pub.
21Nature Photonics38.551JCR1PhysicsNature Pub.
22Nature Methods41.934JCR1BiologyNature Pub.
23BMJ2.801JCR3Medical InformaticsBMJ Publishing Group Ltd
24Blood12.365JCR1Medical InformaticsGrune & Stratton [etc.]
25The Journal of Materials Chemistry A9.531JCR1Chemistry and PhysicalRoyal Society of Chemistry Pub.
26Scientific Reports4.609JCR3Multidisciplinary SciencesNature Publishing Group
27Neuron16.076JCR1Medical InformaticsCell Press
28Cochrane Database of Systematic Reviews7.669JCR2Medical InformaticsOxford, U.K.
29Gastroenterology19.131JCR1Medical InformaticsBaltimore.
30Nature Neuroscience19.188JCR1Medical InformaticsNature America Inc.
31Advanced Functional Materials13.274JCR1Chemistry and MultidisciplinaryWiley-VCH, c2001-
32Immunity23.618JCR1Medical InformaticsCell Press
33The Journal of Clinical Investigation14.434JCR1Medical InformaticsAmerican Society for Clinical Investigation.
34Nanoscale7.713JCR1Chemistry and MultidisciplinaryRSC Pub.
35ACS Applied Materials & Interfaces8.284JCR1Nanoscience and NanotechnologyAmerican Chemical Society
36Monthly Notices of the Royal Astronomical Society4.893JCR2Astronomy and AstrophysicsOxford University Press
37Nature Reviews Immunology46.507JCR1Medical InformaticsNature Pub. Group
38Science Translational Medicine18.614JCR1CellbiologyAmerican Association for the Advancement of Science
39Nature Reviews Genetics44.913JCR1Genetics and HeredityNature Pub.
40Nature Reviews Cancer50.293JCR1Medical InformaticsNature Pub. Group
41Cell Stem Cell23.799JCR1Cell and Tissue EngineeringCell Press
42Cancer Research9.578JCR1OncoligyAmerican Association for Cancer Research
43Chemical communications6.064JCR1Chemistry and MultidisciplinaryRoyal Society of Chemistry
44Nature Climate Change22.363JCR1Environmental Science and EcologyNature Pub. Group
45Physical Review B3.704JCR2PhysicsAmerican Physical Society
46Diabetes Care10.74JCR1BiologyAmerican Diabetes Assn.
47Advanced Energy Materials19.687JCR1PhysicsWiley-VCH
48Hepatology11.889JCR1Medical InformaticsWilliams & Wilkins, [c1981]-
49Nature Reviews Molecular Cell Biology47.918JCR1CellbiologyNature Pub. Group
50Annals of Internal Medicine18.726JCR1Medical InformaticsAmerican College of Physicians
51Nature Immunology21.974JCR1Medical InformaticsNature America Inc.
52Nature Physics22.61JCR1PhysicsNature Pub. Group
53Cell Metabolism21.398JCR1CellbiologyCell Press
54The Journal of Physical Chemistry Letters8.48JCR1Chemistry and MultidisciplinaryAmerican Chemical Society
55The Lancet Neurology28.055JCR1Medical InformaticsLancet Pub. Group
56Environmental Science & Technology7.25JCR1Engineering and EnvironmentalAmerican Chemical Society
57Gut15.91JCR1Medical InformaticsBritish Medical Assn.
58Nature Reviews Neuroscience38.691JCR1Medical InformaticsNature Pub. Group
59European Urology15.655JCR1Medical InformaticsElsevier Science
60Nature Chemistry28.79JCR1Chemistry and MultidisciplinaryNature Pub. Group
61Biomaterials9.315JCR1Engineering and BiomedicalIPC Science and Technology Press
62NeuroImage7.079JCR2Medical InformaticsAcademic Press
63Cancer Cell27.072JCR1CellbiologyCell Press
64Annals of the Rheumatic Diseases11.152JCR1Medical InformaticsBMJ
65Applied Energy7.888JCR1Energy and FuelsApplied Science Publishers.
66IEEE Transactions on Pattern Analysis and Machine Intelligence13.229JCR1Computer Science and Artificial IntelligenceIEEE Computer Society.
67Pediatrics6.442JCR1BiologyAmerican Academy of Pediatrics
68Journal of Cleaner Production6.352JCR1Environmental SciencesButterworth-Heinemann, Ltd
69ACS Catalysis11.783JCR1Chemistry and PhysicalAmerican Chemical Society
70Nature Reviews. Drug Discovery54.49JCR1Biotechnology and Applied MicrobiologyNature Pub. Group
71Obstetrical & Gynecological Survey2.164JCR4Medical InformaticsWilliams and Wilkins
72Circulation Research13.313JCR1Medical InformaticsLippincott Williams & Wilkins
73Journal of Hepatology12.723JCR1Medical InformaticsMunksgaard International Publishers
74The New England Journal of Medicine67.513JCR1Medical InformaticsMassachusetts Medical Society.
75JAMA10.415JCR1Medical InformaticsAmerican Medical Association
76The Lancet Oncology33.234JCR1OncologyLancet Pub. Group
77The Astrophysical Journal5.402JCR1Astronomy and AstrophysicsThe University of Chicago Press for the American Astronomical Society.
Table 2. The core authors of each year.
20142015201620172018
Zhang, Y.Zhang, Y.Zhang, Y.Wang, Y.Wang, Y.
Wang, J.Wang, J.Wang, Y.Zhang, Y.Zhang, Y.
Li, Y.Li, Y.Wang, J.Wang, J.Wang, J.
Wang, Y.Wang, Y.Wang, X.Li, Y.Zhang, J.
Wang, X.Zhang, L.Li, Y.Zhang, J.Li, Y.
Zhang, L.Zhang, J.Zhang, J.Li, J.Wang, Z.
Zhang, J.Wang, X.Zhang, X.Li, X.Wang, H.
Zhang, X.Li, J.Zhang, L.Liu, Y.Wang, X.
Liu, Y.Zhang, X.Li, J.Wang, X.Li, J.
Li, J.Liu, Y.Liu, Y.Wang, Z.Liu, Y.
Table 3. Statistical data on the number of papers published by authors from different affiliations with the same abbreviated names.
AuthorNumber of PapersAffiliation
Zhang, Y.3852University of Chinese Academy of Science
796QiLu Hospital
392The Third Affiliated Hospital of Sun Yat-sen University
353National University of Defense Technology
326Steven Institute of Technology
Wang, J.3245Capital Medical University
691The Chinese University of Hong Kong
447University of Illinois at Urbana-Champaign
343Sichuan University
231South China University of Technology
Li, Y.2949Shandong University
870Harbin Institute of Technology
681University of Manchester
657Hubei University of Medicine
453Chinese PLA General Hospital
Wang, Y.3119Fudan University
687University of Chinese Academy of Sciences
537Ningbo University
457Cornell University
439Tsinghua University
Wang, X.3333Zhejiang University
789Chinese Academy of Agricultural Sciences
654University of Michigan
491China Medical University
452Xi’an Jiaotong University
Zhang, L.3619Second Military Medical University
866Qingdao University
762Soochow University
459University of Illinois
433Aarhus University
Zhang, J.3543Chinese Academy of Sciences
784Sichuan University
598Shanghai Jiaotong University
463China Agricultural University
456Southeast University
Zhang, X.3329Nankai University
866University of Science and Technology of China
713Harbin Institute of Technology
772Tongji University School of Medicine
323Sichuan Agricultural University
218South China University of Technology
Liu, Y.2854Peking University
589University of Maryland
545East China University of Science and Technology
371Northeast Agricultural University
292The University of Texas at Austin
Li, J.3074University of California
609Jinan University
580Tianjin University
501Lanzhou University
339University of Washington
Li, X.2468Fudan University
576Lanzhou University
483Jiangnan University
476Shanghai Medical College
273Southwest University
Wang, Z.2778China Medical University
647Duke University
589University of Oklahoma
542Nanjing Agricultural University
449Nankai University
Wang, H.2672Tsinghua University
538Massachusetts General Hospital
393Northwestern University
255South China University of Technology
240Xi’an Jiaotong University
Table 4. γ for each year.
Exponent20142015201620172018
γ0.5920.6010.5930.5750.568
Table 5. The average path length and aggregation coefficient of the networks during 2014–2018.
Parameter20142015201620172018
L2.140 2.1432.0072.0312.257
C0.6310.6380.6280.6450.624
Table 6. θ for each year.
Parameter20142015201620172018
θ0.6160.5940.5690.5210.472

