1. Introduction
The increasing growth of cities demands new policies to promote urban sustainable development. This rapid growth of cities imposes new challenges in urban planning, namely dealing with pollution and creation of new infrastructures and services to deal with the increase of population in cities [
1]. Indeed, it is expected that by 2030, 60% of world’s population will live in cities [
2]. This increase in city population will lead to a massive consumption of natural resources and contribute drastically to an increase in the emission of greenhouse gases, necessitating greater environmental efficiency to guarantee that cities become sustainable in the long term [
3].
The concept of a smart city emerged in 1997, with the intent of limiting CO
2 emissions due to the increasing growth of urban development [
4]. Nowadays this aspect is even more relevant, and CO
2 emissions play a central role in the political agenda, due to the recognition that CO
2 emissions are the major contributor to climate change [
5]. In this sense, there is the need to implement measures in cities to mitigate anthropogenic CO
2 emissions, like encouraging alternate methods of transportation (e.g., public transport and bikes), reducing the energy consumed by buildings (e.g., use of more thermally efficient materials in the construction of buildings, use of energy efficient LED light bulbs), investing in renewable energy, and encouraging recycling.
Urban trees play a fundamental role in CO
2 storage and sequestration as they act as a sink for CO
2 by fixing carbon during photosynthesis and storing excess carbon as biomass [
6]. As urban areas continue to expand, urban trees are fundamental to maintaining environmental quality and there is the need to understand the impacts that urban trees have on carbon storage in cities, as they store carbon in their tissue while they grow. The expansion of urban trees in cities is extremely important to decrease the amount of carbon that is released into the atmosphere by human activities. Indeed, the carbon stored by urban trees can only mitigate the emissions caused by human activities, as the amount of carbon released by human activities is higher than the one stored by trees. When trees die and decompose, they also release carbon in the atmosphere, this fact is important because knowing the carbon stored in trees, provides a general overview of the amount of carbon that could be released into the atmosphere when the trees die.
An internationally accepted approach that has been used to measure carbon storage in trees is through allometric equations [
7,
8] and this method has been used in several studies to measure carbon storage [
9,
10,
11,
12]. Allometric equations relate the biomass or volume of trees, using certain characteristics of the trees (e.g., stem diameter at breast height, height), and different methods exist to develop them, depending on the objective (e.g., measuring commercial volume, biomass, carbon) [
13]. In this sense, there are two main difficulties in the choice of the most accurate allometric equation namely: (1) More than one allometric equation may be available for a tree species and for a given ecological zone; and (2) there may be no allometric equation for a given species or ecological zone [
13,
14]. For these reasons, it becomes necessary, to use a global tree allometric equation database to provide the specific equations, along with their specific characteristics, mandatory to compute trees volume and/or biomass (e.g., GlobAllomTree [
13]). Beyond the above mentioned difficulties, the accuracy of carbon quantification depends on the underlying data used to derive the allometric models, causing these models to be an important source of uncertainty in carbon quantification [
15].
Open data initiatives are considered as defining elements of emerging smart cities [
16] as they provide citizens with the tools necessary to create new, innovative services or applications [
17,
18]. The city of Lisbon with the goal of promoting citizen participation, encouraging data reuse and sharing, and stimulating innovation created a portal with open data for the city of Lisbon (
http://lisboaaberta.cm-lisboa.pt) in which there is a data set regarding the urban trees of Lisbon, which could be used in the context of carbon storage. Indeed, the main goal of this initiative of the city of Lisbon, is to transform Lisbon into a data-driven planning and management city, leading to a better quality of life for their citizens, employers, employees and visitors [
19].
The aim of this paper is to study the potential of urban tree open data to measure carbon storage quantity, density, and value by using the seven most represented tree species in the parishes of the city of Lisbon.
2. Data and Methods
The city of Lisbon is located in the western part of the Portuguese mainland (38° 43′ latitude N and 9° 9′ longitude W). The city covers an area of 84 km
2, is divided into 24 parishes, and is located 30 km east of the Atlantic and on the right bank of the Tagus river. Lisbon is characterized to have a subtropical–Mediterranean climate with short and very mild winters and warm summers. The average annual temperature is 21.5 °C with an average annual precipitation of 774 mm. To compute the urban tree carbon storage in the city of Lisbon, an urban tree database was downloaded from a publicly available website of open data regarding the city of Lisbon (
http://lisboaaberta.cm-lisboa.pt). The urban tree database possesses information about the urban trees of Lisbon namely, the geographic location, id number, scientific name, circumference at breast height (cm) of the trunk, height (m), age (young or adult), and place of plantation (cemetery, school, green area and street) of about 61,447 trees. An example of the information collected from the database for four individual trees is showed in (
Table 1).
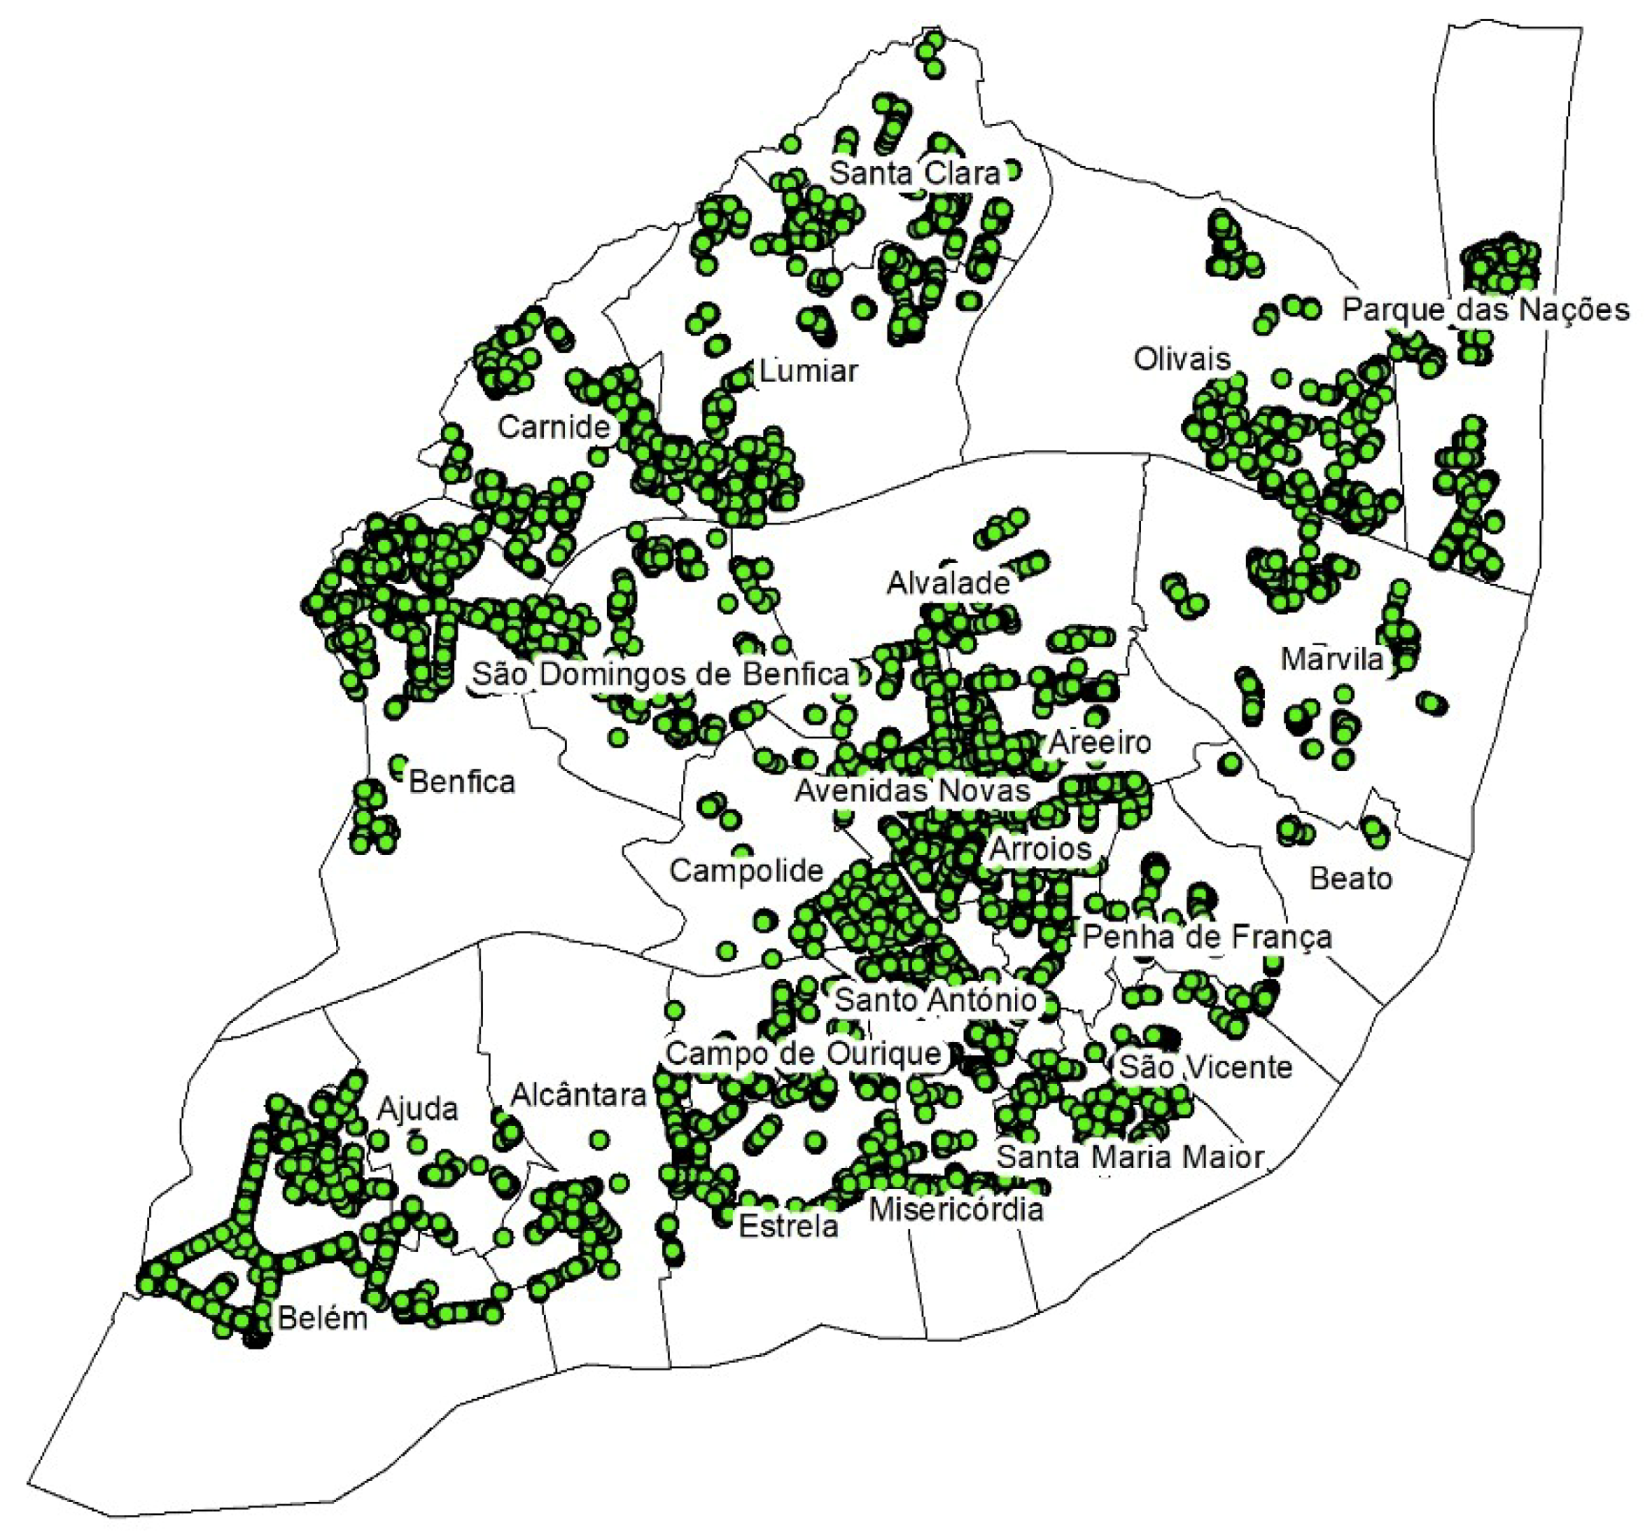
For the computation of carbon storage, were chosen the seven most represented tree species, namely
Acer negundo,
Celtis australis,
Cercis siliquastrum,
Jacaranda mimosifolia,
Platanus spp.,
Populus nigra, and
Tipuana tipu, resulting in a set of 15,229 individuals (24.7% of the total number of trees). In
Figure 1 is presented the spatial distribution of tree species selected for this study in the city of Lisbon.
The number of individuals (N
h) for each species and their relative proportion (f
r) in this set, is presented in
Table 2 along with the mean and standard deviation for diameter at breast height (
dbh) and height (
ht). The
cbh was converted to
dbh by dividing the perimeter by π.
To deal with the missing values for
dbh and
ht, an R package named “mice” (Multivariate imputation by chained equations in R) was used that imputes incomplete multivariate data by chained equations [
20]. The imputation is made on a variable-by-variable basis by specifying an imputation model per variable, using the information from other variables in the data set to predict and impute the missing values. As
pbh and
ht are related with the tree species and their age, the tree species and age were used as predictors along with
pbh and
ht. The methods for imputing the missing values were specific for each variable depending on whether the variable was continuous or ordinary. In this study, we used predictive mean matching for the continuous variables (i.e.,
pbh and
ht), logistic regression for the binary variable (i.e., age), and Bayesian polytomous regression for the tree species.
The approach used to measure the carbon storage of each tree species is composed of the following steps: (1) Compute the volume of each individual tree species using an allometric equation for that tree species; (2) compute the dry weight biomass of each tree, multiplying the volume of each tree species by the corresponding dry weight density factor of that tree species (retrieved from the Global Wood Density Database [
21]); (3) compute the total dry weight biomass (i.e., including below-ground biomass) by multiplying the dry weight biomass by 1.28 [
22,
23]; and (4) convert the total dry weight biomass of carbon, multiplying the total dry weight biomass by 0.5. This value is used by several authors [
6,
12,
24] to calculate the dry weight biomass of carbon and/or also when the specific carbon amounts for each tree species is unknown [
25,
26].
In
Table 3 are presented the allometric equations used to compute the volume of each tree species, with the indication of the equation reference. The allometric equations were retrieved from the GlobAllomTree database [
13] website (
http://globallometree.org/). When a specific equation for a tree species was not found, we used the equation of a similar tree species of the same genus. When there was no similar species of the same genus, we used a general equation for broadleaf trees [
27].
As the retained carbon per tree is known following the previous steps along with the geographic location of each tree, it was possible to elaborate a density map of carbon storage in kg per ha in the city of Lisbon, using the tool “Point density” of the software ArcMap by ESRI (Environmental Systems Research Institute). This tool calculates a magnitude per unit area from point features that fall within a specified neighborhood around each cell.
To compute the carbon monetary value associated with the seven most represented urban trees in the city of Lisbon, the carbon quantity of each tree was first converted to quantity of CO
2 by multiplying the carbon quantity by 3.67 (molecular weight of CO
2). The CO
2 value obtained for each tree was multiplied by the estimated social cost of carbon for Portugal in 2018 (42.4 €/tCO
2). This value was based on the HEAT tool (Health Economic Assessment tool) approach to compute the social costs of carbon [
32]. The value for the social costs of carbon of this tool is provided by country and year, based on international evidence, regional averages, or country-specific values.
As the tree database provides information regarding the place in which each tree is planted (i.e., if the tree is located in a school, street, or green area), the carbon storage was quantified for each one of these categories in each parish. The rationale for this analysis was to gain insights about the characteristics of the places where trees are located, and determine their relationship with carbon storage. This analysis will allow to municipality decision makers to adopt planning measures relatively to trees plantation.
To improve the understanding of the decision makers about the data, a dashboard with five visuals was elaborated, namely: (1) A visual with the carbon storage by tree species where it was possible to see on a map this quantity by parish; (2) a visual with a heat map where it was possible to visualize the areas of the city of Lisbon where there are major values of carbon storage; (3) a visual with the total number of trees used in this study, and the total quantity and monetary value of carbon storage; (4) a visual with a donut chart where the frequency of each tree species relatively to the total number of trees is represented; and (5) a visual with a tree map where the monetary value of each tree species is represented.
3. Results
In
Table 4 is presented the percentage of individuals for each tree species (N
h) from the total of 15,229 individuals, the percentage of individuals selected for each tree species that were used for the imputation of missing values (n), the percentage of missing values for
dbh,
ht, and missing values in both
dbh and
ht.
The most represented tree species was C. australis, with 46% of individuals, followed by J. mimosifolia and Platanus spp. with 16% and 11% of individuals, respectively. The remaining tree species each represented approximately the same percentage of individuals (between 6% and 8%). About half of the individuals for each tree species were used for the imputation of missing values for dbh and ht. The exceptions were Platanus spp. with 62% and T. tipu with 57% of individuals that were used for the imputation of missing values. The tree species with the highest percentage of missing values for dbh were A. negundo and C. siliquastrum with 52%. Platanus spp. presented the lowest percentage of missing values for dbh (38%). The variable ht presented high percentages of missing values, ranging between 82% for Platanus spp. and 92% for J. mimosifolia.
In
Table 5 is presented the mean (µ) and standard deviation (σ) for
dbh before and after the imputation of missing values for each tree species. For each tree species, the difference between means was also computed before and after imputation of missing values, to verify the accuracy of the imputation.
The dbh means computed for the tree species after imputation, resulted in higher values when compared with the means before imputation. Despite these differences being very small for the majority of the tree species, which shows the high accuracy of the imputation, there were two exceptions. Indeed, the differences for Platanus spp. dbh mean (–5.36) and P. nigra dbh mean (–4.00) indicated that, for these two species, the accuracy of the imputation was low.
The mean for
ht (m) for each tree species, before and after imputation of missing values, is presented in
Table 6.
Analyzing
Table 6, it could be verified that the mean for
ht, presented slightly higher values before imputation, except for
T. tipu and
C. siliquastrum. As the differences of the means for
ht, for each tree species, were very small, it could be concluded that the accuracy of the imputation for
ht was high.
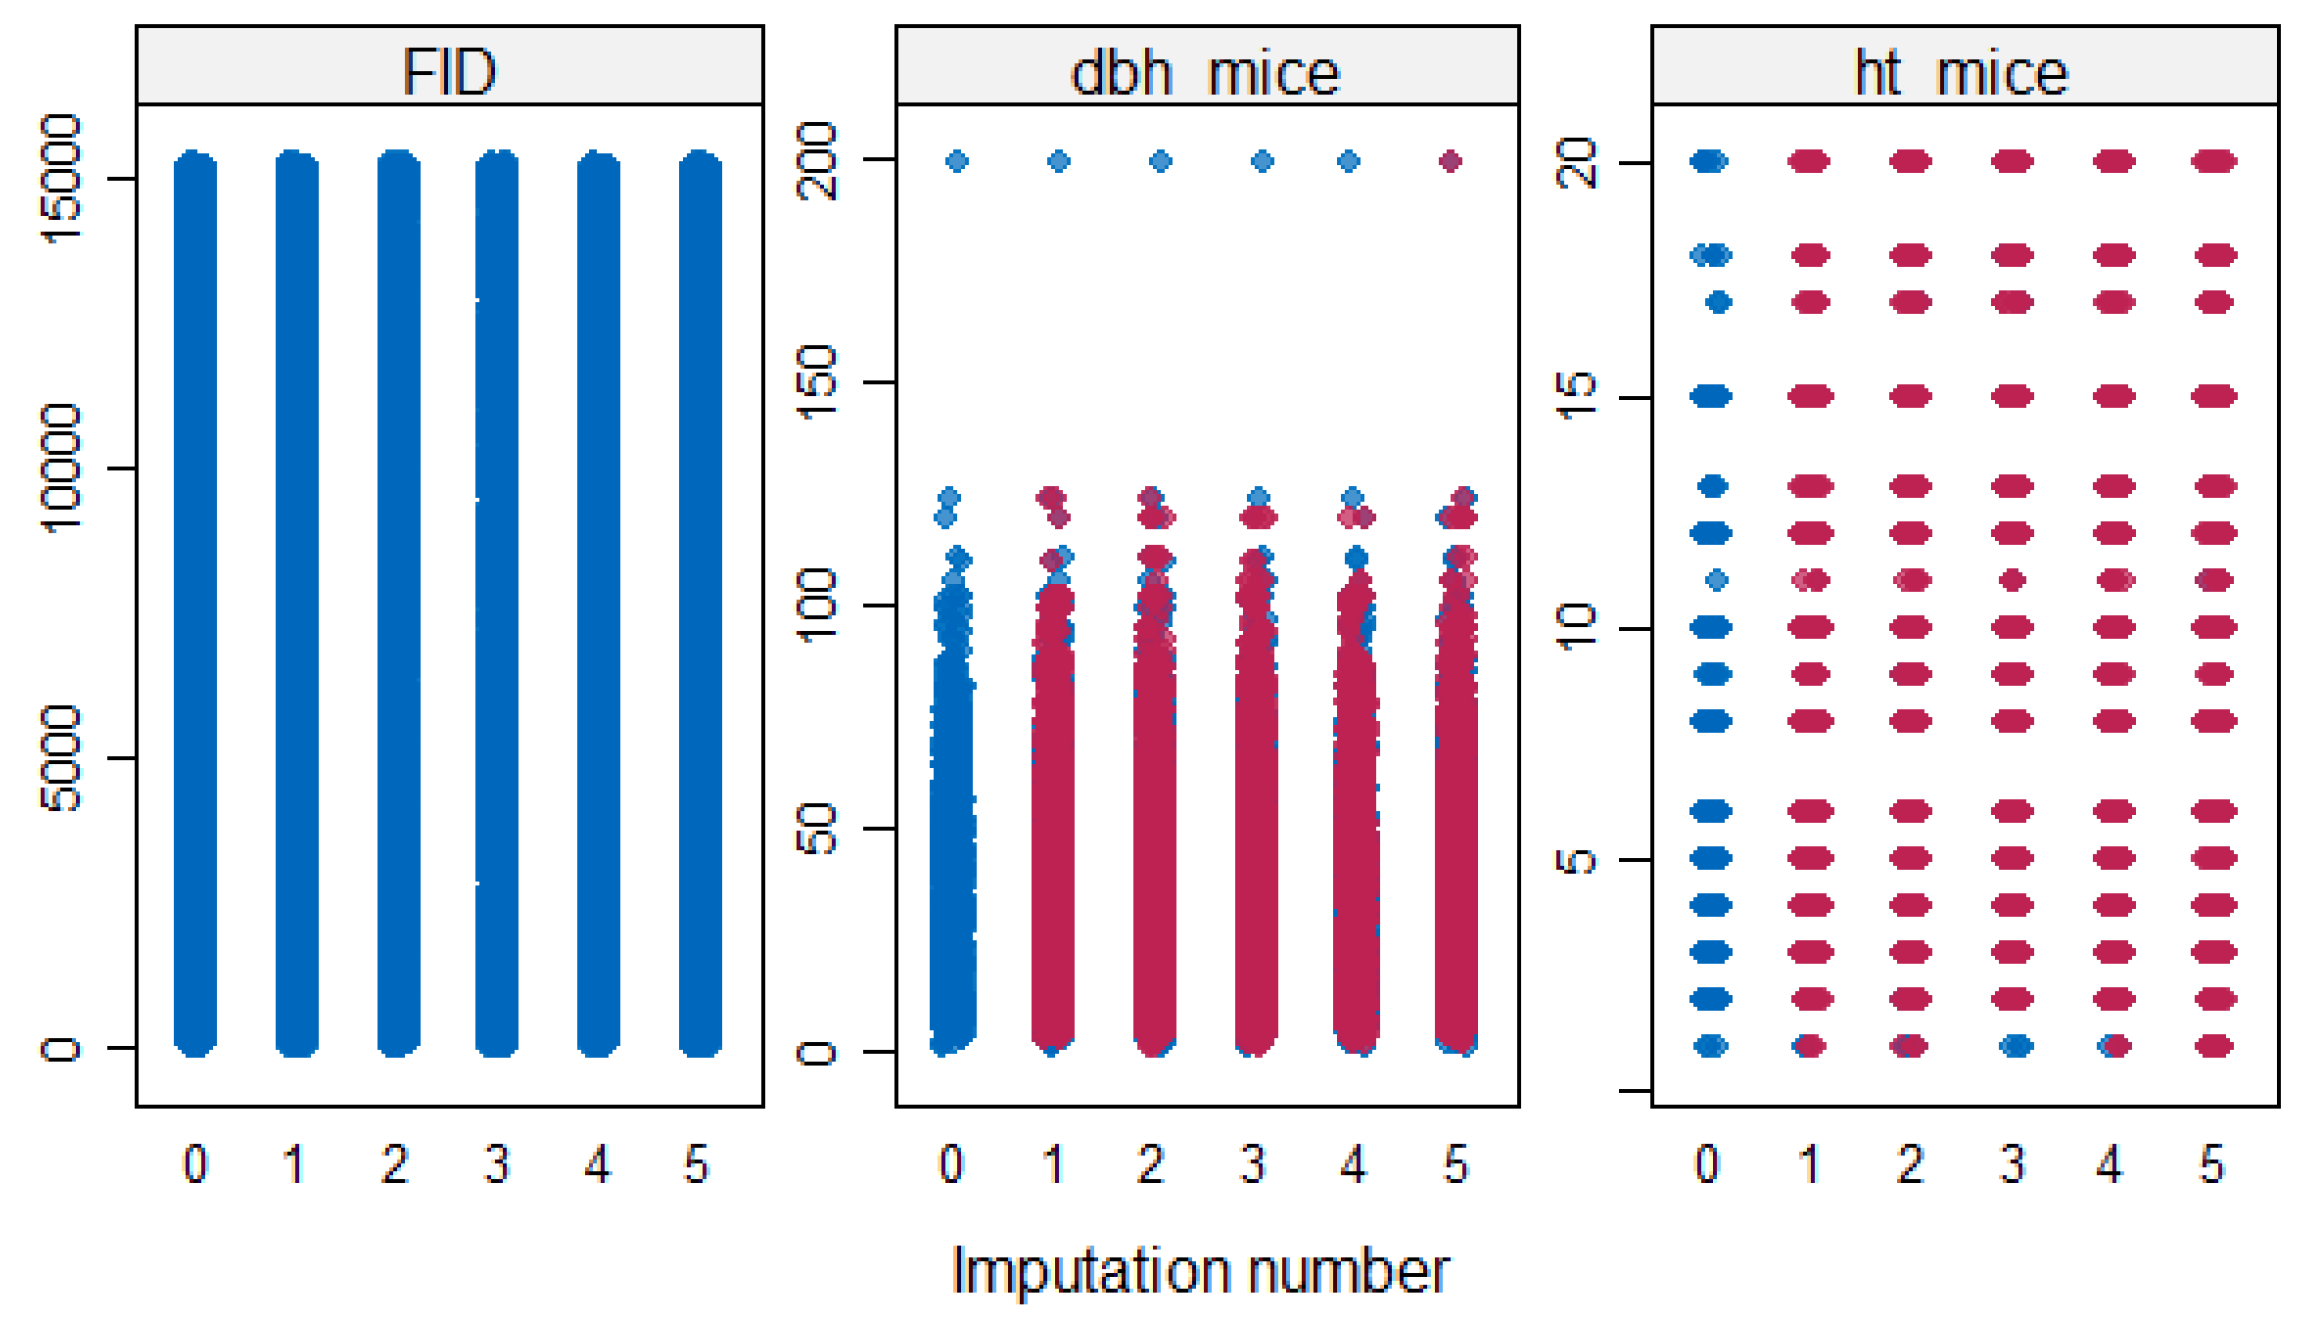
Figure 2 shows the distribution of the two imputed variables (i.e.,
dbh and
ht) as individual points for each one of the five imputations made, where the blue points are observed, and the red points are imputed. The panel for FID (the unique identifier for each tree species) contains only blue points because FID was complete.
Analyzing
Figure 2, the red points followed the blue points reasonably well, including the gaps in the distribution for
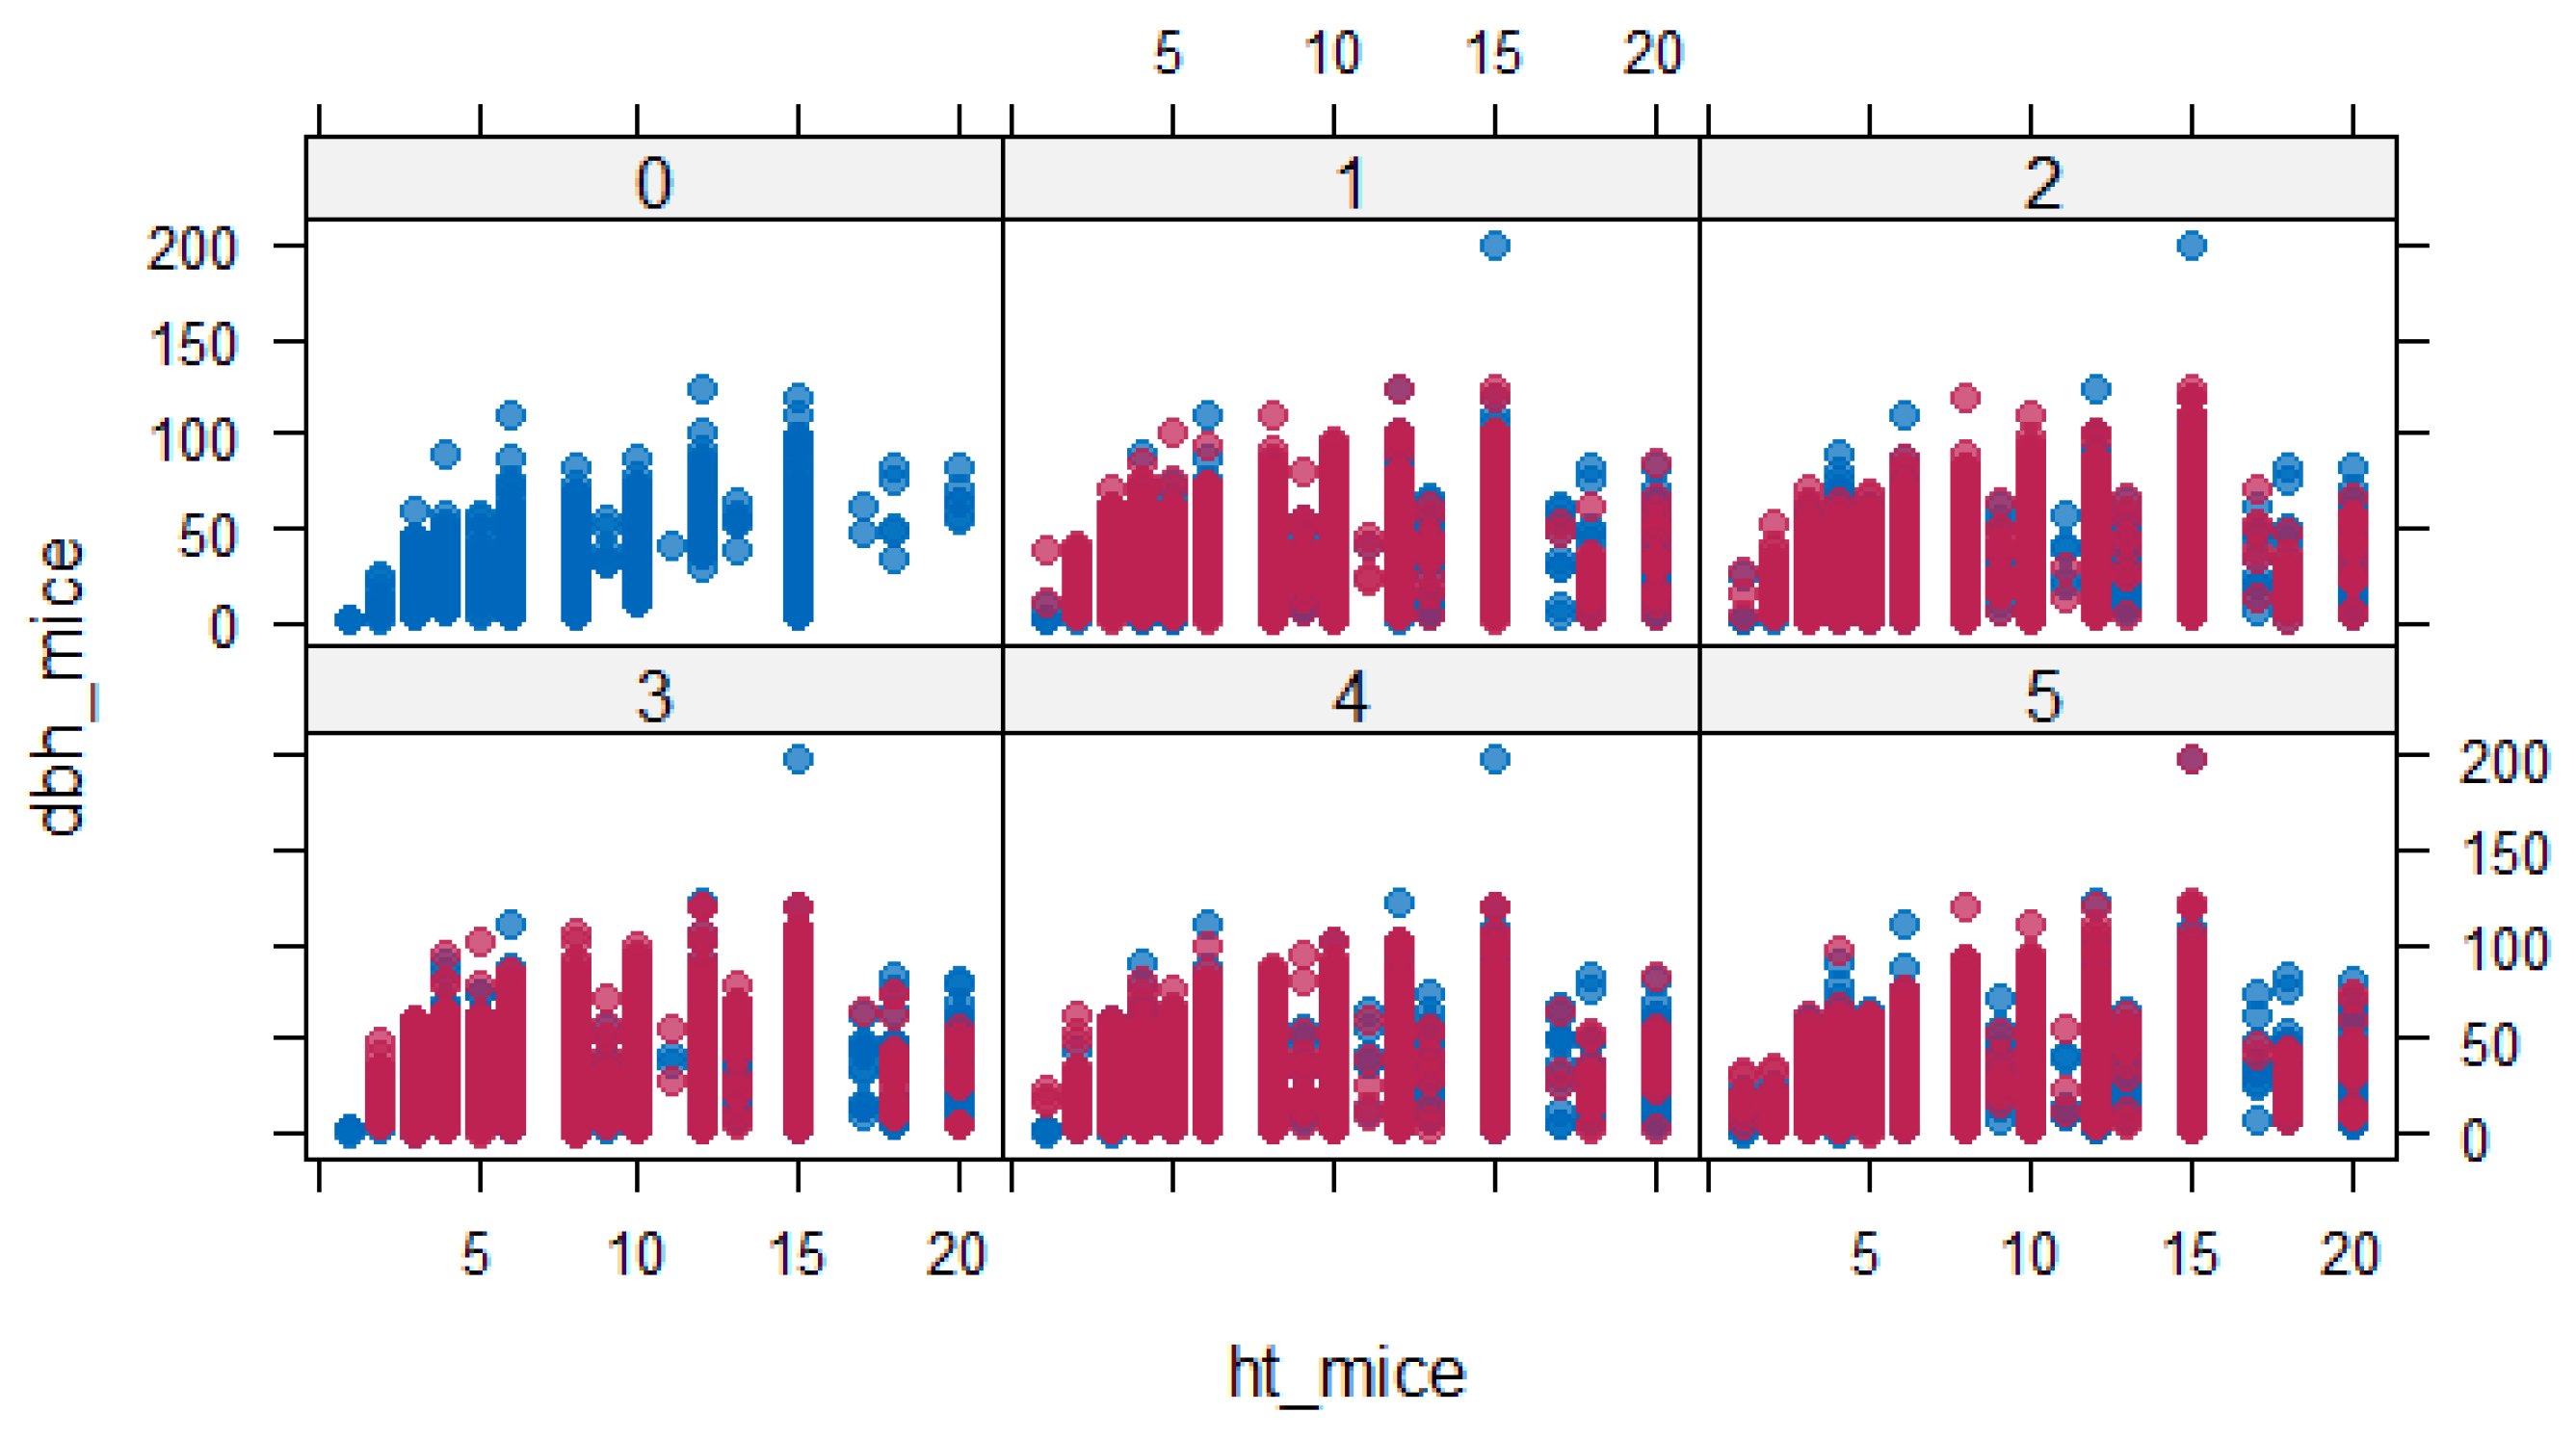
ht. A scatter plot for
dbh and
ht is shown in
Figure 3.
The blue points were the same across all the panels (each panel representing one of the five imputations), but the red points varied. The red points had more or less the same shape as the blue points, indicating that they could have been plausible measurements if they had not been missing.
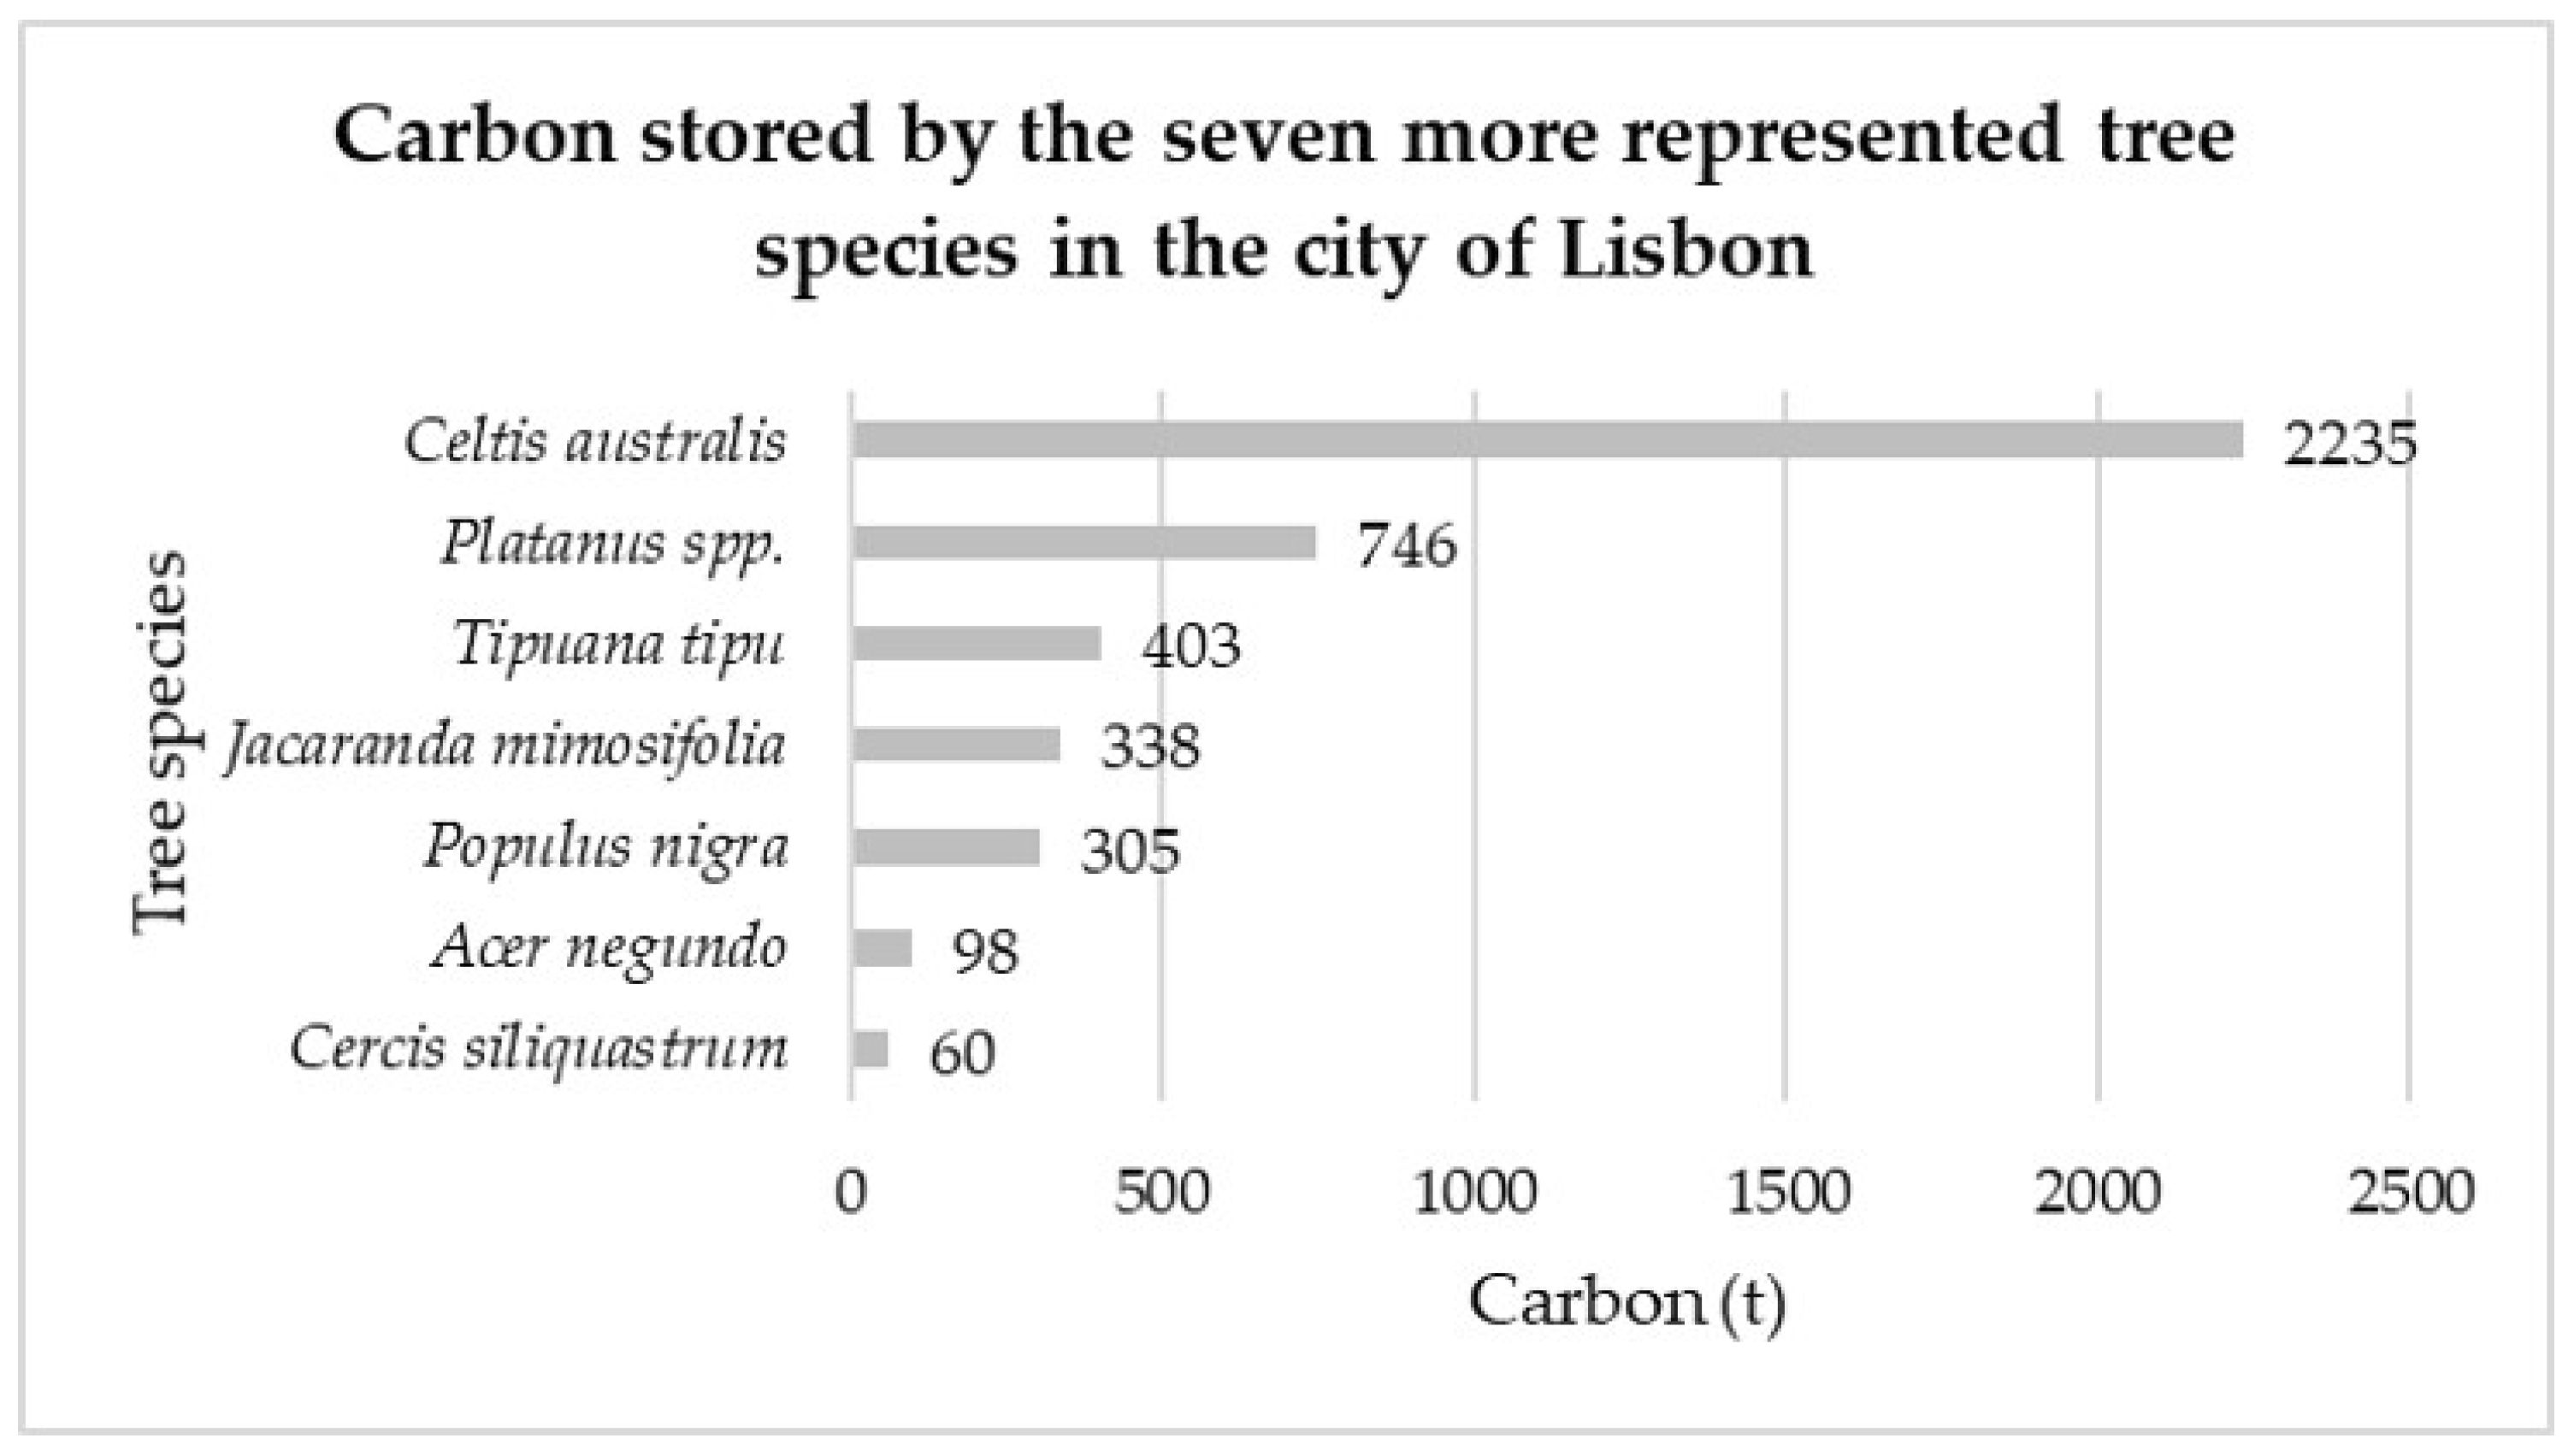
In
Figure 4 is presented the total carbon storage for each one of the tree species in the city of Lisbon.
The total carbon amount that was stored by the seven most represented tree species in the city of Lisbon was 4185 t, for which
C. australis contributed to more than a half of that value (2235 t). Indeed, this tree species was the most represented in the city of Lisbon (
Table 4). However, this aspect should not be taken as a rule of thumb regarding the other tree species. As an example, despite
J. mimosifolia, being more represented than
Platanus spp., the later had a higher carbon storage value. This could be explained by the higher
dbh and
ht mean values (
Table 5 and
Table 6) for
Platanus spp. when compared with
J. mimosifolia. The same rationale could be extended regarding
T. tipu that was less represented (7%) than
J. mimosifolia (16%) but had a higher value of carbon stored (403 t against 338 t) but, in this case, just the mean
dbh value and the dry weight density value were higher for
T. tipu. Despite
P. nigra, being the least represented tree species and having the lowest dry weight density value, it presented much higher carbon storage values (305 t) than
A. negundo (98 t) and
C. siliquastrum (60 t). Indeed, as
P. nigra was the tree species with the highest mean dimensions for
dbh and
ht, it seemed to contribute greatly to carbon storage. In this sense, it can be concluded that carbon storage depends not only on the number of trees but also on their biomass. In this sense, the quantity of carbon stored was highly influenced by the tree species and the
dbh and
ht values that the tree species presents.
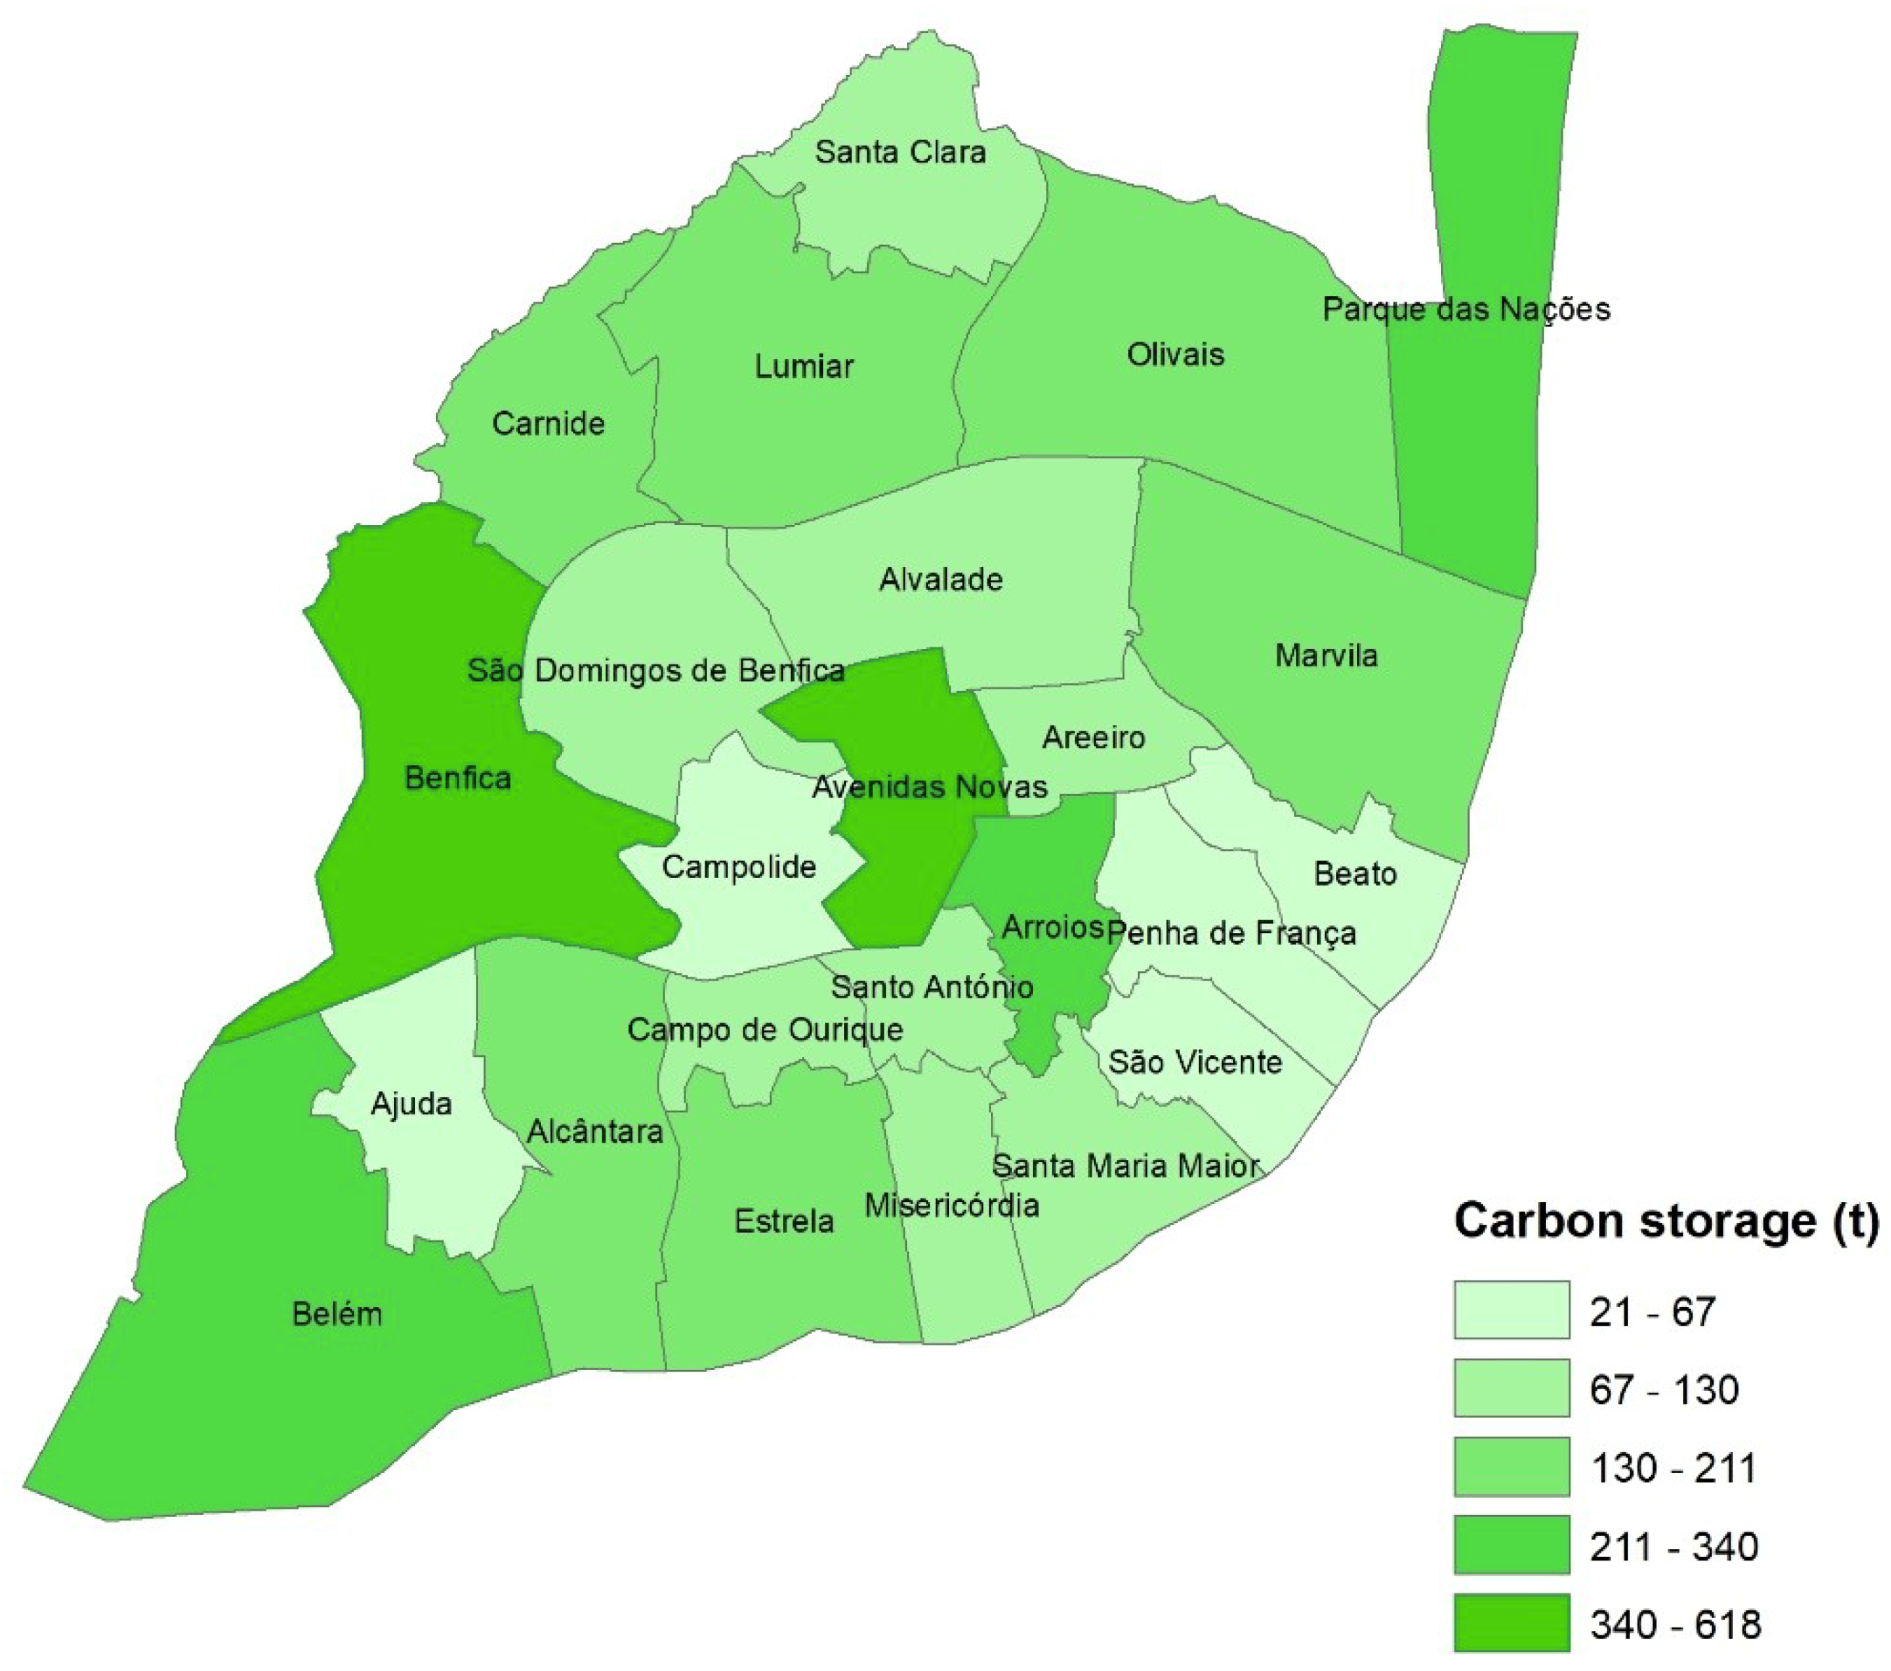
In
Figure 5 is presented the carbon storage in each parish of the city of Lisbon. The parishes that presented higher values of carbon storage correspond to the parishes of Avenidas Novas and Benfica, while the parishes of Ajuda, Campolide, São Vicente, Penha de França, and Beato presented the lowest values of carbon storage (between 21 and 67 t). Carnide, Lumiar, Olivais, Marvila, Alcântara, and Estrela presented intermediate values of carbon storage (between 130 and 211 t).
As carbon storage was computed by tree and the database had the geographic location of each tree, it was possible to derive a density map regarding the carbon storage quantity in kg/ha. In
Figure 6 is presented a map with the spatial distribution of carbon storage density in kg/ha for the seven most represented tree species in the city of Lisbon.
The parishes with a higher density of carbon storage were Avenidas Novas and Arroios, corresponding to parishes in the center of Lisbon that also presented high values of carbon storage (
Figure 5). On a smaller scale, the parishes of Benfica and Parque das Nações also presented high values of carbon storage density, however, more localized in specific areas of the parishes, namely in the North of Benfica and in the center of Parque das Nações.
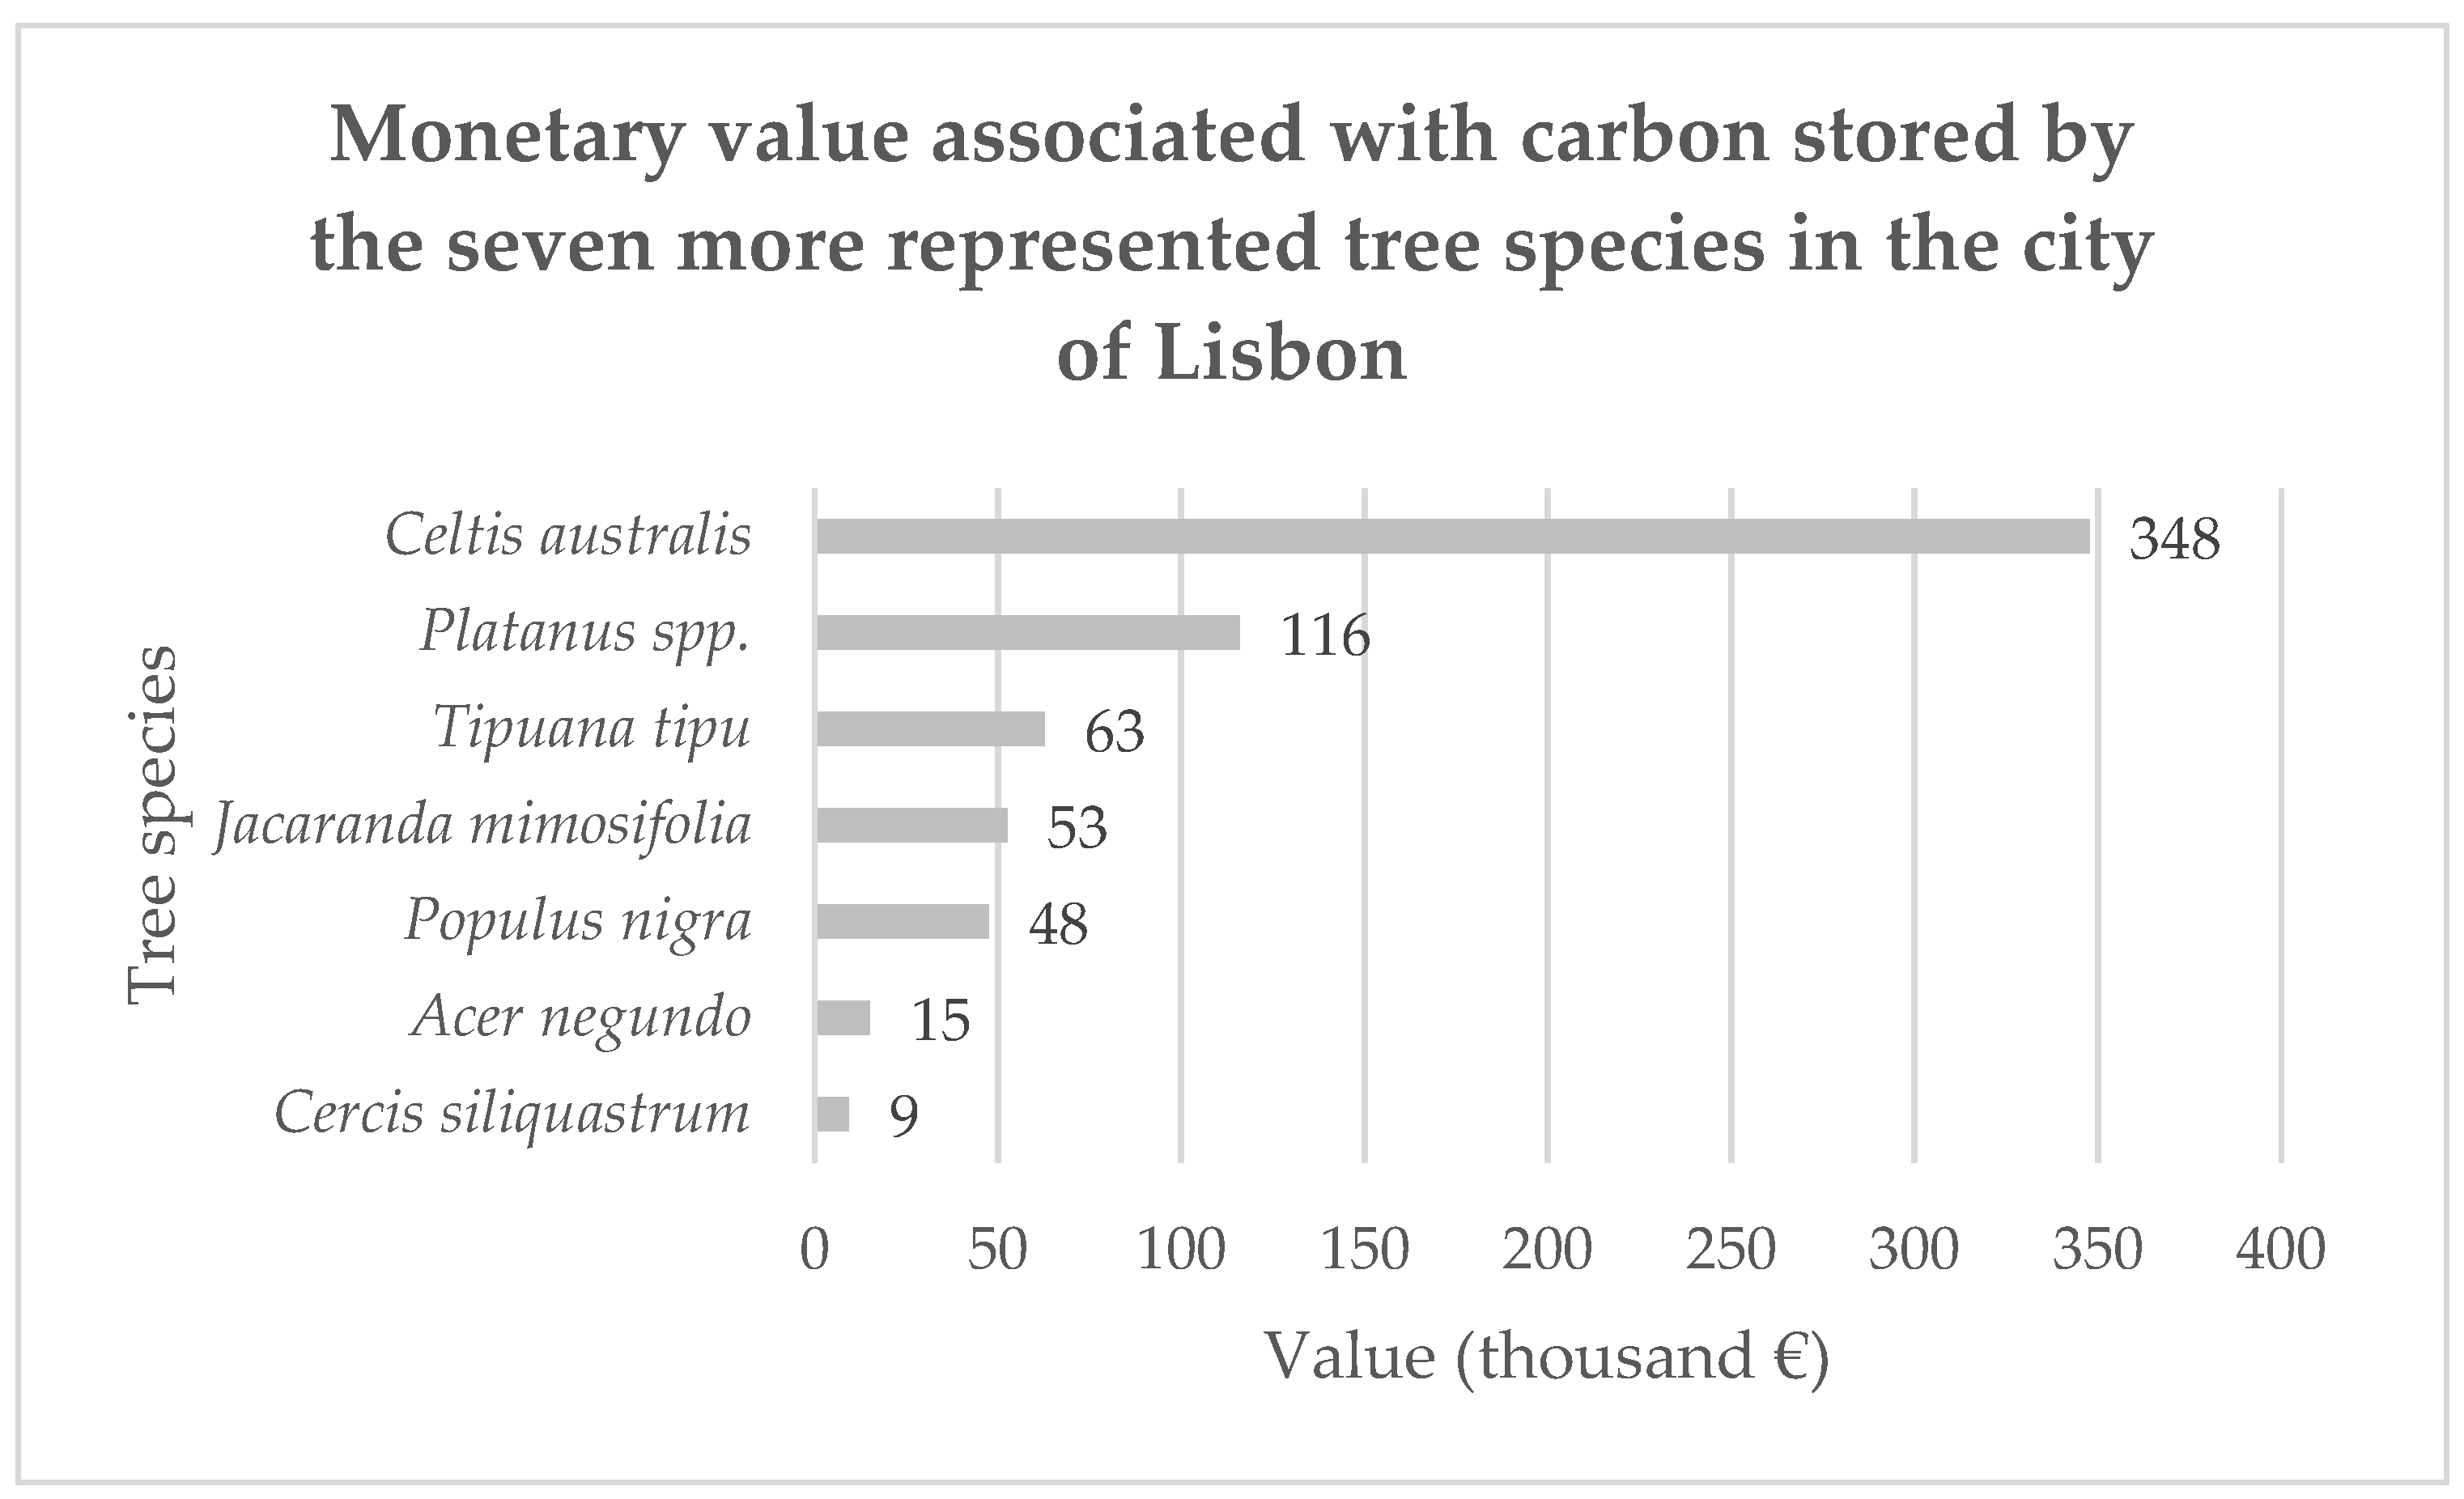
In
Figure 7 is presented the monetary value associated with carbon storage by the top seven tree species in the city of Lisbon, making a total of 651,195 €. More than half of this value came from the carbon storage of
C. australis because it was the tree species most represented in the city of Lisbon, followed by
Platanus spp. with a carbon storage value of 116,015 €. A similar medium value of carbon storage was observed regarding
J. mimosifolia and
P. nigra.
C. siliquastrum presented the lowest monetary value associated with carbon storage (about 9388 €). It is noteworthy that these monetary values only considered the carbon stored by each tree species, not measuring the carbon sequestration value that these trees make every year and were just representative of a quarter of the total monetary value because only about 15,000 trees from a total of about 60,000 trees in the city of Lisbon were analyzed.
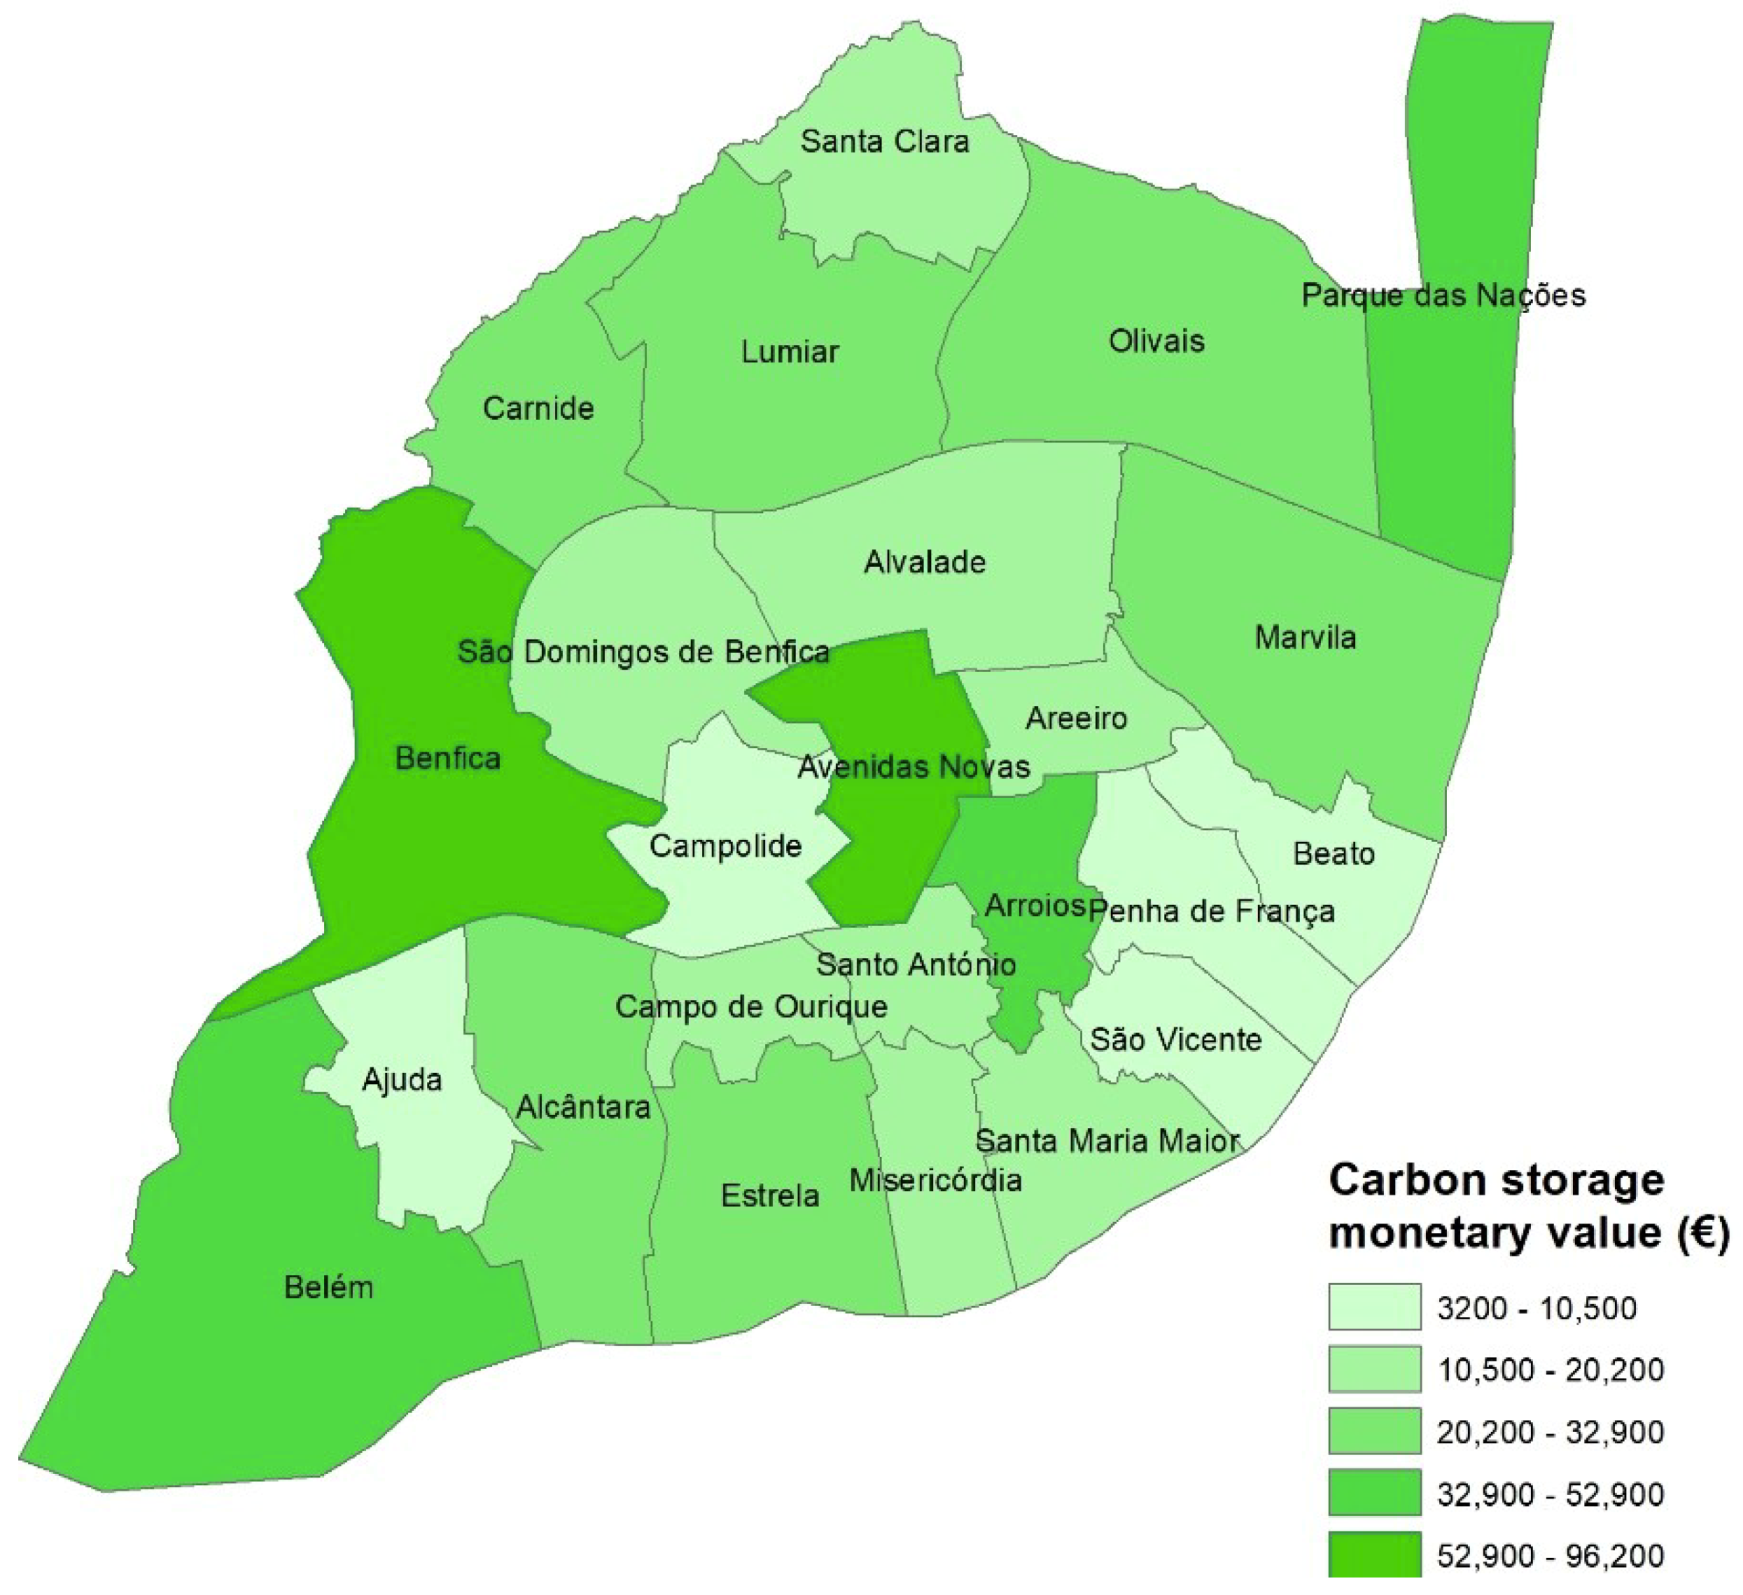
In
Figure 8 is presented the carbon monetary value in each parish of the city of Lisbon by the seven most represented tree species in the city of Lisbon. The parishes that presented the highest monetary values of carbon stored were the parishes of Avenidas Novas and Benfica. Lumiar, Olivais, Carnide, Marvila, Alcântara, and Estrela presented medium values of carbon monetary value (between 20,200 and 32,900 €). Low carbon monetary values were presented in the parishes of Beato, Penha de França, São Vicente, Campolide, and Ajuda.
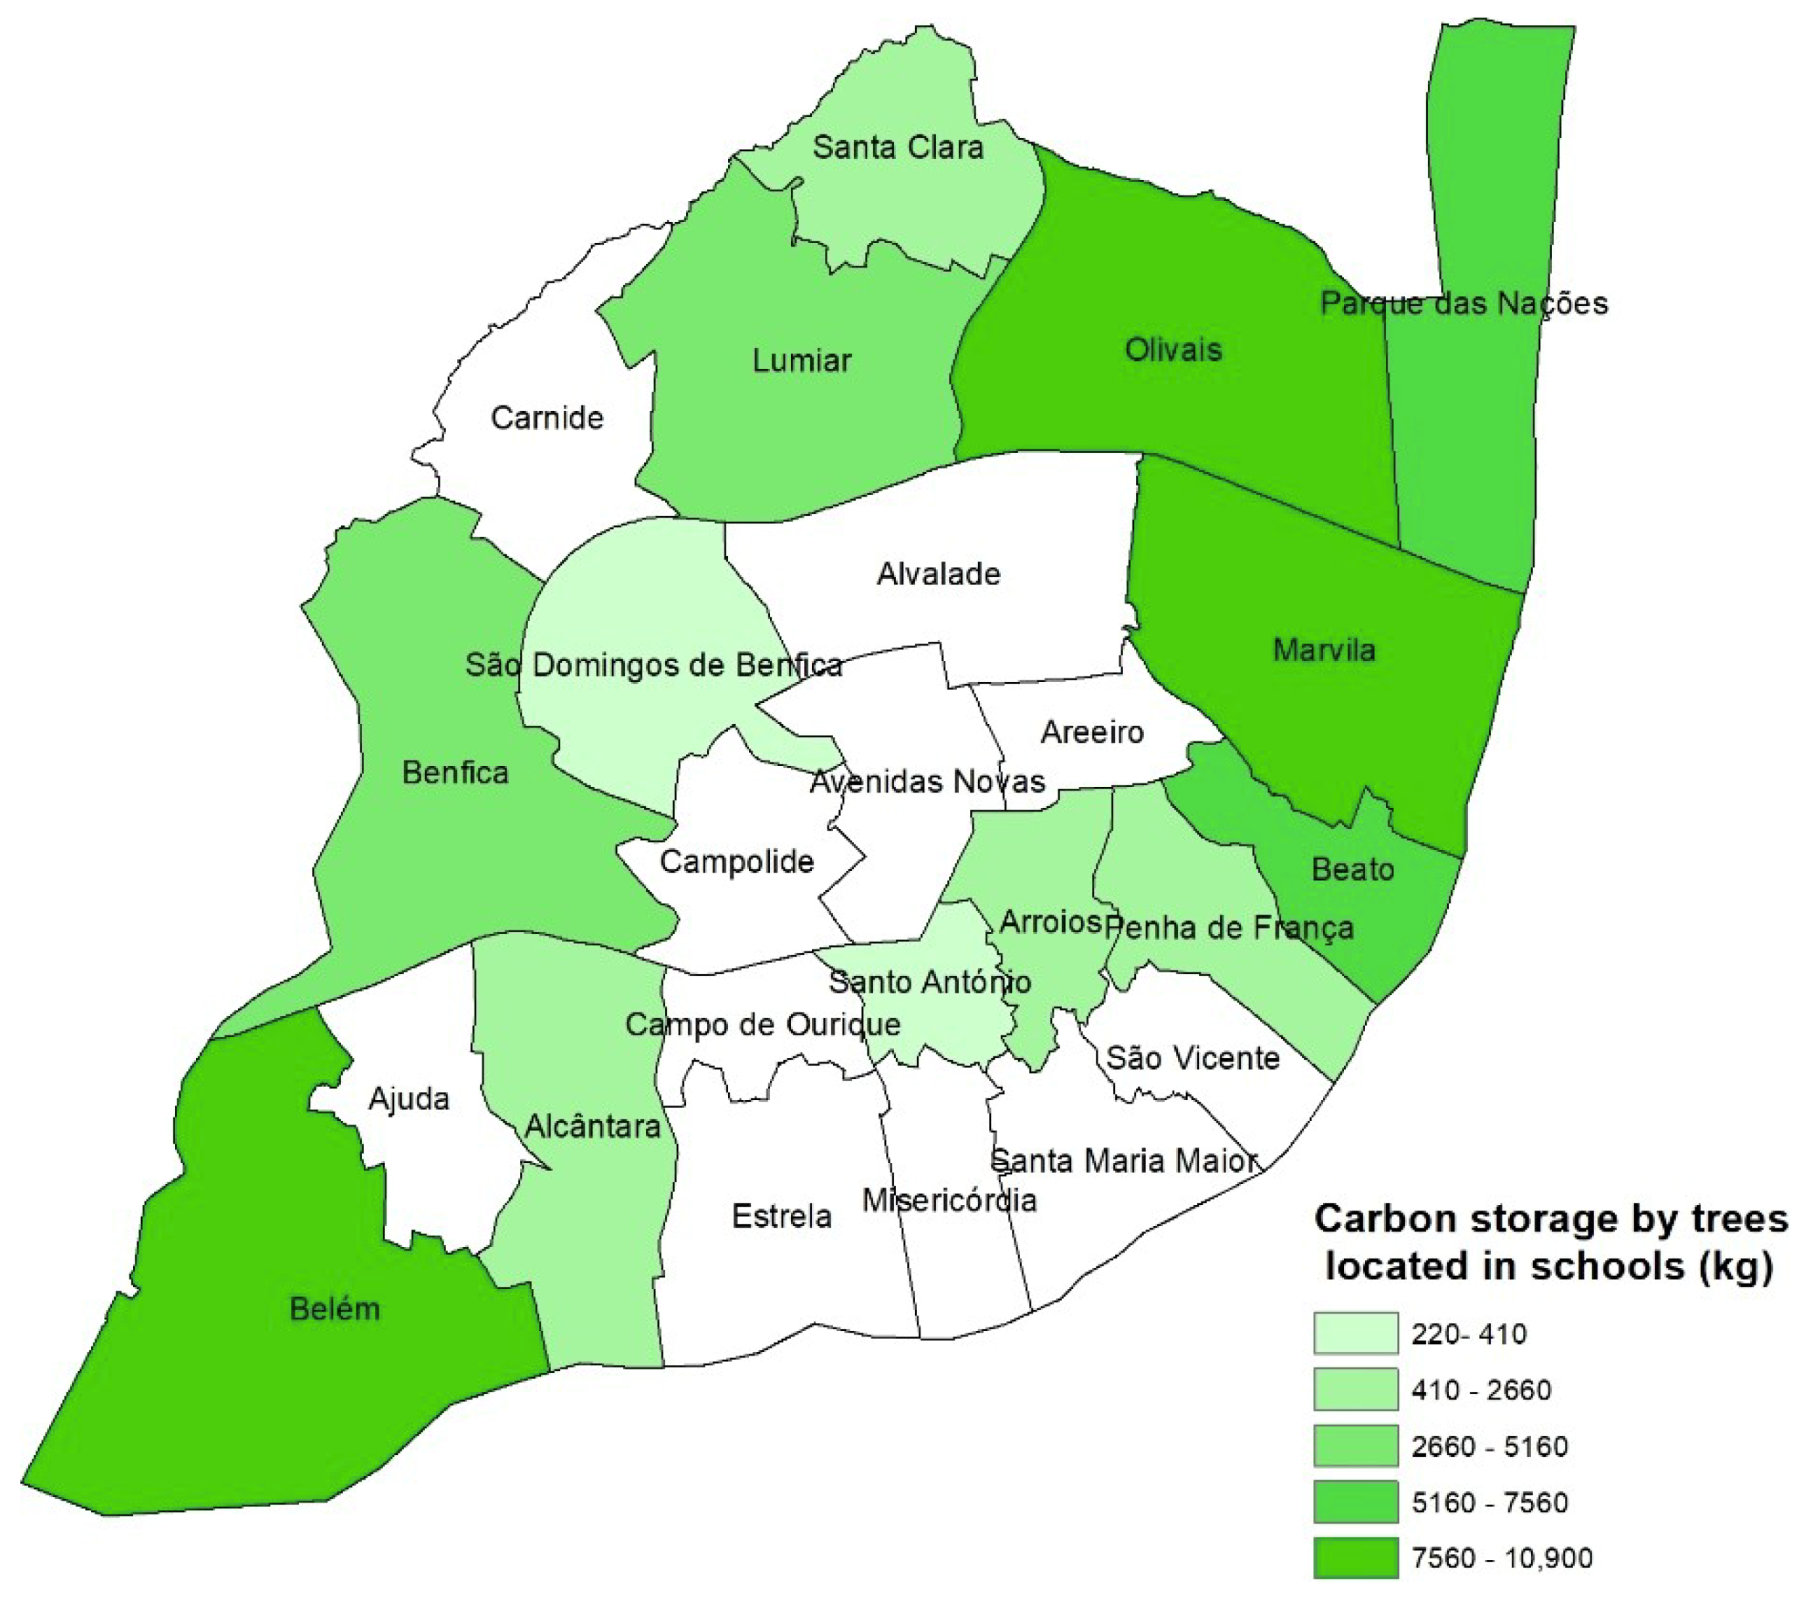
As the original data set provided information about the characteristics of the trees’ location, an analysis of the carbon stored by parish in each one of these categories (i.e., school, green area, and street) was made. In
Figure 9 is presented the carbon stored by trees located in schools by parish. Only the parishes that had trees located in schools are represented.
The parishes of Belém, Marvila, and Olivais presented the highest values of carbon storage by trees located in schools (between 7560 and 10,900 kg). The parish of Arroios had a carbon storage between 2660 and 5160 kg, and the lowest value of carbon storage was present in the parish of Santo António.
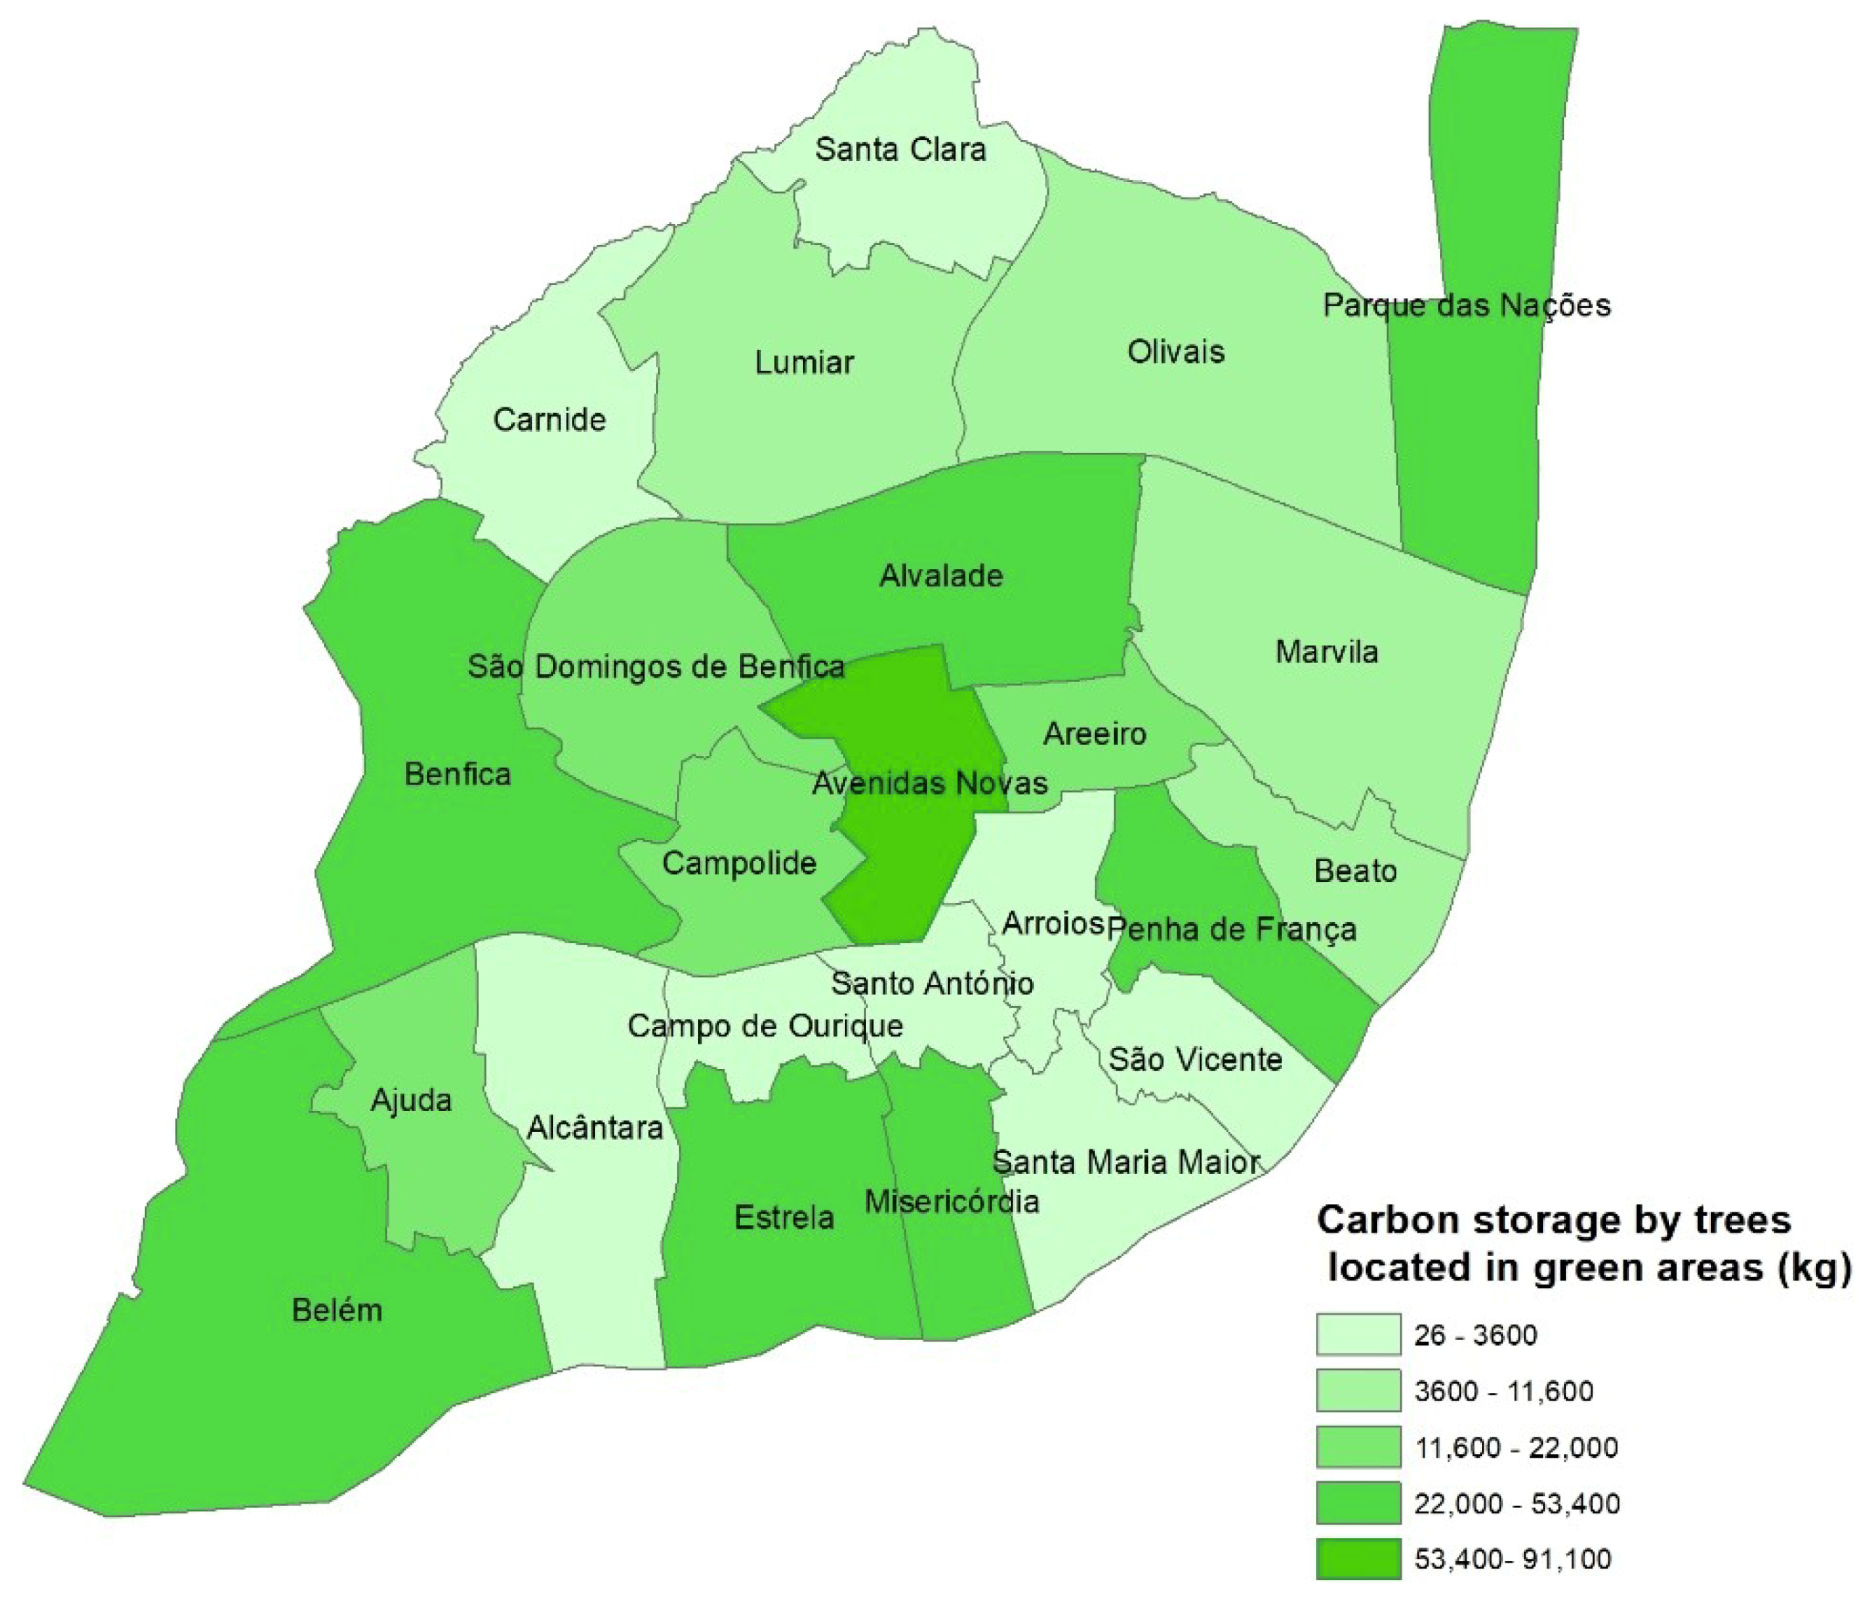
In
Figure 10 is presented the carbon storage by trees located in green areas. The parishes of Avenidas Novas and Estrela presented the highest values of carbon storage by trees located in green areas despite the parish of Estrela presenting a low value of carbon storage (
Figure 5). With values of carbon storage between 26 and 3600 kg the parishes of Alcântara, Campo de Ourique, Santo António, Arroios, Santa Maria Maior, São Vicente, Carnide, and Santa Clara presented the lowest values. Despite the parish of Arroios presenting the lowest values of carbon storage by the trees located in green areas, this parish presented medium values of carbon storage in general (
Figure 5).
In
Figure 11 is presented the carbon storage by trees located in streets for each parish. The parishes of Ajuda, Campolide, São Domingos de Benfica, Alvalade, Beato, and Misericórdia presented the lowest values of carbon storage by trees located in streets, while Avenidas Novas and Benfica presented the highest values. The pattern of carbon storage by trees located in streets for each parish was the same as for the total accounting of carbon storage presented in
Figure 5. The trees located in streets possessed the major impact on carbon storage in the city of Lisbon at least for the seven tree species studied in this work.
4. Discussion
In the present work, the carbon storage and value of seven tree species was computed for the city of Lisbon. The tree species C. australis was the one that contributed the most to carbon storage in the city of Lisbon, retaining of about 2235 t of carbon. The remaining tree species presented much lower values of carbon storage varying between 746 and ~60 t of carbon.
The quantity of carbon stored presented higher values in the parishes of Avenidas Novas, Belém, and Benfica and therefore these parishes also presented higher carbon monetary values. In general, the parishes in the center of Lisbon presented higher values of carbon storage density when compared with the parishes on the edge of Lisbon. This aspect indicated that a major effort must be made to spread new tree plantations in the parishes on the edge of Lisbon, due to their low-to-medium carbon storage density. Relative to carbon storage in the green areas of the city, it was evident that the parishes of Alcântara, Campo de Ourique, Santo António, Arroios, Santa Maria Maior, São Vicente, Carnide, and Santa Clara had low values of carbon storage, indicating the need to expand or create new green areas in these parishes. Trees planted in streets provided the major contribution to carbon storage in the city of Lisbon. However, is necessary consider that this study was only made for the seven most represented tree species, and, in this sense, the use of the entire database to compute carbon storage could lead to different results.
Despite the data being freely available, the later had a huge amount of missing values which is an important drawback to making a more detailed study in the future. Indeed, to cope with this situation it was necessary resort to imputation algorithms to fill the missing values using the tree species, dbh, ht, and the age of the trees, as predictors. This aspect always leads to a certain amount of error in the volume computation of tree species and, consequently, in the tree biomass. Because these equations do not exist for most of the tree species, it was necessary to use equations which referred to similar tree species. However, as there were no allometric equations of the studied tree species for the Mediterranean climate—and climatic and geographical conditions determine the growth of trees—the computation of carbon storage in this study could be biased. Another aspect that could bias the results was that the dry weight density factor of each tree species used for the computation of the biomass was too generic and without any reference to the climatic and geographical location where they were calculated.
Several studies exist regarding the accounting of carbon storage in European cities, namely Leicester [
9], Leipzig [
7], and Bolzano [
8]. However, even though these studies used allometric equations to compute trees biomass, the authors resorted to a sample to estimate carbon storage in these cities along with land cover data. As in this study, only a third of the urban trees of Lisbon were used to compute carbon storage, it is not possible to compare the obtained values with the previous examples of other cities. Indeed computing carbon storage from a census of urban trees is quite challenge for the data providers as they have to keep the database updated and collect information about the trees that could be useful in the computation of carbon storage (e.g., the trees age) by researchers. In this sense, it is necessary to develop methods to compute carbon storage that allow the comparison between cities of Europe.
As carbon storage in this study was only made for trees, it would be interesting to study carbon storage also considering herbaceous and shrub vegetation of the green urban areas of Lisbon. Future studies could also use the data of the spatial distribution of carbon emissions and compare it with the spatial distribution of carbon storage, to verify the carbon balance in the city of Lisbon. Accounting with the monetary benefits of the ecosystem services provided by carbon storage and carbon sequestration could be also a future line of research to measure how urban trees of the city of Lisbon contribute to the well-being of their citizens.
Beyond the contribution to mitigate CO2 emissions, urban trees can play a fundamental role in the decrease of temperature and in the increase of air quality. However nowadays in the city of Lisbon, the accounting of this information is not possible due to the reduced number of sensors to measure both and because this information does not possess the spatial granularity necessary for an analysis of this kind.
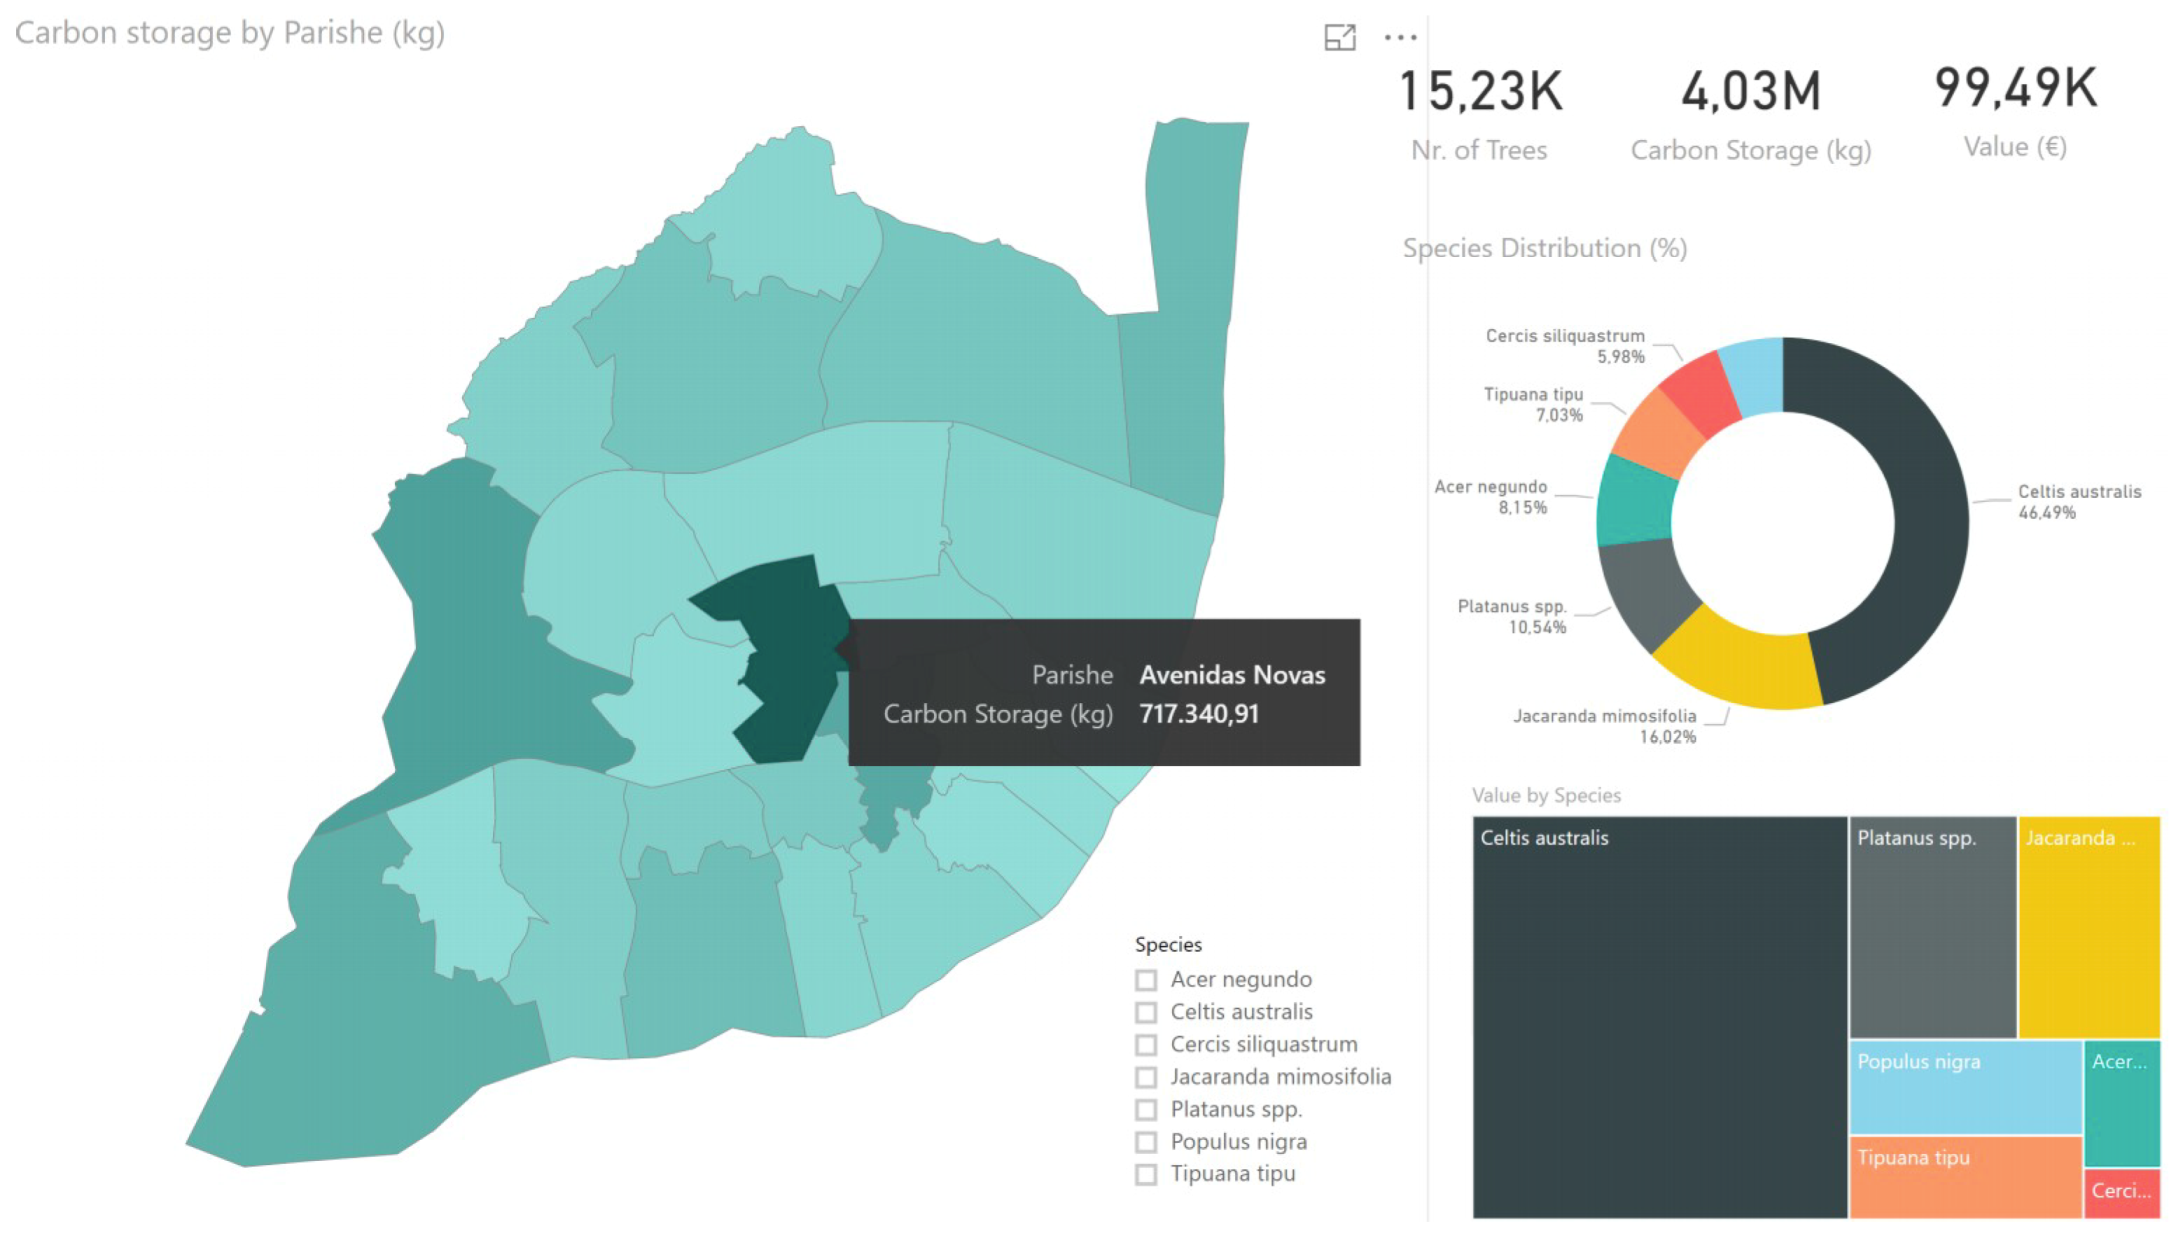
Finally, and in order to support decision-making in what concerns green infrastructure management at the city level, the above presented methodology could support a dashboard that would give an integrated vision and provide relevant KPIs (Key Performance Indicators) on an everyday basis, together with interactive capabilities as presented in
Figure 12, where the data were used to create an example of a possible visualization of the results obtained with Power BI. In this dashboard, the user can identify, select, and filter the data to obtain insights about the role of different tree species in carbon storage and sequestration.


