1. Introduction
In recent years we have witnessed the tremendous achievement of the mobile communication, driven by the rapid proliferation of smart wireless devices [
1], such as Wi-Fi technologies, laptops, smart phones, wearable smartwatches, tablet computers, which also promotes the emergence of a promising network model that is known as opportunistic networks (ONs) [
2,
3]. As the enablers of 5G networks and big data environment, opportunistic networks [
4] have been generally regarded as a new type of networking topology to improve traditional communication infrastructure by enabling smart mobile nodes to contact with each other when they are in the same communication area instead of the cellular network [
5]. In ONs, without a fixed communication infrastructure, mobile nodes try to seize the opportunity of encountering others to implement the wireless and opportunistic communication process due to the unstable and discontinuous connectivity between them [
6]. Nowadays, opportunistic networks have a significant application in multitudinous areas such as vehicular networks [
7], space communication [
8], disaster relief [
9], wildlife surveillance [
10], Internet of Things (IOT) [
11], communication in underdeveloped areas [
12] and sensor networks [
13].
As the special variants of delay tolerant networks (DTNs) [
14] and mobile ad hoc networks (MANETs) [
15], opportunistic networks have to undergo the intermittent and unstable communication connectivity in the data dissemination process [
16]. As a sequence, the data transmission process in opportunistic networks usually executes the ’store-carry-forward’ mechanism [
17], indicating that message carriers with data information randomly move to the communication areas of the peers, select the suitable relay nodes from its neighbors and transmit data packets to them via short-range wireless communication technologies such as Bluetooth or Wi-Fi [
18]. A concrete example of opportunistic networks is a disaster relief area with destroyed communication infrastructures in which rescuers walk around with smart phones and try to search for victims via wireless or Wi-Fi technologies [
19]. Since there is no reliable and fixed end-to-end connection between the sources and destinations, message routing and forwarding have already been considered as a challenging and concerning problem in opportunistic networks [
20].
For constructing an efficient path of data chain between sources and destinations and investigating the issues of the frequent disconnection and instability of the data transmission process [
5], a number of routing approaches [
8,
10] have been proposed in opportunistic networks. The main purposes of these algorithms are to yield higher message delivery ratio, lower end-to-end delay and lower network overhead [
3]. However, the three type of evaluation metrics are interlinked and it is particularly difficult for these strategies to obtain the optimal trade-off between them in the networks [
17]. Additionally, the research on community detection and location prediction [
21] has gradually become a hot topic in the field of routing algorithms recently. Several community-based routing approaches, which mainly refer to the centrality, similarity and friendship of nodes [
22], aim at constantly dividing mobile nodes into multiple connected communities and then building a shorter and faster peer-to-peer communication path between sources and destinations [
15]. On the contrary, due to the lack of the context information associated with social characteristics of mobile nodes, some community-based routing strategies [
23] have to divide communities by comparing the distance between the location of mobile nodes, node activeness, social influence, historical encounters among nodes, and so forth [
24]. Because plenty of data transmission opportunities exist between the mobile nodes that belong to the same community [
25], routing methods—based on community division—could be adopted for better data transmission decision and simultaneously to guard against the dead-end problem [
26].
To some extent, the above-mentioned routing strategies have improved the data dissemination environment but there are still several challenging problems demanding prompt solution in the real application of opportunistic networks [
27]: (1) Most routing approaches in opportunistic networks mainly concentrate on investigating the historical information of mobile nodes such as context information, social attributes, mobile trajectory to design effective data dissemination strategies. However, they do not provide a mechanism that is able to effectively obtain and update the node history information or network routing status [
21]. It is obviously not accurate to make data transmission decisions based on current routing state rather than periodic data information. (2) When utilizing community structure and network topology to make a more efficient message delivery decision, the latest studies just focus on analyzing how node communities are divided reasonably, instead of how they are condensed and optimized [
13]. However, as the random movement of nodes and the change of their social attributes, the relationship between nodes and network structure may also change constantly. Therefore, it is essential for routing approaches in opportunistic networks to update and optimize node community periodically. (3) Most routing methods based on location prediction only consider the probability of nodes moving to the next position at the next state but do not evaluate the probability of the next encounter between destinations and neighbors and whether they belong to the same social community [
28]. The location prediction for nodes during current short time periods are obviously not suitable for the real scenarios of opportunistic networks, so a periodic location prediction method is necessary for state assessment of nodes over a long period of time [
29].
In this paper, in view of the above-mentioned issues, we propose an improved routing-forwarding strategy utilizing node profile and location prediction (NPLP) for opportunistic networks, which mainly includes three continuous phases: the process of information collecting and updating, community detection and optimization and the state prediction of mobile nodes. During the phase of information collecting and updating, each node in the networks shares its state queue with the peers it encounters and constantly updates its own information queue and more importantly, constructing an identical and uniform network routing state matrix. Besides, we develop a community optimization algorithm based on node activeness and node attributes, which reasonably narrows the coverage of the node community and enables the mobile nodes in the same community to be more closely connected. Based on the improved Markov chain [
30], the location state prediction strategy is adopted to ensure that data packets are carried and routed by the relay nodes with a higher probability of moving to where the destinations are more likely to arrive in the future. Eventually, data packets are transmitted to those nodes with higher underlying capacity of encountering the destinations in the same community at the next time stamp. The main contributions of this article are summarized as follows:
This paper investigates the issue of collecting and updating network routing state information via the cooperation between multiple nodes. Considering both the social attributes and periodic mobility trajectory of nodes in a certain phase, the well-organized structure of network routing state matrix is established.
Through the definitions of node activeness and node profile, the inner structure of the community could be reconstructed more orderly and simply, in which mobile nodes possess relatively high social similarity among them, indicating that those nodes communicate with each other more frequently and closely. Consequently, plenty of opportunities for data dissemination may be generated in the refactored community.
With the support of the improved Markov chain, we propose the state prediction method to predict the probability of each node in the networks moving to the next location state at the next time stamp and, more importantly, evaluating the mobility relationship between neighbor nodes and destinations. This also could be considered as a significant basis for message routing and forwarding in opportunistic networks.
The remainder of this paper is organized as follows. The state of the art associated with routing algorithms in opportunistic networks will be introduced in
Section 2. We propose and develop the structure of NPLP strategy for message routing and forwarding in
Section 3. Experimental process and performance analysis will be described in
Section 4. Ultimately, this study is concluded in
Section 5.
3. System Model Design
In opportunistic networks, it is difficult for message carriers or the source node to accurately acquire the location of the destination due to the random movement of the mobile devices. However, node profile may consist of multiple strong social attributes, which can be utilized to optimize the community division of nodes. Additionally, because of the periodicity and repeatability of node movement, many routing algorithms start to focus on the trajectory prediction of nodes. However, there is no effective method to combine these two strategies in opportunistic networks. Therefore, we present an improved node trajectory prediction method based on location prediction and community optimization for opportunistic networks.
3.1. Collecting and Updating Effective Information about the Routing State of the Networks
In our proposed algorithm, there is an information updating phase where two nodes exchange their social attributes and mobile trajectory information at each encounter. After this special phase, message carriers or the source node are able to make an accurate decision on messages routing or forwarding based on the obtained information, which indicates that the NPLP algorithm is one that periodically updates information and forwards messages. The length of information updating phase T is usually set based on the cycle of user activity, in which message carriers or the source node can obtain the important social attributes and movement trajectories of other nodes in the networks.
To quantify the entire process of information collecting and updating in this period, we define
and
as the mobile trajectory queue and social attribute queue of the node
i in the networks, respectively, and these two information queues could be formalized as
where
,
,
,
represent
m different time stamps of the node
i and
,
,
denote the locations of the node
i at
m different time stamps. Consequently,
record the mobile trajectory of the node
i during the length of information updating phase
T. Additionally,
,
,
,
are
n different significant social attributes of the node
i, such as interest, working place, residence, occupation, and so forth, which may play a special role in community optimization and data transmission. In order to consider the mobile trajectory queue and social attribute queue comprehensively, we define the information queue of the node
i as
in which
represents the information queue of the node
i and
is the the set of information queues of the nodes encountered by the node
i and the nodes
a,
b,
cz are the set of nodes encountered by the node
i.
As mentioned above, each node in the networks employs the mobile trajectory queue and social attribute queue
and
to build a information queue
and then each node will share its own information queue with the nodes it encounters. After the entire process of information collecting and updating, each node stores a non-redundant and uniform network routing state matrix
, which could be strictly defined as
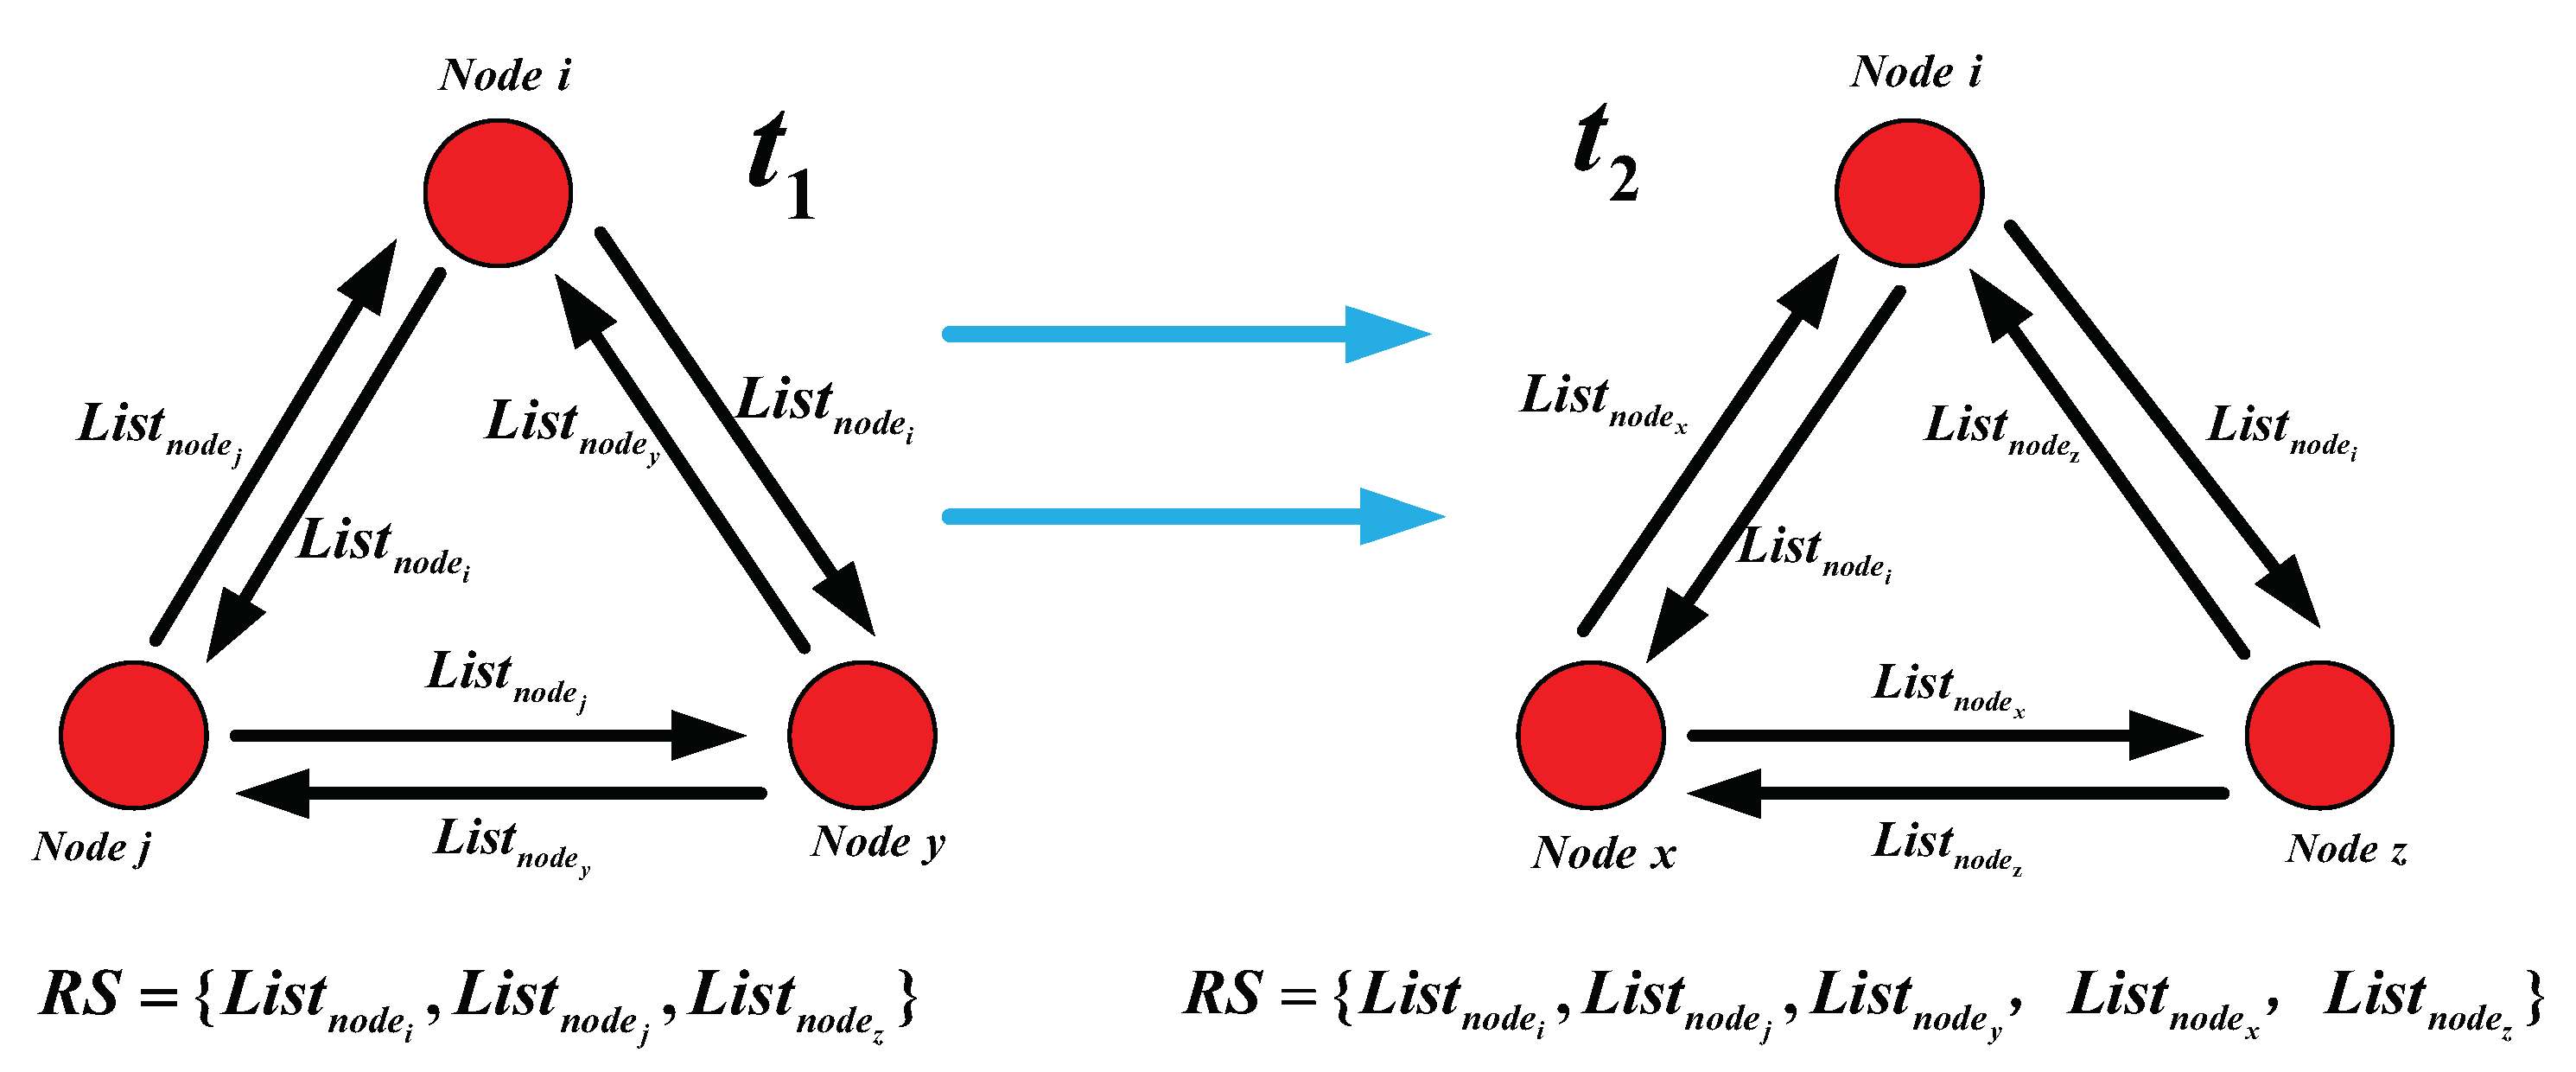
To be specific (as shown in
Figure 1), at the time
, the nodes
i,
j and
y are in the same communication domain and they share their own information queue
with each other. Moreover, each node
i,
j or
y in the networks constantly collects and updates
by adding the obtained information queue to its own encountering queue
. Furthermore, the nodes
i,
j and
y are able to construct an identical and uniform routing state matrix as
, which reflects the mobile and social attribute information of these nodes during the time
and they will respectively store the routing state matrix
in their own cache spaces.
After that, at time , as the nodes in the networks move randomly, the nodes i, x and z are in the same communication domain, they continue to collect other’s information queue and update its own information queue and finally the network routing state matrix in their cache spaces could be denoted as , which effectively represents the current routing sate of the networks. After the whole process of information queue collecting and updating, each node in the networks is able to establish a network state routing matrix and then processed to the phase of message routing and forwarding. When the phase of message routing and forwarding is over, each node in the networks deletes the state routing matrix from its own cache spaces and then enters the next phase of information collecting and updating.
3.2. Markov Chain State Prediction Model Based on the Movement Trajectory of Nodes
In the real application scenarios of opportunistic networks, the daily behaviors of mobile nodes are highly repetitive, which means that mobile nodes may visit several fixed places repeatedly in a relatively fixed time and carry out some repetitive activities every day, such as driving from residence to workplace. According to the mobile trajectory of nodes and fixed behavior patterns, the proposed algorithm is able to model the scene based on the mobile trajectory and employs the improved Markov chain to predict the next mobile state of nodes in the networks, thereby constructing a reliable data transmission link from source to destination.
Firstly, referring to Equation (
1), we assume that there are
m frequently visited locations in the current application scenario of opportunistic networks and
is the
m-th state of the node
i in the Markov prediction process, which could be denote as
. Then, the transition state matrix
P for each node in the networks could be calculated utilizing the network routing state matrix
collected in the phase of information updating. Specifically, we assume that
is the number of times that the observation node
i moves from the position
x to the position
y, then the probability that the node
i starts from the position
x to reach the position
y could be computed by
in which
h is the sum of the times that the node
i accesses each position starting from the position
x. Therefore, if there are
m locations in the application scenarios of opportunistic networks, then an
transition probability matrix
for the node
i could be determined, which can be represented as
In addition, according to the Markov prediction model of absolute distribution,
represents the probability that the node
i is in the current state
at the initial time
and the probability that the node
i is in the other state
at the next time stamp
could be denoted as
. In this way the initial distribution of Markov prediction chain
can be denoted as
Moreover, through comparing the transition probability matrix
with the distribution of Markov prediction chain at the previous time, the prediction distribution of Markov chain at the next time
in the networks can be computed by
where
represent the probabilities that the node
i will be in the potential position states
at the next time
. To express the probability that the node
i reaches the next potential position state more concisely, we reasonably define
as
in which
indicates that the maximum value of the elements in the Markov chain
is the most likely position state of the node
i in the next time. For example, if the initial position state of the node
i is
and the initial distribution of Markov prediction chain for the node
i is
, then the prediction distribution of Markov chain
at the next time
can be determined. If
is maximum value of the state sequence
, then the node
i is most likely to reach the position state
at the next time
.
The main purpose of predicting the next state position of nodes in opportunistic networks is to understand the general rules of node movement and simultaneously evaluate the mobile relationship between neighbor nodes and destination. Consequently, message carriers or the source node are able to make an more efficient and accurate decision on message routing and forwarding based on the mobile characteristics of their neighbor nodes.
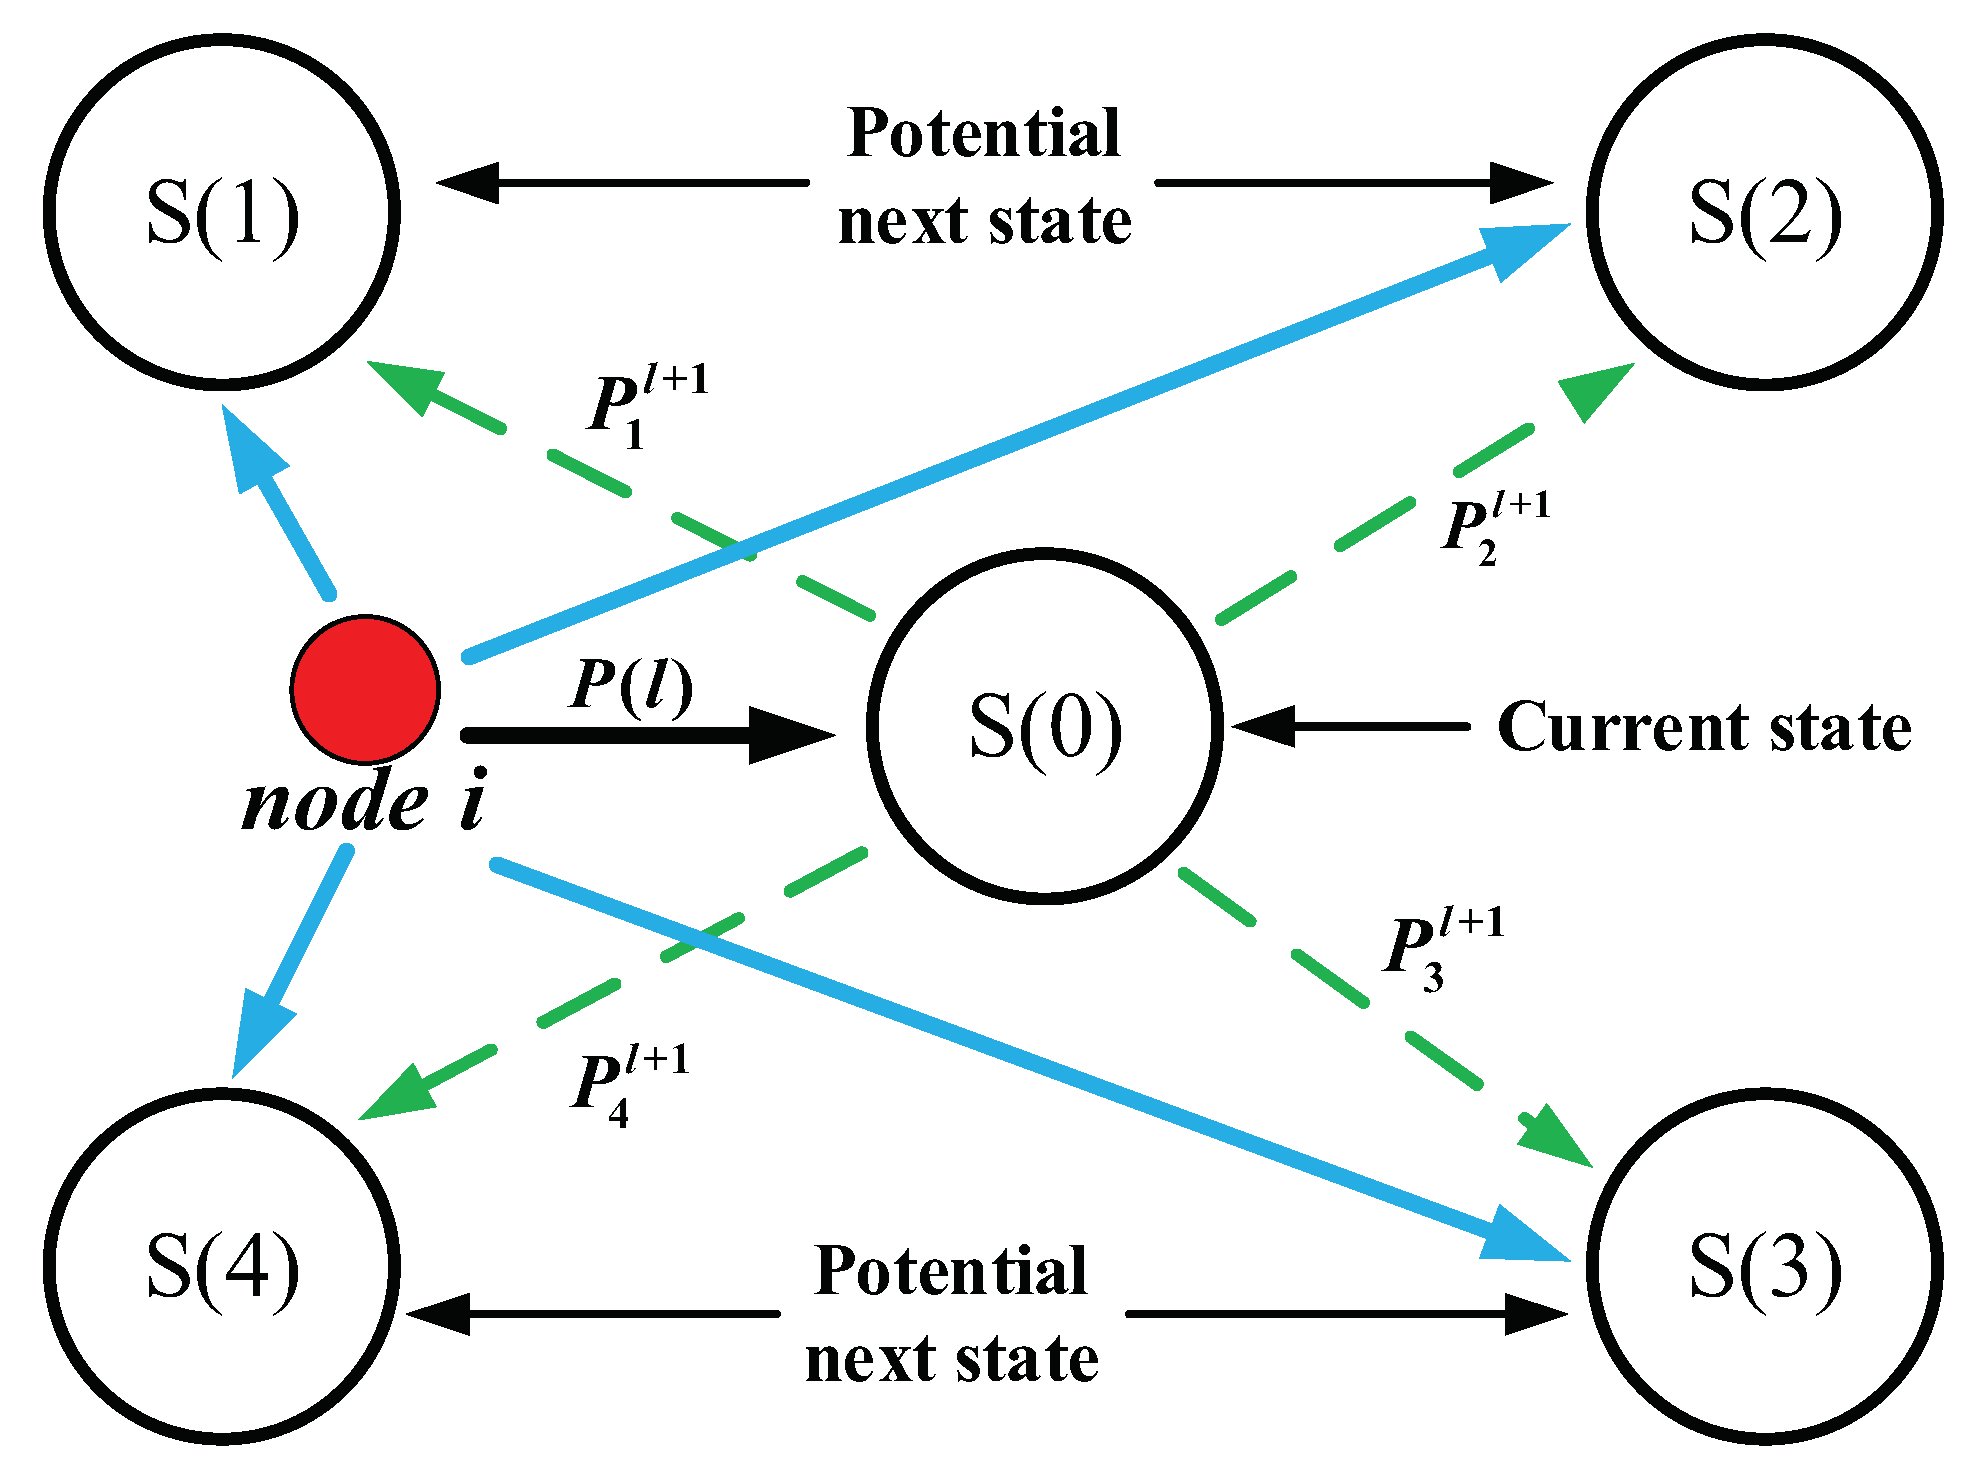
As shown in
Figure 2, the application scenarios of opportunistic networks consists of 5 different position states
and
. Additionally, the node
i is in the position state
at the current moment
and
are the potential next position sates of the node
i at the next time
. Moreover,
represents the prediction distribution of Markov chain at the current moment, hence the prediction distribution of Markov chain for the node
i at the next time
could be computed by
. Consequently, the final result of Markov’s prediction for the node
i is the maximum value of these four probabilities
, which indicate that the node
i is more likely to arrive at the position state
with the maximum probability in the next sequence
.
3.3. Community Detection and Optimization Strategy Based on Node Activeness and Node Profile
After the whole process of information collecting and updating, each mobile node in opportunistic networks has obtained a unified network routing state matrix , which contains the social attribute information of nodes in the networks. Actually, the set of these social attributes of the node could be called ’node profile’ in opportunistic networks, which is also regarded as a strong basis for community detection and division in the networks. In many scenarios, the definition of a community is not measured by geography but rather by multiple social characteristics of mobile nodes such as personal interests, affiliation, occupation and so on. Additionally, the number of mobile nodes in a dynamic community are always changing. Over a period of time, there will always be some members of a community who are more stable in the community (or more involved in the community), while others will leave the community more quickly (or less involved in the community). In general, nodes belonging to the same community will be more closely connected and communicate with each other more frequently, which provides a good opportunity for messages routing and forwarding.
The community in dynamic opportunistic networks is a group with multiple common social characteristics that changes over time. Thereout, if
represents the state of the community in time slice
, then the state of a community could be denoted as a binary group
. Then the state sequence
C of a community from the time slice
to the time slice
can be represented as
in which
is a disjoint time slice sequence for a period of time. Besides, the network states at different time slices may show different importance on the data transmission process and node activity cannot be a simple sum of the individual situation on each time slice, meaning that we need to consider the weight of each specific time slice in the networks. Therefore, the node activeness
of the node
i usually could be computed by
where
represents the regulatory factor of the time slice
and
and
denote the time slice set containing the node
i in community
C and the total time slice sets in community
C, respectively. Furthermore, the node
i strictly belongs to the community
C in the networks, which can be formalized as
. The regulatory factor of the time slice
could be determined based on specific characteristics of the community or specific research objectives.
One of the most important behaviors of mobile nodes in a community of opportunistic networks is to interact and connect with others. For example, in online social networking sites, an old member who posts frequently online and participates in community activities is often more important in the community than a new member who rarely posts, which can effectively reflect the characteristics of mobile nodes in the community. As a result, mobile nodes in the community are divided into
g grades according to their activeness in the community and we assume that the degree of node activeness
g is higher than the level
. According to different levels of node activity, mobile nodes in the community could be divided into
g classes. Combined with Equation (
1), the social attributes of the node
i in the community
C can be defined as
where
T is the length of the phase of information collecting and updating, which is also known as the set of time slices in community
C and
represent different attribute characteristics of the node
i in the time period
T. Consequently,
could be categorized into different classes based on node activeness.
In opportunistic networks, node profile reflects different social attributes of mobile node, which also has become an important foundation for community detection, division and optimization in the networks. Therefore, comprehensively combining node activeness with node profile, we rigorously define the social similarity
between the nodes
i and
j in the community
C as
in which
and
represent the number of the elements in the intersection and union sets between the social attributes of the nodes
i and
j and
denote the parameter value of different weights, which could be determined based on the structure of a particular community in the networks.
Because there are several overlapping communities in opportunistic networks and one node may exists in multiple communities, the calculation of node similarity
should be standardized. In general, no matter what community the node in, it should be the most similar to itself. Therefore, we compare the similarity between the two nodes with the average of all the nodes in the community with their own similarity, which can be mathematically reduced to
In overlapping communities, if the node
i and the node
j simultaneously exist in multiple communities, then the social similarity between them in the whole networks is the average of their social similarity in each community, which can be expressed as
where the nodes
i and
j synchronously belong to
. Moreover,
, in which
represents the whole network environment.
In the proposed algorithm, the node activeness the node activeness
could be computed by Equation (
10), while the social similarity of mobile nodes in the networks can be obtained from Equations (
11)–(
13). Then, comprehensively combining node activeness with node profile, we define the joint score
of community optimization as
where
represent
e different mobile nodes in the networks and
U is the total number of mobile nodes in the community
C. Additionally,
and
denote the node activeness of nodes in the community
C and social similarity of mobile nodes in the networks, respectively. Through comparing the node’s joint score
in each community of the networks, the community with the highest score will be recommended to this node eventually.
3.4. Message Routing and Forwarding Method Based on Markov Chain and Community Optimization
In the application scenarios of opportunistic networks, a mobile node usually maintains strong social relations with a few individuals. In the proposed strategy, we have detected, divided and optimized the community to which the nodes belong. The connections between nodes within the community are relatively tight, while that between different communities are relatively sparse. According to the social characteristics of mobile nodes, the probability of mobile nodes moving to a community is relatively large and the retention time is relatively long. In contrast, the probability of a node moving to a non-community location is lower and the duration time is shorter.
Therefore, according to the gregarious characteristics of social nodes in opportunistic networks, it is necessary to predict the position of a certain node at the next moment. If a number of nodes that contain multiple relatively close social relationships with the destination assemble at a certain location at the current moment, the probability of the destination moving to this location at the next moment is relatively large. For this reason, the proposed scheme creatively employs node activeness and node profile to detect community and adopts the improved Markov chain to predict the next location sate of mobile nodes, thereby making a more reasonable decision on message routing and forwarding in the data transmission process.
After the phase of information collecting and updating, mobile nodes have obtained effective information about the routing state of the entire network, which mainly consists of the information about social attributes and mobile trajectory of these nodes in the networks. Based on the network routing state matrix
, we assume that the contacting records
of the nodes
i and
j within the length of information collecting and updating
T are expressed as
where
represents the number of communications between the nodes
i and
j and
is the time when the
a contact started and
is the time when the
a contact ended. Then, the contact probability between the nodes
i and
j can be expressed as
According to the above Equation (
17), the social relationship matrix between mobile nodes in the networks could be obtained. Next, we need to calculate the probability of the node arriving at the next location state in the next moment. Given that the node
i is in community
at the current moment, we define the set of all nodes in the location state
in this community as
, in which
. Then, with the precondition of the node
i at the location
in the current time, the probability of it reaching the location
in next moment could be defined as
where
represents the probability of the node
remaining at its current position
, which can be calculated by Markov model in the
Section 3.2. Furthermore,
is the probability that the nodes
and
encountering at the location state
and it could be calculated by
in which
is the number of encounters between the nodes
and
at the location sate
. If we assume that the relationship weight value
, then the probability that the node
i reaches the location state
at the next moment could be computed by
in which
is the weight of each conditional probability, which could be obtained by normalizing the weight of relationship between the node
i and others nodes in the community
.
Consequently, according to the location state distribution of mobile nodes in the community
, the probability of the node
i arriving at different location states could be determined. Combined with the results of location state prediction from Markov model, the probability distribution of the
reaching all location states could be obtained by utilizing the above Equation (
20). After the phase of information collecting and updating, through comparing the probability of neighbor nodes arriving at each different location state at the next moment and determining the change of community optimization, message carriers or the source node are able to make the most reasonable decision on message routing and forwarding in the data dissemination process.
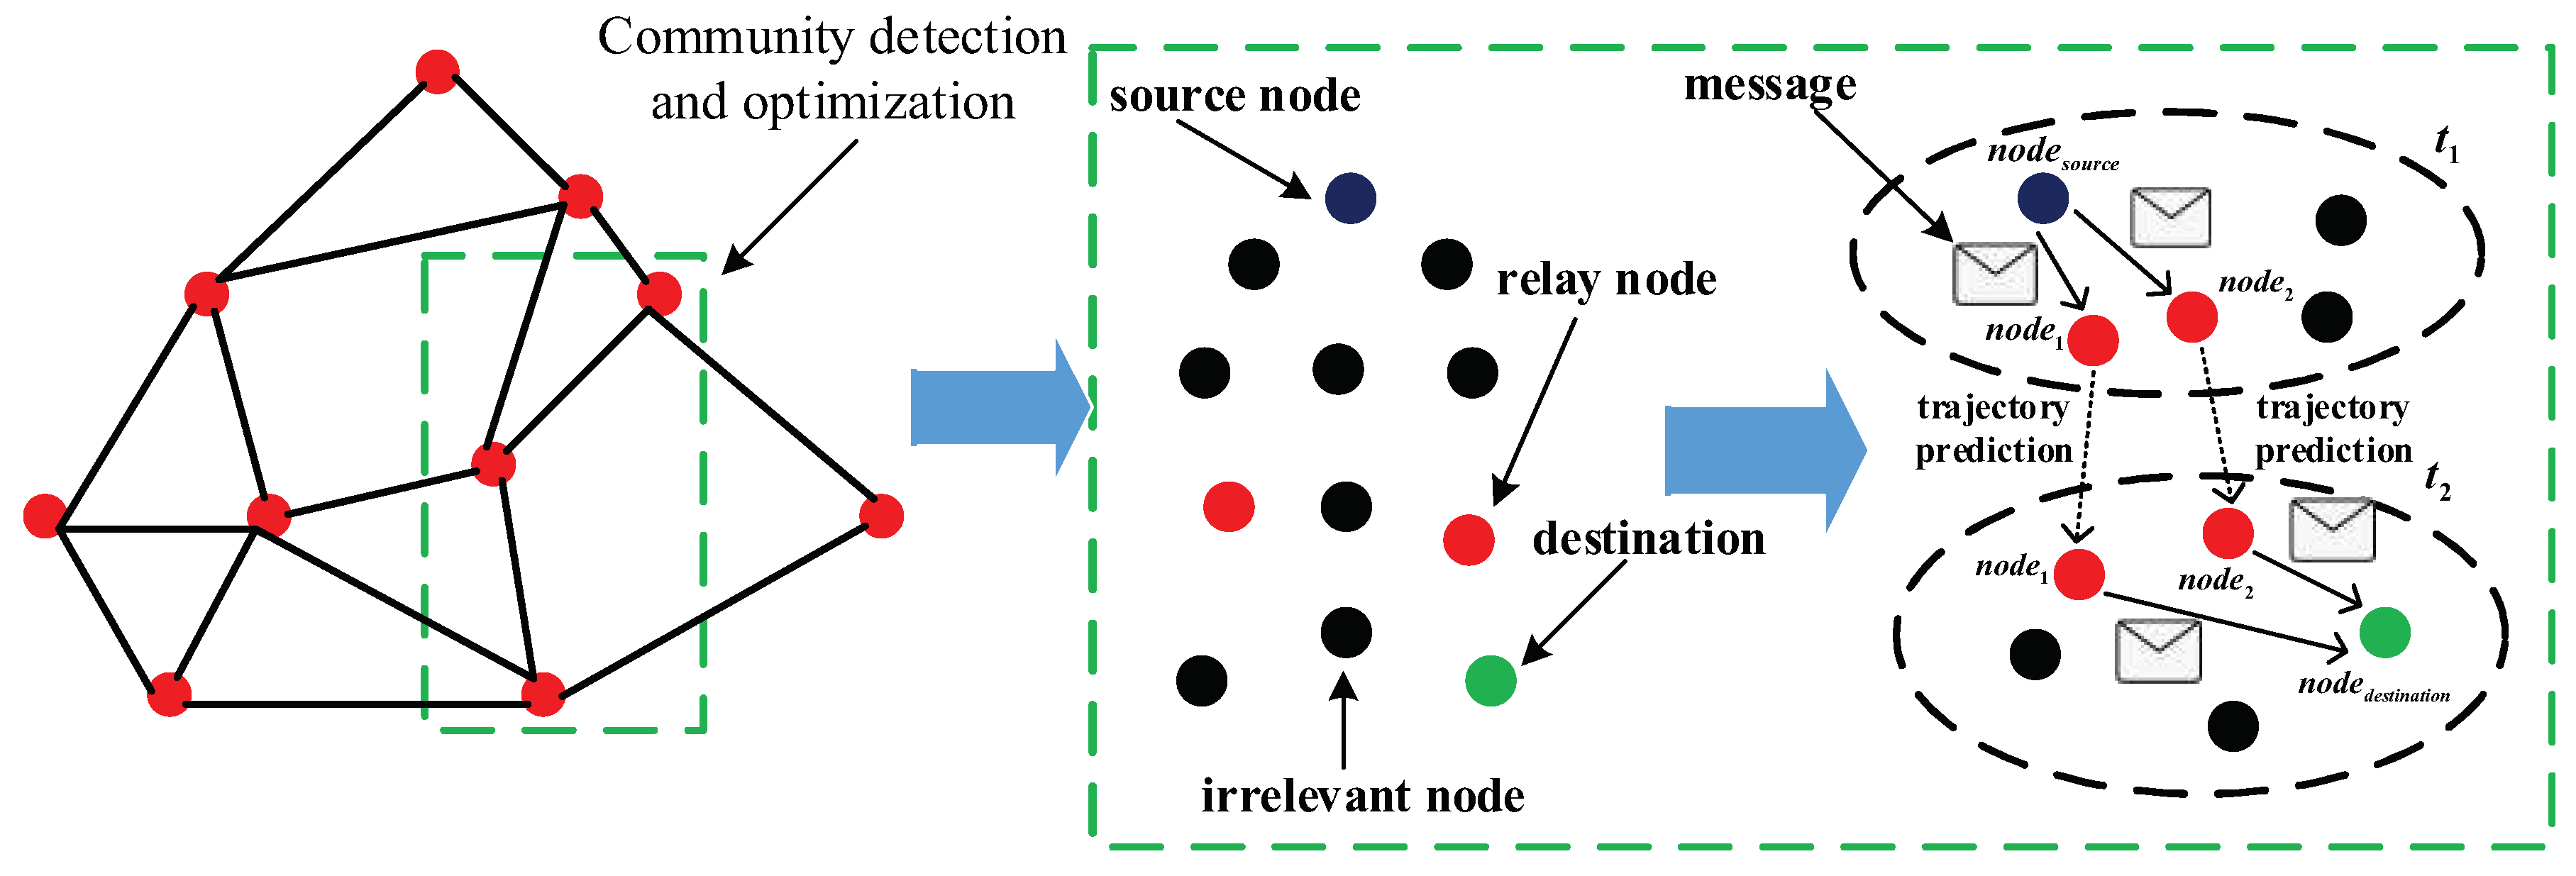
As shown in
Figure 3, the community detection strategy based on node activeness and node profile constantly optimizes the community in opportunistic networks, which reflected in that the number of nodes in the community is decreasing and they are becoming more and more connected. In the green rectangle, the purplish blue dot represents the source node and the red dots are relay nodes, while the green one is the destination and the black one denotes irrelevant node in the networks. Moreover, each black dotted circle represents a community in the networks. At the time
, the source node
, relay nodes
and
are divided into the same community based on community detection and optimization strategy. On the basis of the results of Markov location prediction, the relay nodes
and
possess the highest probability of moving to the same location state as the destination node
, hence the source node
sends messages to relay nodes
and
at the time
. As nodes move and communities change, the relay nodes
and
are more likely to delivery messages to the destination
at the time
.
4. Simulation and Analysis
In our experiment, the simulator Opportunistic Network Environment (ONE) is used to evaluate the performance of the NPLP algorithm in terms of delivery ratio, network overhead and end-to-end delay. In addition, we employ the mathematical tool
to implement the process of Markov chain construction and simultaneously realize the community optimization strategy. The setting of experimental parameters in Opportunistic Network Environment (ONE) could be determined based on the obtained results from
. Moreover, to comprehensively evaluate the improvement and enhancement from the NPLP algorithm, it will be compared with other four routing methods in opportunistic networks—Spray and wait [
32], Epidemic [
3], ICMT (Information cache management and data transmission algorithm) [
24], and FCNS (a fuzzy routing-forwarding algorithm exploiting comprehensive node similarity) [
17], where Spray and wait and Epidemic are two traditional and typical algorithms and ICMT and FCNS are the latest routing strategies in opportunistic networks.
4.3. Analysis of Experimental Results
In the simulation, the experimental results mainly focus on the influence of the cache spaces of a node and the number of nodes on the performance of the five routing algorithms in opportunistic networks. Consequently, we constantly change these two variables to observe the average fluctuation of delivery ratio, end-to-end delay and network overhead from the five algorithms tested in the four real data sets.
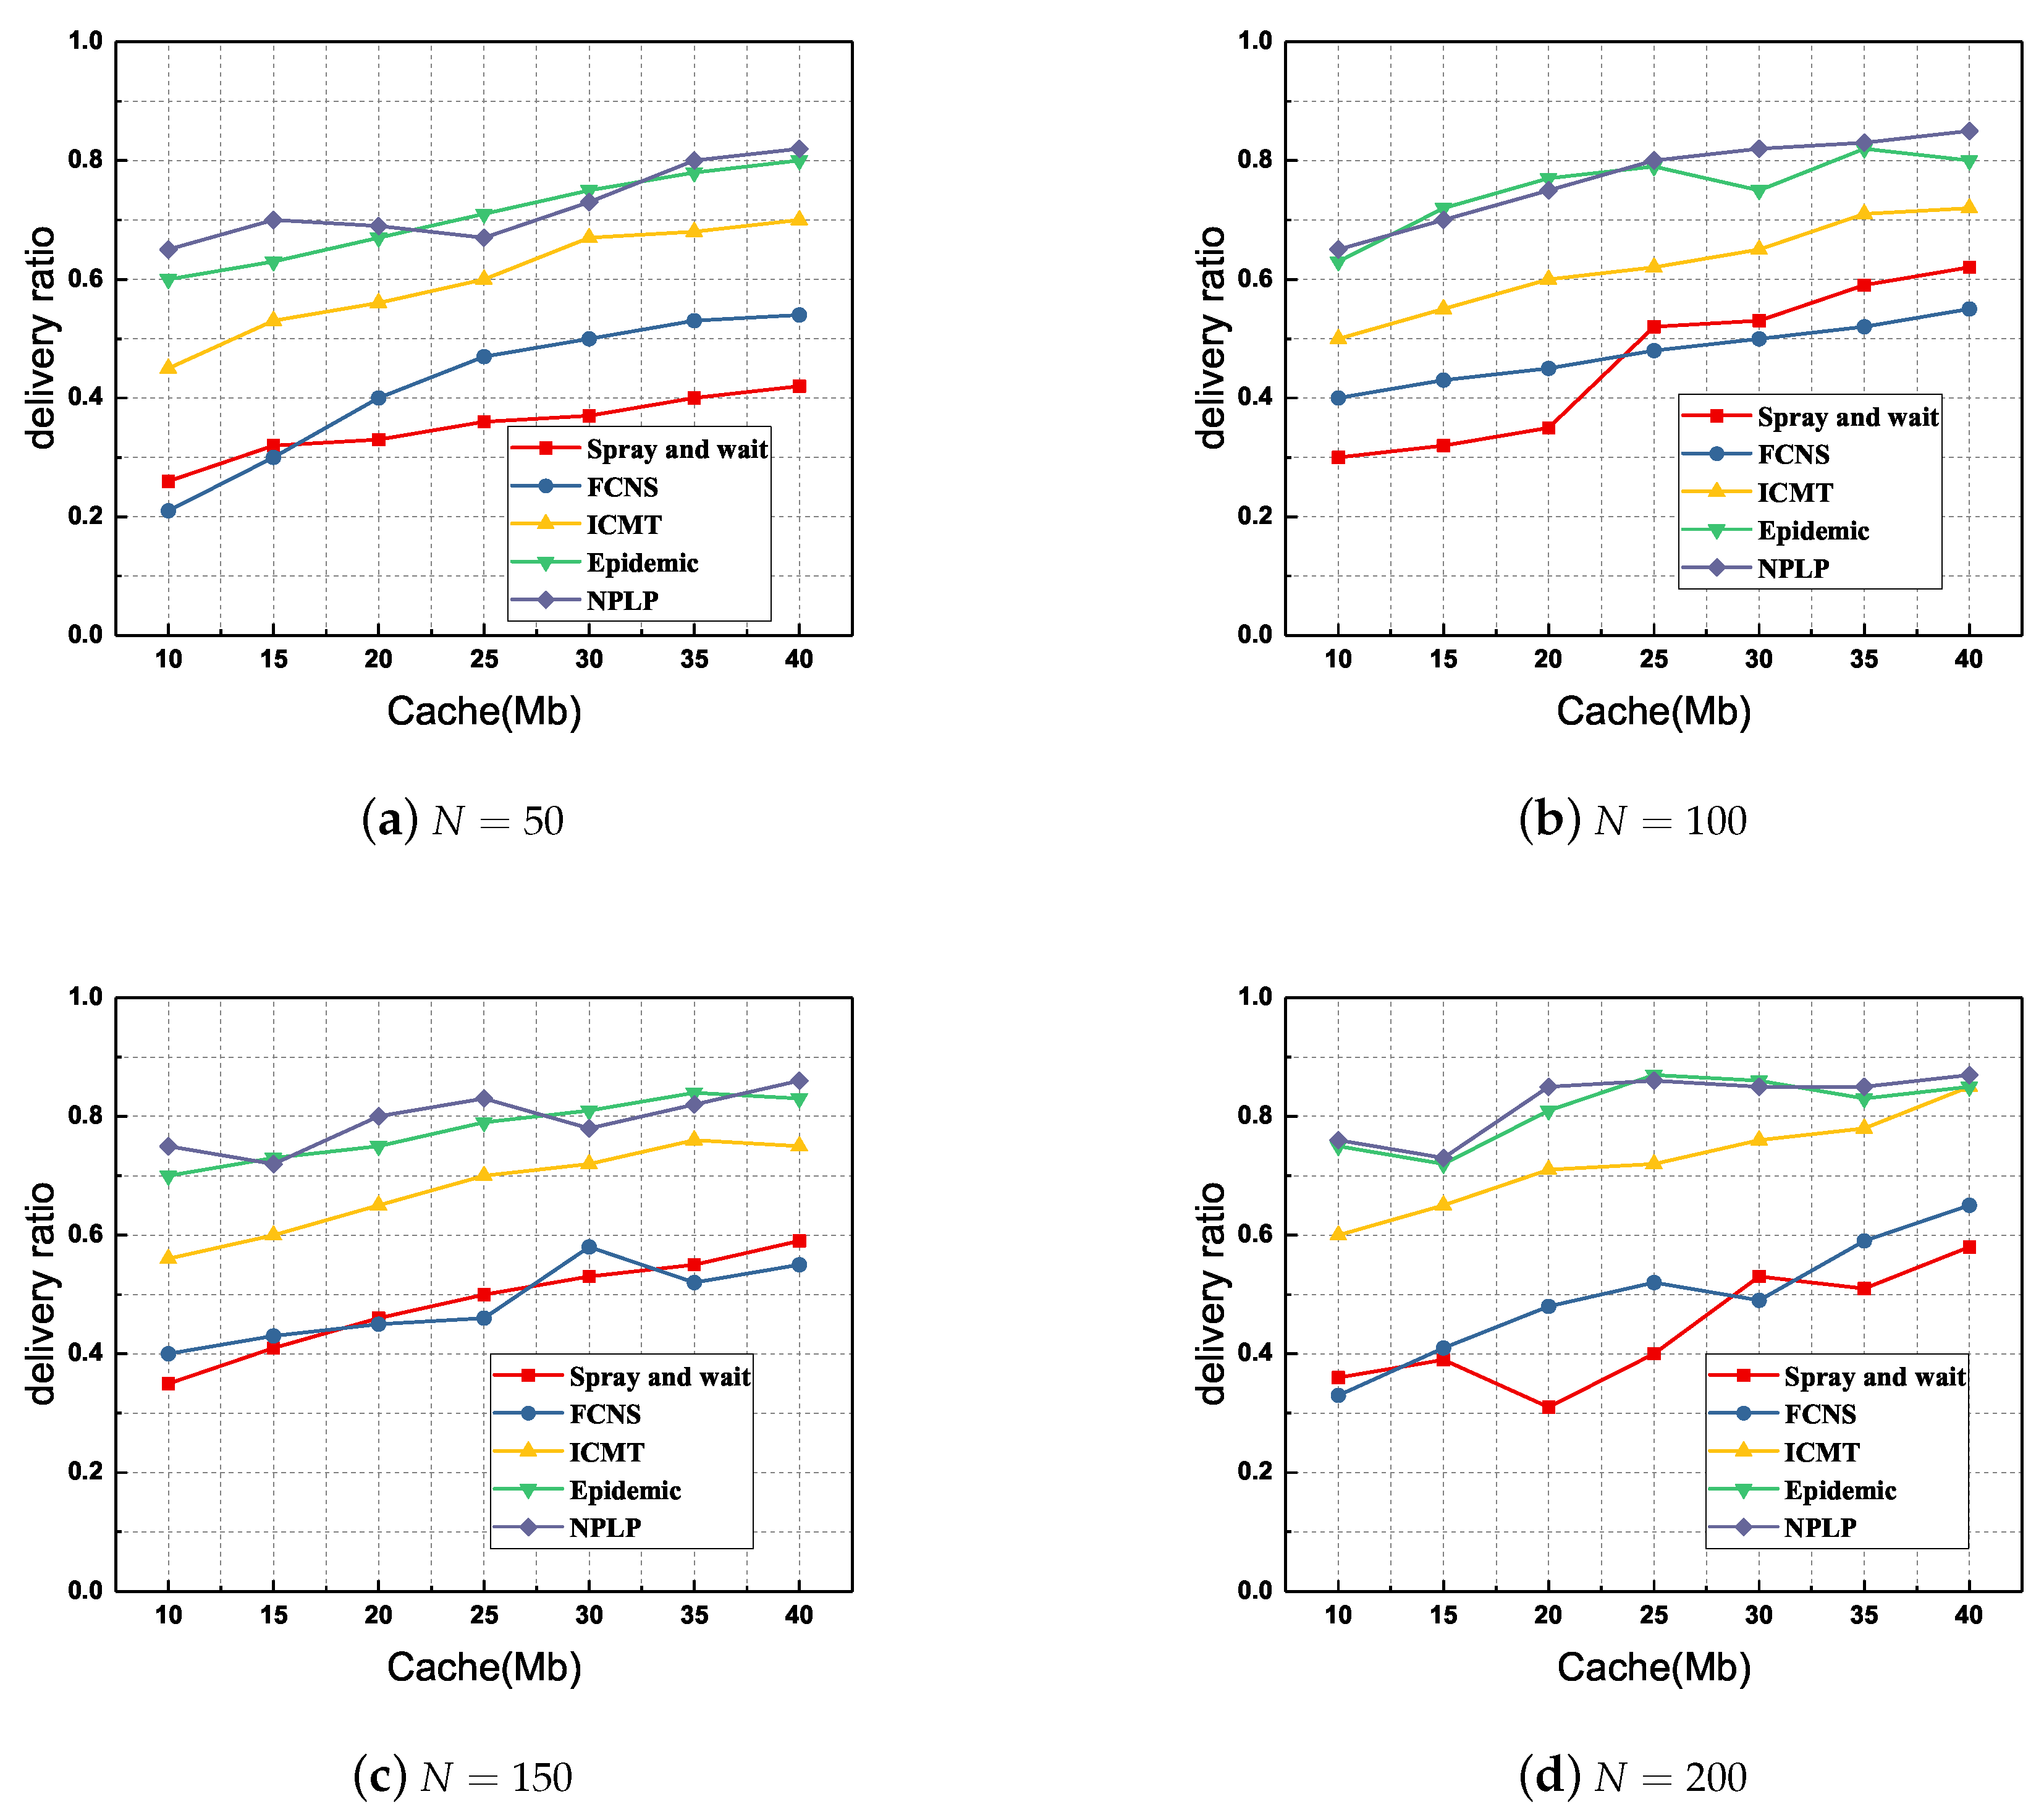
Firstly, we compare the delivery ratio of each routing algorithm with various number of nodes and various cache spaces of a node. As demonstrated in
Figure 4, the NPLP and Epidemic methods show a delivery ratio infinitely superior to those from the other three algorithms FCNS, ICMT and Spray and wait. Furthermore, the delivery ratio from ICMT is always in the middle level among these methods, while those from FCNS and Spray and wait are always been at a relatively low horizontal. Specifically, when the number of mobile nodes
and the cache spaces of a node
Mb (
Figure 4d), the delivery ratio from NPLP almost reaches
; when
and
Mb (
Figure 4b), the delivery ratio from NPLP is at the minimum of
. Overall, the average delivery ratio from NPLP is about
, which increases by nearly
as compared with that from Spray and wait.
As far as the delivery ratio is concerned, NPLP and Epidemic are the two best algorithms among these five proposals. This is because the traditional Spray and wait routing algorithm employs flooding mode to broadcast message duplicates widely in the networks, hence its delivery ratio will be relatively high. Additionally, through the reasonable detection and division of node community and the location prediction of node mobility, the NPLP algorithm is able to effectively enhance the probability of relay nodes encountering the destination in the communication area. Moreover, ICMT and FCNS employ cache management and fuzzy inference mechanism to effectively evaluate the social relationship between relay nodes and destinations, thereby improving the efficiency of message routing and forwarding. However, relay nodes may take a long time to wait for the destination in the second phase of Spray and wait, which definitely causes a relatively low delivery ratio in the networks.
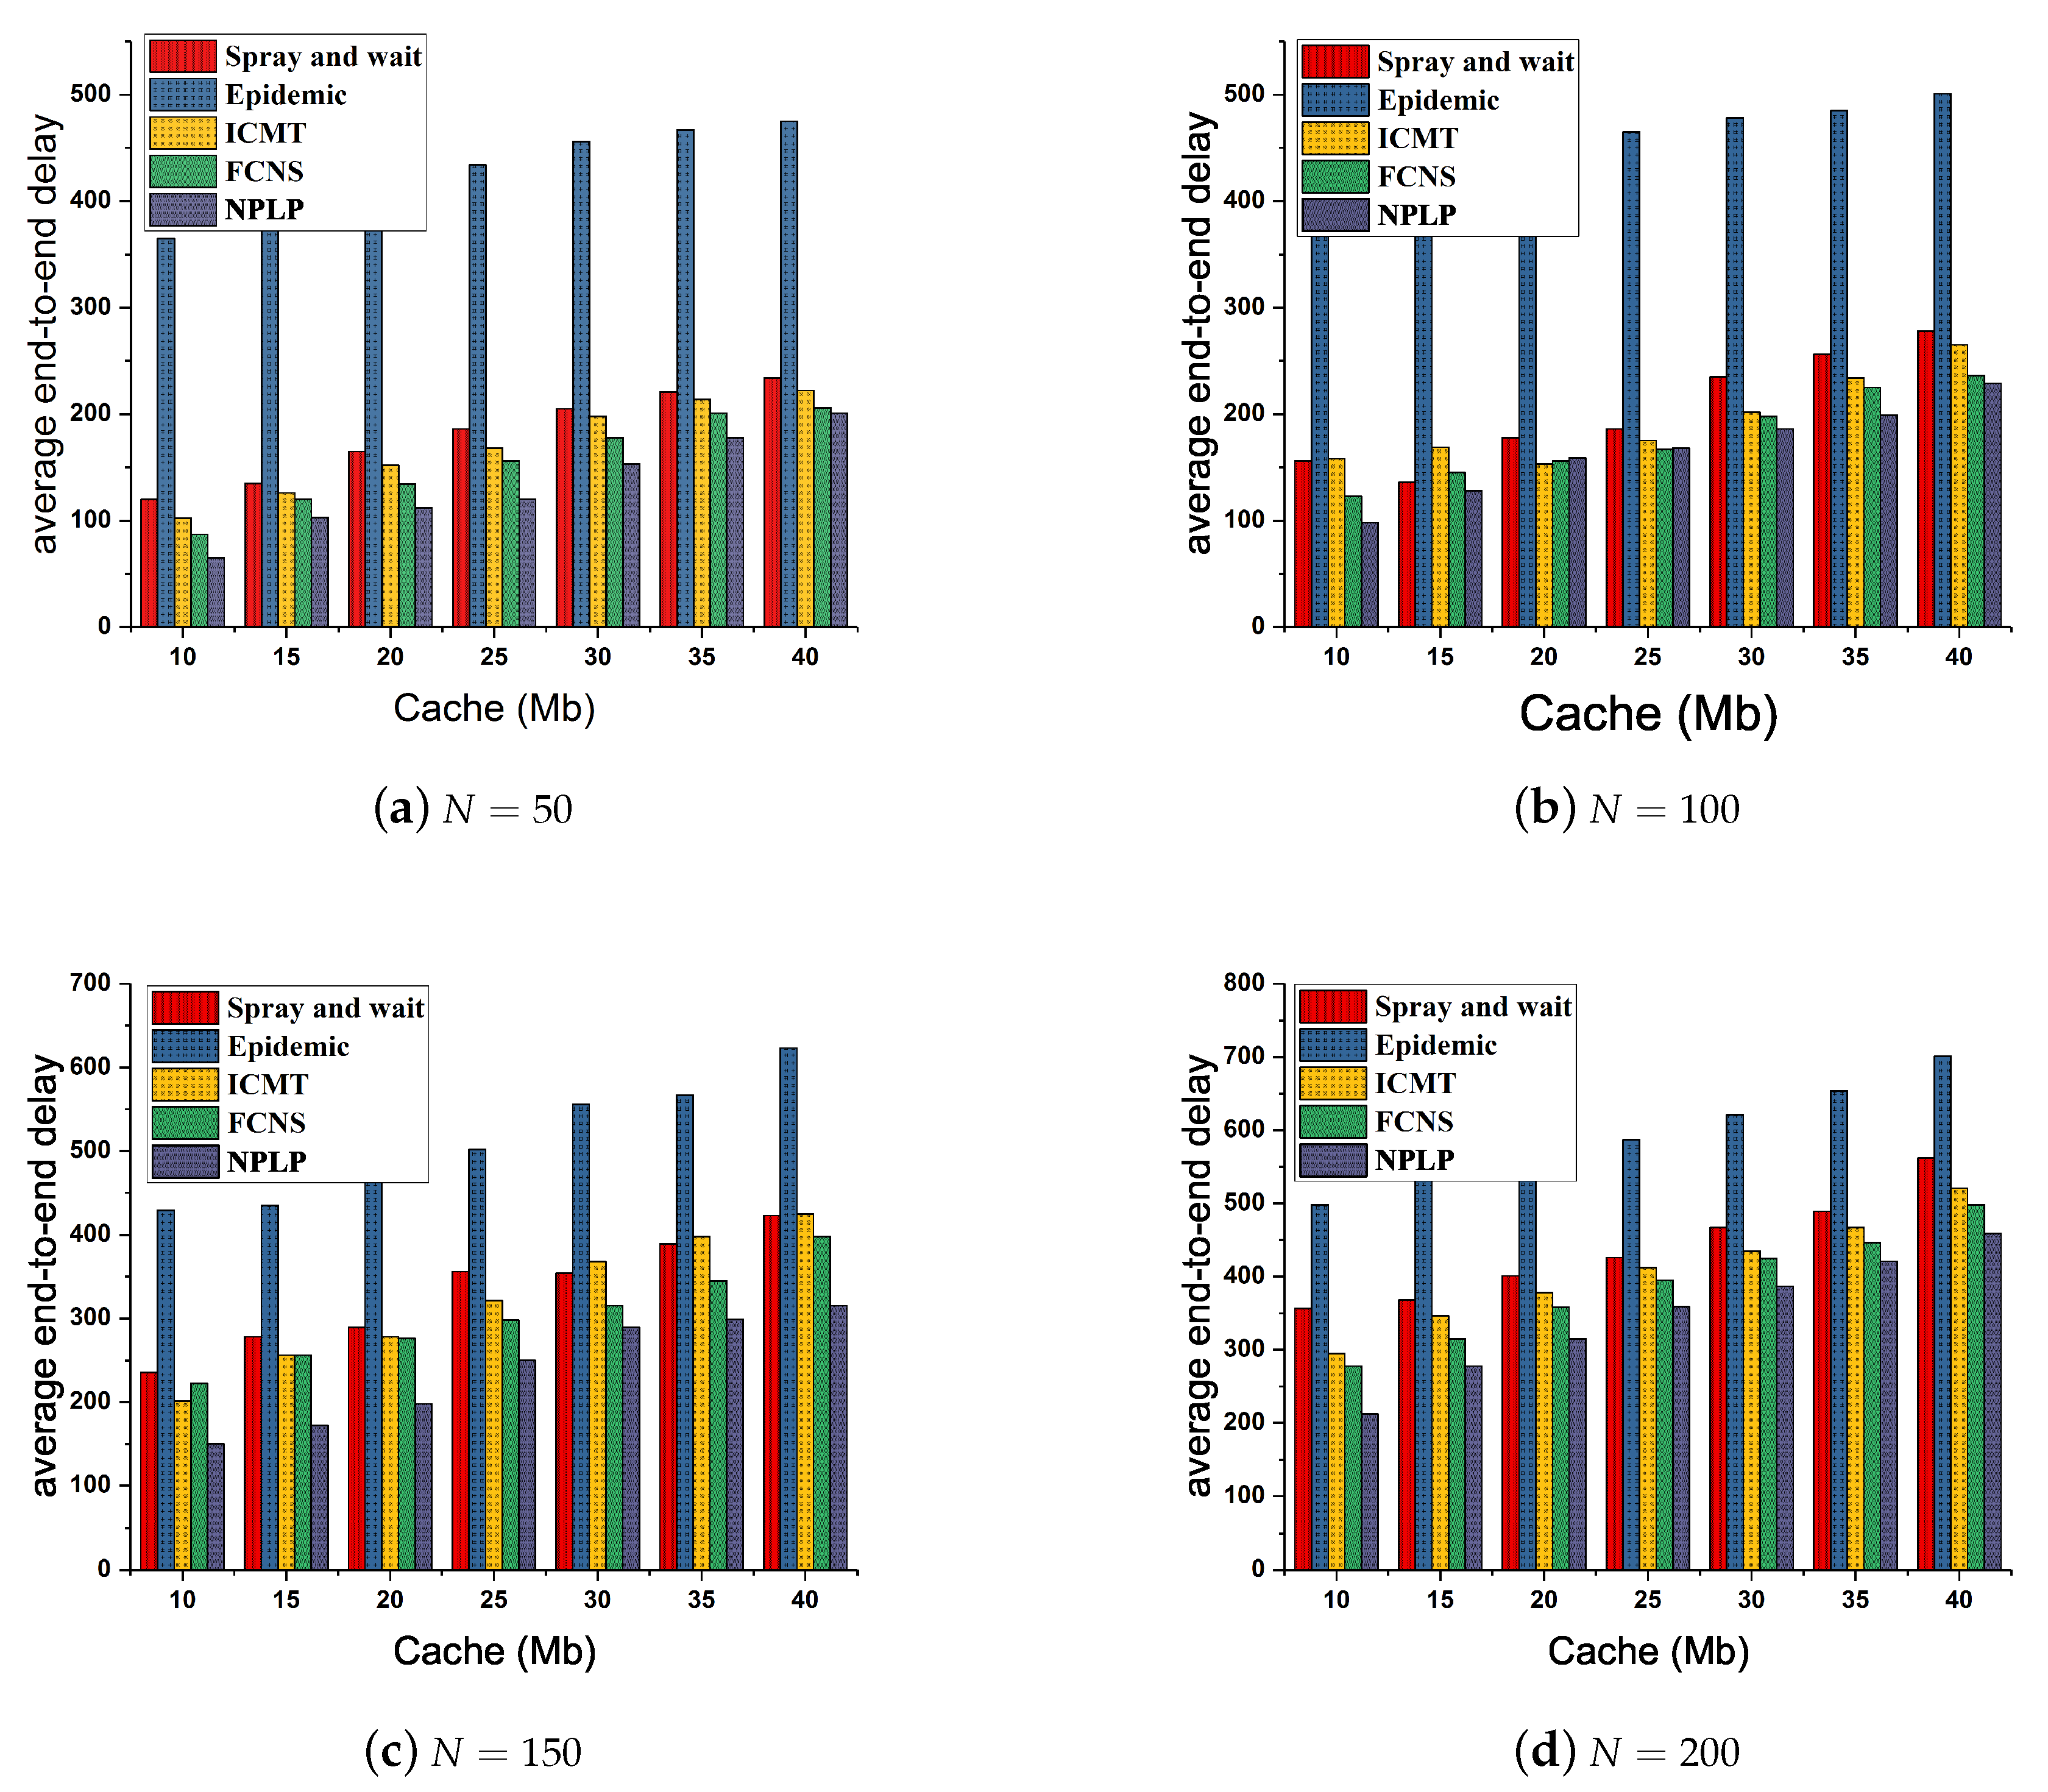
Figure 5 demonstrates the fluctuation of the average end-to-end delay from each routing algorithm with various number of nodes and various cache spaces of the node. In general, with the increasing of the cache spaces and number of nodes, the average end-to-end delay of each algorithm goes up continuously and slowly. It is worth noting that the average end-to-end delay from Epidemic is always the highest among those from the five algorithms and those from ICMT and Spray and wait are at the middle level all the time, while the average end-to-end delay from NPLP and FCNS are both inferior to those from the other three algorithms. Specifically, when
and
Mb (
Figure 5a), the average end-to-end delay from NPLP presents the minimum value of approximately 65, while it reaches the maximum value of 450 when
and
Mb (
Figure 5d). Besides, when
and
or 25 Mb (
Figure 5b), the average end-to-end delay from NPLP surpasses that from FCNS twice. Furthermore, the total average end-to-end delay from Epidemic is as high as about 320, which is almost
times that from NPLP (about 120). Additionally, the total average end-to-end delay from Spray and wait, ICMT and FCNS is approximately 162, 150 and 135, respectively.
In the light of the assessment on each algorithm’s characteristics, Epidemic and Spray and wait are used to broadcast a large number of message duplicates to the networks and the buffer memory space and processing capacity of the node are very limited, hence the flooding mode adopted in the two algorithms often leads to a relatively high average end-to-end delay in the network environment. Besides, with the application of the mechanisms of node cooperation and cache management, the ICMT algorithm is able to maximally and rationally utilize the buffer memory space of each node and, more importantly, tremendously improving the efficiency of the data dissemination and simultaneously decreasing the average end-to-end delay. FCNS is a traditional fuzzy inference algorithm that makes a reasonable data transmission decision by comparing the social and mobile similarities between nodes, enhancing the success rate of messages routing and forwarding. Furthermore, NPLP could predict the probability of relay node reaching the community to which the destination node belongs at the next moment, evaluates the mobility relationship between relay nodes and destinations and decreases the hop number of messages routing in the networks, thereby reducing the average end-to-end delay significantly.
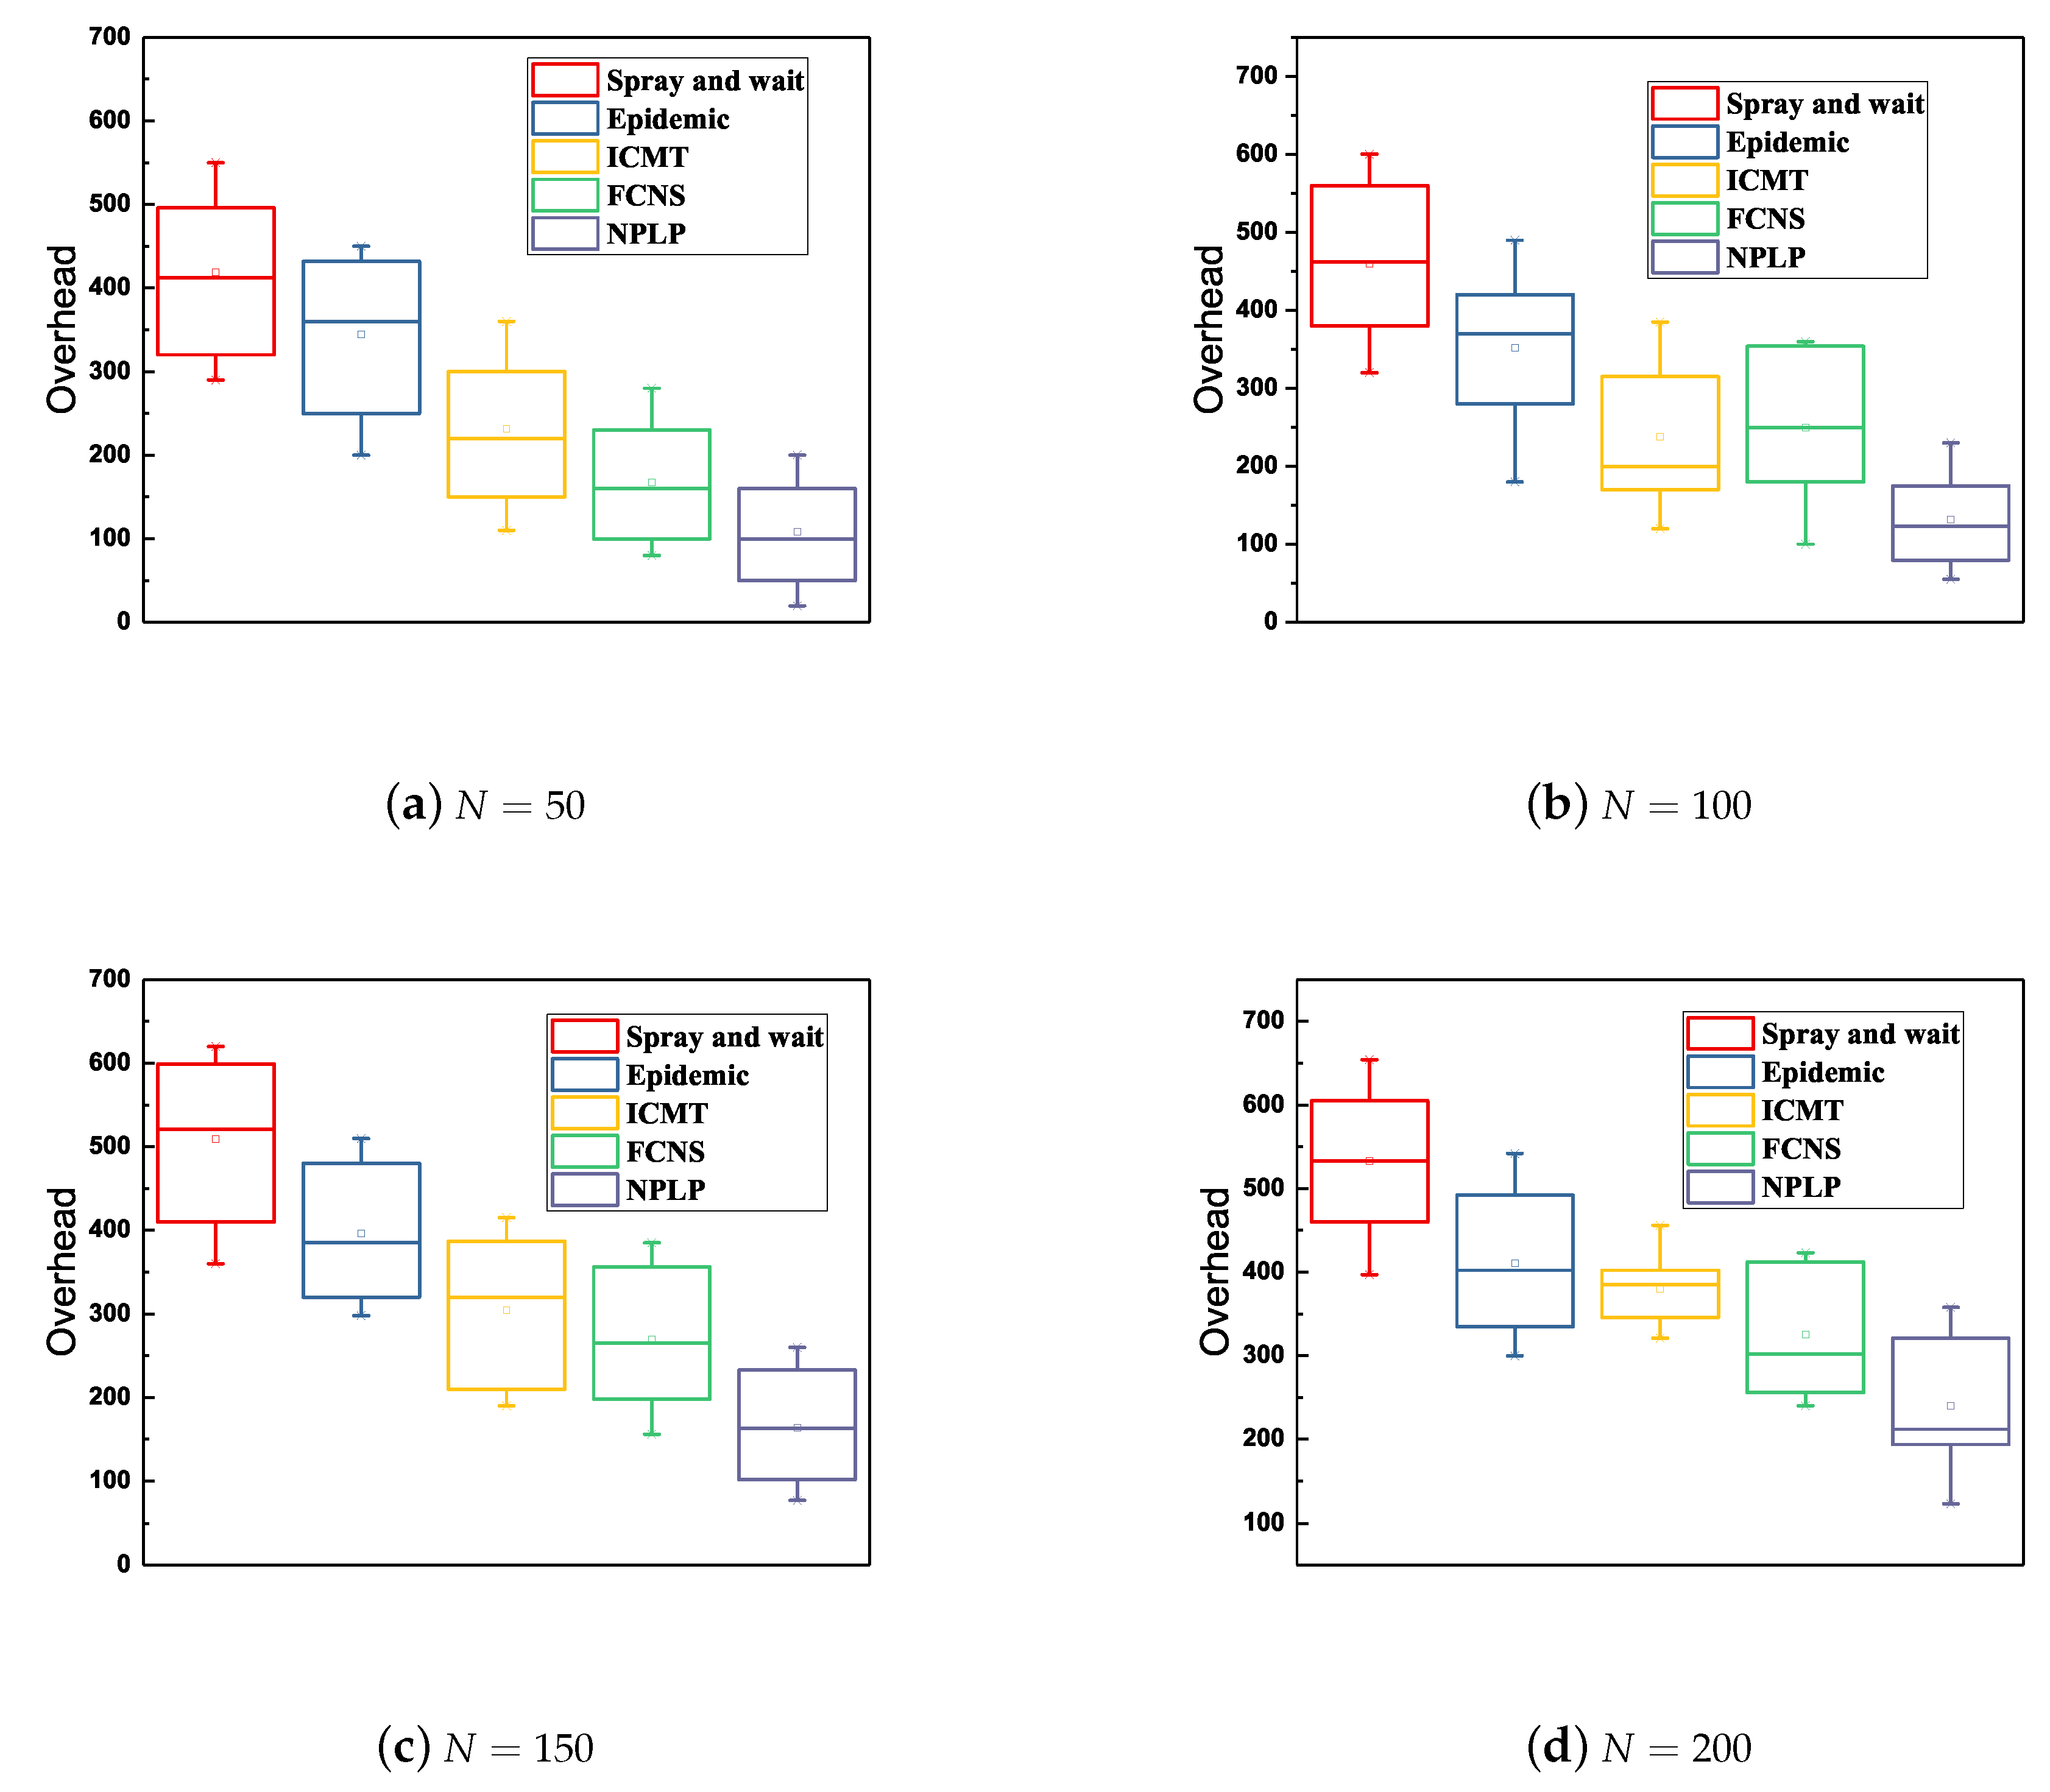
Ultimately, a comprehensive comparison of the network overhead between the five algorithms with various number of mobile nodes and various cache spaces of the node is demonstrated in
Figure 6. In general, when the number of nodes ranges from 50 to 200 and the cache space of a node increases from 10 to 40Mb, NPLP always exhibits the lowest network overhead among those from these algorithms, with the lowest and average values of 50 and 150 respectively. While the network overhead from Spray and wait is the largest among those from these algorithms all the time, indicating that the highest and average values reach nearly 680 and 450 respectively. Besides, the network overhead from epidemic, ICMT and FCNS are in the middle grade among those from the five algorithms. As we can see from
Figure 6d, the fluctuating range of the network overhead from ICMT is the smallest (from 100 to 400), meaning that this strategy is relatively stable and reliable. The Spray and wait method shows the largest fluctuation range (from 250 to 680) among these five algorithms.
This is because ICMT is committed to store data information and delivery messages through cache cooperation between multiple nodes, which significantly saves the cache space of nodes and reduces their energy consumption. A mass of message duplicates in Epidemic and Spray and wait may take up the cache spaces of the node unduly, therefore the nodes carrying excessive data are more likely to consume more energy in the process of random movement, which may lead to a relatively high network overhead when the number of nodes increases from 50 to 200. Moreover, NPLP is able to effectively control the number of message duplicates in the networks through community optimization and the prediction of node mobility. It also effectively decreases the number of message hops from sources to destinations in the networks, thereby reducing the energy consumption of nodes and simultaneously saving their memory space.

