Article

MSSN: An Attribute-Aware Transmission Algorithm Exploiting Node Similarity for Opportunistic Social Networks

School of Software and Communication Engineering, Xiangnan University, Chenzhou 423000, China
*
Author to whom correspondence should be addressed.
Information 2019, 10(10), 299; https://doi.org/10.3390/info10100299
Submission received: 10 September 2019 / Revised: 22 September 2019 / Accepted: 22 September 2019 / Published: 26 September 2019
(This article belongs to the Special Issue Applications in Opportunistic Networking)

Abstract

:
Recently, with the development of big data and 5G networks, the number of intelligent mobile devices has increased dramatically, therefore the data that needs to be transmitted and processed in the networks has grown exponentially. It is difficult for the end-to-end communication mechanism proposed by traditional routing algorithms to implement the massive data transmission between mobile devices. Consequently, opportunistic social networks propose that the effective data transmission process could be implemented by selecting appropriate relay nodes. At present, most existing routing algorithms find suitable next-hop nodes by comparing the similarity degree between nodes. However, when evaluating the similarity between two mobile nodes, these routing algorithms either consider the mobility similarity between nodes, or only consider the social similarity between nodes. To improve the data dissemination environment, this paper proposes an effective data transmission strategy (MSSN) utilizing mobile and social similarities in opportunistic social networks. In our proposed strategy, we first calculate the mobile similarity between neighbor nodes and destination, set a mobile similarity threshold, and compute the social similarity between the nodes whose mobile similarity is greater than the threshold. The nodes with high mobile similarity degree to the destination node are the reliable relay nodes. After simulation experiments and comparison with other existing opportunistic social networks algorithms, the results show that the delivery ratio in the proposed algorithm is 0.80 on average, the average end-to-end delay is 23.1% lower than the FCNS algorithm (A fuzzy routing-forwarding algorithm exploiting comprehensive node similarity in opportunistic social networks), and the overhead on average is 14.9% lower than the Effective Information Transmission Based on Socialization Nodes (EIMST) algorithm.

1. Introduction

In recent years, the deployment of mobile devices has become increasingly extensive, and the massive data transmission requirements of mobile devices has put increasing pressure on infrastructure. Emerged from mobile ad hoc networks (MANETs) [1] and the Social Network Service (SNS) [2], opportunistic social networks (OSNs) [3,4,5] have been regarded as a complex intermittently connected network architecture, which have been identified as a promising network model to improve network transmission reliability and dissemination environment. OSNs are infrastructure-free: nodes store data and carry it based on the mobility of the underlying user until new communication opportunities arise to forward the data. The store-carry-forward [6,7] mechanism proposed by OSNs can effectively alleviate the pressure brought by massive data transmission and effectively improve the data deliver ratio. At present, the research direction of OSNs mainly includes routing-forwarding algorithm [8], mobile pattern [9], security and privacy [10], and data storage and management [11].
With the gradual development of 5G networks and big data environments [12,13], the number of smart mobile devices has increased dramatically, such as Bluetooth, smart phones, laptops or other wearable sensor devices. As a result, the data transmitted over the network link grows exponentially, and the pressure of massive data on network transmission links [14] makes it difficult for some users to enjoy network services conveniently and quickly. Furthermore, the routing overhead of improving infrastructure is getting higher and higher, and it is difficult to meet the demand during large gatherings such as sports events. Besides, in sparsely populated areas, deploying communication infrastructures may have no economic benefit to the operator. Finally, in natural or man-made disasters, infrastructure [15] can be damaged, causing rescue services to be inaccessible to those in need. For the above reasons, OSNs proposed that end-to-end communication connectivity can be established by suitable relay nodes [16] performing store-carry-forward mechanism. The mobile nodes temporarily store the data package in their cache spaces and forward the carried data packages to the peer they encounter. The store-carry-forward mechanism can effectively alleviate network pressure and provide users, with a more comfortable and convenient network service experience. Therefore, it is extremely important for mobile nodes carrying data in OSNs to select relay nodes to perform effective data forwarding process. Especially, how to choose the appropriate relay node to perform data transmission is also a key factor in opportunistic social networks.
At present, various routing and forwarding algorithms have been proposed to deal with data dissemination problems in different scenarios. However, most of these algorithms only consider a single factor, either the mobile similarity [17] between nodes or the social similarity [18] of nodes. For algorithms that only consider the mobile similarity of nodes, they typically use the number of real-time common neighbor nodes of the nodes and destination nodes to evaluate the mobile similarity between them. However, the key point that they ignore is that the nodes in the network have certain social relationships with each other, and the social relationships between them can usually be reflected by social attributes [19]. The social attributes of nodes can reflect the special connections between users, which could be termed as a powerful basis for selecting relay nodes. Some studies have shown that nodes with high social similarity are more likely to encounter each other, and thus have more opportunities to transmit data between them. For those algorithms that only consider the social similarity between nodes, they usually use the factor of mutual friends between nodes to evaluate the social similarity between them, but they ignore the importance of mobile similarity of nodes in the process of data transmission. In a realistic social scenario, nodes are likely to repeat the same movement route every day, such as from the residence to the workplace. If the mobile similarity of two nodes is higher, the probability of encountering between them is greater, so the probability of message delivery between them is greater. Therefore, the mobile similarity and social similarity of nodes can be used as strong basis for selecting reliable relay nodes. However, most algorithms only choose one or the other, without considering these two key factors.
To tackle the above-mentioned problems, this work proposes an effective data transmission strategy (MSSN) utilizing mobile and social similarities in opportunistic social networks. This scheme evaluates the mobile similarity and social similarity between nodes by using their moving trajectories, the number of common neighbor nodes and their social attributes. Specifically, this mechanism calculates the first moving trajectory similarity between neighbor nodes and destination based on the moving trajectories of them. According to the number of their common neighbor nodes in a period of time, this method is able to determine moving trajectory similarity. The final mobile similarity can be obtained by adding together the two trajectory similarities after given the corresponding weights. Then we set a threshold based on the all obtained mobile similarity and round off the nodes whose mobile similarity is less than the threshold. Next, according to the social attributes of the remaining neighbor nodes and destination nodes, the social similarity between them is further calculated, and the nodes with higher social similarity can be the reliable relay nodes. In conclusion, the MSSN is a novel routing-forwarding strategy, which considers the mobile similarity and social similarity of nodes together. The contributions of this paper are listed as follows:
  • By effectively collecting node information, the message applications can accurately assess the comprehensive similarity (social and mobile similarity) between neighbor nodes and destination nodes and determine the special transmission relationship between them.
  • Through setting a mobile similarity threshold, we can narrow down the screening range of reliable relay nodes, thereby make the next calculation of node social similarity more accurate and obtain more suitable relay nodes.
  • To take the social attributes of neighbor nodes and destination nodes as the main analysis basis, an effective data transmission strategy based on node socialization is proposed. Message carriers can obtain more reliable relay nodes.
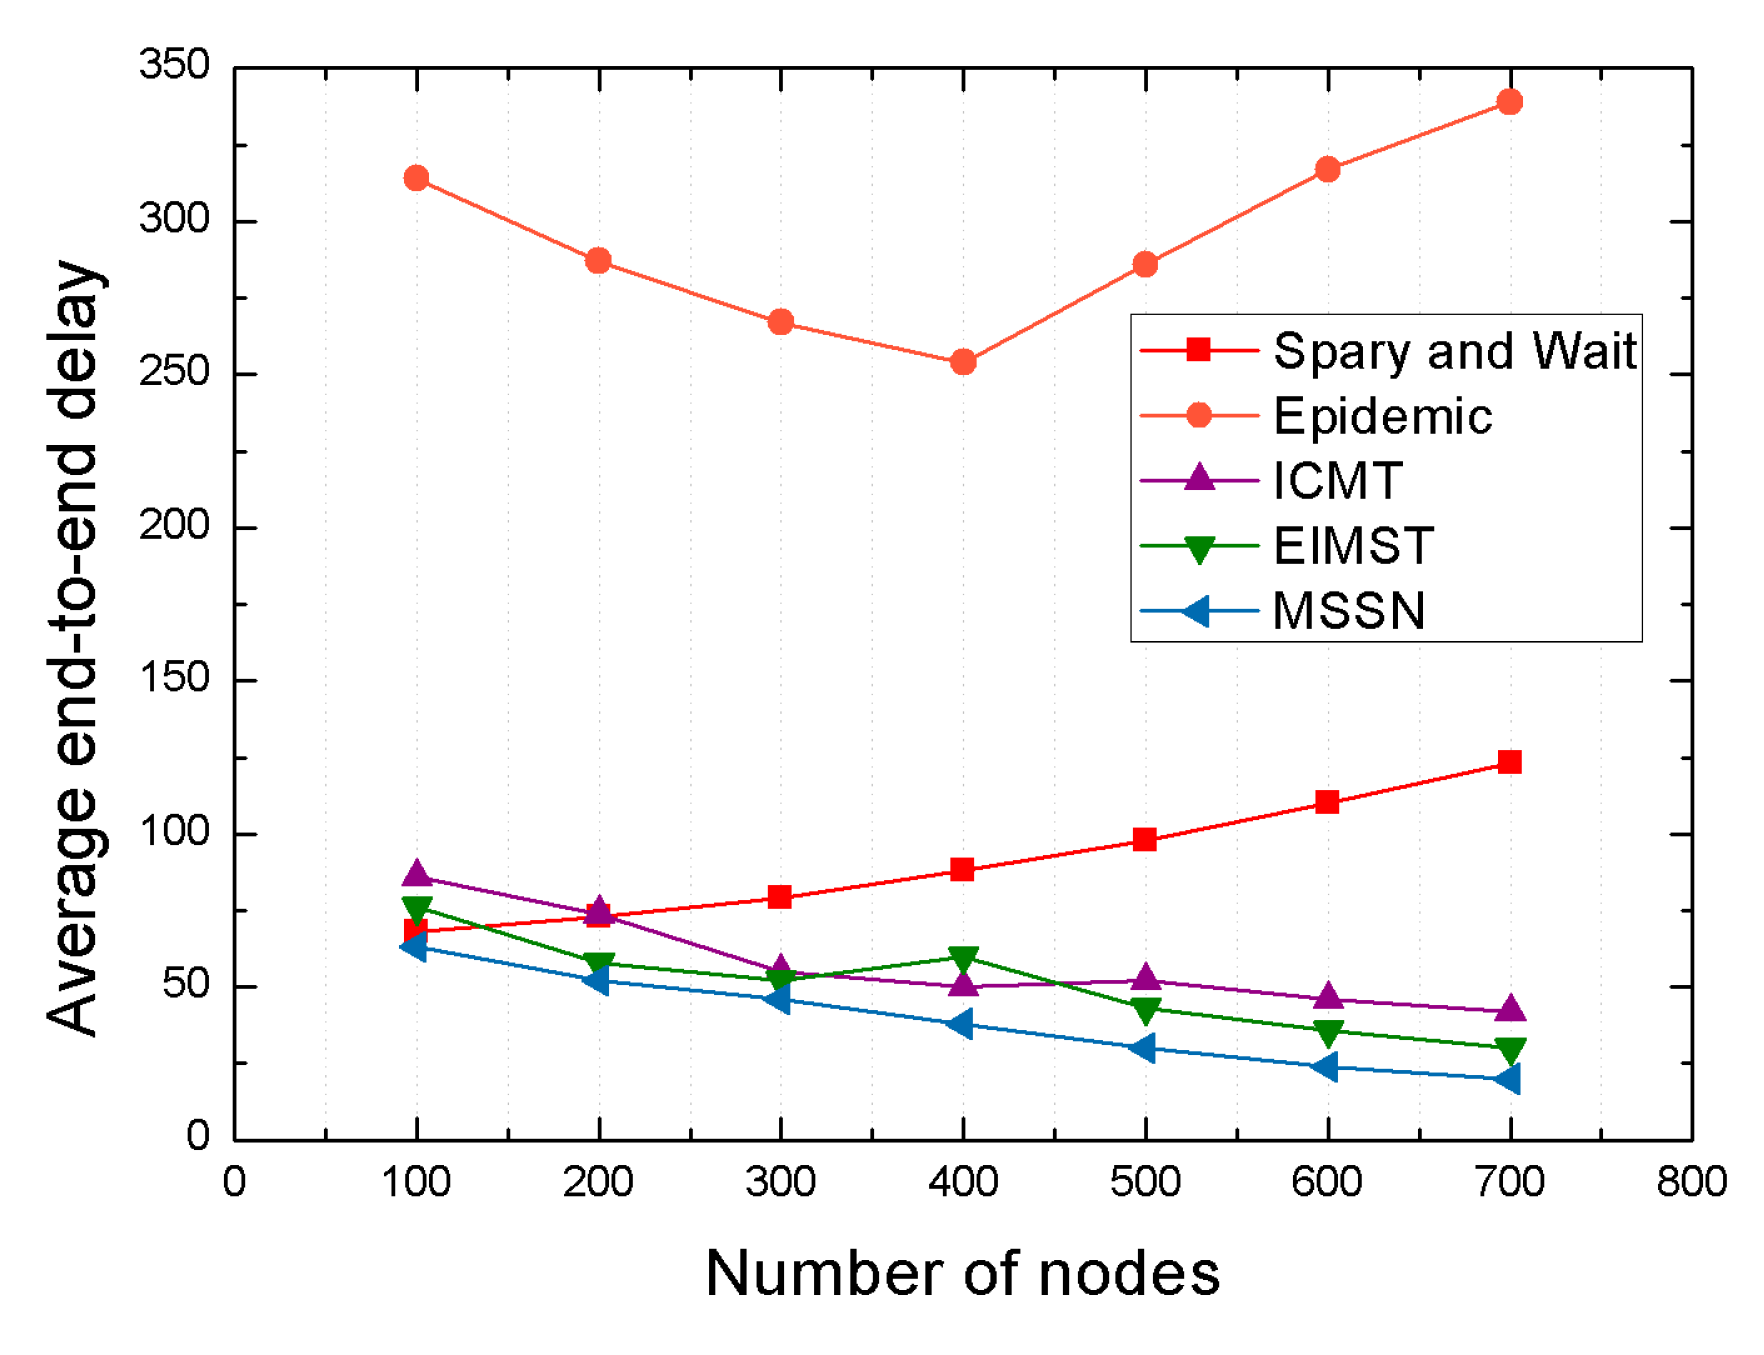
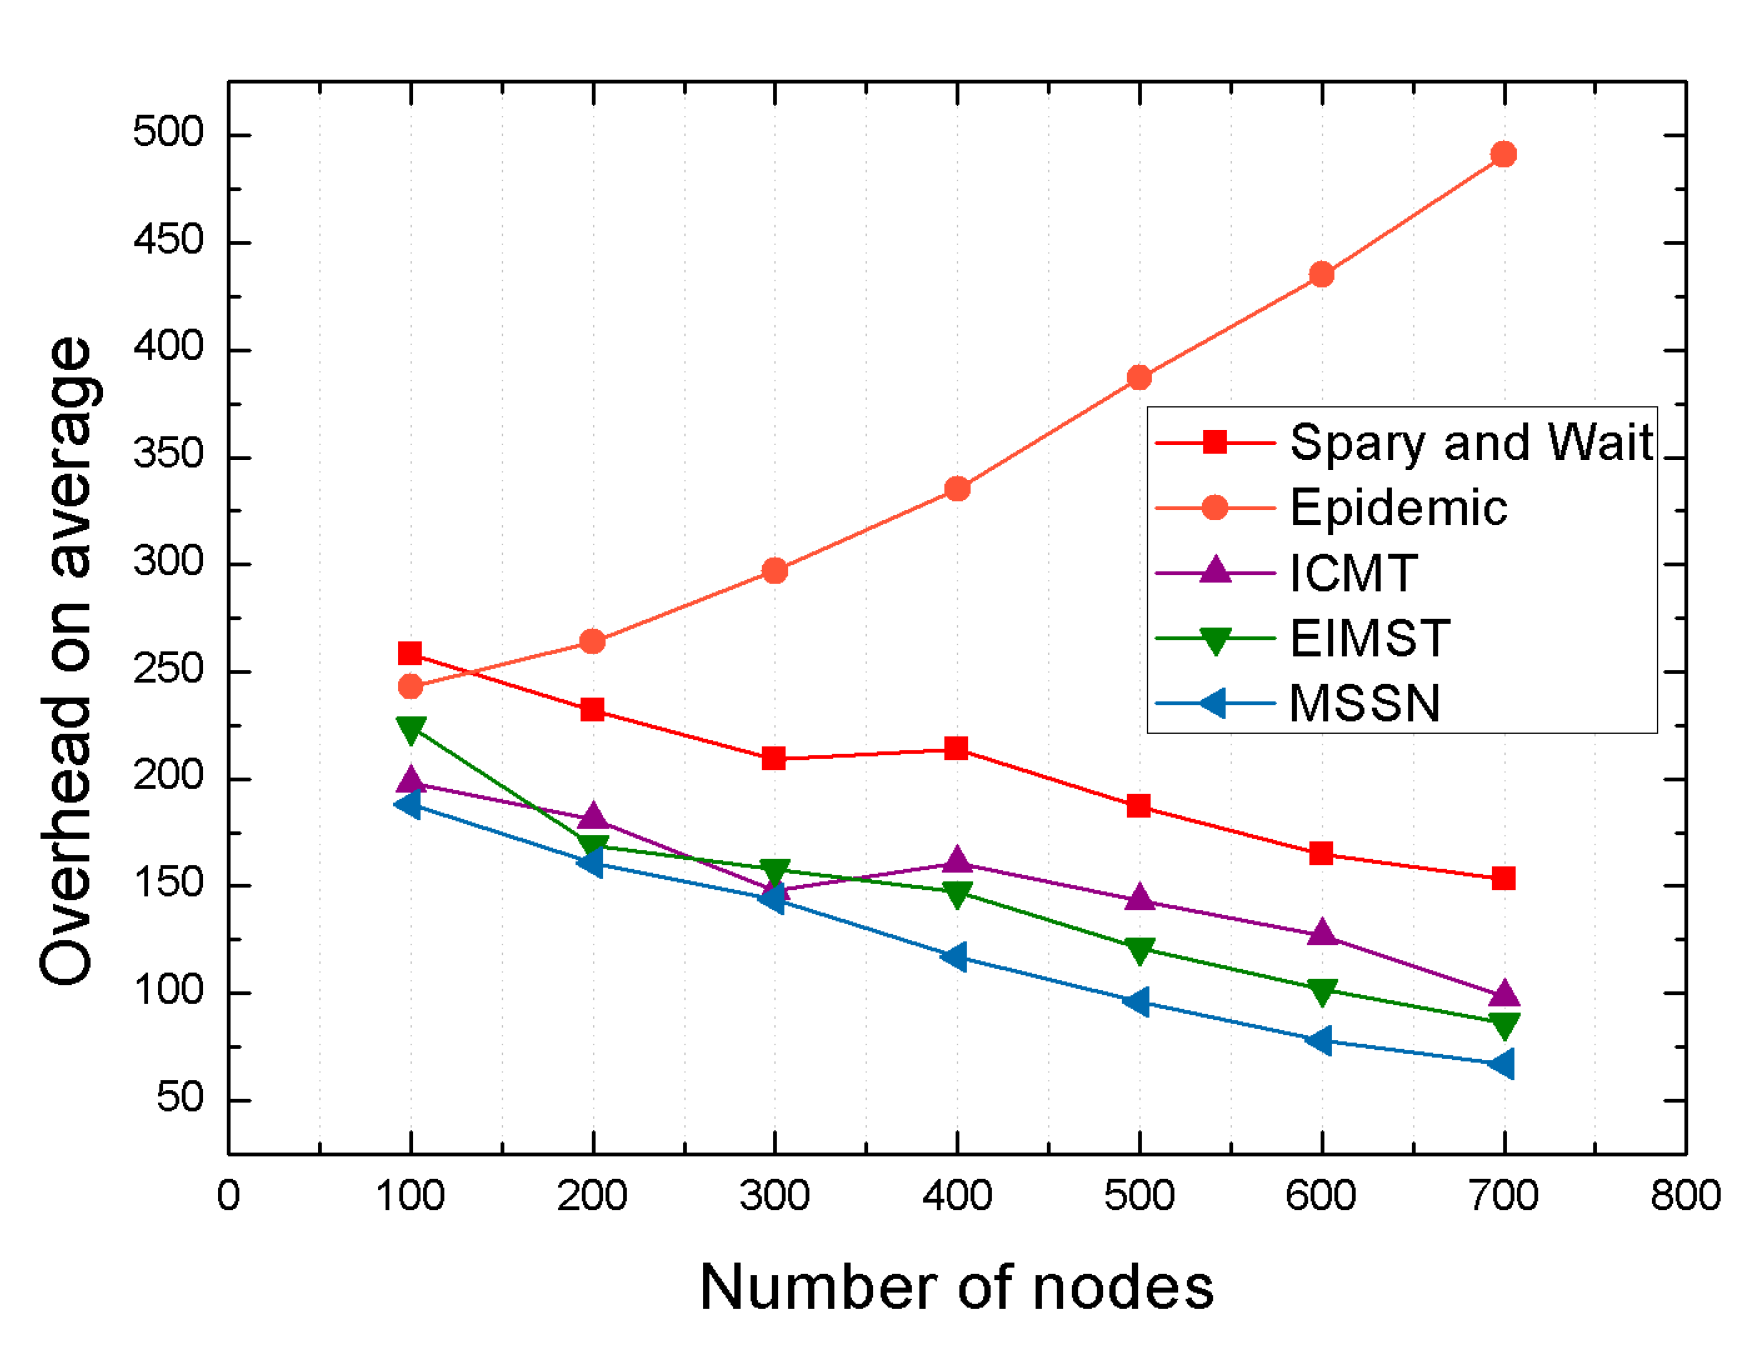
  • In light of the simulation results in the Opportunistic Networking Environment (ONE), the performance of the MSSN algorithm is better than other algorithms in the aspects of the delivery ratio, network overhead, and end-to-end data transmission delay.
The remainder of the paper is organized as follows: In Section 2, we introduce the previous related work; The MSSN data transmission strategy will be discussed in Section 3; in Section 4, we evaluate the performance of our algorithms through extensive simulation results. Finally, the conclusion of the paper is shown in the last section.

2. Related Works

In recent years, opportunistic social networks have moved forward step by step. With the gradual arrival of 5G networks, a wave of researchers has once again set off. In the development of the opportunistic social networks, the research focuses on finding relay nodes for forwarding messages and researching the energy consumption and delay in the forwarding process. Therefore, the existing algorithms in opportunistic social networks could be divided into two categories: the approaches based on mobility attributes and the approaches based on social attributes. Next, we will introduce the state of the art related to our study.

2.1. The Existing Algorithms Based on Mobility Attributes for Opportunistic Social Networks

Jia et al. [20] proposed a method of caching through neighbor nodes based on probability evaluation. In order to avoid accidentally deleting cached data and using neighbor nodes as shared nodes, the effective transmission is finally realized. Compared with the traditional method, not only the transmission rate is improved, but also the delay is reduced. Jiang et al. [21] proposed three data propagation protocols, namely RRDP (Request-Reply Dissemination Protocol), RDP (random propagation protocol) and LDP (LRU propagation protocol). Through simulation experiments, the advantages and disadvantages of the three communication protocols in the case of campus and vehicle are verified. Ying et al. [22] proposed many problems in the routing mechanism in the opportunistic social networks, that is, the problems that most people are discussing now, unfair traffic distribution and the unfairness of transmission success rate. In response to this phenomenon, the authors propose an FSMF algorithm that limits the number of forwarded copies based on social relationships to improve fairness. Jia et al. [23] analyzed the problem of device cache space delay and low delivery rate in social networks. The large amount of data between users leads to high information delivery delay and low efficiency. A node-based algorithm is proposed to improve the transmission environment and select a neighbor node with high priority access probability.
Lin et al. [24] proposed a preference-aware content communication protocol. The links between nodes in a mobile social network are not persistent. Therefore, based on preference perception, we can predict how much contact can be made for the future. Contribute and predict the best forwarding time. Boldrini et al. [25] proposed a Content-Place data dissemination system. Content-Place is responsible for moving and copying data objects in the network. When encountering interested nodes, users can mark them. Connect and guarantee that the connection will not be disconnected for a long time. Content-Place can learn relevant user social behaviors to drive the data dissemination process. Conti M et al. [26] proposed an algorithm based on semantic data annotation, which considers users to construct their own semantic network representations and use descriptions to connect between networks.

2.2. The Existing Algorithms Based on Social Attributes for Opportunistic Social Networks

Woungang et al. [27] proposed a message forwarding routing protocol based on energy-saving altruistic trust dependence, which uses the social exploitation matrix to determine the credibility of messages forwarded between nodes. In addition, by comparing with other algorithms, the superiority of the method is embodied. The Ad-hoc Social Network (ASNET) proposed by Liaqat et al. [28] represents a special network that uses the social attributes of customers to provide services in a distributed environment. Mordacchini and others [29] found that when social networks communicate with their interested nodes through the adaptive of devices, a large amount of data is difficult to be used. According to this question, the data dissemination scheme is proposed, and the social environment is used as the evaluation method. Borrego [30] present a broadcast dissemination protocol for message controlling in opportunistic networks, in which data duplicates will be limited by evaluating the prospective forwarders of mobile nodes and the optimal stopping theory will be utilized to select the suitable nodes with the beset message stores in the networks.
Yu et al. [31] proposed a combination of multi-faceted task attributes to determine whether it can be used as a corresponding relay node to establish a fuzzy matrix and quantify social relationships through social assessment. Souza et al. [32] proposed a new routing protocol called FSF protocol (Applying Machine Learning Techniques to Data Forwarding in Socially Selfish Opportunistic Networks.), which mainly makes decisions based on the social connection between nodes and the resource level of their own devices. In the case of not accepting messages, there is a relative improvement through the FSF algorithm. Zhao et al. [33] proposed a three-stage method for device-to-device data dissemination, through the user’s social attribute connection, data dissemination between users in social relationships. Yang et al. [34] improved the data forwarding performance based on the spontaneous communication of enhanced nodes in the community and found the best relay nodes. This paper proposes a routing protocol for assessing geographic social interests to select the best relay node. A performance comparison found that this protocol is superior to other protocols.

3. System Model Design

In opportunistic social networks, there are many algorithms that select the appropriate relay nodes based on the similarity between the nodes. However, when considering the similarity between nodes, these algorithms usually only consider a single factor such as location, common neighbor node, and social attribute. Since these algorithms tend to ignore a lot of valuable information between nodes, the relay nodes obtained by these algorithms are often not so reliable. Therefore, this paper proposes a data transmission strategy that utilizes the mobile similarity and social similarity between neighbor nodes and destination nodes to select more reliable relay nodes. Next, we will introduce the algorithm step by step in detail.

3.1. Collecting Information about Nodes in Network

In the opportunistic social networks, we need to collect a lot of relevant node information and do corresponding processing and statistics, such as the node carrying the message, the distribution of the neighbor nodes, the related information of the destination node, and the selection information of the relay node. First, we need to collect not only some of their own information, such as social similarity, historical information, etc. However, the appropriate definition and corresponding processing of the collected information needs to be addressed. Secondly, we need to update the defined messages on time, so that the data transmission strategy algorithm can have higher timeliness and accuracy.

3.1.1. Defining and Collecting Information about Mobile Nodes

Opportunistic social networks are sparse wireless networks and there is no direct full link from the source node to the destination node. Therefore, opportunistic social networks use the random movement of the node to establish a suitable temporary communication link for data exchange. In the data transmission process, we use the intermediate node to realize the effective transmission of the message from the source node to the destination node. Therefore, we have the concept of relay node and neighbor node.
For the MSSN algorithm, we also need to collect information about many nodes. In our proposed algorithm strategy, there is a preparation period of a network node, in which all network nodes acquire the latest network node status and update the corresponding status. In a real-life scenario, the user may perform the same behavioral activities every day, such as entering a conference room at a certain time, from home to the company, etc. Therefore, we set this time period Δ t to 24 h. During this period, we also need to collect the historical movement trajectories of all nodes and their social attributes. In addition, this mechanism collects information of the two encountered nodes in the cycle; and obtain and update in real-time. Therefore, in order to better normalize this information, we will define the data by formula:
l i s t ( n o d e ) = ( m _ t r a c k n o d e , a t t n o d e , * l i s t _ n u m )
where m _ t r a c k n o d e is the distribution of the movement trajectory of the node in the network, a t t n o d e is a feature vector, represents the social attribute of the node, and l i s t _ n u m represents the sequence of node states encountered by the node during the time period. Therefore, the entire information network is defined by a sequence of motion trajectories, social attributes, and historical encountering information states.

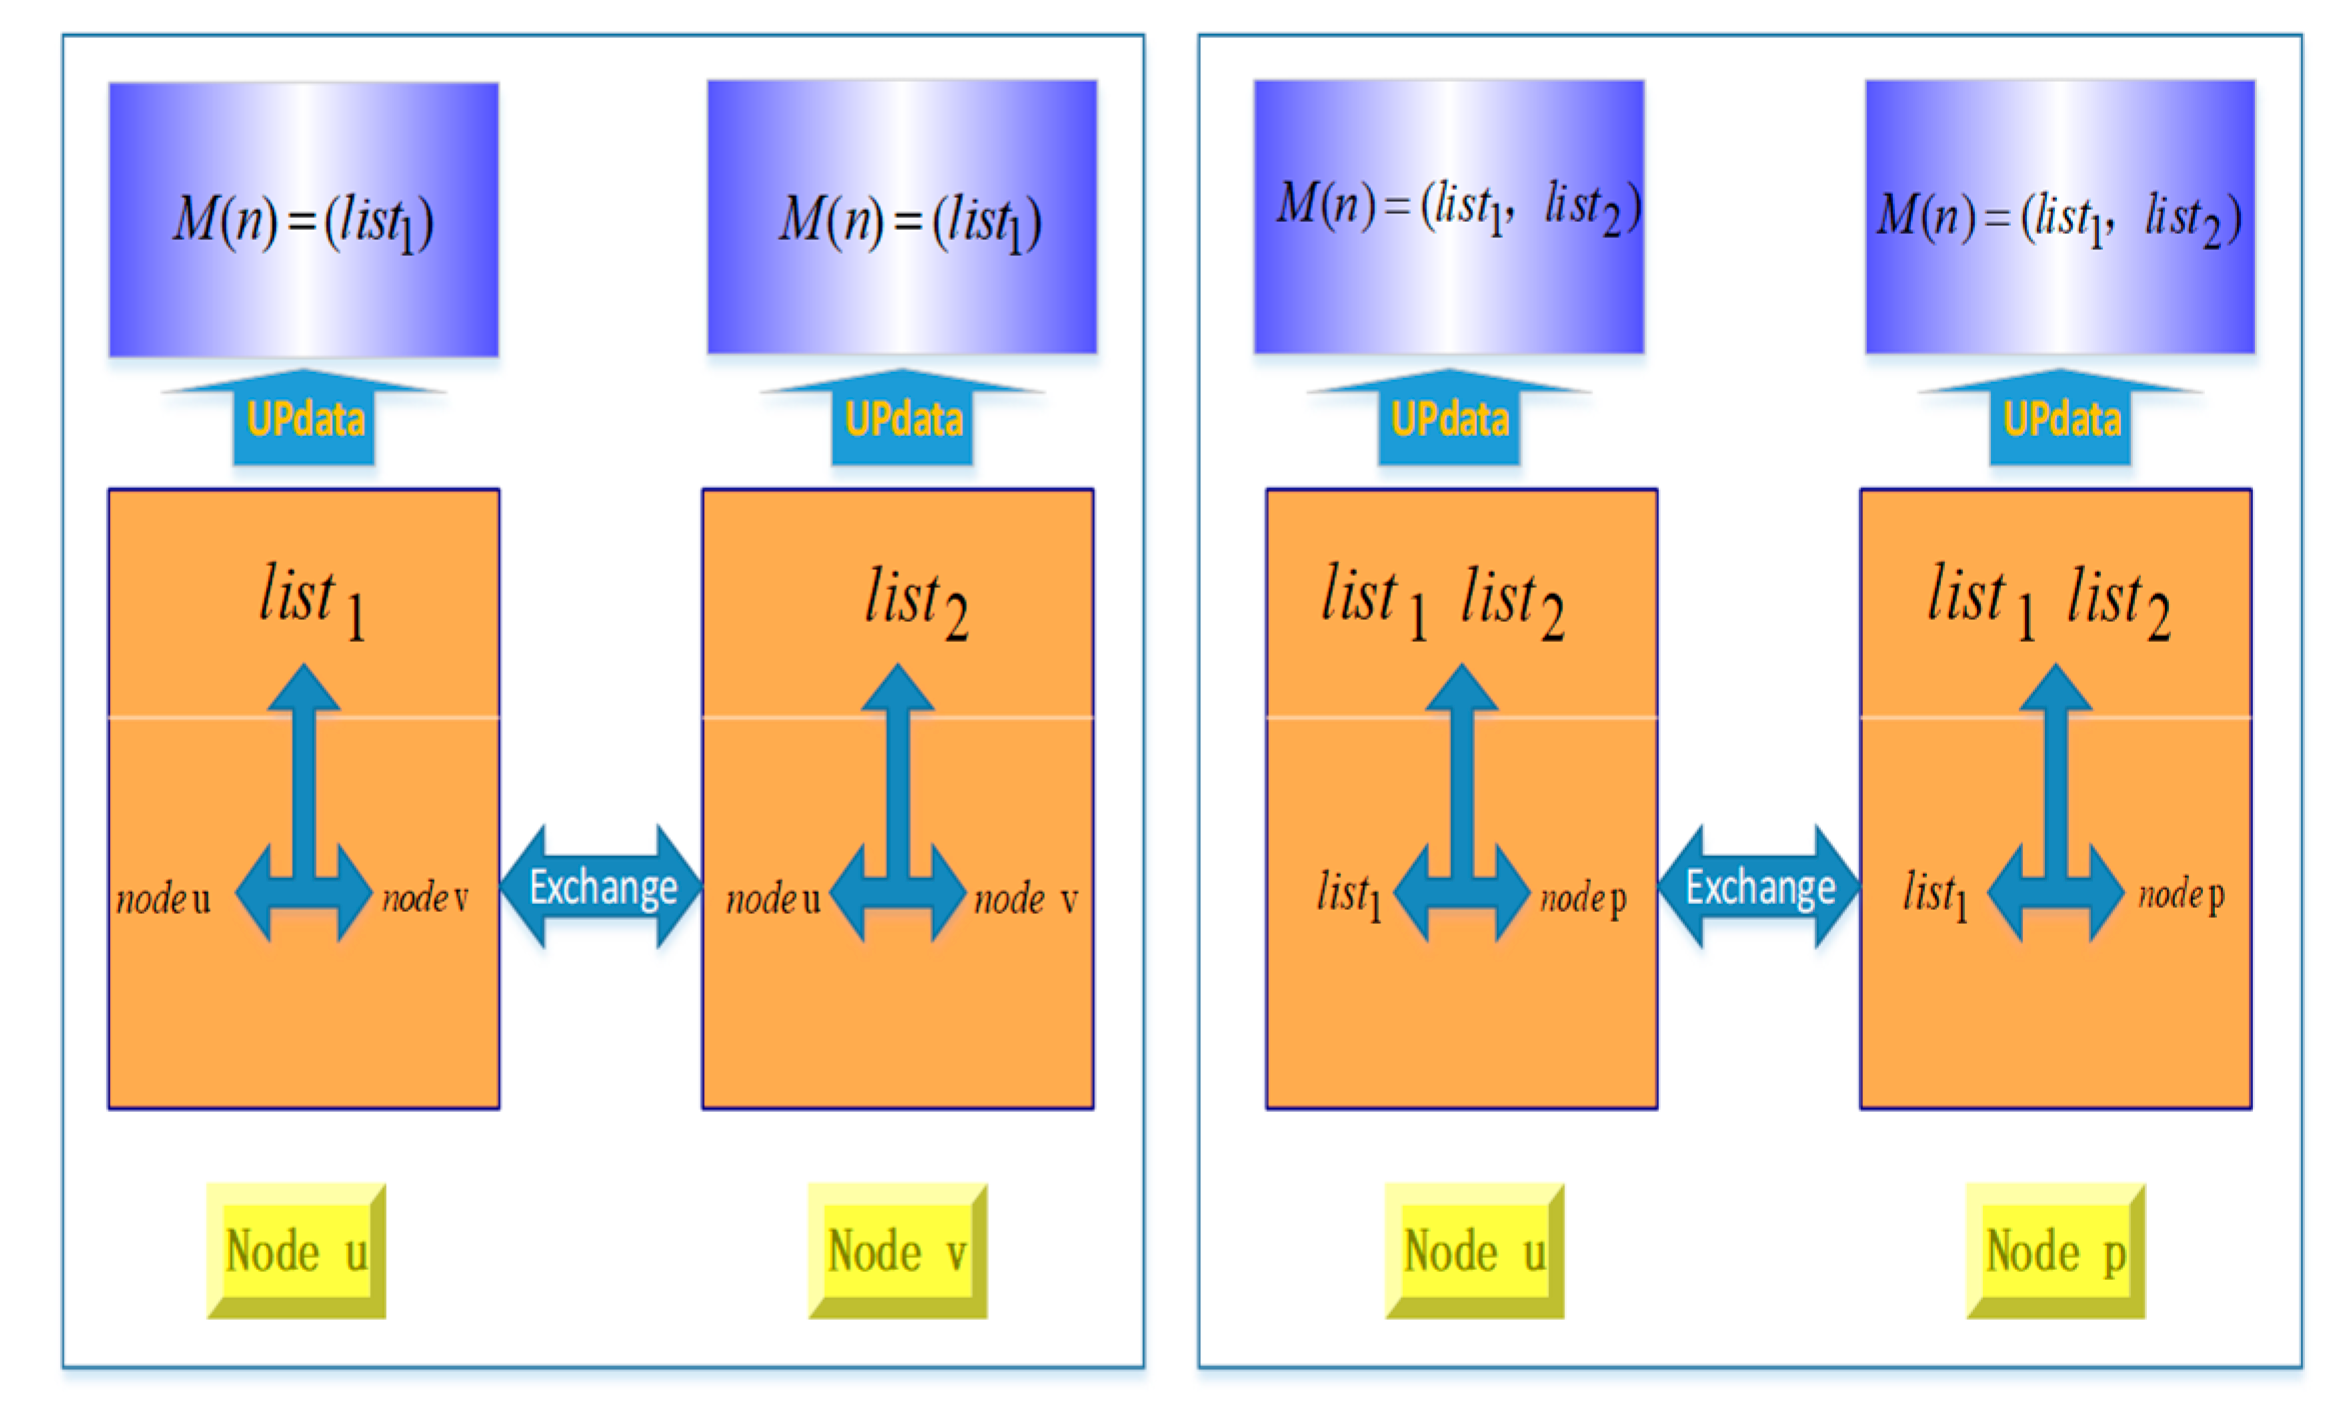
3.1.2. Information Updating between Mobile Nodes

This method contains a process of information update during the information collection phase. During the time period of the movement of the opportunistic network node, when the two nodes meet, we let the two nodes exchange information with each other. During a period of time, there will be constant nodes meeting and exchanging information between them. Finally, a mass of information network will be generated to provide support for the subsequent transmission strategy algorithms.
* l i s t _ n u m = ( l i s t n o d e 1 , l i s t n o d e 2 l i s t n o d e n )
Each node will meet many other nodes in a time period Δ t . Each time they meet another node, they exchange information between them. Finally, this node will contain information about many other nodes. Next, we will carry out a detailed explanation of the whole process from acquisition to update by information exchange between node u and node v. As in Equation (3) below, when node u encounters node v, exchange information generation matrix M ( n ) between two nodes.
l i s t ( u ) < < = > > l i s t ( v ) = ( m _ t r a c k n o d e u , m _ t r a c k n o d e v , a t t n o d e u , a t t n o d e v , * l i s t _ n u m )
M ( n ) = ( l i s t 1 , l i s t 2 l i s t n )
As shown in Figure 1, the process of information collection and update is performed by data exchange among mobile nodes in opportunistic social networks. To be specific, in the time T1, nodes u and v are in the same communication area, and they share their own list of information sequence with each other. On the one hand, the node u establishes the status sequence l i s t 1 by combining its own list of information sequence and the list of information sequence obtained from the node v; on the other hand, the node v constructs the status sequence l i s t 2 in the same way. Combining the two status sequences l i s t 1 and l i s t 2 , the set matrix M ( n ) could be determined in the time T1. With each node moves around in the communication area, at the time T2, the nodes u and p are in the same community area. Then, node u shares the set matrix M ( n ) with the node p and the node p sends its own list of information sequence to the node u. After that, the new set matrix M ( n ) , which consists of l i s t 1 , l i s t 2 and l i s t 2 , can be determined in the time T2. Based on that, each node in opportunistic social networks constantly collects information from its encountered nodes and updates the set matrix M ( n ) , which aims at establishing a uniform and regular data set in the cache spaces of each node. After that, each mobile node in opportunistic social networks accesses to the next phase, and starts to make message delivery decisions via the social and mobile information related to the network routing state.
Through the inter-community message transmission strategy, the opportunistic social networks select the nodes with large social relationships in each community as the intermediate nodes; and sends the message to the community where the destination node is located to realize the message transmission process across the community. The node must have the movement of the node during the transmission process, and the node movement information also serves as a kind of social attribute. Selecting the mobile similarity of nodes in a relay node with high probability is an important basis for selection. The mobile and social similarities of mobile nodes in opportunistic social networks will be computed by the latest set matrix M ( n ) , and message carriers or source nodes select suitable relay nodes from their neighbors based on the mobile and social similarities of mobile nodes in the same communication area.

3.2. Calculating Mobile Similarity of Node and Narrowing the Node Range by a Single Threshold

In our proposed algorithm, the attributes related to node movement are fully utilized and calculated from two aspects. The neighbor nodes in the opportunistic social network are relative to the transmission distance or the number of transmission hops. On the one hand, we can judge the similarity between two nodes by judging how many common neighbor nodes exist between nodes. According to the mobility of nodes, we judge the movement between nodes by the common neighbor nodes between nodes’ similarity. On the other hand, we collect the position of the moving track of the node and its moving state at the time of information collection. The purpose is to judge the mobile similarity by calculating the similarity of the moving track during the information collection phase.

3.2.1. Computation of the Mobile between Nodes

A:Calculating mobile similarity by the number of neighbor nodes
The closer the social relationships between nodes in the network, the greater the chance that they will meet later. The neighbor nodes are relative to the transmission distance or the number of transmission hops. We judge the moving similarity of the nodes by the number of common neighbor nodes between the nodes. As shown in Figure 2, after a time Δ t , the node u and the node v move from the left side of Figure 2 to other positions, and the neighbor nodes included are different, and the number of neighbor nodes is also different. Node u and node v contain a common neighbor node. After time Δ t , the number of common neighbor nodes and neighbor nodes is different. The left side is the communication range of time t 1 node u and node v, and the right side is the communication range of time t 2 node u and node v.
The similarity between nodes is related to the number of common neighbor nodes. When there are more common neighbor nodes between two nodes, the closer the relationship between the two nodes is, the higher the similarity between the two nodes is. Therefore, when the node is at rest, the similarity between the nodes calculated by the number of neighbor nodes can be calculated by the number of common neighbor nodes accounting for the total number of neighbor nodes:
N _ s i m i l a r i t y s t a t i c ( n o d e u ,   n o d e v ) = [ Q u Q v ] [ Q u Q v ]
where the static similarity of node u and node v is calculated, Q u represents the neighbor node of node u, Q v represents the neighbor node of node.
The mobile similarity of neighbor nodes is also related to the number of corresponding neighbor nodes. After the elapse of time A, if the number of co-neighbor nodes between nodes increases, the similarity between nodes increases. Conversely, when the common neighbor nodes are less than before, the similarity is reduced. Therefore, we can use Equation (6) as the calculation of node moving similarity:
N _ s i m i l a r i t y m o v i n g ( n o d e u   , n o d e v ) = [ ( Q u Q v ) ( Q u Q v ) ] [ ( Q u Q v ) ]
where Q u represents the neighbor node after the time u passes the time Δ t , and Q v represents the neighbor node after the time Δ t of the node v.
The combination of static node similarity and dynamic node similarity is collectively referred to as node moving similarity, denoted as N _ s i m i l a r i t y .
N _ s i m i l a r i t y = α N _ s i m i l a r i t y s t a t i c + β N _ s i m i l a r i t y m o v i n g
where α and β are correlation coefficients of node similarity and α + β = 1.
B: Calculating the mobile similarity of a node by its historical movement trajectory
The position of the moving track of the node and its moving state are collected at the time of information collection, which aims to judge the moving similarity of the moving track by calculating the similarity of the moving track during a period of time. In general, the more similar the movement trajectory of two nodes in the network, the higher the success rate of message forwarding. Therefore, we will use the time of node trajectory motion and its communication area to work together. During the node information collection process, we collect the movement trajectory state m _ t r a c k n o d e of the node, which contains the set of motion positions of the node and the set of movement states at time t.
At the same time, we use this information as input to calculate the mobile similarity of the node. First, in the real scene, the state of the nodes may be different in different periods. For example, when people travel from home to the company, they should be given more weight. At the same time, when people move in a space for a long time, such as working status, the weight should be set smaller. According to the formula 8, we can calculate the mobile similarity of the nodes:
M _ s i m i l a r i t y ( n o d e u , n o d e v ) = i = 1 n ( u ) j = 1 n ( v ) λ ( Δ t | f t i ( u ) f t j ( v ) | ) ( μ ( s i ( u ) , s j ( v ) ) ) i = 1 n ( u ) j = 1 n ( v ) λ ( Δ t | f t i ( u ) f t j ( v ) | )
where λ is the weight of different periods, i, j represents the sequence of nodes, s represents the communication area, f t i ( u ) represents the first communication time of node u, f t i ( u ) f t j ( v ) represents the time interval between nodes, and μ ( s i ( u ) , s j ( v ) ) represents the position similarity between node u and node v.

3.2.2. Reducing Node Range by Setting Threshold

By setting a single threshold, nodes with a node similarity value higher than the threshold are left, and nodes with a node similarity value lower that the threshold are deleted. First, we will combine the result values of the similarity of two nodes and combine them with appropriate weights to get M N S :
M N S = δ N _ s i m i l a r i t y + μ M _ s i m i l a r i t y
Q l e a v e = Q [ Q M S N > M S ~ ]
M N S is the value of the node similarity of each node, Q l e a v e represents the remaining node, Q M S N represents the M N S value of the node, and T h r e s h o l d is the experimentally calculated threshold. From experiment, we set the appropriate threshold to narrow the node range. The purpose of this operation is to first calculate the attribute distance for the next step of the model. If all nodes are calculated, then the workload will be very large, and the system processing will be hindered. Secondly, for nodes with too low node similarity, its message forwarding success rate is also very small. Therefore, we will eliminate these nodes in advance, which will make the system more efficient.

3.3. Calculating the Social Similarity between Mobile Nodes in the Networks

The social attribute of a node is a collection of various attributes owned by the node, such as age, place of residence, and so on. The social attribute of a node is an important criterion for judging whether a node can become a reliable relay node. Therefore, we can rely on the social attributes between computing nodes to select a reliable relay node. Therefore, we propose a clustering algorithm to calculate the distance of social attributes between nodes. This mechanism collects some of the social attributes of the nodes in the node information collection phase. Therefore, the input could be computed as:
S _ a t t r u = ( s _ a t t r u 1 ; s _ a t t r u 2 ; ; s _ a t t r u n )
S _ a t t r v = ( s _ a t t r v 1 ; s _ a t t r v 2 ; ; s _ a t t r v n )
where S _ a t t r u and S _ a t t r v are the attribute sets of the node u and the destination node v. S _ a t t r u represents attribute classes such as occupation, place of residence, hobbies, etc.
In opportunistic social networks, the attribute distance of the compute node is generally the Minkowski distance [34], as shown in Equation (1):
D i s t m k ( S _ a t t r u , S _ a t t r v ) = ( i = 1 n | S _ a t t r u i S _ a t t r v i | p ) 1 p
where A is the social attribute distance of the node u and the node v calculated by the Minkowski distance. The value of P is 1 or 2. When p is 1, the formula is the Manhattan distance. When P is 2, the formula is the Euclidean distance, n is the number of sample clusters.
The social attributes of nodes in the opportunistic social networks are not all continuous, and even most of the social attributes are discrete, such as occupation, gender, and so on. The Minkowski distance can only be used for continuous attributes, so the VDM (Value Difference metric) could be used in this approach:
V D M p ( a , b ) = i = 1 k | m S _ a t t r , a , i m S _ a t t r , a m S _ a t t r , b , i m S _ a t t r , b | p
where V D M p ( a , b ) is the distance in the attribute S _ a t t r calculated by the V D M distance m S _ a t t r , a is the number of samples taking the value a on the node attribute S _ a t t r , and m S _ a t t r , a , i is the number of samples taking the value a on the node attribute S _ a t t r in the i-th sample cluster, k is the number of sample clusters.
Finally, we combine the continuous attributes between nodes with discrete attributes, which combines two distance algorithms to handle mixed attributes. When our attribute has n c continuous attribute and n n c discrete attributes, we arrange the continuous attributes in the node in front of the discrete attribute. The formula for handling mixed properties could be expressed as:
M i n k _ V D M p ( S _ a t t r u , S _ a t t r v ) = ( i = 1 n c | S _ a t t r u i S _ a t t r v i | p + i = n c + 1 n V D M p ( S _ a t t r u i , S _ a t t r v i ) ) 1 p
By calculating the social attribute distance of the node, we can get the distance of the social attribute between each two nodes. According to the principle that the larger the distance is, the smaller the similarity is, we can find the most suitable relay node. In the above formula, the social attributes we set do not have weights. If the importance of different attributes in the nodes is different, we will use the "weighted distance" to calculate the attribute distance between the nodes. Then, we use a method based on information gain ratio to determine the weight distribution of each social attribute. We will analyze this process in detail.
First, information entropy is a value that evaluates the purity of a sample index. Therefore, we can calculate the information entropy by the following formula:
I n f o _ e n t r ( D _ s e t ) = c a t e = 1 2 ( P o r c a t e log 2 ( P o r c a t e ) )
where I n f o _ e n t r ( D _ s e t ) represents the information entropy of the sample data set, D _ s e t is the sample data set. Given that the proportion of the c a t e category is P o r c a t e , and when c a t e is 1, the value is larger.
Next, the information gain ratio is used to measure the index of the best attribute classification, and the calculation formula of the information can be determined as the Equations (17)–(19). The information gain ratio is obtained by the ratio of the information gain to the internal value. The greater the information gain, the higher the purity of the attribute. The internal value represents the more possible values of the attribute, the larger the internal value. The resulting weight is calculated by the weight ratio of the information gain ratio.
I n f o _ g r ( D _ s e t , a t t r i ) = I n f o _ g a i n ( D _ s e t , a t t r i ) I n t r _ v a l u e ( a t t r i )
where I n f o _ g r ( D _ s e t , a t t r i ) is the information gain ratio, I n f o _ g a i n ( D _ s e t , a t t r i ) represents the information gain, and I n t r _ v a l u e ( a t t r i ) denotes the internal value.
I n f o _ g a i n ( D _ s e t , a t t r i ) = I n f o _ e n t r ( D _ s e t ) v = 1 V D _ s e t v D _ s e t n f o _ e n t r ( D _ s e t v )
I n t r _ v a l u e ( a t t r i ) = v = 1 V | D _ s e t v | | D _ s e t | log 2 ( | D _ s e t v | | D _ s e t | )
Then, we need to divide the sample of the attribute by evaluating the data set, so the branch formed by our segmentation is denoted as v.
w i = I n f o _ g r ( D _ s e t , a t t r i ) d i = 1 d I n f o _ g r ( D _ s e t , a t t r i )
The final weight calculation is to determine the weight of each social attribute by the proportion of the information gain ratio. The higher the information gain ratio, the greater the weight of the social attribute.
If the importance of different attributes in the node is different, we will use the “weighted distance” to calculate the attribute distance between the nodes. The formula is as follows:
W e i g _ M i n k V ( S _ a t t r u , S _ a t t r v ) = ( w 1 | S _ a t t r u 1 S _ a t t r v 1 | p + + w n c | S _ a t t r u n c S _ a t t r v n c | p + w n c + 1 V D M p ( S _ a t t r u n c + 1 , S _ a t t r v n c + 1 ) + + w n V D M p ( S _ a t t r u n , S _ a t t r v n ) ) 1 p
where W e i g _ M i n k V ( S _ a t t r u , S _ a t t r v ) represents the use of “weighted distance” to calculate the attribute distance between nodes, and w 1 , w 2 , …, w n is the weight corresponding to each social attribute.

3.4. Message Forwarding Strategy in Social Opportunity Networks

In the previous section, we described the process of selecting the appropriate relay node. From the first step, this mechanism collects the information of the nodes in the network, calculates the similarity between the nodes through the neighbor nodes and the moving trajectory, and narrows the range of the nodes by a single threshold. The message forwarding strategy of the traditional opportunistic social networks is basically that the source node carries the message, and searches for a relay node with a large forwarding and forwarding probability to forward the message.
The message carrier selects a message forwarding preference, which is usually judged by the social similarity of a pair of nodes; and selects a suitable node for message forwarding. However, the message forwarding strategy proposed by us here is different. When we calculate the social attribute distance between all nodes and the destination node, according to the larger the distance and the smaller the similarity, we not only seek a node with the smallest distance as the node with the smallest distance. Our approach is to average the social attribute distances of all compute nodes, and then use nodes with social attribute distances below the mean as relay nodes. The main purpose of this is to be afraid of carrying lost messages and a friendlier transmission between communities.
As shown in Figure 3, which is a model diagram of a message forwarding policy in a social opportunity network, three circles are respectively communication ranges of nodes that carry messages differently at three times. At time t 1 , the message carrying node forwards the message to nodes B and C whose social attributes are below average. At time t 2 , node B moves to another communication area, and the message is forwarded to nodes D and E. At time t 3 , node E moves to the communication area containing the destination node, and finally transmits the message to the destination node. W _ M ( S A , S B ) represents the social attribute distance between node A and node B. The blue node indicates that the social attribute distance between nodes is greater than the average distance. Green indicates that the social attribute distance between the two nodes is less than the average distance, so the message is forwarded to the green node in the figure.
A v g n o d e = 1 n i = 1 n W e i g _ M i n k V ( S _ a t t r u , S _ a t t r i )
where A v g n o d e represents the social attribute distance of the average node, and W e i g _ M i n k V ( S _ a t t r u , S _ a t t r i ) represents the social attribute distance between the node u and other nodes.

3.5. Complexity Analysis of this Algorithm

In summary, we propose an algorithm that utilizes an efficient data transmission strategy for mobile and social similarity in opportunistic social networks. To improve the understanding of the algorithm, the general steps of data transmission in the MSSN algorithm are divided into the following four steps:
  • In the information gathering stage of the algorithm, we build a sequence of information by preparing the data information collection and update in the previous stage, which contains the data information needed later. In order to provide accurate and timely data, our information sequence needs to be constantly integrated integration.
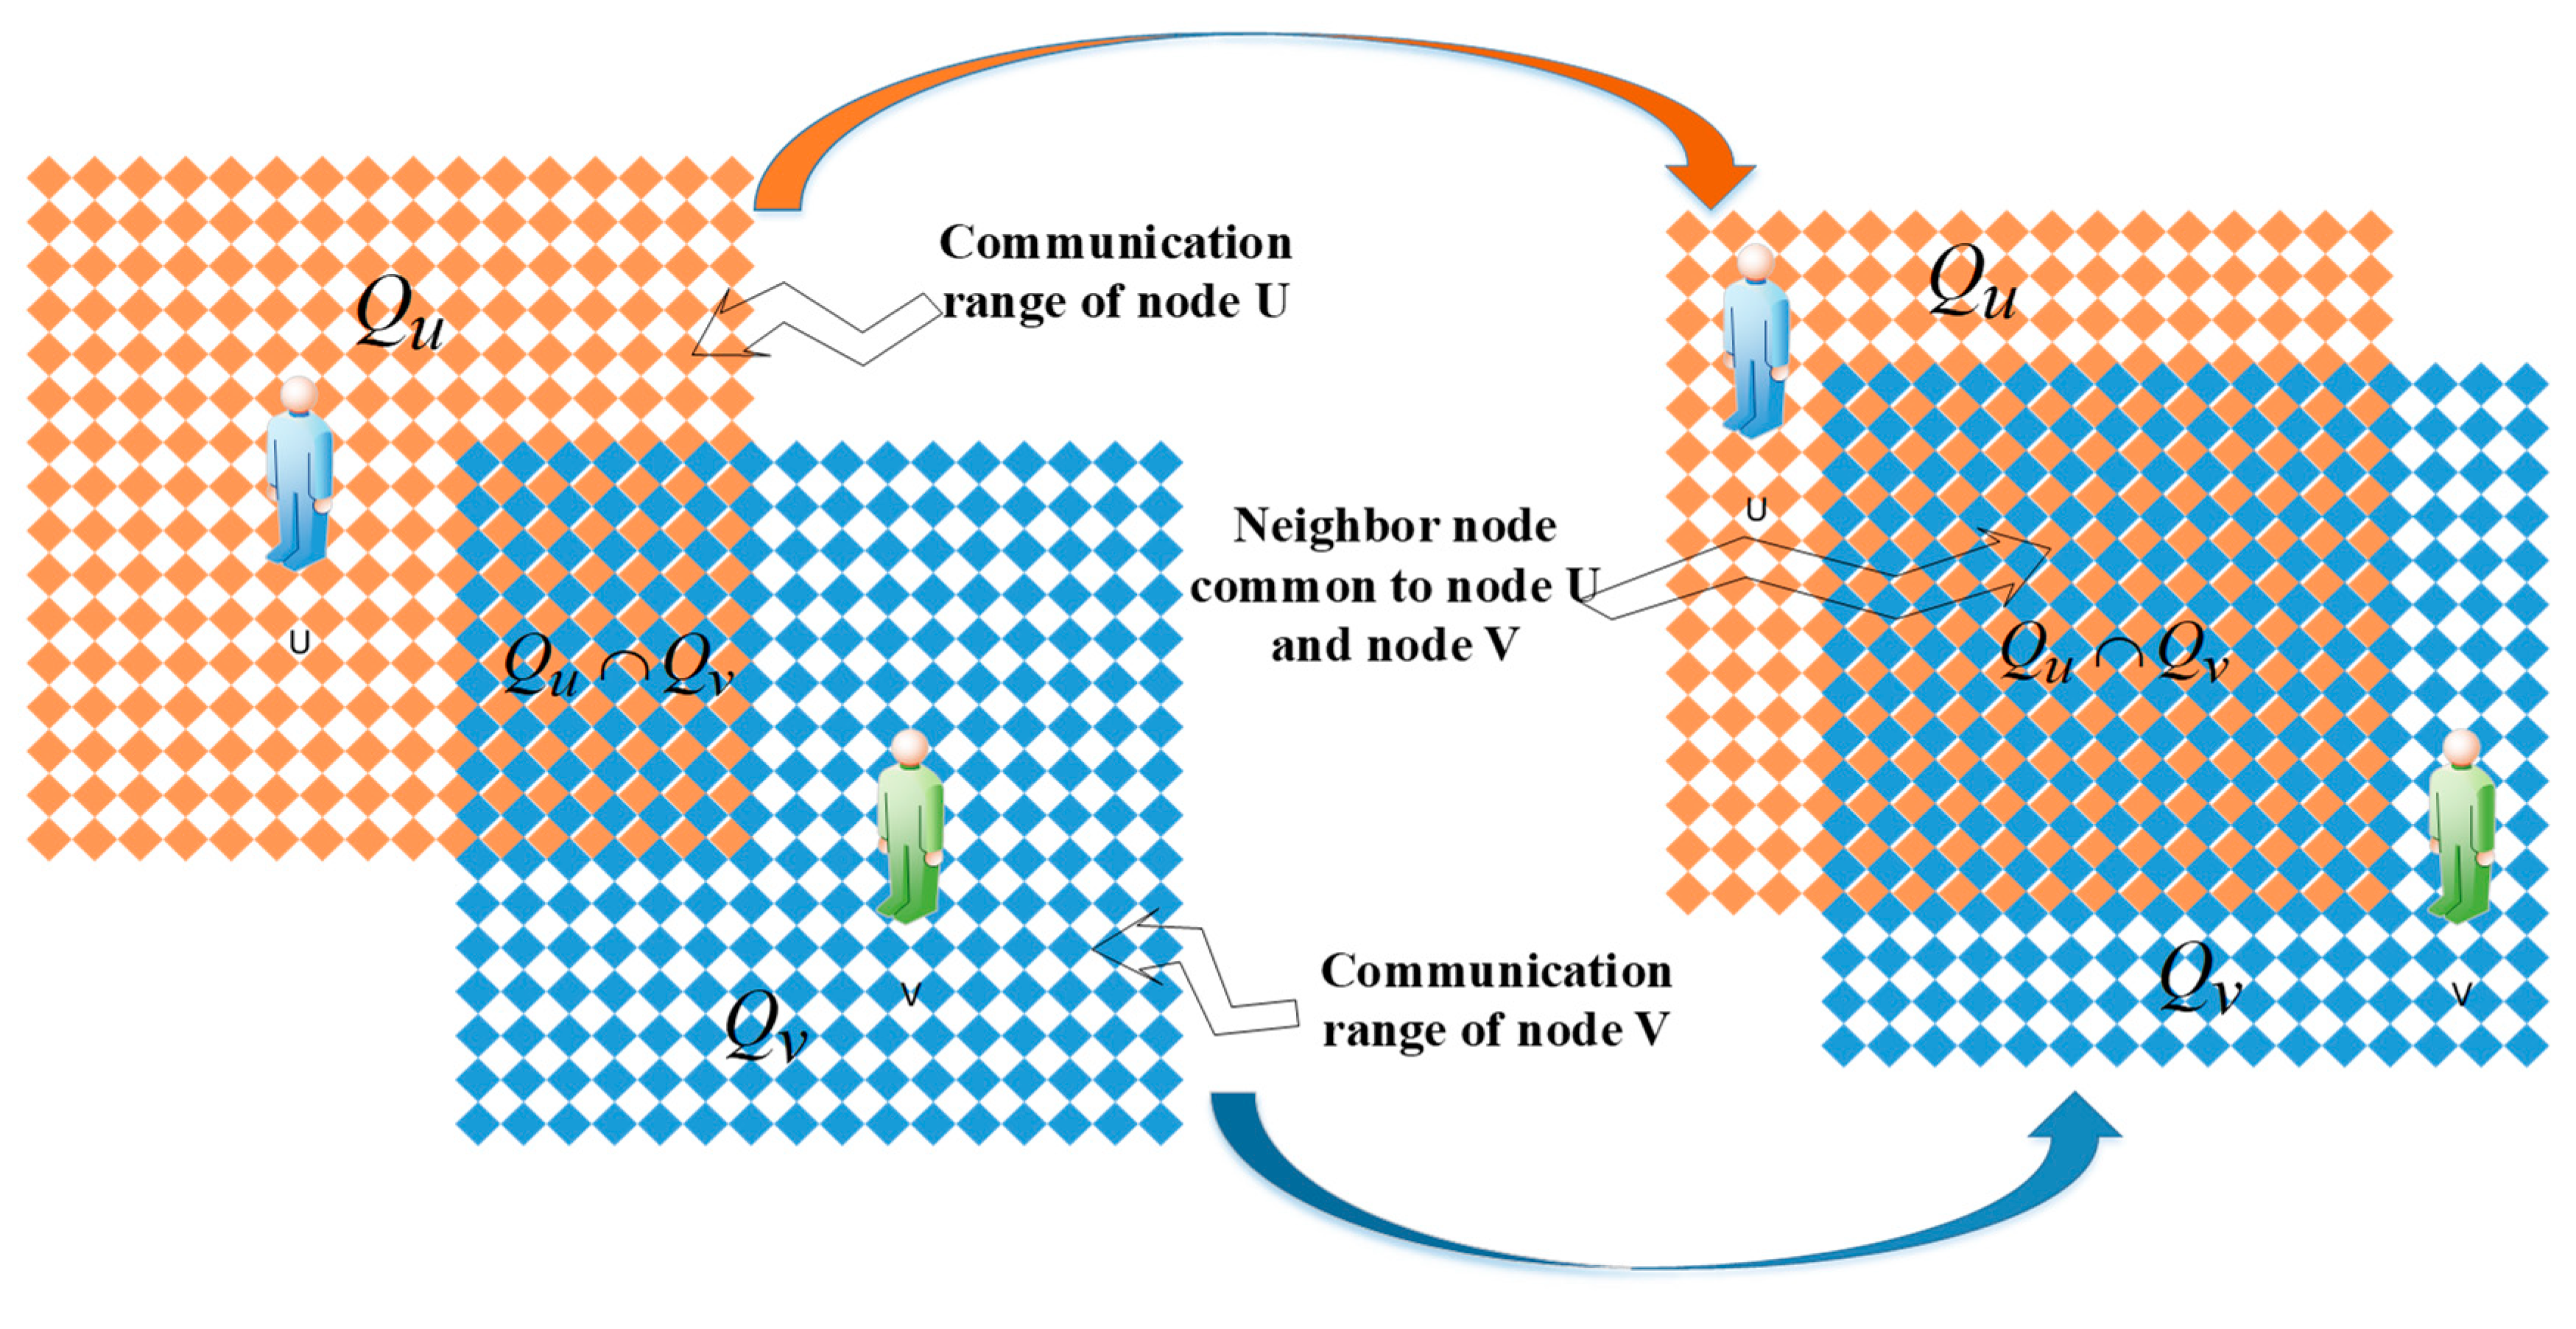
  • Secondly, based on the collected information sequence, the mobile node’s mobile similarity is calculated by the neighbor nodes of the node and the movement trajectory of the node. Then, the node range is reduced by a single threshold, leaving nodes with similar similarity and deleting nodes with similar similarity.
  • In the algorithm, we calculate the distance between social attributes by the Minkowski distance and VDM distance in the clustering algorithm. According to the larger the distance, the smaller the similarity between social attributes, mark each node.
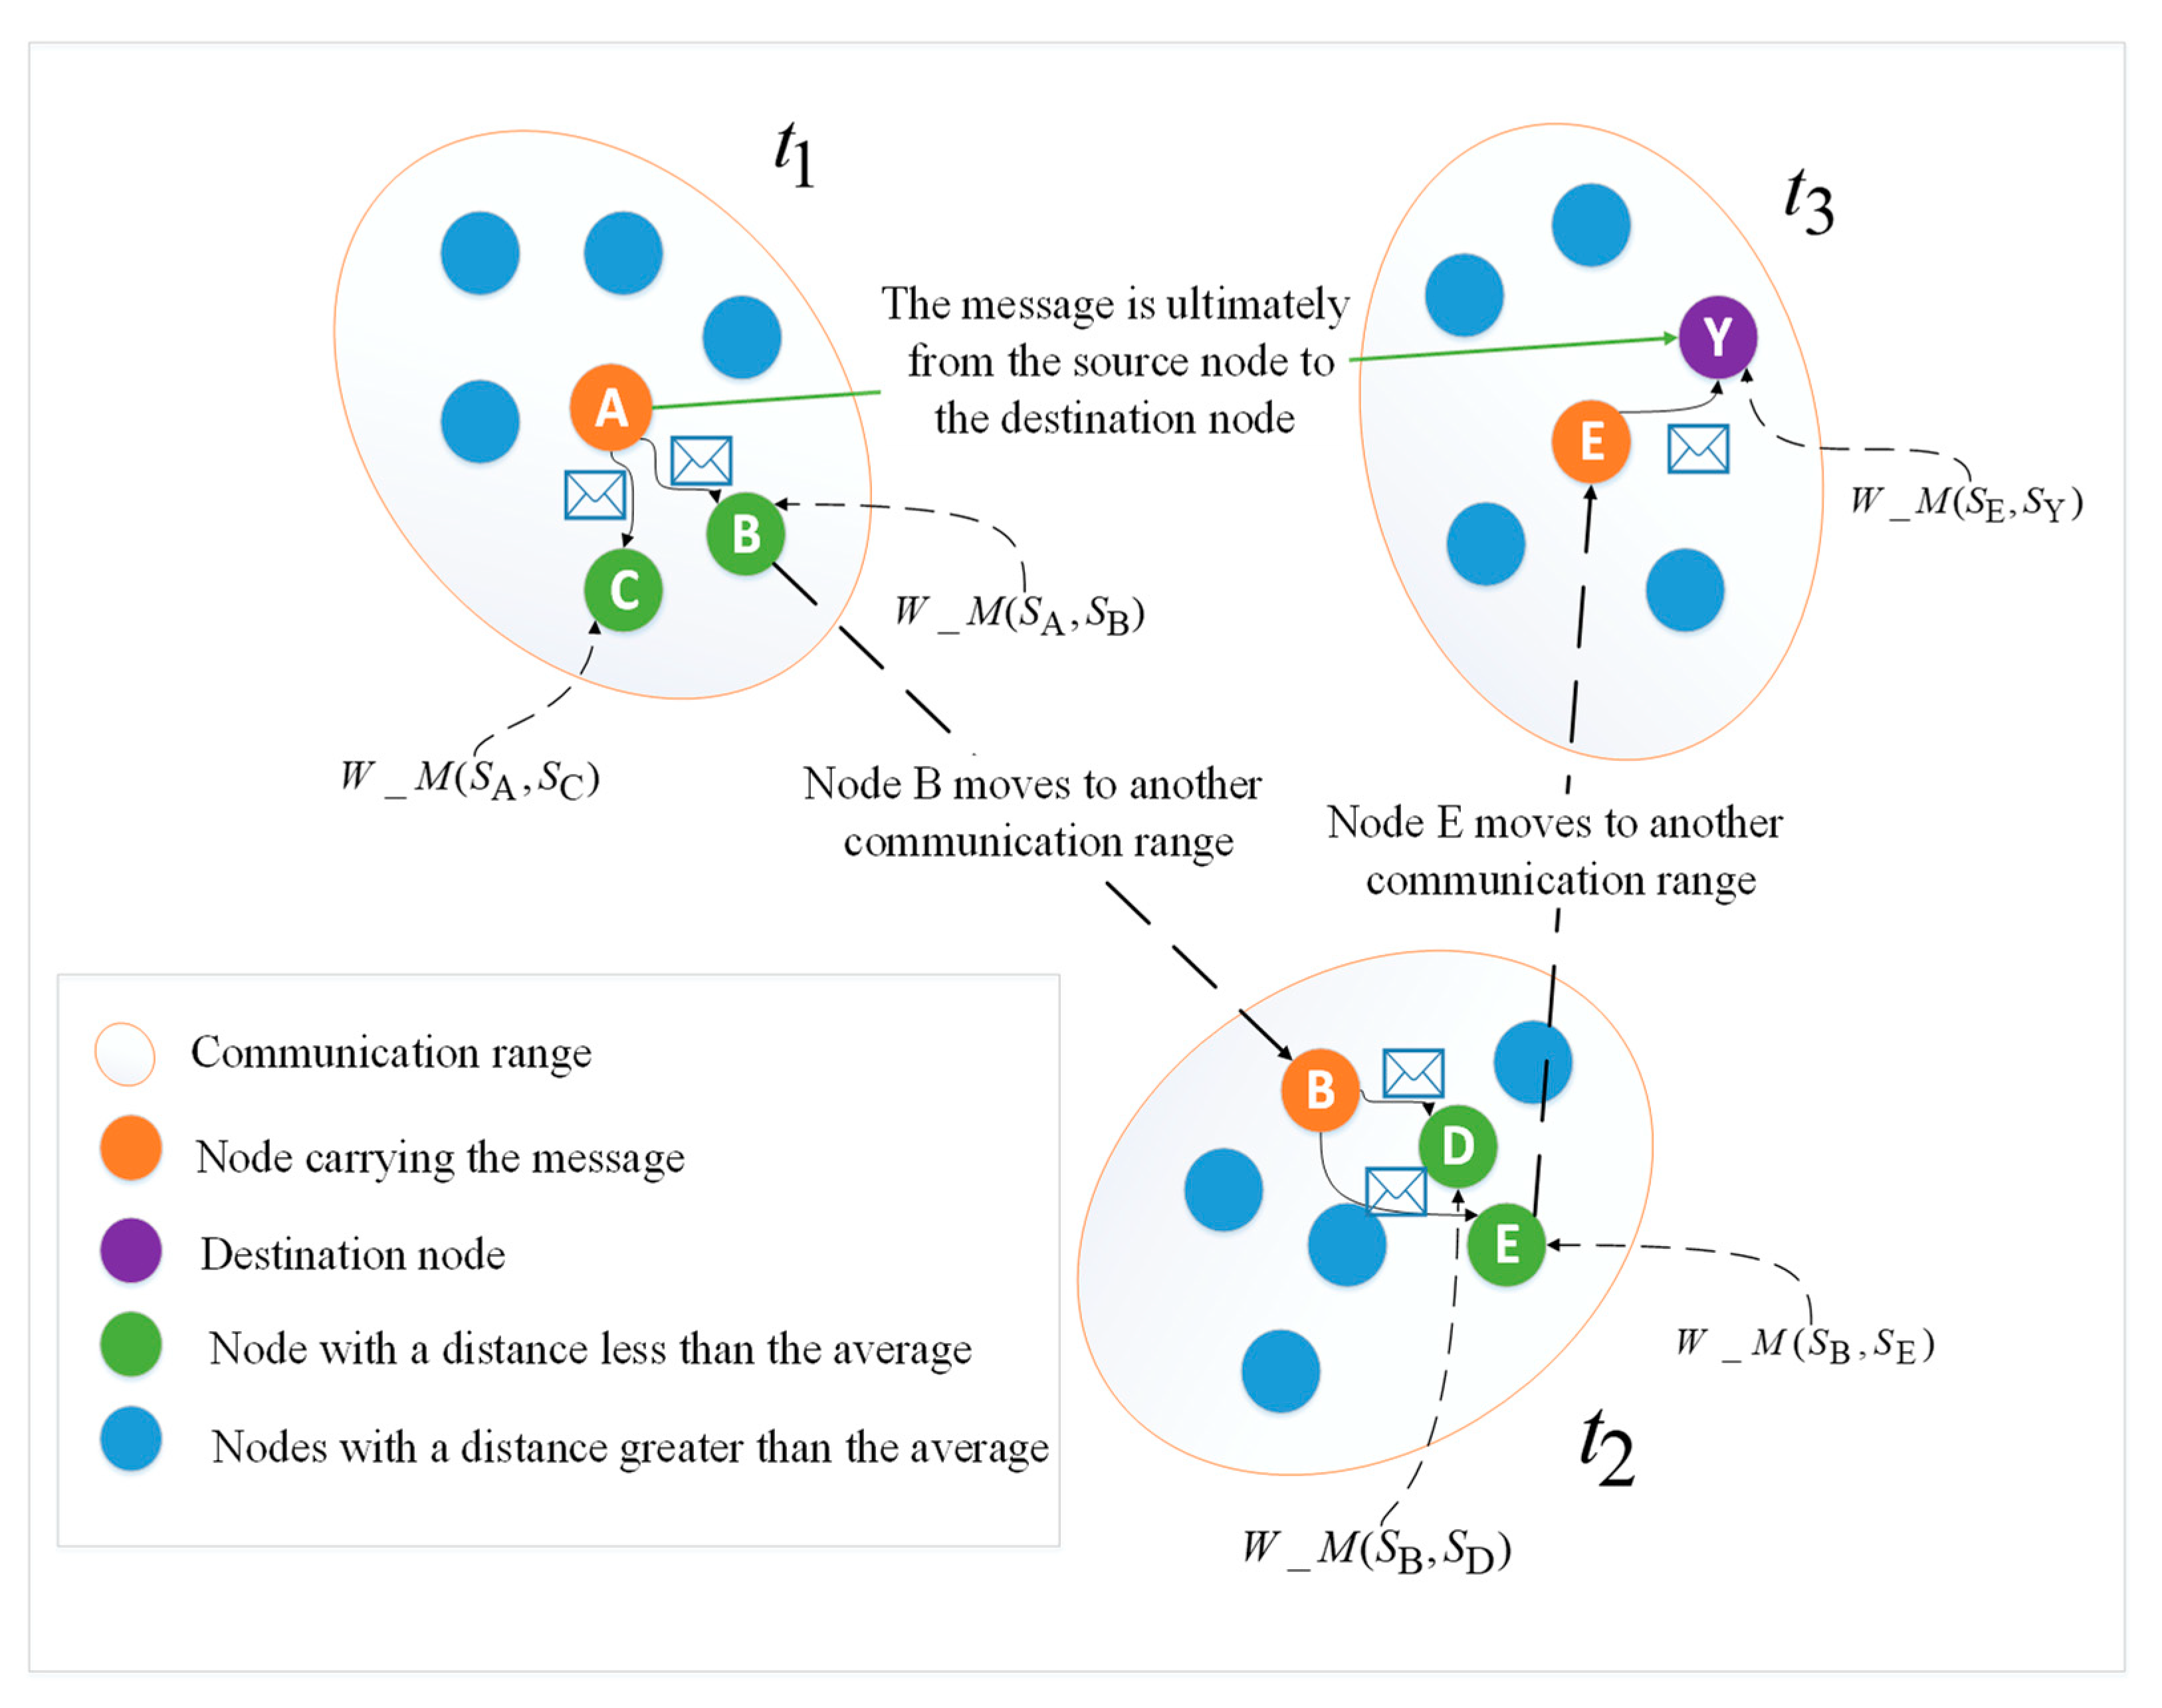
  • Finally, we take the appropriate relay node by the average method, calculate the average value by the distance of the social attribute, and take the node below the average value as the relay node. The purpose of this is that the message is not easy to be lost. Through this mechanism, the security and continuity of the message transmission of the opportunistic social networks is guaranteed.
According to the four steps mentioned above, in the preparation phase, each node should update the encounter state matrix in time, in addition to sharing its own state sequence. The time complexity of this phase is O ( log 2 n ) . The time complexity of computing node motion similarity and narrowing the node range by a single threshold is O ( n ) . The algorithm complexity related to the social attribute distance calculation between destination and neighbor nodes is O ( n ) . Finally, by taking the average of all distances, the distance node below the average is used as the relay node, and the time complexity of the process is O ( n ) . Through the rigorous analysis of each step, the overall time complexity of the MSSN algorithm is O ( n ) .
Algorithm: MSSN.
Input: Message carrier n o d e x and its neighbor nodes sequence < n o d e 1 , n o d e 2 , , n o d e n > And the encounter matrix M ( n ) of each node
Output: the relay node n o d e m
Begin
Node classification:
For ( a = 1 ; a n ; a + + )
  If ( n o d e a and n o d e b meet);
  Collect and update matrix M ( n ) ;
End for
 Matrix M ( n ) gets a complete update, obtaining the relationship matrix of all nodes and the corresponding number of nodes:
For (i = 1; i < = n; i++)
  Calculating the mobile similarity of nodes:
   M N S = δ N _ s i m i l a r i t y + μ M _ s i m i l a r i t y ;
  If ( Q M S N > T h r e s h o l d ) then
   Reserve the node L;
  Else
   Delete the node D;
End for
For (i = 1; i < = n; i++)
  Calculating the social attribute distance of the remaining nodes
   W e i g _ M i n k V ( S _ a t t r u , S _ a t t r v )
End for
 Calculate the average of the distances between all nodes: A v g n o d e ;
For (i = 1; i < = n; i++)
  If ( W e i g _ M i n k V ( S _ a t t r u , S _ a t t r v ) < A v g n o d e ) then
   Output relay node n o d e m
End for
 Forwarding messages:
   n o d e x synthesizes all the calculation results to obtain the reliable relay node n o d e m ;
   n o d e x forwards the messages to n o d e m ;
End

4. Experiment and analysis

4.1. Simulation Parameters and Simulation Process

The experiment adopts Opportunistic Network Environment (ONE) simulation platform to evaluate the performance of MSSN data transmission strategy in real environment. In addition, we compare the MSSN routing algorithm with the following four algorithms: Spray and Wait [35], Epidemic [36], EIMST (Effective Information Transmission Based on Socialization Nodes) [37], and ICMT (Information Cache Management and Data Transmission Algorithm) [20]. “Spray and Wait” and Epidemic are traditional and typical algorithm, while the other two algorithms are the latest routing algorithms for opportunistic social networks.
In this simulation, the movement of all nodes within the communication area follows the MGMM movement model, the communication area is set to 4500   m   ×   3400 m, the total experiment time is 2–6 h. The initial energy for each node is 100 J, each node carries 20 data packets, and sending a packet consumes 0.25 J of energy. The speed value range of each node is 1–20 m/s, which may be the moving speed of pedestrians and vehicles. Besides, the number of mobile nodes in the original data set (Infocom5, Infocom6, Cambridge, and Intel) that this simulation obtained is shown in Table 1. Then, the number of mobile nodes in the four real datasets will be set to 100, 200, 300, 400, 500, 600, and 700 (shown as Table 2), because it is a vital factor that needs to be considered carefully in this experiment. Moreover, the cache space of each node is set to 30 MB and we define six different social attributes for each node, including interest, comment, occupation, preference, and workplace. Each social attribute contains several different eigenvalues, and each node is randomly assigned the eigenvalues on the corresponding social attribute.
Considering the algorithm’s requirement for attribute weights in this paper, the real dataset Infocom5, Infocom6, Cambridge, and Intel are most suitable for getting the influence of each social attribute of the node on the message transmission process. The datasets can be download from CRAWDAD, and the detailed information is shown in Table 1. After analyzing the social attributes of the datasets by using the information gain method in the MATLAB platform, the weight distribution of each social attributes of the node we selected is as shown in Figure 4. We find that the social attributes of “interest”, “occupation” play a more important role in the data transmission process. In addition, in the experiment, we set the mobility similarity threshold between the neighbor node and the destination node to 0.15, 0.25, 0.35, 0.45, 0.55, 0.65, 0.75 to test the performance of the algorithm under different thresholds. In order to improve the readability of the above experimental environment settings, we constructed the Table 2 to expound the environment of the simulation experiment.
The MSSN data transmission strategy is compared with the other four algorithms mentioned above to verify its performance. The experiment mainly focuses on the following parameters:
Delivery ratio: This metric represents the probability of the neighbor and target node getting the data packet during data transmission process. It can be computed by D n o d e = D r e c e i v e / D s e n d , where D r e c e i v e represents the number of messages that the destination node gets from the relay nodes, and D s e n d is the total number of messages forwarded by the rely nodes.
Overhead on average: This parameter represents the overhead of a successful message forward between a pair of nodes. It can be calculated by the Equation (23), where T t o t a l _ t i m e is the total time of data transmission, T s u c c e e d _ t i m e represents the total time it takes for the data to be successfully transmitted to the destination nodes.
O n o d e = T t o t a l _ t i m e T s u c c e e d _ t i m e T t o t a l _ t i m e
Average end-to-end delay: This parameter is the average delay of routing selection, waiting for messages, node mobility, and message forwarding. It can be calculated as ω d e l = ω s u m / σ n o d e , where ω s u m is the total delay of data transmission from source nodes to destinations. σ n o d e represents the total number of nodes that successfully obtain the message.

4.2. Simulation Result Analysis

As demonstrated in Table 3, the average delivery ratio from MSNN increases by 15%, 60%, 7% and 6% as compared with those from spray and wait, Epidemic, ICMT and EIMST, respectively. Alternatively, the average end-to-end delay from MSNN decreases by 90%, 75%, 67% and 50% as compared with those from spray and wait, Epidemic, ICMT and EIMST, respectively. Finally, the average network overhead from MSNN reduces by 68%, 44%, 24% and 13% compared with those from spray and wait, Epidemic, ICMT and EIMST, respectively. Overall, the MSNN algorithm is superior to other four approaches in terms of delivery ratio, average end-to-end delay and average network overhead.
This is because that the MSNN algorithm mainly divided into four continuous phases. First, to achieve the functional integrity of the algorithm, it is necessary for mobile nodes to acquire network routing state. Secondly, the mobile similarity of the nodes is calculated by the relationship among nodes. Thirdly, the retained nodes are selected by the clustering algorithm, and the distance between the Minkowski distance and the MVD distance is calculated, and the distance of the social attribute is calculated according to the social attribute. Finally, the relay node with the highest probability of message forwarding success is selected as suitable relay nodes in data dissemination process.

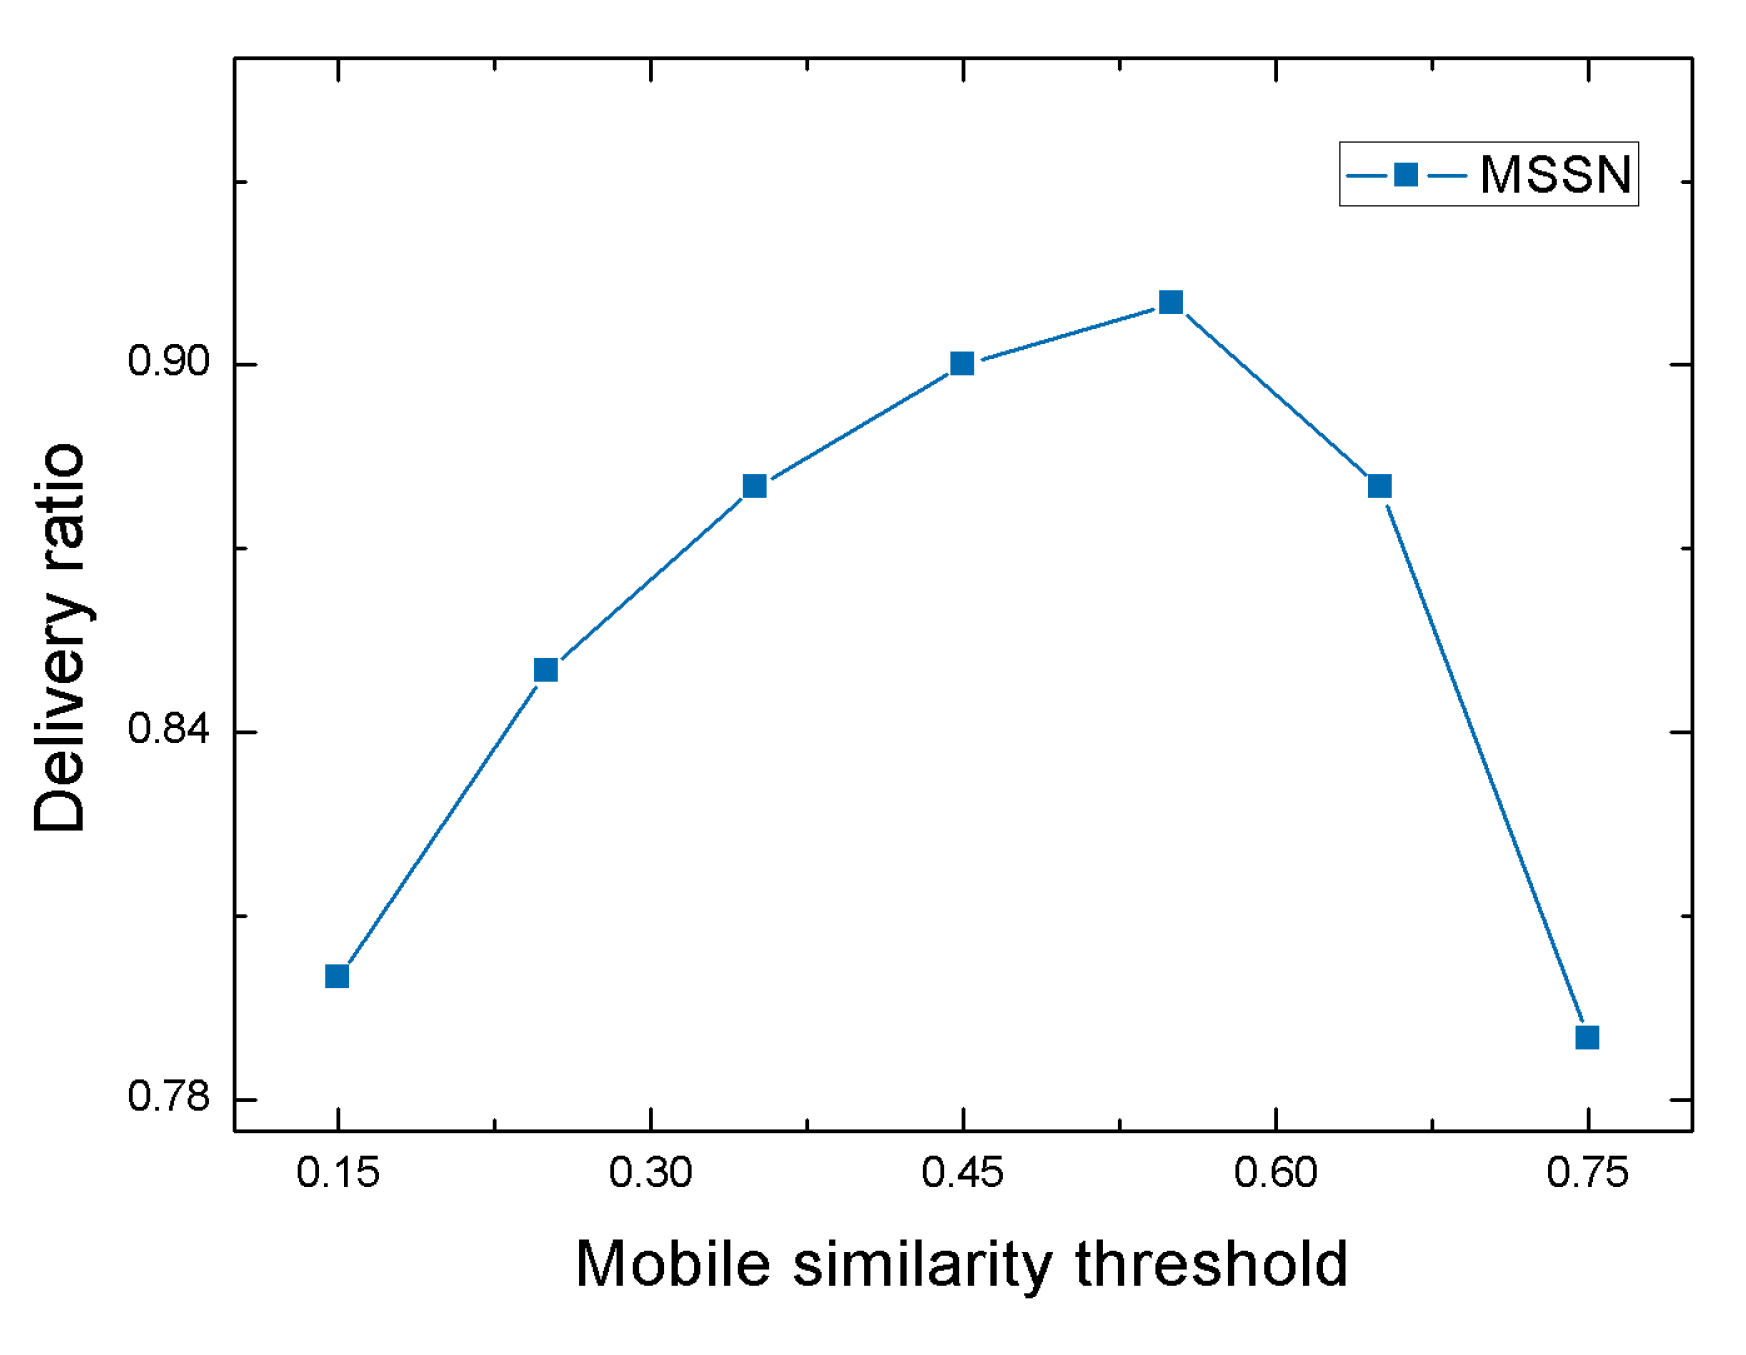
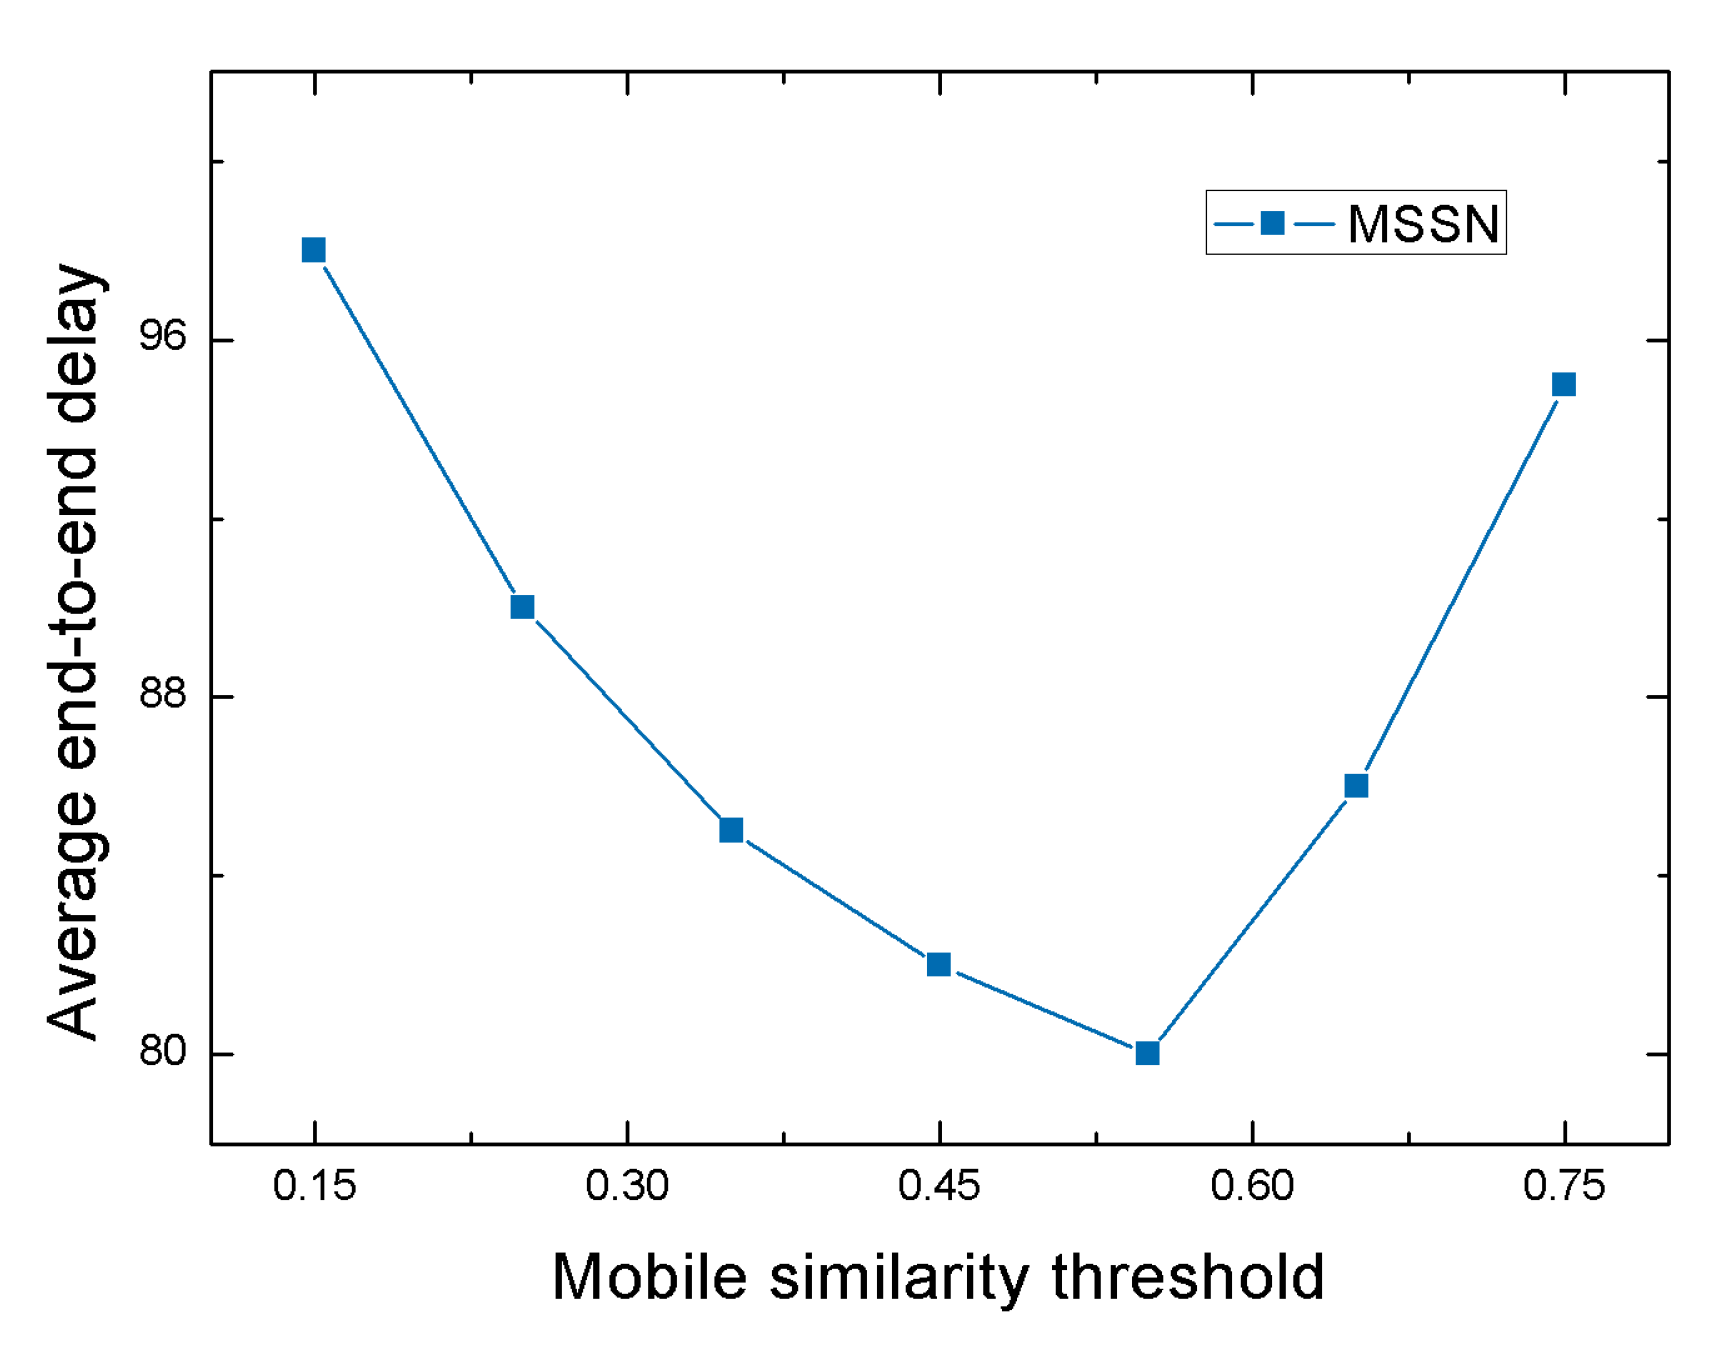
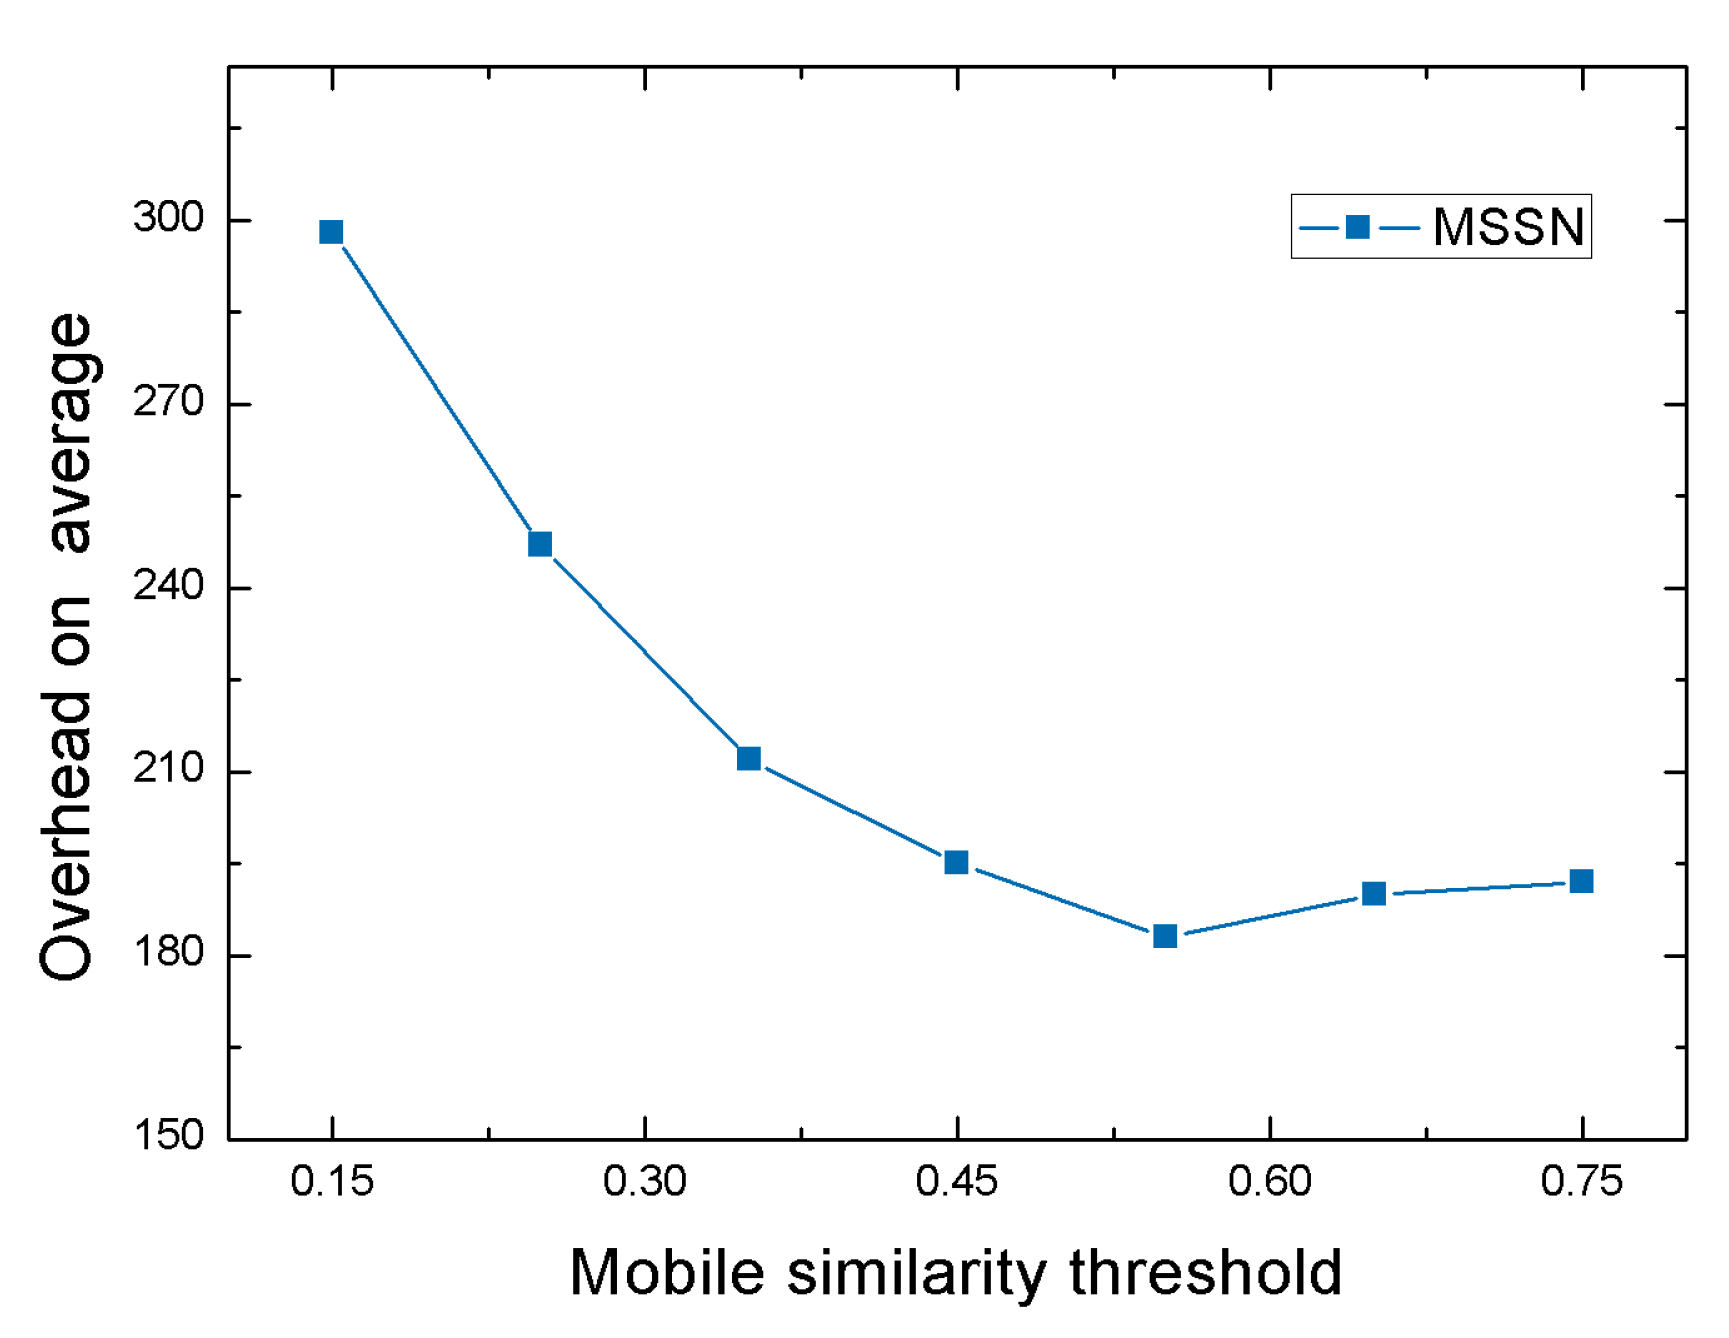
4.2.1. Performance of MSSN Algorithm under Different Mobile Similarity Thresholds

This section mainly describes the performance of the MSSN data transmission strategy under different mobile similarity thresholds. The purpose of setting the mobile similarity threshold is to reduce the number of neighbor nodes that perform the next step of calculating social similarity with the destination node, thereby reducing the calculation workload of the next step to reduce the delay and improving the reliability and accuracy of the obtained relay node. Therefore, the value of mobile similarity determines the range of relay nodes selected according to the node social similarity in the second step, which has a significant influence on the transmission performance of the MSSN algorithm. According to the simulation experiment results, when the mobile similarity threshold between the neighbor node and the destination node is set to 0.54–0.55 the MSSN data forwarding strategy shows the optimal performance in the transmission environment.
First, we explore the impact of the mobile similarity threshold on the delivery ratio. As show in Figure 5, when the mobile similarity threshold is from 0.15 to 0.55, the delivery ratio is in a rising state, and the highest value even reaches 0.91, but the rising range gradually decreases. When the mobile similarity threshold rises from 0.55 to 0.75, the delivery ratio drops sharply, and even drops to 0.79. When the mobile similarity threshold rises, we no longer consider those nodes with lower similarity to the destination node. At the same time, after removing those nodes with lower mobile similarity, the higher the accuracy and reliability of the relay nodes obtained by the next step of calculating the social similarity operation. However, when the mobile similarity is higher than a certain value, some neighbor nodes that may also be suitable relay nodes are removed although more reliable relay nodes can be obtained, Consequently, the number of relay nodes we obtain is small, which leads to a lower delivery ratio.
Figure 6 shows the effect of the mobile similarity threshold on the average end-to-end delay. As shown, when the mobile similarity threshold rises from 0.15 to 0.55, the average end-to-end delay drops from 98 to 80, and its downward trend tends to be flat. That is because as the mobile similarity threshold increases, neighbor nodes that are almost impossible to become reliable relay nodes due to the small similarity of movement to the destination node are removed, thereby greatly reducing the delay of routing selection. Since some noise nodes are reduced, the message carrier can find the appropriate relay node faster and forward the message out, the average end-to-end delay is reduced. However, when the mobile similarity threshold is higher than 0.55, the average end-to-end delay increases rapidly, even reaching 95, and the upward trend is increasing. That’s because when the mobile similarity threshold exceeds a certain level, the probability and number of suitable relay nodes will be reduced due to the large number of neighbor nodes being abandoned, and the probability of destination node receiving messages will be reduced, leading to high average end-to-end delay.
Finally, the effect of different mobile similarity thresholds on the overhead on average is shown in Figure 7. As we can see, when the mobile similarity threshold increases gradually from 0.15 to 0.55, the average cost decreases rapidly and even drops to 183. However, when the mobile similarity threshold continues to increase from 0.55, the average cost shows a certain upward trend, but the rate of increase is relatively slow. That’s because when the mobile similarity threshold is around 0.55, we no longer consider the neighbor nodes that are not suitable as reliable relay nodes because of the low mobile similarity between them and the destination node, thus reducing the memory and processing resource overhead needed in computing. At the same time, we can get more reliable relay nodes, which increases the success rate and speed of destination node to get the message, and thus reduces the average network overhead. And when the mobile similarity threshold continues to increase on the basis of 0.55, as the threshold of most nodes is lower than this value, the range of neighbor nodes from which we choose reliable relay nodes decreases sharply, so that the number of reliable relay nodes we can obtain decreases and the overhead on average increases.

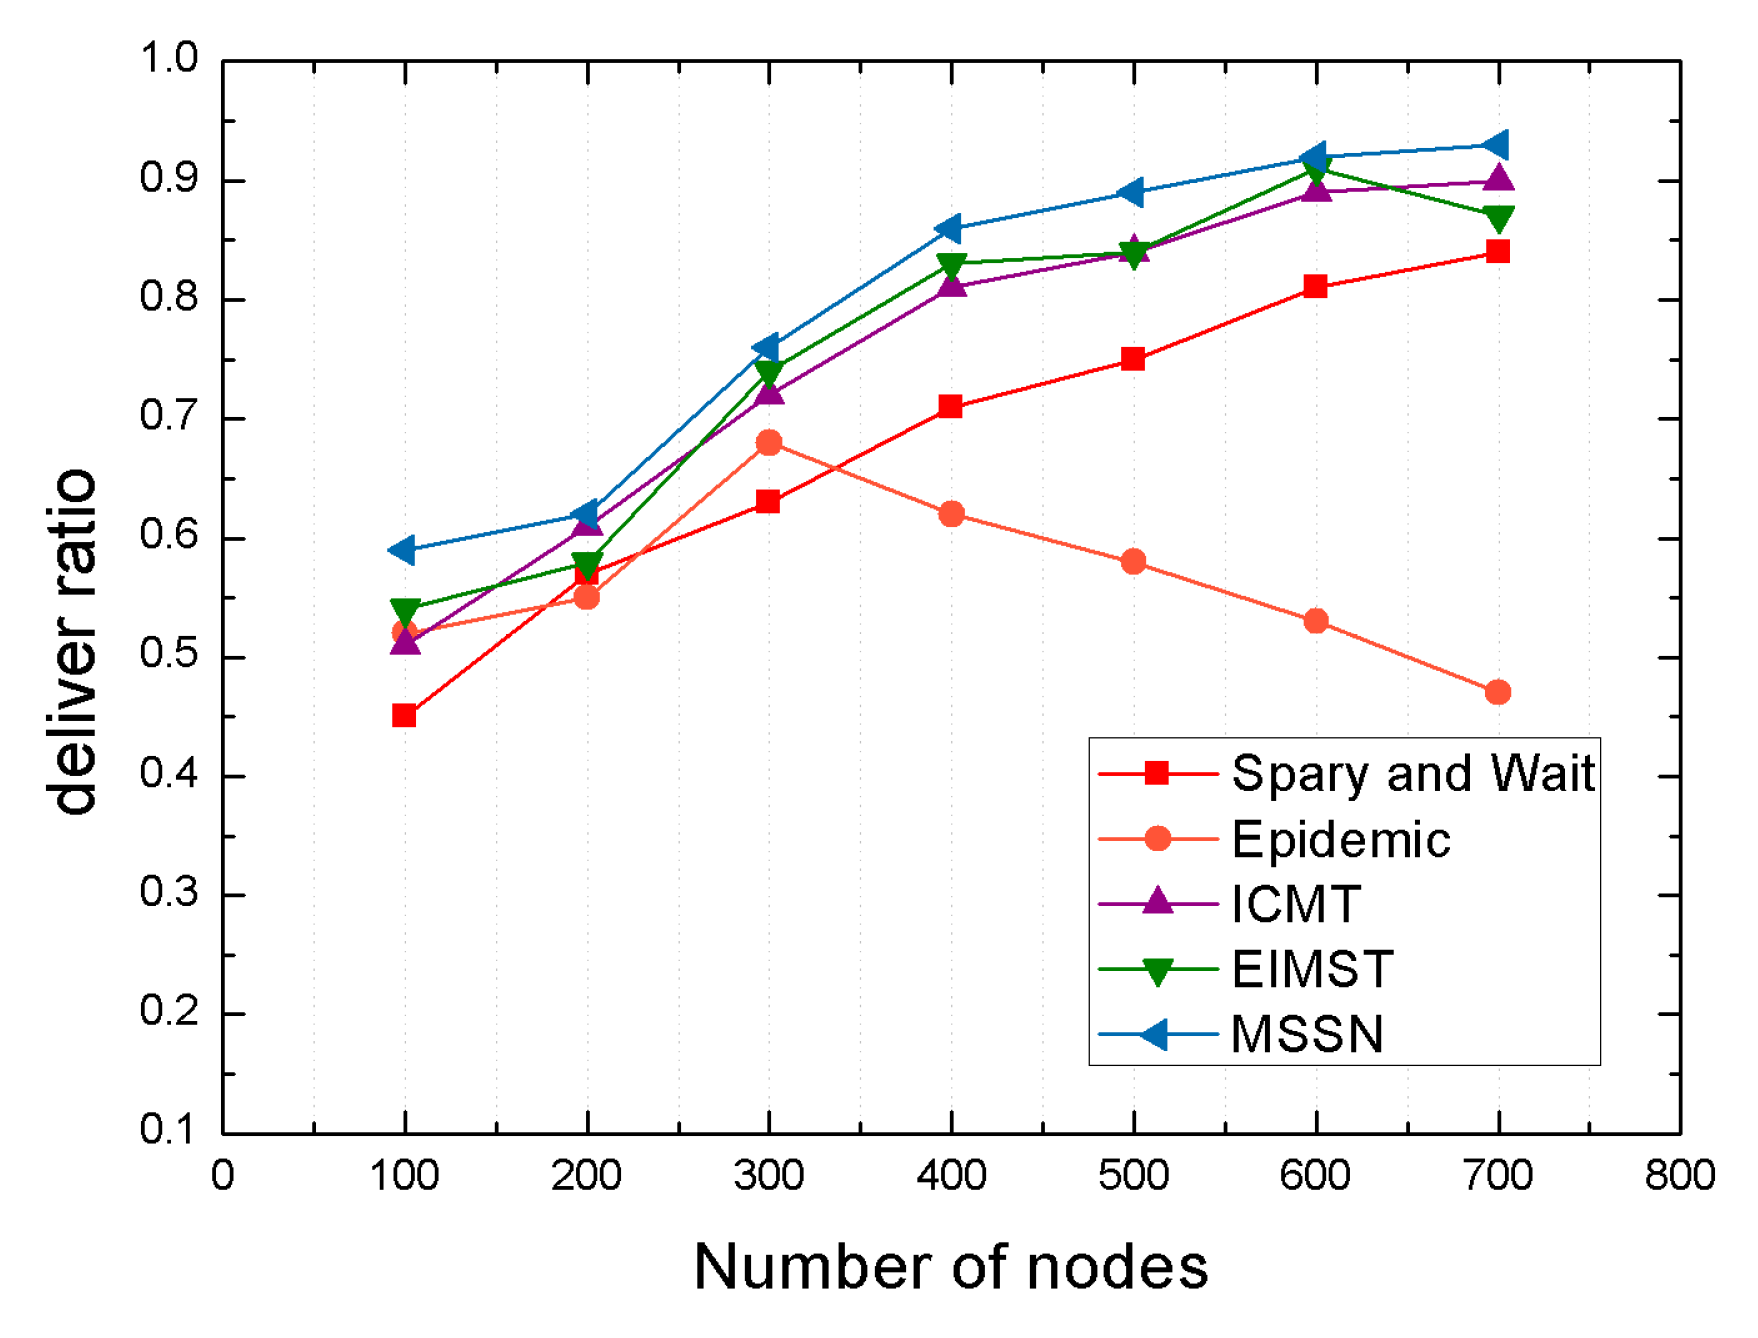
4.2.2. Comparison Result Analysis between Algorithms under Different Number of Nodes

This section mainly compares and analyzes the performance of the five algorithms mentioned above under different number of nodes. For those routing algorithms based on contextual message in opportunistic social networks, the message carrier needs to forward the message to multiple relay nodes. When the number of neighbor nodes around the message carrier is insufficient, it may not be able to select a plurality of suitable relay nodes from the neighbor nodes to perform effective data transmission. Therefore, in this experiment, we reasonably set the number of neighbor nodes as a variable to study the transmission performance of each algorithm. In addition, the comparison results show that the MSSN algorithm performs better than other algorithms in terms of delivery ratio, average end-to-end delay and overhead on average under different node numbers.
As demonstrated in Table 4, the average confidence levels of delivery ratio, end-to-end delay and network overhead from the MSNN algorithm are 0.85, 0.92 and 0.95, respectively. Alternatively, the average confidence interval of delivery ratio, end-to-end delay and network overhead from the MSNN algorithm are 0.4–0.95, 0–65 and 25–200, respectively. This indicates that the probability that the real value obtained in this simulation falls in the estimated value interval is relatively large, and the experimental data obtained from this experiment are also relatively reliable. Compared with spray and wait, Epidemic, ICMT and EIMST, the improved results reflected by the experimental data are more reliable. Next, we compare the proposed approach with spray and wait, Epidemic, ICMT and EIMST in terms of delivery ratio, end-to-end delay and network overhead, respectively.
Above all, we evaluated the delivery ratio of each algorithm under different number of nodes, and the comparison results of the five algorithms are shown in Figure 8. As shown in the figure, with the increase of the number of neighbor nodes from 100 to 700, the delivery ratio of most routing-forwarding algorithms shows a certain upward trend. However, the delivery ratio of Epidemic algorithm shows a downward trend when the number of nodes exceeds 300. This is because the Epidemic routing algorithm adopts information flooding mechanism to carry out information transmission, and when the number of nodes exceeds a certain range, it may cause network congestion, resulting in a lower delivery ratio.
With the increase of the number of neighbor nodes from 100 to 700, we can see that the average delivery ratio of the MSSN algorithm increases by 15%, 60%, 7% and 6% as compared with those from spray and wait, Epidemic, ICMT and EIMST, respectively. Especially, when the number of mobile nodes in communication area fluctuates from 200 to 300, the delivery ratio of MSSN algorithm is very close to those from EIMST approach. This is because both of the two algorithms are based on information exchange between a pair of nodes and community division, in which frequent information exchange between nodes in the same community is beneficial to promote the delivery ratio in the networks, and the effective strategy of message duplicates controlling is able to reduce the average end-to-end delay and network overhead in the networks. Moreover, when the number of nodes reaches 700, the delivery ratio even reaches 0.93. The MSSN algorithm comprehensively utilizes the mobile and social similarities between the neighbor nodes and the destination node. When the number of neighbor nodes increases, the message carrier can find more reliable relay nodes to perform efficient data transmission, thereby increasing the delivery ratio.
The “Spray and Wait” algorithm performs a certain number of copies of the message in the network. When the number of neighbor nodes increases, the probability of encounter between neighbor nodes and destination node will increase, so the delivery ratio gradually rises from 0.45 to 0.84. The ICMT and EIMST algorithms achieve effective data transmission through cooperation between multiple nodes, but this is not an effective data transmission scheme when the cache space of nodes is limited. Therefore, compared with traditional algorithms, these two algorithms have some improvement in delivery ratio. When the number of nodes is 700, the transmission rate of ICMT algorithm even reaches 0.9. However, in general, the delivery ratio of MSSN algorithm is the highest among these algorithms.
In Figure 9, we show the performance of the average end-to-end delay for each algorithm under different number of neighbor nodes. As we can see, in addition to the Epidemic algorithm and the Spray and Wait algorithm, the average end-to-end delay of other algorithms shows a gentle downward trend as the number of nodes increases. The reason why the average end-to-end delay of Spray and Wait has been rising is because the algorithm uses the mechanism that randomly transmits the replication of the message to the network to implement data transmission. When the number of nodes increases, the probability of the randomly distributed message reaching the destination node is reduced, so the average end-to-end delay rises from 68 to 123. As for the Epidemic algorithm, since the algorithm adopts the flooding data transmission mechanism, when the number of neighbor nodes exceeds 400, the replication of messages in the network increases sharply, thereby causing network congestion, and thus, the average end-to-end delay increases.
We can see that the average end-to-end delay of MSSN algorithm always stays at the lowest state from 63 to 20 when the number of nodes increases from 100 to 700. That is because when the number of neighbor nodes increases, the number of reliable relay nodes that the MSSN algorithm can find based on the mobile similarity and social similarity between nodes increases, and the average end-to-end delay decreases. The ICMT algorithm utilizes the cooperation mechanism between nodes to realize the effective transmission of data, and the EIMST algorithm carries out message forwarding through effective information management and community division. Therefore, compared with other two traditional algorithms, these two algorithms have higher average end-to-end delay. To sum up, compared with other algorithms, the MSSN algorithm is the best method to reduce the average end-to-end delay of network message transmission.
The performance of each algorithm in terms of overhead on average with different number of nodes is shown in Figure 10. As the number of neighbor nodes increases from 100 to 700, the overhead on average of all the other four algorithms except the Epidemic algorithm is in a slowly decreasing state. Moreover, the overhead on average of the MSSN algorithm has been kept below 200. When the number of nodes is 700, the average overhead from the MSSN algorithm is even reduced by 68% as compared with those from spray and wait, and it is very close to those from the EIMST algorithm. The reason why the MSSN algorithm can always maintain a low overhead on average is mainly because the algorithm comprehensively utilizes the mobile node similarity and social attributes of the neighbor nodes to select reliable relay nodes, which is similar with the EIMST algorithm. When the number of neighbor nodes becomes larger, the relay nodes determined by the MSNN algorithm are more accurate and more numerous so that messages can be forwarded faster. The reason why the overhead on average of the Epidemic algorithm has been increasing is mainly because the algorithm uses the message flooding mechanism. When the number of nodes increases, the replication of messages in the network increases sharply, and the destination node cannot quickly obtain messages, which results in a larger average network overhead.
The ICMT algorithm utilizes the cooperation mechanism between neighbor nodes and establishes a method of identifying nodes by relying on the probability of encounter. Therefore, when the number of nodes increases from 100 to 700, the average cost of the algorithm shows a certain downward trend. the average network overhead from MSNN reduces by only 13% compared with those from EIMST. To be specific, the EIMST algorithm uses community division and information management to perform an efficient data transmission process. In the same way, the mobile similarity and social similarity between nodes are also used in the MSSN algorithm, which is mainly based on the moving trajectories of nodes, the number of common neighbor nodes and their social attributes. Besides, communities share some parts of transmission missions, nodes carrying messages may reduce overhead. Therefore, when the number of nodes increases, the average cost of the algorithm gradually decreases from 224 to 86. In conclusion, The MSSN algorithm outperforms other algorithms in terms of network overhead when the number of nodes changes.

5. Conclusions

This paper proposes an effective data transmission strategy algorithm (MSSN) that utilizes mobile and social similarity in opportunistic social networks. The model algorithm is mainly divided into four phases. First, in order to achieve the functional integrity of the algorithm, it is necessary to collect and update related information of the network node. Secondly, on the one hand, the mobile similarity of the nodes is calculated by the relationship between the number of co-neighbor nodes. On the other hand, through the similarity calculation of the historical movement trajectory of the node, the final one node mobile similarity is obtained by combining the weights. Then, the partial nodes with high mobile similarity are selected by the single threshold screening method to proceed to the next step. Thirdly, the retained nodes are selected by the clustering algorithm, and the distance between the Minkowski distance and the MVD distance is calculated, and the distance of the social attribute is calculated according to the social attribute. The larger the distance value is, the smaller the similarity is. Finally, the relay node with the highest probability of message forwarding success is selected and the entire forwarding strategy is described.
This work adopts the social and mobile relationships between a pair of nodes, termed as “node similarity”, to improve data dissemination environment in opportunistic social networks. However, frequent information exchange among mobile devices may lead to the disclosure of private attribute and data protection. Alternatively, the memory and energy of mobile devices are also big limitations on data dissemination process in opportunistic social networks. Therefore, in future work, we apply this algorithm in different real-world scenarios, continuously improve the performance of the algorithm, and consider the issues of energy consumption and information security. To be specific, we will build an information protection protocol framework, which can be applied in the network layer, to hide the vital information about mobile nodes in the bundle layer of opportunistic networks and protect private data of mobile devices. Alternatively, we will integrate more node attributes to achieve a better data transmission environment, which is reflected in higher delivery ratio, lower average end-to-end delay and average network overhead.

Author Contributions

M.G. and M.X. conceived the idea of the paper. M.G. designed and performed the experiments; M.G. analyzed the data; M.G. and M.X. contributed reagents/materials/analysis tools; M.G. wrote and revised the paper.

Funding

This research was funded by [Scientific Research Fund of Hunan Provincial Education Department, Research on database storage performance optimization in virtualization] grant number [No. 16C1498]; [School level scientific research project of XiangNan University, Research on network security situation prediction based on data fusion] grant number [No. 2017XJ16].

Conflicts of Interest

The authors declare that they have no competing interests.

References

  1. Conti, M.; Giordano, S. Mobile Ad Hoc Networking: Milestones, Challenges, and New Research Directions. Commun. Mag. IEEE 2014, 52, 85–96. [Google Scholar] [CrossRef]
  2. Zhang, S.; Zhao, L.; Lu, Y. Do you get tired of socializing? An empirical explanation of discontinuous usage behaviour in social network services. Inf. Manag. 2016, 53, 904–914. [Google Scholar] [CrossRef] [PubMed] [Green Version]
  3. Wu, D.; Zhang, F.; Wang, H. Security-oriented opportunistic data forwarding in Mobile Social Networks. Future Gener. Comput. Syst. 2018, 87, 803–815. [Google Scholar] [CrossRef] [PubMed]
  4. Liu, K.; Chen, Z.; Wu, J.; Xiao, Y.; Zhang, H. Predict and Forward: An Efficient Routing-Delivery Scheme Based on Node Profile in Opportunistic Networks. Future Int. 2018, 10, 74. [Google Scholar] [CrossRef]
  5. Liu, K.; Chen, Z.; Wu, J.; Wang, L. FCNS: A fuzzy routing-forwarding algorithm exploiting comprehensive node similarity in opportunistic social networks. Symmetry Basel 2018, 10, 338. [Google Scholar] [CrossRef]
  6. Kimura, T.; Matsuda, T.; Takine, T. Location-Aware Store-Carry-Forward Routing Based on Node Density Estimation. IEICE Trans. Commun. 2015, 98, 99–106. [Google Scholar] [CrossRef]
  7. Kimura, T.; Muraguchi, M. Buffer management policy based on message rarity for store-carry-forward routing. In Proceedings of the 2017 23rd Asia-Pacific Conference on Communications (APCC), Perth, WA, Australia, 11–13 December 2017; pp. 1–6. [Google Scholar]
  8. Peng, Y.; Guo, L.; Deng, Q.X. A Novel Hybrid Routing Forwarding Algorithm in SDN Enabled Wireless Mesh Networks. In Proceedings of the IEEE International Conference on High Performance Computing and Communications, New York, NY, USA, 24–26 August 2015; pp. 1806–1811. [Google Scholar]
  9. Ge, X.; Ye, J.; Yang, Y. User Mobility Evaluation for 5G Small Cell Networks Based on Individual Mobility Model. IEEE J. Sel. Areas Commun. 2016, 34, 528–541. [Google Scholar] [CrossRef]
  10. Wu, Y.; Zhao, Y.; Riguidel, M. Security and trust management in opportunistic networks: A survey. Secur. Commun. Netw. 2015, 8, 1812–1827. [Google Scholar] [CrossRef]
  11. Liu, K. Big Medical Data Decision-Making Intelligent System Exploiting Fuzzy Inference Logic for Prostate Cancer in Developing Countries. IEEE Access 2019, 7, 2348–2363. [Google Scholar] [CrossRef]
  12. Mumtaz, S.; Al-Dulaimi, A.; Frascolla, V. Guest Editorial Special Issue on 5G and Beyond—Mobile Technologies and Applications for IoT. IEEE Int. Things J. 2019, 6, 203–206. [Google Scholar] [CrossRef]
  13. Han, Q.; Liang, S.; Zhang, H. Mobile cloud sensing, big data, and 5G networks make an intelligent and smart world. IEEE Netw. 2015, 29, 40–45. [Google Scholar] [CrossRef]
  14. Han, S.; Xu, S.; Meng, W. An Agile Confidential Transmission Strategy Combining Big Data Driven Cluster and OBF. IEEE Trans. Veh. Technol. 2017, 66, 10259–10270. [Google Scholar] [CrossRef]
  15. Trifunovic, S.; Kouyoumdjieva, S.T.; Distl, B. A Decade of Research in Opportunistic Networks: Challenges, Relevance, and Future Directions. IEEE Commun. Mag. 2017, 55, 168–173. [Google Scholar] [CrossRef] [Green Version]
  16. Ke, C.K.; Chen, Y.L.; Chang, Y.C. Opportunistic large array concentric routing algorithms with relay nodes for wireless sensor networks. Comput. Electr. Eng. 2016, 56, 350–365. [Google Scholar] [CrossRef] [PubMed]
  17. Elsherief, M.; Alipour, B.; Qathrady, M.A. A novel mathematical framework for similarity-based opportunistic social networks. Perv. Mobile Comput. 2017, 42, 134–150. [Google Scholar] [CrossRef] [PubMed]
  18. Yao, L.; Man, Y.; Huang, Z. Secure Routing based on Social Similarity in Opportunistic Networks. IEEE Trans. Wirel. Commun. 2015, 15, 594–605. [Google Scholar] [CrossRef]
  19. Gong, N.Z.; Talwalkar, A.; Mackey, L. Joint Link Prediction and Attribute Inference Using a Social-Attribute Network. ACM Trans. Int. Syst. Technol. 2014, 5, 1–20. [Google Scholar] [CrossRef]
  20. Jia, W.; Chen, Z.; Ming, Z. Information cache management and data transmission algorithm in opportunistic social networks. Wirel. Netw. 2019, 25, 2977–2988. [Google Scholar]
  21. Jiang, N.; Guo, L.; Li, J. Data Dissemination Protocols Based on Opportunistic Sharing for Data Offloading in Mobile Social Networks. In Proceedings of the.2016 IEEE International Conference on Parallel & Distributed Systems, Wuhan, China, 13–16 December 2016; pp. 705–712. [Google Scholar]
  22. Ying, B.D.; Xu, K.; Nayak, A. Fair and Social-Aware Message Forwarding Method in Opportunistic Social Networks. In Proceedings of IEEE Commun Lett. 2019, 23, 720–723. [Google Scholar] [CrossRef]
  23. Jia, W.; Chen, Z.; Ming, Z. SECM: Status estimation and cache management algorithm in opportunistic networks. J. Supercomput. 2019, 75, 2629–2647. [Google Scholar]
  24. Lin, C.J.; Chen, C.W.; Chou, C.F. Preference-aware content dissemination in opportunistic mobile social networks. In Proceedings of the 2012 Proceedings IEEE INFOCOM, Orlando, FL, USA, 25–30 March 2012; pp. 1960–1968. [Google Scholar]
  25. Boldrini, C.; Conti, M.; Passarella, A. Design and performance evaluation of ContentPlace, a social-aware data dissemination system for opportunistic networks. Comput. Netw. 2010, 54, 589–604. [Google Scholar] [CrossRef]
  26. Conti, M.; Mordacchini, M.; Passarella, A. A Semantic-Based Algorithm for Data Dissemination in Opportunistic Networks. In Revised Selected Papers of Ifip Tc 6 International Workshop on Self-Organizing Systems; Springer: Berlin/Heidelberg, Germany, 2016. [Google Scholar]
  27. Woungang, I.; Dhurandher, S.; Singh, J.; Borah, S. Energy Aware Routing for Efficient Green Communication in Opportunistic Networks. IET Netw. 2019, 8, 272–279. [Google Scholar] [CrossRef]
  28. Liaqat, H.B.; Ali, A.; Qadir, J. Socially-aware congestion control in ad-hoc networks: Current status and the way forward. Future Gener. Comput. Syst. 2019, 97, 634–660. [Google Scholar] [CrossRef]
  29. Mordacchini, M.; Passarella, A.; Conti, M. A social cognitive heuristic for adaptive data dissemination in mobile Opportunistic Networks. Pervasive Mobile Comput. 2017, 42, 371–392. [Google Scholar] [CrossRef] [PubMed]
  30. Borrego, C.; Joan, B.; Sergi, R. Efficient broadcast in opportunistic networks using optimal stopping theory. Ad Hoc Netw. 2019, 88, 5–17. [Google Scholar] [CrossRef]
  31. Yu, G.; Chen, Z.G.; Wu, J. Quantitative social relations based on trust routing algorithm in opportunistic social network. EURASIP J. Wirel. Commun. Netw. 2019, 2019, 83. [Google Scholar] [CrossRef]
  32. Souza, C.; Mota, E.; Soares, D.; Manzoni, P.; Cano, J.C.; Calafate, C.T.; Hernández-Orallo, E. FSF: Applying Machine Learning Techniques to Data Forwarding in Socially Selfish Opportunistic Networks. Sensors 2019, 19, 2374. [Google Scholar] [CrossRef]
  33. Zhao, Y.; Song, W.; Han, Z. Social-Aware Data Dissemination via Device-to-Device Communications: Fusing Social and Mobile Networks with Incentive Constraints. IEEE Trans. Serv. Comput. 1939, 1. [Google Scholar] [CrossRef]
  34. Yang, Y.; Zhao, H.; Ma, J. Social-aware data dissemination in opportunistic mobile social networks. Int. J. Mod. Phys. C 2017, 28, 1750115. [Google Scholar] [CrossRef]
  35. Huang, W.; Zhang, S.; Zhou, W. Spray and Wait Routing Based on Position Prediction in Opportunistic Networks. In Proceedings of the 2011 3rd International Conference on Computer Research & Development, Shanghai, China, 11–13 March 2011; pp. 232–236. [Google Scholar]
  36. Halikul, L.; Mohamad, A. EpSoc: Social-Based Epidemic-Based Routing Protocol in Opportunistic Mobile Social Network. Mob. Inf. Sys. 2018, 2018, 1–8. [Google Scholar] [Green Version]
  37. Jia, W.U.; Chen, Z.; Zhao, M. Effective information transmission based on socialization nodes in opportunistic networks. Comput. Netw. 2017, 129, 129–297. [Google Scholar]
Figure 1. Information collection and update between mobile nodes in the networks.
Information 10 00299 g001
Figure 2. The physical change of the degree of mobile similarity between mobile nodes.
Information 10 00299 g002
Figure 3. Model diagram of message forwarding strategy in opportunistic social networks.
Information 10 00299 g003
Figure 4. Weight value distribution of node social attributes.
Information 10 00299 g004
Figure 5. Delivery ratio with various mobile similarity threshold.
Information 10 00299 g005
Figure 6. Average end-to-end delay with various mobile similarity threshold.
Information 10 00299 g006
Figure 7. Overhead on average with various mobile similarity threshold.
Information 10 00299 g007
Figure 8. Deliver ratio with different number of nodes.
Information 10 00299 g008
Figure 9. Average end-to-end delay with different number of nodes.
Information 10 00299 g009
Figure 10. Overhead on average with different number of nodes.
Information 10 00299 g010
Table 1. Description of the datasets used in the experiment.
DatasetAttributesClassesNodes
Infocom5623276
Infocom662680
Cambridge622310
Intel62837
Table 2. The simulation environment for the MSSN routing algorithm.
Simulation Environment Description
Simulator Opportunistic Network Environment (ONE)
Mobility model MGMM
Communication area (m2)4500   ×   34 00
Total simulation time (h)2–6
Number of nodes100, 200, 300,400, 500,600,700
Cache space of a node (Mb)30
Speech of a node (m/s)1–20
Initial energy for a node (J)100
Number of social attributes6
Mobile similarity threshold M S ˜ = 0.15 M S ˜ = 0.25 M S ˜ = 0.35 M S ˜ = 0.45 M S ˜ = 0.55 M S ˜ = 0.65 M S ˜ = 0.75
Table 3. The average improvement percentage of MSNN as compared to other four algorithms.
MetricSpray and WaitEpidemicICMTEIMST
Delivery ratio15%60%7%6%
Average end-to-end delay90%75%67%50%
Average network overhead 68%44%24%13%
Table 4. The average confidence interval of MSNN with the number of nodes increases 100 to 700.
MetricAverage Confidence LevelAverage Confidence Interval
Delivery ratio0.850.4–0.95
Average end-to-end delay0.920–65
Average network overhead 0.9525–200

