Article

Human Health Impact of Natural and Artificial Radioactivity Levels in the Sediments and Fish of Bonny Estuary, Niger Delta, Nigeria

by
Bolaji B. Babatunde
1,2,*,
Francis D. Sikoki
1,2 and
Ibitoruh Hart
2
1
Center for Marine Pollution Monitoring and Seafood Safety, IAEA-FGN RAF7008 TC project, Department of Animal and Environmental Biology, Faculty of Biological Science, University of Port Harcourt, Port Harcourt 500072, Nigeria
2
Department of Animal and Environmental Biology, Faculty of Biological Sciences, University of Port Harcourt, Port Harcourt 500072, Nigeria
*
Author to whom correspondence should be addressed.
Challenges 2015, 6(2), 244-257; https://doi.org/10.3390/challe6020244
Submission received: 22 September 2015 / Revised: 28 October 2015 / Accepted: 29 October 2015 / Published: 13 November 2015

Abstract

:
There is widespread contamination of the environment of the Niger Delta, which may include enhanced background levels of naturally occurring radioactive materials (NORM) due to oil production and rapid urbanization activities. Sediments and seafood from the Bonny estuary, Niger Delta, were collected for the purpose of determining baseline data on artificial and natural radioactivity and estimation of effective doses for the public due to ingestion of seafood from the study area. The highest and lowest activity concentrations were reported for 40K and 137Cs in both sediments and fish samples of the Bonny estuary. There was some evidence of spatial variability in the 40K and 137Cs data, with the latter being the likely result of dredging. Other radionuclides were not significantly different between sites impacted by industrial activities or not. Activity of radionuclides measured in the sediments of the study area were higher than reported elsewhere in the Niger Delta and Nigeria and higher than reported global averages by UNSCEAR. The total highest activity concentration in all fish species of gamma emitting radionuclides was observed for 40K, followed by 238U, 232Th and 226Ra, respectively, while 137Cs had the lowest activity concentration. However, 210Po activities were the most important in terms of dose contribution. Consumption of molluscs at typical rates could result in doses exceeding 1 mSv·y−1. Although this baseline data may not be conclusive on prevailing trends in radioactivity in the study area, higher consumption rates of the species studied may have public health consequences due to effects of low dose ionising radiation.

1. Introduction

The importance of naturally occurring radioactive materials (NORM) in the environment as a source of ionising radiation dose to Man has been studied for many years [1,2]. The Earth’s crust contains primordial 238U (T1/2 = 4.468 × 10⁹ y) and 232Th (T1/2 = 1.405 × 10¹⁰ y) ubiquitously in a range of concentrations. These primordial radionuclides give rise to the natural decay series, a sequence of radioactive progenies, including isotopes of thorium, radium, radon, lead and polonium. In addition, 40K is another commonly occurring primordial radionuclide. These radionuclides are widely distributed throughout the environment, generally in trace amounts, in sediments, seafood, air, soil, foodstuff, surface and groundwater [3,4,5]. The concentration of these radionuclides in environmental compartments primarily depends on the geology of the area, with the geochemistry of each element also playing a role in its migration from the soil [6].
Overlaying the natural distribution of these naturally-occurring radionuclides are anthropogenic perturbations. Most frequently, processes associated with the exploitation of geological resources can lead to the concentration of natural radionuclides. For example, recovery of minerals, oil and gas, and the production of phosphate fertilizer are capable of increasing environmental concentrations of naturally occurring radioactive materials (NORM) [6,7]. These anthropogenically “enhanced’’ NORM, often known as TENORM (Technologically-Enhanced NORM), may then be redistributed in the environment by both physical and biogeochemical processes [1]. In addition to these NORM, artificial radionuclides, such as 137Cs, 131I and 90Sr, may enter the environment as fallout from nuclear weapons testing, nuclear waste disposal, nuclear power plant accidents, such as the Chernobyl and the Fukushima nuclear accidents, and routine discharges from nuclear or non-nuclear industries [2]. All sources of radionuclides to the environment contribute to the radiation doses on both humans and the wider environment, and therefore should be evaluated.
Although the distributions of natural and artificial radionuclides have been studied widely throughout the world, there are few data sets available for sub-Saharan Africa. African studies are focused on the countries bordering the Mediterranean and Red Seas [8,9,10,11]. In Nigeria, the measurement of radioactivity in the environment is a more recent effort with most studies focusing on the distribution of natural radioactivity in sediments, soils, surface water and foodstuffs around oil and gas producing areas, mining locations and important inland water bodies [12,13,14,15].
The Niger Delta accounts for over 90% of Nigeria’s foreign exchange earnings through oil and gas exports. However, it suffers extensive environmental pollution, such as heavy metal and hydrocarbon contamination as a consequence of oil and gas exploration and exploitation, industrial production and urbanization, which together have significantly impacted its ecological systems for many years [16]. The Bonny estuary, location of the present study, is one of a network of creeks in the Niger Delta region that empties directly into the Atlantic Ocean at Bonny Island. It is tidal and thus receives a high influx of sea water most of the year [17]. Large scale oil and gas production, industrialization and urbanization characterise the study location with reported impacts from oil spills, gas flares, industrial discharges, agricultural runoff and domestic effluents and leachates [18]. The estuary also supports marine transportation by heavy vessels conveying goods and services to and from a petroleum tank farm, Port Harcourt wharf, cement and flour factories, among others, in addition to heavy traffic of fast speed boats for communal transportation.
Despite these activities, artisanal fisheries in the estuary largely support the livelihood of its inhabitants who have little or no knowledge of the extent of contamination in the estuary. Fish remains an important part in the diet of Nigerians, especially for riverine communities such as the inhabitants of the study area, with seafood being served at almost every meal. In Nigeria, especially in rural and fishing communities, fish constitute approximately 75% of animal protein consumed [19]. Fish is consumed either freshly prepared or smoked. Shellfish, especially the Tympanotonus species, are used largely as a condiment in most meals eaten in the Niger Delta [20].
Data are available on hydrocarbon, persistent organics and heavy metal contamination in the Bonny estuary [17,18], but none exist on the distribution of radionuclides, despite several of the industries concerned having the potential to generate TENORM. Hence, the aim of this present study is to generate baseline information on the status of radionuclide concentrations in the sediment and the more heavily consumed fish and shellfish species from the estuary. These data have then been used to estimate the resulting internal radiation dose received by the inhabitants as a result of fish consumption. This information can be useful in determining health risk to the population due to ionising radiation through the ingestion of fish resources. Furthermore, the baseline data will serve as a platform for estimating future changes in activity concentrations in the study area due to anthropogenic input.

2. Materials and Methods

2.1. Study Area

The Niger Delta of Nigeria is situated in the Gulf of Guinea between latitudes 3° and 5° N and longitudes 5° and 8° E (Figure 1). It is the largest delta in Africa with an area of about 70,000 km2; it is rich in biodiversity and maintains the largest drainage system into the Atlantic Ocean in West Africa [16].
The Bonny River is a 127 km long tidal estuary and lies on the eastern flank of the Niger Delta between latitudes 4.25° and 4.50° N and longitudes 7.00° and 7.15° E (Figure 1). It is the largest of the Niger Delta network of rivers and creeks emptying into the Atlantic Ocean and is also the most environmentally stressed due to intense oil and gas exploitation and production activities [18]. The estuary is characterised by a broad belt of mangrove swamps, which are bordered on the seaward side by sandy barrier islands, and receives an influx of sea water for the majority of the year. The depth varies between 2 m inland and 50 m at the point of discharge into the Atlantic Ocean. The mangrove swamps are essentially vegetated tidal flats with predominantly red mangrove (Rhizophora racemosa) characterised by diverse fish and wild life resources (Dublin-Green, 1988). The lithology of the Bonny estuary is typical of the Niger Delta, predominantly made up of sand, sandy mud, mud, sandy clay and clay. Shallow marginal areas of the estuary channel and creeks consist of mud, sandy mud and clay, while the channel centres are predominantly fine to coarse sand [17]. The Niger Delta geological composition has been divided into three formations that reflect long-term progradations, which include pro-delta shales of the Akata Formation (Paleocene to Recent), deltaic and paralic facies of the Agbada Formation (Eocene to Recent) and fluviatile facies of the Benin Formation (Oligocene-Recent). The Niger Delta clastic wedge where the study area is located appears to be associated with progradation of Agbada Formation sediments and the loading of underlying Akata Formation shales [21]. Detailed geology of the study area is described elsewhere [22].
Figure 1. Map of the study area (insets: Nigeria showing Niger Delta; Niger Delta showing Rivers; Rivers State showing Port Harcourt and the Bonny estuary with sampling locations).
Challenges 06 00244 g001

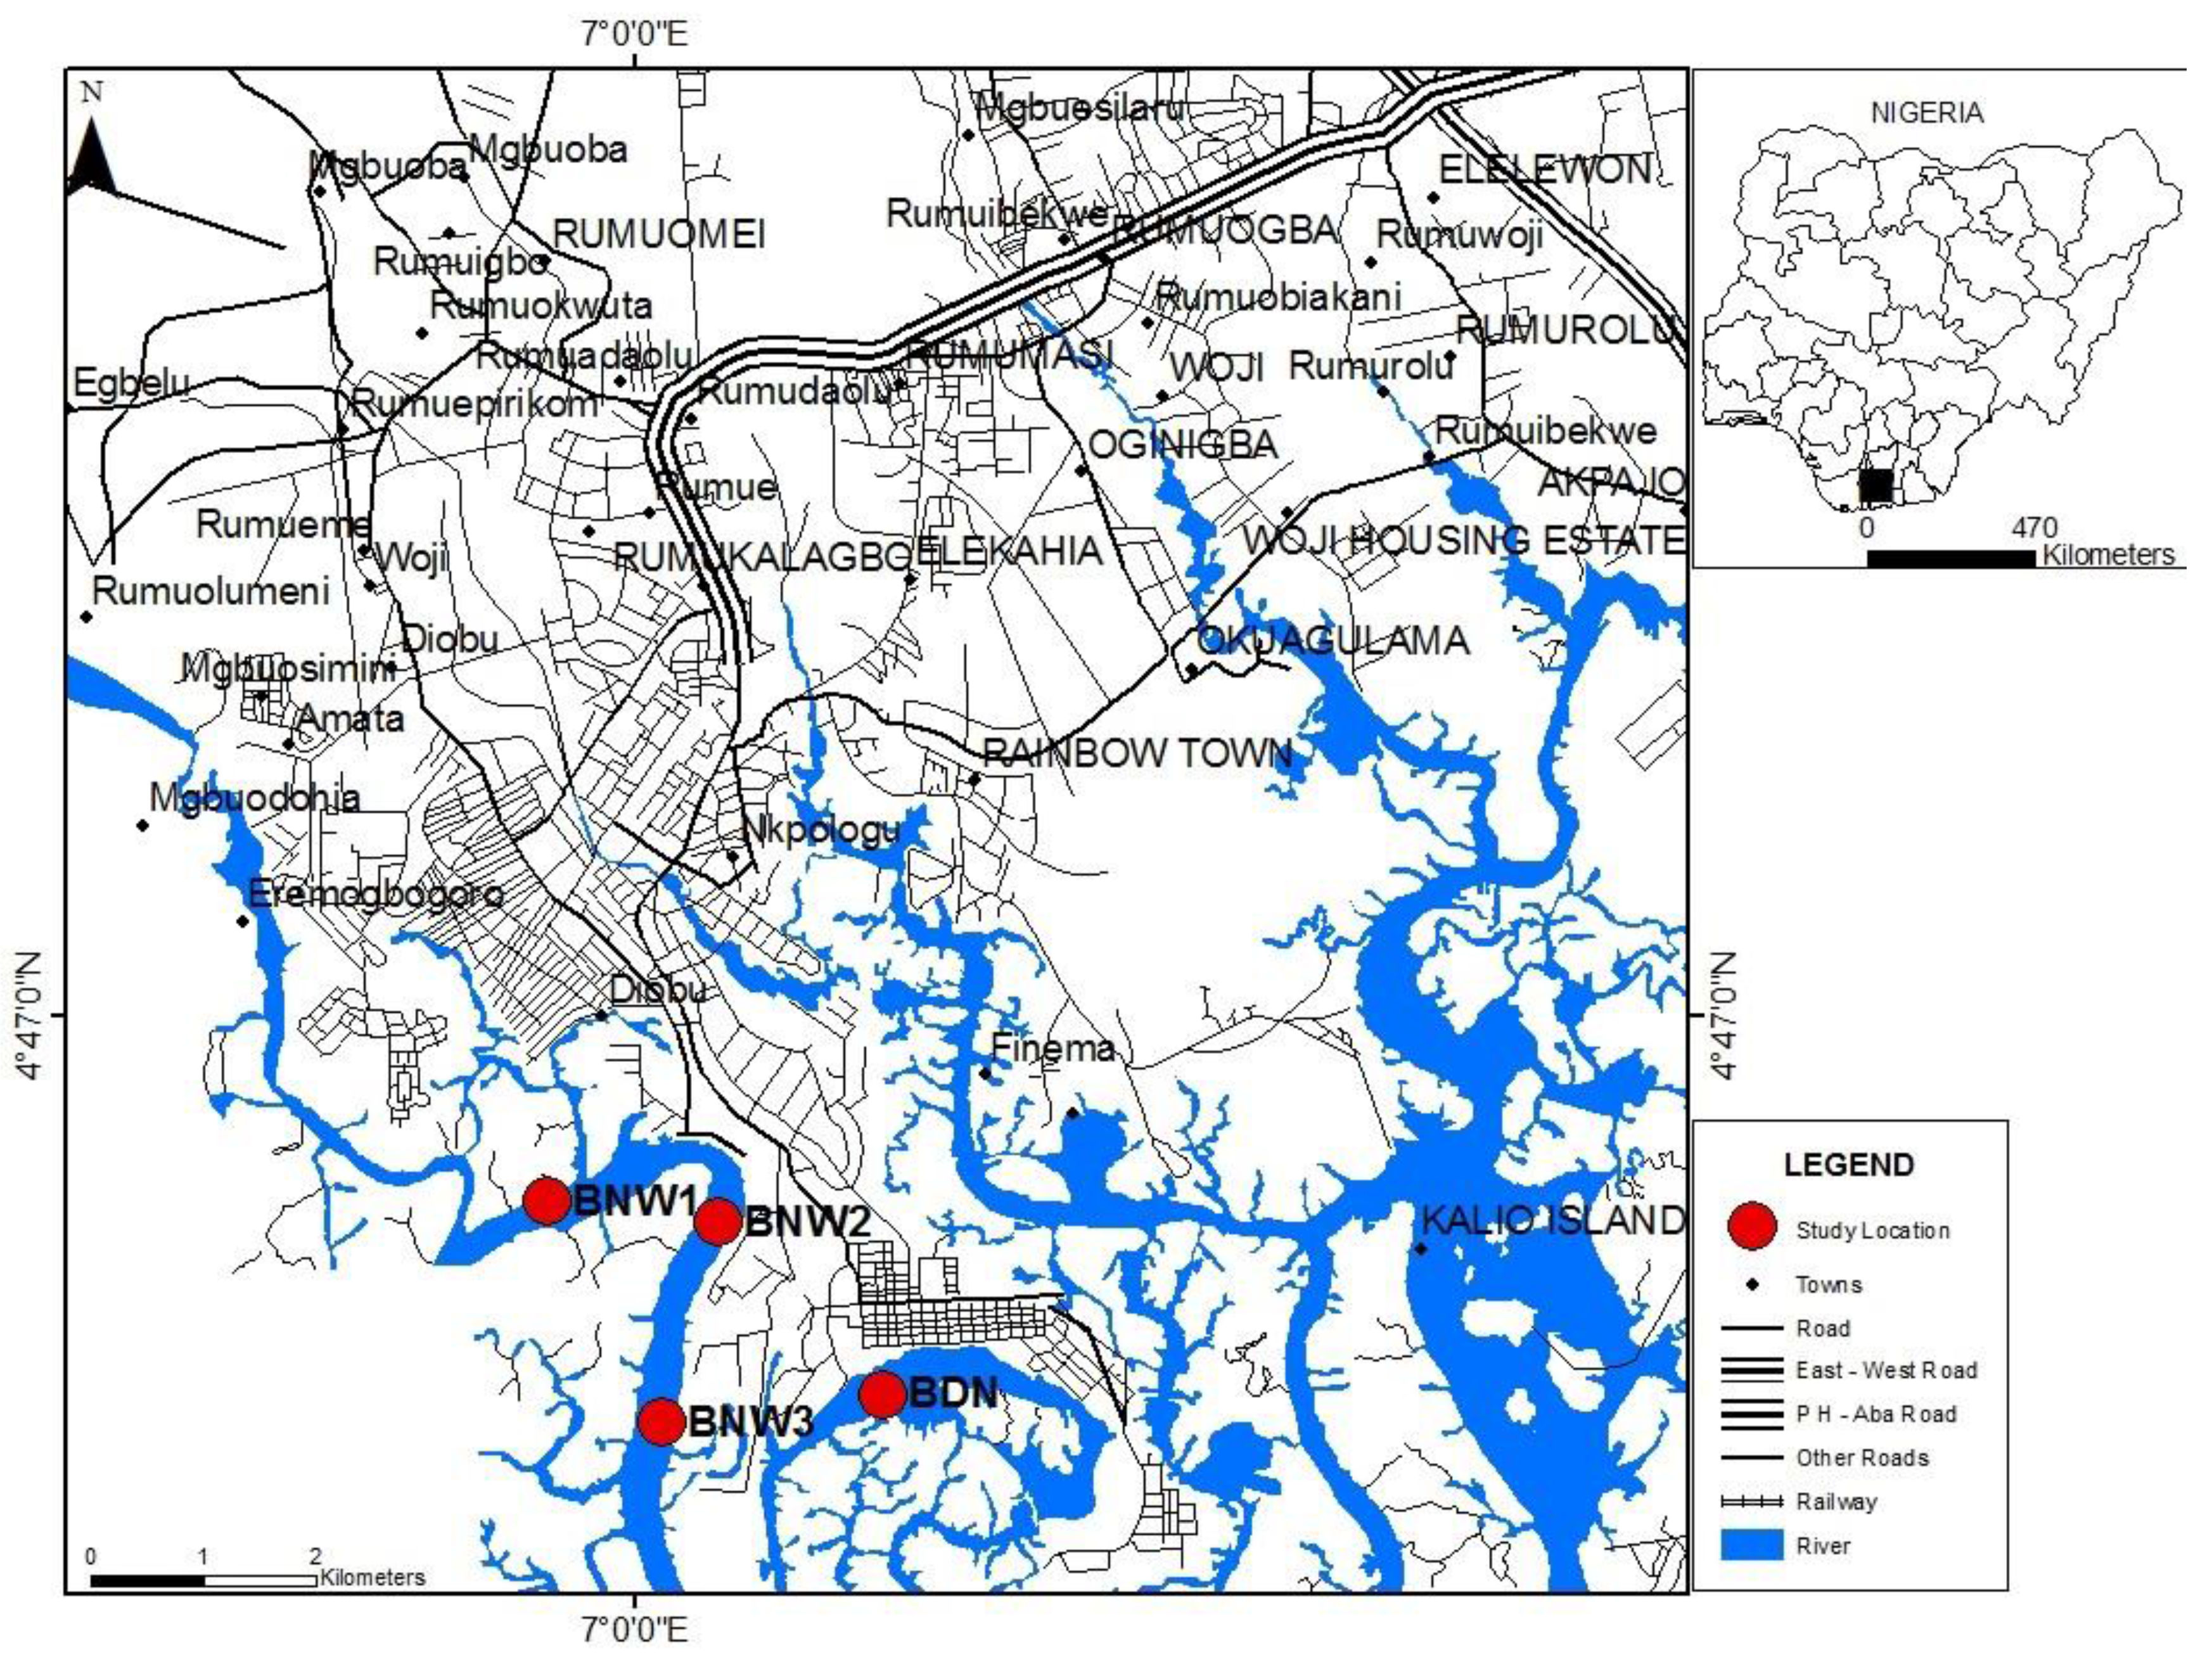
2.2. Sediment Core Sampling

Nine sediment cores, of between 40 cm and 48 cm in length, including the water interface were collected using a triple sediment corer (Uwitec). Sediment samples were collected at three locations in the Bonny estuary: Upstream of industrial activities (BNN1), area of industrial activities (BNN2) and downstream of industrial activities (BNN3) (Figure 1 and Table 1). These locations were chosen to enable the homogeneity of natural radionuclides to be evaluated, as well as allowing anthropogenic impacts to be assessed.
Samples were taken to the laboratory the same day and stored in the refrigerator at 4 °C while awaiting further analysis. Sediment cores were generally sliced at 2 cm intervals and dried the same day in the laboratory in an oven at 50 °C–60 °C. Samples were then homogenised, weighed and compacted into 2.5 cm diameter discs using a hydraulic press. The discs were sealed and coated in 25 mL polycarbonate pots, using Epoxy resin, and allowed to stand for at least three weeks before measurement in order to achieve radioactive equilibrium between 226Ra and its short-lived progeny nuclides.
Table 1. Sediment sampling points in the Bonny estuary.
LocationDescriptionCoordinatesNo. of Cores
BNN1Bonny estuary upstreamN 4°46′33.73″3
E 7°00′18.85″
BNN2Bonny estuary point of industrial activitiesN 4°46′02.43″3
E 7°00′10.56″
BNN3Bonny estuary downstreamN 4°45′71.13″3
E 7°00′05.01″

2.3. Fish Samples

Fish samples, comprising five shellfish species, three crustacean species and one fin fish (Table 3), were freshly caught and purchased from the fishermen. They were transported the same day to the laboratory in an ice chest. Shells and viscera were removed, then the samples were dried in an oven at 50 °C–60 °C. Once dry, they were homogenised, weighed and packed in 75 mL plastic containers with a snap fitted lid for further analysis using gamma spectrometry.

2.4. Sample Analysis

The activity concentrations of 238U, 232Th, 226Ra, 40K and 137Cs were determined using low background co-axial HPGe detectors (EG & G Ortec) with relative efficiencies of 20% and 25% and a nominal resolution of 1.9 keV for 1.33 MeV 60Co gamma emission. The detectors were shielded from environmental background radiation by 10 cm thick cylindrical lead castles, one of which was further lined with copper to absorb Pb X-rays. Counts were accumulated in a multichannel analyser (MCA) for at least 60,000 s and analysed using GammaVision software also by EG & G Ortec. The detectors were calibrated for energy and efficiency using a gamma source (152Eu) and mixed gamma calibration standards prepared at the Lancaster Environment Centre. The calibration standards were prepared in the same geometries used for the samples by spiking deep sea and river sediments and fish with known activities of mixed gamma tracer solutions supplied by the National Physical Laboratory, United Kingdom. Blanks were prepared similarly, but without added tracer. The detector background was determined every month for 48 h and the average background counts used in computation of activity of samples. The concentrations of 238U, 232Th and 226Ra were determined through the gamma emissions of their progeny nuclides, assuming secular equilibrium, i.e., the 234mPa 1001 keV photopeak, the 228Ac 911 keV photopeak and the 214Pb 351 keV photopeak respectively. Potassium-40 and 137Cs were determined at their 1460 keV and 662 keV photopeaks respectively. However, activity of K-40 was corrected for the contribution of 228Ac (1459.14 keV), which could not be resolved in the recorded spectra.
Polonium-210 was determined using alpha spectrometry. The sample was first sieved through a 500 μm mesh. Then, a 0.1 g aliquot was spiked with ~ 1 Bq 209Po as an internal tracer and digested using a combination of HNO3, HF and HCl (5:3:2 mL) in Savillex digestion bombs. Following dissolution, 25 mL boric acid was added to neutralise any residual HF. Samples were taken to dryness, then re-dissolved in 25 mL of 1.5 M HCl. Polonium was plated onto copper foils using a spontaneous deposition process. Samples were made up in approximately 100 mL solution containing demineralised water, 5 mL of 30% m/V hydroxylammonium chloride solution, 5 μg stable Bi and 5 μg stable Pb carriers, and the pH was adjusted to 3.0 using ammonium hydroxide or hydrochloric acid. Copper foils of 576 mm by area and 0.1 mm thickness were coated on one side with a DCA silicone spray and allowed to dry at room temperature for 48 h. Immediately prior to plating, they were cleaned by brief immersion in 2M HNO3 and rinsed in water and acetone. The copper foils were then suspended in the adsorption solutions and plated at 95 °C with a stirring speed of 600 rev min−1 for 2.5 h.
Polonium-209 and 210Po counts were accumulated for over 60,000 s at 4.9 MeV and 5.3 MeV respectively using EG & G Ortec alpha spectrometers with relative efficiencies of between 30% and 36%. Detector backgrounds were determined monthly by counting only the empty chambers for 48 h or more and mean count rates obtained for use in activity calculations. The activity concentrations of 210Po were decay corrected to the time of sampling. Polonium-210 analyses were performed in triplicate, and the mean and standard error for each sample is presented. Average percentage recoveries of Po-210 were (58 ± 3.5) and (60 ± 3.8) with and without stable bismuth, respectively.

3. Results and Discussion

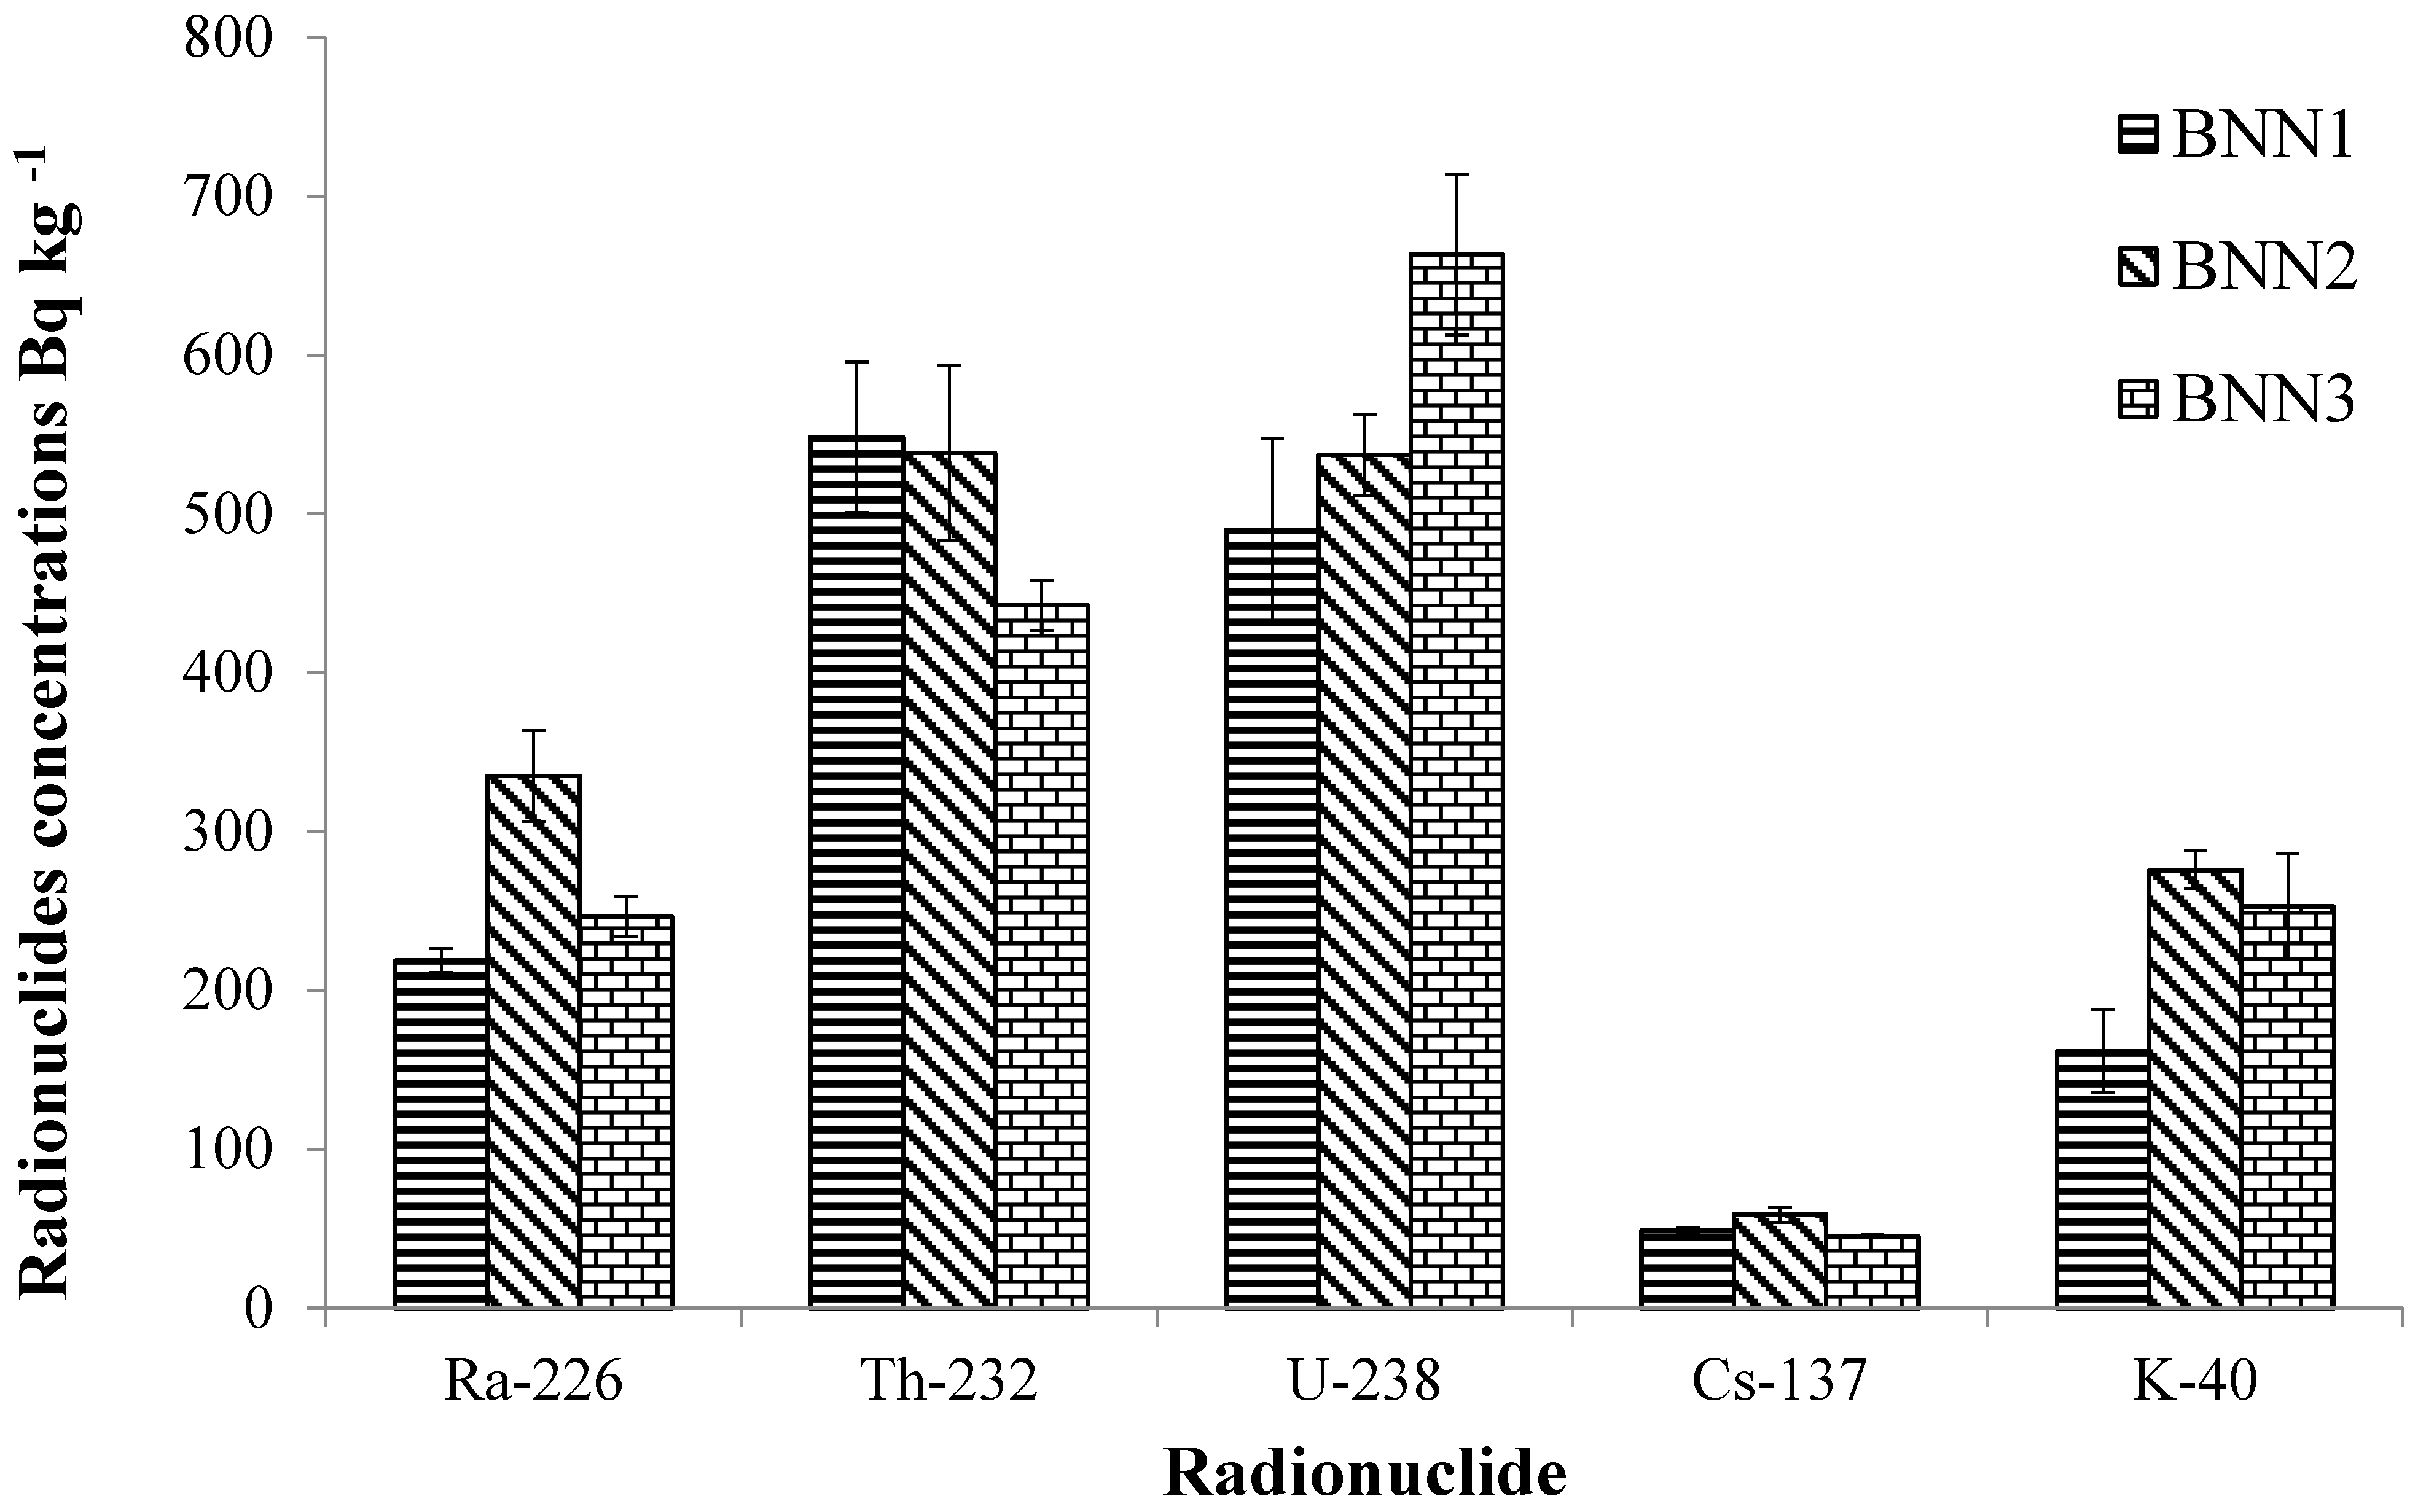
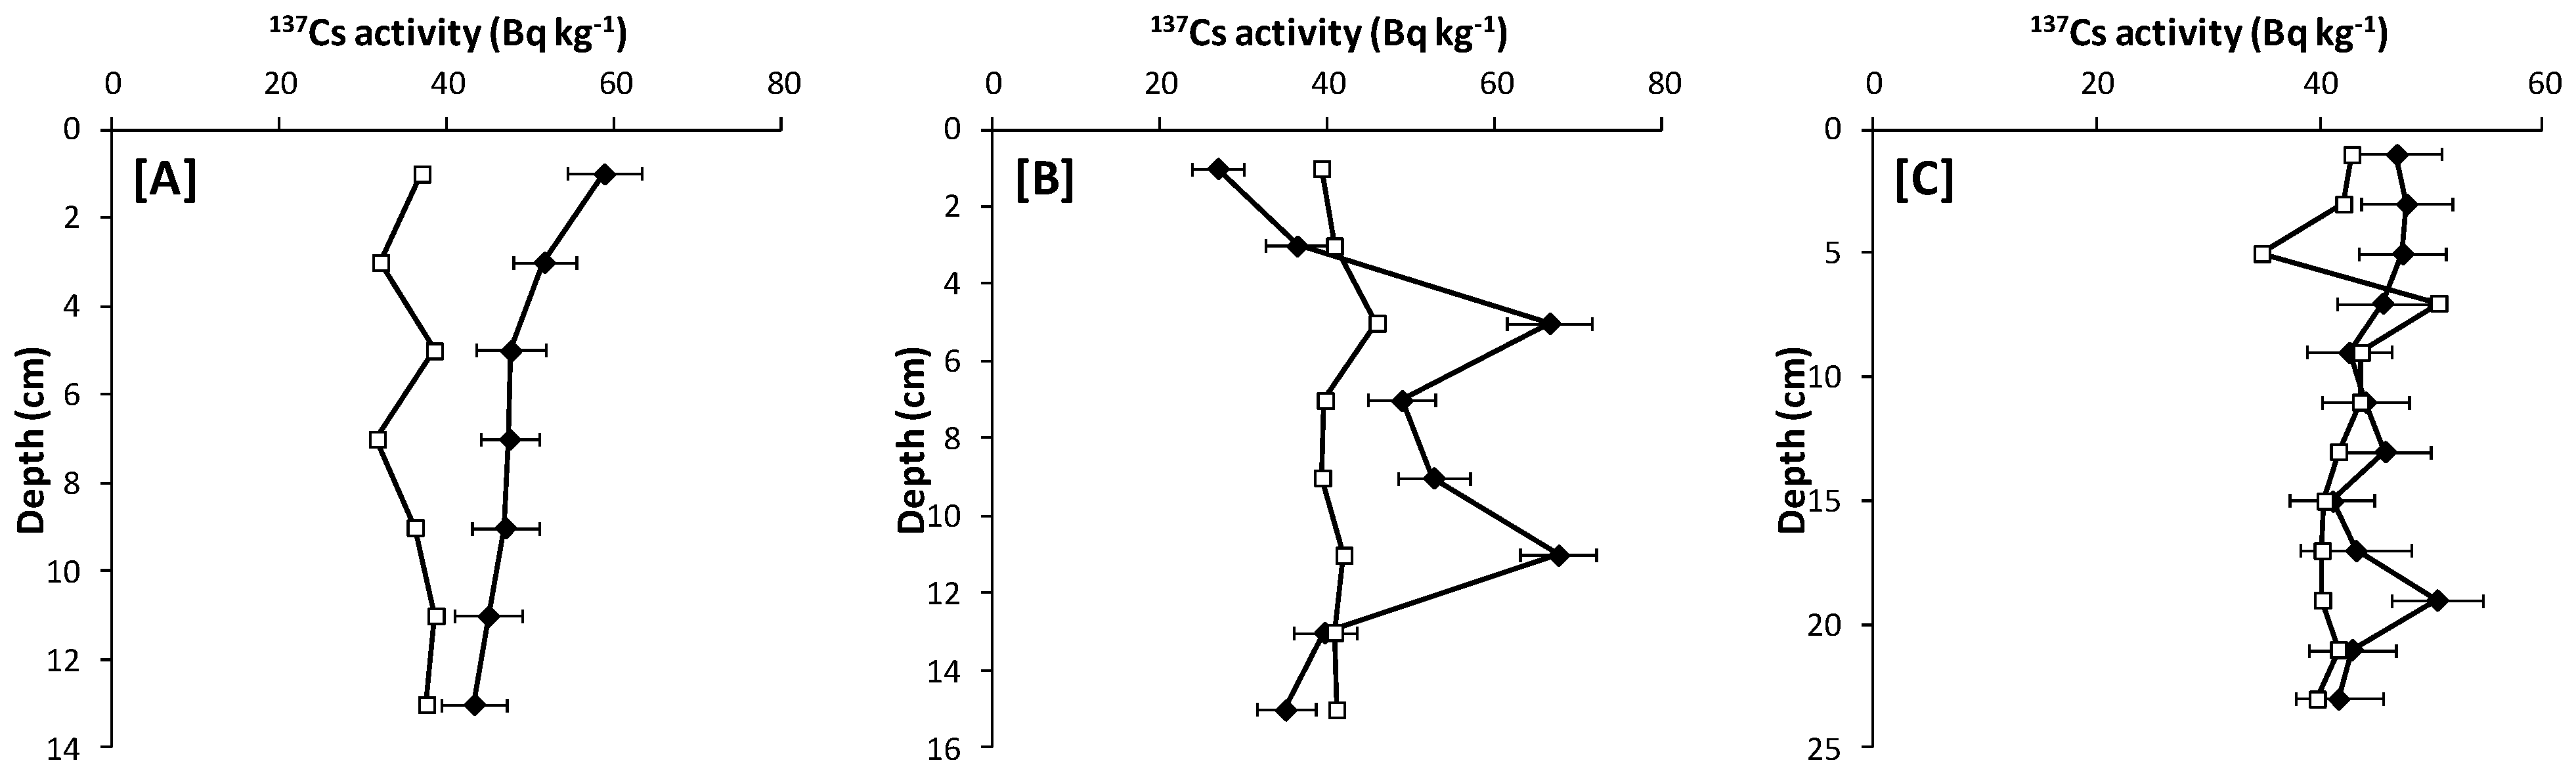
3.1. Activity Concentrations in Sediments

Mean specific activity concentrations of radionuclides in sediments of the study area are presented in Figure 2 and Figure 3. Values below the detection limit were excluded from the calculation of the mean concentrations for each site. The range of observed activity concentrations of all radionuclides measured are presented in Table 2. The average values of all the radionuclides measured in this study were higher than those reported for similar environments in the Niger Delta and Nigeria [13,14], as well as typical global averages [23].
The activity concentrations of 238U were highest downstream, followed by the point of industrial activities, with the upstream site experiencing the lowest concentration (Figure 2 and Table 2). However, analysis of variance showed the difference between the three sampling locations in the Bonny estuary was not statistically significant (p = 0.09) for 238U distribution, allowing the null hypothesis (there is no significant difference between the sites) to be accepted. In contrast, the 226Ra distribution varied significantly between the three sampling locations (p = 0.001), with the highest value occurring at the point of industrial activities. Furthermore, the 226Ra/238U ratio was less than one at all three locations (0.45, 0.62 and 0.37 for upstream, point of industrial activity and downstream respectively). These data suggest possible anthropogenic input of 238U and 226Ra at the study location, which otherwise should be at secular equilibrium with each other, as well as exhibiting more uniform distribution patterns in the study area.
Activity concentrations of 40K in the Bonny estuary were higher than reported elsewhere in the Niger Delta and Nigeria [13,14], but there was no significant difference between the sample sites (p = 0.59). If anthropogenic inputs are significant in the Bonny estuary, they are widely distributed across the three sites.
Table 2. Activity concentration ranges for radionuclides in the sediments of the Bonny estuary.
Sampling Stations238U (Bq·kg−1)232Th (Bq·kg−1)40K (Bq·kg−1)226Ra (Bq·kg−1)137Cs (Bq·kg−1)
BNN1<383–601482–8191150–3120193–24243–59
BNN2<461–575415–840300–9800269–484<39–67
BNN3<469–812370–540<1032–3760175–327<44–50
Table 3. Radionuclide concentration and effective dose estimate in fish samples from Bonny estuary, Niger Delta, Nigeria. The errors quoted are 1σ based on the propagation of counting statistics, except for 210Po data, which are based on the triplicate analysis of the sample.
RadionuclidesEffective Dose (μSv·y−1)
SamplesCommon nameConsumption rate (kg·y−1)226Ra (Bq·kg−1)232Th (Bq·kg−1)238U (Bq·kg−1)40K (Bq·kg−1)137Cs (Bq·kg−1)Supported 210Po (Bq·kg−1)Unsupported 210Po (Bq·kg−1)Lower limitUpper limit
Mollusc
T.fuscatus var.radulaperiwinkle256.6 ± 0.417.7 ± 1.057.3 ± 11.791.7 ± 5.61.5 ± 0.122.6 ± 1.5163 ± 47441203
T.fuscatus var.fuscatusperiwinkle254.3 ± 0.39.8 ± 0.8120 ± 15<22.5<0.823.9 ± 0.4174 ± 17721266
Ergeria radiataclam257.4 ± 0.431.2 ± 1.8<97.5132.7 ± 8.6<0.932.8 ± 1.9238 ± 511131787
Thais spdog whelk254.7 ± 0.313.8 ± 1.0<112152.5 ± 9.60.9 ± 0.117.5 ± 1.7138 ± 56611085
G. gasaroyster255.5 ± 0.311.1 ± 0.8<72.344.3 ± 4.60.8 ± 0.117.0 ± 1.6123 ± 4579927
Crustaceans
Macrobrachium spshrimp254.7 ± 0.310.8 ± 0.8<98.268.2 ± 6.21.0 ± 0.19.4 ± 1.173 ± 3431656
Penaeus notialiscray fish254.7 ± 0.39.3 ± 0.8103 ± 1571.8 ± 6.6<0.915.7 ± 1.0123 ± 3571947
Portonus spcrab254.4 ± 0.39.9 ± 0.8<80.847.3 ± 5.10.8 ± 0.110.7 ± 1.284.5 ± 3431691
Fin fish
Ethmalosa fimbriatabonga fish254.5 ± 0.311.0 ± 0.8<85.937.4 ± 5.2<0.828.3 ± 1.5223 ± 48451532
Figure 2. Mean activity concentrations of radionuclides in sediments of Bonny estuary.
Challenges 06 00244 g002
Figure 3. 137Cs activity profiles of sediments from three sites in the Bonny estuary. (A) BNN1, upstream site; (B) BNN2, point of industrial activity; (C) BNN3, downstream site. Open symbols are the detection limit for each sample. Error bars represent 1σ uncertainties based on the propagation of counting statistics.
Challenges 06 00244 g003
Activity concentrations of 137Cs in the Bonny estuary were within reported ranges in similar environments that are far from nuclear discharges and accidents [24]. Its activity differs significantly between the three sampling locations (p = 0.200), with BNN2 having a significantly higher mean 137Cs concentration than the other two sites. This finding is unexpected given that the origin of 137Cs is predominantly atmospheric fallout from nuclear testing and nuclear accidents in other parts of the world and not influenced by local inputs. However, the difference between the sites may reflect more the distribution of 137Cs in the cores (Figure 3) than spatial differences in deposition. The core at BNN2 is typical of undisturbed sediments, with peak 137Cs concentrations occurring at depth. The downstream site, BNN3, however, has a relatively uniform 137Cs profile, and the upstream site, BNN1, has a surface peak, both of which may be the result of dredging. If previously contaminated sediments have been removed, this could result in a lower mean 137Cs concentration at these sites.
The heterogeneous industrial and other intense anthropogenic activities along the course and banks of the estuary may be responsible for the higher values of activity concentrations of radionuclides recorded at the study location. The largest releases of technologically enhanced NORM to European waters come from oil and gas industries and the production of phosphate fertilizers [25]. These sources are well represented at the study area. In addition, the cement factories along the banks of the estuary may play significant role in producing elevated levels of the studied radionuclides. Cement has being reported to contain high background values of 40K, 226Ra and 232Th associated with limestone, gypsum, clay, shale and other raw materials used in the production of cement [26]. The activity concentrations of 40K, 226Ra and 232Th in the sediments of the Bonny estuary were higher than reported in raw cement samples in Nigeria [26,27], as well as for many other countries, such as Malaysia, Brazil, UK, Hong Kong [28] and the typical global averages [29,30].

3.2. Activity Concentration in Seafood Samples

Means and combined uncertainties of activity concentrations of radionuclides in fish and shellfish samples are presented in Table 3. The total highest activity concentration in all the seafood species of gamma emitting radionuclides was observed for 40K, followed by 232Th and 226Ra respectively. Uranium-238 was below the detection limit for most seafood samples...Caesium-137 was present at very low concentrations, and was frequently below the detection limit. The highest values of 232Th and 226Ra were both recorded in Ergeria radiata while their lowest values were recorded in Penaeus notialis and T. fuscatus var fuscatus respectively. Potassium-40 activity concentrations ranged between BDL (<22.5 Bq·kg−1) in T. fuscatus var fuscatus to 152.5 ± 9.6 Bq·kg−1 in Thais species. Radionuclide concentrations measured in all species in the present study were similar to values reported elsewhere for similar seafood in India, Pakistan and Lebanon (Ghose et al., 2000) and similar to values reported for other foodstuffs in Nigeria [31]. However, higher activity concentrations of 226Ra have been reported in fish samples in South Africa [32].
Two values are presented for 210Po. The activity of the parent of 210Po, 210Pb, had not been determined, and given the time elapsed between sampling and analysis, any decay and ingrowth play a considerable role in determining the concentration at time of sampling. Therefore, upper and lower limits are presented, representing the cases in which 210Po is completely unsupported and fully supported. Given the known preferential uptake of 210Po compared to 210Pb [33], the upper limit based on unsupported Po-210 is more likely to be realistic. The highest activity concentration of 210Po was observed for Ergeria radiata and the least was recorded in Macrobrachium sp (Table 3). Much higher activity of 210Po (1181.29 Bq·kg−1) has been reported in whole scallop from the Bay of La Rochelle [34] and in bottom feeders in South Africa near a mine [32]. Concentrations of 210Po are elevated compared to its grandparent, 226Ra, but this observation is expected given that marine organisms, especially filter feeders, are well-known to strongly bioaccumulate 210Po [33].

3.3. Effective Dose Due to Ingestion of Fish

The effective dose to an individual due to ingestion of one type of food containing radionuclides is calculated based on the [35,36] metabolic model, which provides the relevant conversion factors to calculate effective doses from the total activity concentrations of radionuclides measured in the food. The model is based on the measured activity concentrations of the radionuclides in the food type (Bq·kg−1), the consumption rate of the food type and the dose conversion factor for each radionuclide present in the food type (Equation (1)):
DA = CR × IA × CF
where DA is the effective dose for a given food type (Sv·y−1), CR is the radionuclide concentration (Bq·kg−1), IA is the rate of consumption of the food type (kg·y−1) and CF is the conversion factor (Sv·Bq−1). The total dose via ingestion of fish can be calculated by summing the doses derived for each radionuclide.
The values of CF for 238U, 232Th, 40K, 226Ra, 137Cs, 210Po and 210Pb are 4.8 × 10⁻⁸ Sv·Bq−1, 2.3 × 10⁻⁷ Sv·Bq−1, 6.2 × 10⁻⁹ Sv·Bq−1, 2.8 × 10⁻⁷ Sv·Bq−1, 1.3 × 10⁻⁸ Sv·Bq−1, 2.4 × 10⁻⁷ Sv·Bq−1 and 6.8 × 10⁻⁷ Sv·Bq−1, respectively [35,36]. The effective doses due to ingestion of fish from the Bonny Estuary were calculated for adult members of the public who consume an average of 25 kg of the fish per year [20,37]. Smaller amounts (on average 15 kg·y−1) can be consumed as condiment.
The estimated total effective dose due to intake of radionuclides in fish and shellfish species from the study area are presented in Table 3, together with the lower and upper effective doses received as a result of consuming seafood from the study area. These effective dose ranges are based on the supported and unsupported components of 210Po from the decay of 210Pb and other sources in the study area respectively. The importance of high contribution of 210Po to total effective dose cannot be overemphasised as some of its lower limit doses were still higher than the stipulated worldwide ingestion exposure dose value of 0.29 mSv·y−1 [23]. The overall highest total effective doses were delivered by the fin fish Etmalosa fimbriata followed Ergeria radiata, respectively, which are the species with the highest 210Po concentrations. In general, the higher doses are associated with the consumption of molluscs, rather than crustaceans, which may be attributed to their ecology and biology, given that they are filter feeders and ingest a significant amount of sediment during feeding activities. Consequently, they tend to bioaccumulate particle reactive radionuclides more strongly.
Doses were calculated on the basis that the annual fish consumption was of a single species. Clearly, people eat a mixture of the available species, and therefore doses will vary within the range presented here. The total effective doses from consuming any one of the species studied was higher than the worldwide ingestion exposure dose value of 0.29 mSv·y−1 [23], and in addition several of the species, particularly the molluscs, result in doses exceeding the recommended total effective dose of 1 mSv·y−1 to the adult public [38]. Higher consumption rates of these species may therefore be a cause for public health concern.
The percentage contribution of radiation dose was ranked in the order 210Po > 238U > 232Th > 226Ra > 40K > 137Cs with 210Po contributing more than 50% of total effective dose from each species. Polonium-210 has been considered as one of the most radiotoxic naturally occurring elements [39] (Al Masri et al., 2004) and by far the major contributor of radiation dose to humans through ingestion of foodstuffs [23]. According to Faanhof and Louw [32], 210Po accounted for up to 2100 μSv·y−1 of total effective dose from ingestion of fish from a mining area in South Africa. The estimated effective doses from some of the species studied here were lower than reported in the South African study, but are higher than effective doses reported for most other foodstuffs in Nigeria, including foodstuffs from areas with high background levels of radionuclides [12,31]. The estimated effective dose by this study was also higher than effective dose due to ingestion of fish in India, Pakistan and Lebanon [40] (Ghose et al., 2000), but falls within reported average consumption doses for all radionuclides in foodstuff in United Kingdom [41].

4. Conclusions

Knowledge about the occurrence and concentration of natural radioactivity in environmental samples is essential for monitoring their background levels and provide insight into changes in their concentrations that may result from anthropogenic inputs. This knowledge can be useful in understanding the effects of ionising radiation on the environment and also for the estimation of radiological hazards to human health. Baseline data of the present study provides a platform for measuring future changes in radioactivity levels in the Bonny estuary Niger Delta, Nigeria. The information provided by this study on estimated effective dose due to ingestion of fish resources from the study area can be useful for holistic assessment of public health effects on inhabitants of the study area due to exposure to radioactivity.

Acknowledgments

This work was carried out at the Lancaster Environment Centre, UK, funded by the Commonwealth Scholarship Commission, UK (NGCN-2011-207), the International Atomic Energy Agency (RAF7008) and the International Foundation for Science Sweden (W/5246-1).

Author Contributions

Bolaji Babatunde and Francis Sikoki conceived the idea, Bolaji Babatunde carried out the work supervised by Francis Sikoki and Ibitoruh Hart, Bolaji Babatunde did the data analysis supervised by Francis Sikoki, Ibitoruh Hart supported with some materials including seafood samples. Bolaji Babatunde wrote the manuscript supervised and proof read by Francis Sikoki and Ibitoruh Hart. The funding sponsors had no role in the design of the study; in the collection, analyses, or interpretation of data; in the writing of the manuscript, and in the decision to publish the results.

Conflicts of Interest

The authors declare there is no conflict of interest.

References

  1. McDonald, P.; Baxter, M.S.; Scott, E.M. Technological enhancement of natural radionuclides in marine environment. J. Environ. Radioact. 1996, 32, 67–90. [Google Scholar] [CrossRef]
  2. MacKenzie, A.B. Environmental radioactivity: Experience from the 20th century—Trends and issues for the 21st century. Sci. Total Environ. 2000, 249, 313–329. [Google Scholar] [CrossRef]
  3. Cochran, J.K. The oceanic chemistry of the uranium- and thorium-series nuclides. In Uranium Series Disequilibrium: Applications to Earth, Marine and Environmental Sciences; Ivanovich, M., Harmon, R.S., Eds.; Clarendon Press: Oxford, UK, 1992; pp. 334–395. [Google Scholar]
  4. Linsalata, P. Uranium and thorium decay series radionuclides in human and animal foodchains—A review. J. Environ. Qual. 1994, 23, 633–642. [Google Scholar] [CrossRef]
  5. Chau, N.D.; Dulinski, M.; Jodlowski, P.; Nowak, J.; Rozanski, K.; Sleziak, M.; Wachniew, P. Natural radioactivity in groundwater—A review. Isotopes Environ. Health. Stud. 2011, 47, 415–437. [Google Scholar] [CrossRef] [PubMed]
  6. Sohrabi, M. The state-of-the-art on worldwide studies in some environments with elevated naturally occurring radioactive materials (NORM). Appl. Radiat. Isot. 1998, 49, 169–188. [Google Scholar] [CrossRef]
  7. Tayibi, H.; Choura, M.; Lopez, F.A.; Alguacil, F.J.; Lopez-Delgado, A. Environmental impact and management of phosphogypsum. J. Environ. Manag. 2009, 90, 2377–2386. [Google Scholar] [CrossRef] [PubMed] [Green Version]
  8. Adam, K.S.; Ahamed, M.M.O.; El Khangi, F.A.; El Nigumi, Y.O.; Holm, E. Radioactivity levels in the Red Sea coastal environment of Sudan. Mar. Pollut. Bull. 1998, 36, 19–26. [Google Scholar]
  9. Azouazi, M.; Ouahidi, Y.; Fakhi, S.; Andres, Y.; Abbe, J.C.; Benmansour, M. Natural radioactivity in phosphates, phosphogypsum and natural waters in Morocco. J. Environ. Radioact. 2001, 54, 231–242. [Google Scholar] [CrossRef]
  10. El-Gamal, A.; Nasr, S.; El-Taher, A. Study of the spatial distribution of natural radioactivity in the upper Egypt Nile River sediments. Radiat. Meas. 2007, 42, 457–465. [Google Scholar] [CrossRef]
  11. Radi Dar, M.A.; El-Saharty, A.A. Some radioactive elements in the coastal sediments of the Mediterranean Sea. Radiat. Prot. Dosim. 2013, 153, 361–368. [Google Scholar] [CrossRef] [PubMed]
  12. Jibiri, N.N.; Farai, I.P.; Alausa, S.K. Estimation of annual effective dose due to natural radioactive elements from ingestion of foodstuffs in tin mining area of Jos-Plateau, Nigeria. J. Environ. Radioact. 2007, 94, 31–40. [Google Scholar] [CrossRef] [PubMed]
  13. Agbalagba, E.O.; Onoja, R.A. Evaluation of natural radioactivity in soil, sediment and water samples of Niger Delta (Biseni) flood plain lakes, Nigeria. J. Environ. Radioact. 2011, 102, 667–671. [Google Scholar] [CrossRef] [PubMed]
  14. Jibiri, N.N.; Okeyode, I.C. Activity concentrations of natural radionuclides in the sediments of Ogun River, Southwestern Nigeria. Radiat. Prot. Dosim. 2011, 147, 555–564. [Google Scholar] [CrossRef] [PubMed]
  15. Avwiri, G.O.; Agbalagba, E.O. Studies on radiological impact of oil and gas activities in oil mineral lease 30 (Om130) oil fields in Delta State, Nigeria. J. Pet. Environ. Biotechnol. 2012, 3, 1–8. [Google Scholar] [CrossRef]
  16. Akpomuvie, O.B. Tragedy of commons: Analysis of oil spillage, gas flaring and sustainable development of the Niger Delta of Nigeria. J. Sustain. Dev. 2011, 4, 200–210. [Google Scholar]
  17. Dublin-Green, C.O. Some Textural Characteristics and Organic Content of Recent Sediments in the Bonny Estuary, Niger Delta Technical Paper 67; Nigerian Institute of Oceanography and Marine Research: Lagos, Nigeria, 1988. [Google Scholar]
  18. Jamabo, N.; Chinda, A. Aspects of the ecology of Tympanotonus fuscatus var fuscatus (Linnaeus, 1758) in the mangrove swamps of the upper Bonny River, Niger Delta, Nigeria. Curr. Res. J. Biol. Sci. 2010, 2, 42–47. [Google Scholar]
  19. Edun, O.M.; Akinrotimi, O.A.; Uka, A.; Owhonda, K.N. Patterns of mudskipper consumption in selected fishing communities of Rivers State. J. Agric. Soc. Res. 2010, 10, 100–108. [Google Scholar] [CrossRef]
  20. Gomna, A.; Rana, K. Inter-household and intra-household patterns of fish and meat consumption in fishing communities in two states in Nigeria. Br. J. Nutr. 2007, 97, 145–152. [Google Scholar] [CrossRef] [PubMed]
  21. Short, K.C.; Stauble, A.J. Outline of geology of Niger Delta. AAPG Bull. 1967, 51, 761–779. [Google Scholar]
  22. Taiwo, B.A.; Tse, C.A. Spatial variation in groundwater geochemistry and water quality index in Port Harcourt. Sci. Afr. 2009, 8, 134–155. [Google Scholar]
  23. UNSCEAR. Sources, Effects and Risks of Ionization Radiation, Report to the General Assembly; United Nations: New York, NY, USA, 2000. [Google Scholar]
  24. Junge, B.; Mabit, L.; Dercon, G.; Walling, D.E.; Abaidoo, R.; Chikoye, D.; Stah, K. First use of the 137Cs technique in Nigeria for estimating medium-term soil redistribution rates on cultivated farmland. Soil Tillage Res. 2010, 110, 211–220. [Google Scholar] [CrossRef]
  25. Betti, M.; Aldave de las Heras, L.; Janssens, A.; Henrich, E.; Hunter, G.; Gerchikov, M.; Dutton, M.; van Weers, A.W.; Nielsen, S.; Simmond, J.; et al. Effects of discharges of naturally occurring radioactive material. J. Environ. Radioact. 2004, 74, 255–277. [Google Scholar] [CrossRef] [PubMed]
  26. Ademola, J.A. Assessment of natural radionuclide content of cements used in Nigeria. J. Radiol. Prot. 2008, 28, 581–588. [Google Scholar] [CrossRef] [PubMed]
  27. Gbadebo, A.M.; Amos, A.J. Assessment of radionuclide pollutants in bedrocks and soils from Ewekoro Cement Factory, Southwest Nigeria. Asian J. Appl. Sci. 2010, 3, 135–144. [Google Scholar]
  28. El-Taher, A. Assessment of natural radioactivity levels and radiation hazards for building materials used in Qassim area, Saudi Arabia. Rom. J. Phys. 2012, 57, 726–735. [Google Scholar]
  29. Organization of Economic Cooperation and Development (OECD). Exposure to Radiation from Natural Radioactivity in Building Materials; Nuclear Energy Agency, OECD: Paris, France, 1979. [Google Scholar]
  30. UNSCEAR. Sources and Effects of Ionizing Radiation, Report to the General Assembly; United Nations: New York, NY, USA, 1993. [Google Scholar]
  31. Jibiri, N.N.; Okusanya, A.A. Radionuclide contents in food products from domestic and imported sources in Nigeria. J. Radiol. Prot. 2008, 28, 405–413. [Google Scholar] [CrossRef] [PubMed]
  32. Faanhof, A.; Louw, I. The measurement of natural radioactivity in fish and the impact on humans. J. Radioanal. Nuclear Chem. 2001, 249, 227–232. [Google Scholar]
  33. Fowler, S.W. 210Po in the marine environment with emphasis on its behaviour within the biosphere. J. Environ. Radioact. 2011, 102, 448–461. [Google Scholar] [CrossRef] [PubMed]
  34. Bustamante, P.; Germain, P.; Leclerc, G.; Miramand, P. Concentration and distribution of Po-210 in the tissues of the scallop Chlamys varia and the mussel Mytilus edulis from the coasts of Charente-Maritime (France). Mar. Poll. Bull. 2002, 44, 997–1002. [Google Scholar] [CrossRef]
  35. ICRP. Dose Coefficient for Intakes of Radionuclides by Workers ICRP publication 68; Pergamon Press: Oxford, UK, 1994. [Google Scholar]
  36. ICRP. Conversion coefficients for use in radiological protection against external radiation. Ann. ICRP 1996, 26, 3–4. [Google Scholar]
  37. Sikoki, F.D.; Zabbey, N. Aspects of fisheries of the middle reaches of Imo River, Niger Delta, Nigeria. Environ. Ecol. 2006, 24, 309–312. [Google Scholar]
  38. ICRP. 1990 Recommendations of the International Commission on Radiological Protection. Ann. ICRP 1991, 21, 1–3. [Google Scholar]
  39. Al Masri, M.S.; Byrakdar, M.E.; Mamish, S.; Al-Haleem, M.A. Determination of natural radioactivity in Euphrates river. J. Radioanal. Nuclear Chem. 2004, 261, 349–355. [Google Scholar] [CrossRef]
  40. Ghose, S.; Alam, M.N.; Islam, M.N. Radiation dose estimation from the analysis of radionuclides in marine fish of the Bay of Bengal. Radiat. Prot. Dosim. 2000, 87, 287–291. [Google Scholar] [CrossRef]
  41. McDonald, P.; Jackson, D.; Leonard, D.R.P.; McKay, K. An assessment of 210Pb and 210Po in terrestrial foodstuffs from regions of England and Wales. J. Environ. Radioact. 1999, 43, 15–29. [Google Scholar] [CrossRef]

