1. An Unheard-Of Literary Work
The Gospel as revealed to me (
L’
Evangelo come mi è stato rivelato,
Valtorta 2001) is the main literary work by Maria Valtorta (1897–1961), in the following referred to as the EMV, in which she reports a very detailed life of Jesus of Nazareth. She wrote it straight off on common notebooks, while bedridden for serious health problems, mainly in the years between 1943 and 1947. To give an idea of its extension, the longest novel ever written—
À la recherche du temps perdu by Marcel Proust—contains an estimated 9,609,000 characters (including spaces), whereas the EMV, printed in ten books, contains about 10,800,000 characters. The EMV describes events and characters that animate the story of Jesus’ life narrated in the Gospels, but enriched with detailed descriptions of landscapes, costumes, uses, roads, towns with their buildings (including the Temple in Jerusalem) and streets, rivers, lakes, hills, valleys, plantations, climate, even the night sky with its constellations, stars and planets. The richness of narrative elements in the EMV has allowed to pursue many studies on it because Maria Valtorta states that it is not due to her fantasy, but that she has written down everything she watched “in vision”, or was dictated to her by Jesus, as if she was really present 2000 years ago when the events narrated in the Gospels occurred.
In her writings, for example, there are many narrative elements that convey chronological information like days of worship rest, references to major Jewish holy days, market days, seasons, months related both to the Jewish lunar-solar and Julian calendars used 2000 years ago in the Holy Land under the Roman empire. No date, however, is stated explicitly with respect to the Julian calendar, except for a single case (EMV 461.16).
1 However, even in this case, the year is not indicated. We find also many references to the moon in the night sky (moon phases), to planets, constellations, weather conditions, all narrative elements that enrich the events of Jesus’ life described, so detailed that they seem to be real data, as if they were recorded by a careful observer present at the scene. The astronomical and meteorological data contained in Valtorta’s work are so accurate that they have allowed pursuing several scientific investigations on them.
The most obvious hypothesis is that all calendar and astronomical data contained in the EMV are the result of the Maria Valtorta’s narrative fantasy. If this is the case, any analysis of these data would not lead to a coherent chronological framework associated with the described events concerning Jesus’ life. However, in principle, there is also another possibility, a conjecture: all the astronomical and calendar data contained in the EMV are related to a well-defined chronology and, consequently, their accurate analysis would allow associating a precise date to each event of Jesus’ life described in Valtorta’s work, according to the Julian calendar. The latter result, in turn, if it were confirmed, would imply the need to explain the origin of this chronological information embedded in Valtorta’s work. Indeed, it cannot be justified by her knowledge, skills and awareness. Astronomical data, in fact, lead to establish precise dates, through complex mathematical calculations, and these exclude that Maria Valtorta was aware of the chronological information underlying her writings because we know, for certain, from her biography, that she had neither astronomical education nor the high scientific expertise needed to perform these calculations. Indeed, she was definitely hopeless at mathematics and calculations.
2 Furthermore, she had never been in the Holy Land (
Pisani 2010). Moreover, during the Second World War there were neither softwares nor computers to perform complex astronomical calculations. Maria Valtorta had very few books, which can be consulted visiting her house in Viareggio (Tuscany, Italy). Neither books nor tables or other astronomical material were available in her house during the Second World War, when she wrote her manuscripts as, moreover, confirmed by eyewitnesses when she was alive. In addition, of course, it is not scientifically possible to retrieve detailed chronological information belonging to a remote past by means of mystic visions. Therefore, it would seem quite obvious to expect that the intersection of many calendar and astronomical information in the long narrative of Jesus' life reported in the EMV should lead, inevitably, to many chronological contradictions.
Since the 1990s the verification of this point was at the center of scientific studies on her literary work (
Aulagnier 1994;
Van Zandt 1994;
Lavère 2012,
2014;
De Caro 2014,
2015). In addition, the recent detailed analysis of her writings has demonstrated, surprisingly, that every event narrated underlies a precise date, without any contradiction. To give an idea of what has emerged from these studies, in the present paper we provide first a short example of the research work on the EMV based on the analysis of astronomical and chronological data, referring the reader to the cited bibliography for more exhaustive results (
De Caro 2014,
2015). Secondly, we analyze Maria Valtorta’s literary work according to meteorology to verify the statistical plausibility of her descriptions about rainfall days.
2. From the EMV Astronomical Data the Determination of Jesus’ Crucifixion Date
The Jewish calendar is lunar-solar and even after thousands of years it can be reconstructed thanks to Astronomy, because of the periodicity of the motion of the Moon around the Earth and of the latter around the Sun. Isaac Newton was the first who introduced the modern approach to date the crucifixion of Jesus by calculating when the crescent of the new moon was first visible from Jerusalem (
Pratt 1991). He obtained Friday, April 23 of the year 34, corresponding to the 14 of Nisan of the luni-solar calendar, that is the Easter Eve. This result was published in a work after his death, in 1733 (
Newton 1733;
Pratt 1991). Recent studies confirm the possible historical accuracy of Newton’s crucifixion dating (
La Greca and De Caro 2017). Surprisingly, as we will see in the following, also the EMV data, that can be submitted to astronomical and calendar analysis, lead to the same crucifixion dating. Indeed, a detailed analysis of the explicit calendar information contained in the EMV—as references to the days of worship rest (Saturdays)—and implicit information—as references to the lunar phases, constellations, planets visible in the night sky—has given, unexpectedly, a coherent chronological framework. To every event narrated in Maria Valtorta’s literary work we can associate a specific date, determined by the intersection of many narrative elements carrying chronological constraints. This result could imply that the astronomical and calendar information contained in the EMV cannot be the result of her fantasy. It is outside the scope of this paper to answer the question of how this is possible and to check in detail how to rebuild the aforementioned chronological framework. For the latter point, see the previously cited references (
De Caro 2014,
2015).
To give an idea of how binding is the calendar information reported by Maria Valtorta, although in all her writings no date is ever specified, we show next how it is possible to determine univocally the date of Jesus’ crucifixion from the EMV. Valtorta’s narration of Jesus’ life explicitly states that in the year before his death, the Easter Eve—14 of Nisan of the lunar-solar calendar—was a Friday (EMV 372–375) and that Easter fell on the Sabbath (EMV 378.3). The crucifixion is also placed on a Friday, Easter Eve, according to the chronology of the events of Jesus’ death described in John’s Gospel, with the additional constraint that in both years the feast fell in April (EMV 376.1, 576.1). Moreover, also the penultimate Easter of Jesus before his death is placed in April (EMV 195.3), without indicating the day of the week. These data are extremely binding to determine the possible dates of the Julian calendar associated with these Jewish holy days. Indeed, the lunar-solar calendar year is made of 12 lunar months of 354 days, about 11 days shorter than the solar year. For this reason, about every 3 years the Jewish calendar requires 13 lunar months leading to embolismic years. In this way the calendar can be realigned with the seasons. The modern Jewish calendar has already fixed the sequence of years consisting of 13 months, but in the first century was not so, and years with 13 months were officially proclaimed by the Sanhedrin when necessary.
Because of the latitude of the Holy Land and the resulting mild weather, the spring equinox, which defines astronomically the end of winter, was usually a sufficient date to ensure adequate growth of the lambs to be sacrificed for Easter, and the presence of the first ears of barley, or ripe wheat, to be offered during the liturgy of the Unleavened Bread on the 16th of Nisan. When that did not happen, because of a too harsh winter, even though it was already a date after the spring equinox, a thirteenth month was inserted to postpone Easter by 29–30 days. We do not know which years of the first century were embolismic, but Astronomy allows us to determine them, at least in terms of plausibility.
In the modern version of the Jewish calendar, the beginning of the lunar months of about 29.5 days is today pre-determined according to well defined rules. Two thousand years ago, instead, a lunar month began only after direct observation of the first crescent moon at sunset, after the conjunction of the Moon with the Sun (new moon). However, by observing the sky with naked eyes it is not always possible to verify that the moon is in the crescent phase already in the first day after the conjunction and, consequently, some months were of 29 days, others of 30, never of 31 or 28, by general convention. Experience shows, in fact, that observing the sky with naked eyes, it is very difficult to see the moon in the twilight of sunset if the fraction of the lunar disk illuminated by the sun is less than 2%. This missed observation would have caused a delay of 1 day to the start of a lunar month. Also adverse weather conditions could have delayed the start of a lunar month of 1 day because, in the first day after conjunction with the Sun, the very thin crescent moon is visible in the sky only for about an hour after sunset.
By means of specialized software
3 it is now possible to determine the time of Moon rising and calculate with sufficient accuracy the percentage of its disk illuminated by the Sun, as it was visible from Jerusalem 2000 years ago. We can therefore evaluate when lunar months started relative to the Julian calendar used in the first century AD in the Roman Empire. For example, we can reconstruct the dates of the main Jewish pilgrimage holy days, such as Easter and Tabernacles. The beginning of these holy days started at the sunset of the day 14 of the first and seventh lunar month, respectively, when started the new day, the 15th of the month, within a delay of about 24–36 h relative to the actual full moon, also caused by possible adverse weather conditions which could have delayed the beginning of a lunar month of one day. For this reason, any reconstruction of lunar months of the Jewish calendar during the Roman period has to be considered always affected by an unavoidable indetermination of 1 day.
After these general remarks, it is worth noting that the occurrence that Easter eve falls on the same day of the week in two consecutive years, as it can be evinced from Valtorta’s writings, represents a strong calendar constraint. In fact, because a lunar month is made of about 29.5 days, 12 lunar months amount to 354 days with a rest of few hours. However, 354 is not an integer multiple of 7, there is a rest of 4. Therefore, from this straight calculation, it is clear that after 12 lunar months Easter cannot fall on the same day of the week of the year before. Conversely, 13 lunar months amount to 384 days with a rest of few hours. Also 384 is not divisible by 7 because it gives the rest 1. However, if there was a delay of 1 day in deciding the start of Nisan, possible due to the flexibility with which in the first century AD the start of a month was proclaimed, we could find that, at the end of an embolismic year, Easter would have occurred on the same day of the week of the year before. In other words, if these two conditions were both at work-embolismic year and delay of 1 day in the start of Nisan-, two consecutive Easters could have fallen on the same day of the week.
By analyzing the possible dates of Easter in the years in which Pontius Pilate was in Judea (26–36 AD), it is possible to verify that only in the years 33 and 34 the 14 of Nisan (Easter Eve) was a Friday of April, according to Maria Valtorta’s writings. There are no other possibilities, as it can be deduced from the most important astronomical studies on Jesus’ crucifixion (
Fotheringham 1934;
Schafer 1990;
Finegan 1998;
Humphreys and Waddington 1992;
Bond 2013). The results of the analysis are summarized in
Table 1. In gray there have been shown days that fall on Saturday and, graphically, also the lunar phases.
From
Table 1 it is clear that only in the years 33 and 34 two consecutive Easters could have fallen on Saturday, highlighted by two gray boxes in the same row, and both in April, as required by the EMV, if it is assumed that the year 34 was embolismic and its Nisan started with a delay of 1 day. If year 34 was embolismic also the year 31, most likely, was of 13 lunar months. With this calendar reconstruction, the Easter eve in the years 33 and 34 was Friday, April 3 for year 33 and April 23 for year 34. It is possible to verify that even forcing all Easters to fall in April also for years 26–28, it never happens that two Easter Eves occur on Friday (
Finegan 1998). Now, according to what we have just discussed, it was not at all obvious that there was a solution that would have satisfied all the constraints imposed to the problem, as required by the calendar information contained in the EMV. Moreover, there are many other narrative elements in the writings of Maria Valtorta that contain calendar and astronomical constraints that perfectly agree with the chronological reconstruction just done. For a more comprehensive discussion we refer to the cited studies (
De Caro 2014,
2015,
2017). Any belief that this agreement might be accidental is out of question.
This result, summarized in
Table 1, is emblematic to show a peculiar characteristic that emerges from the astronomical-calendar analysis of the EMV: the uniqueness of the chronological reconstruction associable with the described events of Jesus’ life. In this paper, for the sake of brevity, we have focused our attention only on the dating of the crucifixion, by showing that this date must necessarily be Friday, April 23 of the year 34. It is worth noting that all other dates derived by the astronomical and calendar analysis of the EMV and associated with the events narrated and, indirectly, with many events of Jesus’ life narrated in the canonical Gospels, are unambiguously established. As already evidenced, let us note, also, that the date of the crucifixion that emerges from the EMV is the same proposed by I. Newton, namely April 23 of the year 34. This date is rarely considered by historians, who usually put the crucifixion either to April 7 of the year 30 or to April 3 of the year 33. We cannot, therefore, assume that Maria Valtorta had been, somehow, influenced by what she knew about it. Indeed, if it was the case, one should expect to find in her writings indirect reference to either April 7, 30 or to April 3, 33, and not to Newton’s dating of crucifixion. Moreover, in 1933 there was an extraordinary Jubilee proclaimed by Pius XI to celebrate the 1900th anniversary of the crucifixion. All the Church and, thus, also Maria Valtorta knew this anniversary which leads directly to the year 33 AD for Jesus’ death. For all Catholics this was
the year of the crucifixion. Furthermore, as already noted, no date is explicitly reported in the EMV. It is only thanks to a complex and rigorous astronomical and calendar analysis of the narrative elements in Maria Valtorta’s writings that it is possible to establish an accurate chronology of every event in Jesus’ life described in the EMV. Curiously, what Maria Valtorta indicates as mystical visions and Jesus’ dictations, reported in the EMV, started on the Good Friday April 23, 1943, as if it had been an historical anniversary of Jesus’ crucifixion. Consider that before the year 1943 the Good Friday fell on April 23 only in 1886, and since 1943 it has never happened again. The next time will be Friday April 23, 2038. The fortuity, therefore, should be excluded and everything remains without a rational explanation. Indeed, if the crucifixion happened just on April 23 of the year 34 AD, then April 23, 1943, when Maria Valtorta started to write her mystic visions, was the anniversary of Jesus’s death. The date of 23 April 34 AD was not reported explicitly by Maria Valtorta. It has been obtained by a rigorous astronomical and calendar analysis of her writings. In other words, she knew nothing about it.
Let us discuss two possible explanations. First, we could speculate that the strong correlation of dates is only due to a fortuitous coincidence. However, the frequency with which Good Friday coincides with the 23 of April is very low, less than once every century and, consequently, it is unlikely that it happened by chance. Secondly, we could speculate that this strong correlation is due to a fraud. However, Maria Valtorta had just elementary mathematical ability, and that, in any case, all happened during the Second World War, when people fought every day to survive. During those years her daily life was also harder than that of other people in good health because she was bedridden being paralyzed, and lived in poverty in her little house in Viareggio. Thus, it is difficult to imagine she could take the time, express the willpower and the scientific expertise, that she had not, to devise and realize such a sophisticated fraud. Secondly, in 1942 the Good Friday coincided with the 3rd of April, i.e., just the date proclaimed by Pius XI less than 10 years earlier, as previously recalled, as the historical date of crucifixion. Therefore, it is more reasonable to speculate that any probable fraud would have started everything on the 3rd of April 1942, Good Friday of that year, and would have suitably constructed all astronomical and calendar data correlated with the 3 of April of the year 33 AD, as the day of crucifixion. However, this is not the case and all her writings lead to the less-known date of Jesus’s death proposed by Isaac Newton, known only by few scholars even today. Indeed, Maria Valtorta was acquainted with the name of this scientist from her secondary school years (in Collegio Bianconi in the city of Monza, Lombardy, Italy) as the author of the three Laws of Dynamic and the Theory of Gravitation, and he was actually unknown for his biblical studies and his dating of crucifixion. Indeed, these studies were published only after his death, in Latin, and they were known only by very few scholars of that time. Only during the first half of the XX century, Newton’s work about the crucifixion dating was translated in English, a language that Maria Valtorta did not know, as she explicitly wrote on July 21 1945 (
Valtorta 2006).
3. Rainy Days Described in the EMV and Their Dating According to the Astronomical Analysis
Astronomy is not the only science with which we can analyze the EMV. Maria Valtorta has annotated also observations about the meteorological conditions, especially the occurrence of rain, and this has suggested us to compare her data with the current meteorological data of the Holy Land. Because her observations concern only the occurrence of rain in a day, the statistical variable that we can compare is the number of rainy days. With this regard the reliability of this parameter against possible climatological changes that may have occurred in the Holy Land in the last 2000 years is also important. Of course, a statistical comparison referred to alleged meteorological conditions so remote cannot be as accurate as the astronomical and calendar analysis discussed before but, nevertheless, it turns out to be very interesting, as we show in the following.
The frequency of precipitation depends on the local climate of a region. The Holy Land is a geographical area of transition between regions of temperate and arid climate. The southern and eastern parts are characterized by an arid climate while the rest of the region by a Mediterranean weather. A fundamental feature of this type of climate is the large variability in the amount of rain from year to year and in different areas. Summer is very hot, it rarely rains, winter is cool and rainy, with precipitation mostly occurring from October to May. For this reason, the Israel Meteorological Service (
Central Bureau of Statistics n.d.) (indicated as the IMS in the following) refers long-term precipitation (rainfall, snow, hail) data to the so-called
rainy year, which starts in August and ends in July.
In other words, the climate of the Holy Land is Mediterranean along the coast and semi-arid, with scarce and little frequent rainfall, in the Depression of the Dead Sea, in the Judean Desert and Jordan Valley. Thus, the weather is characterized by more abundant and frequent rainfall towards the Mediterranean Sea and the North. Today the meteorological services of many countries, such as the IMS, make freely available large data banks of precipitation of their areas. The IMS data banks allow to calculate the annual average frequency of the number of rainy days, as a function of latitude and longitude, of many localities in the Holy Land (Israel and West Bank) where meteorological stations are deployed.
The climate of the Holy Land is not drastically changed in the last 2000 years because the climatological constraints that determine it (Mediterranean Sea, Depression of the Dead Sea, Judean Desert and Jordan Valley) have not changed, so that, it is reasonable to assume that the average number of annual rainy days provided by the IMS can be compared to the results deduced from the EMV, under the conjecture that Maria Valtorta wrote about what she allegedly observed in vision 2000 years ago. In this regard, it is interesting to notice that a detailed analysis of tree rings’ growth has shown that the average temperature at the beginning of the Christian era was surprisingly similar to that of the last fifty years (
Esper et al. 2012). The issue of Holy Land climate changes is discussed in more detail in
Section 6. Now we will first focus our attention on the meteorological information deducible from the IMS analysis.
Maria Valtorta never visited the Holy Land and her experience of rainfall frequency and rainy days was typical of Northern Italy—especially the Milan area, where she stayed for many years in her youth- and Tuscany—where she spent many years and died -, which is quite different of that of the Holy Land. To give an idea of the great differences that can be found, for example let us consider Alamogordo, New Mexico (32.5° latitude N, 106.0° longitude W), characterized by a semi-arid climate and rainfall mostly concentrated only in a period of the year, as in the Holy Land. In the 50 years 1951–2000, 2657 rainy days were recorded, an annual average 53.1 rainy days. In Milan (45.5° latitude N, 9.2° longitude E) with temperate-continental climate, in the 143 years 1858–2000, 15635 rainy days were recorded, with an annual average 103.3 rainy days (
Matricciani 2013).
To test the likelihood of the rainy days mentioned in the EMV, we have searched all references to the occurrence of rain in the period of public life of Jesus narrated by Maria Valtorta. The astronomical reconstruction of the dates associable to the narrated events has then allowed to estimate how many days of the public life, on the total of 3 years and few months, have been really described, have been “observed” as if she had been an eyewitness. This search has also allowed to establish if the reference to rain concerned single days separated by non-rainy days, or continuous sequence of rainy days.
The first part of the analysis is reported in
Table 2, where we have listed the number of days explicitly described in the EMV and the subset of the rainy days subdivided for season and for single years of Jesus’ public life.
Table 3 lists the localities to which rainy days have been associated, with their geographic coordinates and dates of rainy days. The chronological reconstruction of dates associated to rainy days was determined as explained in detail in (
De Caro 2014,
2015,
2017).
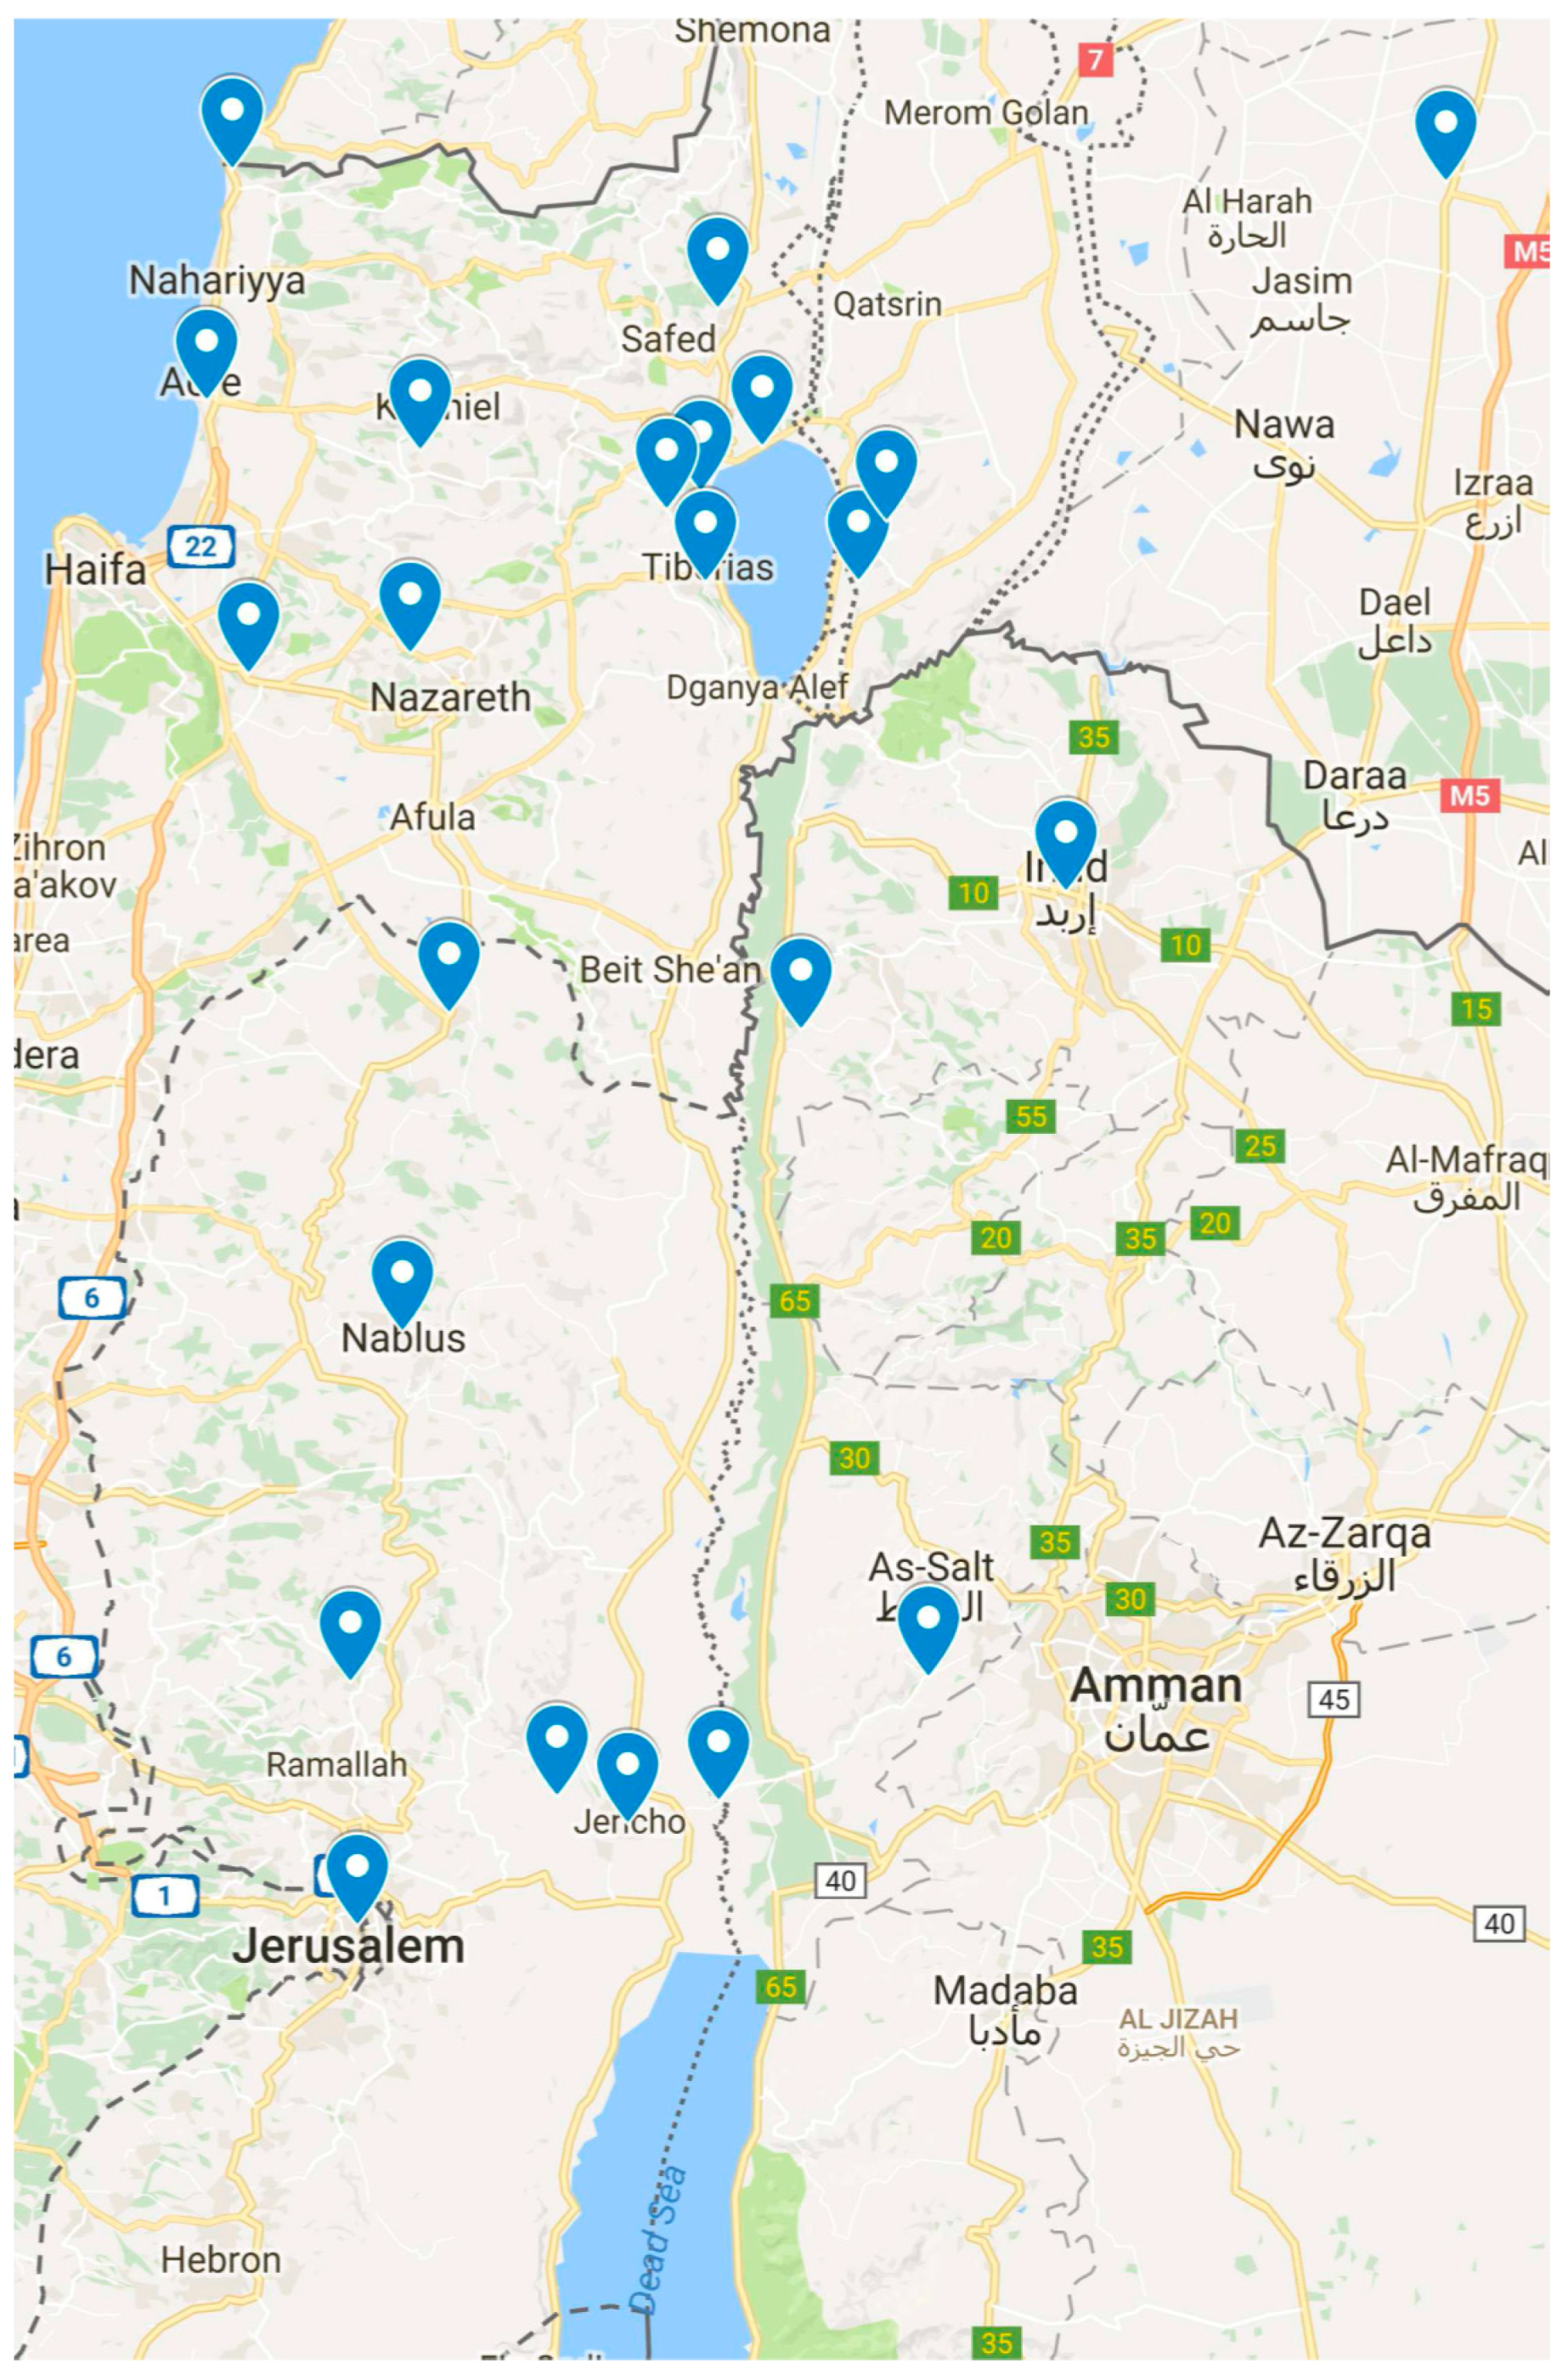
Figure 1 shows synoptically the geographical displacement of these sites, excluding the locality at the latitude of Cyprus, mentioned in
Table 3, because outside the Holy Land. From the analysis it follows that of the 1204 days of Jesus’ public life, emerged by the EMS astronomical analysis—from the 6th of Jan 31 to the 23rd of Apr 34—only about 380 have been actually described by Maria Valtorta, of which only 52 have been annotated as rainy days. From the astronomical analysis it follows that these 380 days are monthly distributed according to
Table 4. The latter values may be affected by small errors in the chronological reconstruction for days that fall across the end of a month and the start of the next.
If we exclude the data corresponding to the latitude of Cyprus (see
Table 3), we obtain an annual frequency of 51 × 365/380 = 49 rainy days. This result is compatible with that of a semi-desert climate in which rainfall is concentrated in about two consecutive seasons of the year, just as it happens in the Holy Land.
The detailed observations that Maria Valtorta reports in the EMV are evidently due to causes other than the meteorological conditions, because the mention of rain is not instrumental to develop the narration, but it is just an incidental observation. Therefore it is legitimate to assume that: (i) the value of the annual rainy days in the EMV (49) can be compared to the frequency of annual rainy days obtained from the IMS data bank; (ii) we can refer this value also to the ancient Holy Land if we could assume that no extreme changes in the rainfall regime of this region have occurred in the last 2000 years, because of the permanence of the main geographical factors that determine the climate, previously recalled. In the next sections we will show that both these hypotheses can be justified, although our general conclusions can be considered, of course, only a conjecture about the significance of the presence of meteorological data in the EMV.
4. A Meteorological Picture Statistically Coherent with the Current Data of the Holy Land
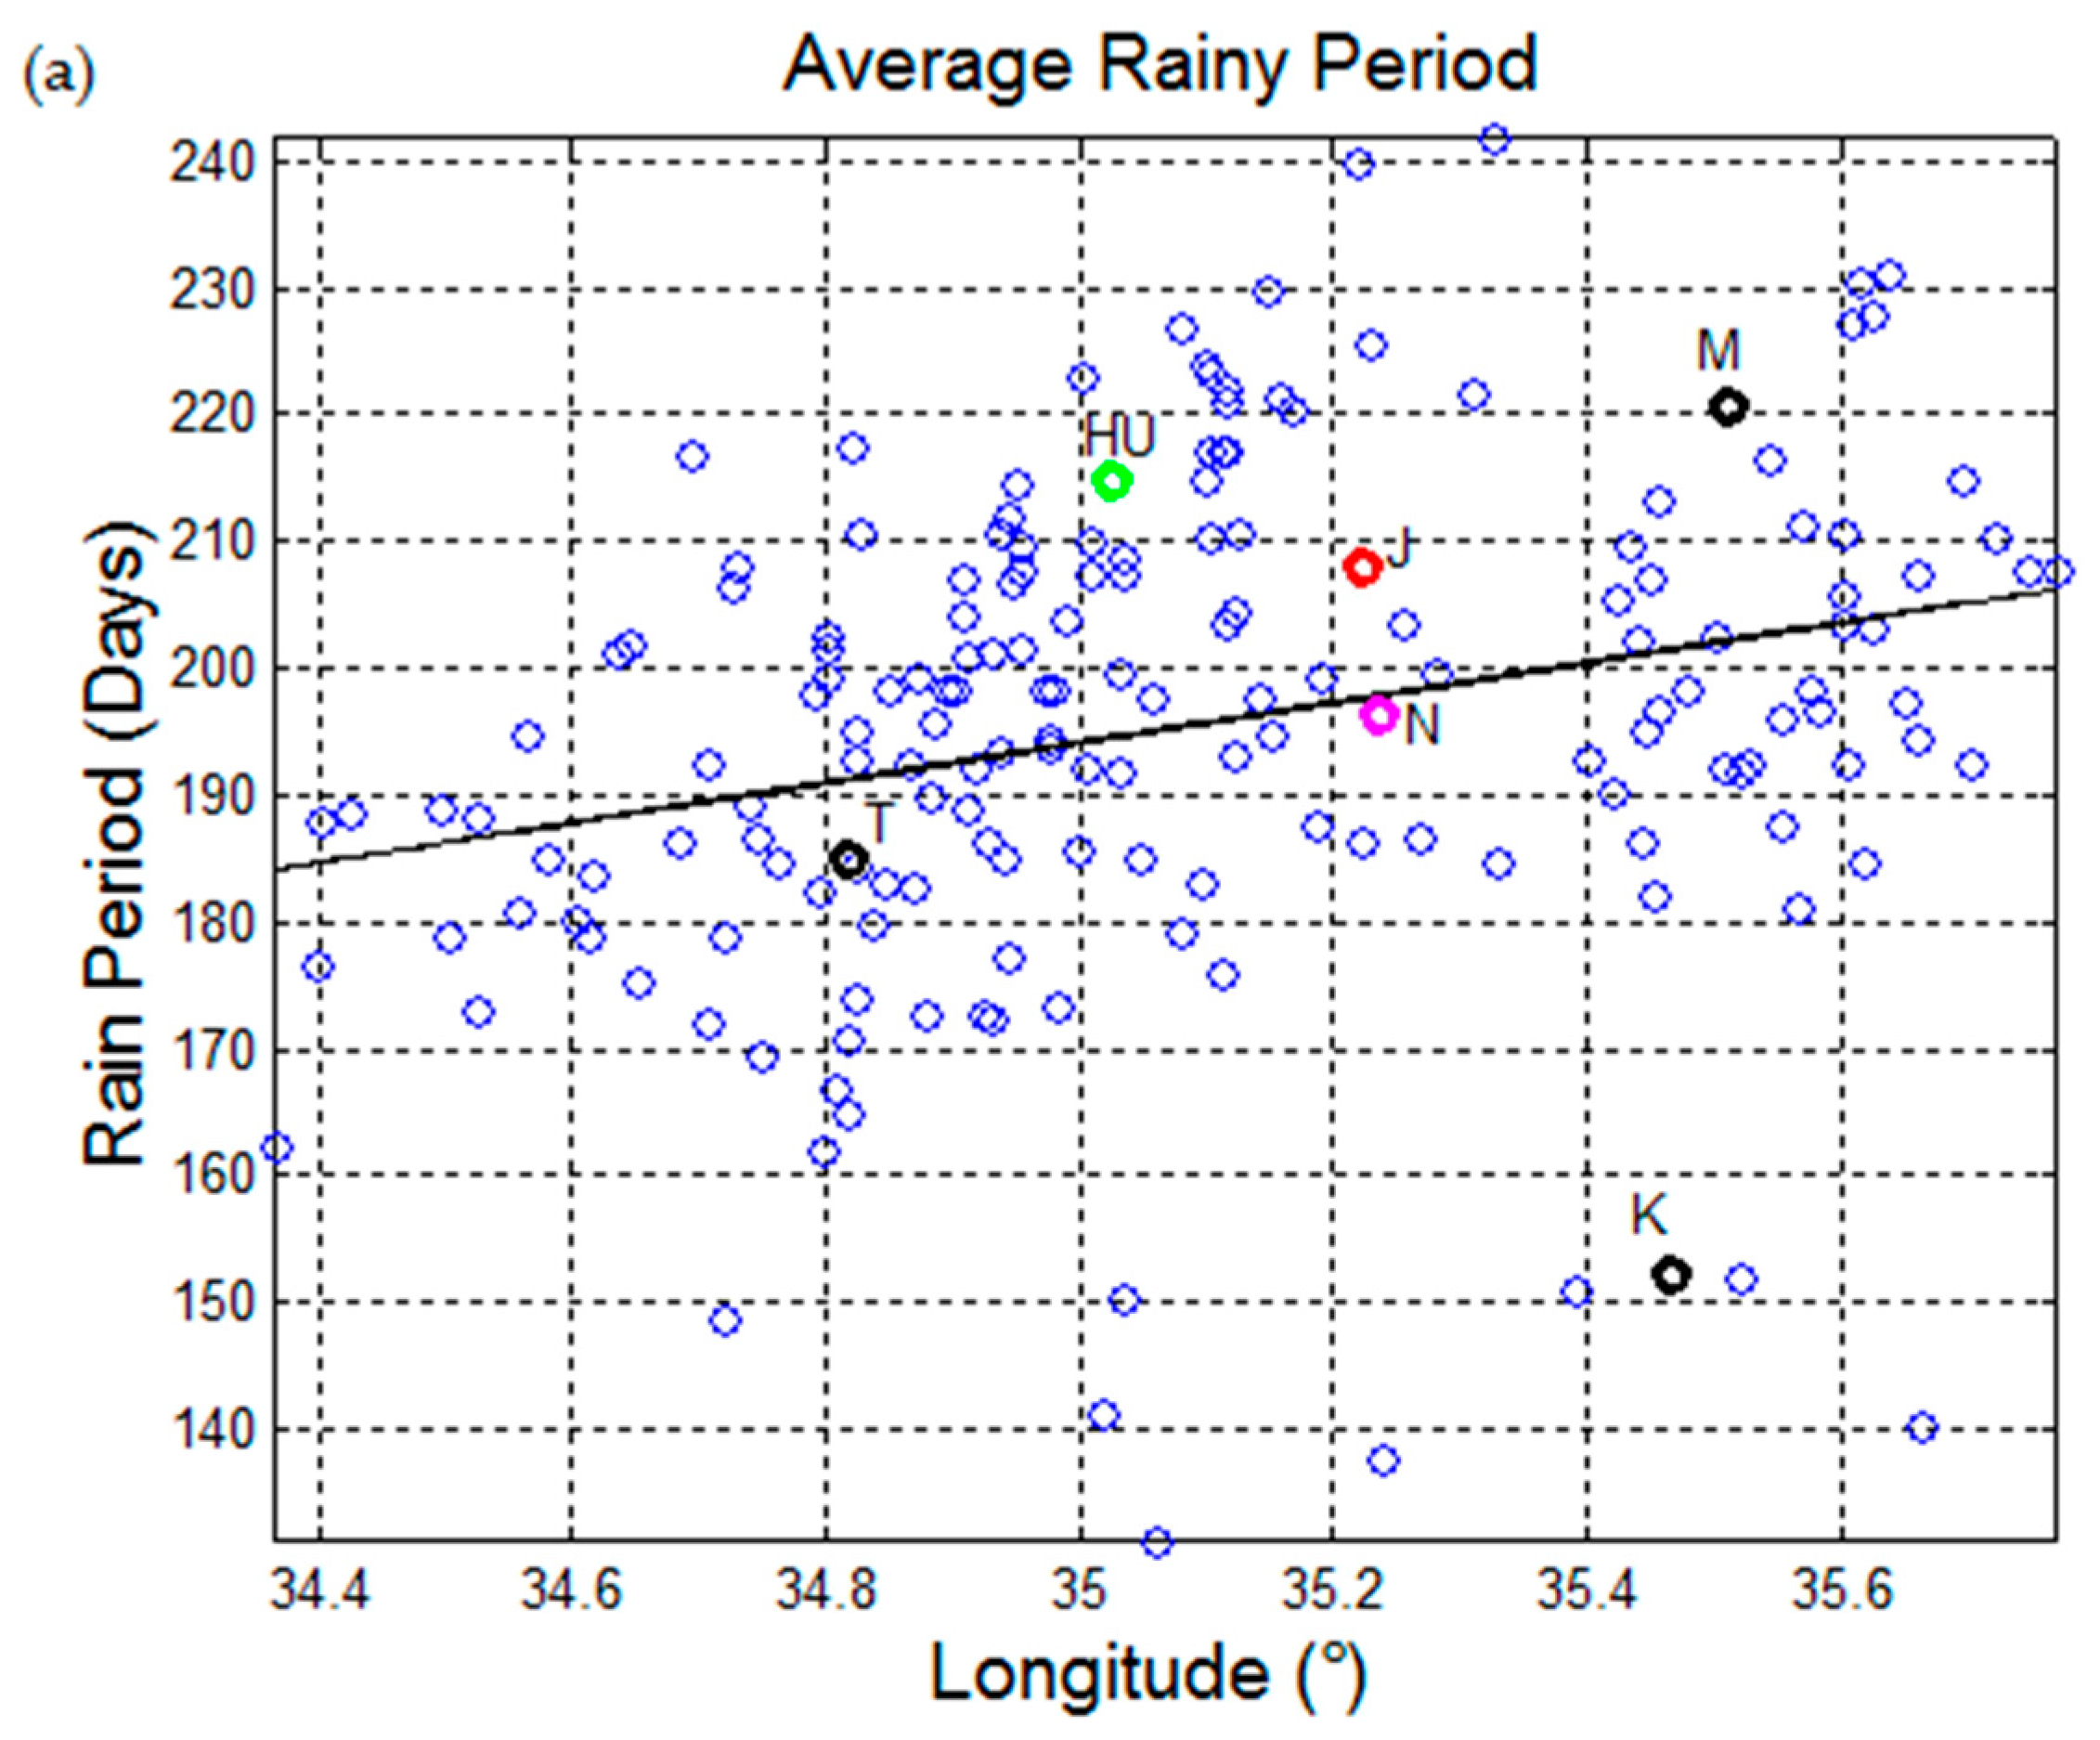
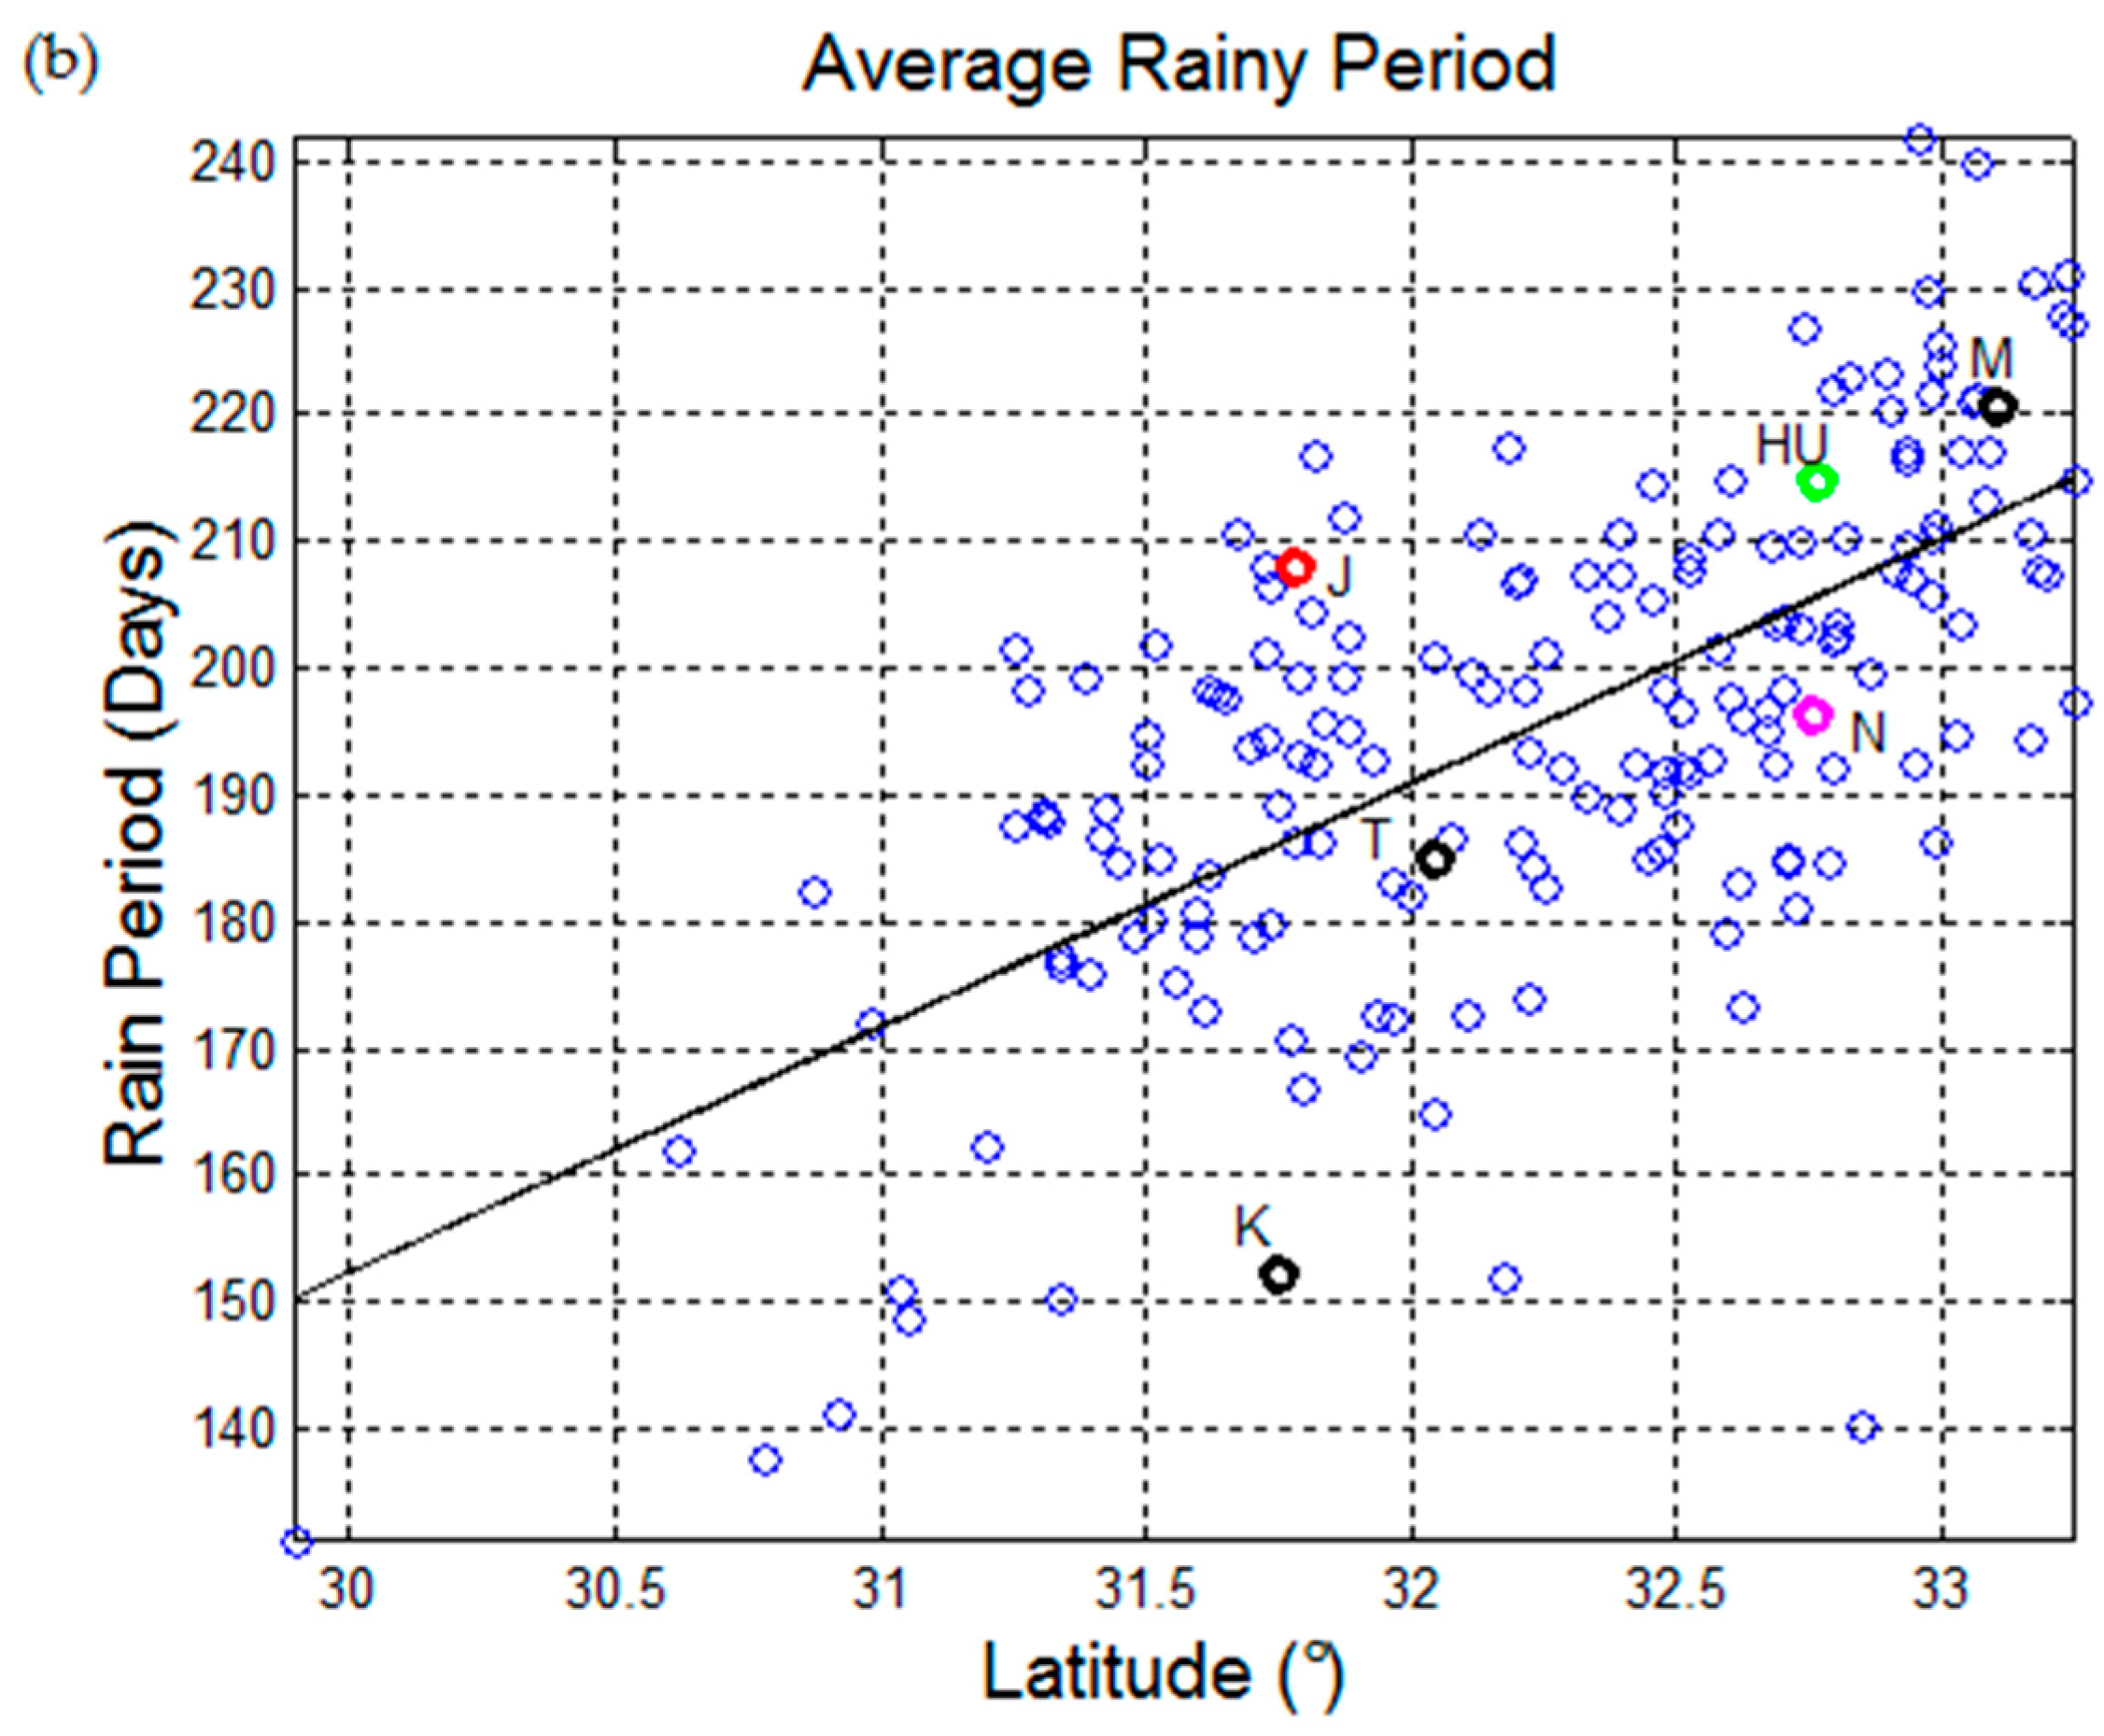
As already observed, in the Holy Land the rainy days are mostly concentrated in the fall and winter months. Relative to the period 1990–2015 and for 184 localities, almost all with rainfall data collected for 26 years by the IMS,
Figure 2 shows the length of the average annual rainy period, as a function of the longitude and latitude, defined as in the following. For each year we have first calculated the duration of the continuous interval of time between the last rainy day before summer and the first rainy day after summer and have then subtracted it from 365 or 366 (leap years). The final result shown in
Figure 2 for each locality is the average for the all period. It is confirmed that the rainy period is about half of the year, longer in the more rainy North-East region and shorter in the South-East region.
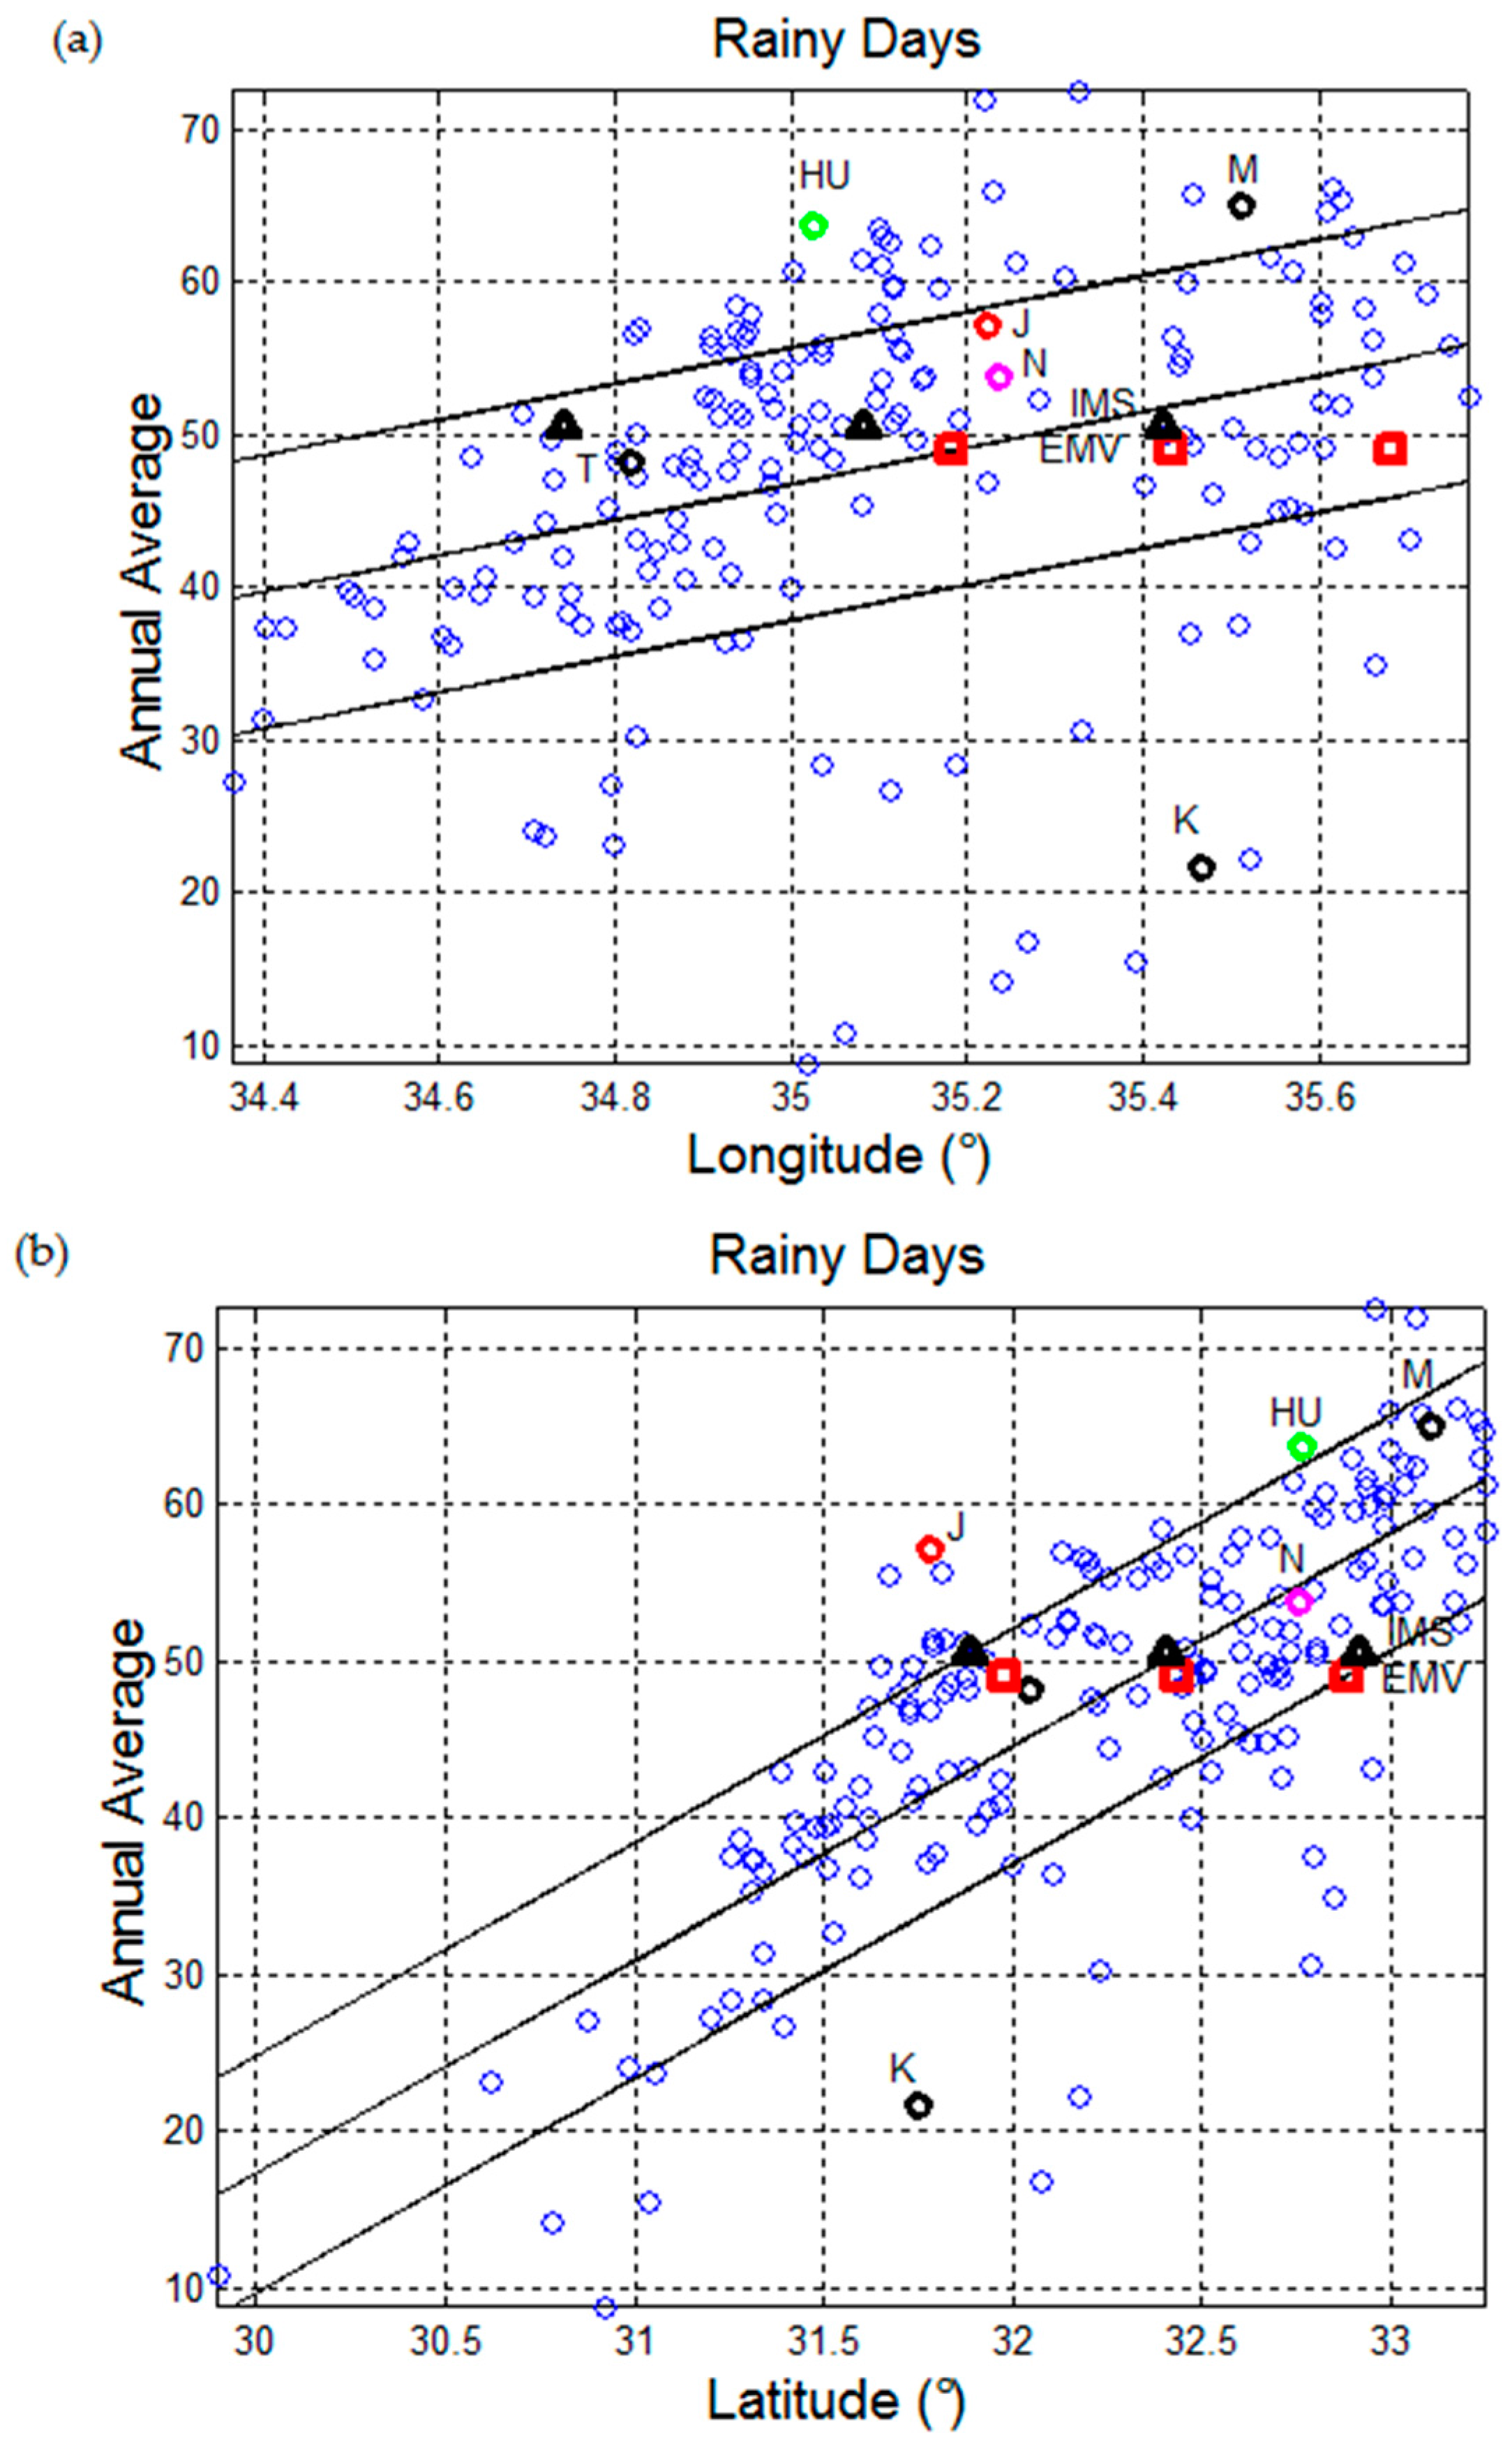
Figure 3 shows the annual average value of rainy days versus longitude (higher panel) and latitude (lower panel) for the same localities of
Figure 2. Squares give the value found in the EMV (49), triangles give the average value of 159 localities with latitude > 31.5° (about the latitude of Jerusalem), that is the minimum latitude reported in
Figure 1 for the localities with rainfall described in the EMV. The value obtained from the IMS data bank is 50.6 rainy days per year, practically as the value of the EMV, 49.
Figure 3 shows also the values at ±1 standard deviation of the longitude and latitude found in the 159 localities with latitude > 31.5°, and in the EMV localities. In longitude the displacement of the IMS and EMV sets is justified by the fact that some of the localities mentioned in the EMV are now in Jordan, and the corresponding meteorological statistical data are not recorded in the IMS databank. Conversely, in latitude the two sets almost coincide because the latitude of Jordan is about the same of that of Israel and West Bank. Notice that in both cases, however, the average values and the standard deviations are almost coincident.
Besides the number of rainy days, another interesting statistical variable for current applications is the number of couples of rainy days, as established by the mathematical theory of de-integration of the quantity of water (rainfall) collected in 1 day (
Matricciani 2013). The theory needs very few input data locally measured and two of them are just the number of rainy days and the number of couples of rainy days. The rainy days are those directly recorded by the meteorological services, such as the IMS, while the number of couples of rainy days is determined by examining a sequence of non-overlapping couples of days and by declaring rainy a couple of days in which it rains in the first day, or in the second day, or in both. The number of couples of rainy days is another parameter, as the number of rainy days, typical of a certain geographical area. The two variables are enough correlated.
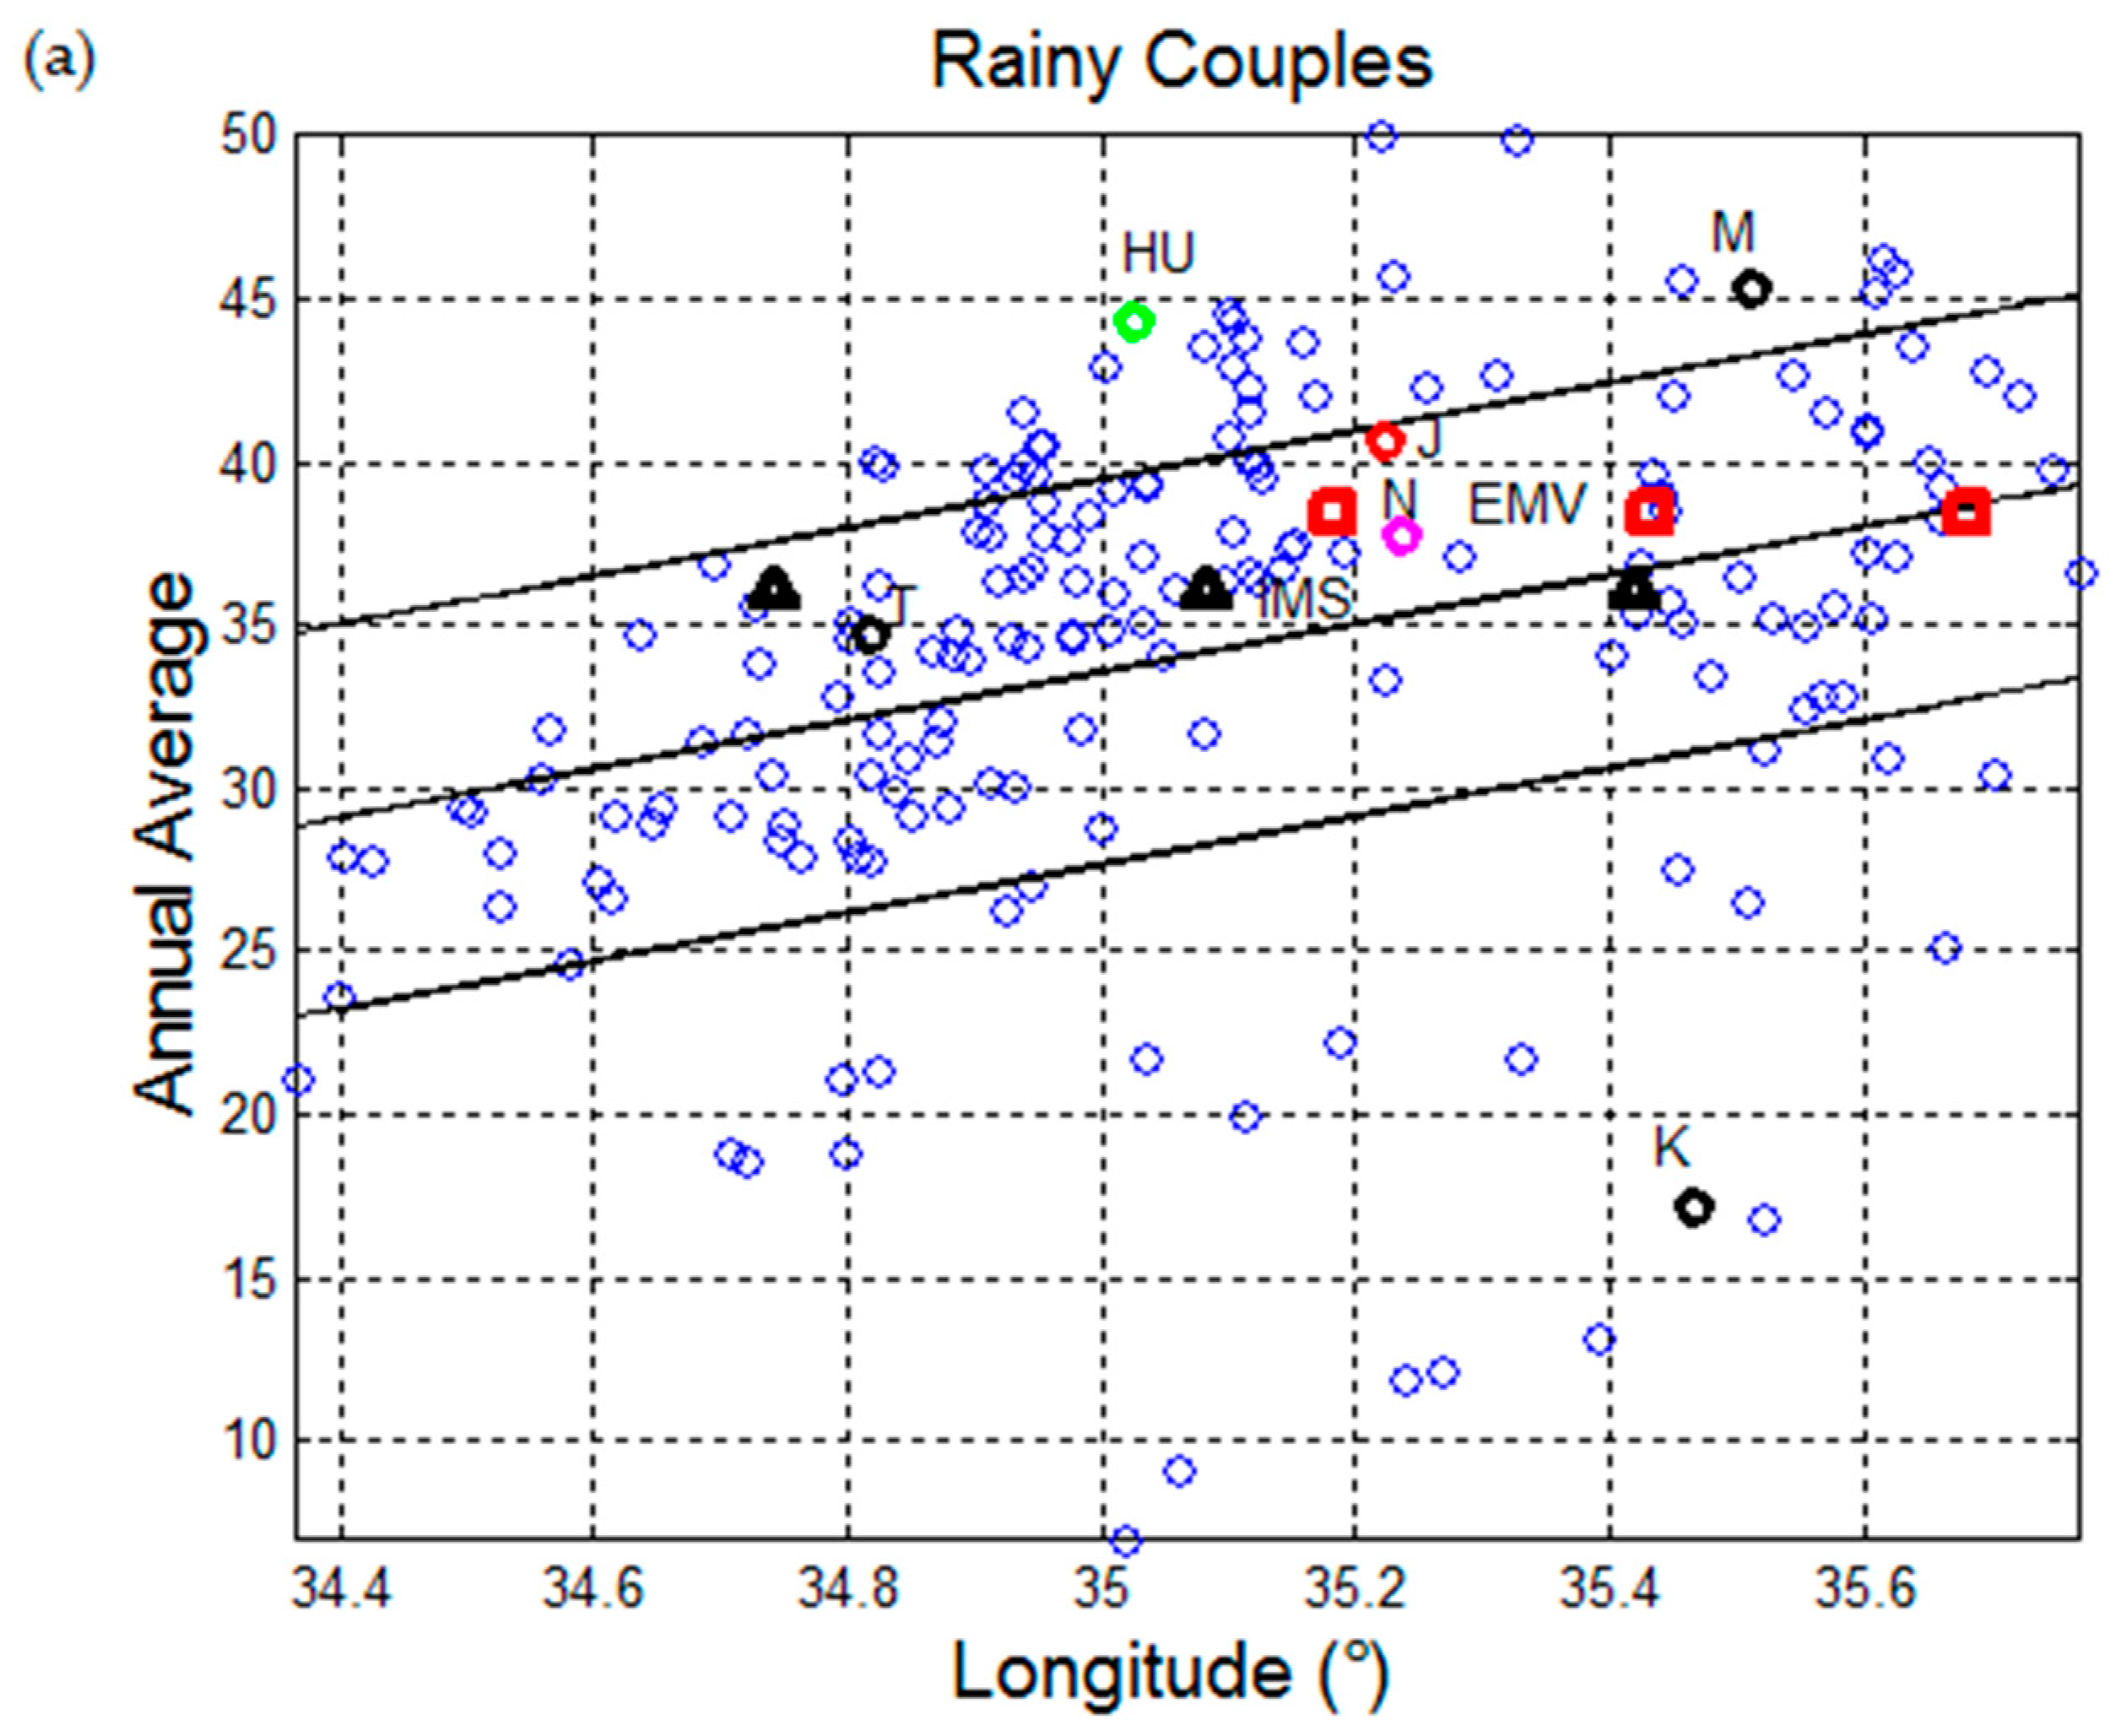
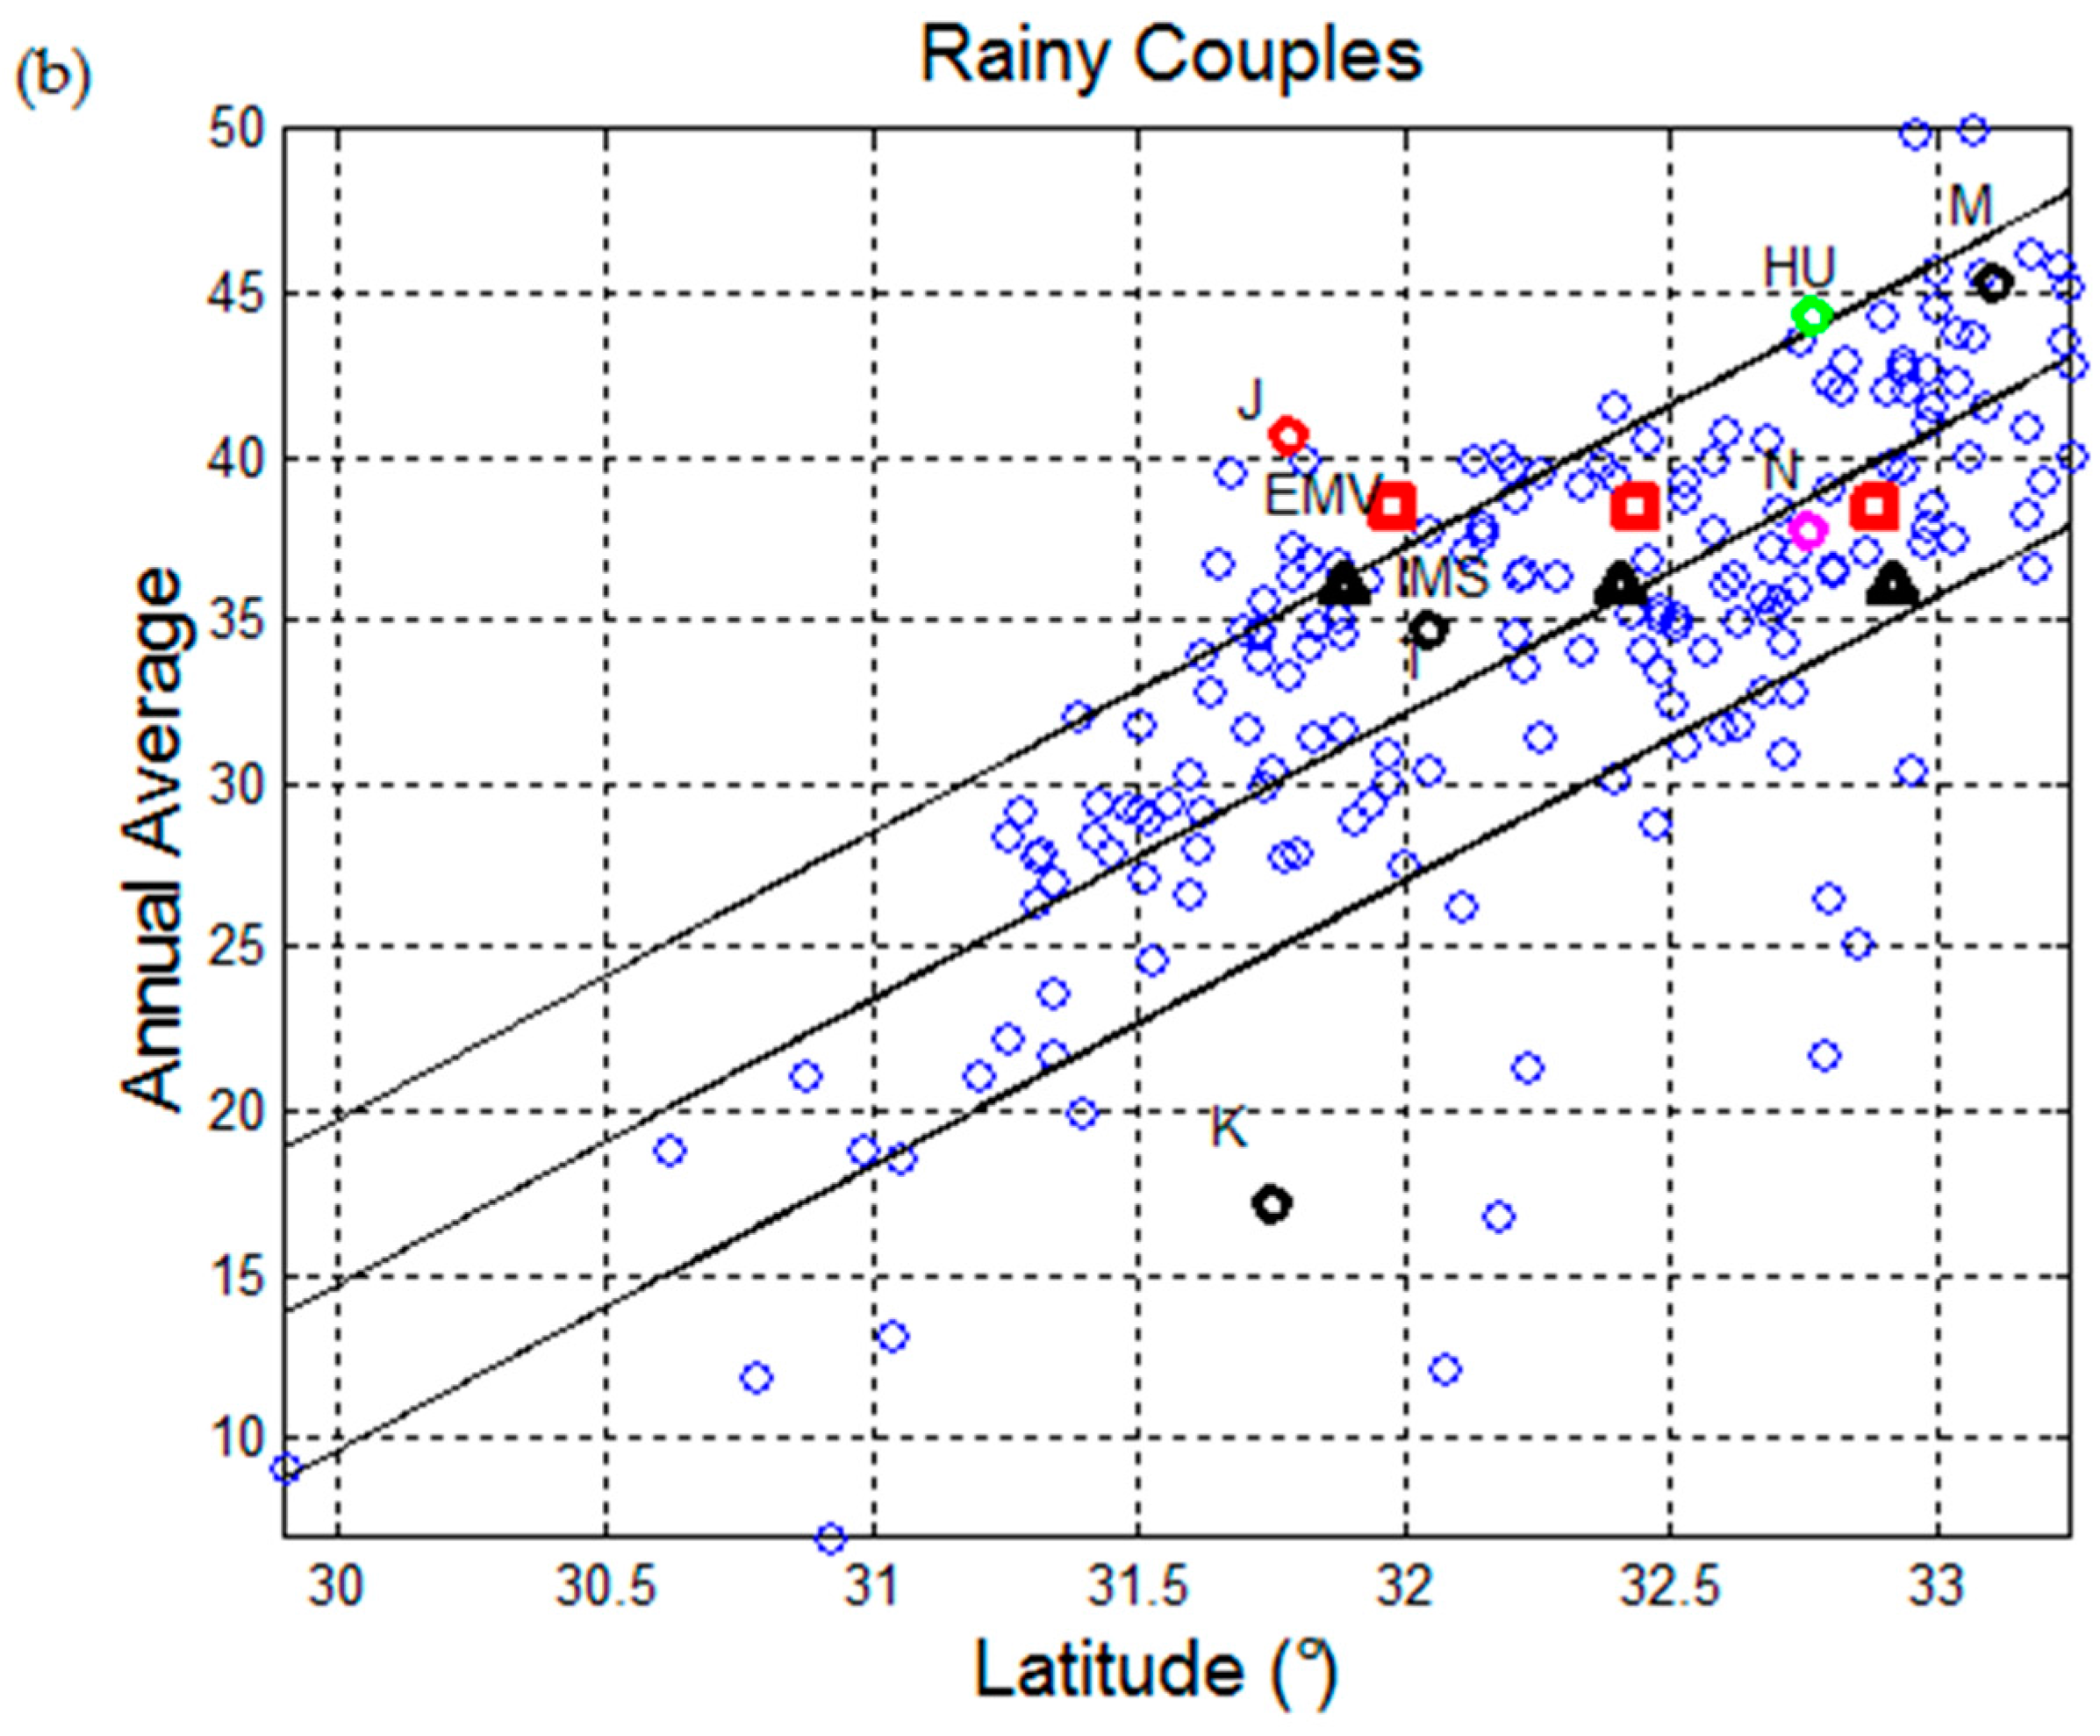
Figure 4 shows the annual average value of the couples of rainy days versus longitude (higher panel) and latitude (lower panel) for the localities of
Figure 1. The number of couples of rainy days deducible from the EMV, based on the chronology reassumed in
Table 3, gives 41 couples and, if we exclude the value relative to the latitude of Cyprus, for comparing again this result with that obtained from the IMS, in a year we find 40 × 365 ×380 = 38.4 couples. This result agrees very well with the value 36.0 deduced from the IMS data bank for the 159 localities with latitude > 31.5°. Once more, we can notice, in
Figure 4, a surprising correlation between the average values deduced from the EMV (squares) and from the IMS (triangles).
5. Monthly Frequency of Rainy Days
Let us observe the meteorological data with a finer temporal detail.
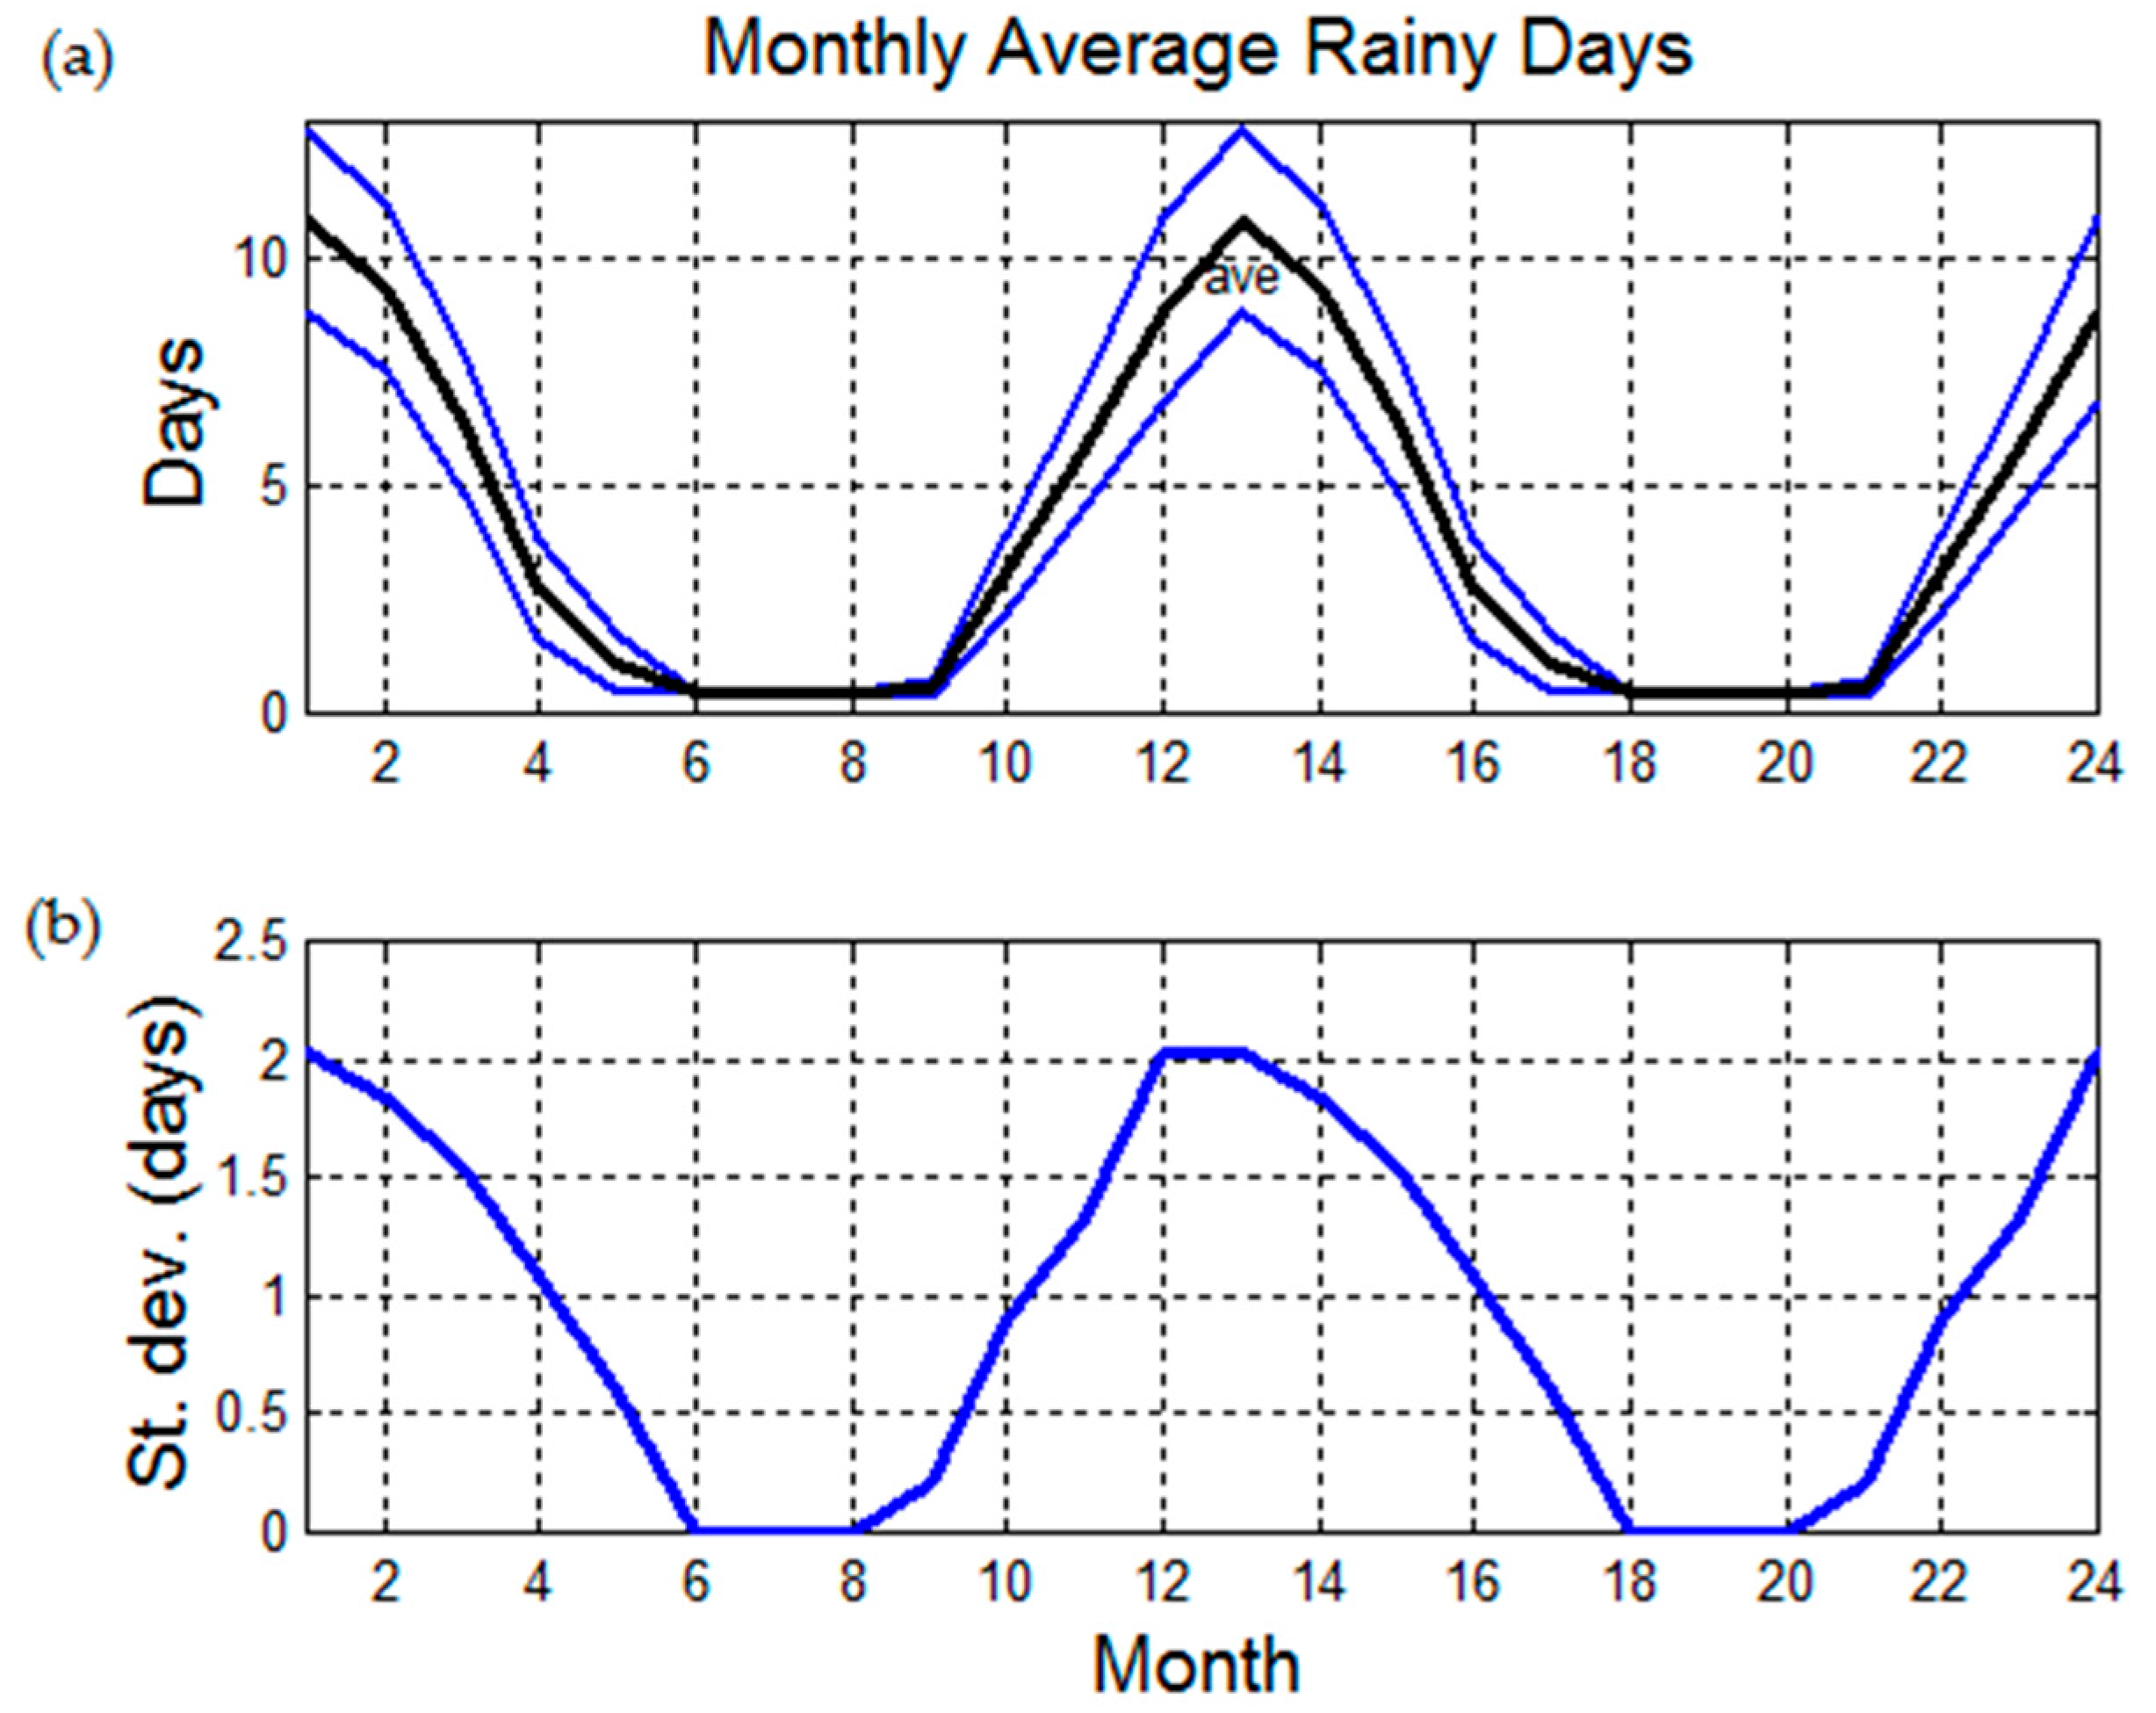
Figure 5 shows, for each month of the year, the average value relative to 26 years, and the ± 1 standard deviation values of the rainy days for the 184 localities. Notice that the annual cycle is repeated for showing continuity. We can clearly see the strong seasonal pattern of the rainy days in the Holy Land, according to the IMS data bank.
From these data we can calculate the average value and standard deviation expected for the distribution of days described in the EMV, by taking into account the number of days listed in
Table 4, and the fact that these partial data refer to about 3 years, from August to July of every year, because the first rainy day in the EMV is August 3, 31 (Nazareth) and the last one is April 23, 34 (Jerusalem), according to
Table 3, and that after April rainy days are extremely rare (
Figure 5).
Let
and
be the average value and the standard deviation, respectively, of the rainy days of the
i-th month of the year,
, according to the IMS (
Figure 5),
the number of days described in the month
i-th according to the EMV (
Table 4),
the number of days for each month (31 for
etc.). The average value of the rainy days for each month found from the IMS data bank (
Figure 5) can be rescaled to the values that have been found according to the number of days described in the EMV (
Table 4), thus finding the average value concerning the 380 days described by Maria Valtorta:
For example, for January,
, the scaling factor that multiplies,
is given by 21/(3 × 31). The annual number of rainy days is thus given by:
The total given by (2) is smaller than the long-term average value, namely 47.8 for the 184 localities considered in the IMS data bank, or 50.6 for the 159 localities with latitude > 31.5° because, obviously, the partial number of monthly days observed in 3 years in the EMV (
) is smaller than the number of total monthly days observable in 3 years (
). On the other hand, going from 26 to 3 years and supposing that the observations are uncorrelated from month to month and from year to year (hypothesis physically well grounded), the average monthly value
can be considered as a random variable with average value given by Equation (1) and standard deviation given by:
Expression (3) is derived as follows. If
is the number of uncorrelated occurrences (as we can assume for the monthly average of rainy days of successive years), then the standard deviation of the random variable “average value” is proportional to
(
Papoulis 1990). Therefore going from
to
the standard deviation scales according to (3).
If now we consider the value at
standard deviation
, we get the average value:
And from (4) a total number of annual rainy days given by:
which agrees very well with the long-term value 47.8 for the 184 localities, or even better with 50.6 for the 159 localities with latitude
(
Figure 3). In other words, the experimental data state that the value given by the combination of Equations (4) and (5) is a more precise estimate of the average monthly rainy days for a period of 3 years randomly observed (for rainfall) for only 380 days, as reported in
Table 4, compared to the long-term period (26 years).
Notice that if the value given by (2) is directly scaled to 3 years, we get about the same value given by (5), namely .
Let us apply the same reasoning to the rainy days described in the EMV. It is found:
The average value at
standard deviation σ
i is given by:
Therefore, the total number of rainy days in 380 days is estimated as:
a value which is very close to that deduced from the IMS (51.2). From it we get an average annual value 51.6 × 365/380 = 49.6, again very close to the annual number of rainy days (49.0) described in the EMV. If (7) is directly scaled to 3 years we get 17.7 × 3 × 365/380 = 51.0, a result which confirms (8) and (9).
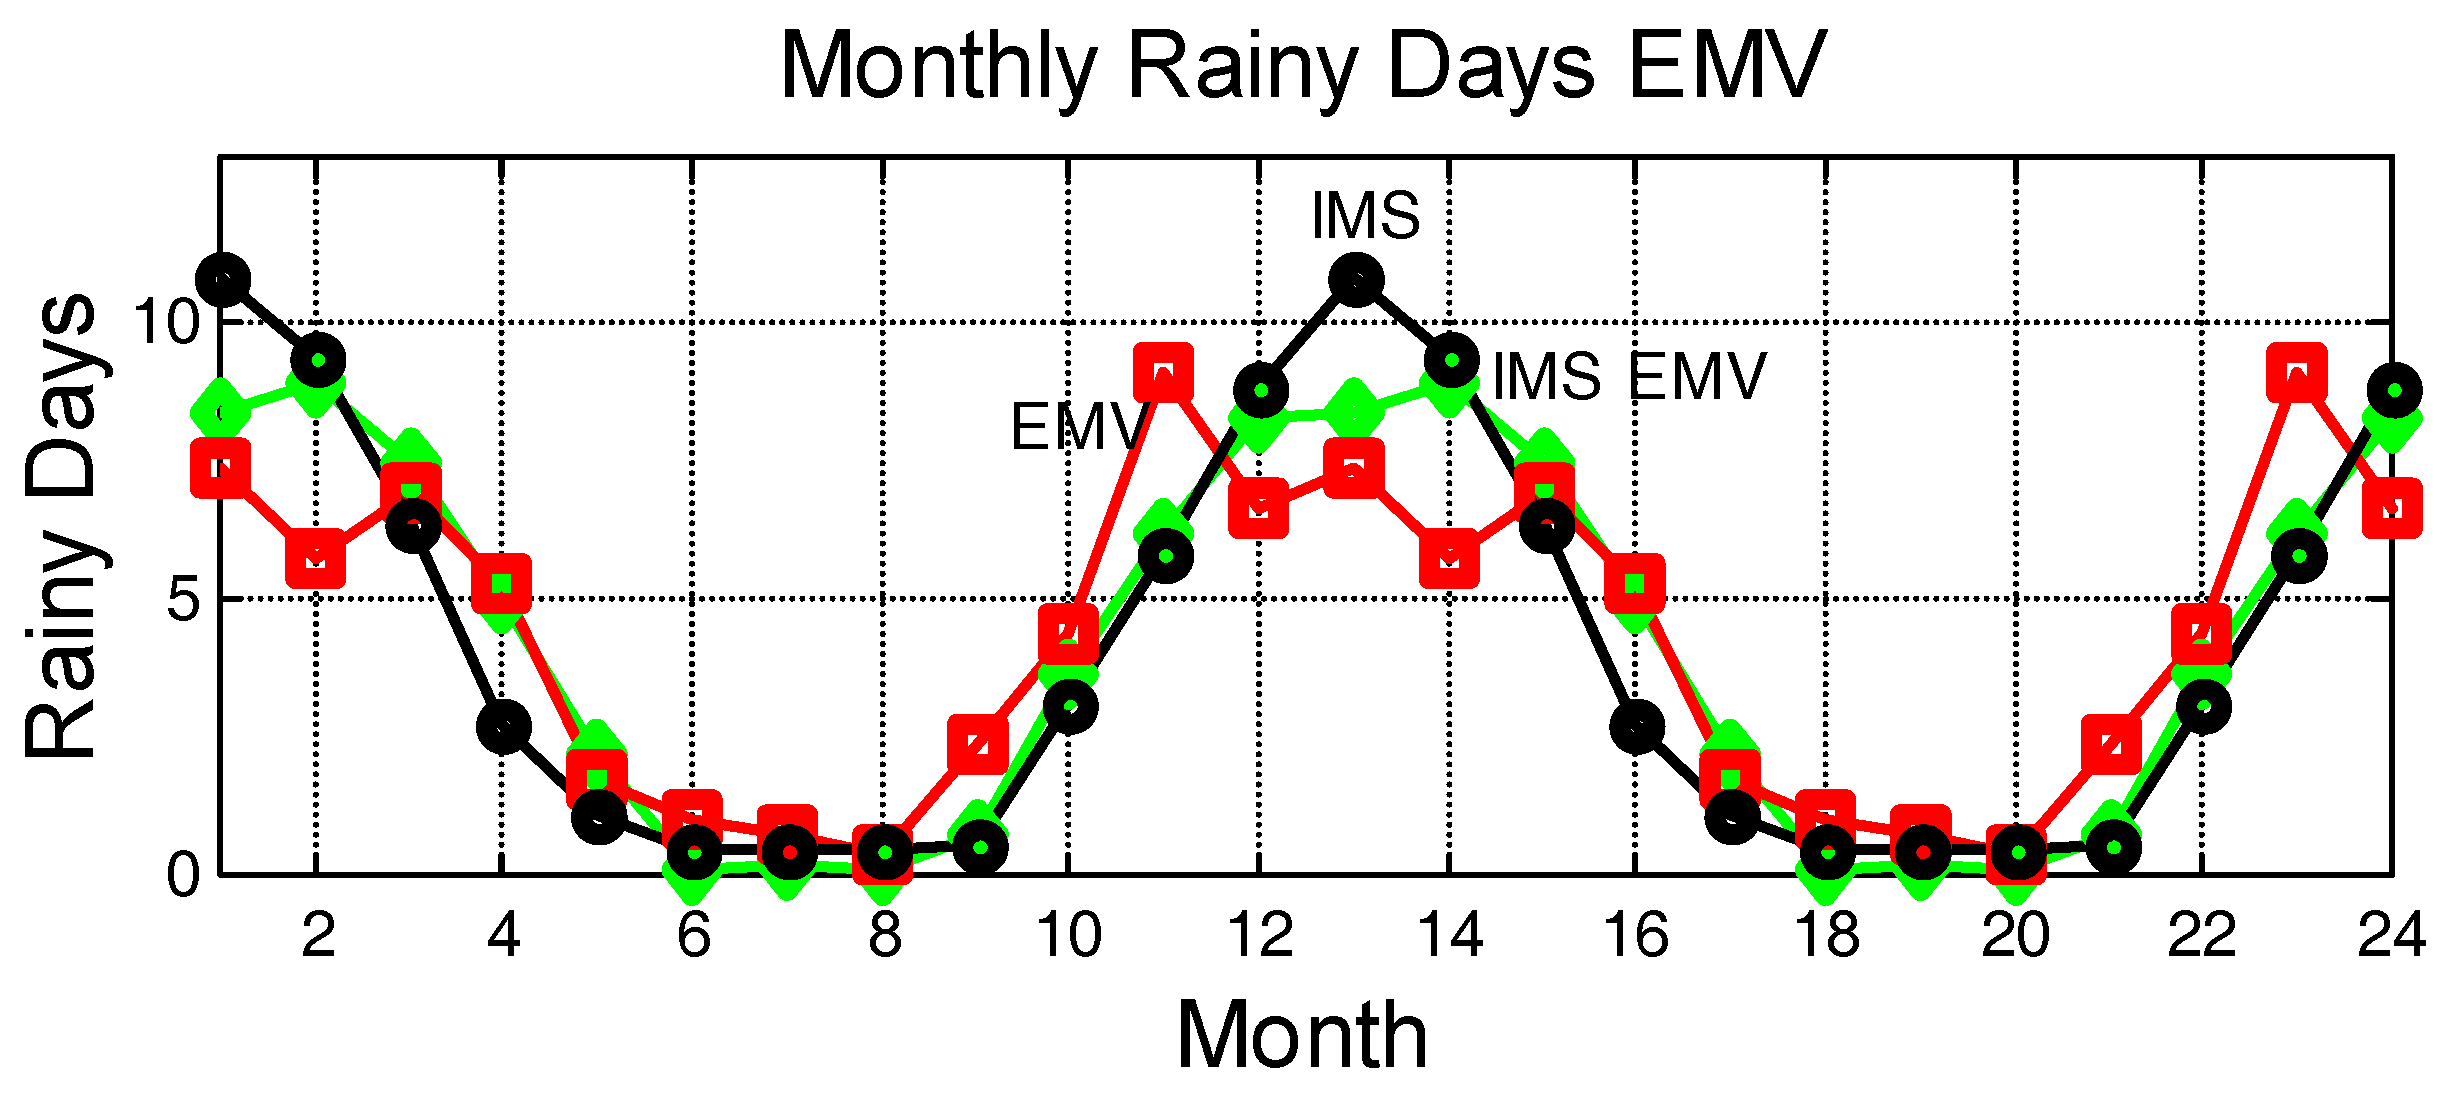
Figure 6 reassumes all these results and clearly shows the very good agreement just discussed. We have drawn the monthly average value of the rainy days relative to 184 localities of the Holy Land (curve IMS, circles), or for 3 years and only 380 days (according to
Table 4, curve IMS EMV, diamonds), as given by Equation (4) from the IMS data bank. The curve labeled EMV (squares) shows the number of monthly days obtained from the EMV, Equation (8). The agreement is very good. In other words, the estimate of the number of rainy days from the monthly distribution (8) seems to be statistically very reliable.
In conclusion, also the finer analysis on the monthly frequency of rainy days indicates that the observation of rainfall reported in the EMV cannot be attributed to the literary invention of Maria Valtorta, but it seems as if she had been a witness of real rain in the Holy Land 2000 years ago. As we have mentioned in
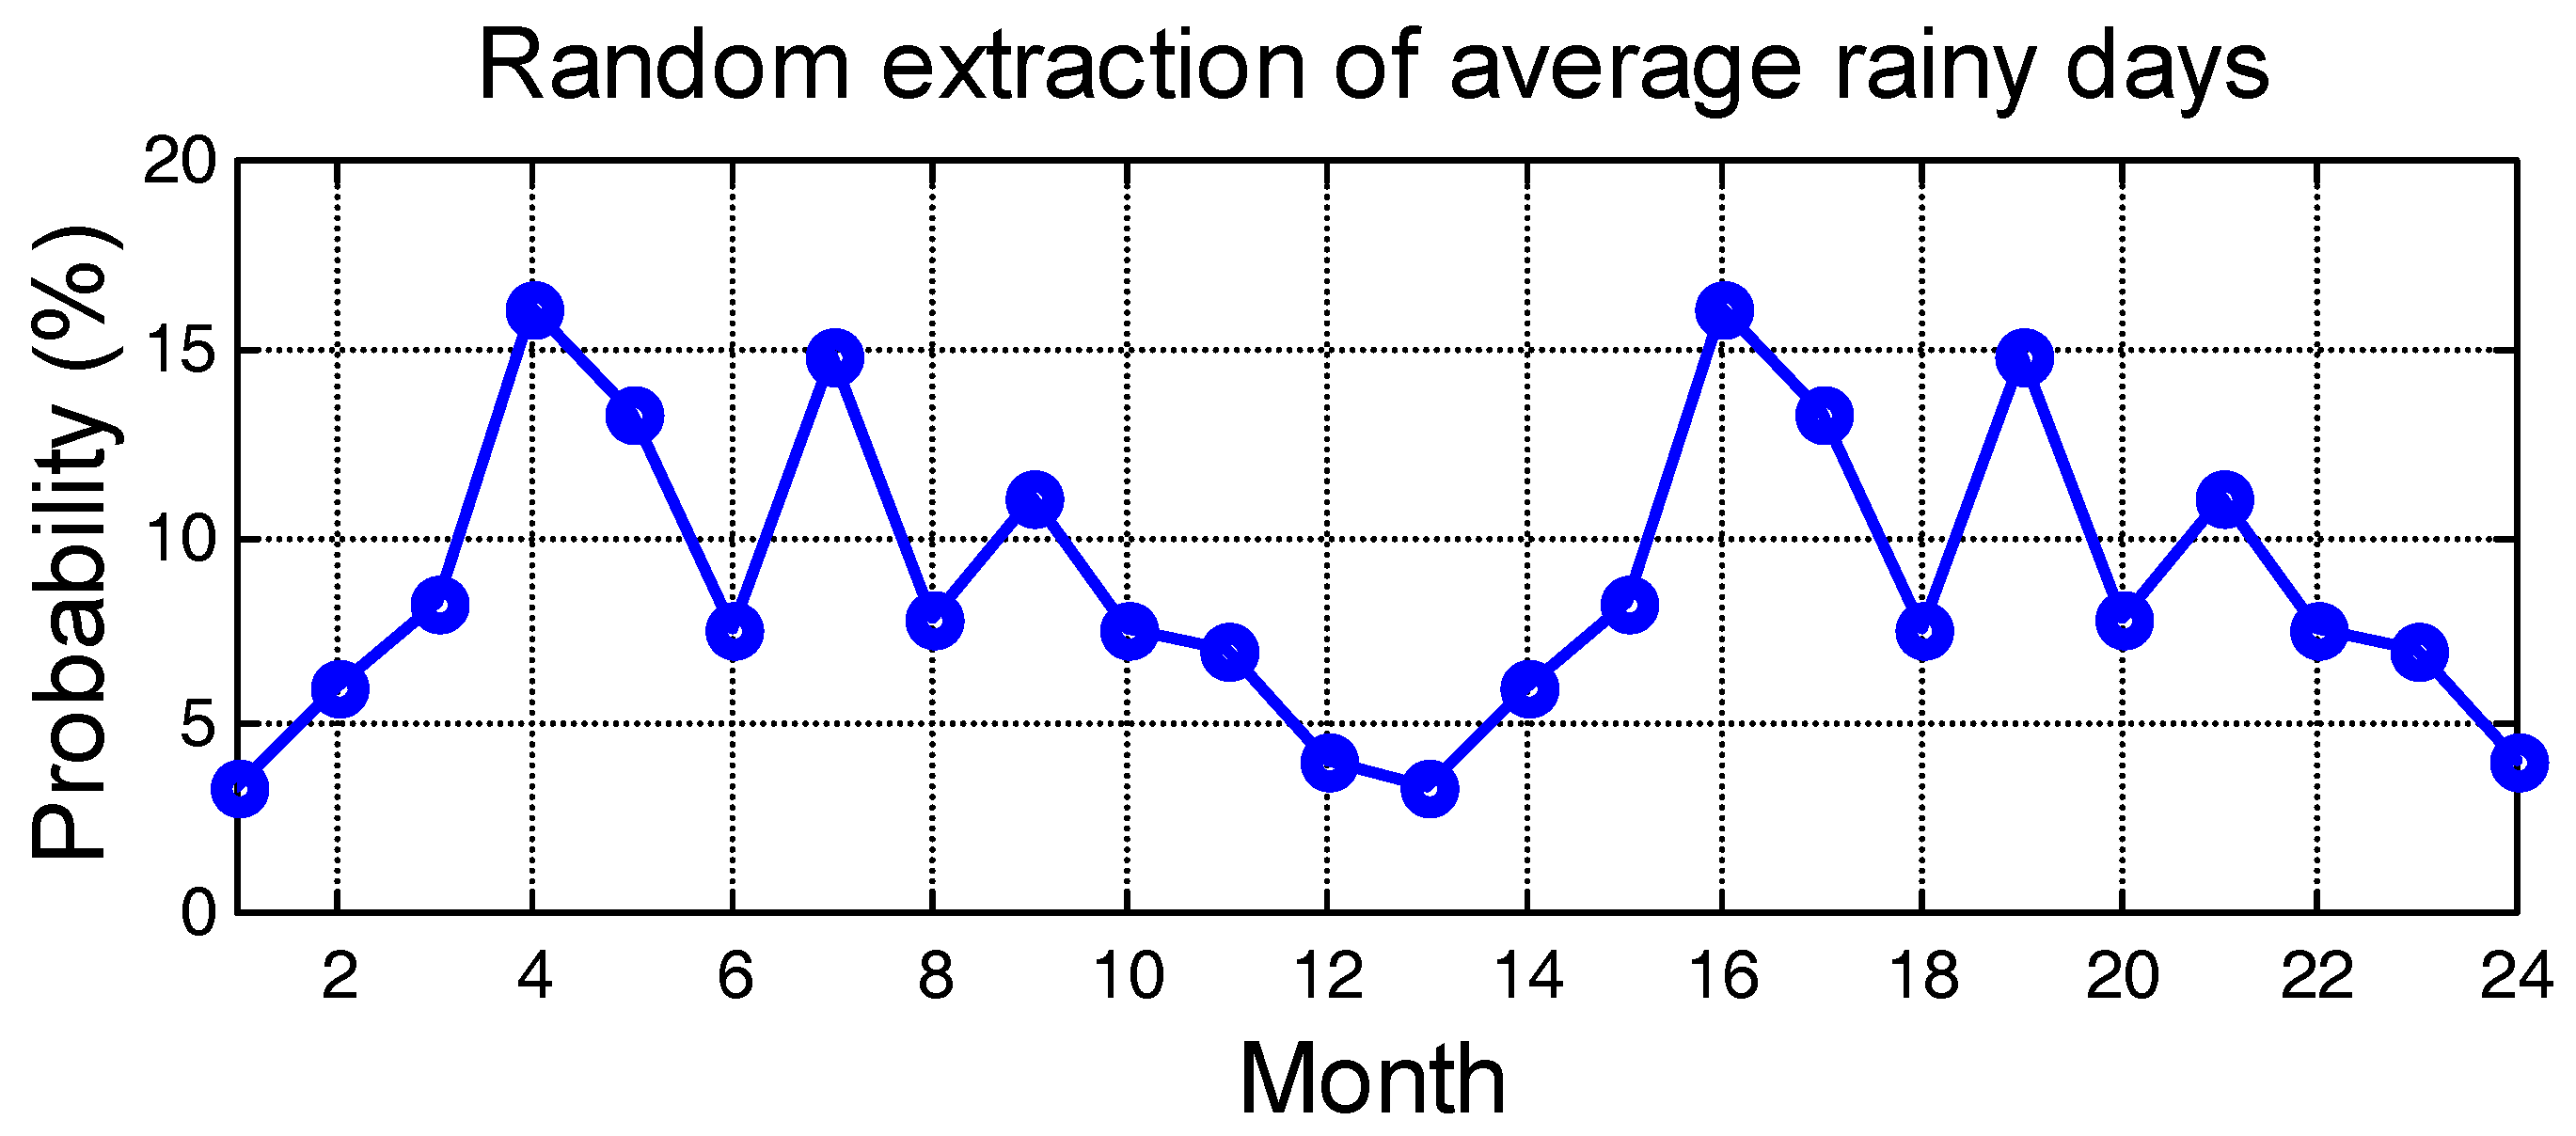
Section 2, Maria Valtorta had no significant mathematical ability to invent such coherent data, moreover considering the years of war and the bombing of Viareggio that caused her to move in another smaller village, in her fragile conditions. Frankly speaking, the statement that she has invented everything is not defensible, also because the probability of randomly generated such a coherent picture is low, 2% for the year, between 2% and 15% for the single months for the single rainy days and even smaller (0.45%) for the yearly rainy couples with both days rainy (see
Appendix A).
Now we have to discuss the second issue, namely whether the climate of the Holy Land has changed in the last 2000 years and, in case of positive answer, if these changes could hinder the possibility to compare statistically EMS rainy days data with the IMS data bank values.
6. Is the Holy Land Climate Changed in the Last 2000 Years?
Today the Holy Land seems more arid and less rainy that 2000 years ago. According to these authors, the change seems to have occurred because of many causes, both climatic (climate cycles) and due to human activities (wars, destructions, giving up agriculture) (
Huntington 1908, part I pp. 513–22, part II pp. 577–86, part III pp. 641–52). In the last decades in the Mediterranean Sea there has been a general tendency to a reduction of the quantity of rainfall and, at the same time, an increase in the peak values of precipitation (maxima), with more rigid winters and hotter summers. In the East Mediterranean there has been a conflicting tendency in the years 1951–1990 as, an exception to the general tendency, in the geographical area that includes Negev and the center-south of the Holy Land, the quantity of total precipitation is increased (
Abert et al. 2004), likely because of a different use of the land (agriculture activity) (
Abert et al. 2008). Besides the tree rings’ study already mentioned (
Esper et al. 2012), another interesting result that refers directly to the Holy Land climate at the time of Jesus and to that of today is the level of the Dead Sea, which shows a peak due to wetter climate just 2000 years ago (
McCormick et al. 2012, see their Figure 7) with the level estimated in 394 m below the Mediterranean sea, close to the level peak found in the 1950’s (390 m).
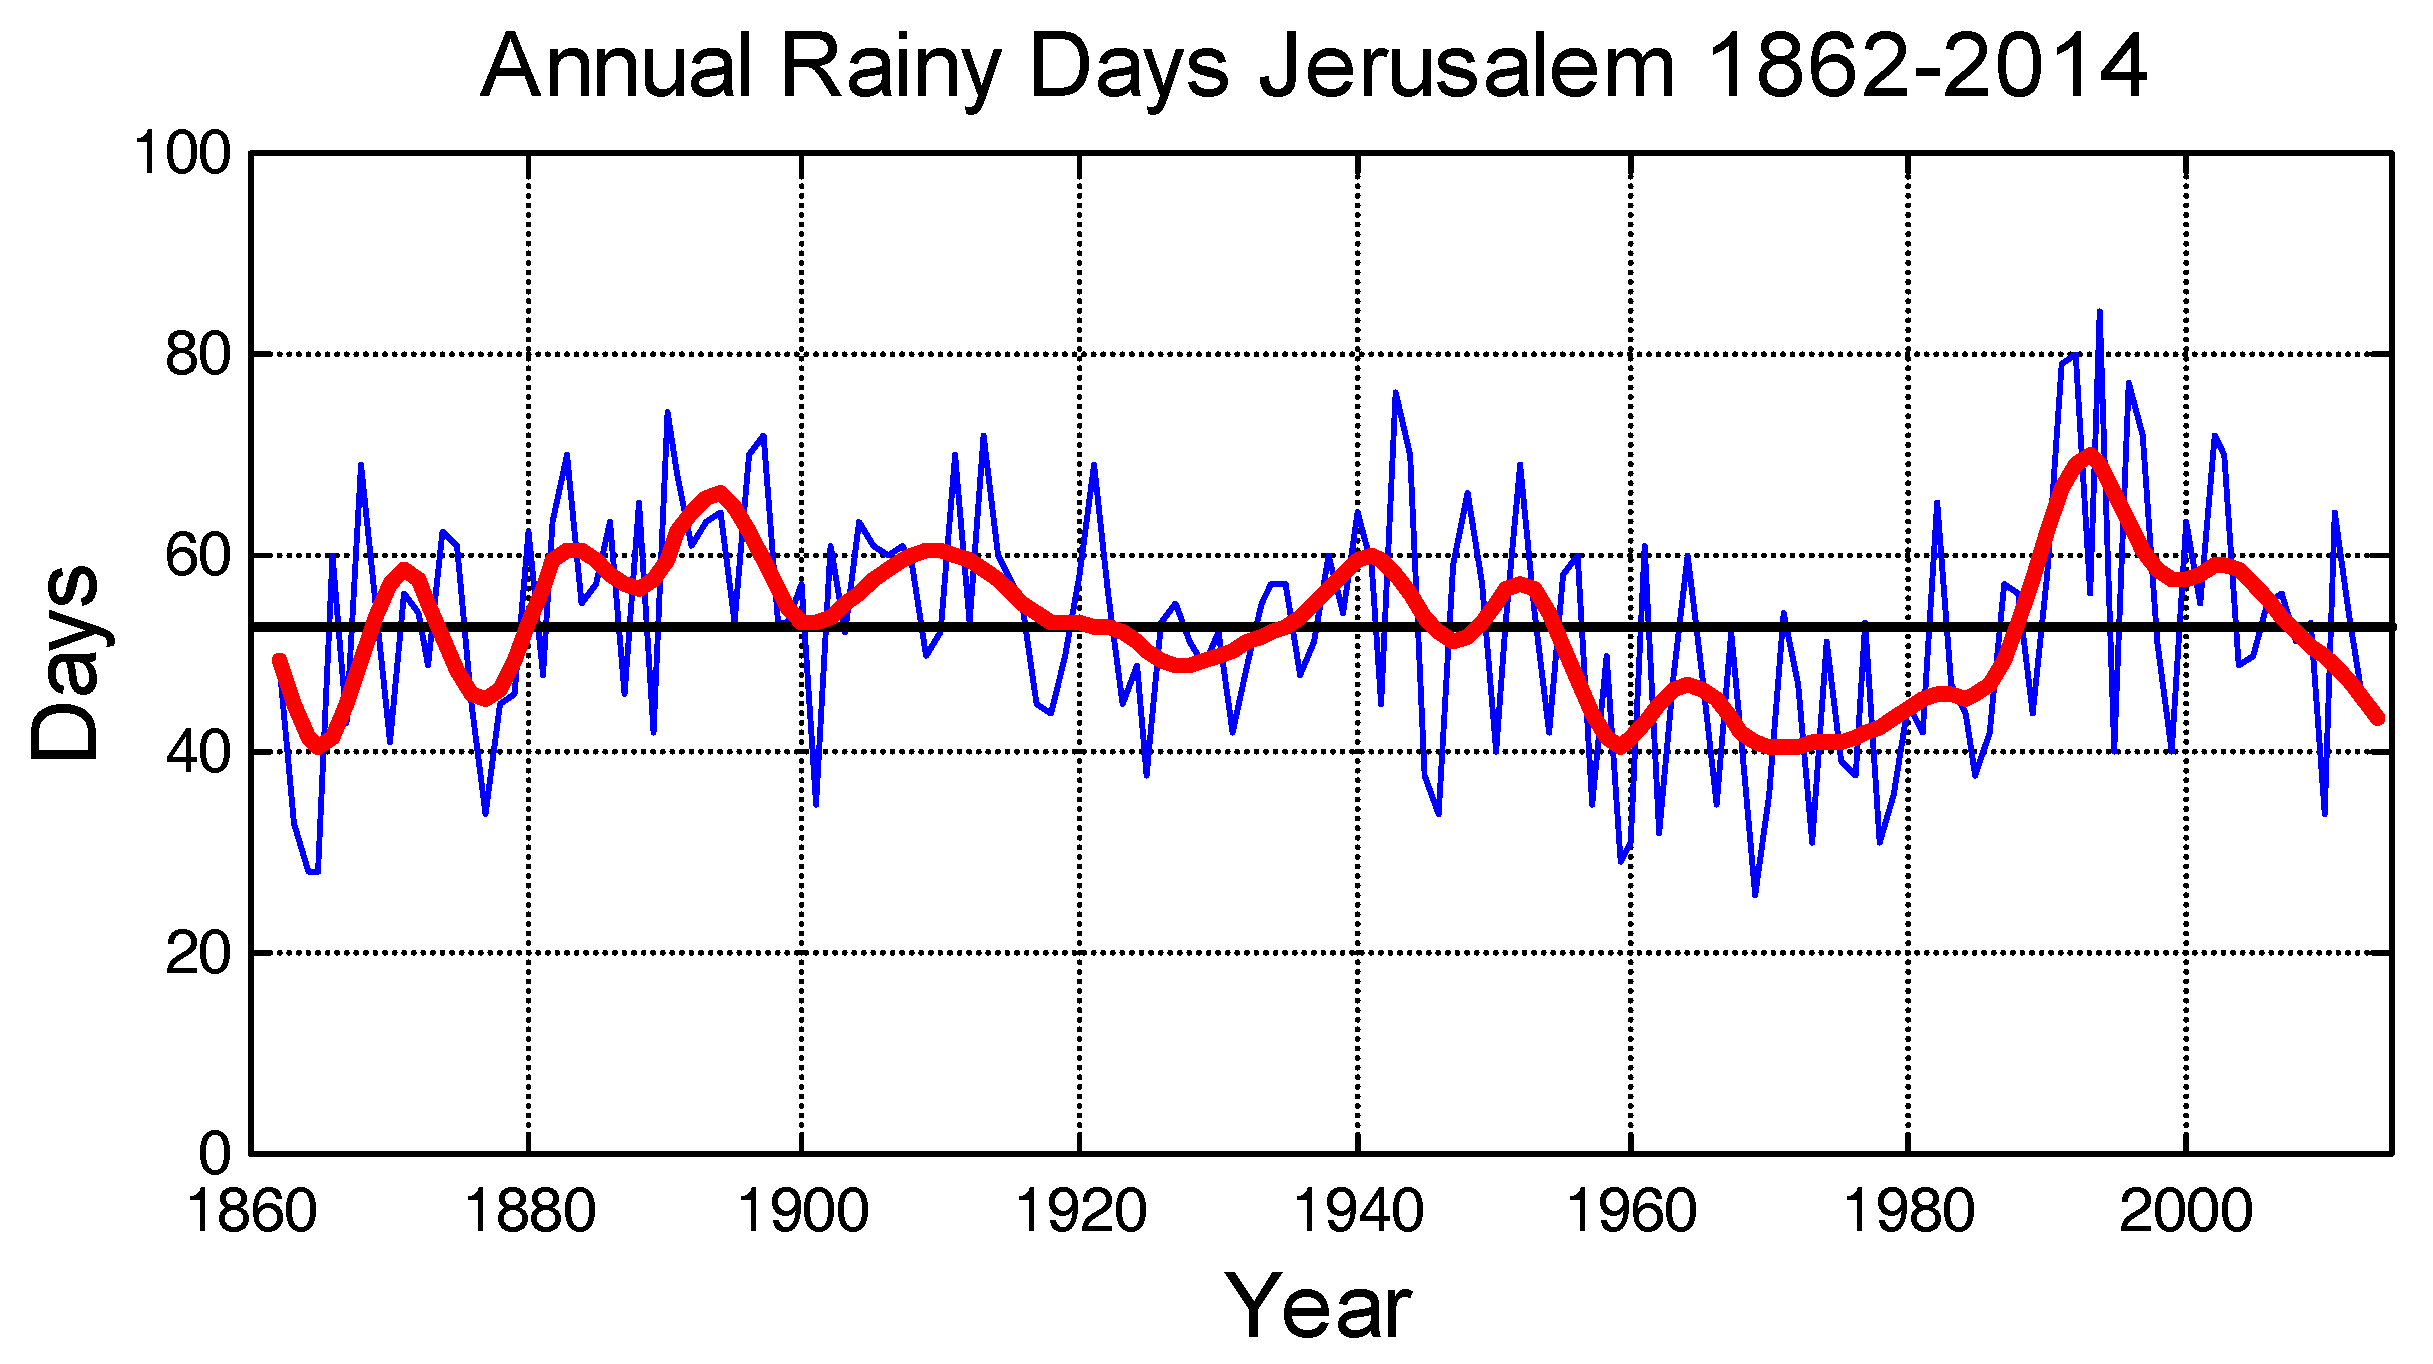
In our analysis we have compared to the current values the only meteorological variable that is possible to examine quantitatively in Maria Valtorta’s writings, namely the number of rainy days observed in the EMV, under the hypothesis that this random variable has not drastically changed in the last 2000 years. This seems to be indeed the case because this random variable is stable in long intervals, as
Figure 7 shows, as an example, for Jerusalem in the years 1862–2014. The smoother curves have been obtained by filtering the original time series with a numerical kernel that filters out the sinusoidal components with period shorter than 10 years to reduce the short-term fluctuations. Besides the short-term fluctuations, typical of any meteorological variable, it is evident the large stability of this variable for more than a century, with average value 52.7 days and standard deviation 11.9 days. If Maria Valtorta had had the recent rainy days data of Jerusalem and filtered the data, she would have seen, before 1943, a time series of increasing number of rainy days in the years 1930 to 1943. Of course, it is unlikely that a science and mathematics illiterate, as she was, could model the raw data shown in
Figure 7 or averaged them. In other words, she could not invent the average results found in her writings, very similar to the long term values found in the Holy Land.
To further clarify this point
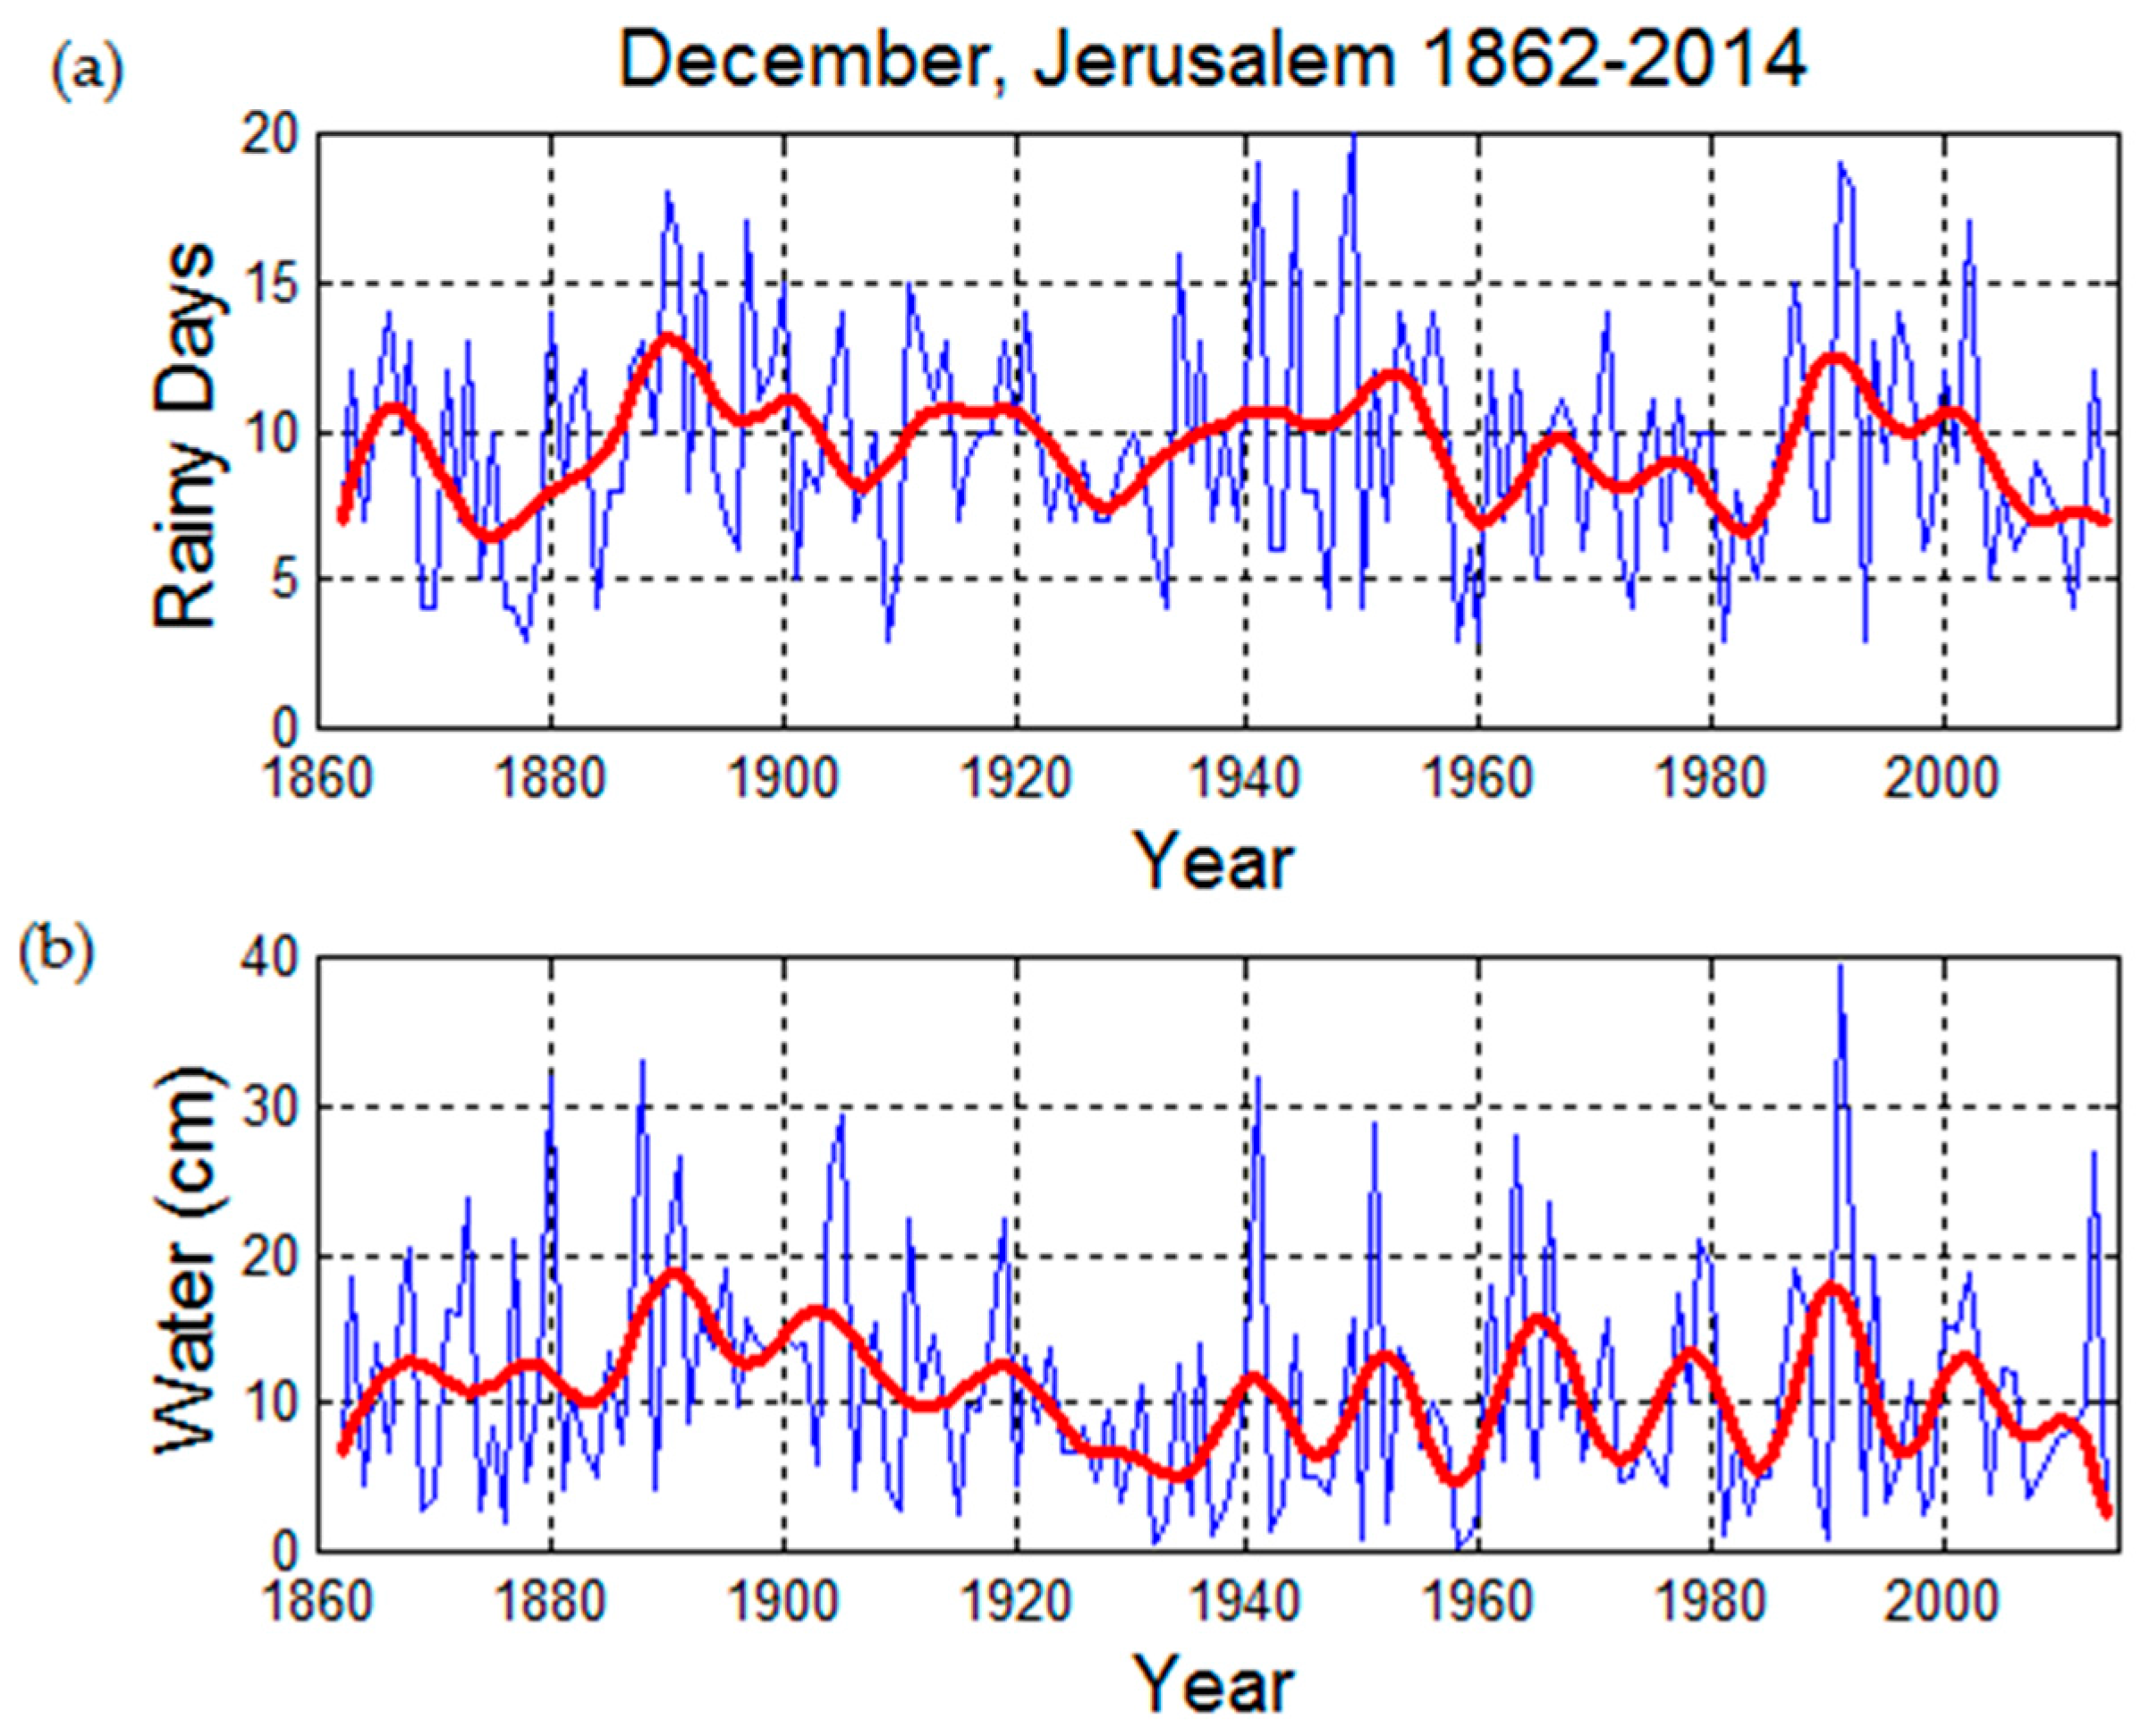
Figure 8 shows the time series of the number of rainy days (higher panel) and the quantity of water precipitated and accumulated in the same day (lower panel) in each month of December in the years 1862–2014 (153 years) in Jerusalem. The average number of rainy days is 9.5, the standard deviation 3.8 days, the average quantity of water is 10.8 cm with standard deviation 7.8 cm, i.e., 72% of the average.
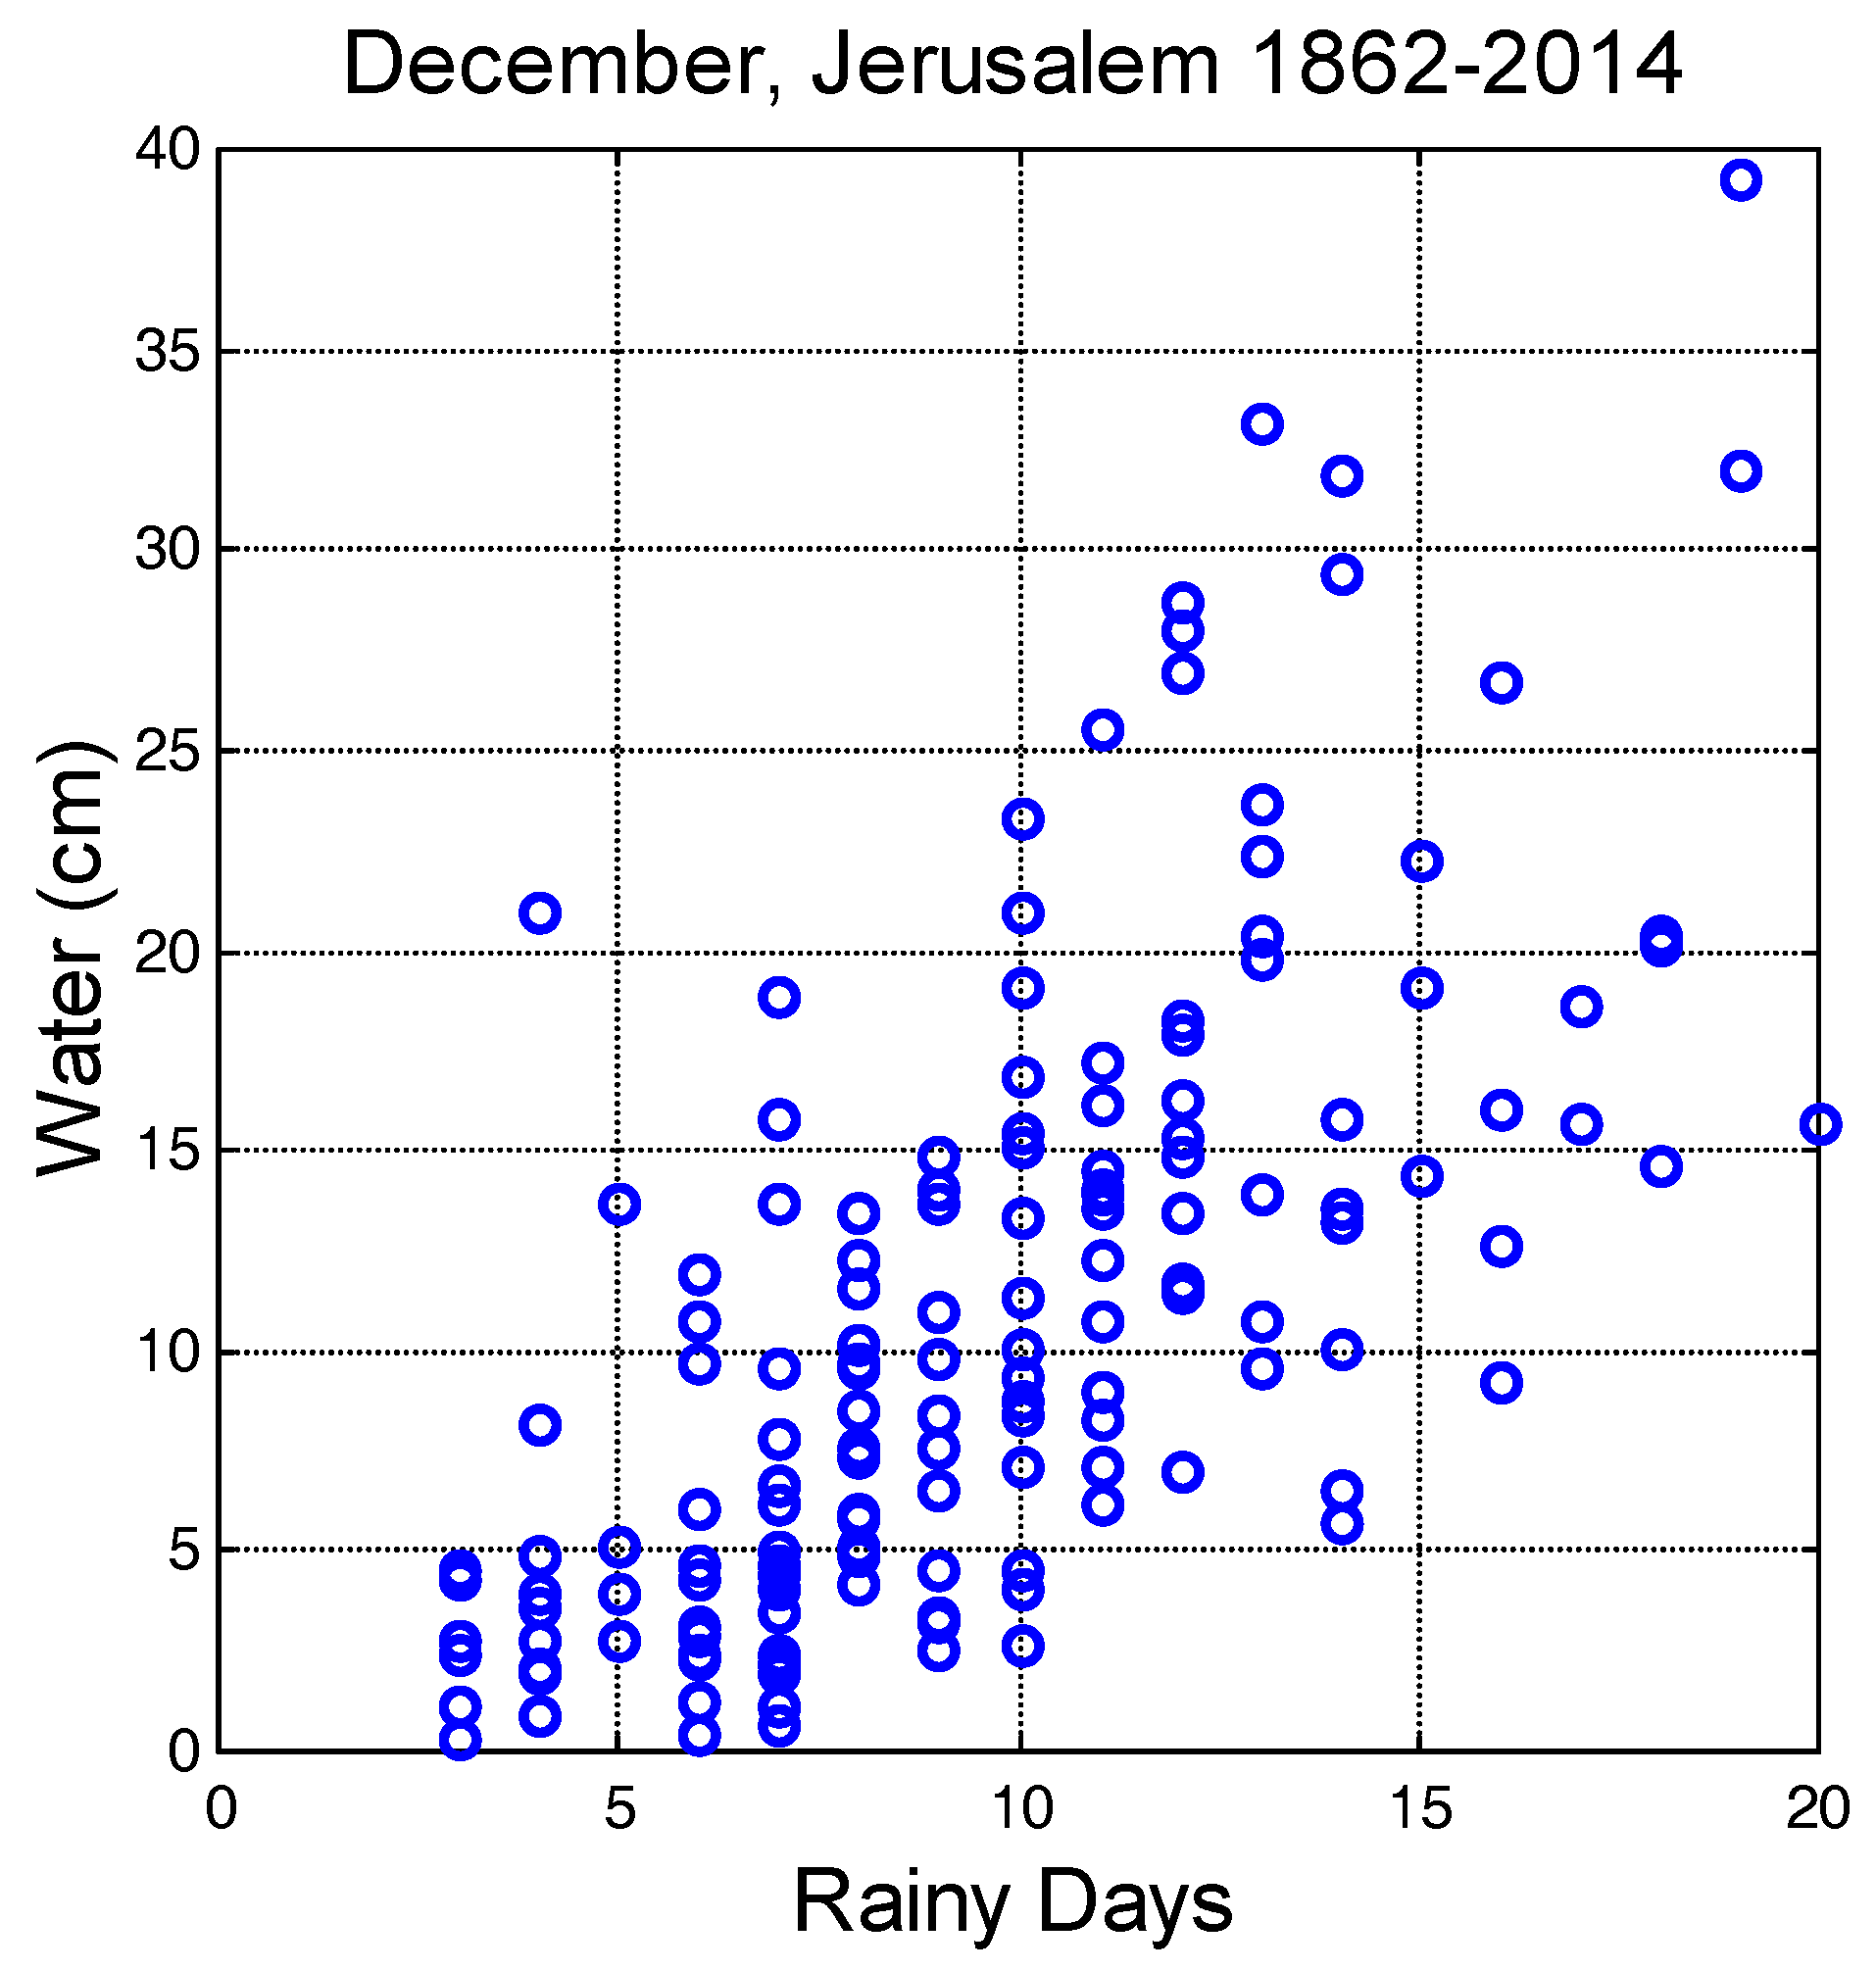
Figure 9 shows the scatterplot between the two variables concerning the same year. The correlation is
for the original data, and
for the filtered data. The latter, without short-term fluctuations, are more adapt to evidence the long-term temporal relationship. We can notice that by calculating the coefficient of determination only
of the variance of the water precipitated is explained, or it can be predicted, by the number of rainy days in the raw data, and only
in the filtered data. In other words, the two variables are loosely correlated and this is more evident in the filtered data. It is possible to find months with the
same number of rainy days but with very
different quantity of water precipitated.
Moreover, let us now consider the geographical dispersion of these data by calculating the monthly averages relative to the 184 localities in the years from 1990 to 2015.
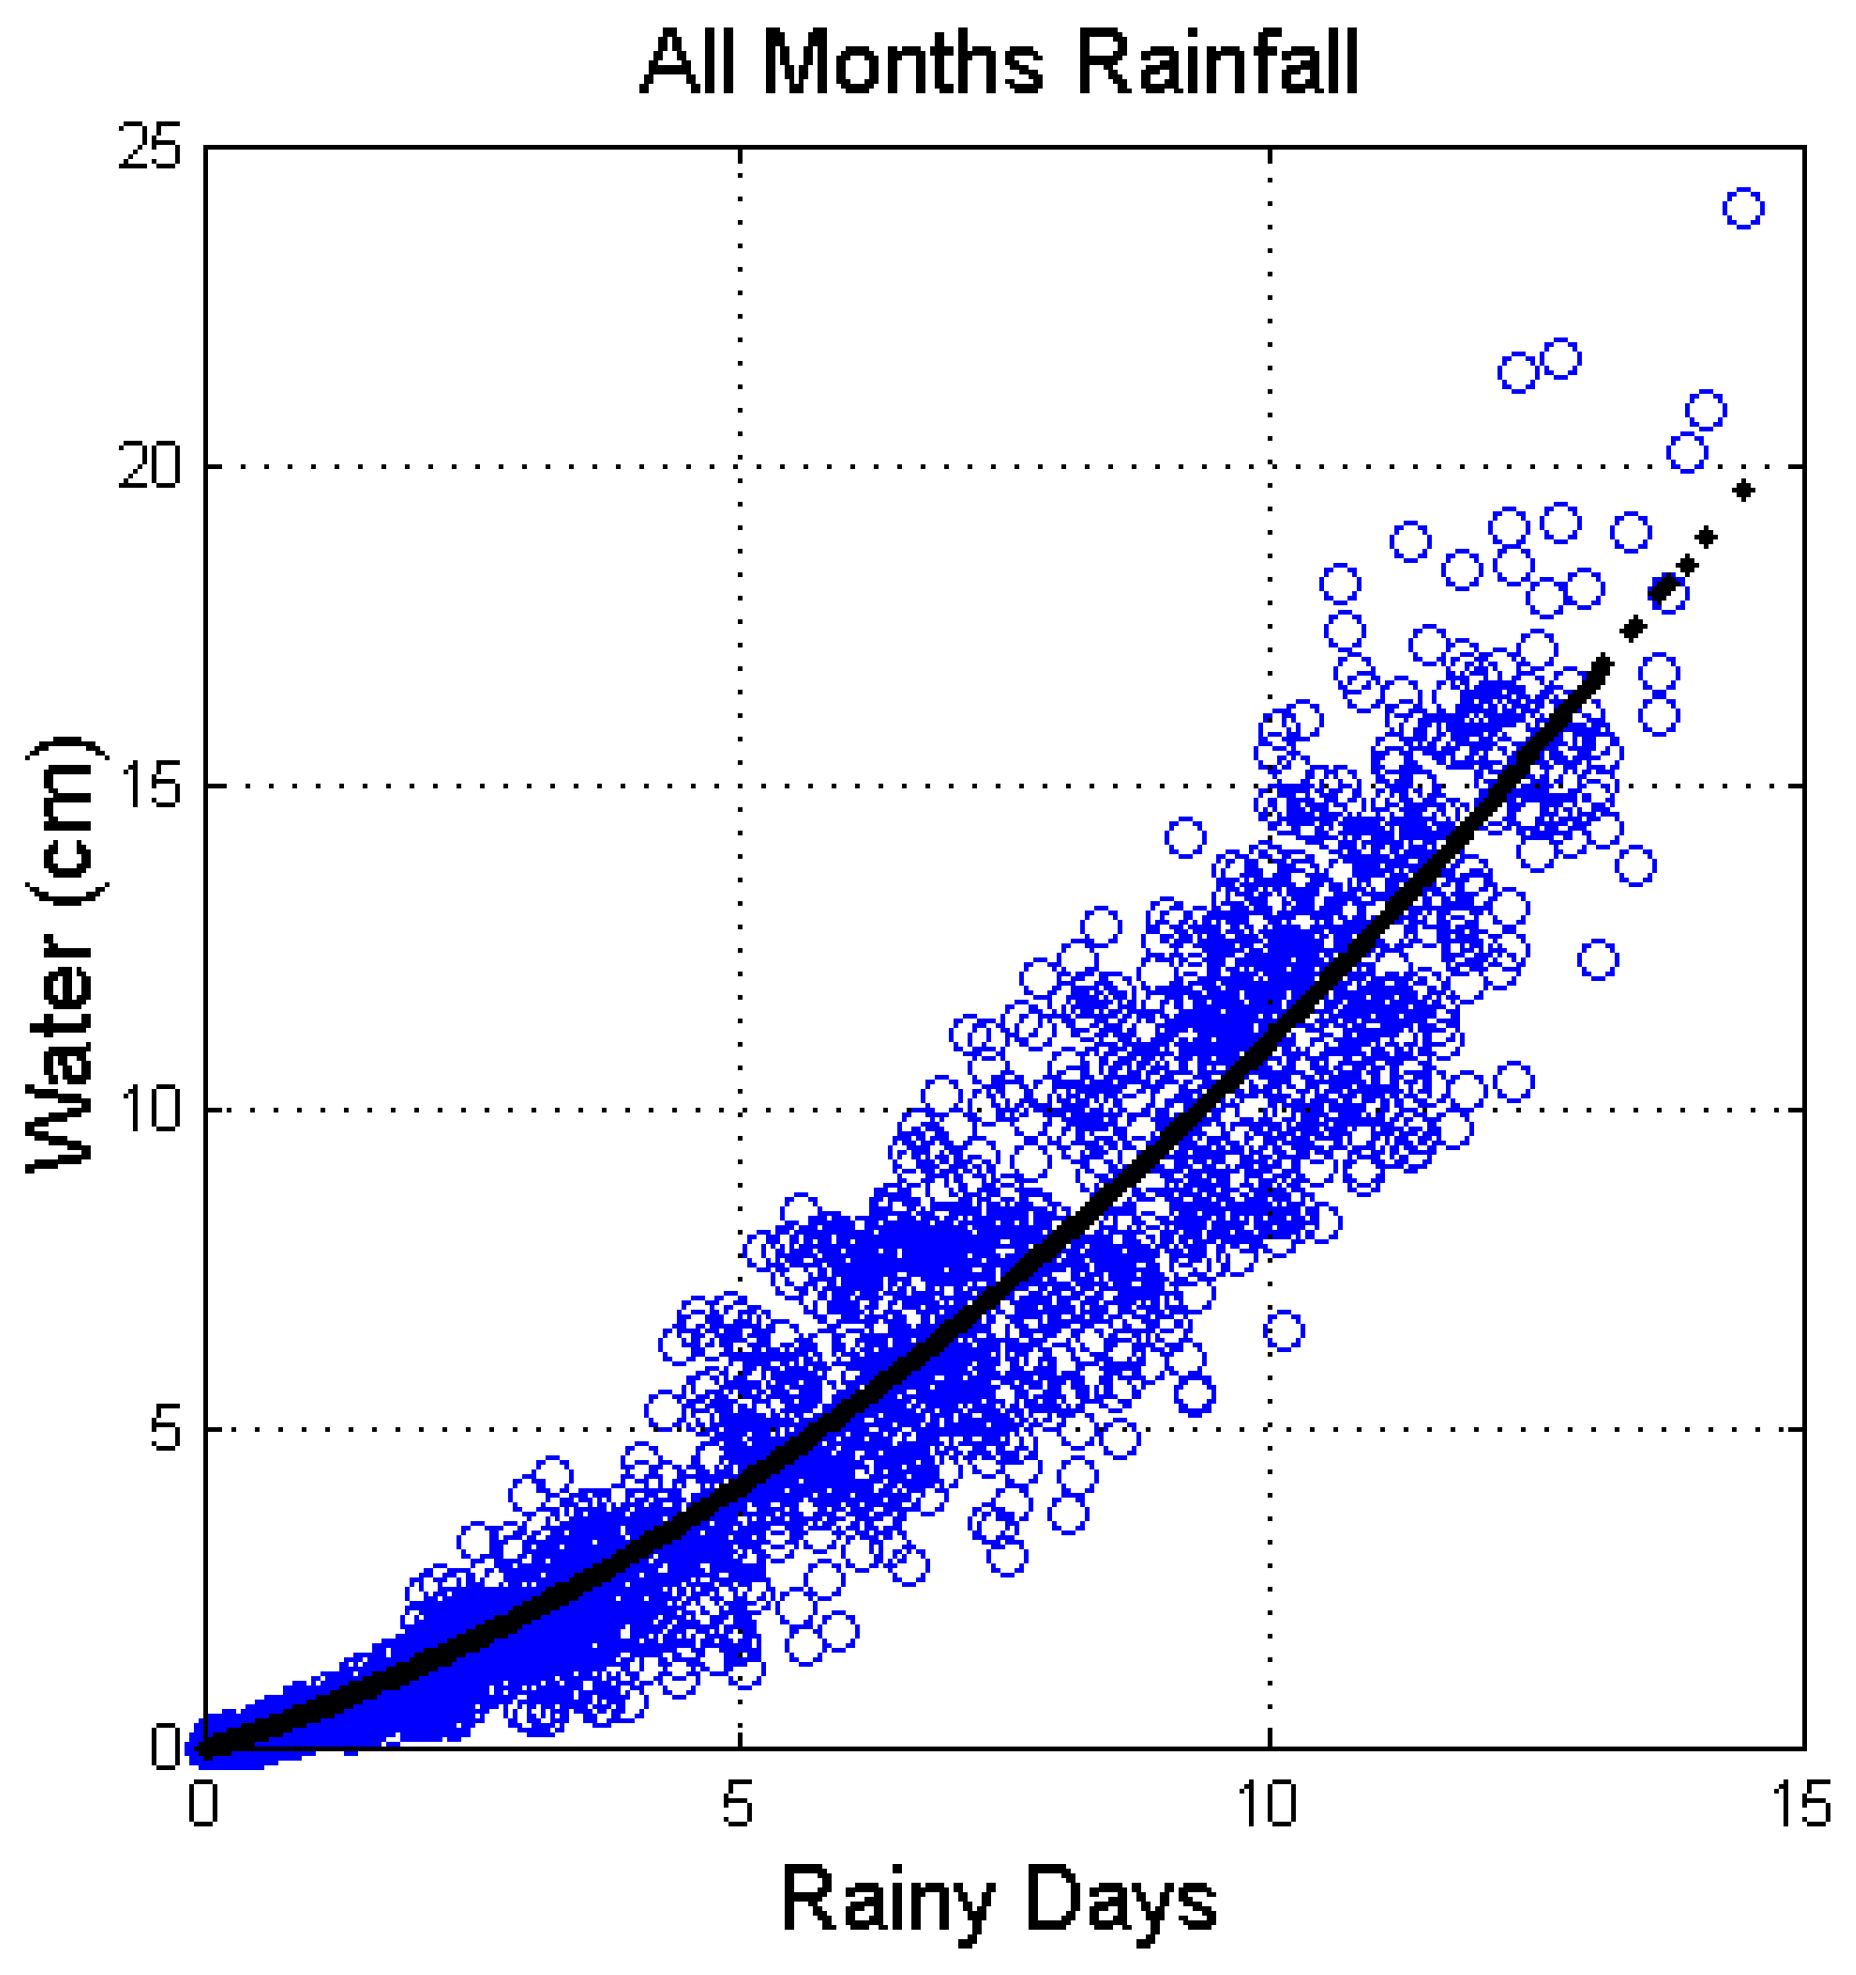
Figure 10 shows the scatterplot between the number of the monthly average quantity of water (
, in cm of height for a surface of 1 m
2) and the average number of monthly rainy days (
). The regression function that minimizes the mean squared error between data and model is given by the parabola:
Figure 11 shows, in the upper panel, the scatterplot of the difference between the monthly average quantity of precipitated water of
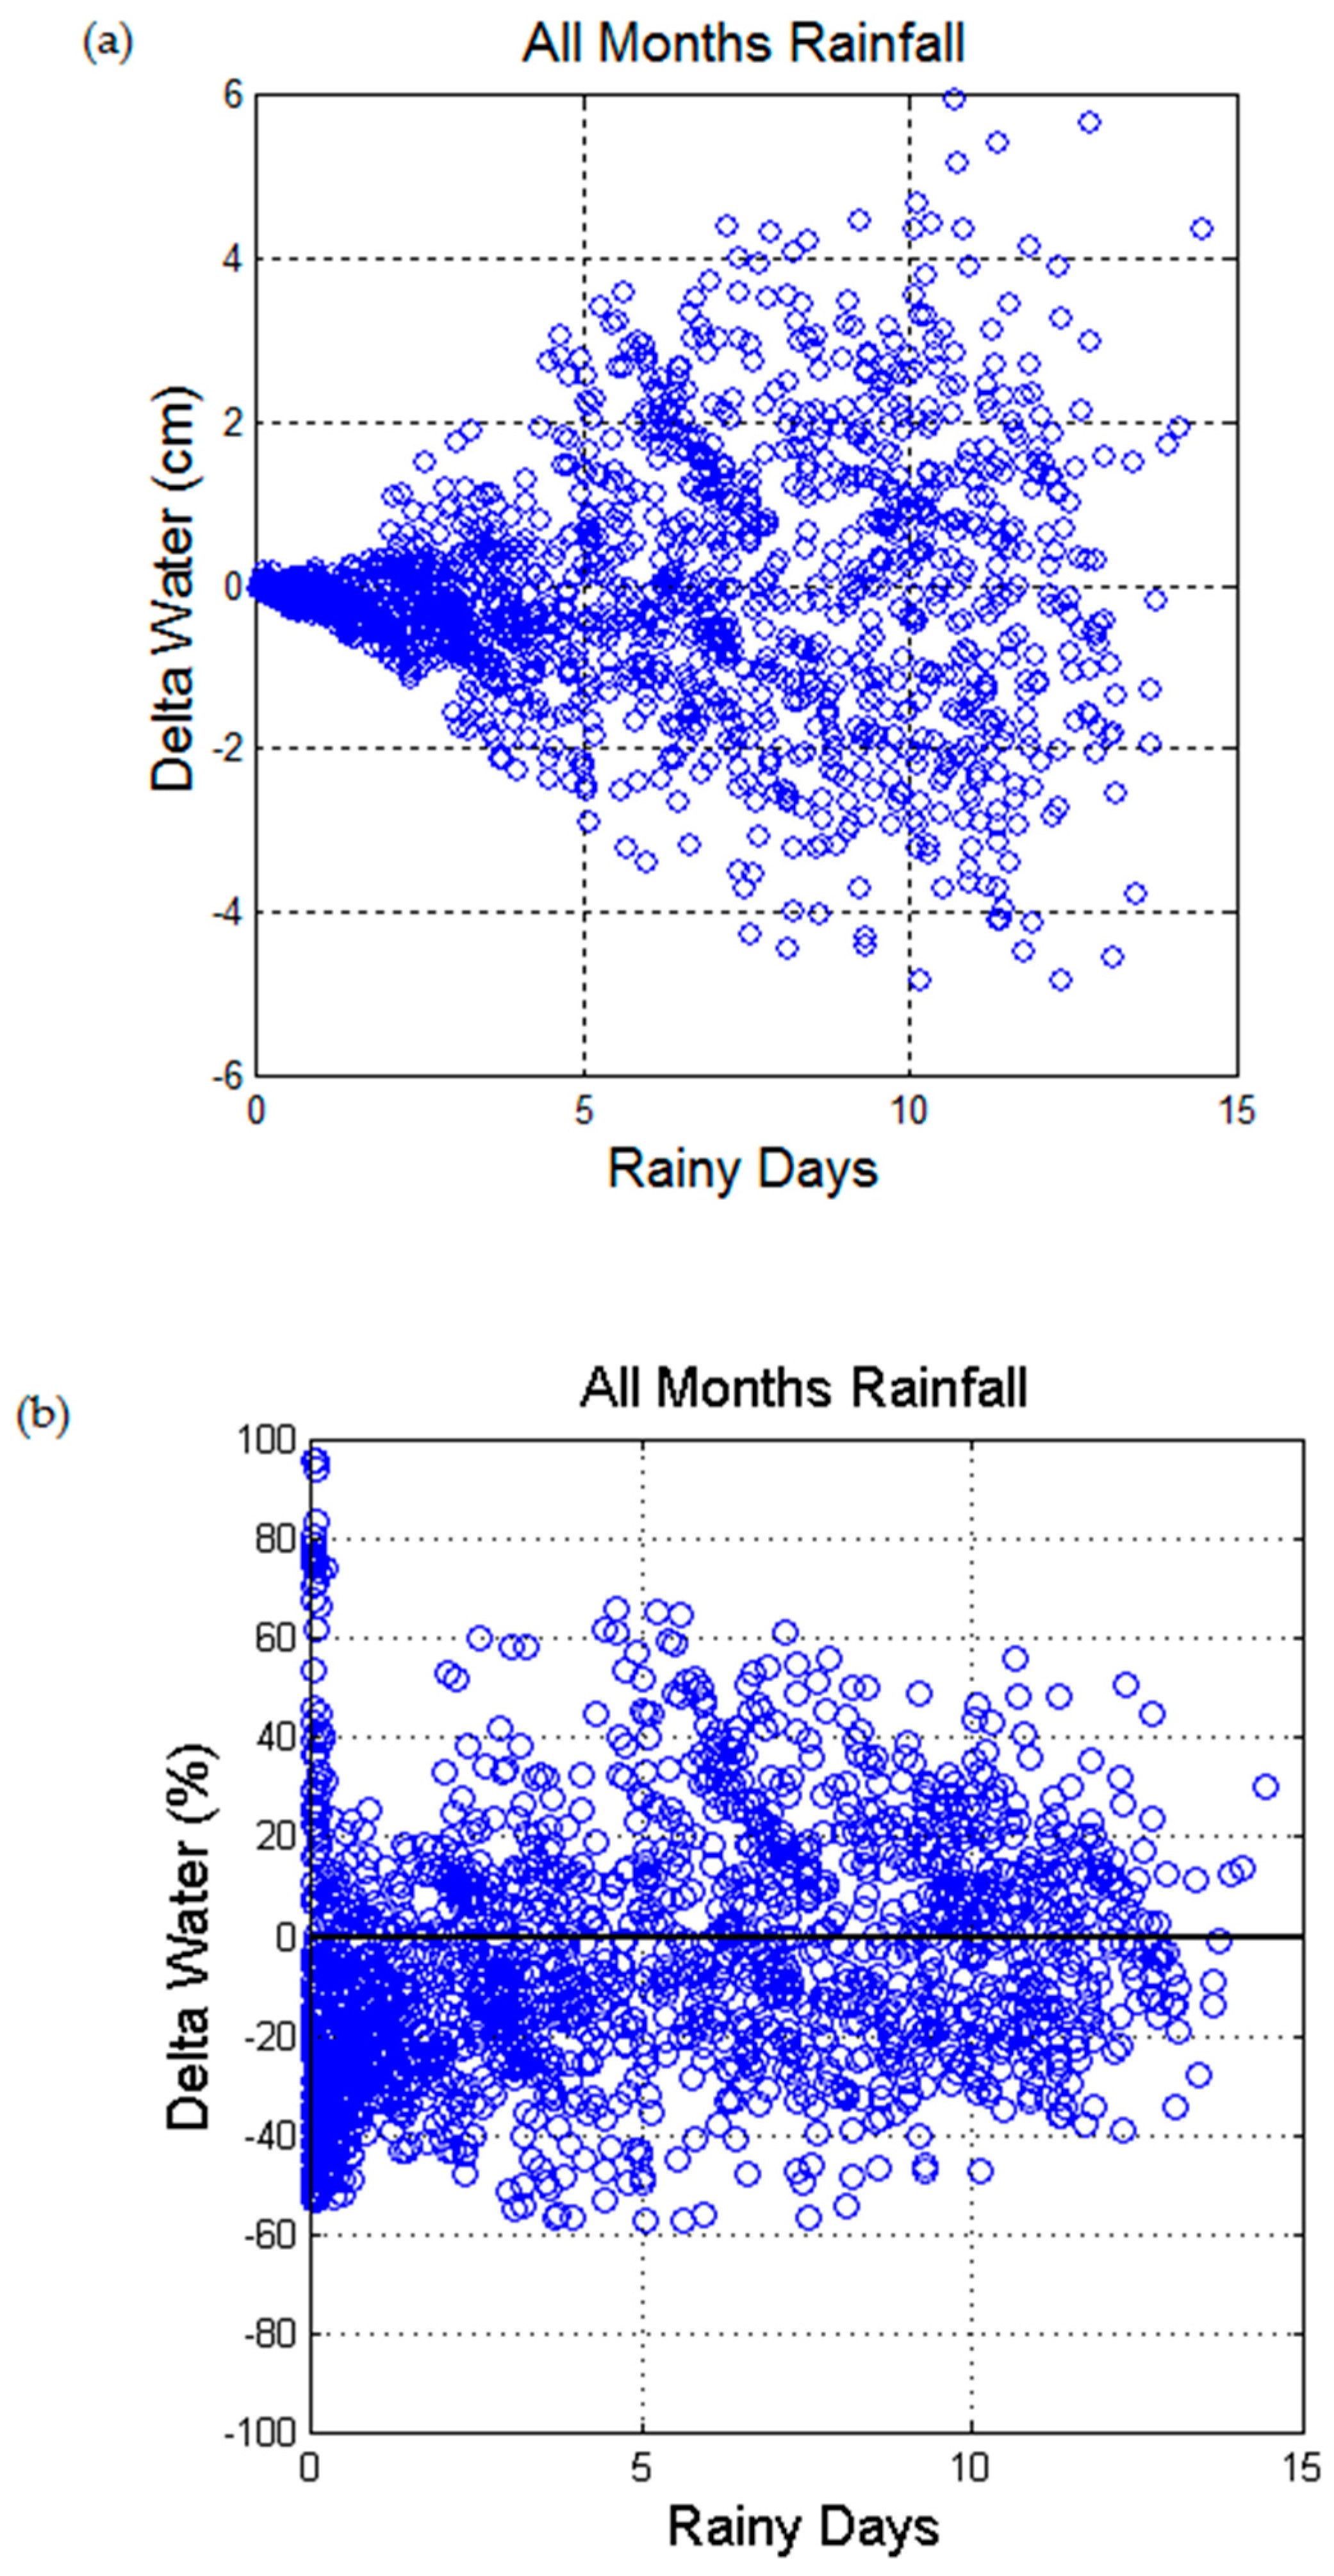
Figure 10 and the regression curve Equation (10), named delta water, and the average number of monthly rainy days, relative the 184 localities of the Holy Land, for each month in the years from 1990 to 2015. In the lower panel the scatterplot between the same quantities is shown, but with the difference given in percent (%) of the value of the regression curve. We can notice that, according to the average relationship (10), the average quantity of monthly water accumulated can change
for the same number of average rainy days of the month. Notice that this geographical spread is numerically close to the temporal spread (72%) obtained in the years 1862–2014 for the month of December in Jerusalem (
Figure 8). Therefore long-term changes in the random variable
are very likely masked by the spread found in the region. In other words, the possible climatic changes that after 2000 years might have affected the quantity of water accumulated daily in the Holy Land should have affected the number of rainy days very loosely.
These results confirm that the number of rainy days is a random variable quite independent of some climate changes that may have occurred in the Holy Land in the last 2000 years and, for this reason, it allows a reliable statistical comparison between the meteorological information derived from the EMS analysis and the current data derived from the IMS.
7. Conclusions
The richness of narrative elements contained in The Gospel as revealed to me by Maria Valtorta has allowed to pursue both astronomical and meteorological studies, suited to verify as much as possible what she states. Indeed, Maria Valtorta affirmed to have witnessed in mystic visions the life of Jesus, and in particular his three years of public life, reporting detailed descriptions of landscapes, costumes, uses, roads, towns with their buildings (including the Temple in Jerusalem) and streets, rivers, lakes, hills, valleys, plantations, climate and rainfall rainy days, night sky with its constellations, stars and planets in the Holy Land, all information that should belong to a period of 2000 years ago. This is not possible from a rational point of view, but from this study a surprising and unexpected result emerges: Maria Valtorta narration seems to be not a fruit of her fantasy. In fact, thanks to a complex and rigorous astronomical analysis of the narrative elements present in her writings, it has been possible to determine a precise chronology of every event of Jesus’ life that she tells us, even if no explicit calendar date is reported in her writings. In particular, this study has led to dating the crucifixion of Jesus in Friday, April 23 of the year 34, a date already proposed by da I. Newton.
Maria Valtorta has also recorded in the EMV the presence of rain and this has suggested to compare her observations with the current meteorological data concerning the number of rainy days in the Holy Land, as recorded by the Israel Meteorological Service (IMS), because this random variable, as shown, seems to be quite independent by the limited climatic changes that have characterized the Holy Land in the last 2000 years. What has emerged is, once more, surprising and unexpected because the annual and even the monthly frequencies of rainy days found in the EMV correspond to what we find today in the IMS data bank. It seems that she has written down observations and facts really happened at the time of Jesus’ life, as a real witness of them would have done. The question arises, unsolved from a point of view exclusively rational, how all this is possible because what Maria Valtorta writes down cannot, in any way, be traced back to her fantasy or to her astronomical and meteorological knowledge.
In conclusion, if from one hand the scientific inquire has evidenced all the surprising and unexpected results reported and discussed in this paper, on the other hand our actual scientific knowledge cannot readily explain how these results are possible.
