Moving Away from Religion: Age, Cohort, or Period Effect? Evidence from a Longitudinal Survey in Switzerland
Abstract
1. Introduction
1.1. Religiosity and Birth Cohort: A Megatrend
1.2. The Swiss Context
1.3. Data
2. Methods
3. Results
3.1. Non-Affiliation
3.2. Non-Affiliation—Intergroup Variance
3.3. Non-Affiliation—Intragroup Variance
3.4. Religious Attendance and Personal Prayer
3.5. Practice and Prayer—Intergroup Variance
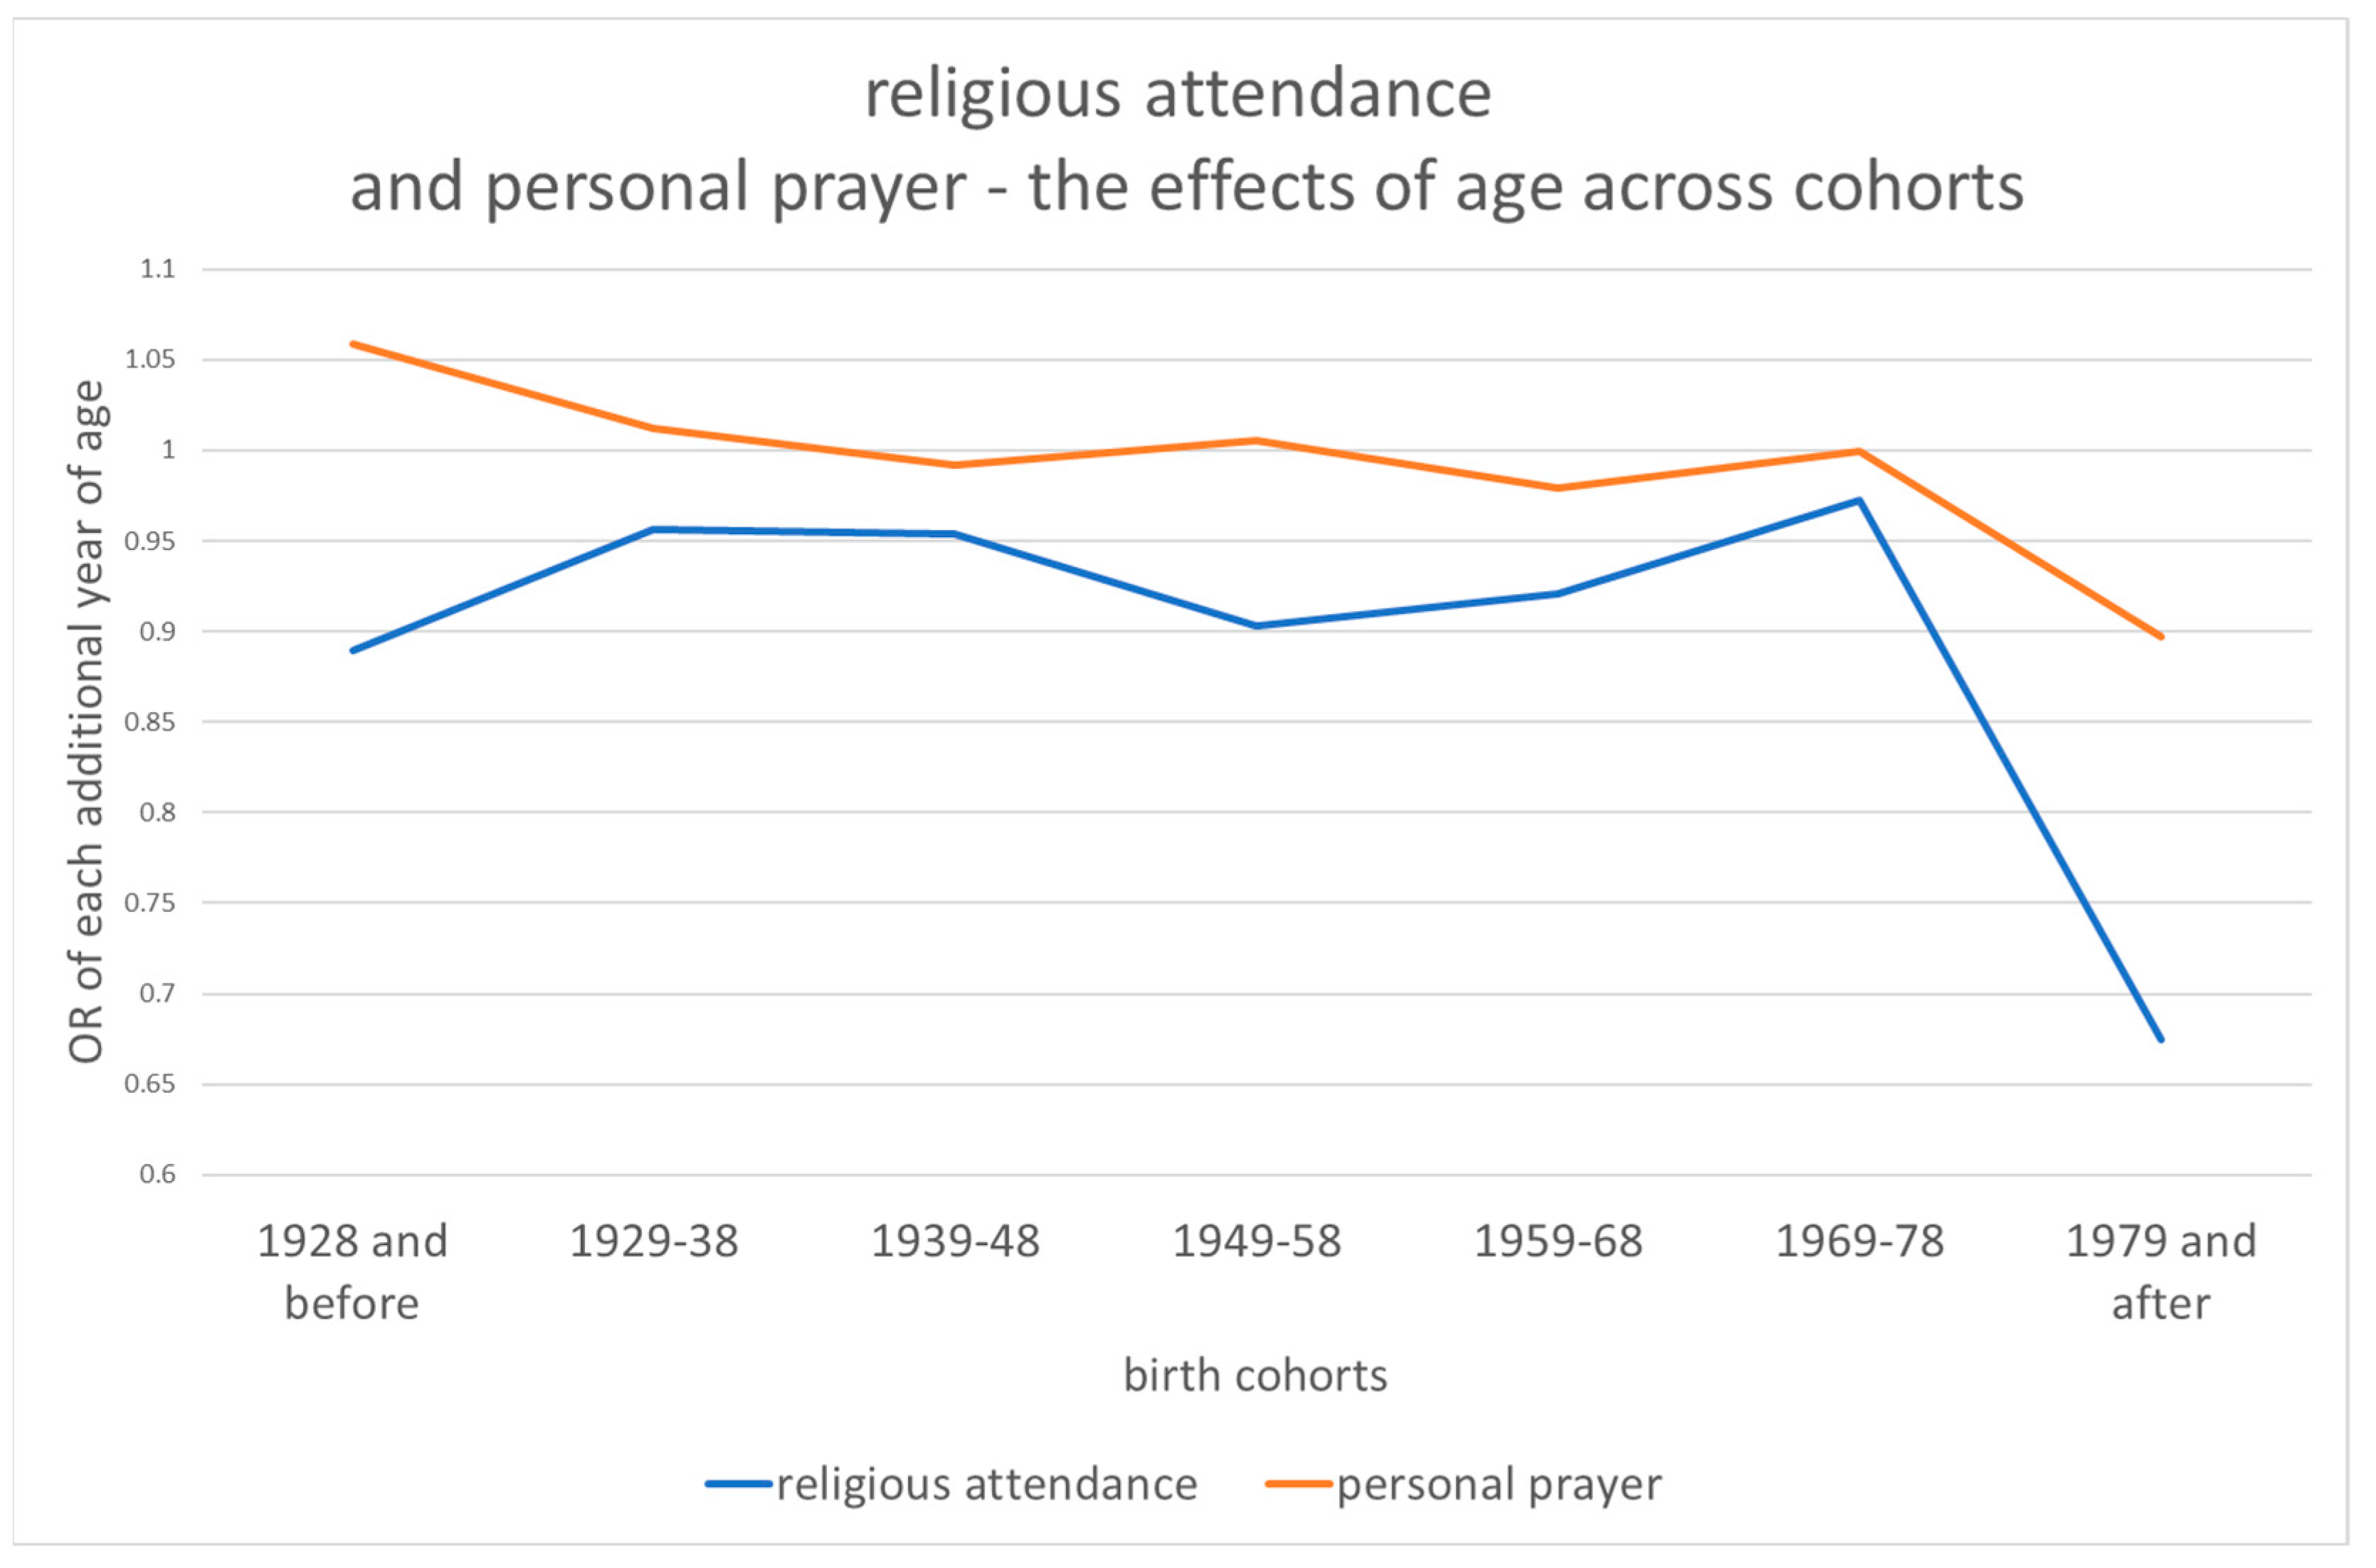
3.6. Practice and Prayer—Intragroup Variance
4. Discussion
5. Conclusions
Author Contributions
Funding
Institutional Review Board Statement
Informed Consent Statement
Data Availability Statement
Conflicts of Interest
| 1. | The authors would like to thank David Voas, Jörg Stolz and the two anonymous reviewers for their comments on an earlier version of this paper. We are also grateful to the CIHSR (University of Lausanne) for providing Dominique Macabies for editing the article in academic English. |
| 2. | The two variables measuring religious attendance and prayer are originally more detailed but cannot, in any case, be considered as continuous. In view of the difficulty of graphical and numerical representation of the statistical processing of such data, for which groupings would, in any case, have had to be found, we opted for monthly dichotomies, which correspond to the usual practice for such indicators. |
| 3. | Although the questions are asked to everyone by the SHP, we opted to study practice and prayer only among people affiliated with the two dominant religions in Switzerland in order to provide a valid basis for comparison with the situation in other contexts, as reported in the literature. |
| 4. | This second part of these analyses, therefore, excludes those declaring a religion other than the main ones mentioned above (10.1% of the total) and the non-affiliated (14.2%), as well as those whose affiliation varies over time, even if only once, during their follow-up by the panel. |
References
- Agresti, Alan. 2013. Categorial Data Analysis, 3rd ed. Hoboken: Wiley. First published 1990. [Google Scholar]
- Allison, Paul D. 2009. Fixed Effects Regression Models. Thousand Oaks: Sage, vol. 160. [Google Scholar]
- Berger, Peter Ludwig. 1967. The Sacred Canopy. Elements of a Sociological Theory of Religion. London: Doubleday. [Google Scholar]
- Brauer, Simon. 2018. The Surprising Predictable Decline of Religion in the United States. Journal for the Scientific Study of Religion 57: 654–675. [Google Scholar] [CrossRef]
- Bruce, Steve. 2002. God is Dead: Secularization in the West, Religion in the Modern World. Oxford: Blackwell. [Google Scholar]
- Chamberlain, Gary. 1980. Analysis of Covariance with Qualitative Data. The Review of Economic Studies 47: 225–38. [Google Scholar] [CrossRef]
- Crockett, Alasdair, and David Voas. 2006. Generations of Decline: Religious Change in 20th-Century Britain. Journal for the Scientific Study of Religion 45: 567–84. [Google Scholar] [CrossRef]
- Firebaugh, Glenn, and Brian Harley. 1991. Trends in U.S. Church Attendance: Secularization and Revival, or Merely Lifecycle Effects? Journal for the Scientific Study of Religion 30: 487–500. [Google Scholar] [CrossRef]
- Greeley, Andrew M. 2003. Religion in Europe at the End of the Second Millennium: A Sociological Profile. New Brunswick: Transaction Publishers. [Google Scholar]
- Greene, William H. 2017. Econometric Analysis, 8th ed. New York: Pearson. [Google Scholar]
- Hosmer, David W., Stanley Lemeshow, and Rodney X. Sturdivant. 2013. Applied Logistic Regression, 3rd ed. Hoboken: Wiley. [Google Scholar]
- Hubbard, Alan E., Jennifer Ahern, Nancy L. Fleischer, Mark Van der Laan, Sheri A. Satariano, Nicholas Jewell, Tim Bruckner, and William A. Satariano. 2010. To GEE or not to GEE: Comparing population average and mixed models for estimating the associations between neighborhood risk factors and health. Epidemiology 21: 467–74. [Google Scholar] [CrossRef] [PubMed]
- Molteni, Francesco, and Ferruccio Biolcati. 2018. Shifts in religiosity across cohorts in Europe: A multilevel and multidimensional analysis based on the European Values Study. Social Compass 65: 413–32. [Google Scholar] [CrossRef]
- Molteni, Francesco, and Ferruccio Biolcati. 2022. Religious Decline as a Population Dynamic: Generational Replacement and Religious Attendance in Europe. Social Forces, soac099. [Google Scholar] [CrossRef]
- Molteni, Francesco, and Frank van Tubergen. 2022. Immigrant generation and religiosity: A study of Christian immigrant groups in 33 European countries. European Societies 24: 605–27. [Google Scholar] [CrossRef]
- Neuhaus, John M. 1992. Statistical methods for longitudinal and clustered designs with binary responses. Statistical Methods in Medical Research 1: 249–73. [Google Scholar] [CrossRef] [PubMed]
- Neuhaus, John M., John D. Kalbfleisch, and Walter W. Hauck. 1991. A Comparison of Cluster-Specific and Population-Averaged Approaches for Analyzing Correlated Binary Data. International Statistical Review 59: 25–35. [Google Scholar] [CrossRef]
- Norris, Pippa, and Ronald Inglehart. 2005. Sacred and Secular: Religion and Politics Worldwide, Repr. ed. Cambridge: Cambridge University Press. [Google Scholar]
- Stolz, Jörg. 2010. A Silent Battle. Theorizing the Effects of Competition between Churches and Secular Institutions. Review of Religious Research 51: 253–76. [Google Scholar]
- Stolz, Jörg, and Jeremy Senn. 2022. Generationen abnehmenden Glaubens. In Religionstrends in der Schweiz: Religion, Spiritualität und Säkularität im Gesellschaftlichen Wandel. Wiesbaden: Springer Fachmedien Wiesbaden, pp. 7–31. [Google Scholar]
- Stolz, Jörg, Ferruccio Biolcati, and Francesco Molteni. 2021. Is France exceptionally irreligious? A comparative test of the cohort replacement theory. L’Année sociologique 71: 337–67. [Google Scholar] [CrossRef]
- Voas, David. 2009. The Rise and Fall of Fuzzy Fidelity in Europe. European Sociological Review 25: 155–68. [Google Scholar] [CrossRef]
- Voas, David, and Mark Chaves. 2016. Is the United States a Counterexample to the Secularization Thesis? American Journal of Sociology 121: 1517–56. [Google Scholar] [CrossRef]
- Voas, David, and Alisdair Crockett. 2005. Religion in Britain: Neither Believing nor Belonging. Sociology 39: 11–28. [Google Scholar] [CrossRef]
- Voas, David, and Stefanie Doebler. 2011. Secularization in Europe: Religious change between and within birth cohorts. Religion and Society in Central and Eastern Europe 4: 39–62. [Google Scholar]
- Wilson, John. 1978. Religion in American Society. Englewood Cliffs: Prentice Hall. [Google Scholar]
- Wolf, Christof. 2008. How Secularized is Germany? Cohort and Comparative Perspectives. Social Compass 55: 111–26. [Google Scholar] [CrossRef]
- Zeger, Scott L., and Kung-Yee Liang. 1986. Longitudinal Data Analysis for Discrete and Continuous Outcomes. Biometrics 42: 121–30. [Google Scholar] [CrossRef] [PubMed]
- Zeger, Scott L., Kung-Yee Liang, and Paul S. Albert. 1988. Models for Longitudinal Data: A Generalized Estimating Equation Approach. Biometrics 44: 1049–60. [Google Scholar] [CrossRef] [PubMed]
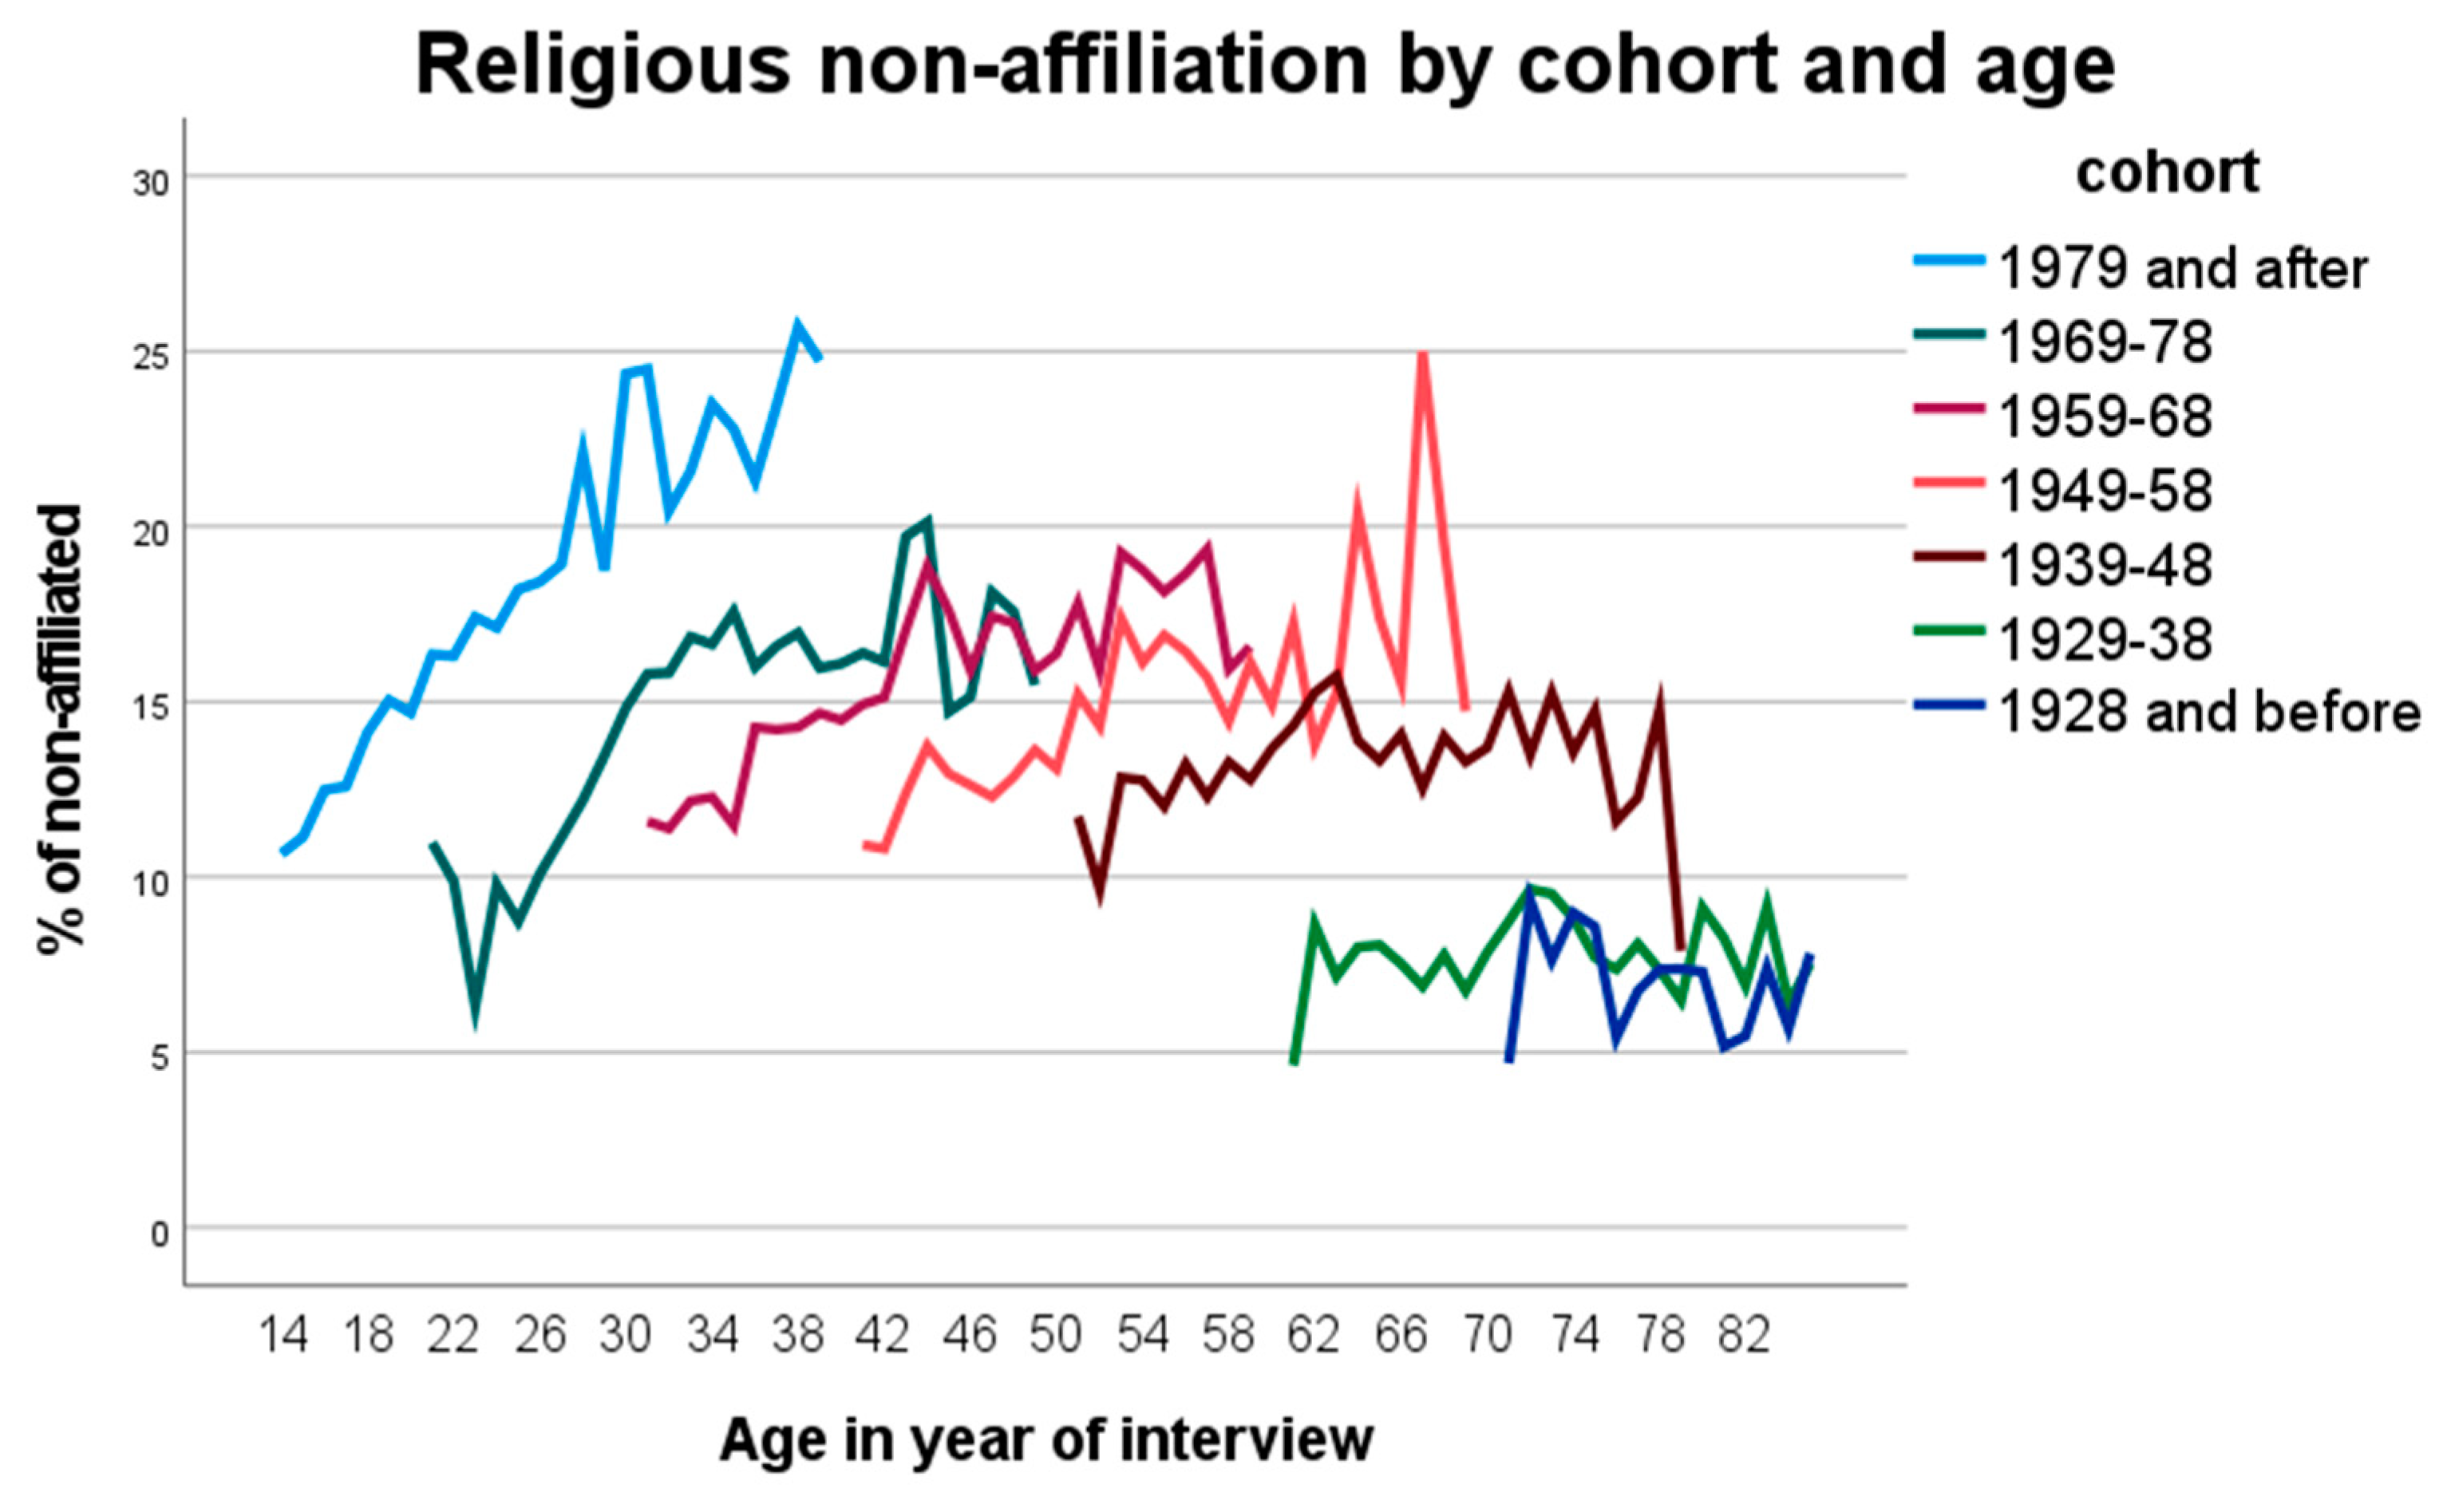

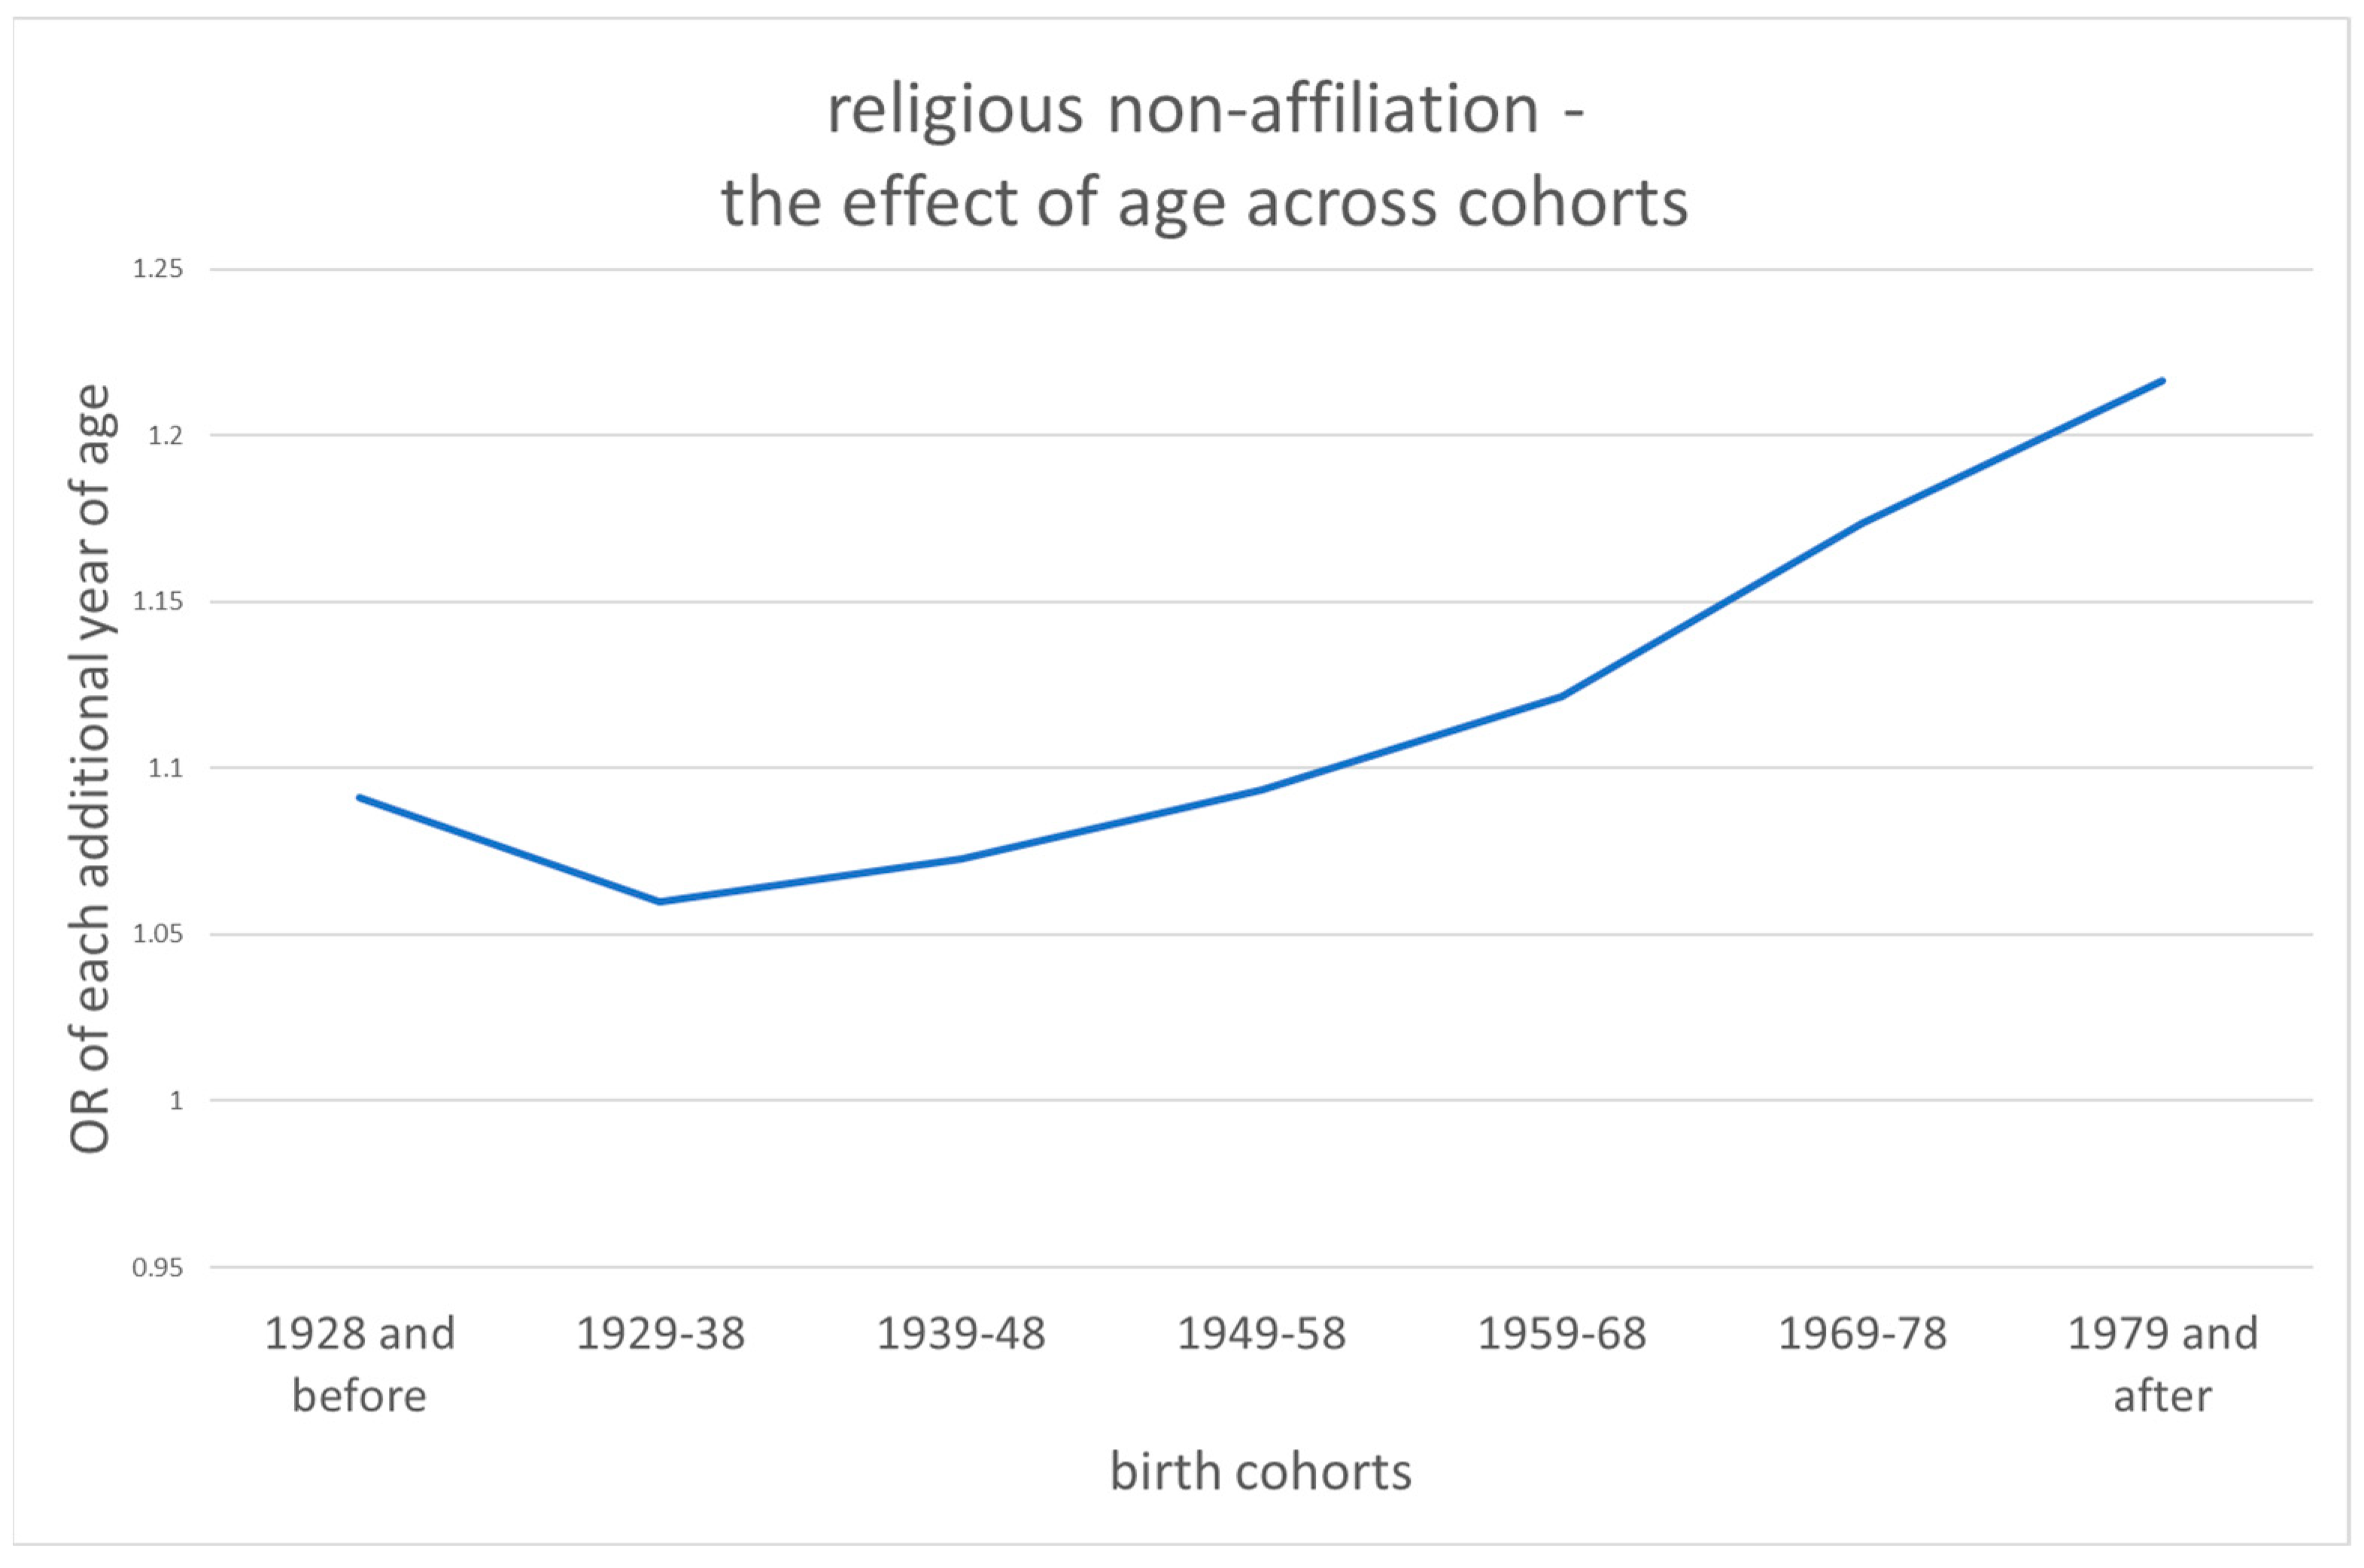
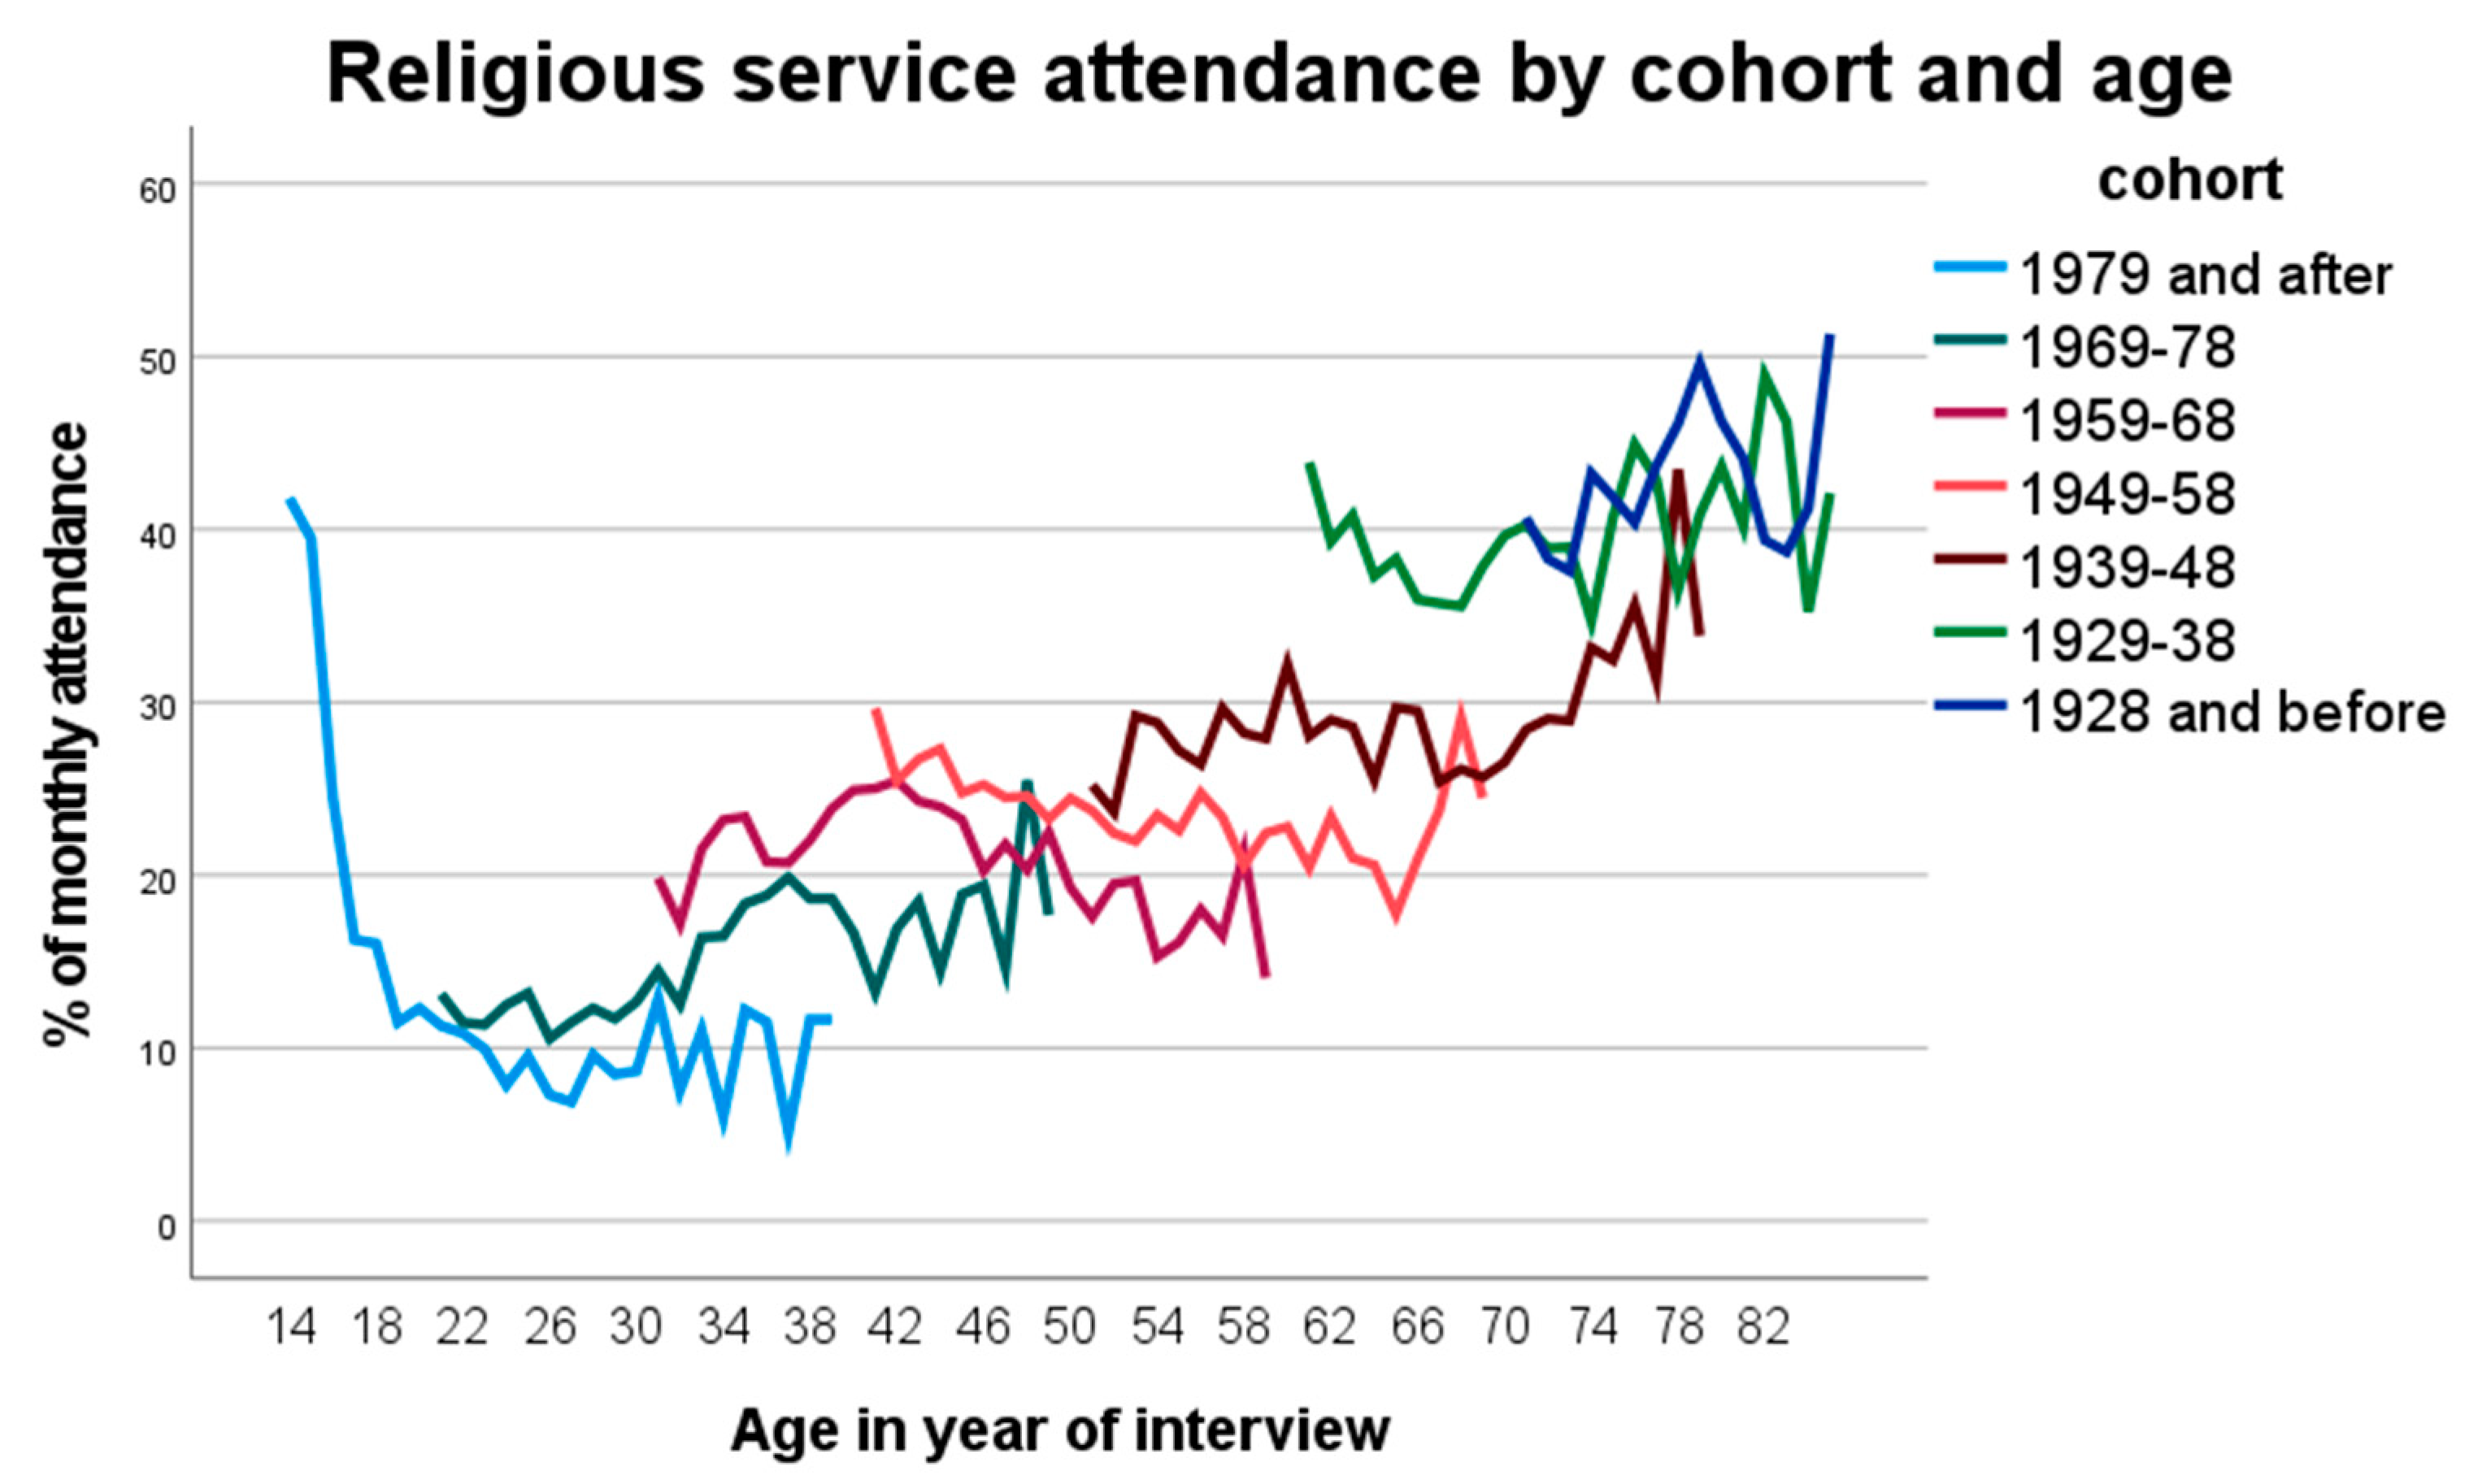

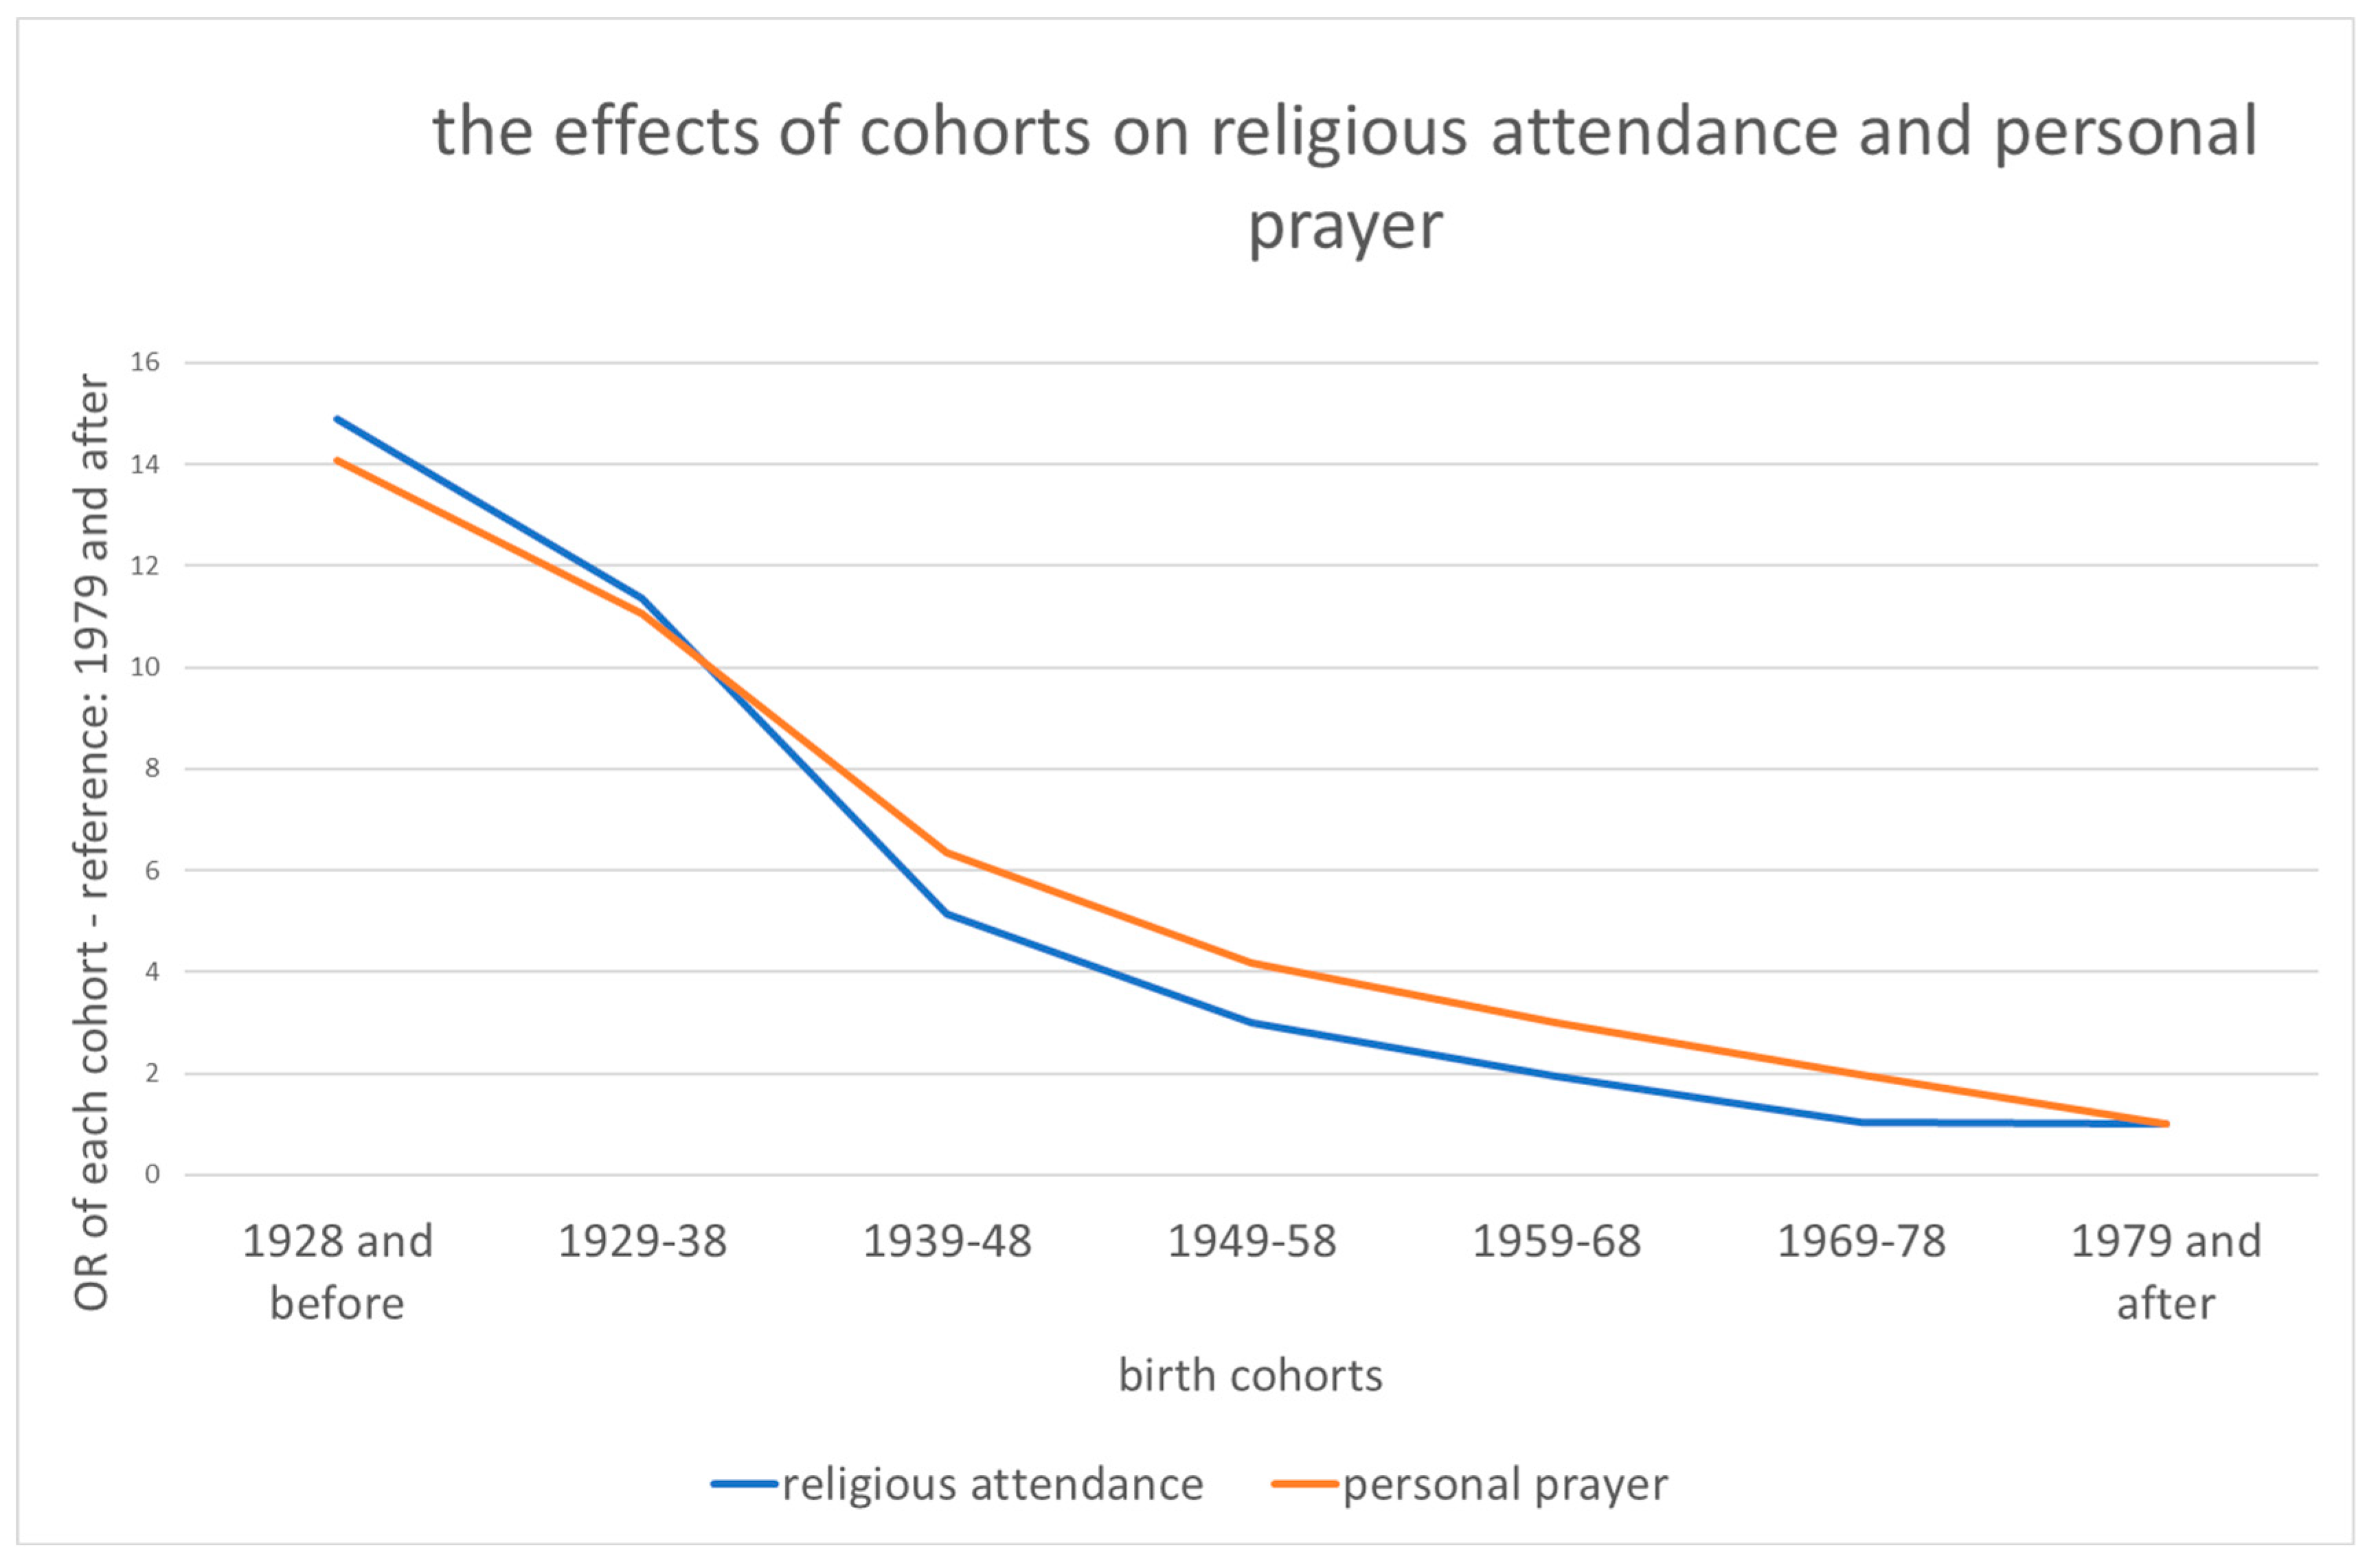
| No Religious Affiliation | Religious Attendance (Monthly) | Personal Prayer (Monthly) | |
|---|---|---|---|
| n observations—with non missing cases on all variables | 100,149 | 58,931 | 58,263 |
| n individuals—with non missing cases on all variables | 21,124 | 13,031 | 12,988 |
| of which n observation—with variance on the dependent variable | 14,545 | 17,570 | 22,517 |
| of which n individuals—with variance on the dependent variable | 2002 | 2355 | 3211 |
| no religious affiliation | 14.2% | ||
| religious practice (monthly) | 24.2% | ||
| personal prayer (monthly) | 56.6% | ||
| 1979 and after | 19.9% | 17.5% | 17.6% |
| 1969–78 | 13.4% | 12.5% | 12.5% |
| 1959–68 | 22.4% | 21.0% | 21.1% |
| 1949–58 | 18.6% | 19.1% | 19.1% |
| 1939–48 | 14.3% | 15.7% | 15.6% |
| 1929–38 | 8.4% | 10.3% | 10.2% |
| 1928 and before | 3.0% | 3.9% | 3.8% |
| men | 44.7% | 44.1% | 44.2% |
| Protestant | 31.6% | 53.7% | 53.5% |
| Roman Catholic | 27.3% | 46.3% | 46.5% |
| Swiss by birth | 85.8% | 90.9% | 90.9% |
| secondos—non swiss by birth, born in CH | 3.7% | 2.6% | 2.6% |
| primos—non swiss by birth, born abroad | 10.5% | 6.5% | 6.5% |
| 1st tertile of annual household income—less than 87,000 CHF | 35.2% | 35.6% | 35.5% |
| 2nd tertile of annual household income—87,000–126,999 CHF | 33.1% | 33.4% | 33.4% |
| 3rd tertile of annual household income—127,000 CHF and above | 31.7% | 31.0% | 31.1% |
| urban area | 53.9% | 54.0% | 53.9% |
| primary school | 15.3% | 15.6% | 15.6% |
| vocational training | 47.3% | 50.7% | 50.7% |
| higher education | 37.4% | 33.7% | 33.7% |
| Odds Ratio | p > z | |
|---|---|---|
| age, in years | 1.028 | 0.000 |
| birth cohort—reference: 1979 and after | ||
| 1969–78 | 0.565 | 0.000 |
| 1959–68 | 0.459 | 0.000 |
| 1949–58 | 0.320 | 0.000 |
| 1939–48 | 0.205 | 0.000 |
| 1929–38 | 0.087 | 0.000 |
| 1928 and before | 0.067 | 0.000 |
| men vs. women | 1.176 | 0.000 |
| migration background—reference: Swiss by birth | ||
| secondos—non swiss by birth, born in CH | 0.970 | 0.737 |
| primos—non swiss by birth, born abroad | 1.080 | 0.168 |
| annual household income—reference: 1st tertile of annual HH income | ||
| 2nd tertile of annual household income—87,000–126,999 CHF | 0.849 | 0.000 |
| 3rd tertile of annual household income—127,000 CHF and above | 0.984 | 0.726 |
| urban area vs. rural area | 1.348 | 0.000 |
| level of education—reference: primary school | ||
| vocational training | 1.118 | 0.040 |
| higher education | 1.591 | 0.000 |
| intercept | 0.077 | 0.000 |
| n observations—with non missing cases on all variables | 100,149 | |
| n individuals—with non missing cases on all variables | 21,124 |
| Odds Ratio | p > z | |
|---|---|---|
| age, in years | 1.217 | 0.000 |
| birth cohort x age—reference: 1979 and after | ||
| 1969–78 | 0.965 | 0.033 |
| 1959–68 | 0.922 | 0.000 |
| 1949–58 | 0.899 | 0.000 |
| 1939–48 | 0.882 | 0.000 |
| 1929–38 | 0.871 | 0.000 |
| 1928 and before | 0.897 | 0.096 |
| men x age—reference: women | 0.982 | 0.053 |
| migration background x age—reference: Swiss by birth | ||
| secondos—non swiss by birth, born in CH x age | 0.921 | 0.000 |
| primos—non swiss by birth, born abroad x age | 0.944 | 0.000 |
| annual household income x age—reference: 1st tertile of HH income | ||
| 2nd tertile of annual household income—87,000–126,999 CHF x age | 1.025 | 0.036 |
| 3rd tertile of annual household income—127,000 CHF and above x age | 1.023 | 0.064 |
| urban area x age—reference: rural area | 0.996 | 0.656 |
| level of education x age—reference: primary school | ||
| vocational training x age | 1.013 | 0.458 |
| higher education x age | 0.981 | 0.264 |
| n observations—with non-missing cases on all variables | 100,149 | |
| n individuals—with non-missing cases on all variables | 21,124 | |
| of which n observation—with variance on the dependent variable | 14,545 | |
| of which n individuals—with variance on the dependent variable | 2002 |
| Religious Attendance (Monthly) | Personal Prayer (Monthly) | |||
|---|---|---|---|---|
| Odds Ratio | p > z | Odds Ratio | p > z | |
| age, in years | 0.978 | 0.000 | 0.987 | 0.000 |
| birth cohort—reference: 1979 and after | ||||
| 1969–78 | 1.043 | 0.588 | 1.963 | 0.000 |
| 1959–68 | 1.950 | 0.000 | 2.995 | 0.000 |
| 1949–58 | 3.003 | 0.000 | 4.172 | 0.000 |
| 1939–48 | 5.125 | 0.000 | 6.351 | 0.000 |
| 1929–38 | 11.362 | 0.000 | 11.068 | 0.000 |
| 1928 and before | 14.903 | 0.000 | 14.065 | 0.000 |
| men vs. women | 0.837 | 0.000 | 0.472 | 0.000 |
| Protestant vs. Roman Catholic | 0.402 | 0.000 | 0.536 | 0.000 |
| migration background—reference: Swiss by birth | ||||
| secondos—non swiss by birth, born in CH | 0.788 | 0.060 | 0.893 | 0.256 |
| primos—non swiss by birth, born abroad | 1.102 | 0.182 | 0.991 | 0.894 |
| annual household income—reference: 1st tertile of annual HH income | ||||
| 2nd tertile of annual household income—87,000–126,999 CHF | 0.967 | 0.491 | 0.933 | 0.094 |
| 3rd tertile of annual household income—127,000 CHF and above | 0.870 | 0.009 | 0.873 | 0.002 |
| urban area vs. rural area | 0.667 | 0.000 | 0.797 | 0.000 |
| level of education—reference: primary school | ||||
| vocational training | 0.719 | 0.000 | 0.952 | 0.289 |
| higher education | 0.825 | 0.001 | 0.998 | 0.968 |
| intercept | 0.873 | 0.052 | 1.654 | 0.000 |
| n observations—with non missing cases on all variables | 58,931 | 58,263 | ||
| n individuals—with non missing cases on all variables | 13,031 | 12,988 | ||
| Religious Attendance (Monthly) | Personal Prayer (Monthly) | |||
|---|---|---|---|---|
| Odds Ratio | p > z | Odds Ratio | p > z | |
| age, in years | 0.675 | 0.000 | 0.898 | 0.000 |
| birth cohort x age—reference: 1979 and after | ||||
| 1969–78 | 1.441 | 0.000 | 1.114 | 0.000 |
| 1959–68 | 1.364 | 0.000 | 1.091 | 0.000 |
| 1949–58 | 1.339 | 0.000 | 1.121 | 0.000 |
| 1939–48 | 1.414 | 0.000 | 1.106 | 0.000 |
| 1929–38 | 1.418 | 0.000 | 1.128 | 0.000 |
| 1928 and before | 1.319 | 0.000 | 1.179 | 0.000 |
| men x age—reference: women | 1.024 | 0.009 | 0.996 | 0.600 |
| Protestant x age—reference: Catholic Roman | 1.049 | 0.000 | 0.986 | 0.055 |
| migration background x age—reference: Swiss by birth | ||||
| secondos—non swiss by birth, born in CH x age | 1.000 | 0.994 | 1.017 | 0.456 |
| primos—non swiss by birth, born abroad x age | 0.991 | 0.595 | 0.979 | 0.135 |
| annual household income x age—reference: 1st tertile of HH income | ||||
| 2nd tertile of annual household income—87,000–126,999 CHF x age | 0.984 | 0.135 | 1.003 | 0.769 |
| 3rd tertile of annual household income—127,000 CHF and above x age | 0.953 | 0.000 | 0.982 | 0.071 |
| urban area x age—reference: rural area | 0.991 | 0.307 | 1.009 | 0.240 |
| level of education x age—reference: primary school | ||||
| vocational training x age | 1.022 | 0.104 | 0.987 | 0.280 |
| higher education x age | 1.035 | 0.027 | 0.980 | 0.141 |
| n observations—with non missing cases on all variables | 58,931 | 58,263 | ||
| n individuals—with non missing cases on all variables | 13,031 | 12,988 | ||
| of which n observation—with variance on the dependent variable | 17,570 | 22,517 | ||
| of which n individuals—with variance on the dependent variable | 2355 | 3211 | ||
Disclaimer/Publisher’s Note: The statements, opinions and data contained in all publications are solely those of the individual author(s) and contributor(s) and not of MDPI and/or the editor(s). MDPI and/or the editor(s) disclaim responsibility for any injury to people or property resulting from any ideas, methods, instructions or products referred to in the content. |
© 2023 by the authors. Licensee MDPI, Basel, Switzerland. This article is an open access article distributed under the terms and conditions of the Creative Commons Attribution (CC BY) license (https://creativecommons.org/licenses/by/4.0/).
Share and Cite
Monnot, C.; Wernli, B. Moving Away from Religion: Age, Cohort, or Period Effect? Evidence from a Longitudinal Survey in Switzerland. Religions 2023, 14, 493. https://doi.org/10.3390/rel14040493
Monnot C, Wernli B. Moving Away from Religion: Age, Cohort, or Period Effect? Evidence from a Longitudinal Survey in Switzerland. Religions. 2023; 14(4):493. https://doi.org/10.3390/rel14040493
Chicago/Turabian StyleMonnot, Christophe, and Boris Wernli. 2023. "Moving Away from Religion: Age, Cohort, or Period Effect? Evidence from a Longitudinal Survey in Switzerland" Religions 14, no. 4: 493. https://doi.org/10.3390/rel14040493
APA StyleMonnot, C., & Wernli, B. (2023). Moving Away from Religion: Age, Cohort, or Period Effect? Evidence from a Longitudinal Survey in Switzerland. Religions, 14(4), 493. https://doi.org/10.3390/rel14040493


