Article

Homophily and Social Capital in a Network of Religious Congregations

by
Jennifer M. McClure
1,2
1
Department of Biblical and Religious Studies, Samford University, Birmingham, AL 35229, USA
2
Department of Geography and Sociology, Samford University, Birmingham, AL 35229, USA
Religions 2021, 12(8), 653; https://doi.org/10.3390/rel12080653
Submission received: 1 July 2021 / Revised: 10 August 2021 / Accepted: 12 August 2021 / Published: 17 August 2021
(This article belongs to the Section Religions and Health/Psychology/Social Sciences)

Abstract

:
This article investigates the relationship between homophily, the tendency for relationships to be more common among similar actors, and social capital in a social network of religious congregations from eight counties encompassing and surrounding a major metropolitan area in the southeastern United States. This network is inter-congregational, consisting of congregations and the relationships between them. Two types of social capital are investigated: the first involves the extent to which congregations bridge across structural holes, or bridge together otherwise disconnected congregations within the network; secondly, network closure involves the extent to which congregations are embedded in tight-knit clusters. Analyses use two types of homophily (religious and racial) to predict both outcomes, and they test linear and curvilinear relationships between both forms of homophily and the outcomes. Results indicate that congregations with moderate levels of religious homophily are more likely to bridge between otherwise disconnected congregations; however, congregations with low or high religious homophily as well as congregations with high racial homophily are more likely to be embedded in tight-knit relational clusters. This article contributes additional social network research on congregations and evidence of curvilinear relationships between homophily and social capital to the fields of social network analysis and sociology of religion.

1. Introduction

U.S. congregations, “the relatively small-scale, local collectivities and organizations in and through which people engage in religious activity” (Chaves et al. 1999, p. 458), are navigating significant changes in the American religious landscape, with a rise in irreligion, declining attendance at worship services, the concentration of attenders into larger congregations, and increasing polarization (Chaves 2017). In the midst of change, relationships are essential for providing support, sharing information and resources, and considering ways to adapt (Gargiulo and Benassi 2000). The benefits provided by these relationships are at the heart of social capital (Portes 1998, p. 6). Despite the importance of social capital, we know very little about the social capital experienced by religious congregations. Past research has underscored the importance of inter-congregational relational ties involving, for example, ministers from different congregations gathering to learn together and to support each other as well as congregations collaborating for joint worship events and for community service opportunities (Ammerman 2005; Chaves and Anderson 2008, p. 434; Marler et al. 2013; Fulton 2016; McClure 2020). Due to data limitations, it has not been possible to explore U.S. congregations’ relationships within a wider network until recently (McClure 2020, 2021), which can elucidate the extent to which congregations bridge together otherwise disconnected congregations or are embedded in a tight-knit cluster of congregations. Both of these network dynamics have important benefits for navigating change. Bridging provides a diverse range of information and opportunities, while a tight-knit network provides support (Gargiulo and Benassi 2000, p. 193).
This article investigates patterns of social capital in a social network of religious congregations from eight counties encompassing and surrounding a major metropolitan area in the southeastern United States; this network is inter-congregational, consisting of congregations and the relationships between them (McClure 2020, p. 3; 2021, p. 3). More specifically, this article considers the extent to which homophily—“the tendency for similar actors to be socially connected at a higher rate than dissimilar actors” (Smith et al. 2014, p. 433)—predicts both bridging together otherwise disconnected congregations and embeddedness in a tight-knit cluster of congregations. Both religious and racial homophily are prominent within this network of congregations (McClure 2021, p. 9), and these two forms of homophily are used as predictors. The relationship between homophily and social capital is important for the network literature because some scholars expect a linear relationship where homophily is negatively correlated with spanning structural holes and positively correlated with network closure (Burt 1992, pp. 46–47; 2001, pp. 47–49; 2004, p. 354; Zaheer and Soda 2009, p. 26). However, some evidence suggests that moderate, rather than high or low, homophily is ideal for bridging across a network (Centola 2015, pp. 1327–28). In examining the relationship between homophily and social capital, this article tests both linear and curvilinear relationships.
In particular, this article contributes to the social scientific study of religious congregations. Numerous studies have examined relational dynamics within congregations using proxies but not full network data due to data limitations; the number of social network studies on congregational life is limited (Everton 2018, pp. xvi–xvii). A few recent articles have explored network dynamics within congregations. In congregational life, homophily can but does not always impact friendships and support (Lee et al. 2019; Todd et al. 2020). Intra-congregational network dynamics also matter for understanding whether members remain at or leave Amish congregations (Stein et al. 2020; Corcoran et al. 2021). In addition to McClure’s previous articles (McClure 2020, 2021) and Mark Chapman’s inter-congregational study of Canadian evangelical congregations (Chapman 2004), this study contributes inter-congregational research to the small but growing social network literature on congregations.

1.1. Homophily in Religious Interorganizational Networks

A large literature documents the occurrence of homophily across many types of networks (see McPherson et al. 2001 for a review). Perhaps not surprisingly, the extent of homophily in religious inter-organizational networks has been investigated as well. Religious environmental movement organizations are more likely to share information when they have the same theological frameworks and focus on the same environmental issues, and they are more likely to engage in joint projects when they have the same religious affiliation and the same theological frameworks (Ellingson et al. 2012, pp. 278–79). In a network of Canadian evangelical congregations, there are no strong patterns of homophily; connections among congregations are driven more by practical goals of congregations (e.g., charitable community engagement) than by a desire to connect with congregations of the same denomination (Chapman 2004, pp. 168–70). These earlier studies provide mixed evidence about the prevalence of homophily in religious inter-organizational networks.
Recent research has explored patterns of homophily in the network analyzed in this article. This study conceptualized homophily as the proportion of a congregation’s alters—or the congregations to whom a congregation has direct relational ties (Wasserman and Faust 1994, p. 42; Prell 2012, p. 118)—that share the same characteristic as the congregation or that have a smaller difference from the congregation (McClure 2021, p. 10). This network is beneficial to use for investigating the relationship between homophily and social capital because there are significant patterns of homophily within it. Homophily occurred across over a dozen characteristics, and three key patterns of homophily involved sharing both the same religious family (Melton 2009) and the same religious tradition (Steensland et al. 2000), sharing the same racial composition, and having a closer geographical distance (in miles) (McClure 2021, p. 9).1 Results indicate the following. Latter-day Saint and Church of Christ congregations have high homophily within their respective religious group and are a further distance from their alters because “they are more likely to have connections with congregations within their religious group that are further away than more geographically proximate congregations” from other religious groups (McClure 2021, p. 17). Multiracial congregations have less racial homophily among their alters and are more likely to “bridg[e] between congregations [of] different racial compositions” (McClure 2021, p. 18). Rural congregations have more racial homophily among their alters and are a further distance from their alters because of the sparsity of rural areas (McClure 2021, p. 18). Lastly, congregations with greater percentages of younger and newer regularly attending adults have less homophily among their alters in terms of religious family and tradition, likely due to declining denominationalism (McClure 2021, p. 18).

1.2. Social Capital in Interorganizational Networks

This article seeks to understand congregations’ social capital using insights from the field of inter-organizational networks (IONs), which involve relational “ties between organizations” (Zaheer et al. 2010, p. 62, emphasis mine). Although the field of IONs typically focuses on organizations in business and non-profit settings (Gulati and Gargiulo 1999; Baker and Faulkner 2002; Provan et al. 2007; Zaheer and Soda 2009; Zaheer et al. 2010; Atouba and Shumate 2015), this article applies its insights to religious congregations.
Ronald S. Burt (1992, 2001, 2004) and James Coleman (1988) have provided helpful frameworks for understanding two contrasting types of social capital in IONs (Provan et al. 2007, pp. 484–85; Zaheer et al. 2010, p. 67; see also Portes 1998, p. 12). The first type of social capital involves bridging across structural holes, or between otherwise disconnected actors within the network (Burt 2001, pp. 34–35). Actors with this type of social capital tend to have quicker access to a wider range of information, and they have a greater ability to control who within the network has access to information as well as the extent to which otherwise disconnected actors within the network can interact with each other (Burt 1992). However, spanning structural holes can be disadvantageous if actors in structural holes exploit their position to reinforce separation to maintain control of the network (Bizzi 2013, p. 1573). On the other hand, the second type of social capital (often referred to as “network closure”) involves engaging in a strongly interconnected group (Coleman 1988) in which “each relationship puts [an actor] in contact with the same [actors] reached through the other relationships” (Burt 1992, p. 17; see also Burt 2001, p. 37). This type of social capital tends to produce trust and a commitment to “an extensive set of expectations and obligations” that can be monitored and reinforced through tight-knit relationships (Burt 2001, p. 38; see also Coleman 1988, p. S107; Bizzi 2013, p. 1558). However, this type of social capital can limit access to new ideas and can contribute to isolation from the broader network (Gargiulo and Benassi 2000, p. 186; Burt 2001, pp. 47–49; 2004, p. 354). Both types of social capital can have beneficial and detrimental impacts.
Burt’s bridging structural holes and Coleman’s network closure are analogous to insights on social capital among individuals from Mark Granovetter (1973, 1983) and Robert Putnam (2000). Granovetter defines the strength of a tie through the following factors: “the amount of time, the emotional intensity, the intimacy (mutual confiding), and the reciprocal services which characterize the tie” (Granovetter 1973, p. 1361). Both strong and weak ties contribute to social capital; strong ties often develop into tightly knit groups, while weaker, bridging ties typically form the interconnections between these clusters (Granovetter 1973, pp. 1364–65; Granovetter 1983, pp. 202, 225). Putnam has similarly defined two types of social capital. Bonding social capital typically creates tight-knit relationships within groups, while bridging social capital provides connections between groups (Putnam 2000, pp. 22–23). Burt’s spanning structural holes corresponds to Granovetter’s weak ties and Putnam’s bridging social capital, while Coleman’s network closure is comparable with Granovetter’s strong ties and Putnam’s bonding social capital (Granovetter 1973, pp. 1362–64; Coleman 1988; Burt 1992, pp. 25–30; 2001, p. 34; Putnam 2000, pp. 22–23).

1.3. Hypotheses Concerning Homophily and Social Capital

Homophily may impact both structural holes and network closure. Inherent in Burt’s arguments and supported by additional research are the assertions that spanning structural holes involves exposure to wider diversity, while network closure is associated with homophily (Burt 1992, pp. 46–47; 2001, pp. 47–49; 2004, p. 354; Zaheer and Soda 2009, p. 26; see also Granovetter 1973, pp. 1362, 1369; 1983, pp. 204, 210; Putnam 2000, pp. 22–23). In other words, structural holes facilitate access to a wider diversity of actors and information, while network closure reinforces a common viewpoint and limits exposure to diversity (Burt 1992, pp. 23, 47; 2001, pp. 47–49; 2004, p. 354). For example, in an inter-organizational network of Italian television production teams, network homophily was negatively correlated with bridging structural holes (Zaheer and Soda 2009, p. 23). These insights are again analogous to those of Granovetter and of Putnam concerning individuals. Granovetter argues that strong relational ties are more likely among similar individuals but that weak ties are more likely to serve as bridges across diverse social groups (Granovetter 1973, pp. 1362–64, 1369; 1983, p. 210; see also Felmlee and Faris 2013, p. 447). Similarly, Putnam’s bonding social capital is “inward looking and tend[s] to reinforce exclusive identities and homogeneous groups,” while bridging social capital is “outward looking and encompass[es] people across diverse social cleavages” (Putnam 2000, p. 22). Within an inter-congregational network, these insights suggest that:
  • Congregations that have a greater proportion of alters with the same characteristic will bridge fewer structural holes.
  • Congregations that have a greater proportion of alters with the same characteristic will experience more network closure.
There is compelling evidence, however, from the literature on diffusion, a major process impacted by structural holes and network closure (Burt 1992, pp. 13–14; 2001, pp. 34–36), that the association of homophily with social capital might be curvilinear. According to Damon Centola, both a network made up of “weak ties” with low homophily and a tight knit, homophilous network are rather ineffective in diffusion (Centola 2015, p. 1327). He argues:
Without sufficient social structure to bind people together in cohesive groups, there is no support for the spread of shared cultural norms and practice…. [However,] high levels of homophily and consolidation [i.e., correlation of social traits] cause the social network to break apart into highly clustered groups without overlapping memberships, creating socially distinct islands across which people cannot influence one another’s cultural or normative practices.
In contrast, moderate levels of homophily contribute to social groups with common norms as well as significant diverse bridges between them; both are needed for effective diffusion (Centola 2015, p. 1328). Simulation-based research provides additional evidence for this inversely curvilinear association (Yavaş and Yücel 2014; Li et al. 2020, pp. 3, 6). Integrating these insights with Burt’s assertions that bridging structural holes facilitates diffusion while network closure impedes it (Burt 2001, pp. 34–36), this study tests two competing hypotheses:
3.
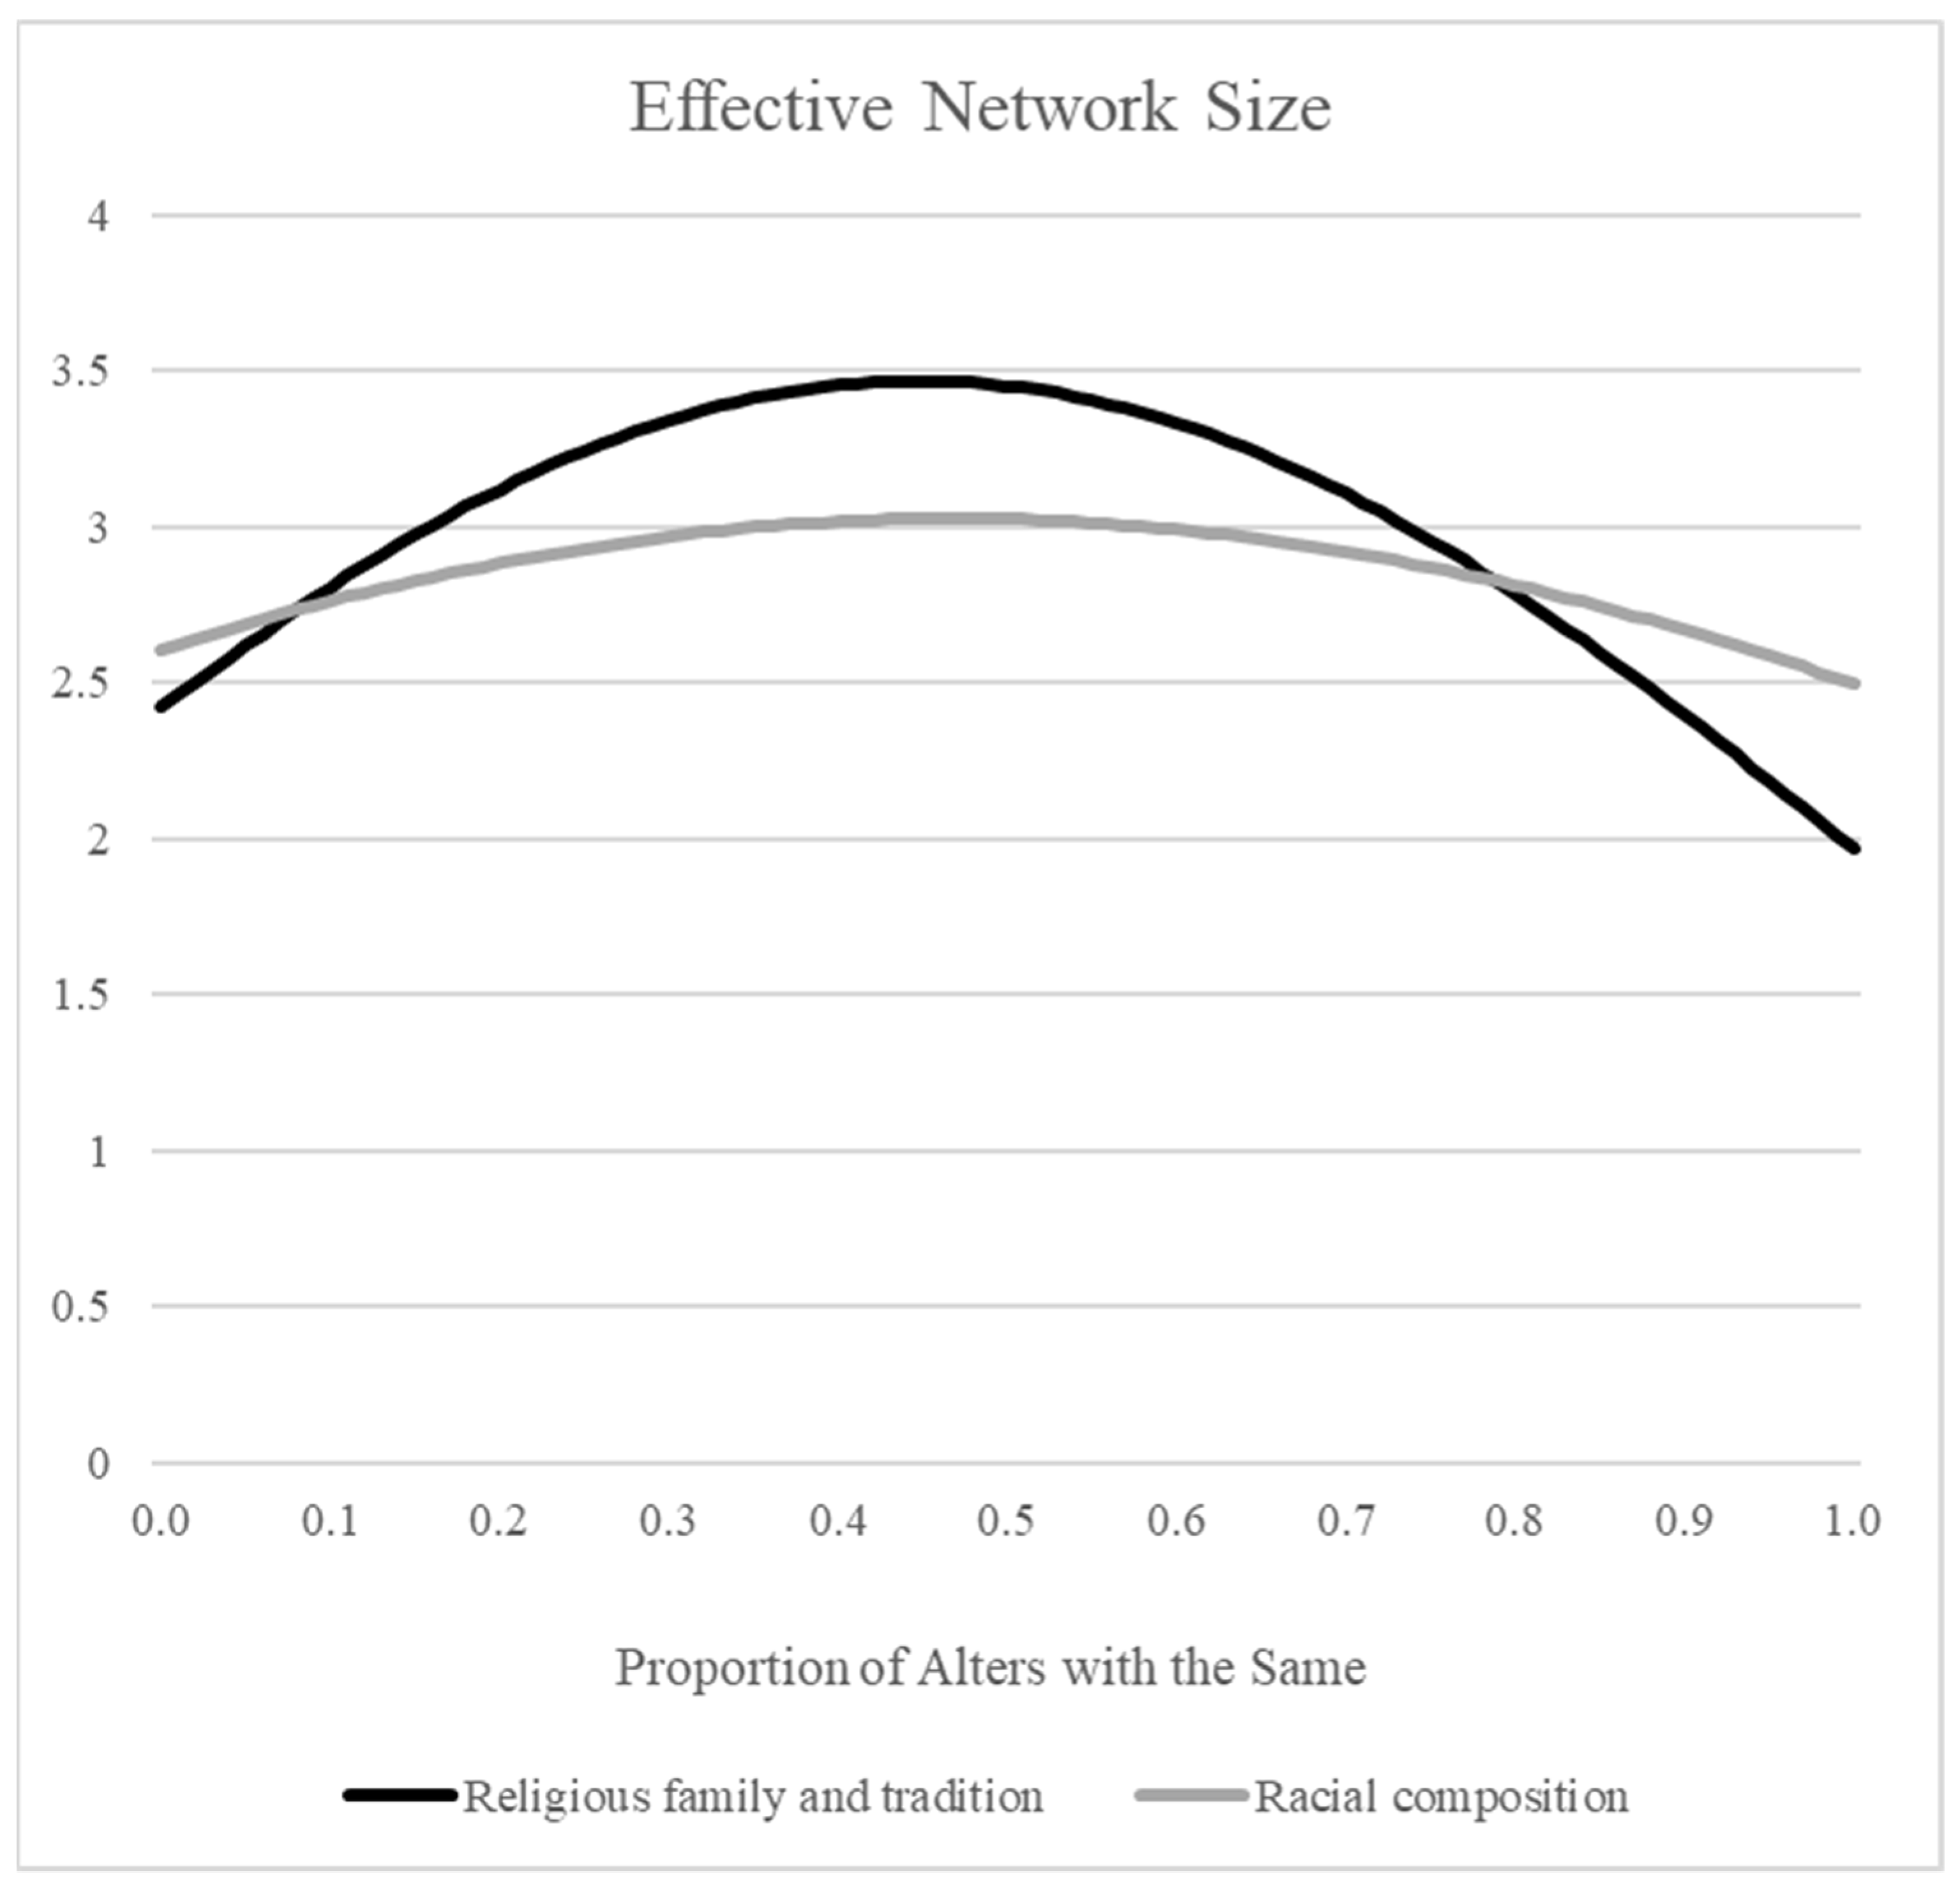
Congregations that have a high or low proportion of alters with the same characteristic will span fewer structural holes, while congregations that have a moderate proportion of alters with the same characteristic will span more structural holes.
4.
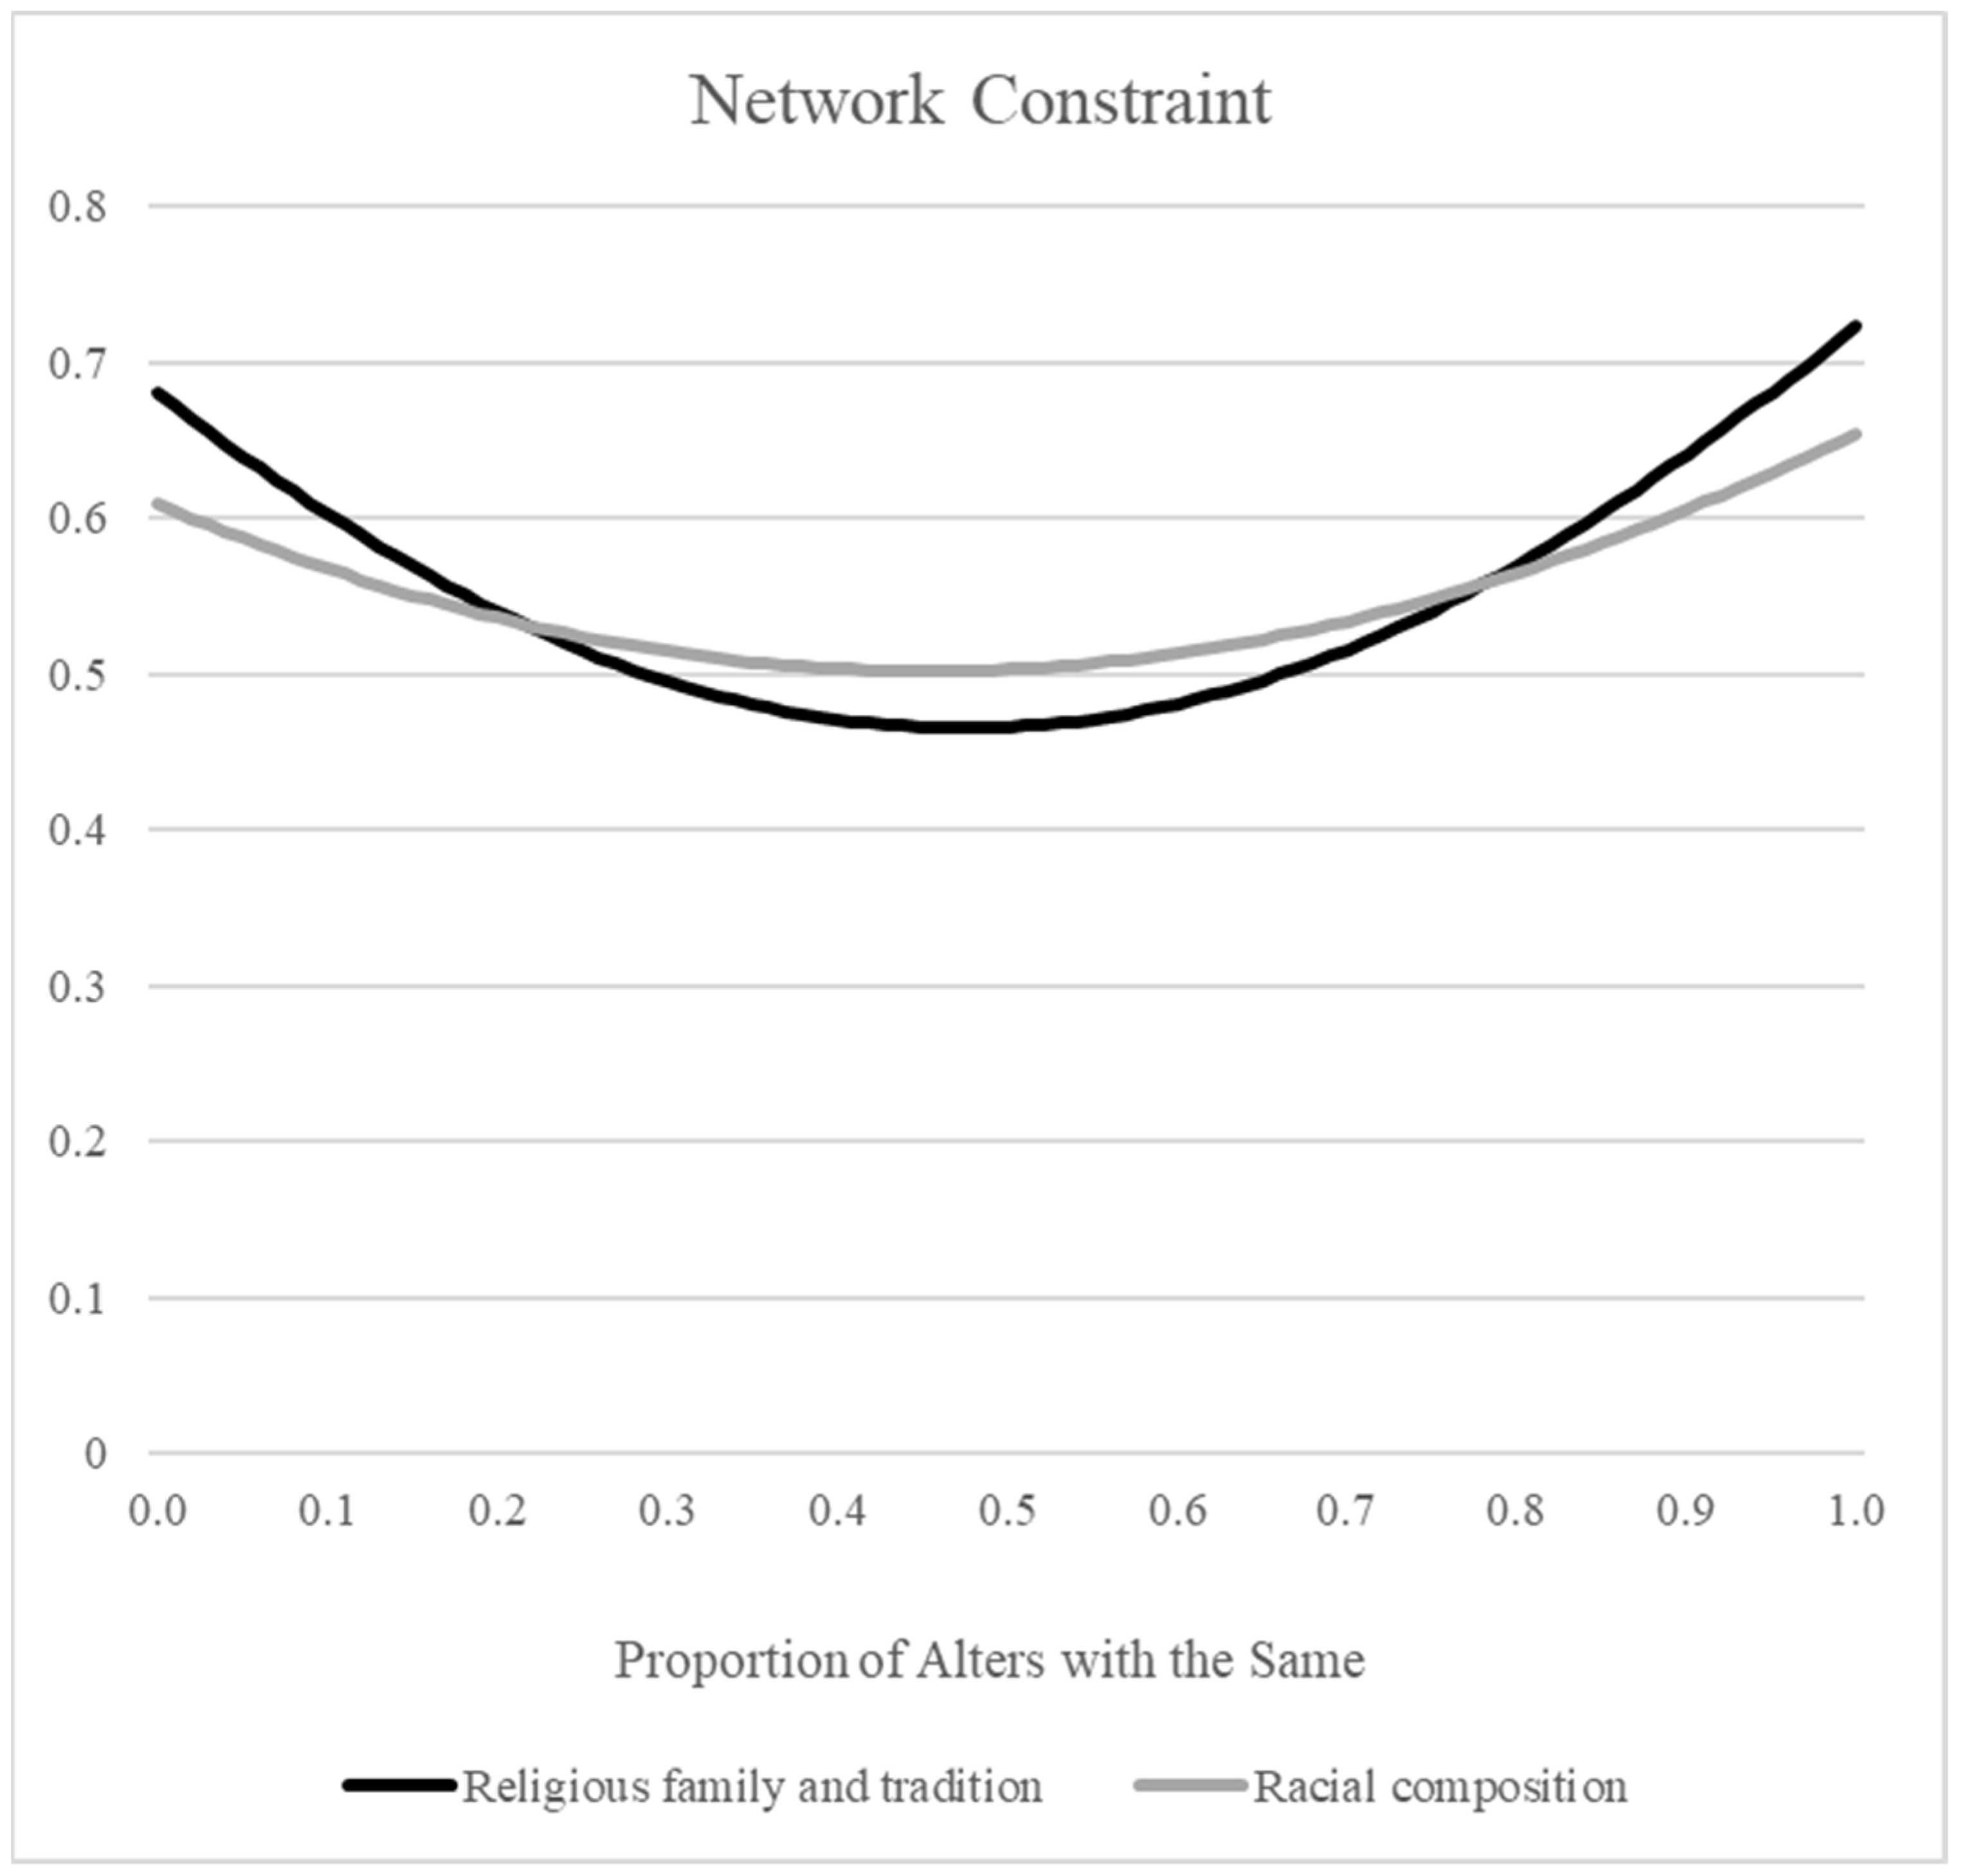
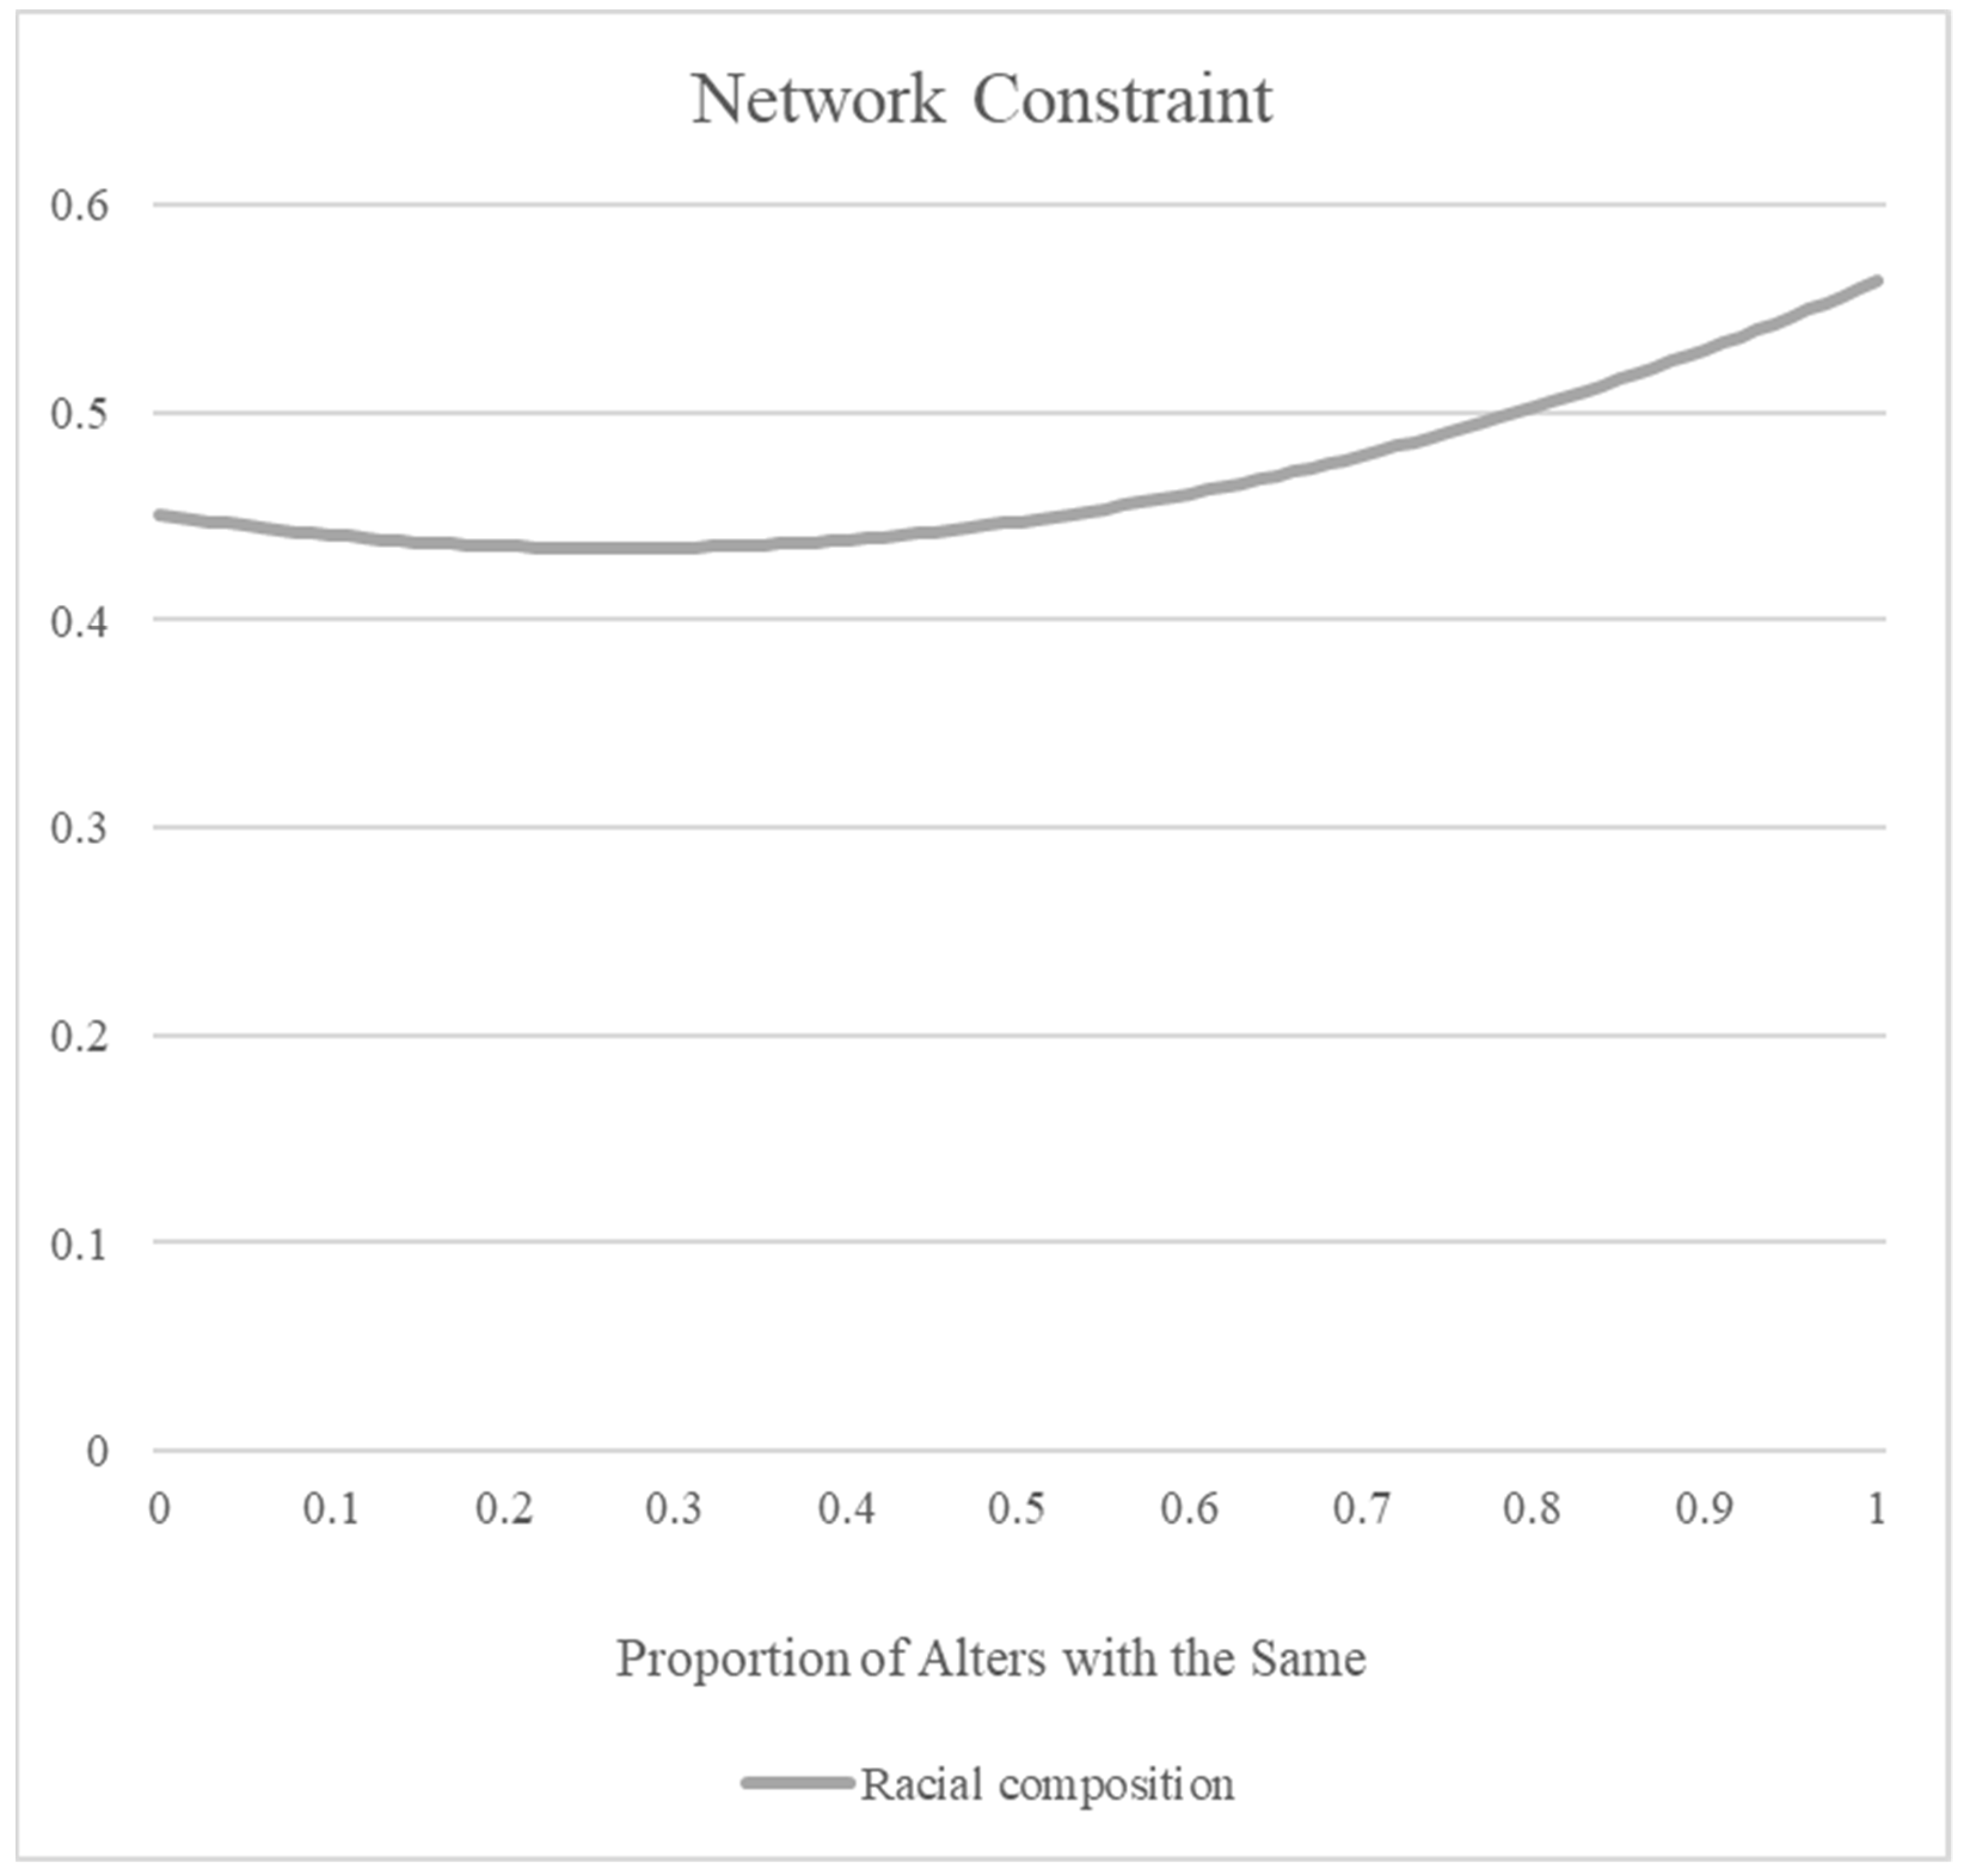
Congregations that have a high or low proportion of alters with the same characteristic will experience more network closure, while congregations that have a moderate proportion of alters with the same characteristic will experience less network closure.
Theoretical support for the importance of moderate homophily exists within the sociology of religion. Evangelicalism’s vitality involves not only boundaries preserving distinctive identities, beliefs, and practices but also broader engagement with American culture (Smith 1998, pp. 150–51). Similarly, religious groups thrive when they maintain central teachings, which are often reinforced through internal relationships while adapting organizationally to their context, often through innovations from external sources (Finke 2004, pp. 20–26). Moderate homophily may be important not only for religious groups’ vitality but also for congregations’ social capital.

2. Data and Methods

2.1. Data

The data collection focused on congregations in eight counties encompassing and surrounding a major metropolitan area in the southeastern United States and used a key informant strategy, typically obtaining information from a minister. The first wave of data collection in the fall of 2017 utilized mailed questionnaires, which were returned by 9.0% of the congregations that received one (171 of 1892) (McClure 2020, p. 6).2 “Congregations that returned questionnaires via mail tended to have a longer history, a smaller size, a greater percentage of regularly attending adults that were 60 or older, an older main minister, and a main minister with either a short or rather long tenure” (McClure 2020, p. 10). A second wave of data collection in 2018 used phone interviews, for which congregations that had not yet provided data became eligible when mentioned by a participating congregation as an alter. Snowballing strategies (Borgatti et al. 2018, p. 40) assist in “avoid[ing] the sparsity of connections” possible in network studies (Scott 2013, p. 50). In the second wave, 267 of 906 eligible congregations (29.5%) provided information through phone interviews; 294 of these eligible congregations were not on the original mailing list (McClure 2020, pp. 6–7). “Analyses suggest that the [mailing list] was less representative of … nondenominational congregations, recently founded congregations, congregations with younger ministers who have shorter tenures, congregations with fewer resources, and rural congregations” (McClure 2020, p. 11). Across both waves, 20.0% (438 of 2186) of the congregations in the eight-county study area participated in the data collection,3 and another 29.2% (639 of 2186) were alters that did not provide data (McClure 2020, p. 7). Comparisons with the 2012 National Congregations Study (NCS) (Chaves et al. 2014) and with the information for the eight-county study area from the 2010 U.S. Religion Census (USRC) (Grammich et al. 2012) are presented in Figure A1. McClure’s previous article provides additional information about the data collection (McClure 2020, pp. 5–13).

2.2. Measures

In measuring relational ties within the network, participating congregations were asked to mention up to ten congregations within the study area with whom they had connections (McClure 2020, p. 13). For each congregation, or alter, participating congregations also indicated the type of connection: “(1) joint events between congregations; (2) friendships with ministers from other congregations; (3) participation in ministerial groups with ministers from other congregations; (4) ministers exchanging pulpits with ministers from other congregations (i.e., speaking at another congregation and/or inviting a minister to speak at theirs)” (McClure 2020, p. 14).4 This study considers: “ties to be present among a pair of congregations if one or both mentioned [any type of] tie; ties to be absent if neither congregation mentioned [any type of] tie” (McClure 2020, p. 14).5 A diagram of the social network that only includes participants is presented in Figure 1; the clusters depicted in the figure maximize ties within and minimize ties between clusters (Clauset et al. 2004, p. 1).
This study uses two network measures to gauge social capital. Both measures are based on congregations’ ego-networks; an individual congregation’s ego network includes that specific congregation (called “ego”), the other congregations to which that “ego” congregation has direct relational ties (called “alters”), the relational ties between “ego” and its alters, and the relational ties between alters (Borgatti et al. 2018, p. 305). The first measure, effective network size, gauges congregations’ capacity to bridge otherwise disconnected structural holes (Burt 1992, pp. 51–53). Effective network size is based on degree centrality, which measures “the number of alters [per] ego” (Prell 2012, p. 97). Calculating effective size involves starting with “ego’s degree [centrality]” and then subtracting “the average degree of [its] alters within the ego network (which can be seen as a measure of their redundancy)” (Borgatti et al. 2018, p. 319; see also Burt 1992, pp. 51–53). The second involves network constraint, which is a measure of network closure; it concerns “the extent to which ego’s alters have ties to each other” (Borgatti et al. 2018, p. 320; see also Coleman 1988, pp. S105–S107; Burt 1992, pp. 54–56; 2001, pp. 35, 37) or, in other words, the extent to which a congregation is embedded in a tightly-knit group of congregations. Network constraint typically ranges between 0 and 1.6 As one might expect, these two outcomes are negatively correlated (r = −0.77; p < 0.001). These measures are based on the network that only includes participants (see Figure 1) due to missing data on relational connections in the larger network that includes both participants and non-participants. This decision results in lower effective network sizes and higher network constraint scores.7
This study has two key predictors—religious homophily and racial homophily. Religious homophily is defined as sharing the same religious tradition (Steensland et al. 2000) and family (Melton 2009). Religious traditions included (Steensland et al. 2000): Black Protestant,8 Evangelical Protestant, Mainline Protestant, Roman Catholic, and other traditions.9 The religious families (Melton 2009) of participating congregations included: Adventist, Anglican, Baptist, Congregationalist, Eastern Orthodox, European Free-Church, Holiness, Independent Fundamentalist, Jewish, Latter-day Saint, Liberal, Lutheran, Methodist/Pietist, Muslim, Pentecostal, Presbyterian, Restorationist, Roman Catholic, Spiritualist, and unclear (McClure 2021, p. 6).10 These two factors were integrated in order to “differentiate, for example, Methodists who are Black Protestant from Methodists who are Mainline Protestant and Baptists who are Evangelical Protestant from Baptists who are Black Protestant” (McClure 2021, p. 6).11 The independent variable for religious homophily measures the proportion of a congregation’s participating alters with the same religious tradition and family as ego. This variable was not measured through denominational affiliation due to difficulty matching national, state, and local Baptist affiliations because some Baptist congregations did not report state and/or local affiliations (McClure 2021, pp. 6–7). The second type of homophily involves racial composition (non-Hispanic white; African American; Hispanic/Latino; Asian/Pacific Islander; other; multiracial12).13 The independent variable for homophily by racial composition measures the proportion of a congregation’s participating alters with the same racial composition as ego. Both homophily measures are based on congregations’ participating alters, not all alters, because I do not have data on non-participants’ characteristics.14 Although both predictors involve elements of race, there is not a strong correlation between them (r = 0.053; p = 0.294).
Control variables were chosen based on bivariate associations with the outcomes as well as limiting multicollinearity;15 they include religious tradition, congregation size, whether the congregation is multisite, the extent to which regularly attending adults are younger and newer, the main minister’s age, the main minister’s theological education, and the congregation’s community type.16 Religious traditions include Black Protestant, Evangelical Protestant, Mainline Protestant, Roman Catholic, and other traditions. Congregation size is measured through average weekly attendance: (1) Under 50; (2) 50–99; (3) 100–199; (4) 200–349; (5) 350–499; (6) 500–999; (7) 1000–1999; (8) 2000 or more. Congregations were considered multisite if they “have worship services that take place every week at more than one location, but all locations are considered part of the same congregation” (Chaves et al. 2014); this variable is dichotomous (0 = No; 1 = Yes). The analyses also control for the extent to which regularly attending adults are younger and newer.
A scale, called “younger, newer attenders,” gauges the age of congregational attenders and the presence of new attenders and is calculated from the percentages of congregations’ regularly participating adults that are: 60 years old or older, less than 35 years old, and new in the past five years. The response categories for these questions are: (1) None or hardly any (0–10%); (2) Few (11–20%); (3) Some (21–40%); (4) Many (41–60%); (5) Most or nearly all (61–100%). To create the scale, the variable for the percentage of regularly attending adults that are 60 or older was reverse coded, all three variables were standardized, and the three standardized variables were averaged. This scale has a Chronbach’s alpha of 0.74.
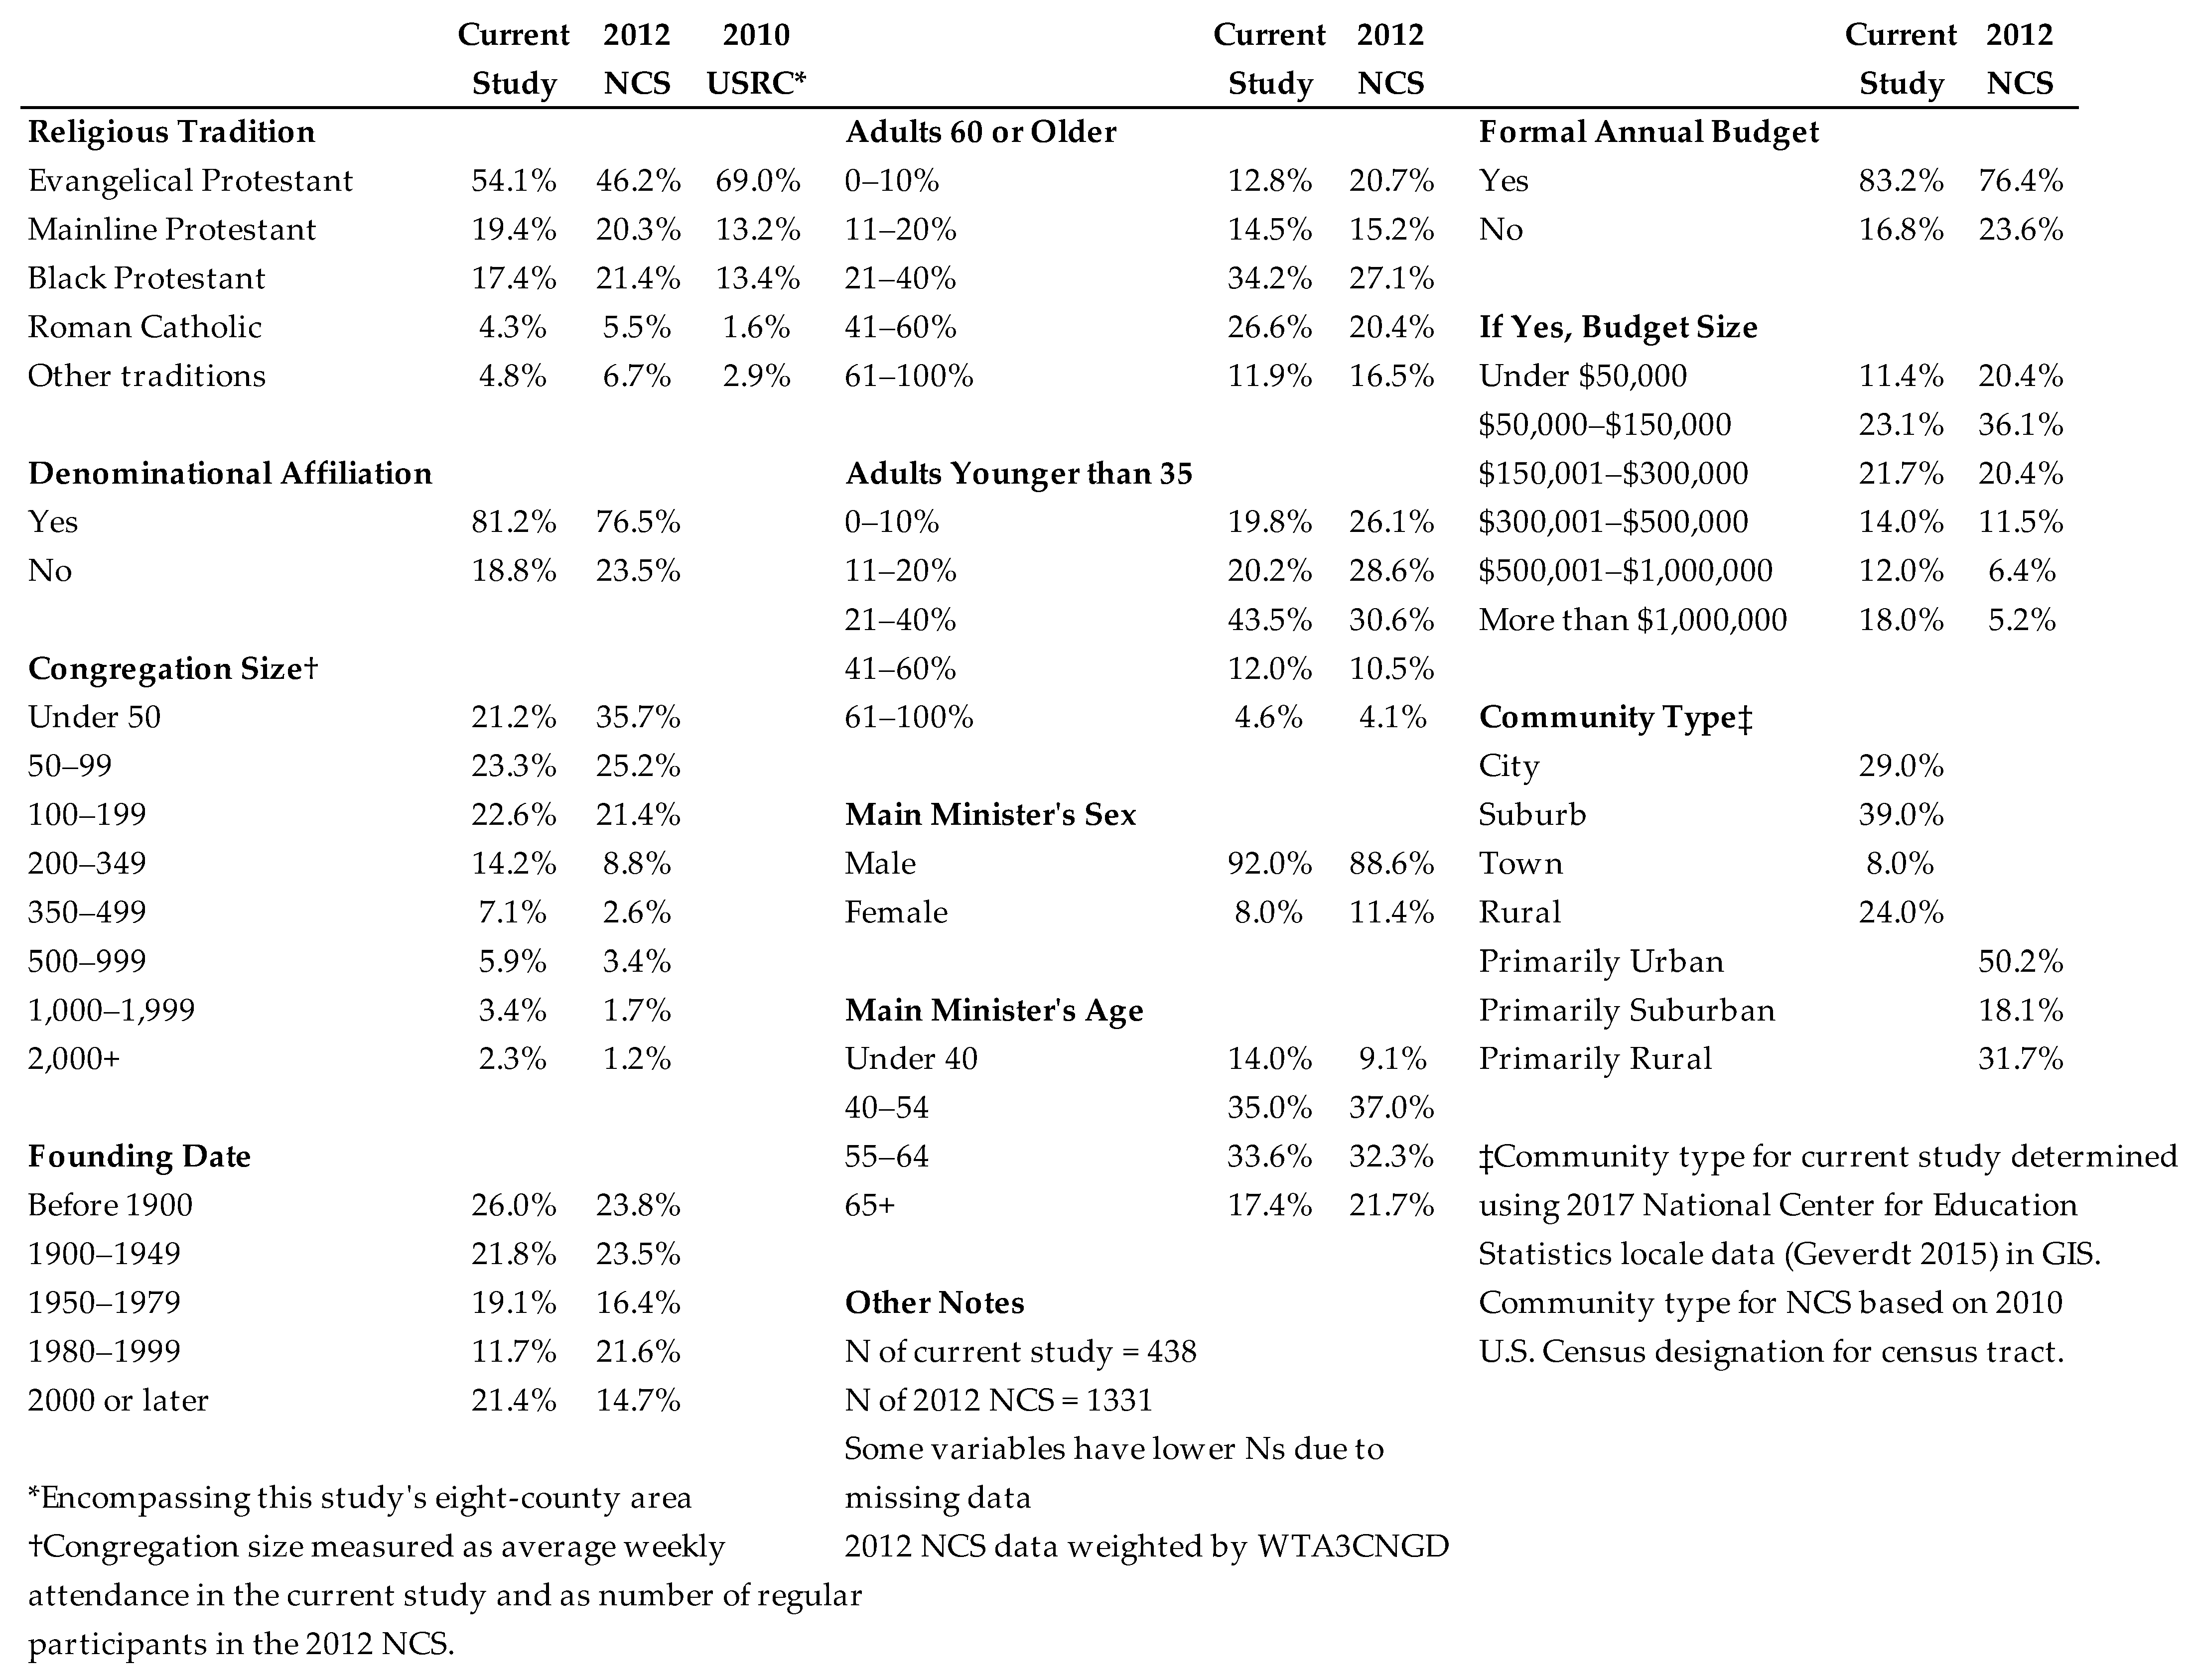
The main minister’s age is measured through the following categories: (1) Under 40; (2) 40–54; (3) 55–64; (4) 65 or older. The main minister’s theological education is measured with the following categories: (1) None; (2) Certificate from a denominational training program or religious institution; (3) Bachelor’s degree in divinity, religion, etc.; (4) Master’s degree in divinity, religion, etc.; (5) Doctoral degree in divinity, religion, etc. The analyses also control for community type (city, suburb, town, or rural).17

2.3. Analytical Strategy

The analyses utilize fractional logistic regression. While logistic regression typically requires a binary (zero or one) outcome (Long 1997, p. 35), fractional logistic regression allows the dependent variable to have values ranging between zero and one (Papke and Wooldridge 1996, p. 621). Fractional logistic regression is effective “regardless of the distribution of [the dependent variable]; [the dependent variable] could be a continuous variable, a discrete variable, or have both continuous and discrete characteristics” (Papke and Wooldridge 1996, p. 622). While values from network constraint already fall within this range, effective network size was transformed into a proportion by dividing all sizes by the maximum size of 11.769.18 Two models are predicted for each outcome; the first examines linear relationships between homophily and the outcome, while the second tests curvilinear associations between homophily and the outcome. An additional sensitivity analysis will supplement the second model.
There are two additional considerations. First, the regression analyses exclude congregations without any participating alters because their social capital and homophily levels cannot be gauged; 31 of 438 participating congregations (7%) are omitted from analyses for this reason.19 Second, not all of the alters mentioned by participating congregations participated in the data collection. On average, 62.1% of the reported alters provided data, with substantial variation among participants in the percentage of alters that participated (SD = 25.7%). The missing data impacts the quality of the estimates of social capital and homophily.20 Consequently, the regression analyses control for the proportion of alters that provided data. Missing data is addressed through case-wise deletion (N = 400).

3. Results

Table 1 presents the descriptive statistics for the outcomes, predictors, and control variables. Starting with the outcomes, the average congregation has an effective network size of 2.9 congregations; however, effective network sizes span from one congregation to 11.769 congregations. There is a wide range of network constraint scores; the average score is 0.58, with a range of 0.19 to 1.00. Moving to the homophily measures, the average congregation has the same religious family and tradition as 58.2% of its alters, and the average congregation has the same racial composition as 73.3% of its alters; however, there is significant variation in these measures. For religious family and tradition, 16% of congregations have no homophilous alters, 19% have some but less than half homophilous alters, 33% have at least half but not all homophilous alters, and 32% have all homophilous alters. For racial composition, 12% of congregations have no homophilous alters, 8% have some but less than half homophilous alters, 31% have at least half but not all homophilous alters, and 50% have all homophilous alters.
Table 2 presents the fractional logistic regressions predicting effective network size21 and network constraint. For each outcome, Model 1 tests whether there are linear relationships involving homophily, as Hypotheses 1 and 2 propose. Considering effective network size, congregations with a greater percentage of alters that share the same religious family and tradition have smaller effective networks (b = −0.359; p < 0.01); however, the relationship between the percentage of alters with the same racial composition and this outcome is not statistically significant (b = −0.068; n.s.). These results partially support Hypothesis 1; congregations with greater religious homophily span fewer structural holes, but homophily by racial composition does not matter for predicting this outcome. Hypothesis 2 concerns the relationship between homophily and network constraint. Congregations with greater religious homophily have higher network constraint (b = 0.416; p < 0.05), but homophily by racial composition (b = 0.257; n.s.) does not predict network constraint at p < 0.05. These results partially support Hypothesis 2; congregations with greater religious homophily experience more network closure, but homophily by racial composition does not predict this outcome.
For each outcome in Table 2, Model 2 tests whether there are curvilinear associations involving homophily. For effective network size, results indicate inverse curvilinear relationships involving both forms of homophily. Effective network size increases as the percentage of alters with the same religious family and tradition increases from 0% to 45%, and then effective network size begins to decrease once more than 45% of a congregation’s alters are homophilous on religious family and tradition. Similarly, effective network size increases as the percentage of alters with the same racial composition increases from 0% to 47%, and then effective network size begins to decrease once more than 47% of a congregation’s alters are homophilous on racial composition. These relationships support Hypothesis 3—that congregations with moderate homophily span more structural holes than congregations with low or high homophily—and are depicted in Figure 2.
The results in Table 2 indicate similar (yet not inverse) curvilinear associations involving network constraint. Network constraint decreases as the percentage of alters with the same religious family and tradition increases from 0% to 47%, and then constraint begins to increase once more than 47% of a congregation’s alters are homophilous on religious family and tradition. Similarly, network constraint decreases as the percentage of alters with the same racial composition increases from 0% to 45%, and then constraint begins to increase once more than 45% of a congregation’s alters are homophilous on racial composition. These relationships support Hypothesis 4—that congregations with moderate homophily experience less network closure than congregations with low or high homophily—and are depicted in Figure 3.
There is an important consideration, however, that requires additional analysis. There are 61 congregations in the analyses that only have one participating alter; their percentage of homophilous alters can either be 0% or 100%. By virtue of having one participating alter, these congregations have the smallest effective network sizes (mean = 1.0) and experience the highest network constraint (mean = 1.0). Could these congregations account for the curvilinear relationships? Sensitivity analyses, which are presented in Table 3, examine models that only include data from congregations with at least two participating alters (N = 339). For effective network size, there is still an inverse curvilinear association involving homophily by religious family and tradition, but the relationship between homophily by racial composition and effective network size is not significant. For network constraint, there are still curvilinear associations involving homophily by religious family and tradition and homophily by racial composition. However, in the sensitivity analyses, the relationship between homophily by racial composition and network constraint, which is depicted in Figure 4, does not reflect the pattern in Figure 3. Although the relationship is curvilinear, the predicted constraint scores indicate that network constraint is more commonly experienced by congregations with high levels of homophily by racial composition. Overall, the sensitivity analyses affirm that homophily by religious family and tradition has curvilinear relationships with effective network size and network constraint. These analyses also support a link between high levels of homophily by racial composition and high network constraint. However, the sensitivity analyses suggest that two findings—the curvilinear relationship that homophily by racial composition has with effective network size and the high levels of constraint among congregations with low levels of homophily by racial composition—might be driven by congregations with only one participating alter.
Integrating the main results with the sensitivity analyses suggests that Hypotheses 3 and 4 are partially supported—that religious homophily has an inverse curvilinear relationship with effective network size and a curvilinear relationship with network constraint. In other words, congregations with both low and high religious homophily have smaller effective networks and experience more network constraint, while congregations with moderate levels of this type of homophily have larger effective networks and experience less network constraint. The conclusions concerning racial homophily are more complex. I am not confident that there is an association between racial homophily and effective network size. However, high racial homophily does appear to go hand-in-hand with higher constraint. Racial homophily may not impact the effective size of congregations’ networks, perhaps due to the widespread racial homophily within the network, but it may constrain a congregation from accessing the wider network due to its embeddedness in a tight knit, racially homophilous cluster of congregations.

4. Discussion and Conclusions

This article investigates homophily and social capital in an inter-congregational network. Results indicate that religious homophily has curvilinear relationships with social capital. Compared to congregations with low or high religious homophily, congregations who have moderate religious homophily span more structural holes, or more otherwise disconnected congregations within the network, and experience less network closure, or less embeddedness in a tight-knit cluster. The results, which are less clear for homophily by racial composition, suggest that high levels of racial homophily are associated with experiencing more network closure. This section discusses the implications of the results for research on American religion, congregations, and social networks; the limitations of the study; and directions for future research.
Religious homophily has clear relationships with congregations’ social capital. Compared with congregations with low or high religious homophily, congregations with moderate religious homophily are more likely to bridge together otherwise disconnected congregations and are less likely to be constrained within a tight-knit cluster of congregations. That religious homophily predicts congregations’ social capital is not surprising for two reasons. First, denominational identities have played a significant role in shaping the American religious landscape (Glock and Stark 1965; Wuthnow 1988; Steensland et al. 2000; Melton 2009), despite recent declines in denominational importance and the growth of nondenominational congregations (Warner 1994, p. 74; Chaves and Anderson 2014, pp. 684–85). Second, religious family and tradition are significant sources of homophily among congregations (McClure 2021, p. 9). However, what is surprising, especially for the literature on structural holes (Burt 1992, pp. 23, 47; 2001, pp. 47–49; 2004, p. 354; Zaheer and Soda 2009, p. 23), is the curvilinear relationship between religious homophily and social capital. Congregations appear to span structural holes most effectively and to experience the least network closure when they have a relatively even balance of homophilous relationships within their religious group and of relationships that expose them to diverse religious groups. Such a combination—both engaging in a group-specific network cluster as well as forming bridges across religious groups (e.g., Centola 2015)—may be key for spanning structural holes and limiting closure in an inter-congregational network. This finding aligns with previous sociological insights about how relationships within a religious group reinforce its distinctive identity and beliefs (Smith 1998, p. 91; Finke 2004, p. 21), while relationships external to a religious group provide opportunities not only for wider cultural engagement (Smith 1998, p. 151) but also for learning about innovation (Finke 2004, pp. 25–26).
Concerning racial homophily, the evidence suggests that congregations with high racial homophily among their alters may experience more network closure. The racial homophily among participating congregations likely reflects significant non-Hispanic white/African American racial segregation among U.S. congregations and in the study’s southeastern context (e.g., Emerson and Smith 2000; Lichter et al. 2007; Lee et al. 2008). A tendency for congregations with higher levels of racial homophily to experience more network closure corresponds with Burt’s insights about exposure to a single perspective in highly constrained networks (Burt 2001, p. 48). Social capital in a racially homophilous network is likely more tight-knit, with higher levels of trust, belonging, and support (Coleman 1988, p. S107; Burt 2001, pp. 37–38; see Emerson and Smith 2000, pp. 141–50, Scheitle and Dougherty 2010, and Martinez and Dougherty 2013 for discussions of comparable benefits for members of the dominant race within racially homogeneous congregations). Maintaining these benefits at the expense of relationships with congregations of different racial compositions, however, likely reinforces the racial divisions within the study’s southeastern context.
Interpretations of these findings, however, must take into account that the relational ties measured in this study more strongly reflect relationships between ministers of different congregations (friendships, ministerial groups, and pulpit exchanges) than relationships between attenders of different congregations (joint events). Surveying attendees at each participating congregation in addition to a key informant was outside of the scope of the data collection; doing so would have been necessary to gauge friendships among attenders of different congregations (McClure 2021, pp. 18–19). “This measurement decision might underestimate the number of relational ties of some participating congregations and might also attenuate the strength of the reported connections between congregations” (McClure 2021, p. 19). Nevertheless, one must keep in mind that even friendships solely involving ministers from different congregations (i.e., friendships and ministerial groups) “can impact congregations through fostering ministers’ wellbeing and facilitating an exchange of support and information” (McClure 2021, p. 19; see Ammerman 2005, pp. 109–14; Carroll 2006, p. 212; Woolever and Bruce 2012, p. 57; Marler et al. 2013, p. 7). Congregational ministers’ choices about the extent to which they engage with ministers of homophilous and diverse congregations may impact their, and by extension their congregation’s, likelihood of learning about ideas and resources that are spreading through the network (McClure 2021, p. 19).
Several limitations impact this study. The most critical issue concerns the alters that did not participate in the data collection. The analyses could not fully measure the social capital or homophily levels of 81% of the participating congregations because of alters that did not participate (McClure 2021, p. 19). Recent research indicates that missing network data may influence estimates of social capital (i.e., network centrality) more strongly than homophily (Smith et al. 2017, pp. 91, 93). Since I am able to more accurately estimate the homophily and social capital of congregations with a greater proportion of participating alters, the regression analyses control for the proportion of alters that participated in the study. Second, this study’s congregations are not representative of U.S. congregations because of the greater percentages of Evangelical Protestant and Baptist congregations in its southeastern context. The data collection procedures resulted in additional limitations: requiring participating congregations to report at most ten alters to lessen respondent burden; probable missing data on congregational networks due to participants’ time restrictions; only allowing participants to report alters within the study area (McClure 2020, pp. 27–28).
Future research will investigate the ramifications of structural holes and network closure in congregational life. Past research has indicated that spanning structural holes has positive implications while network closure has negative implications for individuals and organizations regarding work performance, compensation, promotion, diffusion of ideas, evaluations by managers, market performance, and profit (Burt 1992, 2001, 2004) as well as “ability to adapt … to a significant change” (Gargiulo and Benassi 2000, p. 183). In applying these insights to an inter-congregational network, future research will contribute to the growing literature on congregational vitality (Woolever and Bruce 2004; Bobbitt 2014; Sterland et al. 2018; Theissen et al. 2019) by investigating the extent to which structural holes and network closure predict congregational vitality and sustainability.
In conclusion, this article uses social network analysis to illustrate how the extent to which congregations have relational ties with other homophilous congregations relates to the social capital that they experience. Congregations with moderate levels of religious homophily are more likely to bridge between otherwise disconnected congregations; however, congregations with low or high religious homophily as well as congregations with high racial homophily are more likely to be embedded in tight-knit relational clusters.

Funding

This project is possible thanks to a Faculty Development Grant from Samford University and a Lilly Endowment grant awarded to Samford University’s Center for Congregational Resources (#2014 0494-000).

Institutional Review Board Statement

The data collection was approved by Samford University’s Institutional Review Board (EXPD-A-17-S-2).

Informed Consent Statement

Informed consent was obtained from all subjects involved in the study.

Data Availability Statement

Replication materials will not be immediately available following the publication of this manuscript because of the development of additional manuscripts from the data collection used. Full replication may not be possible due to concerns about protecting the confidentiality of participants. Upon completion of publishing from this project, a redacted dataset will be archived at the Association of Religion Data Archives.

Acknowledgments

The author would like to thank Diane Felmlee, Nathaniel Porter, Jennifer Rahn, Jonathan Fleming, and anonymous reviewers for their help and advice.

Conflicts of Interest

The author declares no conflict of interest.

Appendix A

Figure A1. Comparing Current Study to the 2012 National Congregations Study and the 2010 U.S. Religion Census. Source: (McClure 2020, p. 12).
Religions 12 00653 g0a1

Notes

1
Average distance in miles from alters is not used as a predictor in the present article because: (1) it has a strong, positive correlation with homophily by religious family and tradition (r = 0.38; p < 0.001); (2) homophily by religious family and tradition is stronger within the network than homophily by geographic distance (McClure 2021, p. 9).
2
The mailing list was “based on a database … purchased from InfoGroup” (McClure 2020, p. 5).
3
This study’s response rate is not an outlier vis-à-vis some other congregation-level data collections. This study’s response rate is comparable to response rates for the two waves of the U.S. Congregational Life Survey; the first (2001) wave had a response rate of 35.7%, and the second (2008–2009) wave had a response rate of 14.7% (Woolever and Bruce 2010, p. 122). However, this study’s response rate is much lower than the response rates for the four waves of the National Congregations Study, which range from 69–80% (Chaves et al. 1999, p. 462; 2020, p. 649; Chaves and Anderson 2008, p. 419; 2014, pp. 678–79).
4
Although many of the ties involved other ministers or ministerial groups, the participants were instructed to provide the names of congregations, not ministers or ministerial groups.
5
This study treats relational ties as undirected instead of directed, despite collecting directed data (Prell 2012, p. 75), for one key reason. Participants were limited to “reporting at most ten alters in order to minimize respondent burden” (McClure 2021, p. 19), and some participants would have mentioned a greater number of alters if given the opportunity. Treating the data as undirected accounts for the chance that some unreciprocated ties might have actually been reciprocated if participants had been allowed to mention more than ten alters.
6
In rare cases, constraint can exceed 1.0 (Borgatti et al. 2018, p. 320). In the analyses, there are 35 congregations whose constraint scores are greater than 1.0. They are recoded as 1.0 due to the requirements of the fractional logistic regression model.
7
Calculating these measures from a network including both participants (N = 438) and non-participants (N = 639) would, in most cases, result in higher effective sizes (average difference = 2.4) and lower network constraint scores (average difference = −0.20). When there are data missing not at random for nodes with many relational ties (e.g., a non-participating congregation mentioned frequently as an alter by participants), omitting these highly central non-participants when calculating the outcomes may bias the estimates (Smith et al. 2017, p. 93). However, I prefer this approach to the following situation. Consider a triad where Congregation A participated and mentioned relational ties with Congregations B and C, both of which did not participate; this situation results in missing data about the relational tie between Congregations B and C. An approach measuring the outcomes from a network that includes both participants and non-participants would assume that the relational tie between Congregations B and C is missing, which suggests that Congregation A is bridging a structural hole. If Congregations B and C had provided data confirming a relational tie between them, however, the triad would be closed and would not involve a structural hole (Burt 1992, p. 18; Coleman 1988, pp. S105–S106). In a network including both participants and non-participants, missing relational data from non-participants would create too much uncertainty for measuring effective network size and network constraint.
8
“Black Protestant congregations include those from historically African American denominations, like the National Baptist Convention and the African Methodist Episcopal Church, as well as other Methodist, Baptist, and nondenominational congregations where at least 80% of attenders are African American (Steensland et al. 2000, p. 314)” (McClure 2020, p. 12).
9
“Other traditions include: Eastern Orthodox; Jewish; Latter-day Saint; Muslim; Spiritualist; Unitarian Universalist” (McClure 2020, p. 12).
10
This study added separate Congregationalist and Restorationist families to Melton’s (2009) scheme (see McClure 2021, p. 6 for the rationale). As many nondenominational congregations as possible were classified into Melton’s families (see McClure 2021, p. 6 for more information).
11
For participating congregations (N = 438), 25.3% are Evangelical Protestant and Baptist, 10.3% are Mainline Protestant and Methodist, 8.9% are Evangelical Protestant and Pentecostal, 7.8% are Black Protestant and Baptist, 6.4% are Black Protestant and Pentecostal, and 5.0% are Evangelical Protestant and Presbyterian. Each of the following combinations of religious tradition and family make up at least 2.5% but less than 5% of participating congregations: Mainline Protestant and Anglican; Holiness; Latter-day Saint; Black Protestant and Methodist; Mainline Protestant and Presbyterian; Evangelical Protestant and Restorationist; Roman Catholic; Evangelical Protestant with unclear family. The remaining combinations of religious tradition and family make up less than 1.5% of the participating congregations.
12
“Congregations where less than 80% of regular attenders are the same race are considered multiracial (see Emerson and Kim 2003, p. 217)” (McClure 2021, p. 7).
13
For participating congregations that reported their racial composition (N = 429), 69.7% are non-Hispanic white, 20.1% are African American, and 8.9% are multiracial. Less than 1.5% of the participating congregations are Hispanic/Latino, Asian/Pacific Islander, or another racial composition.
14
Compared to centrality measures, missing data does not have as detrimental of an impact on homophily measures: “The [behavioral homophily] estimates are still worse when more central nodes are missing but here the overall bias is low and the effect of missing central nodes is weak” (Smith et al. 2017, p. 91).
15
It is important to consider multicollinearity in the selection of this article’s control variables because multicollinearity has a greater impact when sample sizes are smaller (Allison 1999, p. 149).
16
I also considered controlling for founding date because of a relationship between congregational founding date and intra-congregational racial diversity (Dougherty et al. 2015, p. 680). However, congregational founding date (measured ordinally as: 1 = Before 1900; 2 = 1900–1949; 3 = 1950–1979; 4 = 1980–1999; 5 = 2000 or later) has a strong correlation with the “younger, newer attenders” scale (r = 0.573; p < 0.001). The “younger, newer attenders” scale is used as a control variable instead of founding date because the former variable has stronger correlations with the outcomes and predictors. However, models that control for founding date instead of the extent to which regularly attending adults are younger and newer do not change this article’s substantive findings (analyses not presented but available upon request).
17
This variable “is based on the National Center for Education Statistics’ framework for classifying communities (Geverdt 2015). The location types for each congregation were ascertained through geolocating each congregation in GIS and matching each location with 2017 NCES locale data” (McClure 2021, p. 7).
18
This variable was difficult to model. It contributed to heteroskedasticity in OLS models; in addition, because effective network sizes can involve fractions, Poisson and negative binomial regression models were not options.
19
A supplemental analysis noted that having at least one participating alter was significantly associated with the main minister’s tenure at the congregation. Congregations where the main minister’s tenure was less than five or at least 20 years were less likely to have at least one participating alter (McClure 2021, p. 10).
20
“The following characteristics correspond with congregations where, on average, at least 70% of their alters participated in the study (leading to more complete data on their similarity to or difference from alters [and their social capital]): Roman Catholic and other (not Protestant or Roman Catholic) traditions; Anglican, Latter-day Saint, and Roman Catholic families; multisite; average weekly attendance of 500 or more; budget of more than $1,000,000. The following characteristics correspond with congregations where, on average, about 55% or less of their alters participated in the study (leading to more incomplete data on their similarity to or difference from alters [and their social capital]): no denominational affiliation; Black Protestant tradition; Holiness, Pentecostal, and Restorationist families; African American racial composition; certificate or bachelor-level theological education; no budget” (McClure 2021, p. 11).
21
This variable was transformed into a proportion by dividing values by the maximum effective network size of 11.769.

References

  1. Allison, Paul D. 1999. Multiple Regression: A Primer. Thousand Oaks: Pine Forge Press. [Google Scholar]
  2. Ammerman, Nancy T. 2005. Pillars of Faith: American Congregations and Their Partners. Berkeley: University of California Press. [Google Scholar]
  3. Atouba, Yannick C., and Michelle Shumate. 2015. International Nonprofit Collaboration: Examining the Role of Homophily. Nonprofit and Voluntary Sector Quarterly 44: 587–608. [Google Scholar] [CrossRef]
  4. Baker, Wayne E., and Robert R. Faulkner. 2002. Interorganizational Networks. In The Blackwell Companion to Organizations. Edited by Joel A. C. Baum. Malden: Blackwell, pp. 520–40. [Google Scholar]
  5. Bizzi, Lorenzo. 2013. The Dark Side of Structural Holes: A Multilevel Investigation. Journal of Management 39: 1554–78. [Google Scholar] [CrossRef]
  6. Bobbitt, Linda. 2014. Measuring Congregational Vitality: Phase 2 Development of an Outcome Measurement Tool. Review of Religious Research 56: 467–84. [Google Scholar] [CrossRef]
  7. Borgatti, Stephen P., Martin G. Everett, and Jeffrey C. Johnson. 2018. Analyzing Social Networks, 2nd ed. Thousand Oaks: SAGE Publications, Inc. [Google Scholar]
  8. Burt, Ronald S. 1992. Structural Holes: The Social Structure of Competition. Cambridge: Harvard University Press. [Google Scholar]
  9. Burt, Ronald S. 2001. Structural Holes versus Network Closure as Social Capital. In Social Capital: Theory and Research. Edited by Nancy Lin, Karen Cook and Ronald S. Burt. New York: Taylor & Francis, pp. 31–56. [Google Scholar]
  10. Burt, Ronald S. 2004. Structural Holes and Good Ideas. American Journal of Sociology 110: 349–99. [Google Scholar] [CrossRef]
  11. Carroll, Jackson W. 2006. God’s Potters: Pastoral Leadership and the Shaping of Congregations. Grand Rapids: William B. Eerdmans Publishing Co. [Google Scholar]
  12. Centola, Damon. 2015. The Social Origins of Networks and Diffusion. American Journal of Sociology 120: 1295–338. [Google Scholar] [CrossRef] [Green Version]
  13. Chapman, Mark D. 2004. No Longer Crying in the Wilderness: Canadian Evangelical Organizations and Their Networks. Ph.D. dissertation, Centre for the Study of Religion, University of Toronto, Toronto, ON, Canada. [Google Scholar]
  14. Chaves, Mark, and Shawna L. Anderson. 2008. Continuity and Change in American Congregations: Introducing the Second Wave of the National Congregations Study. Sociology of Religion 69: 415–40. [Google Scholar] [CrossRef]
  15. Chaves, Mark, and Shawna L. Anderson. 2014. Changing American Congregations: Findings from the Third Wave of the National Congregations Study. Journal for the Scientific Study of Religion 53: 676–86. [Google Scholar] [CrossRef] [Green Version]
  16. Chaves, Mark, Mary Ellen Konieczny, Kraig Beyerlein, and Emily Barman. 1999. The National Congregations Study: Background, Methods, and Selected Results. Journal for the Scientific Study of Religion 38: 458–76. [Google Scholar] [CrossRef]
  17. Chaves, Mark, Mary Hawkins, Anna Holleman, and Joseph Roso. 2020. Introducing the Fourth Wave of the National Congregations Study. Journal for the Scientific Study of Religion 59: 646–50. [Google Scholar] [CrossRef]
  18. Chaves, Mark, Shawna L. Anderson, and Alison Eagle. 2014. National Congregations Study. Cumulative Data File and Codebook. Durham: Duke University, Department of Sociology [producer], University Park: The Association of Religion Data Archives [distributor]. [Google Scholar]
  19. Chaves, Mark. 2017. American Religion: Contemporary Trends, 2nd ed. Princeton: Princeton University Press. [Google Scholar]
  20. Clauset, Aaron, Mark E. J. Newman, and Cristopher Moore. 2004. Finding Community Structure in Very Large Networks. Physical Review E 70: 1–6. [Google Scholar] [CrossRef] [PubMed] [Green Version]
  21. Coleman, James S. 1988. Social Capital in the Creation of Human Capital. American Journal of Sociology 94: S95–S120. [Google Scholar] [CrossRef]
  22. Corcoran, Katie E., Rachel E. Stein, Corey J. Colyer, and Brittany M. Kowalski. 2021. Familial Ties, Location of Occupation, and Congregational Exit in Geographically-Based Congregations: A Case Study of the Amish. Review of Religious Research 63: 245–68. [Google Scholar] [CrossRef]
  23. Dougherty, Kevin D., Brandon C. Martinez, and Gerardo Martí. 2015. Congregational Diversity and Attendance in a Mainline Protestant Denomination. Journal for the Scientific Study of Religion 54: 668–83. [Google Scholar] [CrossRef]
  24. Ellingson, Stephen, Vernon A. Woodley, and Anthony Paik. 2012. The Structure of Religious Environmentalism: Movement Organizations, Interorganizational Networks, and Collective Action. Journal for the Scientific Study of Religion 51: 266–85. [Google Scholar] [CrossRef]
  25. Emerson, Michael O., and Christian Smith. 2000. Divided by Faith: Evangelical Religion and the Problem of Race in America. New York: Oxford University Press. [Google Scholar]
  26. Emerson, Michael O., and Karen Chai Kim. 2003. Multiracial Congregations: An Analysis of Their Development and a Typology. Journal for the Scientific Study of Religion 42: 217–27. [Google Scholar] [CrossRef]
  27. Everton, Sean F. 2018. Networks and Religion: Ties that Bind, Loose, Build-Up, and Tear Down. New York: Cambridge University Press. [Google Scholar]
  28. Felmlee, Diane, and Roger Faris. 2013. Interaction in Social Networks. In Handbook of Social Psychology, 2nd ed. Edited by John De Lamater and Amanda Ward. New York: Springer, pp. 439–64. [Google Scholar]
  29. Finke, Roger. 2004. Innovative Returns to Tradition: Using Core Teachings as the Foundation for Innovative Accommodation. Journal for the Scientific Study of Religion 43: 19–34. [Google Scholar] [CrossRef]
  30. Fulton, Brad R. 2016. Network Ties and Organizational Action: Explaining Variation in Social Service Provision Patterns. Management and Organizational Studies 3: 1–20. [Google Scholar] [CrossRef]
  31. Gargiulo, Martin, and Mario Benassi. 2000. Trapped in Your Own Net? Network Cohesion, Structural Holes, and the Adaptation of Social Capital. Organization Science 11: 183–96. [Google Scholar] [CrossRef]
  32. Geverdt, Douglas E. 2015. Education Demographic and Geographic Estimates Program (EDGE): Locale Boundaries User’s Manual. Washington: National Center for Education Statistics. [Google Scholar]
  33. Glock, Charles Y., and Rodney Stark. 1965. Religion and Society in Tension. Chicago: Rand McNally & Company. [Google Scholar]
  34. Grammich, Clifford, Kirk Hadaway, Richard Houseal, Dale E. Jones, Alexei Krindatch, Richie Stanley, and Richard H. Taylor. 2012. 2010 U.S. Religion Census: Religious Congregations & Membership Study. Kansas City: Association of Statisticians of American Religious Bodies [producer], University Park: The Association of Religion Data Archives [distributor]. [Google Scholar]
  35. Granovetter, Mark. 1973. The Strength of Weak Ties. American Journal of Sociology 78: 1360–80. [Google Scholar] [CrossRef] [Green Version]
  36. Granovetter, Mark. 1983. The Strength of Weak Ties: A Network Theory Revisited. Sociological Theory 1: 201–33. [Google Scholar] [CrossRef]
  37. Gulati, Ranjay, and Martin Gargiulo. 1999. Where Do Interorganizational Networks Come From? American Journal of Sociology 104: 1439–93. [Google Scholar] [CrossRef] [Green Version]
  38. Lee, Barrett A., Sean F. Reardon, Glenn Firebaugh, Chad R. Farrell, Stephen A. Matthews, and David O’Sullivan. 2008. Beyond the Census Tract: Patterns and Determinants of Racial Segregation at Multiple Geographic Scales. American Sociological Review 73: 766–91. [Google Scholar] [CrossRef] [Green Version]
  39. Lee, Sun Kyong, Heewon Kim, and Cameron W. Piercy. 2019. The Role of Status Differentials and Homophily in the Formation of Social Support Networks of a Voluntary Organization. Communication Research 46: 208–35. [Google Scholar] [CrossRef] [Green Version]
  40. Li, Qingjun, Haihua Hu, and Wei Yang. 2020. Homophily and Behavior Diffusion. Social Behavior and Personality: An International Journal 48: e8028. [Google Scholar] [CrossRef]
  41. Lichter, Daniel T., Domenico Parisi, Steven Michael Grice, and Michael C. Taquino. 2007. National Estimates of Racial Segregation in Rural and Small-Town America. Demography 44: 563–81. [Google Scholar] [CrossRef] [PubMed]
  42. Long, J. Scott. 1997. Regression Models for Categorical and Limited Dependent Variables. Thousand Oaks: Sage Publications, Inc. [Google Scholar]
  43. Marler, Penny Long, D. Bruce Roberts, Janet Maykus, James Bowers, Larry Dill, Brenda K. Harewood, Richard Hester, Sheila Kirton-Robbins, Marianne LaBarre, Lis Van Harten, and et al. 2013. So Much Better: How Thousands of Pastors Help Each Other Thrive. St. Louis: Chalice Press. [Google Scholar]
  44. Martinez, Brandon C., and Kevin D. Dougherty. 2013. Race, Belonging, and Participation in Religious Congregations. Journal for the Scientific Study of Religion 52: 713–32. [Google Scholar] [CrossRef]
  45. McClure, Jennifer M. 2020. Connected and Fragmented: Introducing a Social Network Study of Religious Congregations. Interdisciplinary Journal of Research on Religion 16: 1–33. [Google Scholar]
  46. McClure, Jennifer M. 2021. Congregations of a Feather? Exploring Homophily in a Network of Religious Congregations. Review of Religious Research. [Google Scholar] [CrossRef]
  47. McPherson, Miller, Lynn Smith-Lovin, and James M. Cook. 2001. Birds of a Feather: Homophily in Social Networks. Annual Review of Sociology 27: 415–44. [Google Scholar] [CrossRef] [Green Version]
  48. Melton, J. Gordon. 2009. Melton’s Encyclopedia of American Religions, 8th ed. Detroit: Gale. [Google Scholar]
  49. Papke, Leslie E., and Jeffrey M. Wooldridge. 1996. Econometric Methods for Fractional Response Variables with an Application to 401(K) Plan Participation Rates. Journal of Applied Econometrics 11: 619–32. [Google Scholar] [CrossRef] [Green Version]
  50. Portes, Alejandro. 1998. Social Capital: Its Origins and Applications in Modern Sociology. Annual Review of Sociology 24: 1–24. [Google Scholar] [CrossRef] [Green Version]
  51. Prell, Christina. 2012. Social Network Analysis: History, Theory and Methodology. Thousand Oaks: SAGE Publications, Inc. [Google Scholar]
  52. Provan, Keith G., Amy Fish, and Joerg Sydow. 2007. Interorganizational Networks at the Network Level: A Review of the Empirical Literature on Whole Networks. Journal of Management 33: 479–516. [Google Scholar] [CrossRef] [Green Version]
  53. Putnam, Robert D. 2000. Bowling Alone: The Collapse and Revival of American Community. New York: Simon & Schuster Paperbacks. [Google Scholar]
  54. Scheitle, Christopher P., and Kevin D. Dougherty. 2010. Race, Diversity, and Membership Duration in Religious Congregations. Sociological Inquiry 80: 405–23. [Google Scholar] [CrossRef]
  55. Scott, John. 2013. Social Network Analysis, 3rd ed. Thousand Oaks: Sage Publications, Inc. [Google Scholar]
  56. Smith, Christian. 1998. American Evangelicalism: Embattled and Thriving. Chicago: The University of Chicago Press. [Google Scholar]
  57. Smith, Jeffrey A., James Moody, and Jonathan H. Morgan. 2017. Network Sampling Coverage II: The Effect of Non-random Missing Data on Network Measurement. Social Networks 48: 78–99. [Google Scholar] [CrossRef] [Green Version]
  58. Smith, Jeffrey A., Miller McPherson, and Lynn Smith-Lovin. 2014. Social Distance in the United States: Sex, Race, Religion, Age, and Education Homophily among Confidants, 1985 to 2004. American Sociological Review 79: 432–56. [Google Scholar] [CrossRef]
  59. Steensland, Brian, Jerry Z. Park, Mark D. Regnerus, Lynn D. Robinson, W. Bradford Wilcox, and Robert D. Woodberry. 2000. The Measure of American Religion: Toward Improving the State of the Art. Social Forces 79: 291–318. [Google Scholar] [CrossRef]
  60. Stein, Rachel E., Katie E. Corcoran, Brittany M. Kowalski, and Corey J. Colyer. 2020. Congregational Cohesion, Retention, and the Consequences of Size Reduction: A Longitudinal Network Analysis of an Old Order Amish Church. Sociology of Religion 81: 206–29. [Google Scholar] [CrossRef]
  61. Sterland, Sam, Ruth Powell, Miriam Pepper, and Nicole Hancock. 2018. Vitality in Protestant Congregations: A Large Scale Empirical Analysis of Underlying Factors across Four Countries. Research in the Social Scientific Study of Religion 29: 204–30. [Google Scholar]
  62. Theissen, Joel, Arch Chee Keen Wong, Bill McAlpine, and Keith Walker. 2019. What is a Flourishing Congregation? Leader, Perceptions, Definitions, and Experiences. Review of Religious Research 61: 13–37. [Google Scholar] [CrossRef]
  63. Todd, Nathan R., Emily J. Blevins, and Jacqueline Yi. 2020. A Social Network Analysis of Friendship and Spiritual Support in a Religious Congregation. American Journal of Community Psychology 65: 107–24. [Google Scholar] [CrossRef]
  64. Warner, R. Stephen. 1994. The Place of the Congregation in the Contemporary American Religious Configuration. In American Congregations. Edited by James P. Wind and James W. Lewis. Chicago: University of Chicago Press, vol. 2, pp. 54–99. [Google Scholar]
  65. Wasserman, Stanley, and Katherine Faust. 1994. Social Network Analysis: Methods and Applications. Cambridge: Harvard University Press. [Google Scholar]
  66. Woolever, Cynthia, and Deborah Bruce. 2004. Beyond the Ordinary: Ten Strengths of U.S. Congregations. Louisville: Westminster John Knox Press. [Google Scholar]
  67. Woolever, Cynthia, and Deborah Bruce. 2010. A Field Guide to U.S. Congregations: Who’s Going Where and Why, 2nd ed. Louisville: Westminster John Knox Press. [Google Scholar]
  68. Woolever, Cynthia, and Deborah Bruce. 2012. Leadership That Fits Your Church: What Kind of Pastor for What Kind of Congregation. St. Louis: Chalice Press. [Google Scholar]
  69. Wuthnow, Robert. 1988. The Restructuring of American Religion: Society and Faith since World War II. Princeton: Princeton University Press. [Google Scholar]
  70. Yavaş, Mustafa, and Gönenç Yücel. 2014. Impact of Homophily on Diffusion Dynamics Over Social Networks. Social Science Computer Review 32: 354–72. [Google Scholar] [CrossRef]
  71. Zaheer, Akbar, and Giuseppe Soda. 2009. Network Evolution: The Origins of Structural Holes. Administrative Science Quarterly 54: 1–31. [Google Scholar] [CrossRef]
  72. Zaheer, Akbar, Remzi Gözübüyük, and Hana Milanov. 2010. It’s the Connections: The Network Perspective in Interorganizational Research. Academy of Management Perspectives 24: 62–77. [Google Scholar]
Figure 1. Diagram of the social network.
Religions 12 00653 g001
Figure 2. Predicted effective network size by homophily.
Religions 12 00653 g002
Figure 3. Predicted network constraint by homophily.
Religions 12 00653 g003
Figure 4. Predicted network constraint by homophily by racial composition for congregations with at least two participating alters.
Religions 12 00653 g004
Table 1. Descriptive statistics.
MeanSDMinMax
Effective Network Size2.9071.9791.00011.769
Network Constraint0.5850.2760.1941.000
Proportion of alters with same:
  Religious family and tradition0.5820.36201
  Racial composition0.7330.34601
Religious Tradition
  Evangelical Protestant0.54501
  Black Protestant0.17301
  Mainline Protestant0.19001
  Roman Catholic0.04001
  Other traditions0.05301
Congregation size3.1101.81118
Multisite0.03301
Younger, newer attenders0.0160.824−1.5561.991
Main Minister’s
  Age2.5100.93114
  Theological Education3.5201.25815
Community type
  City0.29001
  Suburb0.38801
  Town0.08501
  Rural0.23801
Proportion of alters that participated0.6210.2570.11.0
N = 400.
Table 2. Fractional logistic regressions predicting effective network size and network constraint.
Effective
Network Size Network Constraint
Model 1Model 2Model 1Model 2
Religious Tradition
  Evangelical Protestant (ref.)
  Black Protestant0.311**0.160 −0.568**−0.269
  Mainline Protestant0.249*0.159 −0.244 −0.083
  Roman Catholic−0.534*−0.520**0.549 0.588*
  Other traditions−0.002 −0.088 −1.052***−0.870***
Congregation size0.134***0.093***−0.187***−0.113***
Multisite0.183 0.287 0.354 0.160
Younger, newer attenders0.015 0.001 0.004 0.035
Main Minister’s
  Age−0.084*−0.091*0.097 0.108*
  Theological Education0.076*0.046 −0.002 0.048
Community type
  City0.065 0.101 0.133 0.063
  Suburb (ref.)
  Town0.016 0.004 0.075 0.091
  Rural−0.130 −0.029 0.232 0.055
Proportion of alters with same:
  Religious family and/or tradition−0.359**2.140***0.416*−3.761***
  Religious family and/or tradition 2 −2.392*** 3.966***
  Racial composition−0.068 0.835*0.257 −1.919**
  Racial composition 2 −0.890* 2.115***
Proportion of alters that participated +1.248***1.099***−1.398***−1.146***
Proportion of alters that participated +2−5.351***−3.750***8.645***6.050***
Constant−1.172***−1.438***−0.160 0.337
Wald χ2289.32***404.61***166.99***240.42***
Psuedo R20.055 0.065 0.094 0.126
Statistical significance estimated with robust standard errors: * p < 0.05; ** p < 0.01; *** p < 0.001; N = 400; This outcome was modelled as a proportion of the maximum value (value/11.769). + This variable is centered at its mean. 2 This variable is squared.
Table 3. Fractional logistic regressions predicting effective network size and network constraint for congregations with at least two participating alters.
EffectiveNetwork
Network Size Constraint
Religious Tradition
  Evangelical Protestant (ref.)
  Black Protestant0.232*−0.330*
  Mainline Protestant0.132 0.002
  Roman Catholic−0.550**0.725**
  Other traditions−0.148 −0.608**
Congregation size0.093***−0.108***
Multisite0.240 0.222
Younger, newer attenders−0.004 0.058
Main Minister’s
  Age−0.099*0.098*
  Theological Education0.070 0.019
Community type
  City0.143 −0.010
  Suburb (ref.)
  Town−0.005 0.075
  Rural0.012 −0.042
Proportion of alters with same:
  Religious family and/or tradition1.569**−2.297***
  Religious family and/or tradition 2−1.869***2.517***
  Racial composition−0.172 −0.508
  Racial composition 20.958*
Proportion of alters that participated +1.310***−0.962**
Proportion of alters that participated +2−3.645***3.608***
Constant−1.227***−0.063
Wald χ2251.69***132.39***
Psuedo R20.050 0.058
Statistical significance estimated with robust standard errors: * p < 0.05; ** p < 0.01; *** p < 0.001. N = 339. This outcome was modelled as a proportion of the maximum value (value/11.769). + This variable is centered at its mean. 2 This variable is squared.
Publisher’s Note: MDPI stays neutral with regard to jurisdictional claims in published maps and institutional affiliations.

