1. Introduction
Measuring religiosity is a well-developed field in the sociology and the psychology of religion. There are many validated instruments, covering a broad spectrum, that conceptualize religiosity as belief, attitude, orientation, commitment, and experience, among others (
Hill and Hood 1999). This field is still evolving. New research questions produce even more scales and instruments (
Büssing 2019) and globalization extends this broad spectrum by measures that have been developed in non-Christian and non-Western contexts (
Koenig et al. 2015).
Designing a project that reflects religiosity as an independent variable can only access this variety to a very limited extent. Normally, such projects rely on a single instrument to assess religiosity. The chosen instrument, therefore, has to measure religiosity exactly as conceptualized in the project’s theoretical framework. This is not trivial, because such instruments are, for example, sensitive to the cultural context in which the project is carried out (
Lazar 2004). Orthopractic Muslim societies form a different cultural context than American society with its Protestant bias. And the more or less secular European countries, with their Christian bias, seem to represent another category. Moreover, the chosen instrument often has to be small because of the restricted space in the questionnaires for independent variables. Therefore, measures of religiosity are needed that are available in a concise format.
From a European perspective, there are at least three instruments at hand that seem to fulfill these conditions. They have been developed within Europe and should therefore correspond to the European mode of addressing religiosity. They are also available in a well-tried, short form. These instruments are the Francis Scale of Attitude towards Christianity, the Post-Critical Belief Scale, and the Centrality of Religiosity Scale. All three scales claim to assess religiosity, but do so according to different theoretical backgrounds.
The Francis Scale of Attitude towards Christianity (FAC) is based on the individual differences approach in psychology and reconstructs the religiosity of a person by an attitudinal approach to religion (
Francis 2009, pp. 148–50). The attitude represents an affective concept, thus attitude towards religion assesses an individual’s feelings towards this issue. By adopting the attitudinal approach, according to Francis, the FAC overcomes some problems that are inherent to alternative approaches towards religion. Viewing religion as an affiliation, for instance, only offers a nominal measure of this issue and may have different meanings in various denominational contexts. Assessing religion as practice does not offer any insight into the motives for someone to engage in such practice. Finally, conceptualizing religion as belief is theoretically complex and may be too sophisticated to identify differences in a sample of ordinary people. The attitudinal approach should be able to assess differences in religiosity across various indicators like age or milieu because all individuals should have some (positive or negative) feelings towards this issue. The FAC comprises 24 items reflecting affective responses to five key features of Christianity, namely God, Jesus, the Bible, church, and prayer (
Francis 1989). The inner structure of this instrument is one-dimensional with a high internal consistency (
Michael et al. 2005) and a very good test–retest reliability (
Mc Guckin et al. 2006). The benefits of the FAC are as follows: first, the FAC has been translated into at least 13 languages and therefore is able to stimulate comparative research in various national contexts (
Francis 2009, p. 151). It is available in a validated German version, too (
Francis et al. 2002). Second, it has been transferred into the context of several other religious traditions so that comparative research across various religions is possible. Namely, there is a similar instrument for Islam (
Hamid et al. 2016), Judaism (
Francis and Katz 2007), Hinduism (
Francis et al. 2008) and Theism (
Francis et al. 2013). Third, the FAC has been applied to many studies and offers a solid base of results regarding themes like well-being, mental health, or personality traits (
Francis 2009, pp. 153–59). Fourth, the FAC is available as well-tried short form with seven items (
Maltby and Lewis 1997).
Development of the Post-Critical Belief Scale (PCB) was inspired by the recognition that existing measures of religiosity may no longer be suitable. Hutsebaut claims that such instruments neither interest the majority of participants, nor do they sufficiently differentiate various types of believers (
Hutsebaut 1996, 49f.). To ameliorate this dilemma, he adopted a discursive concept of religion, viewing religiosity as interaction between the religious symbolic system and the subject adhering to this system. According to David Wulff, there are two dimensions to frame this interaction (
Wulff 1997, pp. 629–31). The first dimension delineates the degree to which an individual is convinced that some transcendent reality exists. People may accept the idea of some higher reality or they may explain this world by strictly immanent, mundane processes. The second dimension is the understanding of religious expressions. People may take such expressions literally or symbolically. Hutsebaut adopts these two dimensions to construct four basic attitudes toward religion: (i)
Orthodoxy is defined by a literal understanding of religious expressions and by accepting the existence of a transcendent reality. According to this attitude, holy scripture offers direct access to the sacred because it contains God’s own words. (ii)
External Critique is defined by a literal understanding as well, but this understanding leads individuals to exclude any transcendence. For instance, the biblical stories about the beginning of the world are perceived as fairy tales because they do not match any relevant scientific theory. (iii)
Relativism similarly precludes the existence of any transcendent being, but can take holy scripture as texts of wisdom because this attitude is framed by a symbolic understanding of such texts. (iv)
Second Naiveté, finally, is understanding religious expressions in a symbolic manner and believing in some transcendent reality. Thus, the PCB contains four types of religiosity expressed in 33 items (
Duriez and Hutsebaut 2008) and is characterized by high internal consistency (
Fontaine et al. 2003). The benefits of the PCB are as follows: first, this scale offers an approach to religiosity that does not proceed from a one-dimensional approach to this phenomenon. As such, there is strong evidence that the PCB is able to assess various types of religiosity in contemporary society (
Neyrinck and Hutsebaut 2004). Second, in addition to the differentiation of four types of religiosity, it can be reduced to two basic dimensions. According to further studies, these dimensions represent constructs of
exclusion-vs-inclusion of a transcendent reality and
literal-vs.-symbolic understanding of religious expression (
Duriez and Soenens 2006). Third, the PCB has been applied to various cultural contexts and there is evidence that it functions well in secular contexts (
Cortés Gómez et al. 2016), as well as in formerly atheist (
Martos et al. 2009;
Zarzycka and Śliwak 2012) and in Muslim contexts (
Ghorbani et al. 2018). Fourth, the PCB is available in a validated German translation (
Duriez et al. 2003) and has been applied successfully to German samples (
Riegel and Ziebertz 2012). Fifth, it is available in a short form, comprising 18 items (
Duriez et al. 2005).
The Centrality of Religiosity Scale (CRS), developed by Stefan Huber, perceives religiosity as the inner relevance ascribed to religion by an individual (
Huber 2003). Basically, Huber distinguishes three states of centrality (
Huber 2010, p. 21): (i) highly religious individuals that utilize religion as an important frame of reference in regard to both their general worldview and their daily life. They are familiar with the relevant religious tradition’s doctrine and act accordingly; (ii) religious individuals that are quite sensitive to religious issues, too, however, religion is not an important factor in their daily life, but more of a background feature, which can be activated as needed; (iii) finally, there are non-religious individuals that are not affected by religion at all. Religion may be present culturally or socially in their environment, but non-religious individuals remain unaffected by this presence. They live in the absence of any religious input. To assess the centrality of religiosity, the CRS is based on the classical five dimensions of religion: ideology, intellect, experience, public practice, and private practice (
Huber and Huber 2012, 711f.). These dimensions have been operationalized as generally as possible to create an instrument that is viable across various religious traditions. If public and private practice are considered, however, the CRS has to use the concepts of particular religious traditions, like
personal prayer for Christian respondents and
dua for Muslim ones (
Huber and Huber 2012, pp. 713–15). While ideology, intellect, and experience are measured by 5-point Likert-scales, public practice is assessed on a 6-point scale, and private practice on a 7-point scale. The answers from the latter two, however, will be transferred into a 5-point scale according to a standardized algorithm (
Huber and Huber 2012, p. 720). The mean of the five dimensions represents the degree of centrality of religion in the individual’s meaning system. The benefits of the CRS are as follows: first, the CRS offers a timely and theoretically consistent approach to religiosity. Second, the CRS has successfully been applied to various cultural contexts (
Bertelsmann Stiftung 2010). It seems to be simple enough to be understood in various contexts. At the same time, it seems to be complex enough to grasp the particular contexts of this cultural variety. Third, the CRS is available in several languages. Fourth, the CRS has been proven to be highly reliable and viable in many empirical studies (
Huber 2010, p. 37). Fifth, the CRS is available in a 5-item short form (
Huber and Huber 2012, p. 717).
Comparing FAC, PCB and CRS, all these instruments offer theoretically sound and validated access to the individual’s religiosity. They do so, however, against the background of different theoretical approaches: FAC is based in an attitudinal approach, PCB realizes a theory of cognitive styles and CRS follows an attributional concept. These three theoretical approaches do not necessarily correlate. For example, a strong attitude toward an issue does not necessarily imply the high relevance of this issue in one’s lifestyle. And showing a high centrality of religion does not necessarily correspond with a particular way in which this centrality is expressed. Additionally, the three instruments show different accounts of religion. FAC is strictly related to the doctrine of a particular religious tradition. Its operationalization addresses core concepts of this tradition (like God, Jesus, the Bible, and church in the original version of this instrument). PCB also addresses the Christian doctrine in its item wording. Unlike FAC, PCB contains four accounts of this doctrine, two of which represent religious accounts, and two comprising non-religious ones. CRS represents a more general reading of religiosity. It uses Charles Glock’s dimensions of religion to formulate its items and seeks to avoid any bias of any particular religious tradition in the phrasing of the items. In consequence, centrality is assessed according to a general model of religion and a largely general item wording.
This evaluation raises the question of whether FAC, PCB, and CRS measure the same phenomenon. Both FAC and CRS represent single-dimensional instruments. However, does religiosity according to FAC correlate with religiosity according to CRS? Unlike the latter two, PCB contains two religious and two non-religious styles. Against its theoretical background, one can recognize that these four styles may represent two different dimensions of being religious. More specifically, it is likely that
Second Naiveté versus External Critique forms one of these dimensions and
Orthodoxy versus Relativism a second; this is because each of these two styles comprise opposite ends of the spectrum in Wulff’s theoretical concept (
Wulff 1997, p. 632). If this is so, how do these two dimensions relate to FAC and CRS?
2. Method
To answer these questions, this paper uses a sample from a larger project about why Germans remain in the Catholic or Protestant churches or leave these institutions. In this project, the three instruments—FAC, PCB, and CRS—have been applied to acquire a precise and differentiated description of the spirituality of the respondents. Since all of them are—or have been—involved with Christianity, differentiated measures of religiosity seem appropriate.
The FAC was presented in its 7-item short form and the respondents could respond to this instrument on a 5-point Likert-scale (1 = strongly disagree to 5 = strongly agree). Post-critical belief was measured by the 18-item short form. In contrast to the original instrument, the participants could respond via a five- (1 = I strongly disagree to 5 = I strongly agree) rather than a seven-option scale. This adjustment was made to harmonize the answer format throughout the entire questionnaire, as most of the other variables used 5-point scales and there is no indication that the PCB should not function similarly. Centrality of religiosity, finally, was assessed via the 5-item instrument. Here, the original scales, that vary between five and seven options, were employed. Harmonization to a 5-point answer format was not possible because the items relating to religious practice would not function properly with this measure. When the data were collected, however, these answers were recoded according to the algorithm of
Huber and Huber (
2012, p. 720) and thereby reduced to a 5-point Likert-scale.
The data analysis comprises five steps. First, frequency analysis and descriptive statistics offer a first impression of the respondent’s spirituality. Second, the internal structure of the three instruments will be checked by exploratory factor analysis. To clarify the relationship between the three instruments, further analysis will refer to the variables representing the factor scores of the items on the single factors, because these variables represent the weight of the single items for the relevant factor (
DiStefano et al. 2009). Third, a
t-test for independent samples according to gender and membership status and one-way ANOVA for region will be applied to check the external validity of the new variables. Fourth, the relationship between FAC, CRS, and PCB will be calculated by correlation analysis (Pearson’s r). Fifth, multiple regression analysis will be employed to check whether further variables will identify the correlation between the three instruments under scrutiny.
The article is based on a project on the spirituality of church members and former church members. The data collection of this project took place in between March 2016 and June 2017 via online questionnaire. This rather extensive process of data collection was necessitated by the collection strategy. Originally this project was initiated by the Roman Catholic diocese of Essen, which promoted the questionnaire via social media and in its own journal, and handed it out to every member of the Church of Essen for free (
Riegel et al. 2018, 141f.). Later, the Protestant Church of Westphalia joined this project as well. It took the church some time to reach this decision, but ultimately the questionnaire was similarly promoted by church-related social media. Since the nature of the project is strictly explorative, the extended process of data collection is no problem. Furthermore, during the data collection timespan, no events of particular public interest occurred that would substantially affect the participants’ answers (for example, information about a current church scandal).
The sample of this article consists of the previously identified participants, who properly responded to the three instruments of interest (N = 4396). These individuals are between the ages of 14 and 89 years, with an average age of M = 47 (SD = 15.90). The sample is fairly balanced with regard to gender, comprising 47% females and 53% males. This is noteworthy because women generally tend to respond to questionnaires on religiosity more eagerly than men. In terms of denomination, 1226 respondents are members of the Roman Catholic church, 2369 are members of the Protestant mainline churches, and 801 participants have left either the Roman Catholic or the Protestant church. It should be noted that there are no respondents in the sample that were neither acquainted with any religious community at all nor engaged with a non-Christian religious tradition at any point in time. This Christian character of the sample is a clear result of the larger project that solely targeted church members or former church members. The majority of the respondents reside in Central (25.4%) or Western Germany (52.4%). This aspect of the sample also stems from the previously described sampling strategy. However, respondents from Southern (13.1%), Northern (3.6%), and Eastern Germany (5.5%) are also present in the sample. In terms of education, the majority of the respondents have successfully completed higher secondary education (Abitur; 84.1%). In consequence, most of them have good jobs and a comfortable monthly income.
3. Analysis
As previously described, the analysis will first run frequencies and descriptive statistics at the item level, then employ exploratory factor analysis, after which it will check the external validity of the factors via t-test for independent samples and one-way ANOVA, and finally clarify the relationship between FAC, PCB, and CRS by correlation analysis and regression analysis.
3.1. Analysis of Frequencies and Descriptive Statistics
The analysis of frequencies and descriptive statistics for the items of FAC indicates a moderately positive attitude towards Christianity in the sample (see
Table 1). Most of the respondents respond affirmatively to the item “God means a lot to me” (66.3%) and many of them are convinced that God and Jesus help them in their lives (56% and 53%, respectively). However, for every item a portion of respondents exhibit a rather negative attitude towards Christianity. For example, 20.4% of the respondents respond affirmatively to the item that going to church is a waste of time and 31.2% do not feel that Jesus is close to them. These results could be expected in a sample in which 19% of the respondents have departed from active participation in the church.
The same statistical routines for the items of PCB produce similar results (see
Table 2). The four items with the highest mean represent a symbolic understanding of religion, which entails a positive attitude towards Christianity. Christianity is still perceived as meaningful despite the high number of injustices perpetrated in the name of this religious tradition (M = 4.18; SD = 1.19). The Bible retains its basic message although it was written in a completely different historic context (M = 4.07; SD = 1.17). Most of the respondents are convinced that their beliefs represent only one possibility among other beliefs (M = 4.08; SD = 1.11) and that the individuals’ experience of God is always colored by the times in which they live (M = 3.90; SD = 1.01). Interestingly, the items with the lowest mean represent two different approaches to religion. On the one hand, there are items in this section indicating a critical approach, like “Faith is an expression of a weak personality” (M = 1.61; SD = 1.08) or “Faith is more of a dream” (M = 2.04; SD = 1.28). On the other hand, the items in this section indicate an orthodox religiosity, taking religious expressions literally, for example, “I think that Bible stories should be taken literally, as they are written” (M = 1.71; SD = 1.05) or “Ultimately, there is only one correct answer to each religious question” (M = 2.09; SD = 1.22). According to the conceptual framework of PCB, as previously described, such types of religious accounts share a literal understanding of religion.
The analysis of frequencies and descriptive statistics for the items of CRS support the mainly positive account of religion in the sample (see
Table 3). A total of 72.1% of the respondents believe that God or something divine exists and 68.1% often think about religious issues, while 48.9% experience situations in which they have the feeling that God intervenes in their life. Thus, the results for CRS correspond remarkably closely with those for FAC. Since the results for PCB indicate differences in the way people perceive religion, such overlap in this regard is not as obvious for this instrument as with FAC.
3.2. Exploratory Factor Analysis
The individual items in the three instruments under scrutiny represent scales. To check the validity of this theoretical assumption for the data, exploratory factor analysis (principal component) has been employed. Both CFA and FAC each represent one factor. EFA for the items of CRS results gives a factor with an eigenvalue of 3.64, explaining 72.74% of the variance. The fit of the data is quite good (KMO = 0.88). In the case of FAC, the resulting factor has an eigenvalue of 5.49, explaining 78.41% of the variance. Here, the fit is very good (KMO = 0.93). In both cases the factor scores have been recorded as variables.
Conducting EFA for the items of PCB is possible as well, because the fit is very good (KMO = 0.93). From a theoretical perspective, PCB entails four typical accounts of religion based on two independent basic dimensions. Therefore, the question of how many factors represent the structure of the data adequately is raised. According to the Kaiser–Guttmann Criterion, three factors would be a viable solution, while according to the Scree-Criterion two factors are needed. Taking into consideration that every factor should explain at least 10% of the variance (
Urdan 2017, p. 218), in this paper the two-factor solution is preferred. In this solution, the first factor consists of those items representing either a critical or a second naivete account of religion. While the critical items show positive scores, the items representing second naivete load negatively on this factor. Hence, the factor will be labelled
Second Naivete vs.
External Critique. Its eigenvalue is 6.35 and it explains 35.27% of the variance. The second factor comprises the items representing a relativist account and those representing an orthodox account. Here, the relativist items positively affect the factor and the orthodox ones negatively. The label of this factor is
Orthodoxy vs.
Relativism. Its eigenvalue is 3.20 and it explains 17.76% of the variance. Both factors represent the theoretical structure of PCB very well, because in this instrument orthodoxy and relativism are opposite types, as are external critique and second naivete. In the theoretical model of PCB, these factors are orthogonal. Therefore, varimax rotation has been chosen for EFA. The factor scores have been recorded as variables.
3.3. t-Test for Independent Samples and ANOVA
To check the external validity of the four new factors representing FAC, CRS and PCB,
t-test for independent samples and one-way ANOVA have been chosen. In terms of gender, female respondents were expected to be more religious than male ones. With regards to the account of religion, females should be more relativistic than males (
Woodhead 2007). Both assumptions were corroborated by the respective
t-tests (see
Table 4). Women show a more positive attitude towards Christianity (M = 0.12; SD = 0.89) than males (M = −0.10; SD = 1.07;
t(4328) = 7.21;
p < 0.001), a higher centrality (M = 0.11; SD = 0.91 versus M = −0.10; SD = 1.06;
t(4314) = 6.97;
p < 0.001), and are less critical with regard to religion (M = −0.15; SD = 0.85 versus M = 0.12; SD = 1.10;
t(4314) = −9.05;
p < 0.001). Moreover, males tend to be less relativistic, and therefore more orthodox (M = −0.10; SD = 1.03), than women (M = 0.11; SD = 96;
t(4314) = 6.67;
p < 0.001). In conclusion, the external validity of the four factors is confirmed with regard to gender.
In terms of church membership, active church members are expected to be more religious than former church members. Where the account of religion is concerned, active church members should be more orthodox than former members. Again, both assumptions were supported by the
t-test results (see
Table 5). Active church members hold a more positive attitude towards Christianity (M = 0.25; SD = 7.8) than those who have left (M = −1.17; Sd = 0.89;
t(4204) = −48.10;
p < 0.001), that regard religion as more important (M = 0.23; SD = 81 versus M = −1.19; SD = 0.89;
t(4188) = −42.94;
p < 0.001), and that are less critical (M = −0.26; SD = 0.72 versus M = 1.26; SD = 1.11;
t(4189) = 47.37;
p < 0.001). They are also less relativistic (M = 0.03; SD = 0.97) than the respondents that have left the church (M = 0.11; SD = 0.90;
t(4189) = 2.08;
p < 0.05). All of these results indicate good external validity of the factors with regard to church membership.
Moreover, the results of t-testing the factors according to gender and church membership indicate that FAC, CRS, and the PCB-sub-scale second Naivete vs. external Critique appear to assess approximately the same aspect of religion. They show that the analogous differences for both of the independent variables, and the means are almost identical for all three factors. This is not the case with the PCB sub-scale Orthodoxy vs. Relativism. This factor may measure a different aspect of religion to the other three.
Finally, the relevance of the region where the participants are from for FAC, CRS, and PCB was tested via ANOVA. No difference in religiosity is expected, since all respondents are members or former members of Christian churches, regardless of the region where they live. In terms of relativism, however, participants from East Germany should be less relativistic than those from the Western regions because most of them encountered the atheist GDR system, which brought about a rather orthodox Christianity in this region. Accordingly, there was only one significant effect of region on the PCB sub-scale Orthodoxy vs. Relativism (F(4, 4346) = 16.16, p < 0.001). Respondents from Eastern Germany appear to be more orthodox (M = −0.22) than those from western German regions (M = 0.10). The other three factors under scrutiny did not show significant differences according to region. The external validity of the new factors is again supported.
3.4. Correlation Analysis
Correlation analysis supports the assumptions regarding the relationships between the four factors, as indicated by
t-testing (see
Table 6). First of all, FAC and CRS were found to be very highly positively correlated,
r(4322) = 0.92,
p < 0.001. The correlation between both FAC and CRS with the PCB sub-scale
second Naivete vs.
external Critique is nearly as highly positive. Here, the coefficients are
r(4325) = −0.88,
p < 0.001 and
r(4309) = −0.83,
p < 0.001, respectively.
The correlations between both FAC and CRS with the PCB sub-scale Orthodoxy vs. Relativism are weak. FAC and Orthodoxy vs. Relativism were found to be negatively correlated (r(4325) = −0.26, p < 0.001), as was CRS and Orthodoxy vs. Relativism, r(4309) = −0.25, p < 0.001. The negative character of the relationship makes sense, because, in the theoretical framework of PCB, the relativistic account is indicative of an anti-religious effect.
For the sake of completeness, the two PCB sub-scales second Naivete vs. external Critique and Orthodoxy vs. Relativism were assessed and were not found to be correlated at all. This isn’t surprising, as both factors were constructed via varimax rotation and calculation via factor scores preserves the orthogonal character of both factors.
3.5. Regression Analysis
The final step of the analysis is to check whether the relationship between the instruments under scrutiny are affected by the inclusion of further variables. Multiple regression analysis was employed for this purpose. A crucial question of this analysis is which factor to employ as the independent variable. FAC and CRS have proven to be instruments that generate approximately the same measurement (r = 0.92). Therefore, both instruments were chosen for the regression analysis: each of the factors served as a dependent variable in a relevant routine. Then, the two PCB factors second Naivete vs. external Critique and Orthodoxy vs. Relativism served as independent variables. Additionally, the background variables of age, gender (being male), region (living in the Eastern parts of Germany), education, and income were used as further independent variables.
The two analyses provided similar results. In both regressions, region, education and income turned out to have no effect on the dependent variable in the cases of both FAC and CRS. The results of the regression for CRS indicate that the two PCB sub-scales, age and gender, explain 75% of the variance (R2 = 0.75, F(4, 4132) = 776.13, p < 0.001). It was found that second Naivete vs. external Critique significantly predicted CRS (β = −0.82, p < 0.001), as did Orthodoxy vs. Relativism (β = −0.25, p < 0.001), age (β = 0.07, p < 0.001), and gender (β = −0.03, p < 0.01). The results of the regression for FAC indicate that the same variables explain 83% of the variance (R2 = 0.83, F(4, 4132) = 864.76, p < 0.001). Here, second Naivete vs. external Critique significantly predicted FAC (β = −0.87, p < 0.001), as did Orthodoxy vs. Relativism (β = −0.26, p < 0.001), age (β = 0.03, p < 0.001), and gender (β = −0.02, p < 0.01).
These similar outcomes provide support for the insight that FAC and CRS are comparable instruments in measuring religiosity. Moreover, the PCB sub-scale of second Naivete vs. external Critique predominantly predicts FAC and CRS. This was to be expected, given the correlations. This picture remains the same when including further variables.
4. Discussion
This article addresses the question of which instrument to use in a larger project to effectively measure religiosity as an independent variable. In such projects, the scope of simple variables like denomination, attending religious services, or self-assessment as spiritual/religious appears too limited to comprehensively grasp religiosity. Complex instruments with many sub-scales solve this problem, but also appear to be too extensive to be used as independent variables. Compact instruments that represent a theoretically sound concept of religiosity are needed. The Francis Scale of Attitude towards Christianity (FAC), the Centrality of Religiosity Scale (CRS), and the Post-Critical Belief Scale (PCB) represent such instruments. Each of these measures are based in sound theory, their validity and reliability has been proven in many previous studies, and they are available as established short forms. The question is, then, which of these instruments to use in such a project?
The results of this article indicate that FAC and CRS measure approximately the same issue because they are very highly correlated (
r = 0.92). This is by no means trivial, since FAC addresses the attitude of a person toward religion (
Francis 1989) and CRS the centrality of religion for this person (
Huber 2003). That said, the results indicate that attitude and centrality possess a very close relationship. In consequence, there is support for the claim that it does not matter whether one employs FAC or CRS as the independent measure of religiosity. The outcomes should be the same. The particular type of assessment may further indicate which of these instruments is more appropriate on a case-by-case basis. The FAC is based in a substantial account of religion, addressing Christianity (or Islam, Hinduism, or Theism, as the case may be) as previously described. The CRS, in contrast, is more general in the wording of its items, featuring only two sensitive items with regard to specific religious traditions (collective and private religious practice). In an adaptive questionnaire, in which a participant is offered the relevant version of FAC, this instrument has the potential to produce highly valid results because the frame of reference is very clear in terms of which religion is assessed. However, the problem of how to choose the relevant version of FAC may arise. For example, our sample features participants who have left the church community. In this case, do they receive the Christian or the theistic version? If such problems occur—or if the assessment is not adaptive—CRS may be a better option. By virtue of its more general design, it can offer participants more opportunities to find themselves personally addressed by the items.
When PCB is considered, the results indicate that this instrument assesses two different accounts of religion. The first account is represented in the sub-scale
second Naivete vs.
external Critique. The items of this scale express a negative or positive perception of religion. Therefore, this scale measures religiosity in the sense of whether one is more or less religious. It is a measure similar to FAC (
r = 0.88) or CRS (
r = 0.83). The second account is represented in the sub-scale
Orthodoxy vs.
Relativism. This scale contains items addressing a literal versus relativistic understanding of religion. Therefore, the second sub-scale of PCB is not so much about being or not being religious. Instead, it addresses the style of religiosity. This difference is reflected in the correlation analysis, as the correlations between
Orthodoxy vs.
Relativism and FAC (
r = −0.26) and CRS (
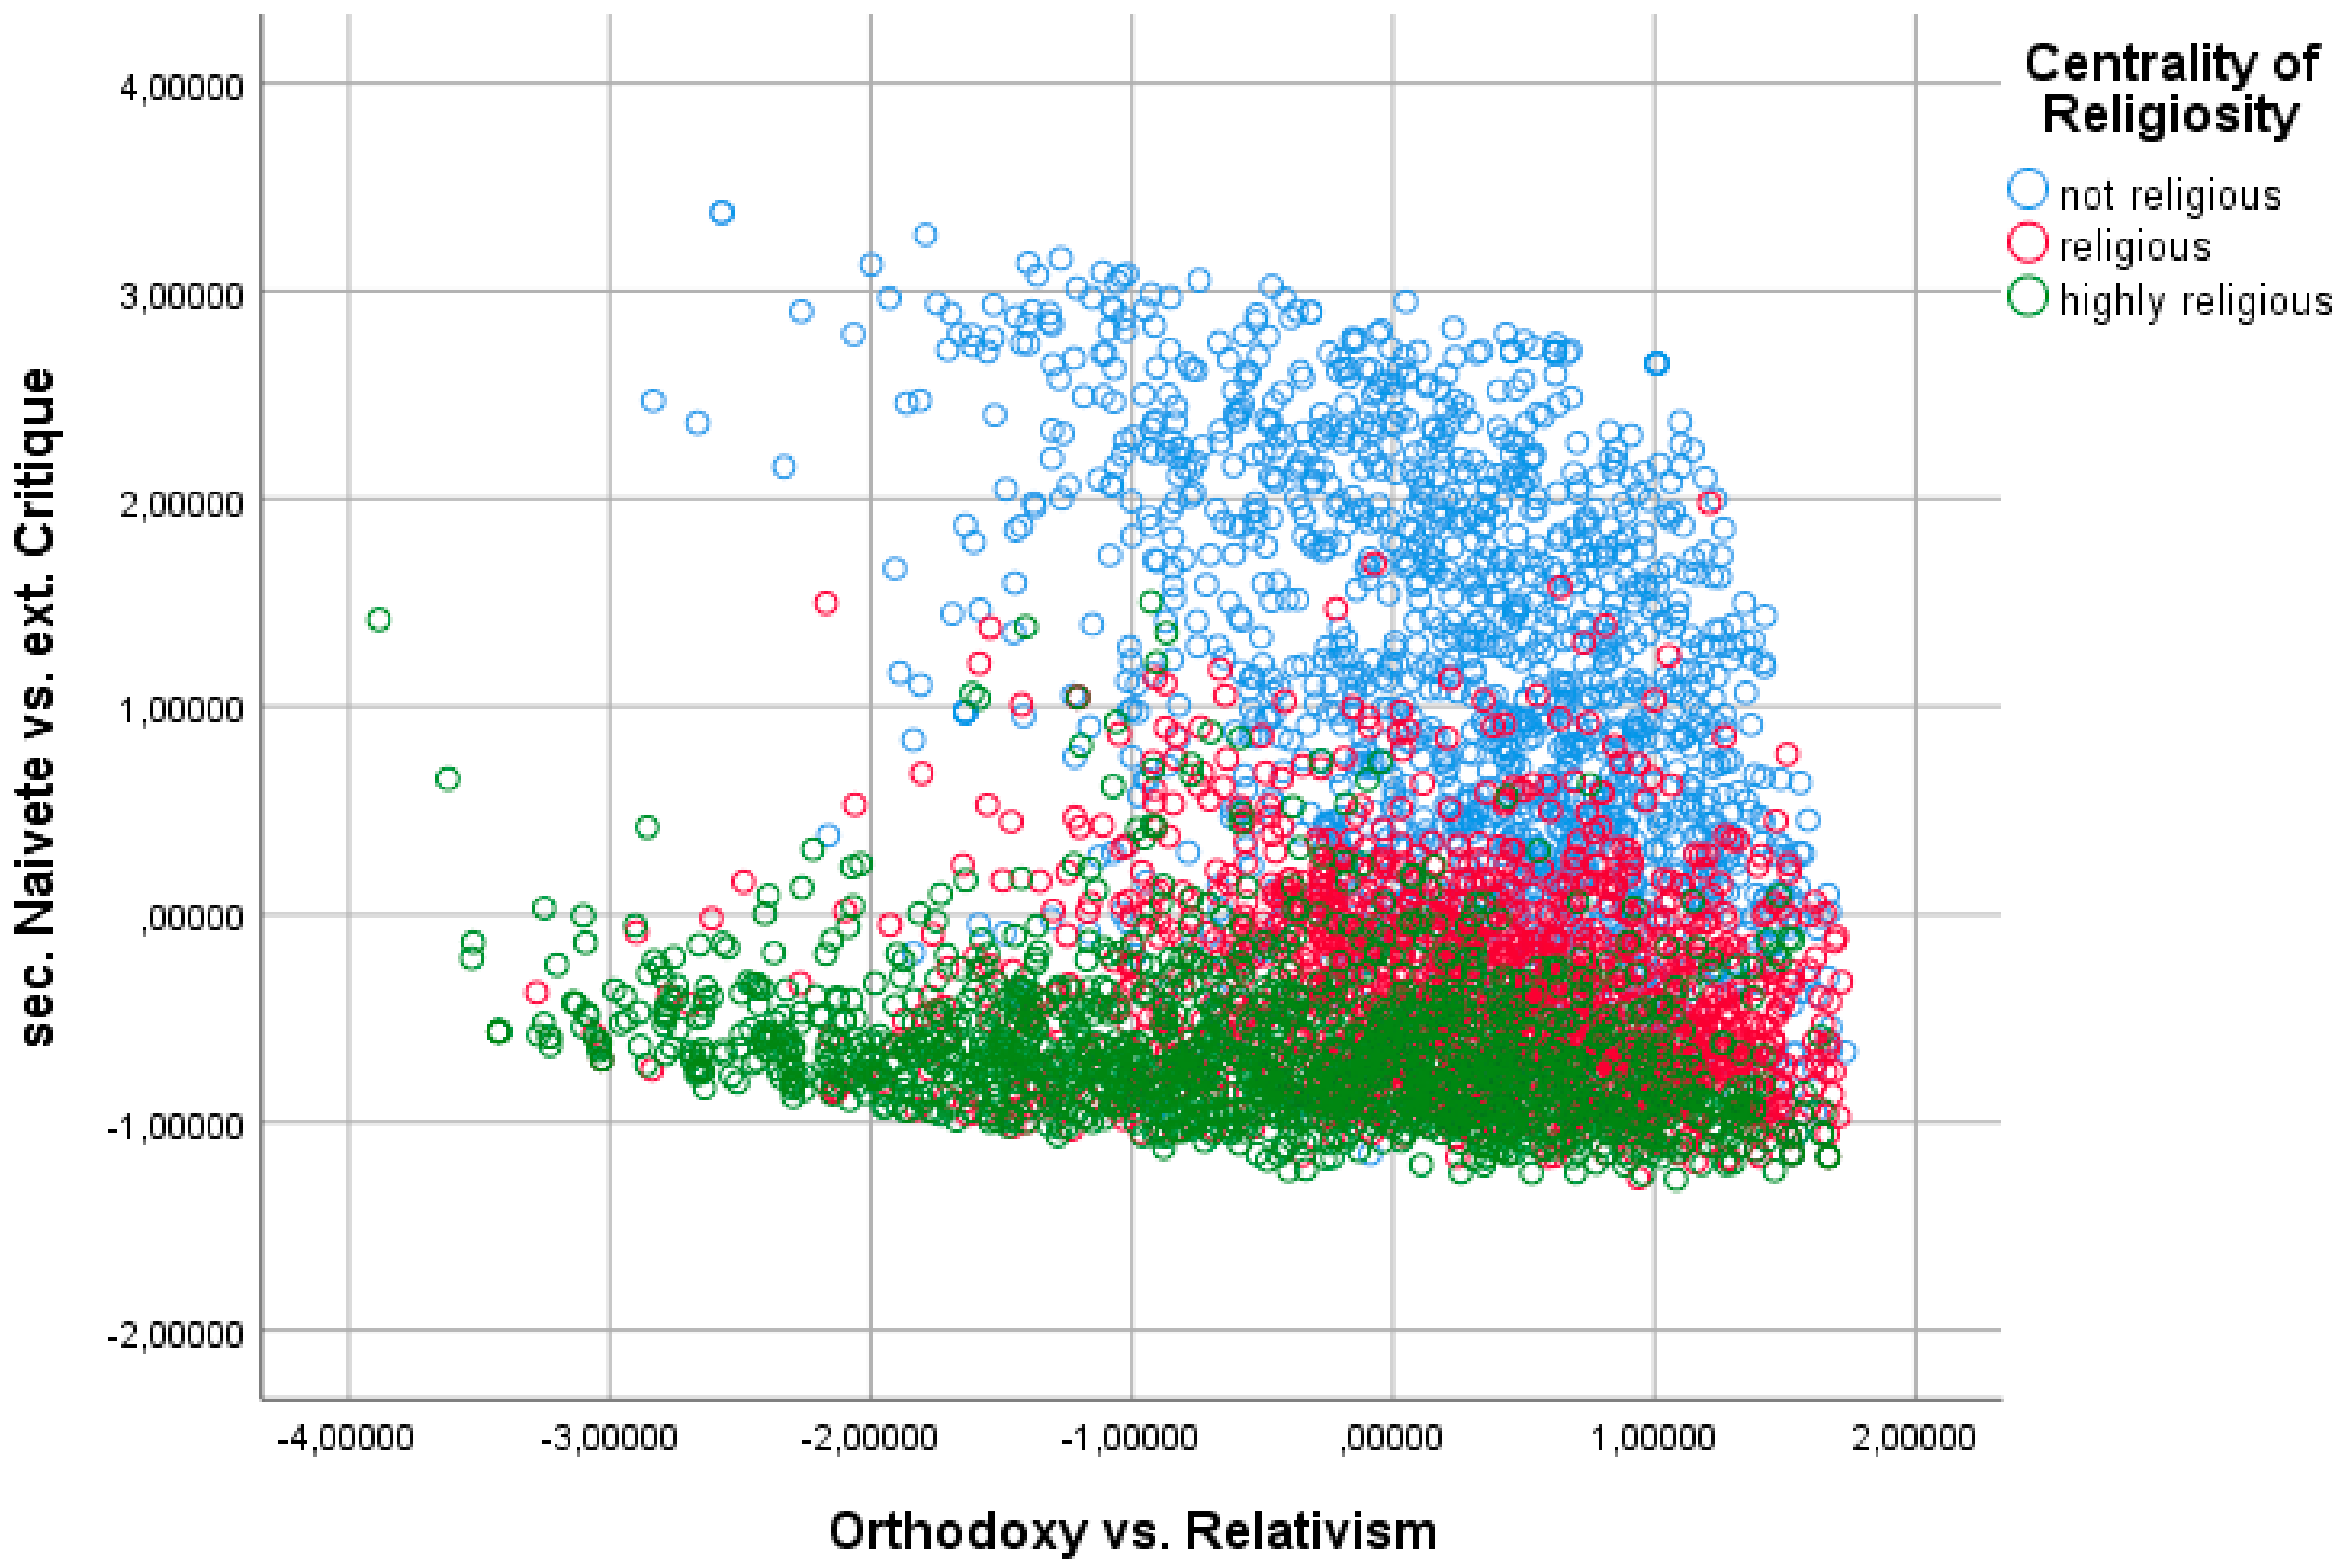
r = −0.25) are quite low. To illustrate this fact, we plotted the distribution of CRS according to the two PCB sub-scales
second Naivete vs.
external Critique and
Orthodoxy vs.
Relativism (see
Figure 1). Before doing so, we transformed the factor of CRS into the three categories of
highly religious,
religious, and
not religious, according to Huber and Huber (
Huber and Huber 2012, p. 722). As expected, the distribution of the CRS categories is correlated with the sub-scale
second Naivete vs.
external Critique: the more critical the respondents are, the less religious they are. Non-religious respondents can be found predominantly in the section
external critique and highly religious participants in the section
second naivete. The particularly interesting insight granted by this plot is the distribution of CRS according to the sub-scale
Orthodoxy vs.
Relativism: highly religious respondents can be found in both the orthodox and the relativistic sectors. The same is true in the case of religious versus non-religious participants.
Second Naivete seems to indicate religiousness and
External Critique non-religiousness, while
Orthodoxy and
Relativism seem to indicate two different aspects of being religious or being not religious, respectively.
This constellation might serve as an argument for employing PCB as the independent variable in a larger project. While FAC and CRS assess whether a participant is religious or not, PCB measures this feature and, additionally, the style of the participants in terms of how they are or are not religious. The added value of this additional perspective on religiosity may be its more differentiated analysis. For example, highly religious individuals are often associated with fundamentalism, while empirical analysis indicates that only very few highly religious individuals are, in fact, fundamentalists (
Faix et al. 2020). While the scale
Second Naivete vs.
External Critique is unable to grasp this difference, the scale
Orthodoxy vs.
Relativism is. In this regard, PCB offers a fine instrument to assess religiosity that is more complex than FAC or CRS. If the main restriction of a questionnaire is its space, FAC and CRS are clearly advantageous compared to PCB, because the latter consists of 18 items in its short form, while the first two instruments are represented by seven and five items, respectively. FAC and CRS are both approximately three times shorter than PCB. If space for independent variables is not limited in this way, PCB presents a good option for acquiring more complex insight into the participant’s religiosity.
This research faces some limitations as well. The sample of this article is neither representative nor multicultural. The first issue should not be particularly troublesome, because region is not shown to affect the question of whether the respondents are religious and, in terms of gender, the sample is balanced. Perhaps it would also be advantageous to control for education level. The majority of this sample comprises well-educated individuals. Although education has no predictive effect on either FAC or CRS in regression analysis, a predominantly less educated sample may exhibit different correlations. The second issue, that of multiculturality, should be taken into account because it relates to two possible restrictions of the findings. First, the sample has a Christian bias. It was carried out among members of Christian churches and former members of these churches. Even those who have left the church previously identified as Christians. Therefore, our results do not provide any information on how FAC, CRS, and PCB are correlated in a sample with a more diverse range of participants with regard to their secularity. In such contexts, for example, it can be hypothesized that the attitude of a person toward Christianity might be quite positive even if this belief system is not central to this person’s identity. Second, the results of this article do not illuminate how the measures under scrutiny might be correlated in Muslim, Hindu, or Jewish contexts. For example, in Iran the scales of PCB can be reconstructed successfully, but they show a different effect on variables like
open-mindedness or
satisfaction with life measures than they do in Western contexts (
Ghorbani et al. 2018). This restricts the explanative power of the results of this article to Christian contexts. Further research in non-Christian contexts is therefore needed.


