1. Introduction
Throughout its entire existence, the study of religion and religiosity has been searching for a universal instrument to measure the psychological constructs behind the various religious ideologies, rituals, experiences and other expressions of faith life. However, over time, the broadness of the field led to a variety of results. Various research interests brought up a plethora of sociological and psychological assessment scales. For an overview and examples, see the book by
Hill and Hood (
1999). Nevertheless, the interest in a robust and versatile instrument remains unbroken, especially when looking at the changes in the religious landscape worldwide (
Hackett and Stonawski 2017) as well as the wish to have a comparable scale for the different dimensions of human religiosity in distinctive religious contexts. Endorsing the idea of multifaceted religious expression,
Murken and Namini (
2006) summarize, in their chapter on the Psychology of Religion, that one subject is undiscussable. In order to be universal, a psychometrical scale has to be multidimensional because assessing, for example, only the frequency of church attendance or prayer, the importance of commandments or rules or the time spent in religious communities is not appropriate to capture the importance of religion in a human’s life. The problem of an assessment with single items is long-known and understood in the research community. Since the 1960s, attempts have been made to construct a scale which includes all possible expressions of human religiosity.
In 2003, Stefan Huber proposed a new—albeit not the first—multidimensional method of measuring religiosity combining two of the most popular measurement models of religiosity of the 20th century: the I/E-concept by
Allport and Ross (
1967) and the Dimensions of Religious Commitment by
Glock and Stark (
1966). His conceptualization takes the multifaceted phenomenological model by Glock and places it on an aggregated score of the religious dedication as proposed by Allport. This conceptualization allows for an assessment of the strength of religious commitment—so-called centrality. At the same time, this assessment encompasses a content analysis of the fanned-out core dimensions of religiosity: ideology, intellect, religious experience, private and public religious practices, which were redefined from the original proposition by Glock. Together, the five dimensions form what is called religiosity—a personal psychological trait in demarcation to religion as an organized, tradition-oriented social phenomenon and spirituality as a privatized, experience-oriented, individual phenomenon (
Streib and Hood 2016, p. 9). The scale is thus called the Centrality of Religiosity Scale, short CRS, and is placed on the intersection of theology, psychology, and sociology of religion as a psychometric questionnaire. A distinctive feature of the scale is that it is conceptualized to capture the expression of personal traits in the measurement of dimensions of frequency, importance and salience providing platform for objective and subjective expression of one’s religiosity. Respondents are not provoked to auto-reference to or compare themselves with a particular social group, therefore, comparability (e.g., between religious communities, across time points, between countries, etc.) is preserved for the analysis of the totality of the collected responses.
In 2012 Huber and Huber proposed various forms of the CRS to the community to satisfy different research needs. There is a major split is between Abrahamitic and non-Abrahamitic contexts: the CRS-5, the CRS-10, and the CRS-15 serve the first and the CRSi-7, the CRSi-14, and the CRSi-20 serve the second ones respectively (see
Table A1,
Table A2 and
Table A3 in
Appendix A). The number after the abbreviation indicates the number of items in the scale. In the shortest version—the CRS-5, each core dimension has only one indicator, multiplied by two in the CRS-10 and multiplied by three in the CRS-15 version. The “i”-versions are an expansion, in which additional items were added. One on meditation and one on experience of connectedness in the short version. With these items, the CRS-5 resulted in the CRSi-7 (5 + 2); the CRS-10 with two additional items in the CRSi-14 (10 + 2 + 2), with one additional item leading from the CRS-15 to the longest version, the CRSi-20 (15 + 2 + 2 + 1). The answer options can be summed up into the three categories of frequency, importance and salience of the construct of interest.
The scale was developed and validated in Europe (Switzerland and Germany;
Huber 2003), its universality, practicality and utility, as well as psychometric characteristics had to be tested by putting it into practice in different contexts.
Since the first publication in the year 2003 all six forms of the Centrality of Religiosity Scale have been used in a wide scope of applications in different religious contexts and numerous countries
1. The application in the international Religion Monitor run by the German Bertelsmann Foundation in 21 countries in the years 2007/2008 (CRS-5, CRSi-7, and CRS-10), in 13 countries in the years 2012/2013 (CRS-5 and CRSi-7), and 6 countries in the year 2017 (CRS-5 and CRSi-7) showcases the viability of the scale. The Religion Monitor is a good example of the adaptiveness of the CRS to different religious, cultural and linguistic environments. The scale assists the field by aggregating divergence of religious expression to a comparable quantity while keeping the possibility of accentuation of the core dimension in the final interpretation. Thus, religiosity becomes an attainable and extensive construct, which is easy to integrate into any kind of research on health-related, economic, political, educational and social topics to name a few examples. That is the reason why interest in application, translations and cultural adaptations of the CRS has remained unbroken in the last decade (e.g.,
Esperandio et al. 2019;
Fradelos et al. 2018;
Huza 2019;
Zarzycka 2007). The showcase of the Religion Monitor demonstrates, on the one hand, the functionality of the CRS, and on the other hand it reveals its limitations. For some non-western contexts (e.g., Turkey, Morocco, Nigeria, Guatemala, Indonesia) the scale had a very skewed distribution, resulting in a collapsing indices of internal consistency (
Huber and Huber 2012). Georgia offers in this regard a unique example of a non-western, predominantly Christian orthodox country to test the CRS further and to explore the capability of its reliability.
1.1. Setting in Georgia
For the investigation of the CRS in the orthodox context, Georgia stands out as a remarkable example because of its long-lasting roots of Christianization. Even though the Christianization of Georgia has not been the only religious transformation of the country—as seen for example in the region Adjara in South-West Georgia with a concentration of Muslims because of former Ottoman influences—its dominance is seen in the numbers of the current demographical statistics. In the 2014 census, the number of Orthodox Christians was 83.4%, Muslims—10.7%, Armenian Apostolic—2.9%, and others including non-religious—3.0% (
Shavishvili 2016). To embed the current situation of the religious landscape in the course of time we are briefly summarizing the development of the orthodox church in Georgia in recent decades in the following paragraph. The Muslim minority as well as other religious groups in Georgia are not a subject of this study.
After the collapse of the Soviet Union and disappearance of the restrictive political regime in 1991, the Georgian Orthodox church started gaining huge social power, church attendance rose dramatically and religious discourses appeared in the political realm (
Sumbadze et al. 2016). The Georgian Orthodox church is still the most trusted institution in the country and Orthodoxy is one of the most important ingredients of Georgian national identity. Hence, religion plays a major role in the daily life of Georgian people but was not examined extensively and in-depth considering all the dimensions of religious life.
1.2. Dimensions of the Centrality of Religiosity Scale
The two versions of the CRS we refer to in this article are the CRS-5 and the CRSi-7. The dimensions of the CRS are ideology, intellect, experience, private practice and public practice. In the CRS-5, each core dimension is represented by only one item, in the CRSi-7 additional items are added on private practice and religious experience. The CRS-5 is intended to be applied in Abrahamitic contexts, i.e., Jewish, Christian and Muslim. The extension, by two items, to the CRSi-7 includes other religious backgrounds, e.g., Hinduism and Buddhism. The five dimensions of CRS-5 are thus included in the CRSi-7. The translated items of both scales can be found in
Appendix A,
Table A1—the answer categories and their interpretation are presented in
Table 1. Hereafter, original items are presented alongside the description of the dimension in the text.
1.2.1. Ideology
The ideological dimension deals with beliefs and patterns of plausibility. A core indicator for this dimension is the plausibility of the existence of a transcendent sphere of reality. The more plausible this sphere appears, the more relevant and concrete religious beliefs can become for somebody. The corresponding question is: “To what extent do you believe that God or something divine exists?” (CRS-5 and CRSi-7).
1.2.2. Intellect
The intellectual dimension consists of religious knowledge, themes of interest, and hermeneutical skills. An indicator of the general strength of this dimension is the frequency of thinking about religious issues. The more somebody thinks about religious questions, the more religious knowledge is deepened and enhanced, and the more hermeneutical skills are trained. The corresponding question is: “How often do you think about religious issues?” (CRS-5 and CRSi-7).
1.2.3. Religious Experience
The experiential dimension consists of patterns of religious perceptions and religious feelings. General indicators of this dimension are the frequency of experiences of divine interventions or of being one with everything. The more these general types of experiences take place, the more somebody is open to concrete experiences of the divine. The corresponding questions are: “How often do you experience situations in which you have the feeling that God or something divine intervenes in your life?” (CRS-5) and additionally “How often do you experience situations in which you have the feeling that you are one with everything?” (CRSi-7).
1.2.4. Private Practice
The dimension of private practice relates to actions in which somebody tries to connect him- or herself with a transcendent sphere of reality. The most common forms are prayer and meditation. The more somebody practices at least one of these forms, the more he or she is in the mode of connecting him- or herself with the divine. The corresponding questions are: “How often do you pray?” (CRS-5) and additionally “How often do you meditate?” (CRSi-7).
1.2.5. Public Practice
The dimension of public practice refers to the integration of somebody’s religious life in a social body. The most general indicator is the frequency of participation in religious services. The more somebody attends religious services the higher is the probability that somebody is integrated in a social religious body. The corresponding question is: “How often do you take part in religious services?” (CRS-5 and CRSi-7).
The frugal short forms have been proven to have good psychometrical characteristics by demonstrating moderate positive correlations between the core dimensions
r = 0.35 to
r = 0.73 (CRS-5 and CRSi-7 in the International Religion Monitor of the years 2007, 2012, 2017)—proving them to be relatively autonomous among each other. The composite score of the scale has a good to excellent internal consistency with a Cronbach’s
between
= 0.84 for the CRSi-7 and
= 0.85 for the CRS-5 in the norm sample (
Huber and Huber 2012). The overall good internal consistency suggests a one-factor latent structure. Nonetheless, the uniform construct of Centrality of Religiosity was subject to discussion from the beginning.
1.3. Interrelationship of the Dimensions of Religiosity
The latent structure of the CRS was examined for the first time in the book “Centrality and Content” (
Huber 2003, pp. 270–93) concurrent with the publication of the scale itself. Different models starting with one latent factor and going up to five latent factors are presented and compared with each other. In this manner, different possible combinations of the core dimensions of religiosity are accounted for. This approach opens the field to a theoretical discussion of homogeneity of religiosity as a personal trait. Since the publication of the scale data was analyzed but not discussed systematically regarding neither the latent structure nor its stability in different religious contexts. Nevertheless, it is worth looking at the construct behind the core dimensions of religiosity.
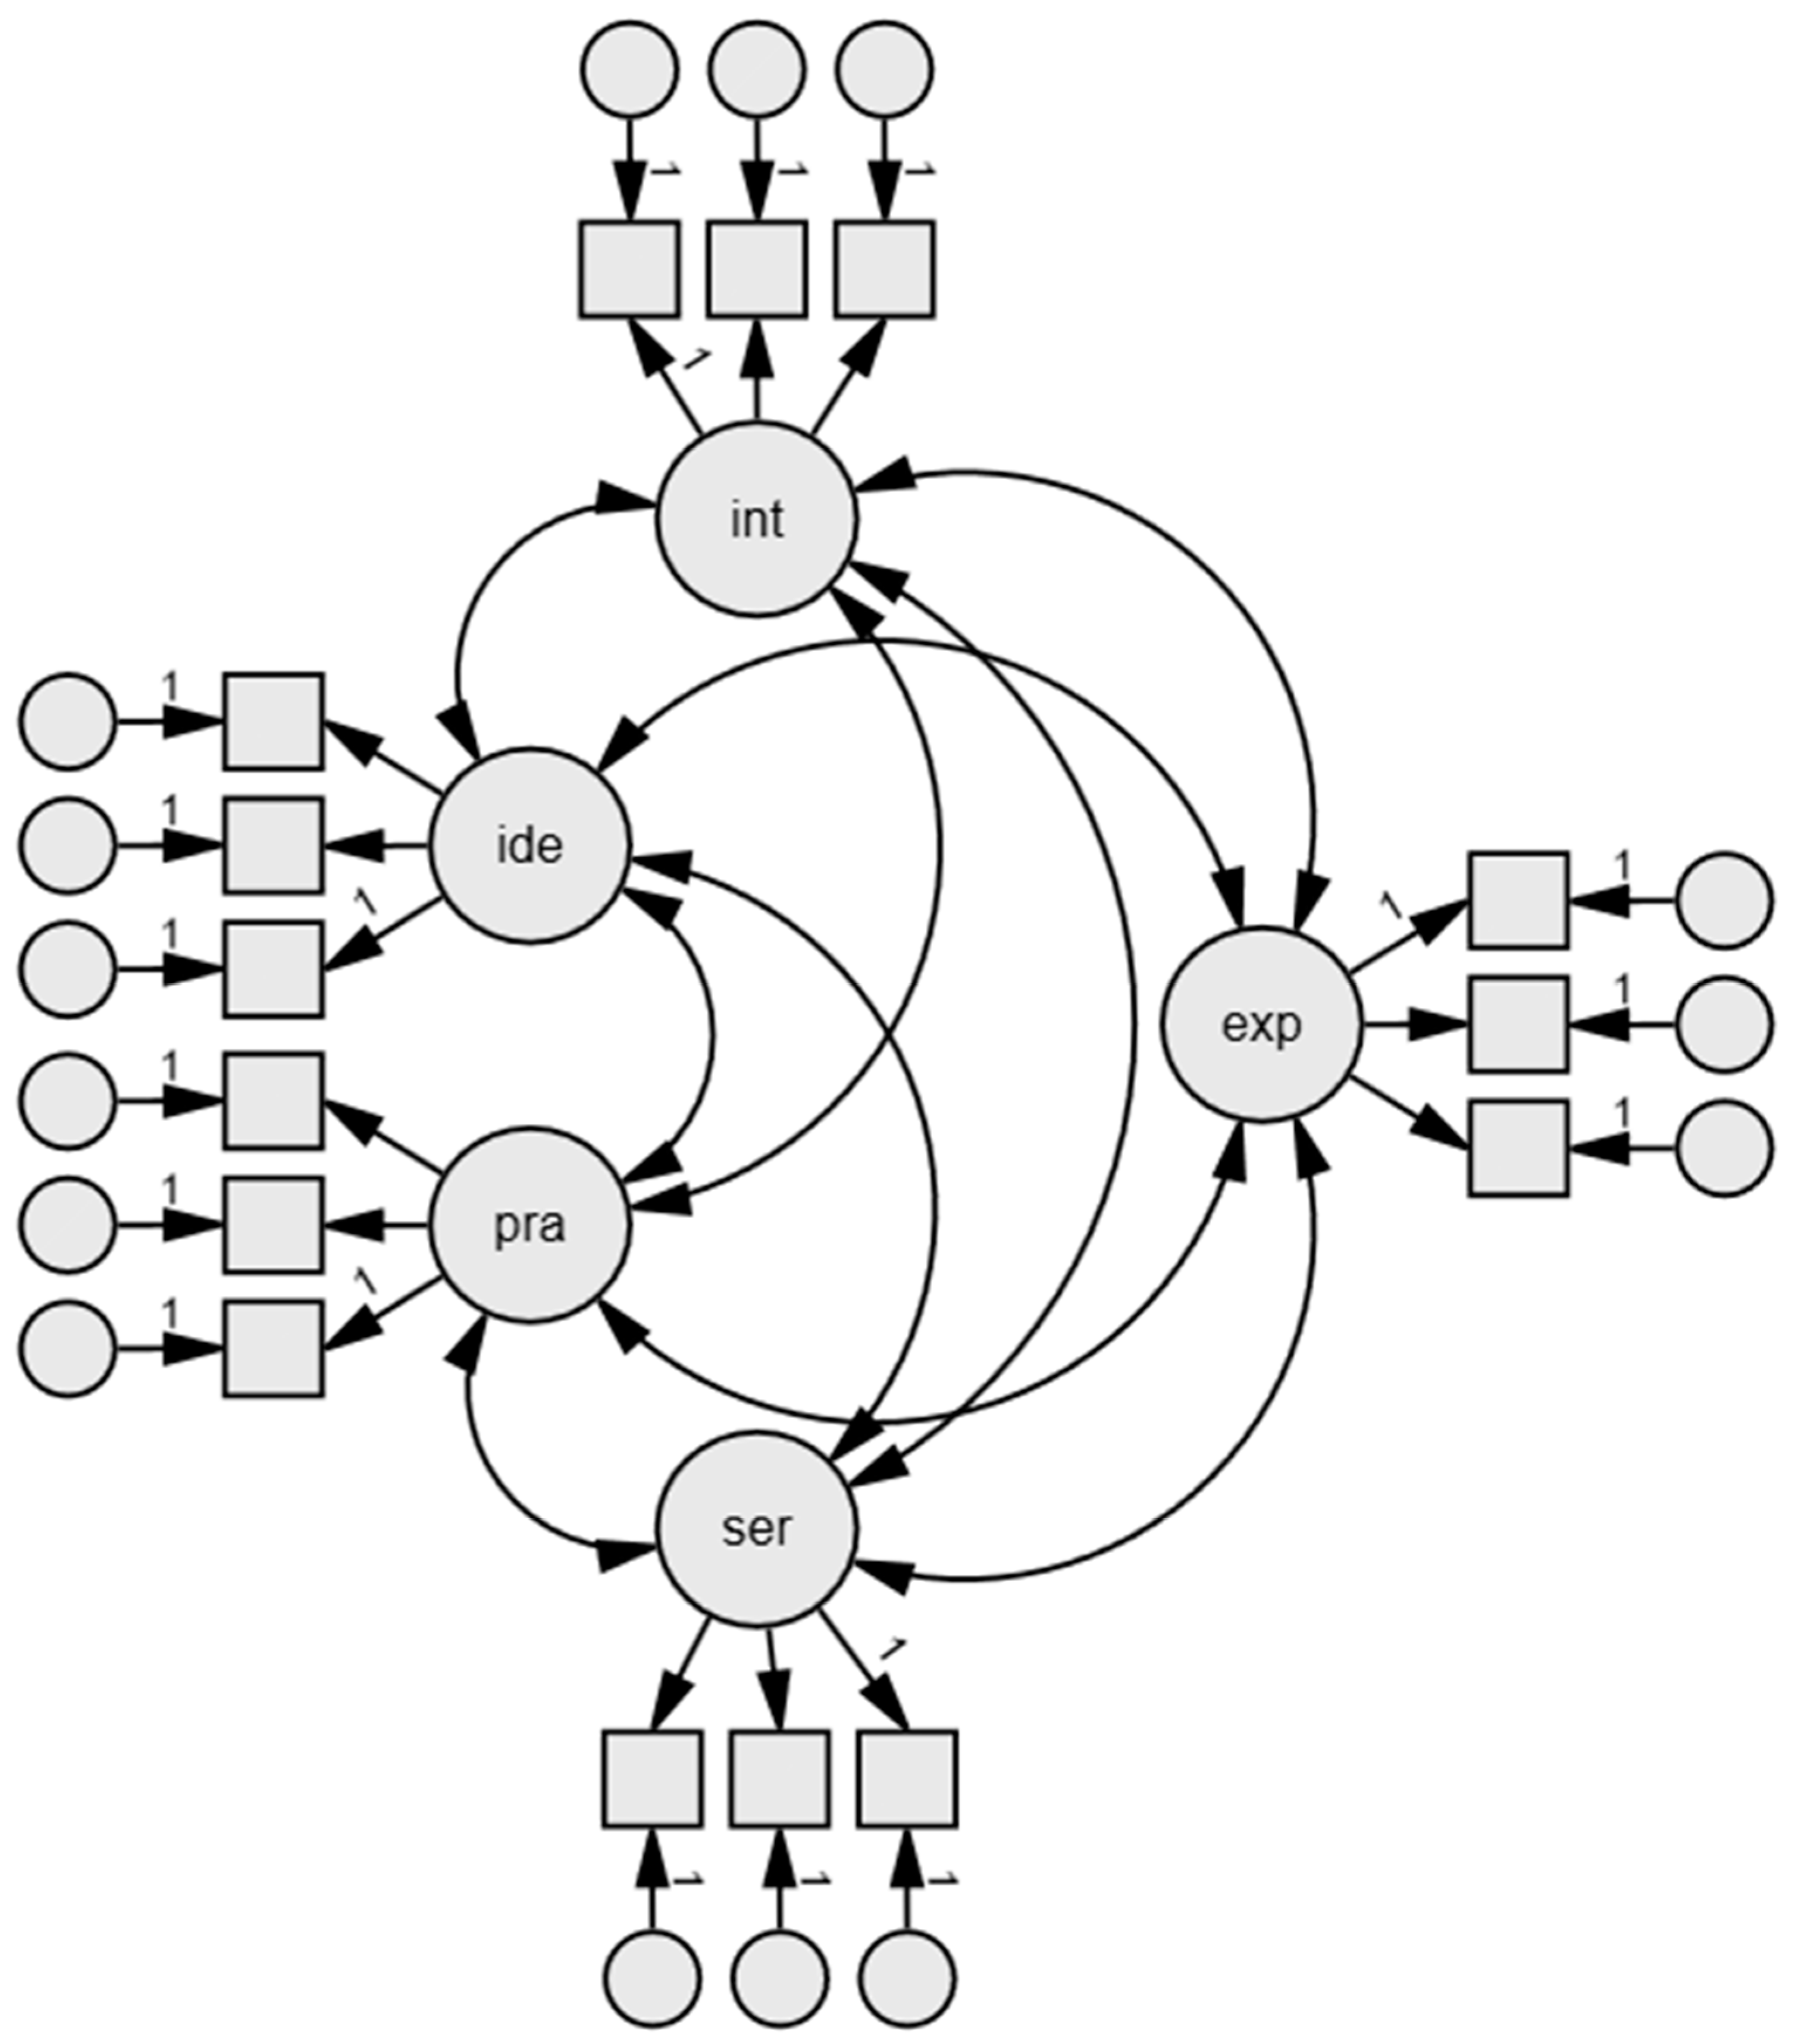
The most obvious and simplest even though not the most parsimonious latent structure of the CRS is given by a five-factor solution, where all the items of one dimension are explained by one latent variable and are correlated with each other (see
Figure 1 for the most advanced version, CRS-15). The most parsimonious version would be represented by five intercorrelated items with the CRS-5. This structure of correlated factors replicates the idea of relatively autonomous core dimensions of religiosity. It was introduced in 2003 and has been constantly and straightforwardly reproduced since then. Recently, two studies using translated versions of CRS-5 and CRS-10 in Brazil by Esperandio and colleagues (
Esperandio et al. 2019) and in Romania with CRS-15 by
Huza (
2019) confirmed this simple pattern yet again.
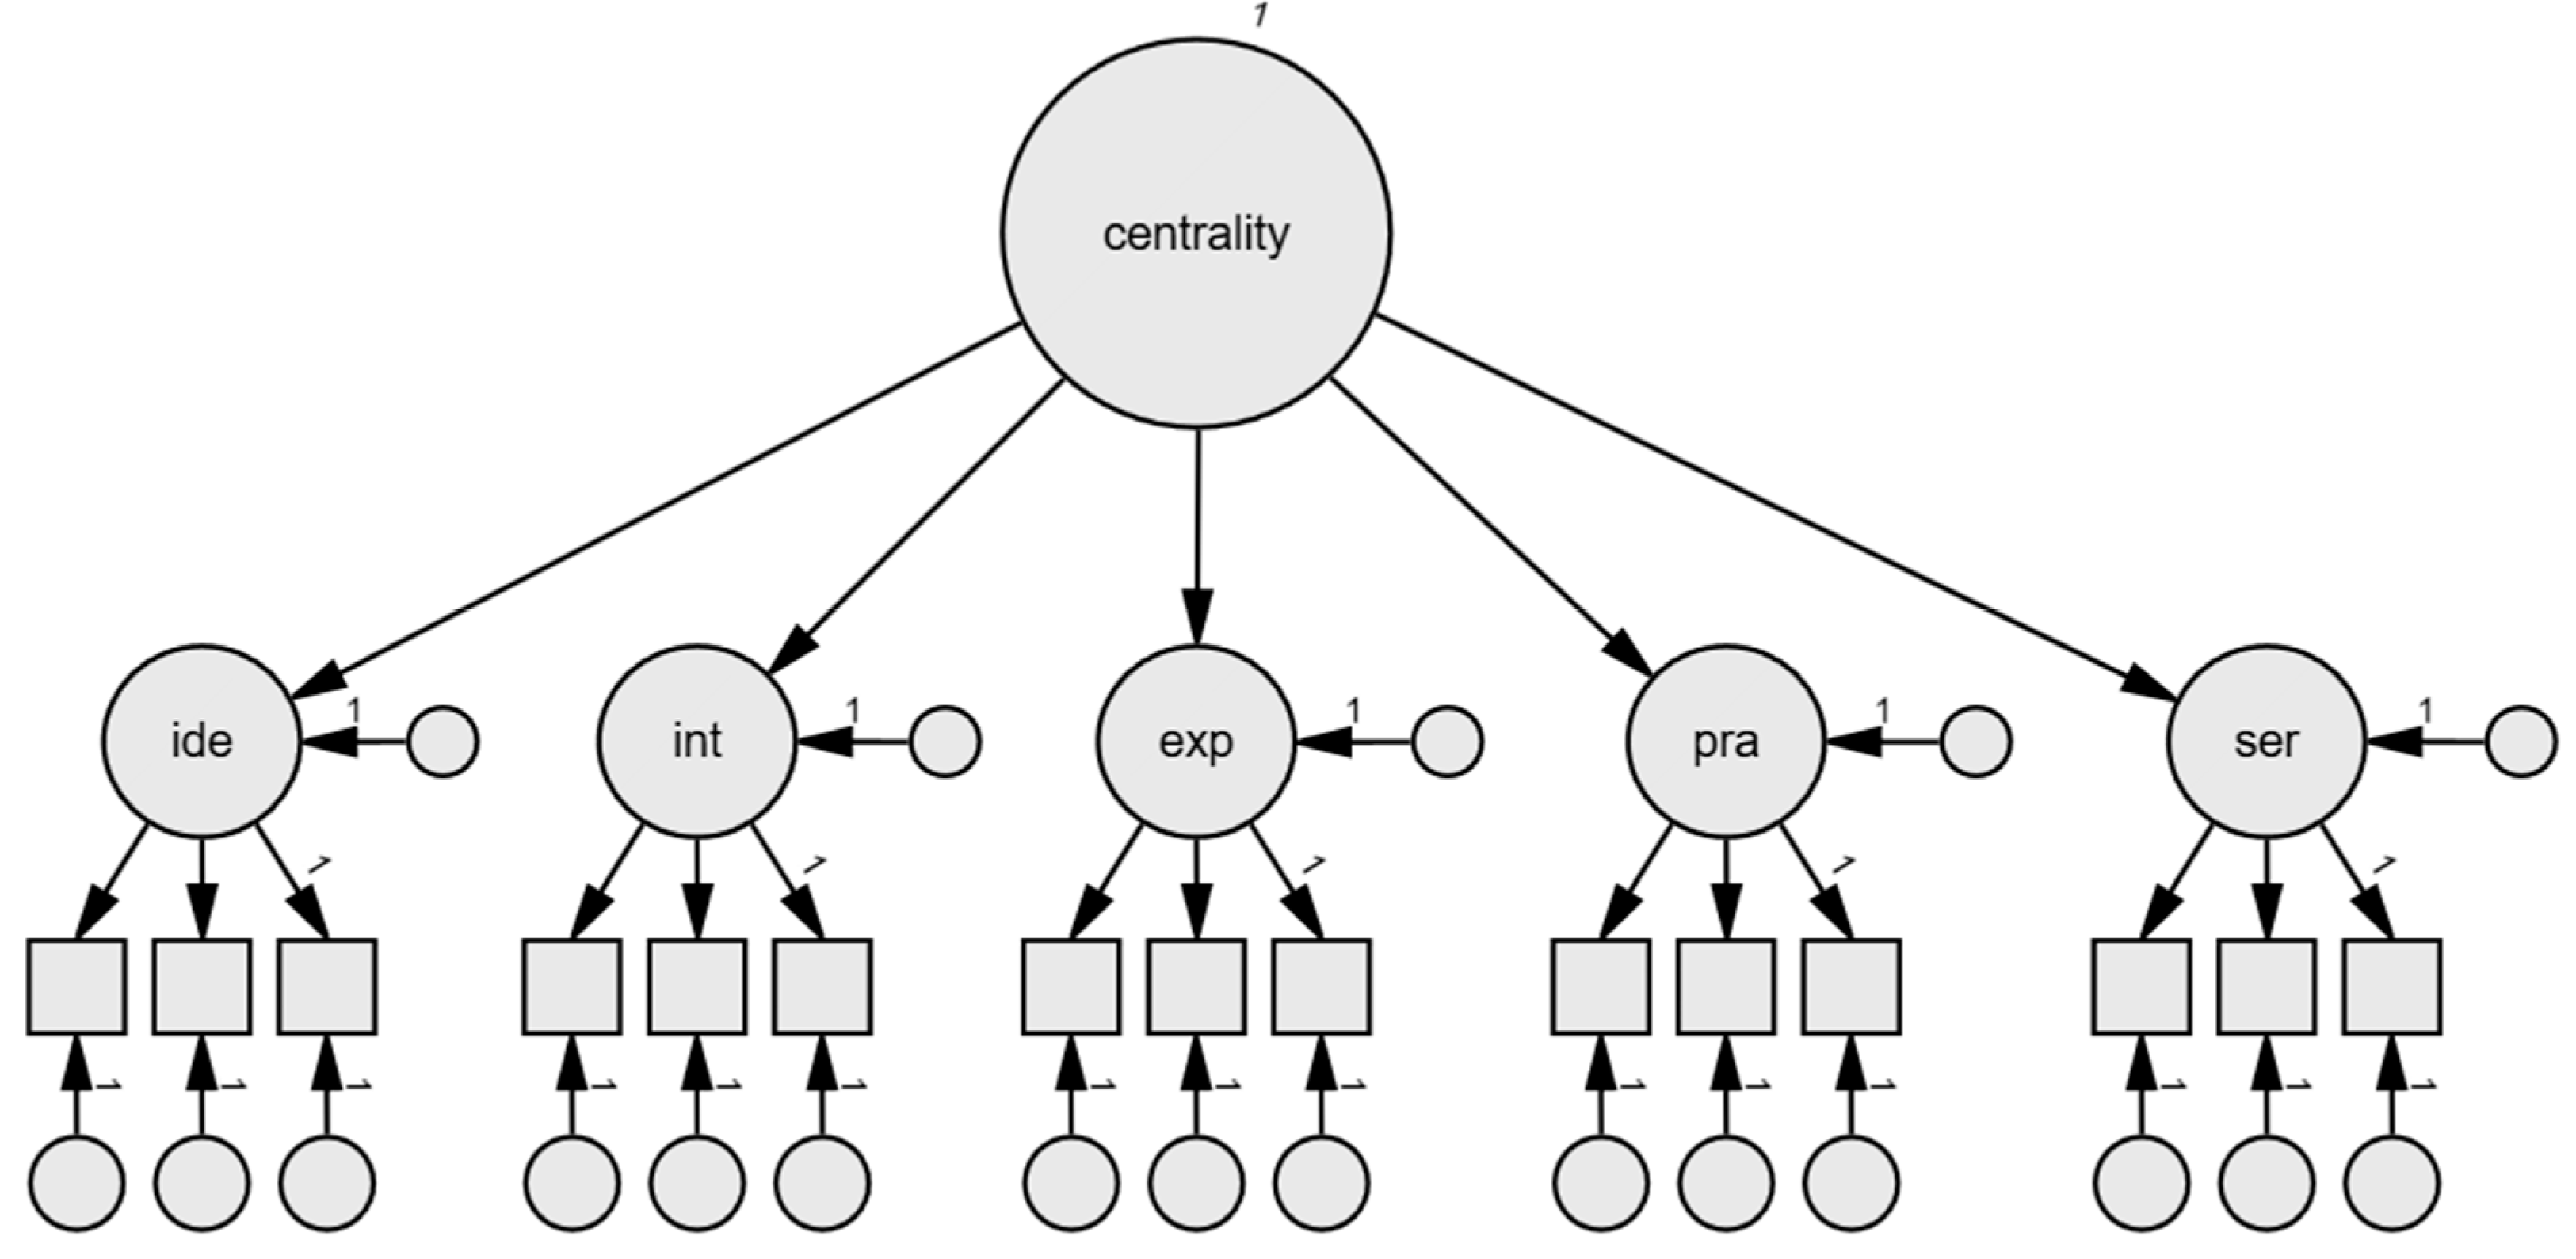
As elaborated by the author of the scale, the core dimensions contribute to a personal trait called Centrality of Religiosity. In other words, the five core dimensions form a common factor, which affects the behavior and experience of a human being in the realm of religion. In the statistical conceptualization, this means there is a second-order factor as depicted in
Figure 2. If the shortest version of the CRS is applied, the centrality is reflected through five items, one per core dimension. Thus, the second-order factor becomes a first-order factor. Between the two configurations from scattered stand-alone factors to the most centralized model with one second-level factor, different kinds of latent structures are imaginable. With this in mind, researchers looked at the latent structures alongside validations of the CRS in different languages and countries.
Even though in the mentioned study by
Huza (
2019), the researcher didn’t test for anything but the five-factor solution, in
Greece Fradelos et al. (
2018) conducted an exploratory factor analysis of the CRS-15 attempting a reduction of the dimensions and found two factors, which they called “religious practices” and “religious beliefs and experiences”. Religious practices as a factor is hereby formed by items from the private and public practice core dimensions. Religious beliefs and experience as a factor is formed by the remaining items from the core dimensions of ideology, intellect, and experience. Looking at the results of the most recent studies in Romania and Greece, which are largely orthodox countries like Georgia, one could question the solidity of the theoretical construct of centrality. The similarity in religious traditions leads to the research idea of testing for the factor structure of the CRS in the Georgian sample as a part of the linguistic validation. Even though the application of the shortest version of the CRS-5 and the CRSi-7 do not allow for a detailed examination of more than a one-factor solution, the temporal stability of such a model can be studied.
In this article, we omit the discussion of the theoretical plausibility of a “more-than-one-factor”-latent structure but rather inspect whether a one-factor solution can be reproduced in Georgian populational samples from the years 2012 and 2018. After establishing a measurement model, we further test for the scalar invariance of the model to examine the change in religiosity in the Christian orthodox population in Georgia from the years 2012 and 2018. If established, scalar invariance allows for a comparison of the factor loadings over time between showing their temporal change and reliability.
1.4. Goals and Hypotheses
Up till now the CRS has been well received by the research community, but there are some inconclusive finding regarding its construct validity and reliability in so-called non-western countries (cf. Table 5,
Huber and Huber 2012, p. 722). The Christian orthodox context of Georgia challenges the concept of Centrality of Religiosity that is why this article examines the question of construct validity and reliability of Centrality of Religiosity in this country among orthodox Christians. To be precise, a one-factor solution is expected to work with CRS-5 and CRSi-7.
The study is built around a twofold analytical objective of firstly testing construct validity and reliability of the CRS-5 over time in two representative population samples from the years 2012 and 2018 by confirmatory factor analysis. Both samples are hypothesized not to differ over time.
Secondly, CRSi-7 is expected to show a good global model fit with one factor and factor loadings different from zero, but to not differ substantially from the results of the CRS-5 model testing.
2. Method
2.1. Overview
Descriptive statistics are calculated for the distinct indicators and composite scores of the CRS-5 and the CRSi-7. For common reliability analyses of both short forms of the CRS, Cronbach’s are calculated separately for each sample. McDonald’s are presented as an alternative coefficient of assessing internal consistency of a scale. The viability of the CRS-5 is confirmed in the general population by comparing the two populational samples from 2012 and 2018 in a one-factor structure invariant model for CRS-5. This model is consequently tested for measurement invariance over time on the level of factor loadings, indicator intercepts, and residual variances. Data only exist from one time point for the CRSi-7. Thus, no invariance testing is performed for this short version of the CRS. The CRSi-7 is tested for global model fit and local strains.
2.2. Translation
The CRS underwent the translation procedures twice. The CRS was developed in German (
Huber 2003), and the first officially validated and published version in English appeared in 2012 (
Huber and Huber 2012).
In 2012, a Georgian research team developed the Georgian short versions (CRS-5 and CRSi-7) of the CRS in collaboration with the original author, thus the order of translation was English–Georgian and then the back-translation of Georgian–German. The translation was assessed and accepted by the author of the scale.
In 2018, as the possibility of the translation of all versions of the CRS (CRS-5, CRSi-7, CRS-10, CRSi-14, CRS-15, CRSi-20) was given, the Georgian team hired two professionals, the first for the English–Georgian, and the second for the Georgian–English back-translation. In 2018, the aim was to consult non-German-speaking experts in the field. The back-translations of all versions were accepted by experts in the field and by the author himself.
The translated Georgian items are presented side to side with the English originals in
Appendix A. Only the translations of the seven items of the CRSi-7, which includes the CRS-5 version, were empirically tested in the current study.
2.3. Samples
The CRS was applied in two samples in Georgia in the years 2012 and 2018. Both samples were collected in different projects but under the supervision of same principal investigators. Originally, both samples included respondents other than orthodox Christians. In 2012, any kind of religious affiliation was targeted. In 2018, because of language and organizational reasons, only Christian respondents were targeted in Georgian-speaking households during the sampling procedure. For unification reasons, respondents other than orthodox Christians were dropped from the analyses, as Christian orthodox formed the biggest overlapping respondent group. The sampling procedure is described in detail for each sample in the following paragraph. Characteristics of final samples are presented in
Table 2.
For the 2012 sample, we used data from a database of the GGS (Generations and Gender Survey, part of the international Generations and Gender Programme, coordinated by United Nations Economic Commission for Europe), from a representative longitudinal study in Georgia. Participants already took part in two waves in 2006 and 2009 but the CRS-5 was first administered in 2012. The GGS, as well as the present study, were conducted by the NGO Georgian Centre of Population Research (GCPR), directed by Ph.D. Irina Badurashvili. We randomly selected participants from three Georgian areas, Tbilisi (N = 1163), Imereti (N = 1116), and Mtskheta-Mtianeti (N = 74), in total N = 2353. Most of the respondents examined in the study belonged to the Georgian Orthodox Church (95.1%, N = 2238). The remaining 4.9% were broke down as follows: Armenian Gregorian 2.6%, other Christians 0.5%, Jewish 0.2%, Muslim 0.2%, Roman Catholic 0.1%, other religion 0.8%, non-religious 0.6%. Participants lived in urban (74.6% of the sample) as well as rural areas (25.4%). Women constituted 58.9% of the sample. The mean age was 46.38 years (SD = 18.63; range = 15 to 88).
In the 2018 sampling procedure, about 2000 households from 11 regions of Georgia were randomly chosen, applying a multistage stratified random sampling procedure based on a Georgian population census from 2014 (
Shavishvili 2016). For further statistical analyses the focus only lay on the population that was affiliated with the Orthodox church (87.8%)—in total
N = 1906 of the 2018 sample (rural area 38%; urban area 62%). The remaining 12.2% of the respondents were distributed as follows: Pentecostalism 5.4%, Protestantism 5.1%, no denomination 0.8%, Roman Catholic 0.7%, another denomination 0.2%. Among the 1906 participants, 55.5% were women and the mean age of the respondents was 48.5 years (
SD = 16.35; range = 18 to 89).
In both waves, all participants were informed about the goal and purpose of the study by an informed consent form, which they signed before entering the study. Participants who did not sign the informed consent form were excluded from the study. There were no specific inclusion criteria apart from being over 15 years old.
2.4. Procedure and Measures
Both translated short versions of the CRS were tested in a pilot study within a selection of 50 people to determine the clarity of the items. Respondents recommended changing the wording of the additional experience item in the CRSi-7. Adaptations were done according to the comments. The questions in both English and Georgian can be found in
Appendix A. Interviews were conducted with the CRS-5 in 2012 and with the CRSi-7 in 2018, therefore, the CRS-5 can also be derived from the data in 2018.
Interviewers visited the participants at their homes. Participants were interviewed face to face, answers were recorded on paper, only one respondent was taken per household according to the most recent birthday in the annual circulation.
The collected data was managed and analyzed with IBM SPSS® and AMOS® both version 26. Confirmatory Factor Analysis with the multigroup method was used to check for the reliability over time from 2012 to 2018 with the CRS-5. A CFA with one factor of Centrality of Religiosity was applied to the CRSi-7.
2.5. Analytic Plan
2.5.1. Exploratory Factor Analysis
An Exploratory Factor Analysis (EFA) was performed with both samples to check for the resemblance with the original model by
Huber (
2003). For factor extraction, a maximum likelihood extraction with varimax rotation method was applied to look for common variance. The decision on the number of factors was done according to the eigenvalue criteria >1. If only one factor would be extracted, rotation would not be applied.
2.5.2. Confirmatory Factor Analysis
The confirmatory factor analysis (CFA), in contrast to EFA, was applied in this study to test a specific hypothesis about statistical invariance and compare the one-factor latent structure over time.
The starting point of the confirmatory analysis are the EFAs. The EFAs indicate a one-factor solution (see Table 6) but with the results of studies by
Fradelos et al. (
2018) and
Huza (
2019) in mind, we further checked the associations of the core dimensions. The correlation matrix shows the proximity of the three core dimensions—intellect, experience, and ideology—as well as the two core dimensions of private and public practice (see Table 4). Thus, the pattern of private and public practice suggests being condensed into “religious practice” (RP) and the grouping of intellect, experience, and ideology can be named “religious beliefs and experience” (RBE) borrowing the designations from
Fradelos et al. (
2018). To model this specific pattern with five indicators and one factor we allow the private practice and public practice core dimensions to covariate freely in the structure. Consequently, the hypothesized structure is a one-factor solution with centrality as a unifying construct and five indicators of intellect, ideology, experience, private practice, and public practice, with linked residuals between the two indicators of private practice and public practice. The maximum likelihood (ML) method is used in the estimation with variance–covariance matrices as data input throughout the analysis. Taking the suggestions of
Hu and Bentler (
1999) acceptable fit of the models is stated by following criteria:
RMSEA (≤0.06, 90%
CI ≤ 0.06,
pclose > 0.05),
SRMR (≤0.08),
CFI (≥0.95), and
TLI (≥0.95). The named indices provide information on different aspects of the model (i.e., absolute fit, fit adjusted for model parsimony, fit relative to a null model). Altogether, these indices offer a more conservative and reliable evaluation of the solution. For the distinct parameter estimates, modification indices bigger than 4.00 (i.e., expected parameter change
) are considered as a point of model discussion. The modification indices are considered as a model comparison with 1 degree of freedom and a critical
p < 0.05 where
suggest that the overall model fit can be significantly improved, if the fixed or constrained parameter is freely estimated. We round up to 4.00 for practical reasons.
Throughout the text, parameter estimates are designated in Greek letters: —factor loading, —intercept of the indicator, —factor mean, —factor variance, —with one-digit subscript designates variance of residual, —with two digits subscript designates covariance of residuals. Parameter estimates for intellect receive the subscript x1, for ideology x2, for experience x3, for private practice x4, and for public practice x5.
2.5.3. Multigroup-CFA
The populational samples do not constitute a test-retest sample. Therefore, we conduct a test of the invariance using a multigroup analysis. The one-factor model of centrality was tested for structural (equal form), scalar (equal factor loadings) and metric (equal indicator intercepts and equal residual variance) invariance as nested models. Parameters of metric invariance are hereby nested within the scalar parameters and the parameters of scalar invariance are nested within the structural invariance respectively. For the model identification in the invariance testing condition, the variances of the latent variable of centrality are fixed to and the means are set to . For the estimation of the mean difference in a second step, the mean for the 2012 group is set to be the reference with and the mean of 2018’s group is unconstrained.
Multivariate normal distribution of the indicators is a critical condition to get non-biased parameter estimates in SEM. Visual inspection suggests close to normal distributions of the indicators. We still decided to apply a bootstrapping procedure with 200 drawings to get bias-corrected 95% confidence intervals for the parameter estimates. We think of the bootstrapping as reasonable with given data to correct for the standard error bias within the Maximum Likelihood estimation with close-to-normal distributed data.
As the CRSi-7 was not applied in 2012, no multigroup analysis is run for this short version. Instead, we test a one-factor model with two changes in the indicators of experience and private practice. In both, the maximum answer value of the main and the additional questions are conveyed into the analysis. Two possible points of difference, i.e., religious experience and private practice between CRS-5 and CRSi-7 are compared.
4. Discussion
This paper presents three main results: firstly, two statistically validated, short versions of the scale (CRS-5 and CRSi-7) in the religious and cultural context of Georgia; secondly, an investigation of the latent structure of the five dimensions of the CRS by Confirmatory Factor Analysis based on samples from 2012 and 2018 that are representative for the Christian orthodox population of Georgia; thirdly, the norm values of both scales for future research.
4.1. Validation in the Context of Georgia
As mentioned in the introduction, Georgia, with its long-lasting Christian roots, has some particularities to be considered, e.g., the interwovenness of religion and national identity, high trust in religious institutions and their role in the everyday life of people and, therefore, their extension from macro to micro levels of society. Even if not discussed in detail, in this study these facts solidify the assessment of religiosity as a key construct in social scientific research in Georgia.
Generally, the Centrality of Religiosity can be straightforwardly assessed in Georgia with both the CRS-5 and the CRSi-7. The scales’ internal consistencies, according to Cronbach’s show acceptable to good values, with the lowest value = 0.67 and the highest = 0.73. Only in the sample from 2018, Cronbach’s drops lower than = 0.70—i.e., = 0.67—in both short versions of the CRS. Therefore, we advocate for using longer versions of the CRS, or considering training for interviewers if applicable. Both steps heighten the probability of better data quality. Additionally, as no data were collected with the CRS-10, the CRS-15, the CRSi-14 or the CRSi-20, it would be a desirable next step to statistically validate their translation into Georgian.
If considered in detail, in the samples, the correlations of the indicators of the CRS range between
r = 0.20 and
r = 0.58 (cf.
Table 4 and
Table 5). These values evidence the operational expectancy that the core dimensions are moderately linked and have enough common variance. At the same time, correlations show that they are not too close to each other to consider one or more core dimensions to be redundant. This finding was mirrored in the CFA. Each of the five dimensions substantially contributes to the latent variable of centrality in both samples (2012 and 2018). In this regard Georgia has a comparable outcome to many of the countries of the Religion Monitor organized by the German Bertelsmann Foundation. Therefore, the researchers can run studies in Georgia with the CRS and draw conclusions on international analyses.
Through an inspection of correlations, two sub-clusters of religiosity can be recognized but not reconstructed via statistical methods in this study. One of them is religious beliefs and experience (intellect, ideology, and experience) and the other is religious behavior (private practice and public practice). Both assumed factors collapse into the factor of Centrality of Religiosity, as is shown by the EFAs. Further exploration of this issue can be undertaken by using a longer version of the CRS in research if desired. More on this topic will follow in the discussion of confirmatory factor analysis.
Even though no distinct behavioral factor shows up in the analysis, one particularity of Georgian believers has to be seriously considered. Especially in Georgia, people use churches and chapels in their everyday faith life as a place to stay shortly, pray and continue their daily businesses. This custom leads to proximity of the church environment and private religious practice. Thus, personal religious activity becomes mixed with the communal religious sphere. Believers may report their private religious habits in public places according to social desirability. A possible explanation is that—being activated in the semantical net—both private and public practice may be subject to conformity under the overarching idea of national identity. Such an influence gives rise to biased survey data. Interviewer effects can amplify the bias. Considering possible sources of data distortion and incompleteness, the differentiated measurement of religiosity should be multidimensional as claimed for more than half a century by the proposition of
Glock and Stark (
1966), and re-established by
Huber (
2003). Hence, we argue in favor of an extensive measurement. Saving time should not be a reason for incompletely constructed assessments. The short forms of the CRS were validated to save time in the first place. One major point stands out. If researches rely for example on the frequency of church attendance and private practice in Georgia, they make use of the weakest predictors according to the results in this study. To sum up briefly, an underestimation of Centrality of Religiosity—e.g., looking at the frequency of church attendance or prayer—would lead to inaccurate results in any domain of scientific investigation related to religion in Georgia.
Another major advantage of samples, like in this study, is their coverage of the majority of the population. The results of this study can be used as rough populational norms in Georgia. In combination with the reliability analyses and the result of longitudinal stability of the scale’s statistical coefficients (cf.
Table 3,
Table 4 and
Table 5) provide a basis for further investigations in Georgia and for international comparisons. A minor concern is that the data in this study consists solely of the Orthodox majority of Georgia despite its religious plurality.
4.2. CRS Reliability
Analysis of the longitudinal stability of the measurement of centrality by CRS-5 shows that over a period of 6 years between 2012 and 2018, the scale is a consistent instrument. CRSi-7 has comparable model fit indices and parameter estimates. In general, both short versions provide evidence for the construct of Centrality of Religiosity with some minor cutbacks on behavioral indicators. We review the results in detail for each scale.
4.2.1. CRS-5
The widely known Cronbach’s shows the viability of the CRS in an unpretentious way; however, it has widely known limitations. Reflecting on the model implications of Cronbach’s —especially its —equivalence and requirement of uncorrelated error variances models in this study have to be evaluated in a different way. Samples from 2012 and 2018 do not contain the same participants. Thus, models with invariance constraints on different levels are calculated for reliability tests. Corrected for the measurement error in the CFA, the CRS-5 demonstrates high credibility by longitudinal invariance over 6 years. This means that the concept of Centrality of Religiosity is a reliable psychological construct.
Considered more closely, the final model with equality on factor loadings, indicator intercepts, indicator variances, and residual variances in 2012 and 2018, has its strengths and weaknesses. Based on EFAs that yield, in both samples, an overall satisfactory solution with only one factor with an eigenvalue higher than 1. The CFA verifies this factor as the assumed Centrality of Religiosity. The global fit indices for the estimation are acceptable at a conventional level allowing the interpretation of the individual parameters.
First, an argument for the residual covariation of the indicators of prayer and church attendance is presented. Ideally, there would be no need to let the residuals covariate, but we see this as well-founded in a one-factor model, where residual variances do not only consist of measurement error. The relatively high variances of the residuals of prayer and church attendance demonstrate that. Thus, we preserve the model with constrained residual variances that corroborates the covariance of residuals being stable at a over time. The second argument is on the factor loadings. Any of the factor loadings have at least a salient presence in the manifest variables. For intellect, ideology, and experience the factor loadings can be interpreted as simple regression coefficients with medium to strong effect sizes (rs ranging from to ), explaining a substantial part of religious beliefs and experience systematically (s ranging from 0.47 to 0.58). Particularly, experience shows its driving force for the Centrality of Religiosity in the Georgian context. No less than experience, cognitive occupation and relation with transcendence also contribute to the Centrality of Religiosity.
For the frequency of private and public practice, the factor loadings show relatively low values and , respectively (their s range from to ). Their validity still stays unquestioned but is belittled in the light of the other three indicators. Further investigations may use the longer CRS versions to establish a measurement model which has more indicators per core dimension. For thorough and detailed investigations, the CRS-15 and CRSi-20 are recommended. Then, the clusters of religious belief and experience and religious behavior will be reproduced by covariations between the latent variables of each core dimension. The same recommendations can be derived for the predictive power of the CRS. Longer versions consider more aspects of behavior than just frequency, i.e., importance and connectedness.
The reported indicator intercepts are conservative—in other words, more precise—mean estimations of each of the items of the core dimensions as they are corrected for the measurement error. Combined with the found latent mean difference of we can conclude a small increase in the mean of Centrality of Religiosity in Georgia from 2012 to 2018. If needed, increases in each core dimension can be calculated separately by multiplying the factor loadings with the latent mean change and adding the product on the values of the 2012 indicator intercepts. With the established model, we can see that changes in intellect, ideology and experience are slightly underestimated, whereas changes in private and public practice are slightly overestimated by the composite scores: intellect , ideology , experience , private practice , public practice . We do not consider these changes as substantial enough to discuss, but the amplitude of differences can quickly change according to the groups being analyzed; thus, practical implications of a substantial change are a desirable next step in further investigations. A third representative sample with a comparable sample size—around 2000 participants—in Georgia with an adequate time gap (e.g., starting from 2024) would allow for further investigations of scale reliability of the CRS-5 and the first invariance testing of the CRSi-7.
4.2.2. CRSi-7
The CRSi-7 was examined differently than the CRS-5. Because of a lacking second time point of assessment, no invariance test could be run. Despite this fact, the interreligious short version demonstrates comparable results as its shorter Abrahamitic equivalent. The two potential points of difference between the two scales are the core dimensions of experience and private practice. CRSi-7 offers the participants two additional questions. Before the analysis, both core dimensions receive the maximum value. The maximum is calculated from the items asking about the frequency of prayer or meditation. The same pattern applies for the item of religious experience asking about dialogic (God’s intervention in one’s life) or participative (connectedness with everything) familiarity. Following this logic, both dimensions should have higher factor loadings. A comparison of the parameter estimates shows that the estimation for the core dimension of experience in the CRS-5 fall within the 95% CI of the estimator in CRSi-7 and vice versa. While the core dimension of private practice is at the upper bound (superscript ub) of the confidence interval in the CRSi-7, it touches the lower bound (superscript lb) of the CI in CRS-5 (). The CIs of the covariance between the residuum of private and public practice overlap as well. The same can be said about the remaining factor loadings in the models. Thus, we can conclude that the CRSi-7 yields comparable results to the CRS-5 in the sample from 2018. One should not lose sight of one thing; the sample solely consists of orthodox Christians and practices such as meditation or an experience of being one with everything are not typical for this religious tradition. Our hypothesis on the equality of the result of both CRS version in this sample is confirmed.
4.3. Relation of the CRS-5 and the CRSi-7
Even though not mentioned explicitly as a study goal, the comparison of both scales is of interest. Considering the uniform Christian orthodox sample, it is not surprising to find both scales perform similarly in the statistical analyses. Means of the composite scores in 2018 almost do not differ—with CRS-5 with , and CRSi-7 with . Cronbach’s are identical . The correlations between the core dimensions for the CRS-5 and CRSi-7 do not differ by greater than 0.01; no favorable direction can be identified thus it seems to have a random character. In the EFA, CRSi-7 captures a little, but not substantial, more variance——in the data than CRS-5, at . In the end, CFA showed that both scales are comparable in the Christian orthodox context of Georgia—see the discussion of CRSi-7 in the preceding paragraph. There seems to be no advantage of an interreligious version; therefore, for study economy, CRS-5 should be applied in dominantly Abrahamitic contexts.


