1. Research Background
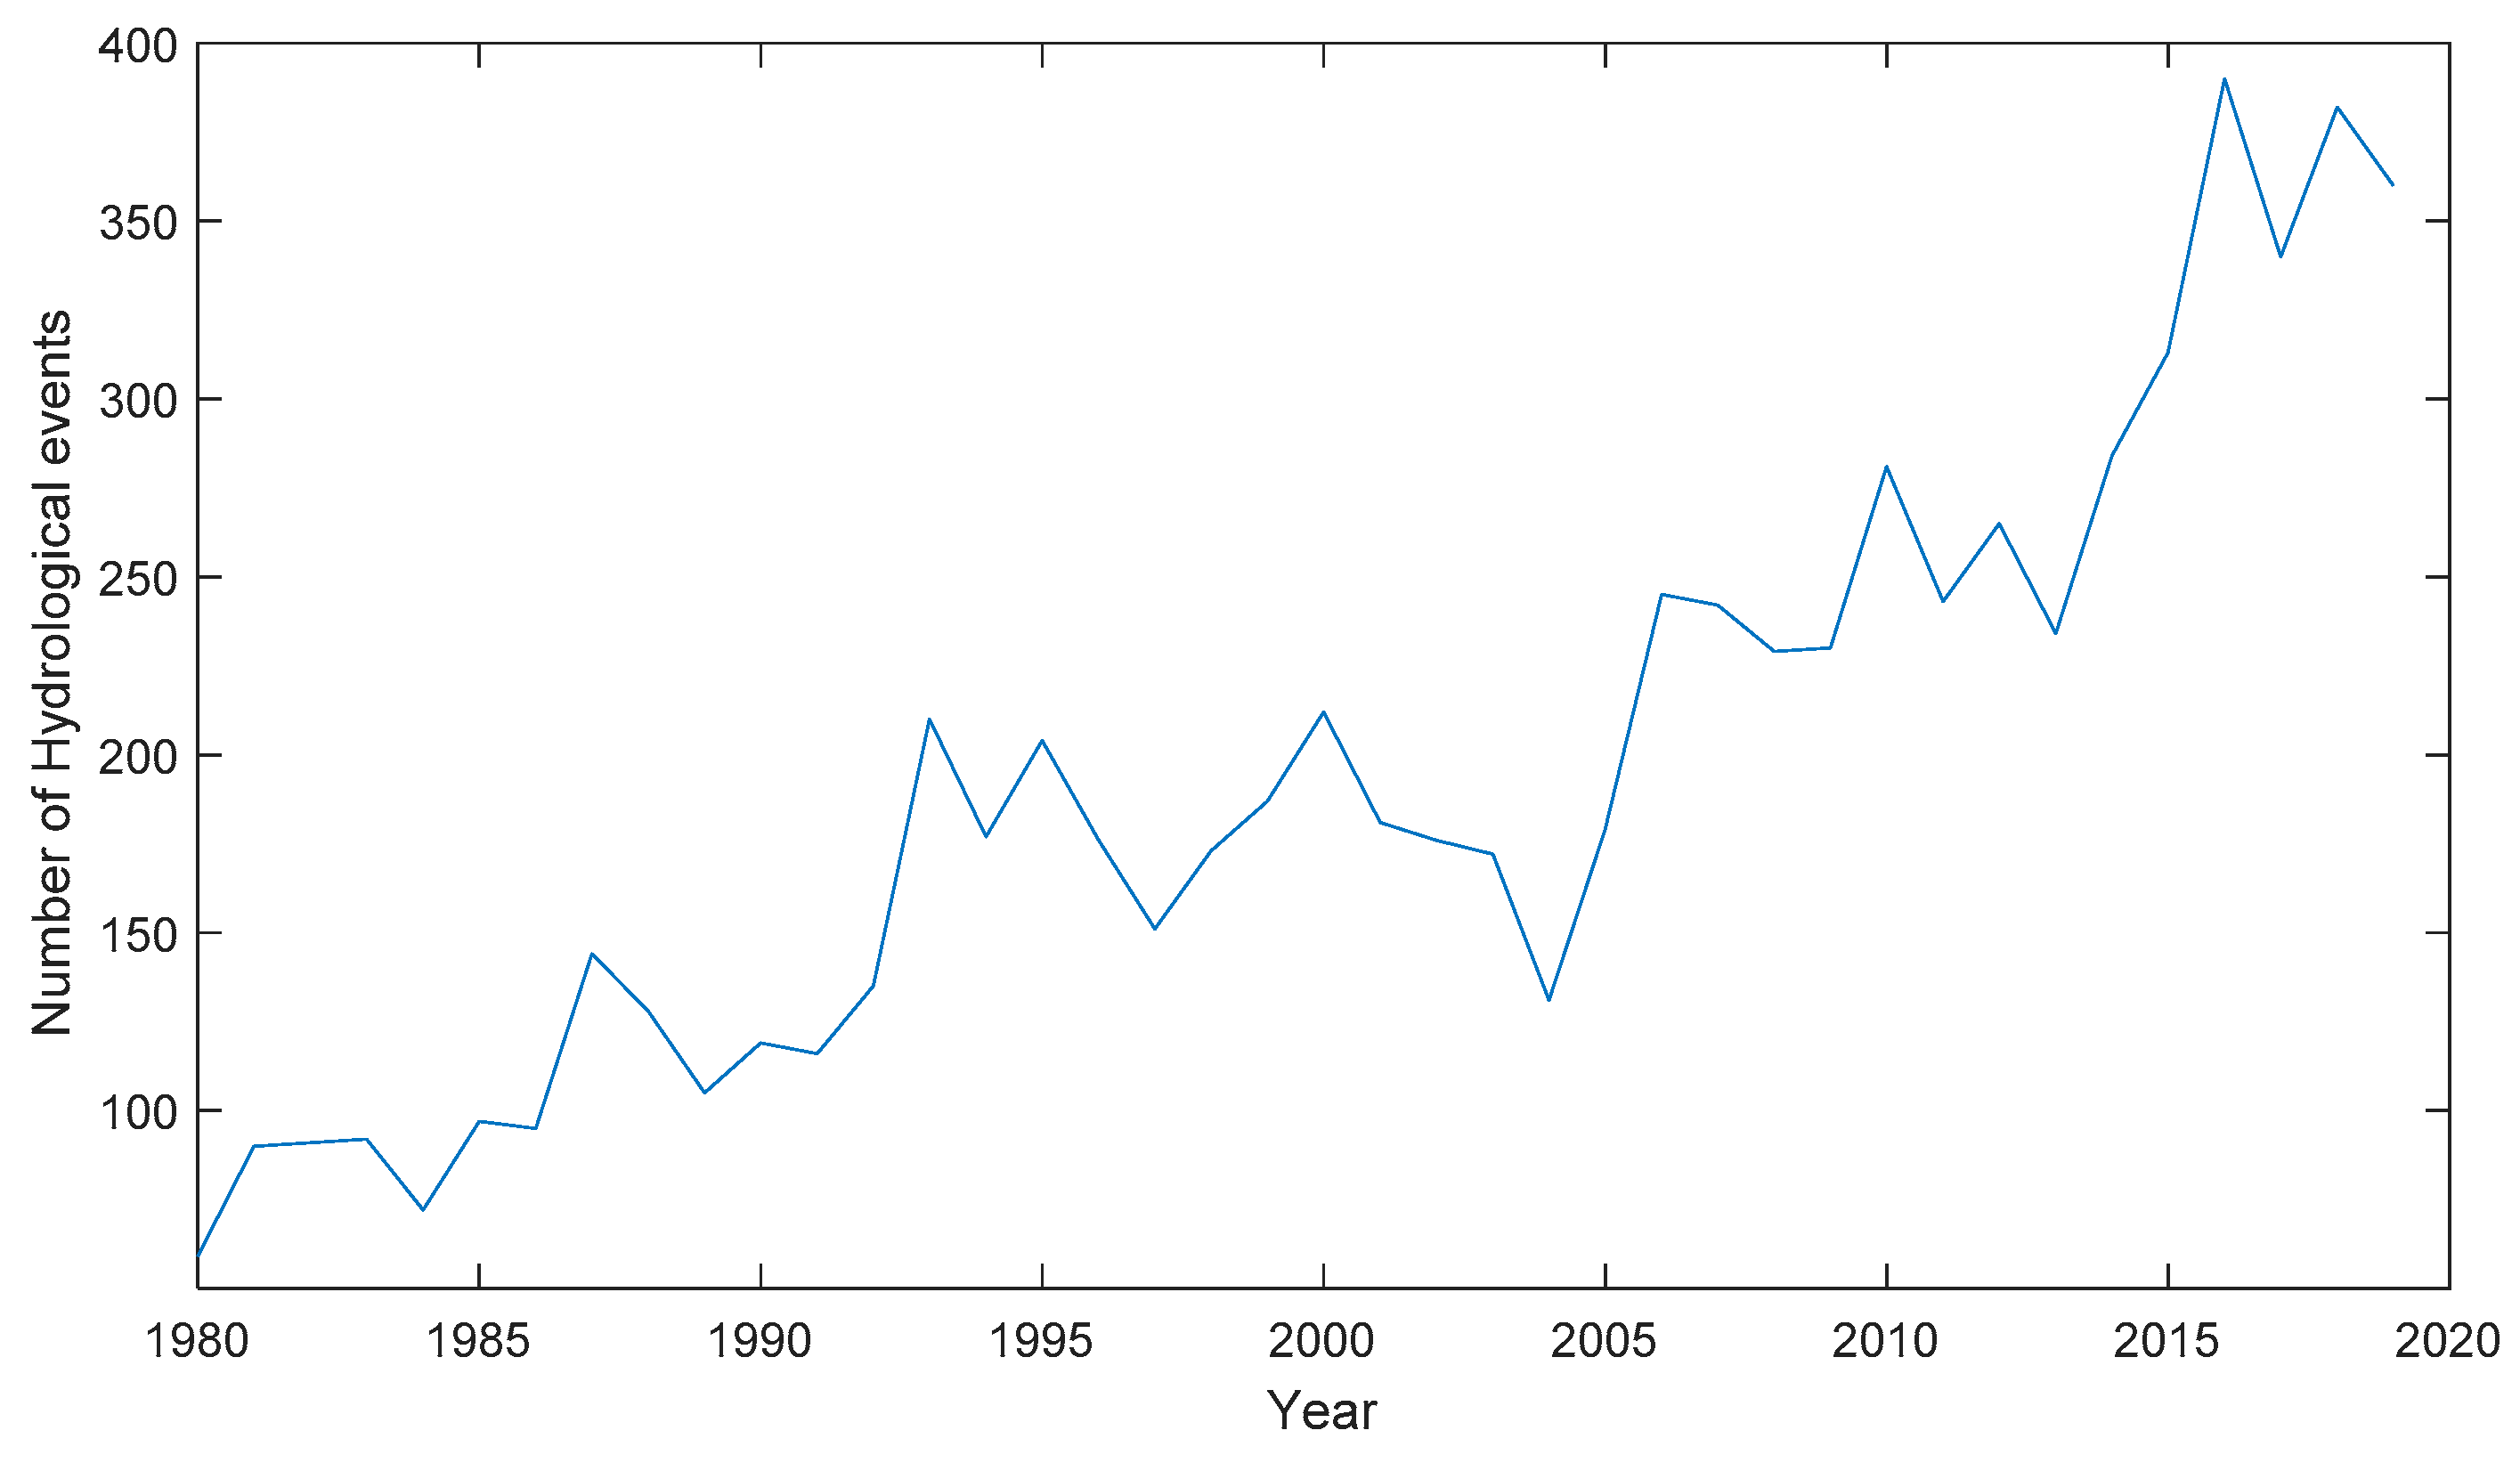
Globally, typhoons (hurricanes) are one of the natural disasters that have caused the greatest losses to human society. With global warming, the frequency of strong typhoons (hurricanes) is increasing, and hydrological events (including rainfall, runoff, evaporation, flood, drought, tide, storm surge, huge wave) caused by typhoons are more serious and frequent than ever (see
Figure 1), which has attracted the close attention of scholars in related fields [
1,
2,
3]. Typhoon Hato brought a Class 10 gale to Hong Kong on 23 August 2017, causing economic losses of USD 1.02 billion and injuring nearly 100 people. Typhoon “Mangkhut” landed in Hong Kong in the early morning of 16 September 2018, injuring more than 200 people and causing huge economic and property losses [
4]. In 2019, the global wind king hurricane “Dorian” landed in the Bahamas on 1 September and brought a catastrophic storm surge to Grand Bahama Island on 2 September, killing at least 50 people and destroying tens of thousands of houses in the Bahamas. The economic loss exceeded seven billion USD [
5]. According to the statistics of the Munich Re Group disaster database, in the six years from 2013 to 2018, 36,200 deaths were caused by global hydrological events with an economic loss of 213 billion USD, of which catastrophic hydrologic events accounted for about 56% [
6]. In all catastrophic hydrological events, storm surges and huge waves caused by typhoons have severely threatened the survival and development of humankind with their frequent occurrences and formidable destructive power [
7,
8,
9]. Establishing projects, such as wave and flood prevention seawalls, is an effective way to prevent the destruction of offshore constructions caused by typhoons (hurricanes) from marine dynamic environmental factors (wind, waves, etc.), as well as to reduce the casualties and losses caused by typhoon surge disasters. One of the key technologies for preventing extreme sea conditions while establishing wave and flood prevention seawalls is to reasonably determine the fortification standards. For this reason, it is very important to consider the statistical characteristics of typhoons in time and construct a typhoon-influenced design wave height estimation model that can reflect the characteristics of both time and space factors.
Design wave height is an important part of the calculation of seawall height in the coastal protection, mitigation, and prevention of typhoon surge disasters [
10,
11,
12]. For marine engineering to prevent typhoon storm surge disasters, it is of great significance to reasonably and accurately determine the multi-year distribution law of the wave height in the typhoon-affected area and obtain the design value of the corresponding wave return level. In the early design wave height estimation models, marine environmental factors, such as wave height and water level, were simply regarded as random variables for extreme probability analysis. Young et al. analyzed >20 years of global altimeter data, subdivided into four years, and used a Gumbel distribution to analyze the extreme value of each time period [
13]. Wang Liping used Gumbel, Weibull, and Pearson-III distributions to analyze the measured wave height data of Binhai Nuclear Power Station from 1963 to 1989 and obtained the multi-year wave height values of the area under three methods [
14]. Under several regional wave climatic conditions of the east and west coast of the United States, Neary et al. used the two common extreme value analysis models from the Gumbel distribution of the annual extreme value method (AM) and the generalized Pareto distribution (GPD) of the peak over threshold (POT) method to do the analysis on the extreme sea conditions characterized by wave conditions from the third-generation spectral wave model. By using quantile-quantile plots to determine the threshold for GPD distribution fitting is indeed a great method to avoid user deviation [
15,
16]. Clayton et al. proposed a change method for regional frequency analysis. Based on the POT method, the threshold value was selected as the 98th percentile of the wave height, and GPD was used for data fitting; through this, he analyzed the extreme waves on the Pacific coast of Canada [
17]. S. CAIRES and A. STERL, based on the European Center for Medium-Range Weather Forecasts (ECMWF) 40-yr Re-Analysis (ERA-40) data, used the POT method to estimate the global wind speed and a hundred-year return level of effective wave height. The 93 and 97 percentiles of the data were selected as the thresholds, and the exponential and GPD distributions were compared. The results showed that the exponential distribution could better fit the existing data [
18]. Mazas et al. studied the method of determining extreme wave height through GPD modeling and showed that a higher threshold would improve the rationality of model extrapolation [
19]. It is appropriate to select a threshold as large as possible and directly model the extreme tail values, but GPD cannot fit the peak and right tail of over the threshold distribution at the same time, which limits GPD’s analysis ability on the overall sample distribution. Simultaneously, the determination of the threshold value is also a difficult task, and artificially selecting a threshold on the fixed percentile of the data is a relatively crude method, which is easily affected by human bias. With the deepening of the research, Liu Defu and Ma Fengshi put forward the compound extreme value distribution theory, which is suitable for the typhoon-affected sea area, extends the one-dimensional compound extreme value distribution to multi-dimensional space [
20,
21,
22,
23,
24], and has been widely used in engineering. Dong Sheng et al. proposed a Poisson two-dimensional Gumbel logistic distribution model and applied it to the probability and statistical analysis of typhoon surge [
25]. The above methods for estimating the design wave height assume that the typhoon wave height data conforms to a certain distribution pattern and use the existing observation data to estimate the parameters in the distribution function. Most of the selected distribution functions can pass the test, but the results of different models are quite distinctive from each other. In 1957, Jaynes proposed the principle of maximum entropy [
26]. The essence of maximum entropy is to constrain the known information while maintaining the maximum uncertainty of the unknown information. To a certain extent, it can avoid the influence of a priori and human factors when analyzing the probabilistic characteristics of marine environmental elements such as wave heights. In the 1990s, Xu Delun and others proposed the Maximum-entropy distribution to reduce the a priori factors in estimating marine environmental design parameters [
27]. Wang Liping and others combined the compound extreme value theory and the principle of maximum entropy and proposed a new model of design wave height estimation [
28]. Liu Guilin et al. derived the joint maximum entropy distribution function of wave height and wave period with the help of the structure of the Copula function to calculate the wave height return level [
29]. Following in-depth research, scholars have proposed a multi-dimensional composite maximum entropy model for the joint design of multiple marine environmental elements [
30,
31,
32] so that the calculation results are more in line with the actual engineering and natural state.
The above design wave height estimation model, whether it is an extreme value distribution, compound extreme value distribution, one-dimensional, or multi-dimensional, they all use typhoon frequency and wave height as random variables to solve the return period level. In fact, marine environmental factors such as typhoon frequency and wave height are essentially stochastic processes, which are constantly changing through time. Treating them as stochastic processes, we establish models and analyze dynamic characteristics changing through time. Thus, we can more accurately describe the state of the project and the natural state of the marine environment elements, such as typhoon wave height, to make the return level typhoon wave height calculation more in line with engineering requirements. To analyze typhoon wave height distributions, carry out more accurate and effective storm surge disaster prevention, and improve defense projects in coastal engineering, we use stochastic process theory to study the internal mechanisms and statistical distributions of typhoon wave heights, analyze typhoon intensity and typhoon-affected wave height distributions at different times, reflect internal statistical characteristics at a deeper level, and select appropriate distribution functions; all the while avoiding subjective interference of artificially selected distribution functions.
In this paper, based on the Maximum Entropy Principle, no other restrictive assumptions about wave height are made, thus avoiding the a priori factors of the assumed distribution function. At the same time, based on the stochastic process theory and the principle of maximum entropy, this paper uses a cluster of random variables instead of a limited number of random variables to study the statistical characteristics of typhoon wave heights and a new model of typhoon influence wave height distribution is constructed, which reflects the characteristics of time and space. We analyze the probability of typhoon frequency in different time periods and the wave height distribution law under its influence and show that the features of design wave height in temporal and spatial dimensions (while covering the compound extreme value distribution model) that has been widely used and overcomes the subjective interference of artificially selected distribution functions. Based on the Naozhou typhoon and wave height data, this paper provides a model for calculating the return level of typhoon wave heights considering time, with an in-depth analysis of the probability of typhoon occurrence in different seasons and months. It also provides the distribution of design wave heights under the influence of typhoons and calculates the needed height of seawalls in coastal protection projects in typhoon-prone areas. Through these methods, we present more effective and accurate design parameter guidance for preventing and resisting typhoon surge disasters.
2. Model Construction
In order to consider the changes in typhoon wave height in time and space, this paper adds the time factor on the basis of the traditional model, using a random process to construct a time-varying typhoon frequency probability model and design wave height distribution pattern under the influence of typhoon to describe frequency and wave height in more detail.
Theorem 1. Setto wave height at time , for wave height at time , abbreviated as .,represents, respectively, its distribution function and probability density function. Supposeis expressed as the occurrence of typhoon k within the time period of , the value is non-negative and independent of the wave height, which is simply written as, its probability distribution law at time is: The general formula of the typhoon wave height distribution function based on the stochastic process is:
Particularly, when the frequency of typhoon occurrence
assumes the Poisson process with
, and wave height
, taking the maximum entropy distribution, (2) becomes:
where
is the number of typhoons, and
are the parameters given by the constraints and boundary conditions.
Proof. According to engineering practicality, the frequency of typhoon occurrence has the following statistical characteristics:
(1) The probability of occurrence of more than one typhoon in a sufficiently small time interval is very small, and the frequency of typhoon occurrence takes a non-negative integer value, with .
(2) The number of occurrences of typhoons in any two non-overlapping time intervals is independent of each other, if , then , is the number of occurrences in the time period .
(3) The number of typhoon occurrence times within the time is only related to the length of the time interval , and is independent to the time . is the continuous step function on the right for . □
It can be seen from the above statistical properties that the number of typhoon occurrences in a certain period of time is a counting process, assuming it takes the Poisson process with , represents the average number of typhoon occurrences within the time .
Recorded
as the distribution function of the wave height at the moment of
under the influence of the typhoon, then:
in which:
Assuming
, and set the first data in the data column to be the largest, then:
in which:
is the indicative function on
A.
When the frequency of the typhoon
takes the Poisson process with parameter
, the distribution function is
Suppose the wave height
conforms to the maximum entropy distribution [
27], and its probability density function is:
The corresponding distribution function is:
Wherein
,
,
,
are the parameters given by the constraints and boundary conditions. Under given constraint conditions Euler equations are used [
33]. Substituting Equations (8) and (10) into Equation (2), we get:
End of theorem proof.
In practical applications, let:
where
, and
are the design frequency. Return period may be expressed as:
Through Formulas (11)–(13), the design value of wave height under the influence of typhoons at any time in different return periods can be calculated.


