
The Effects of Tidal Translation on Wave and Current Dynamics on a Barred Macrotidal Beach, Northern France


Abstract
1. Introduction
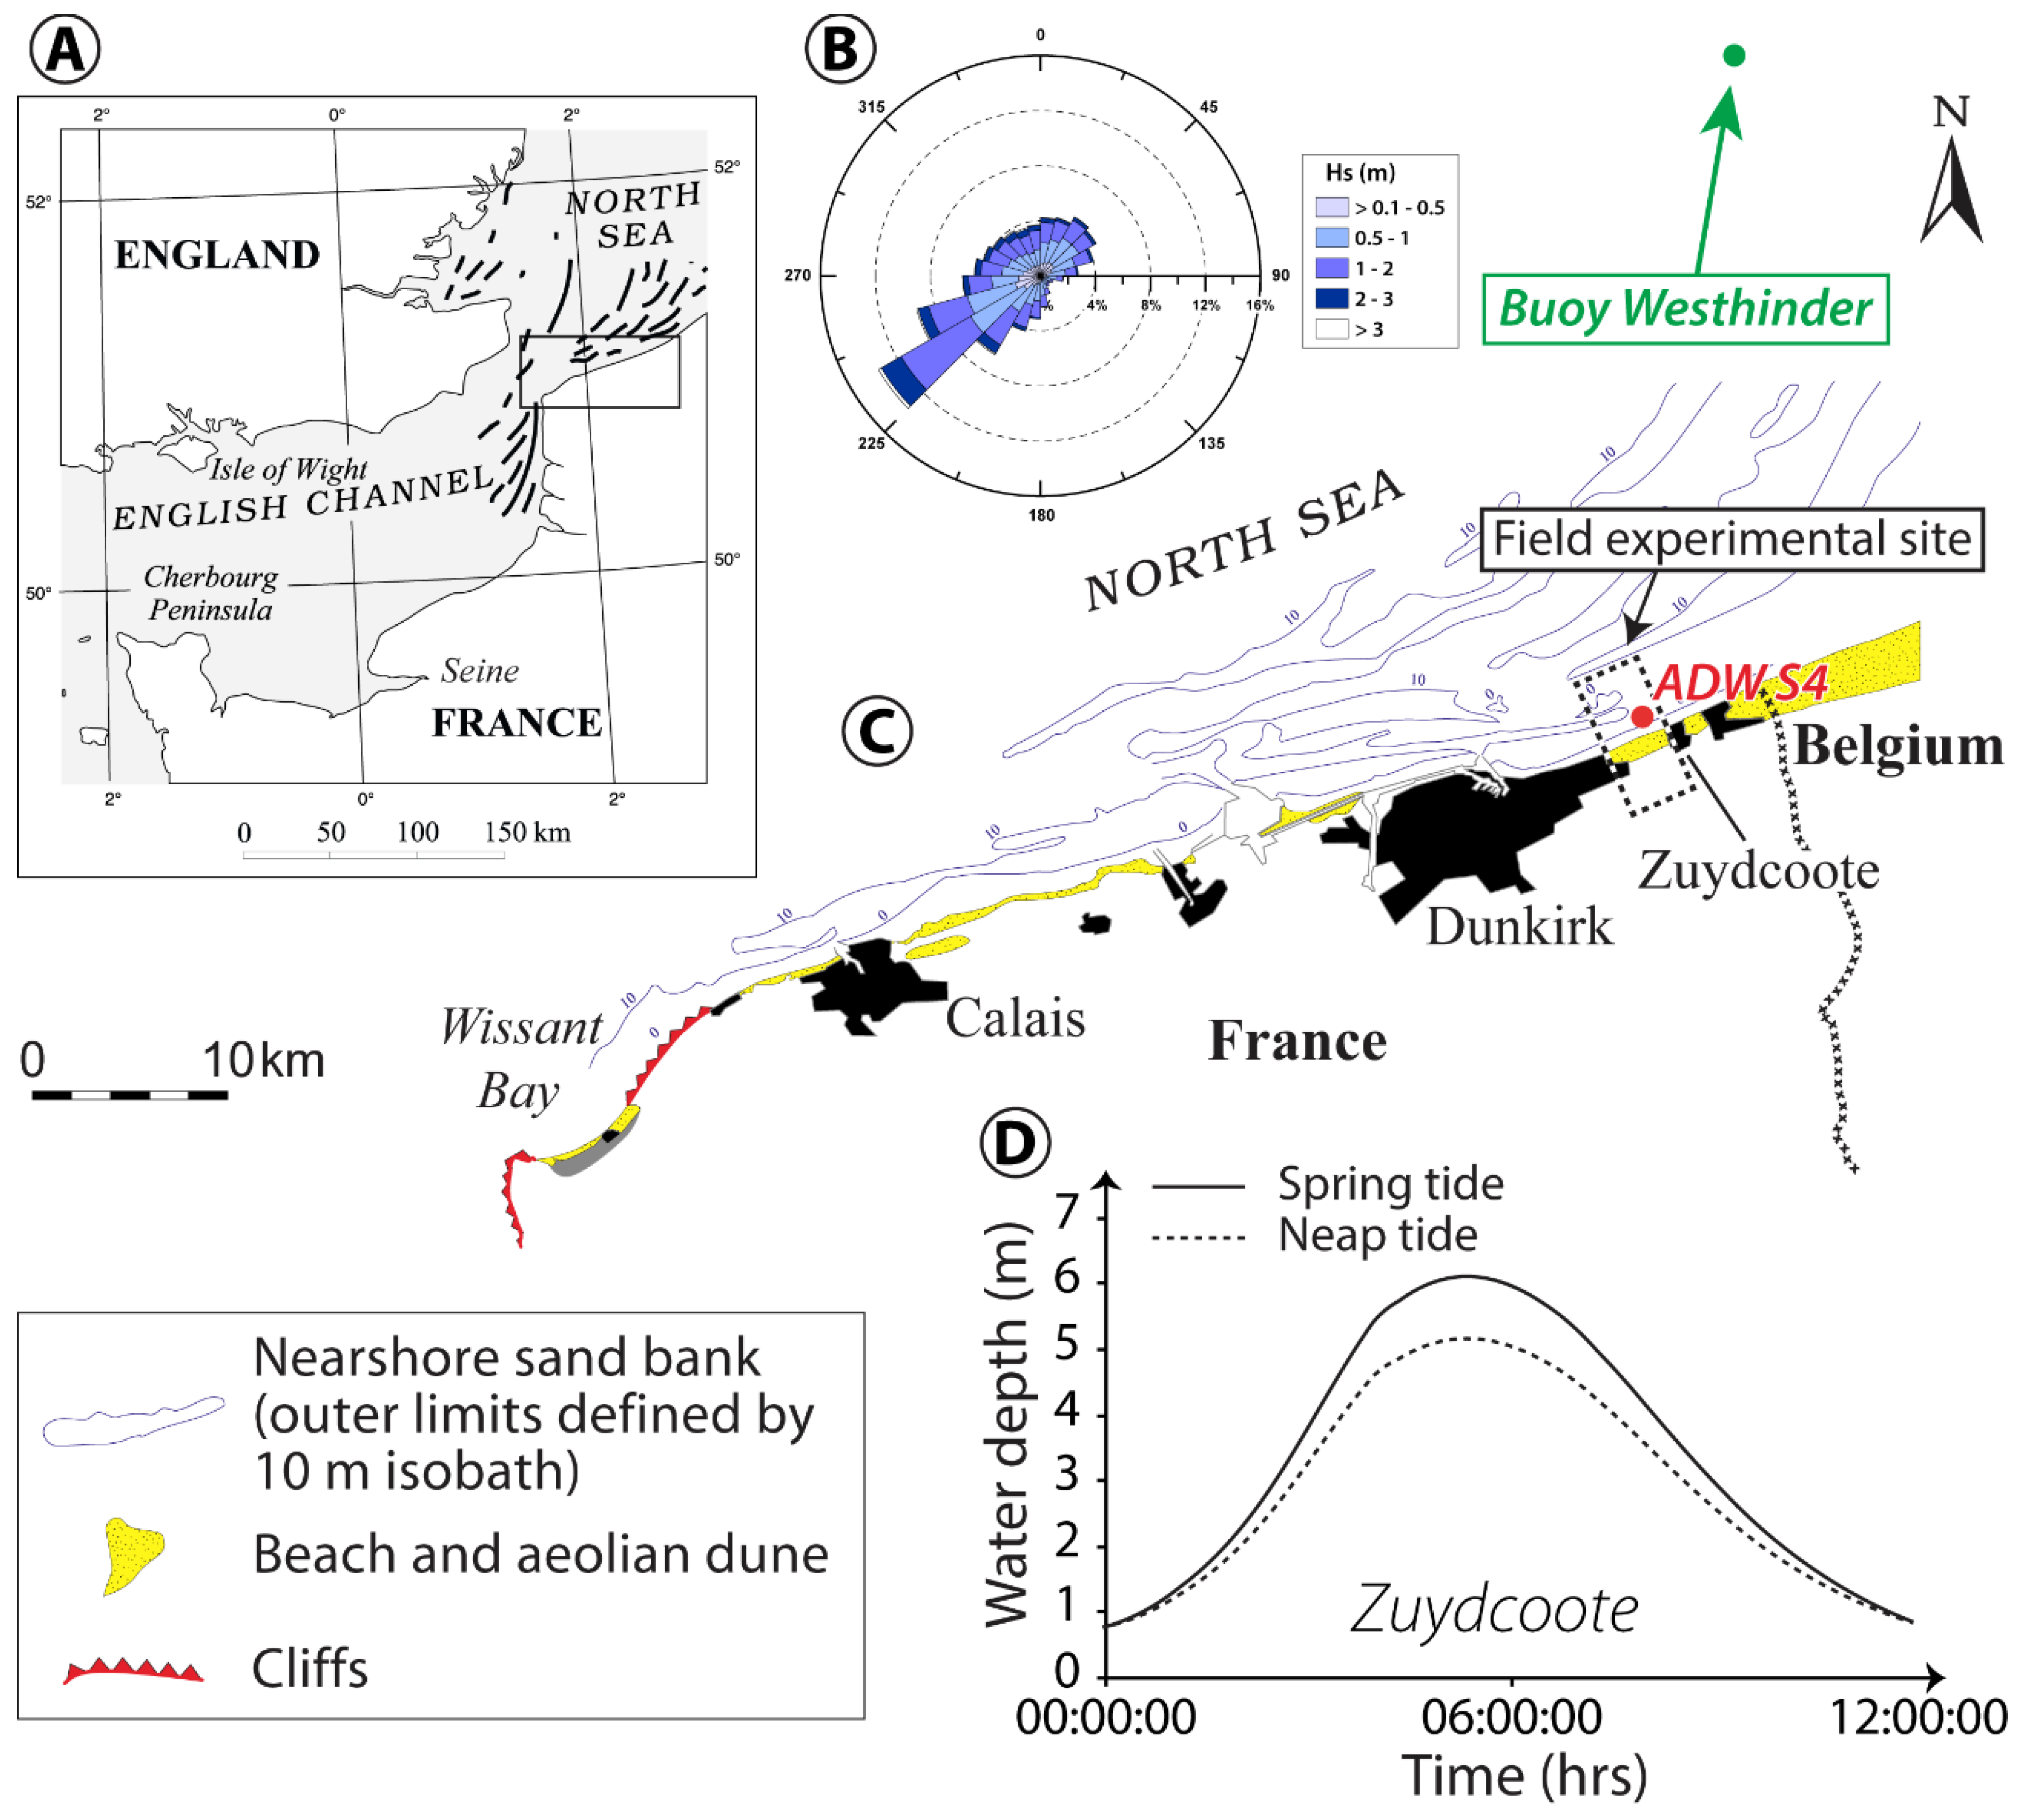
2. Study Area
3. Materials and Methods
3.1. Hydrodynamics
3.2. Video Imagery
4. Results
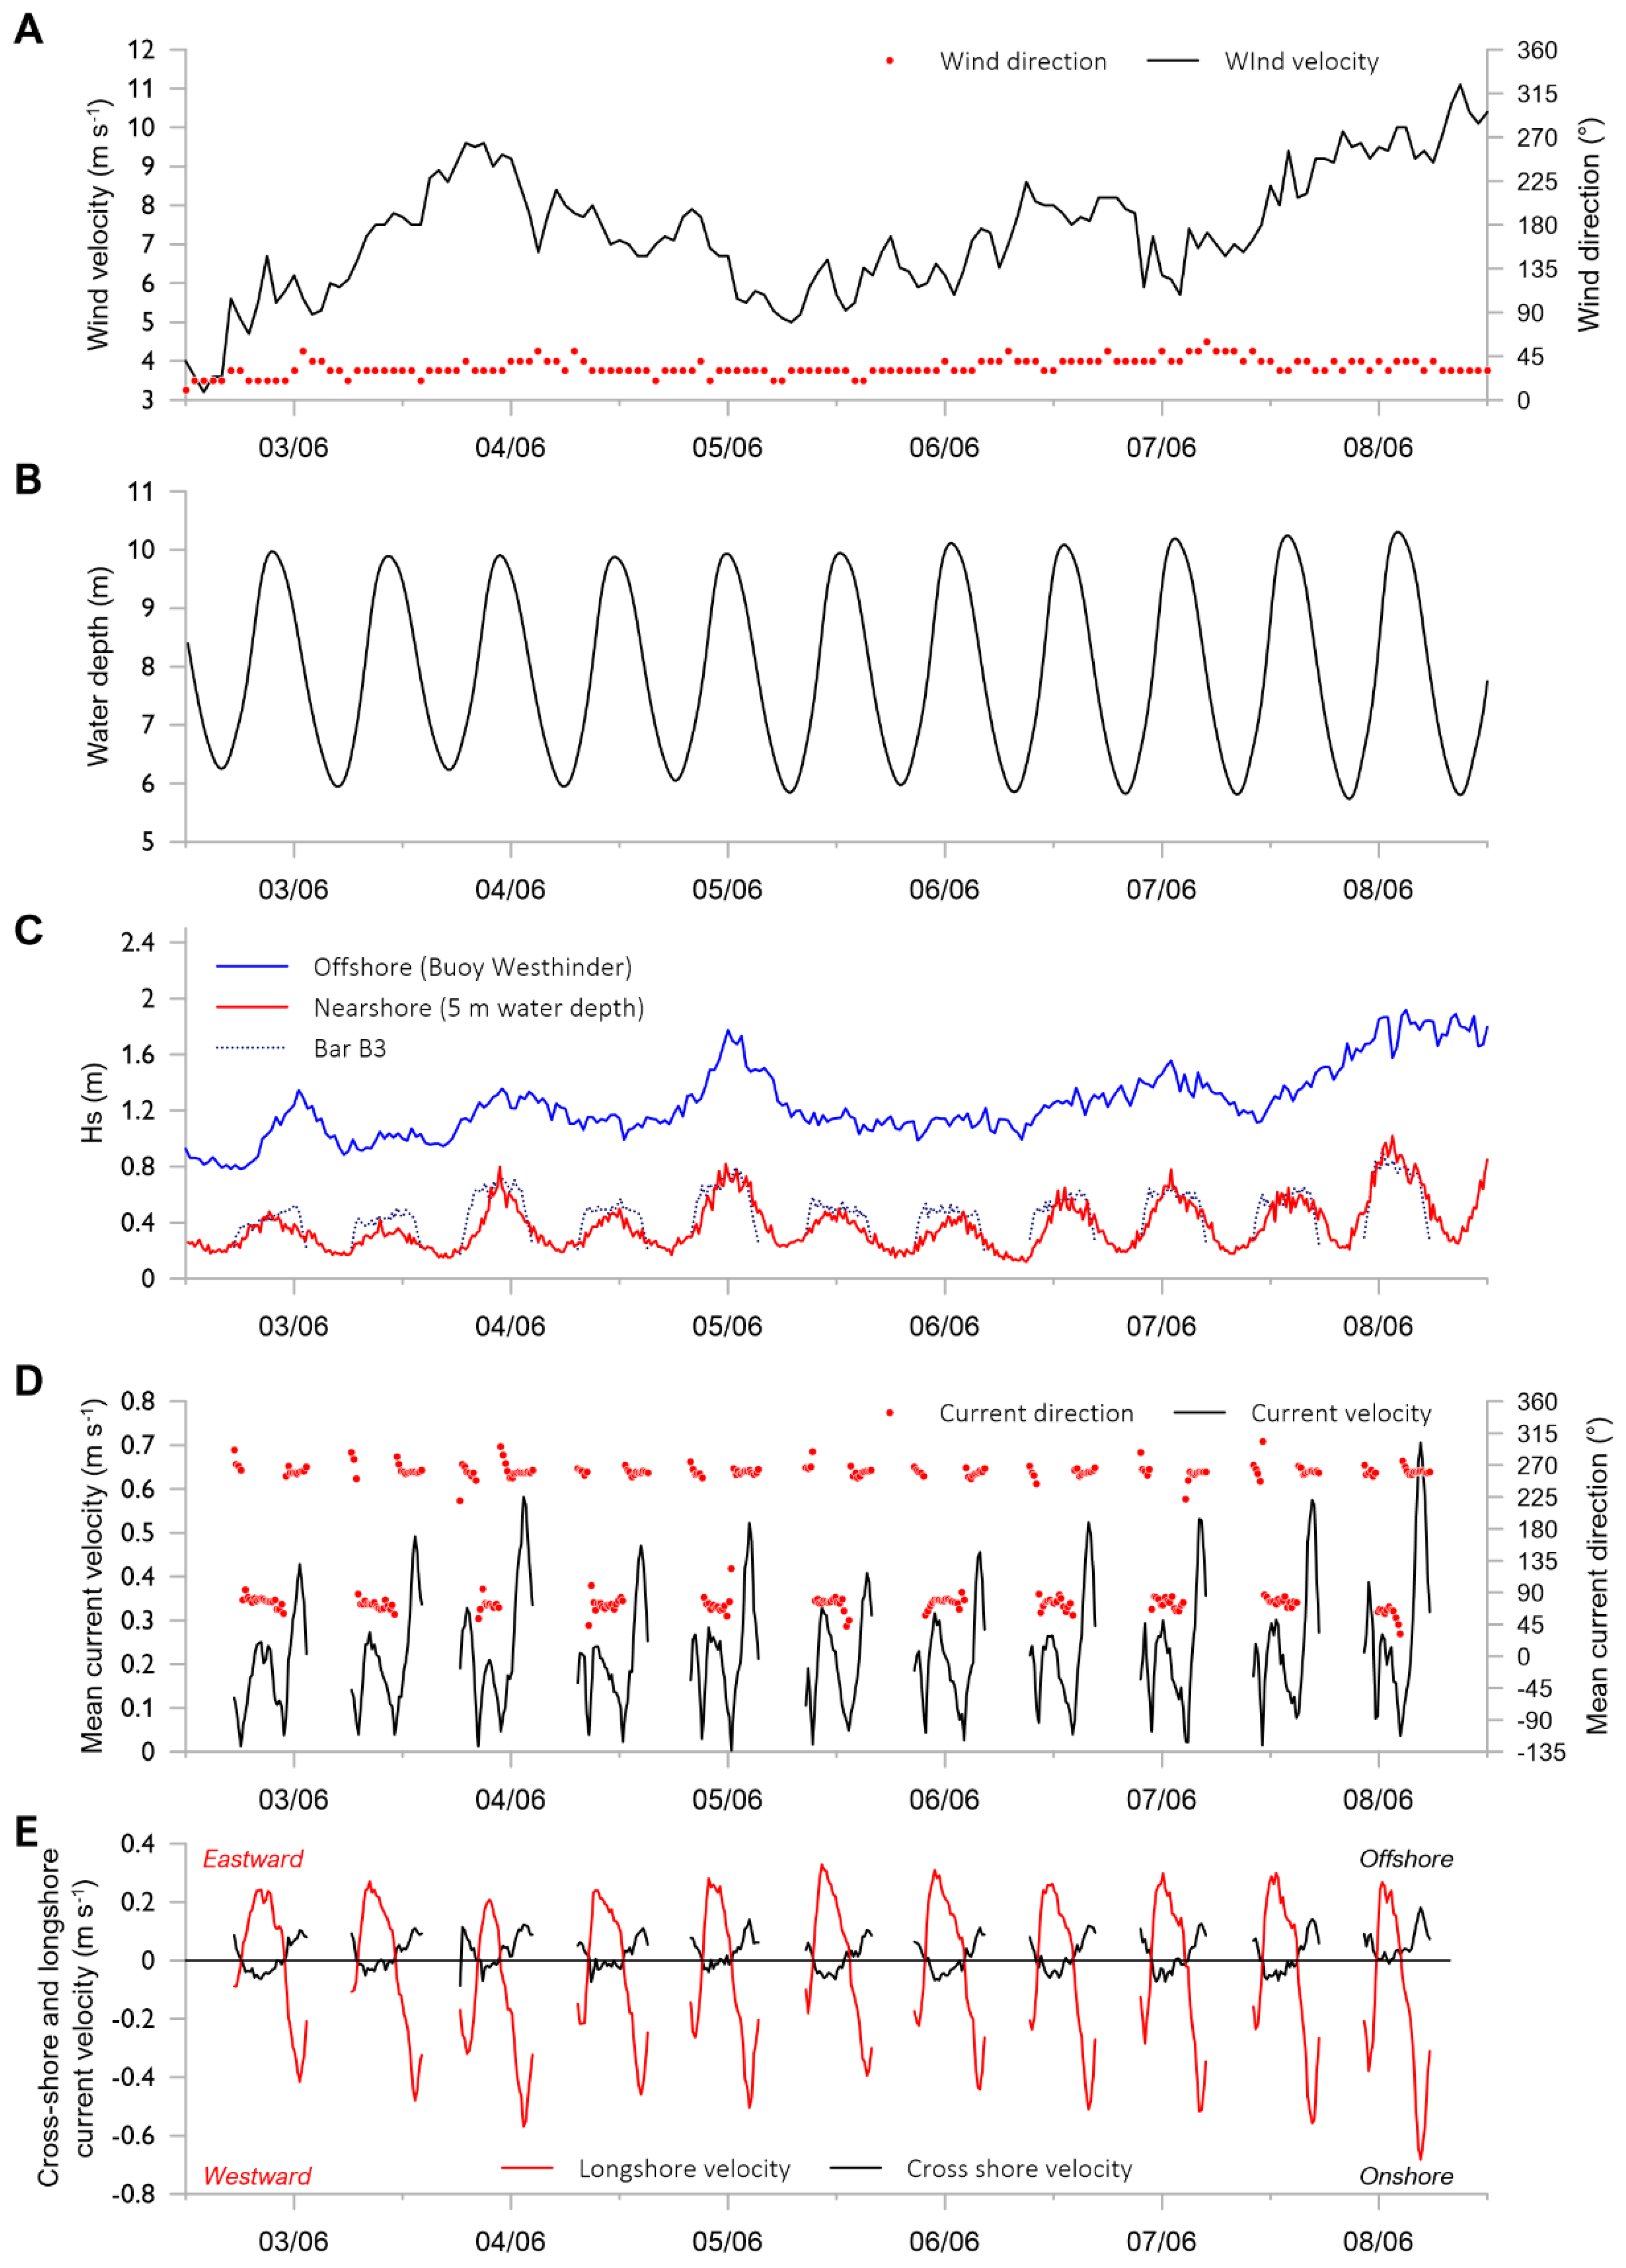
4.1. Hydro-Meteorological Conditions during the Field Experiment
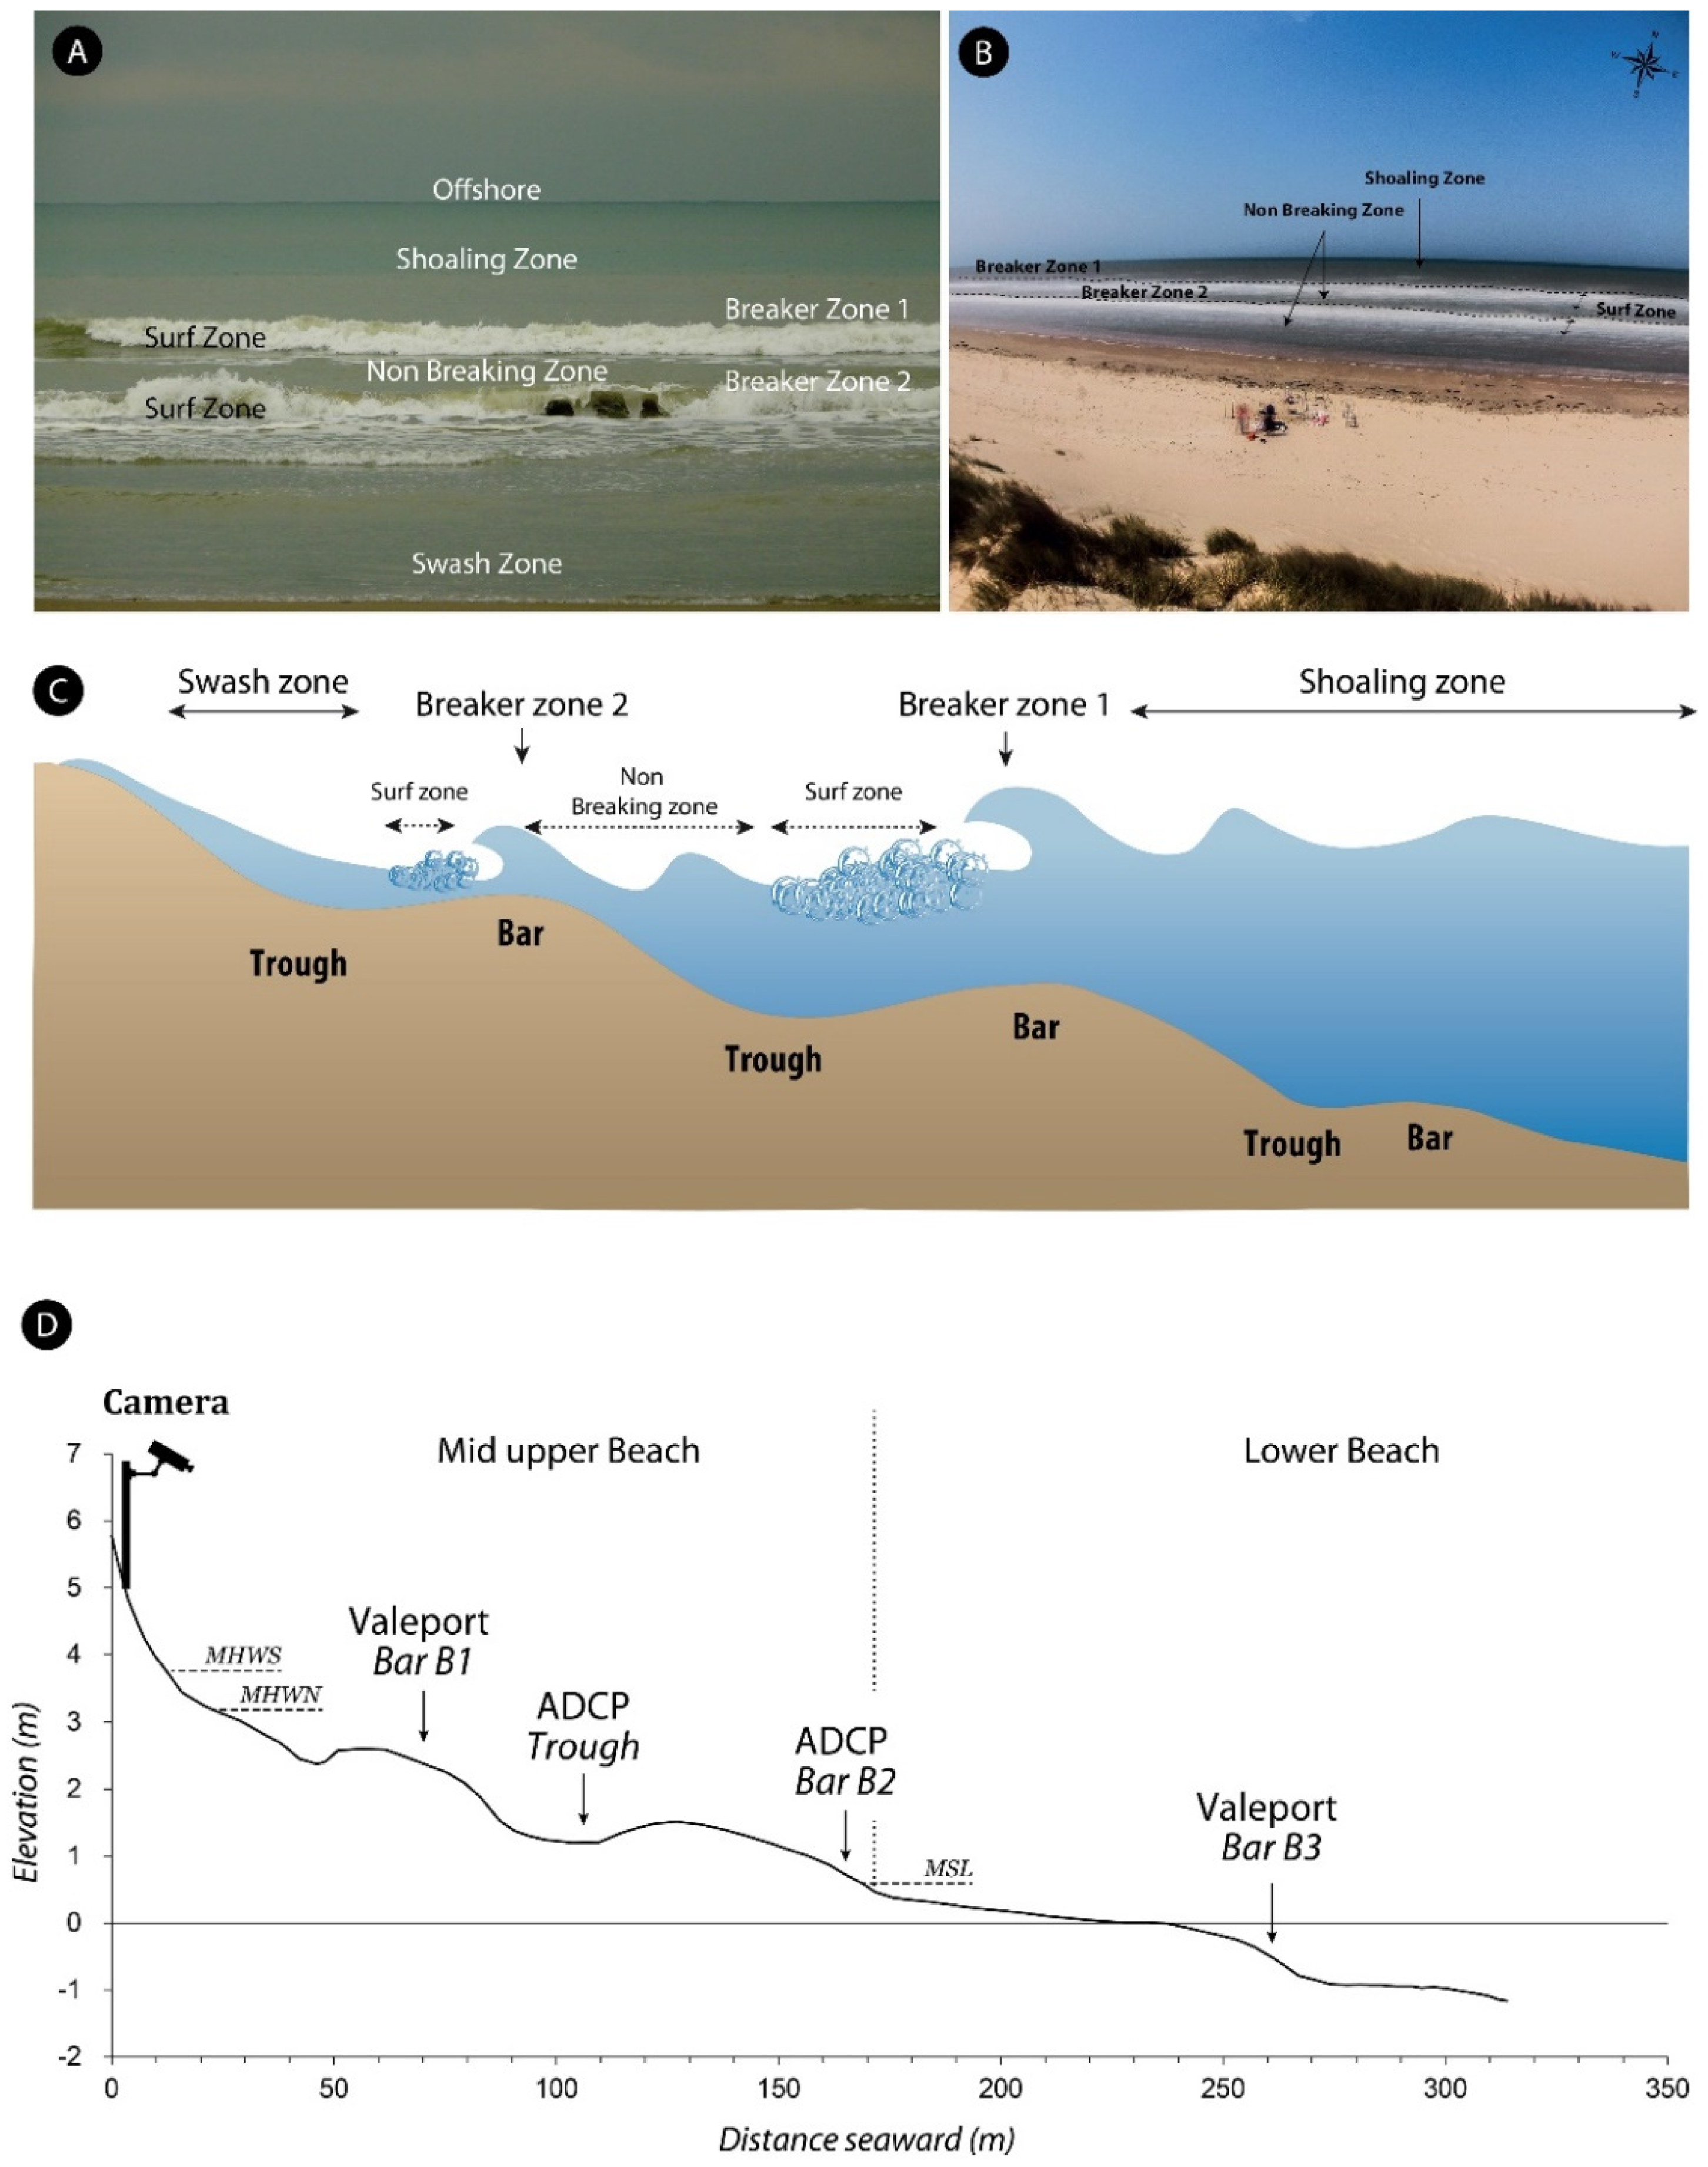
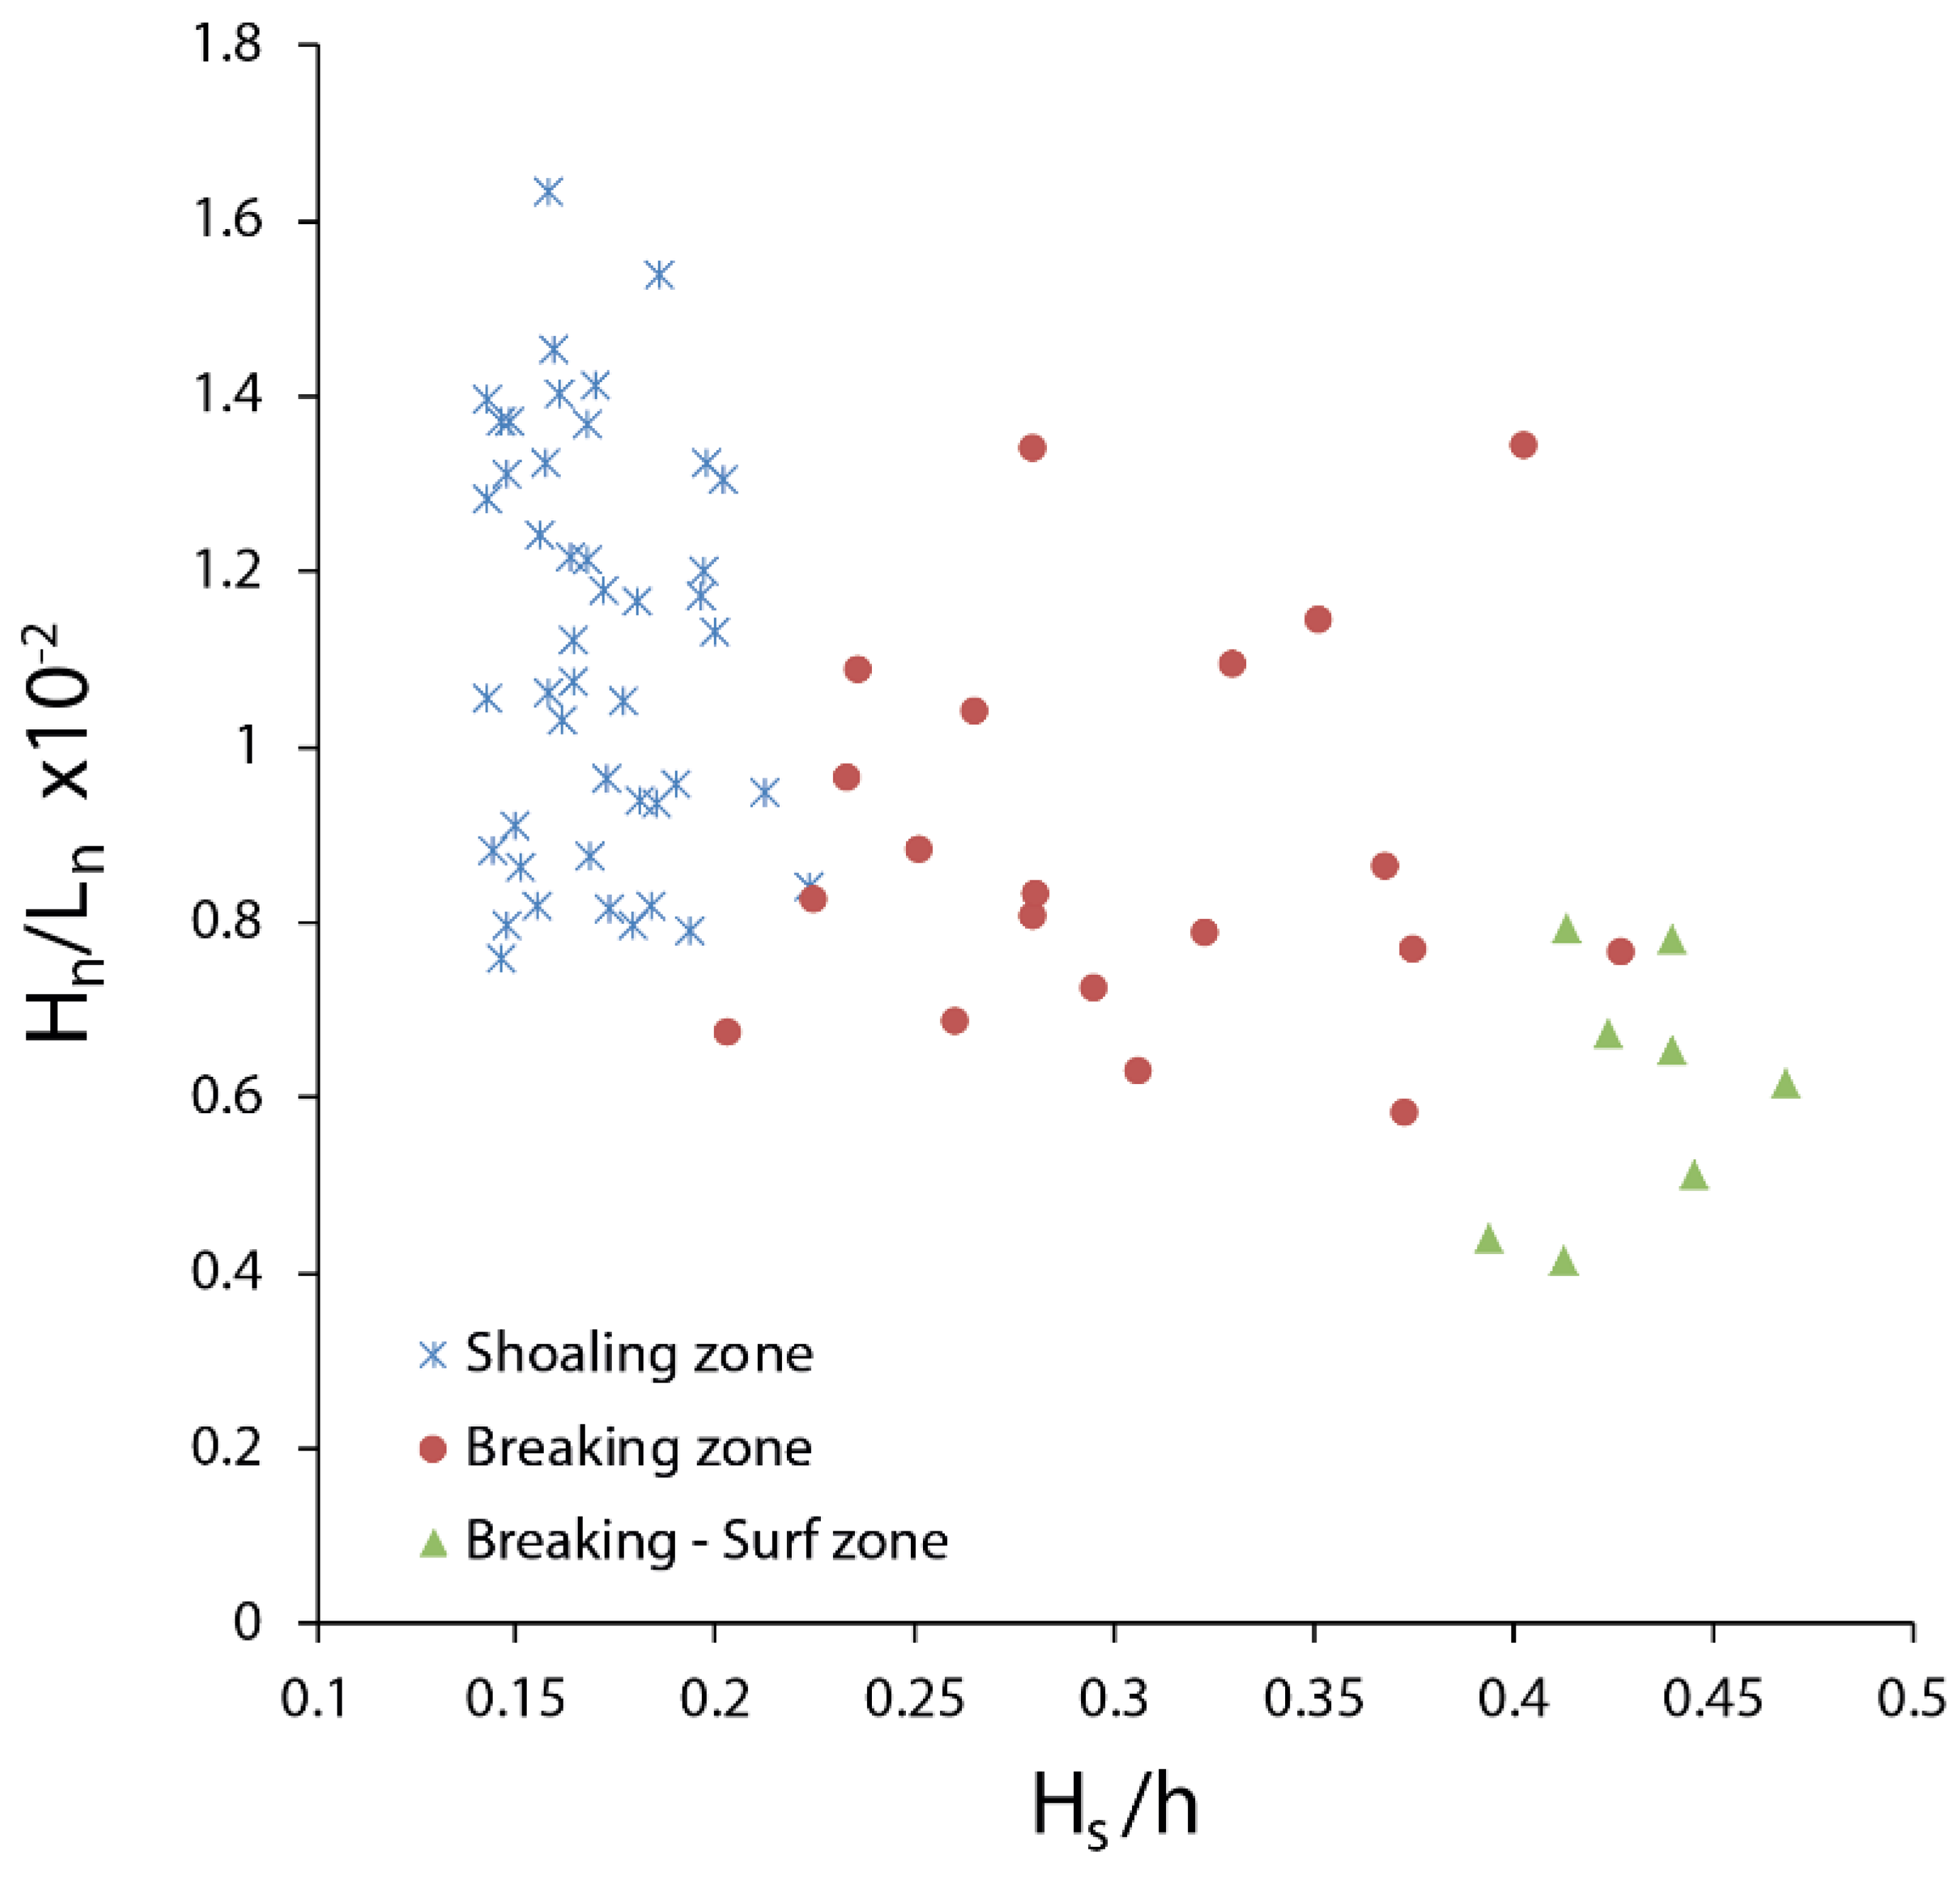
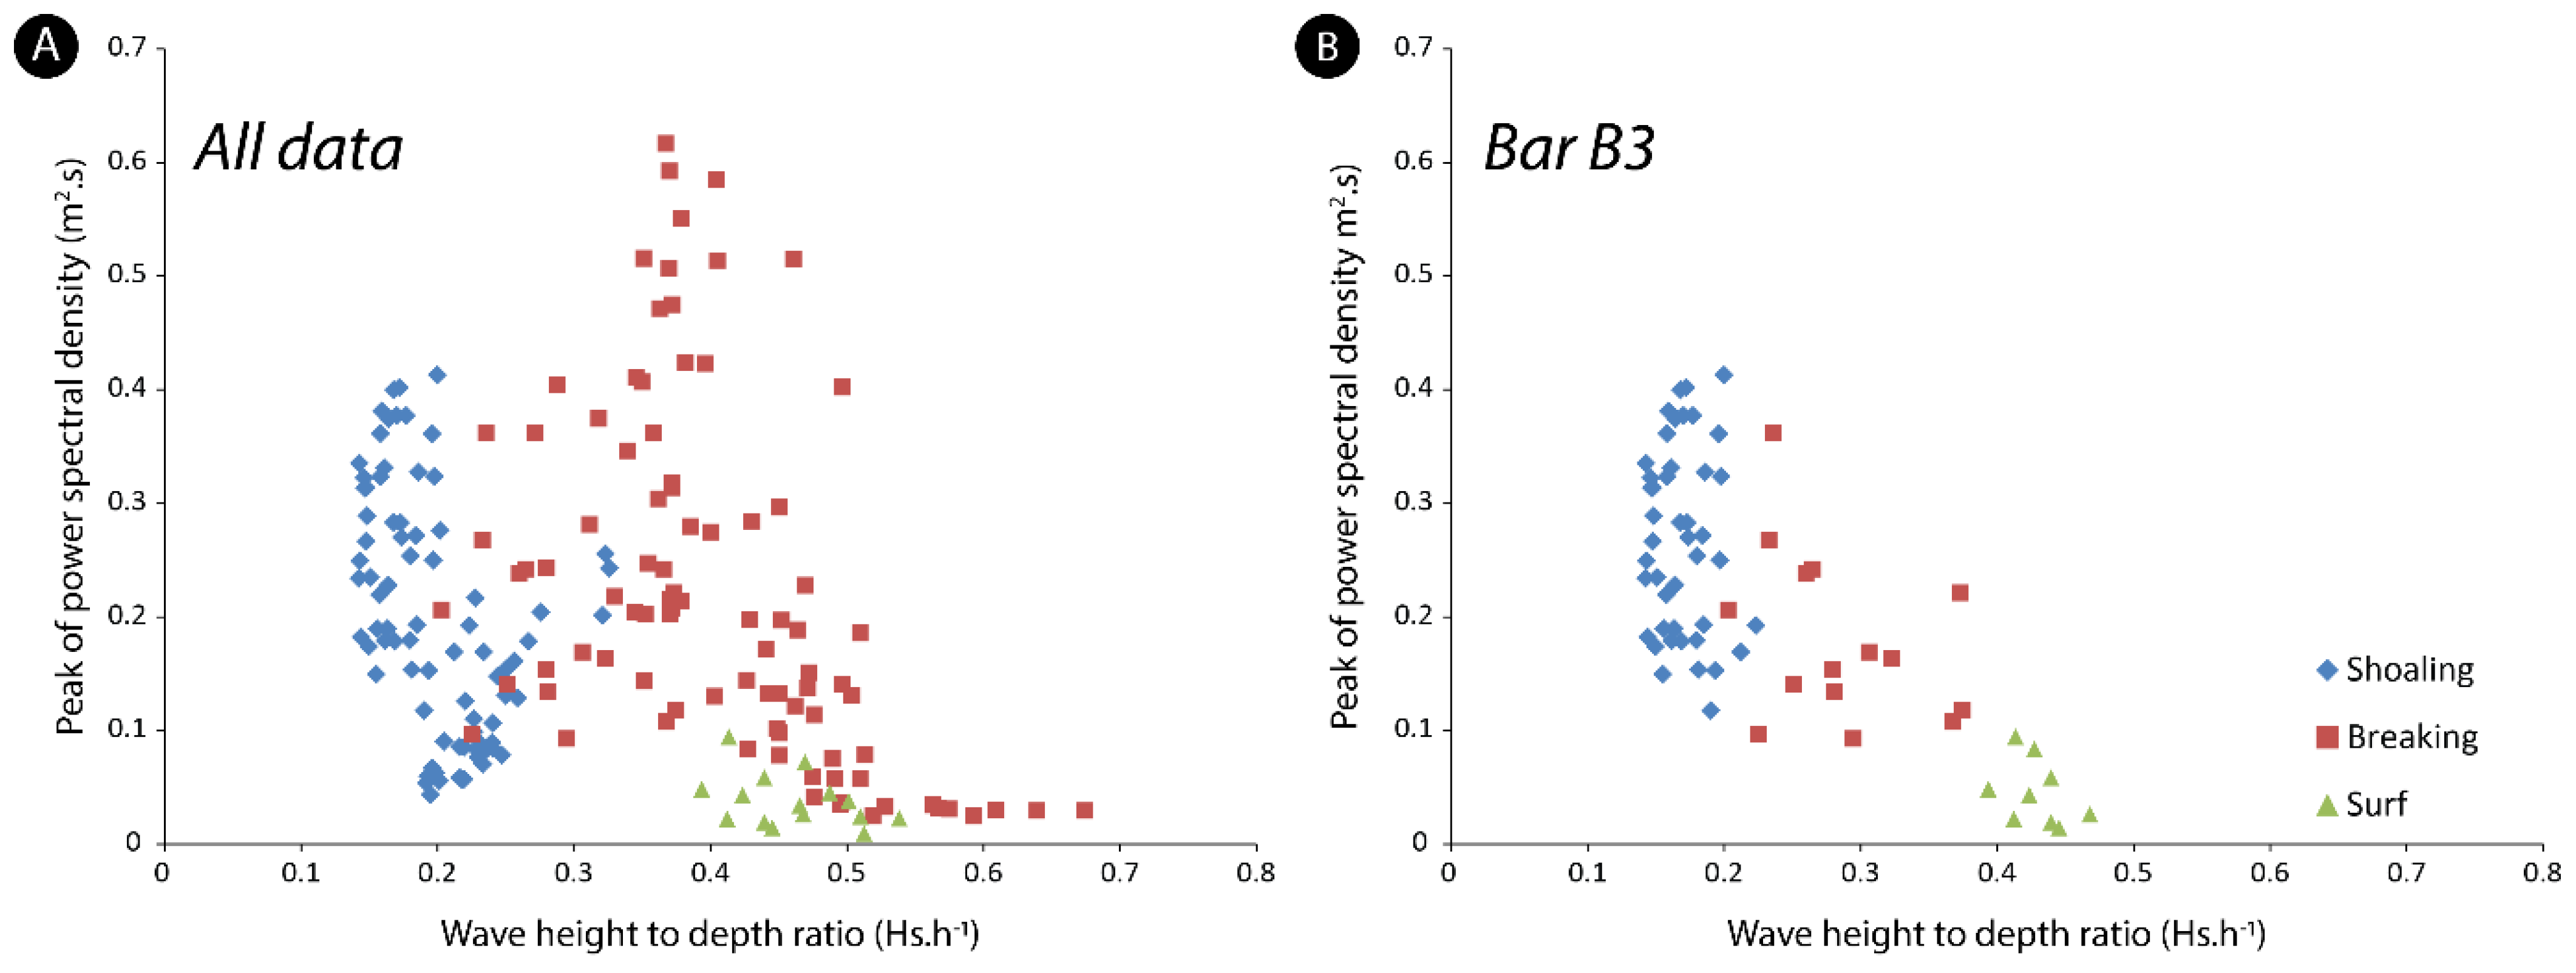
4.2. Discrimination of Hydrodynamic Zones
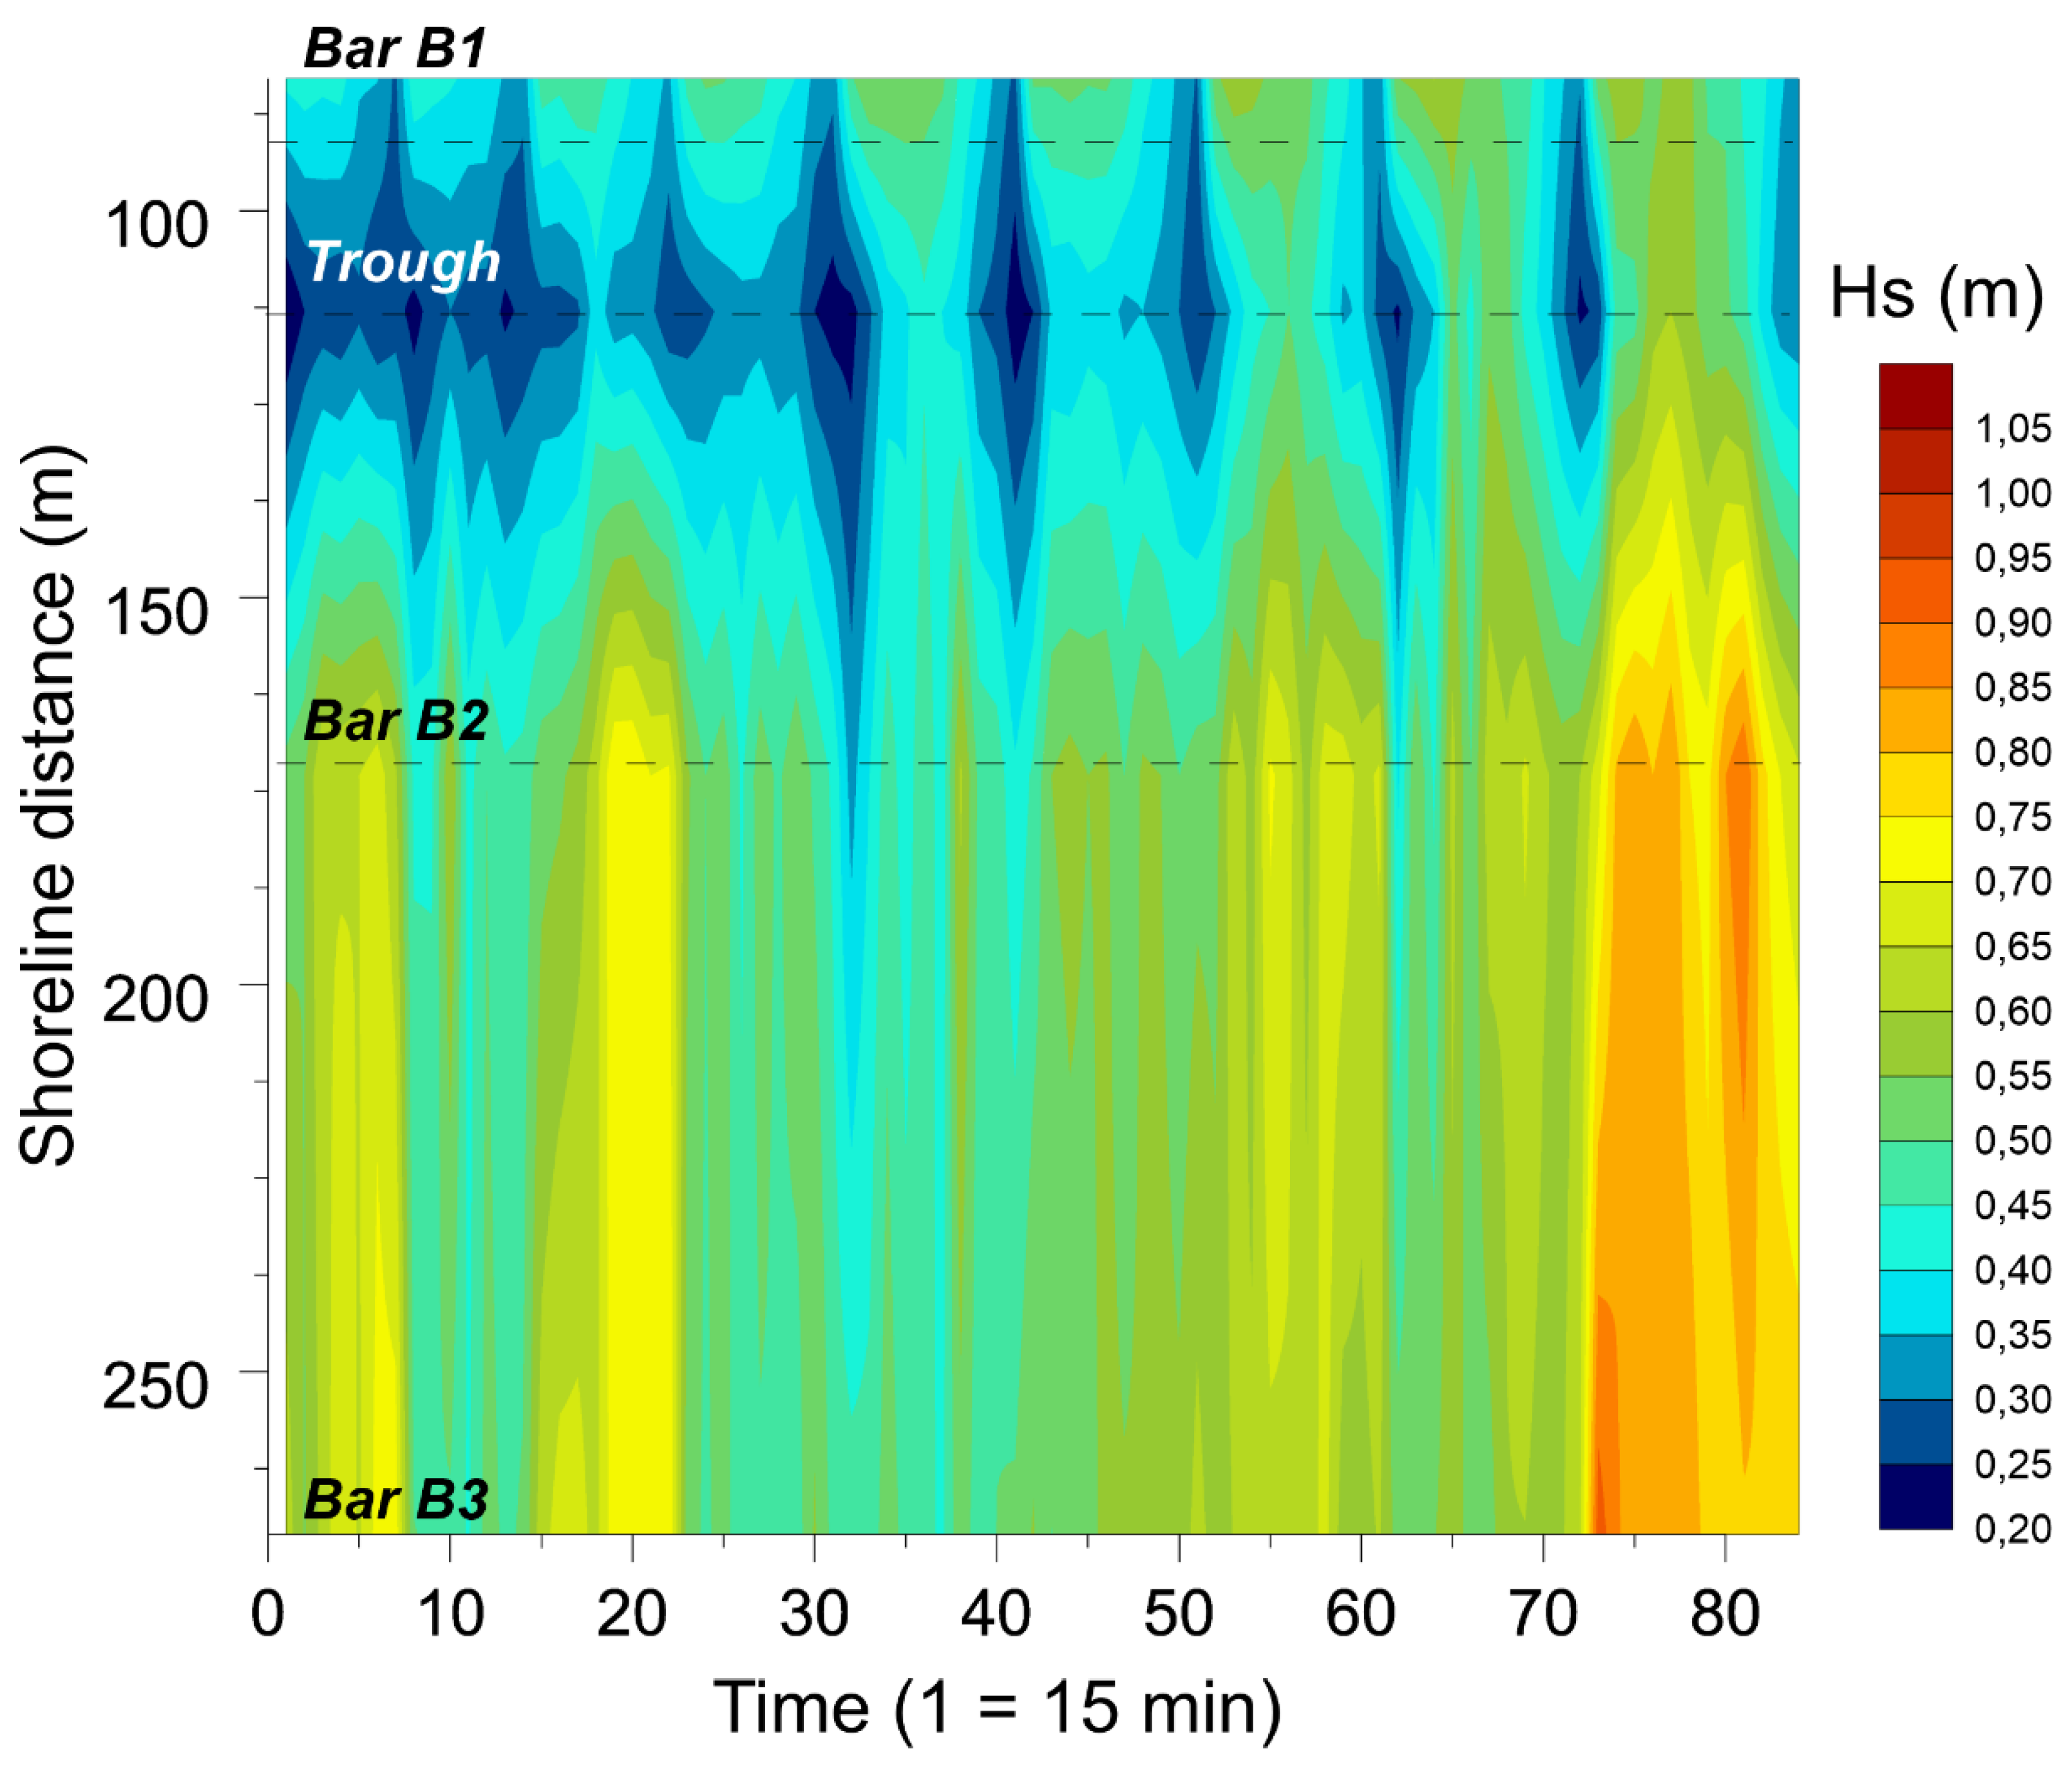
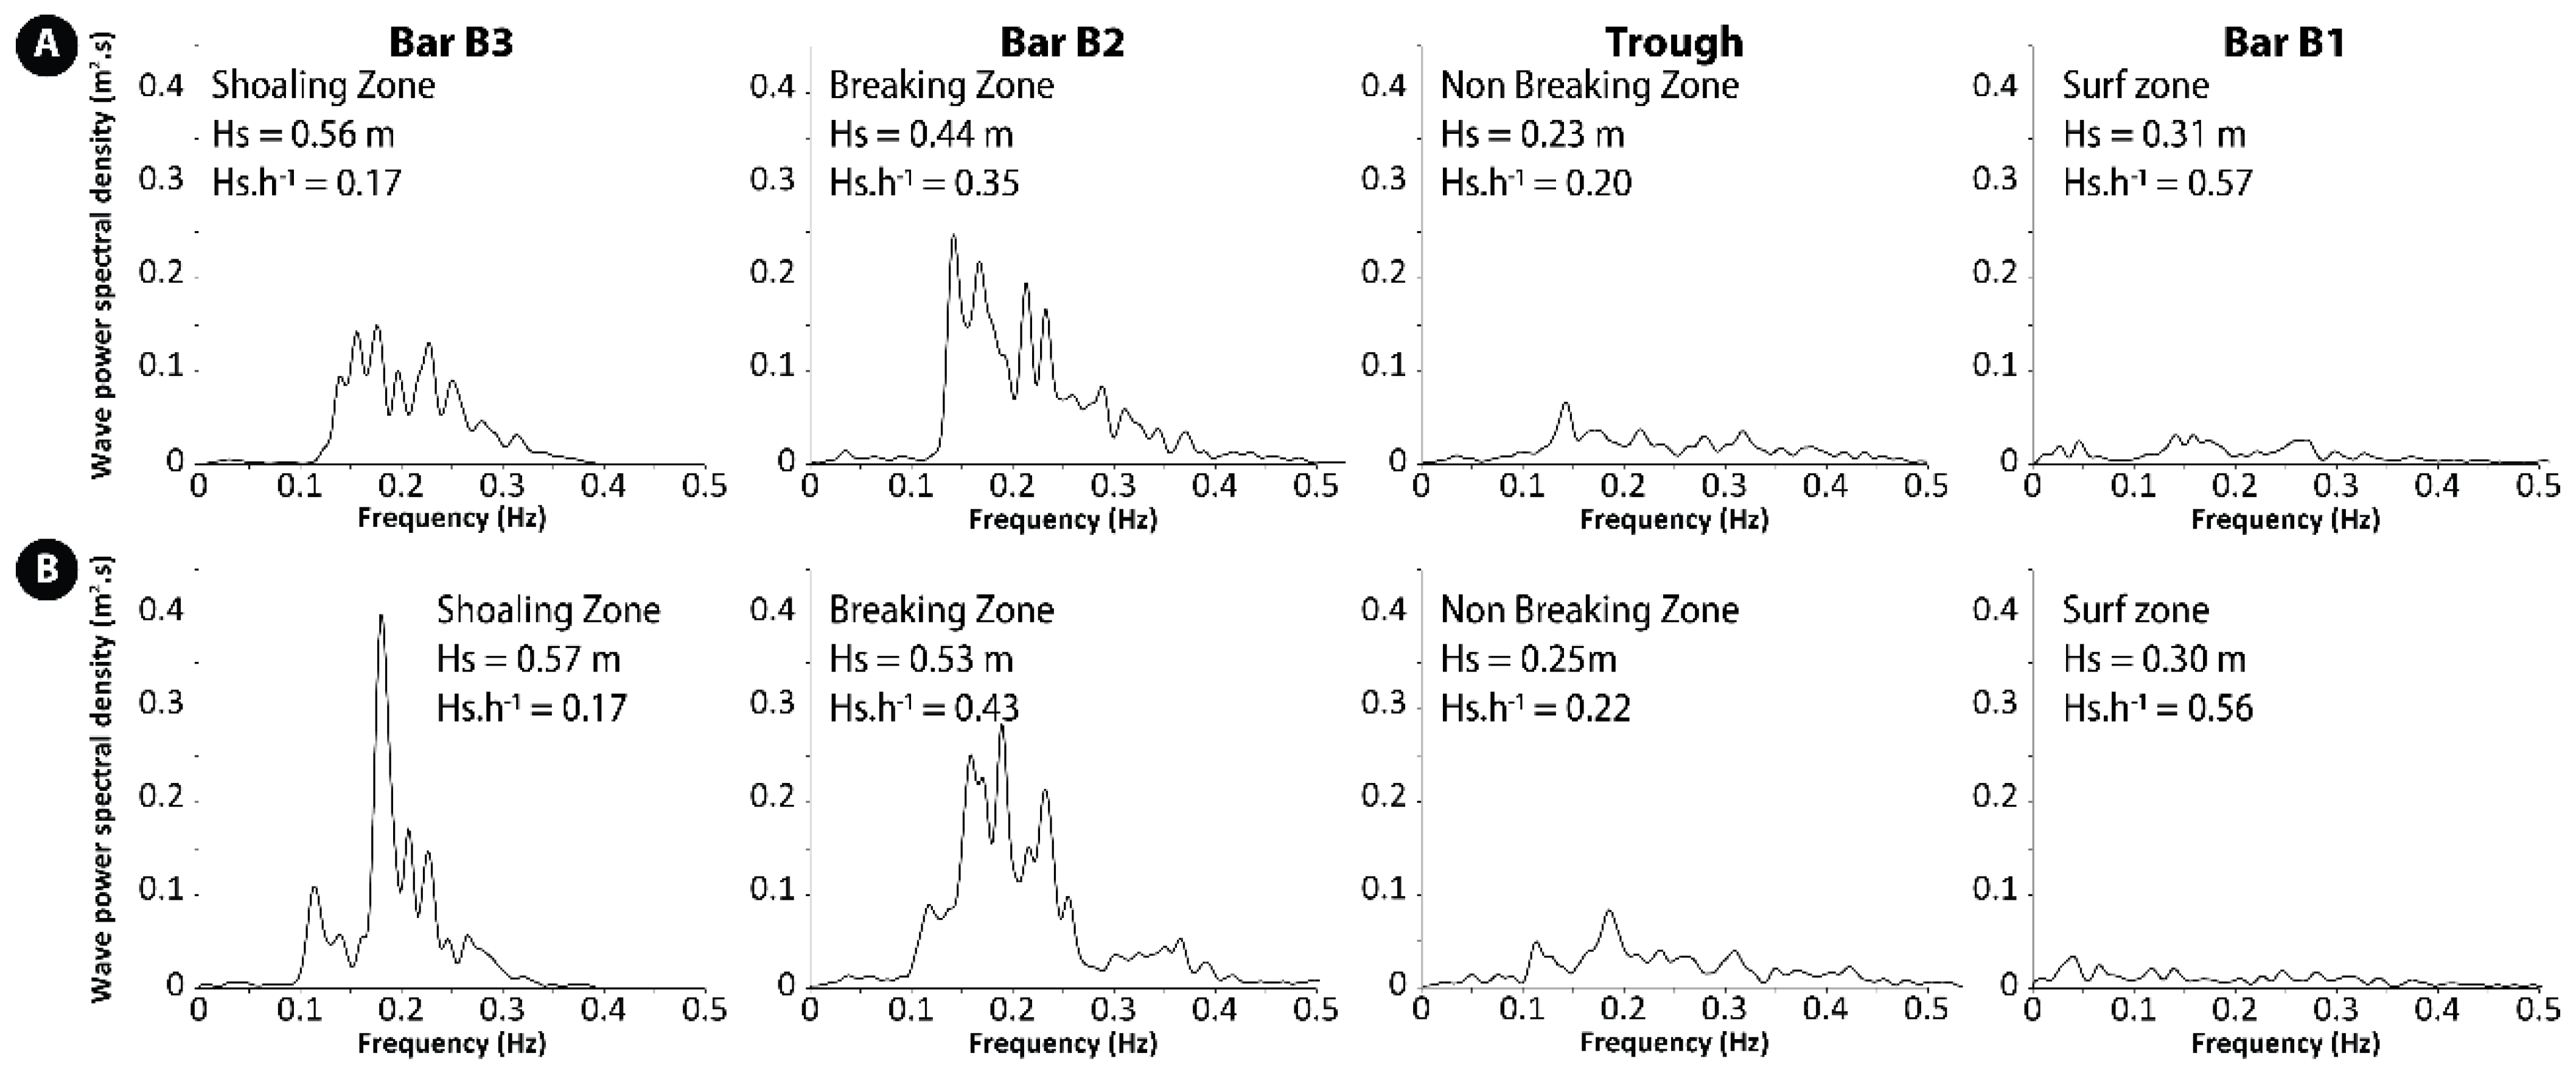
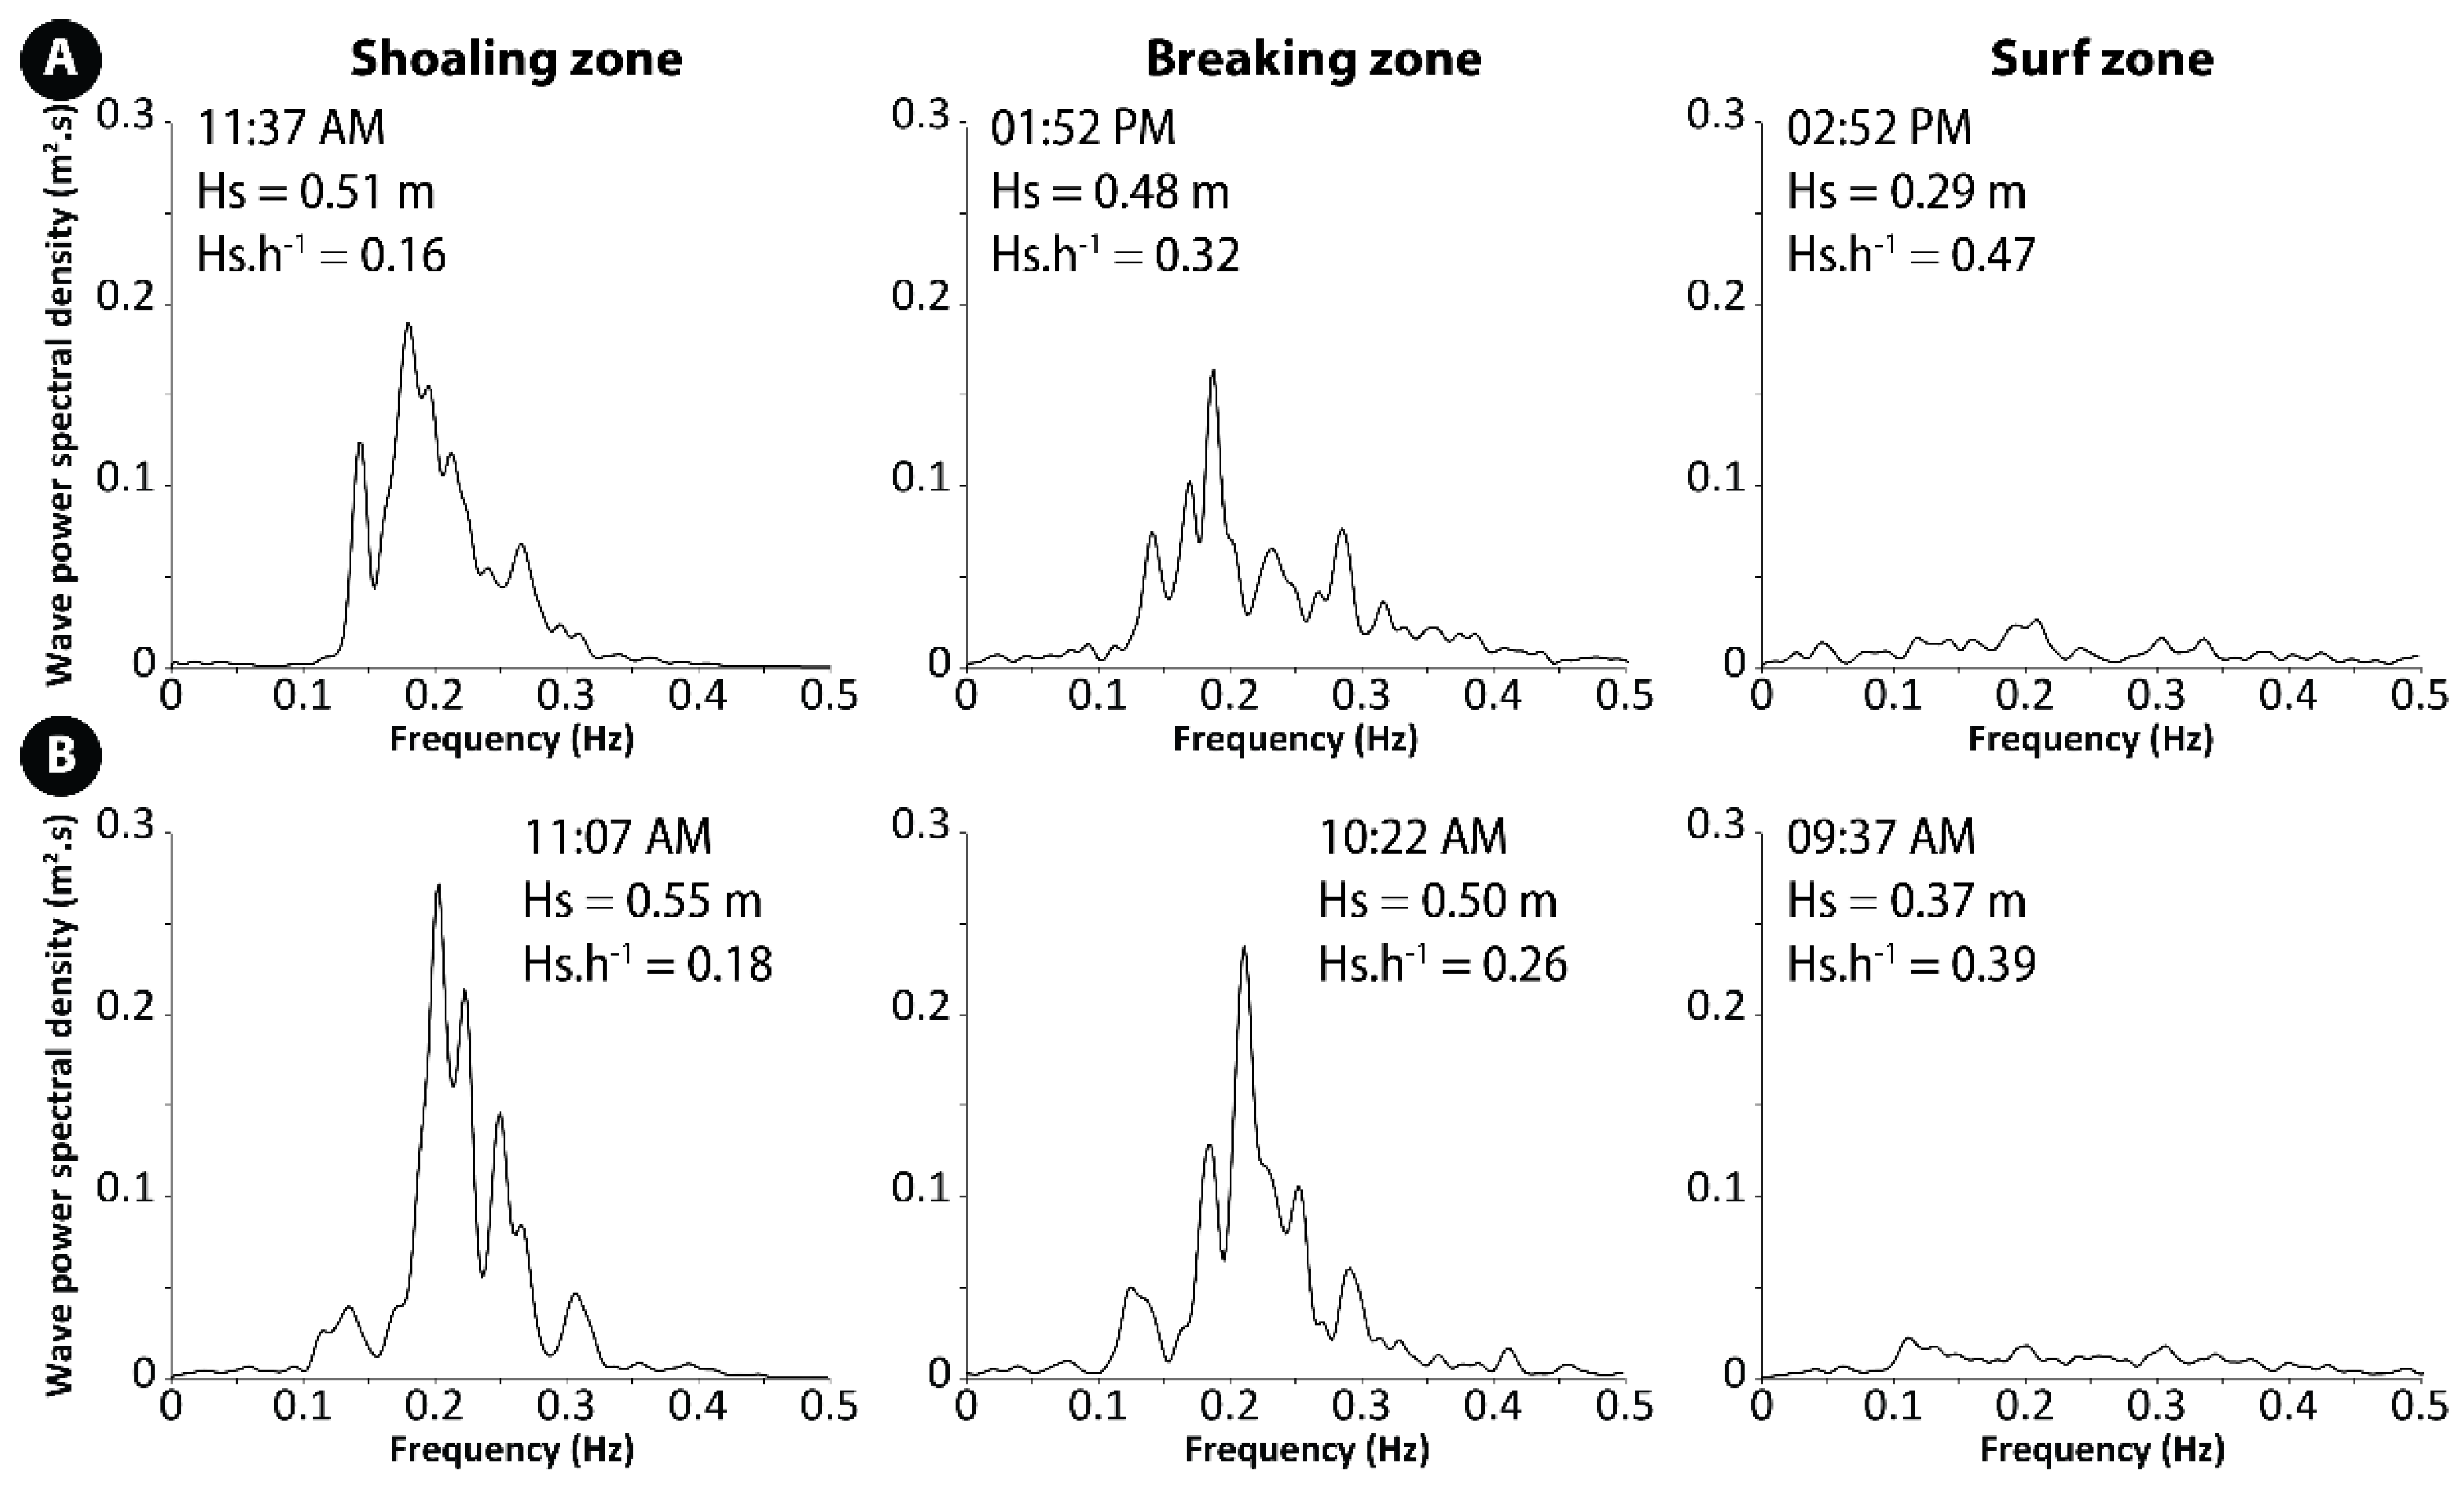
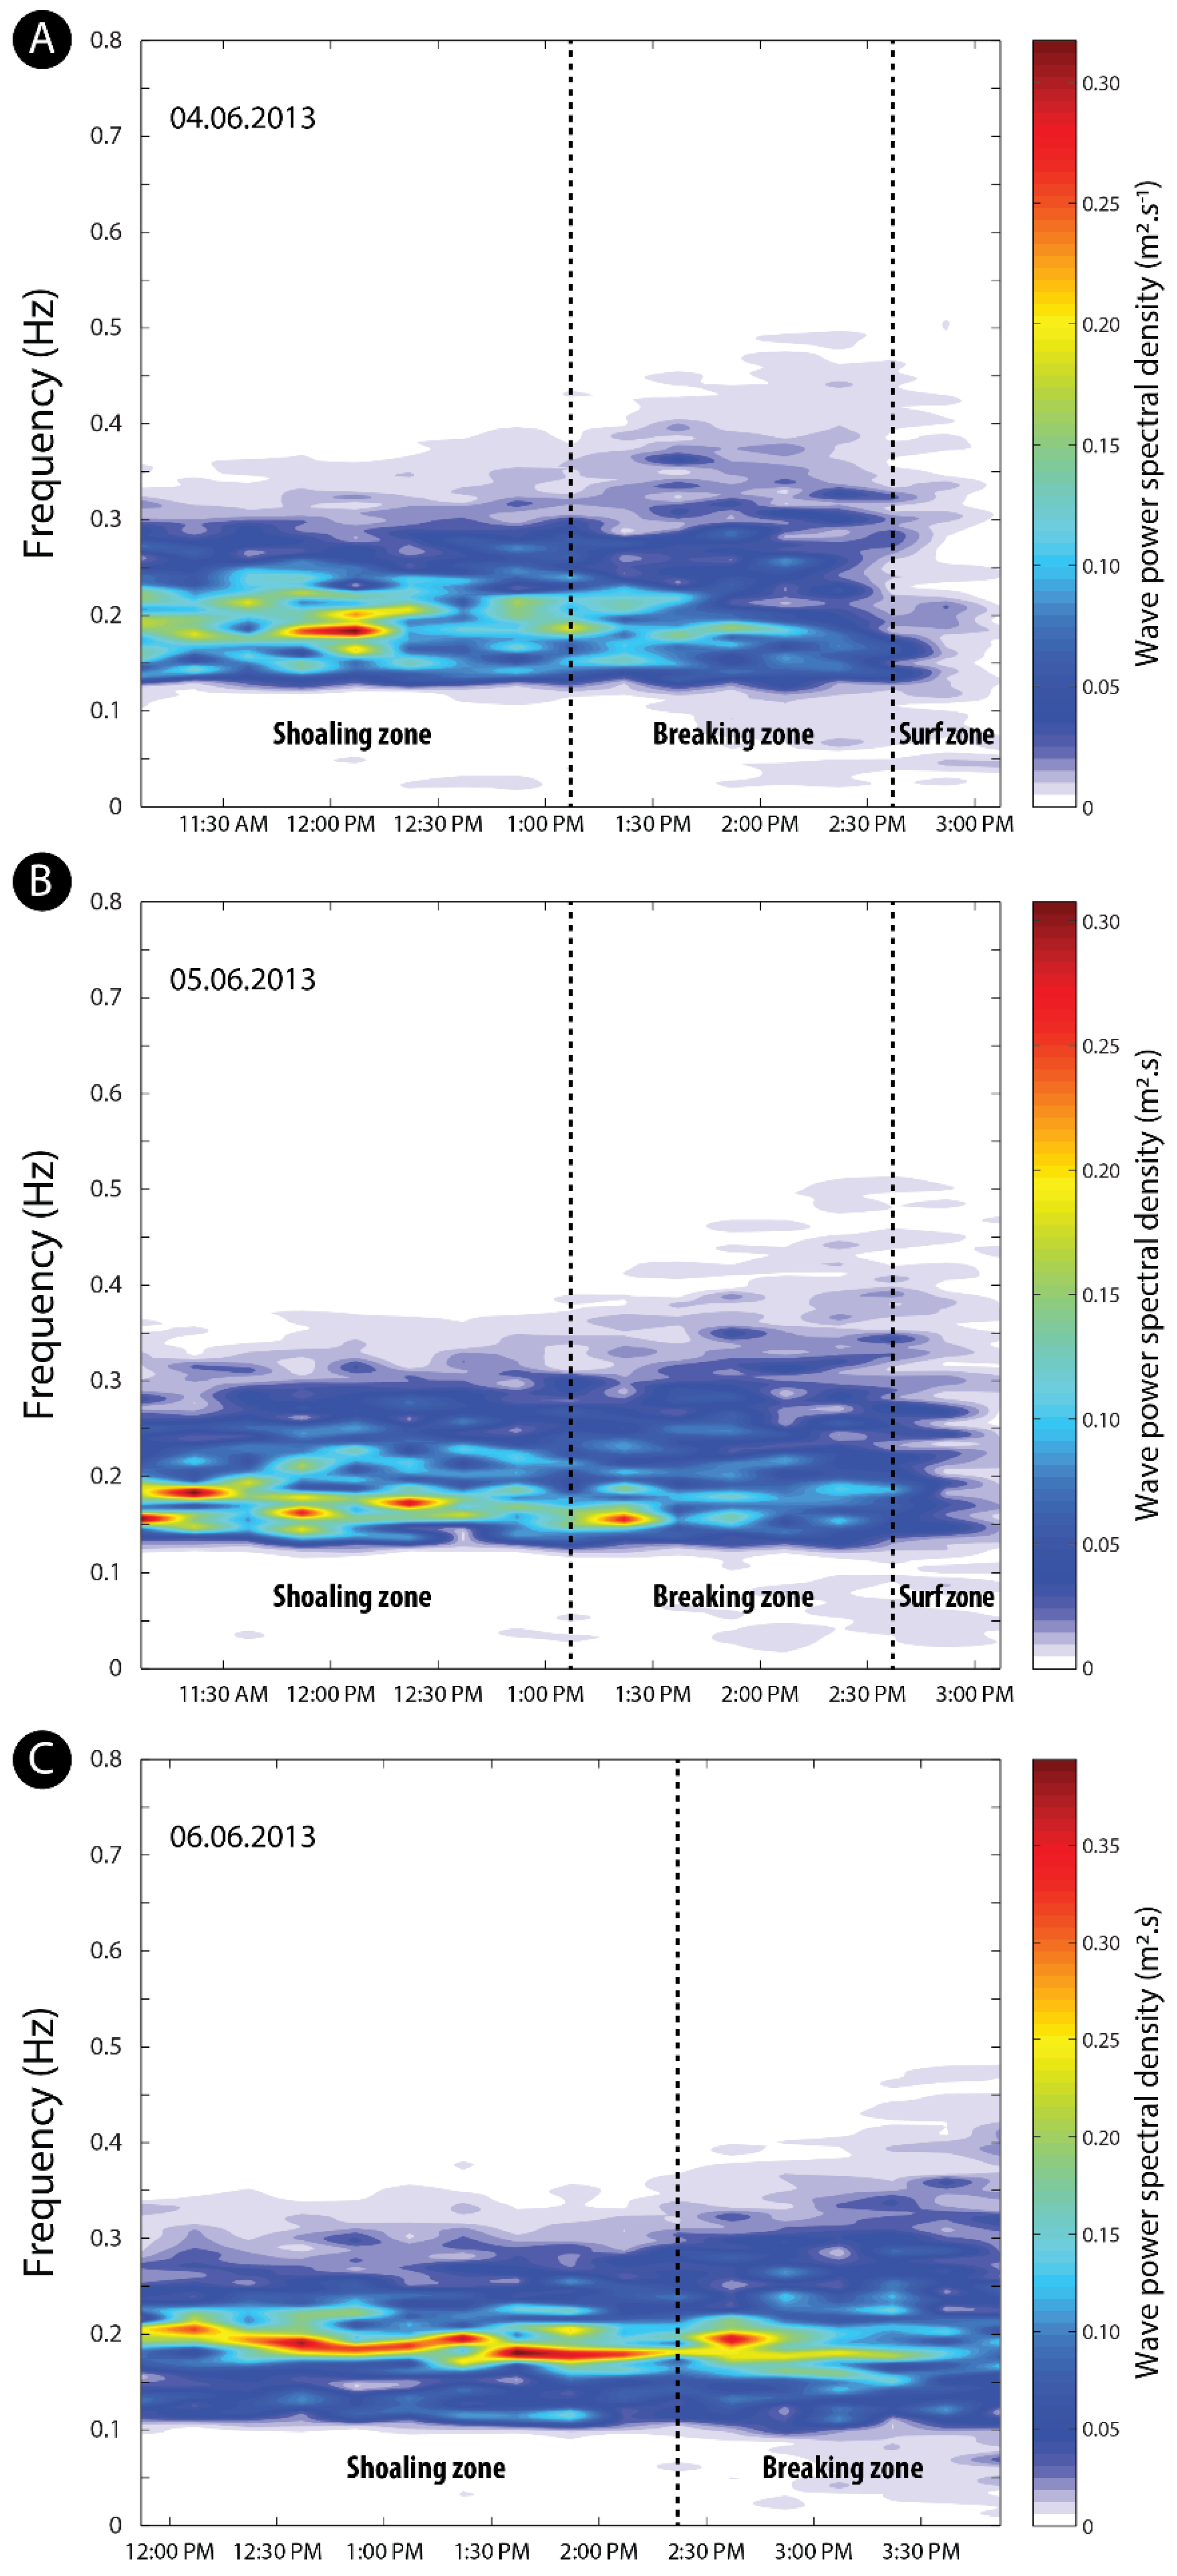
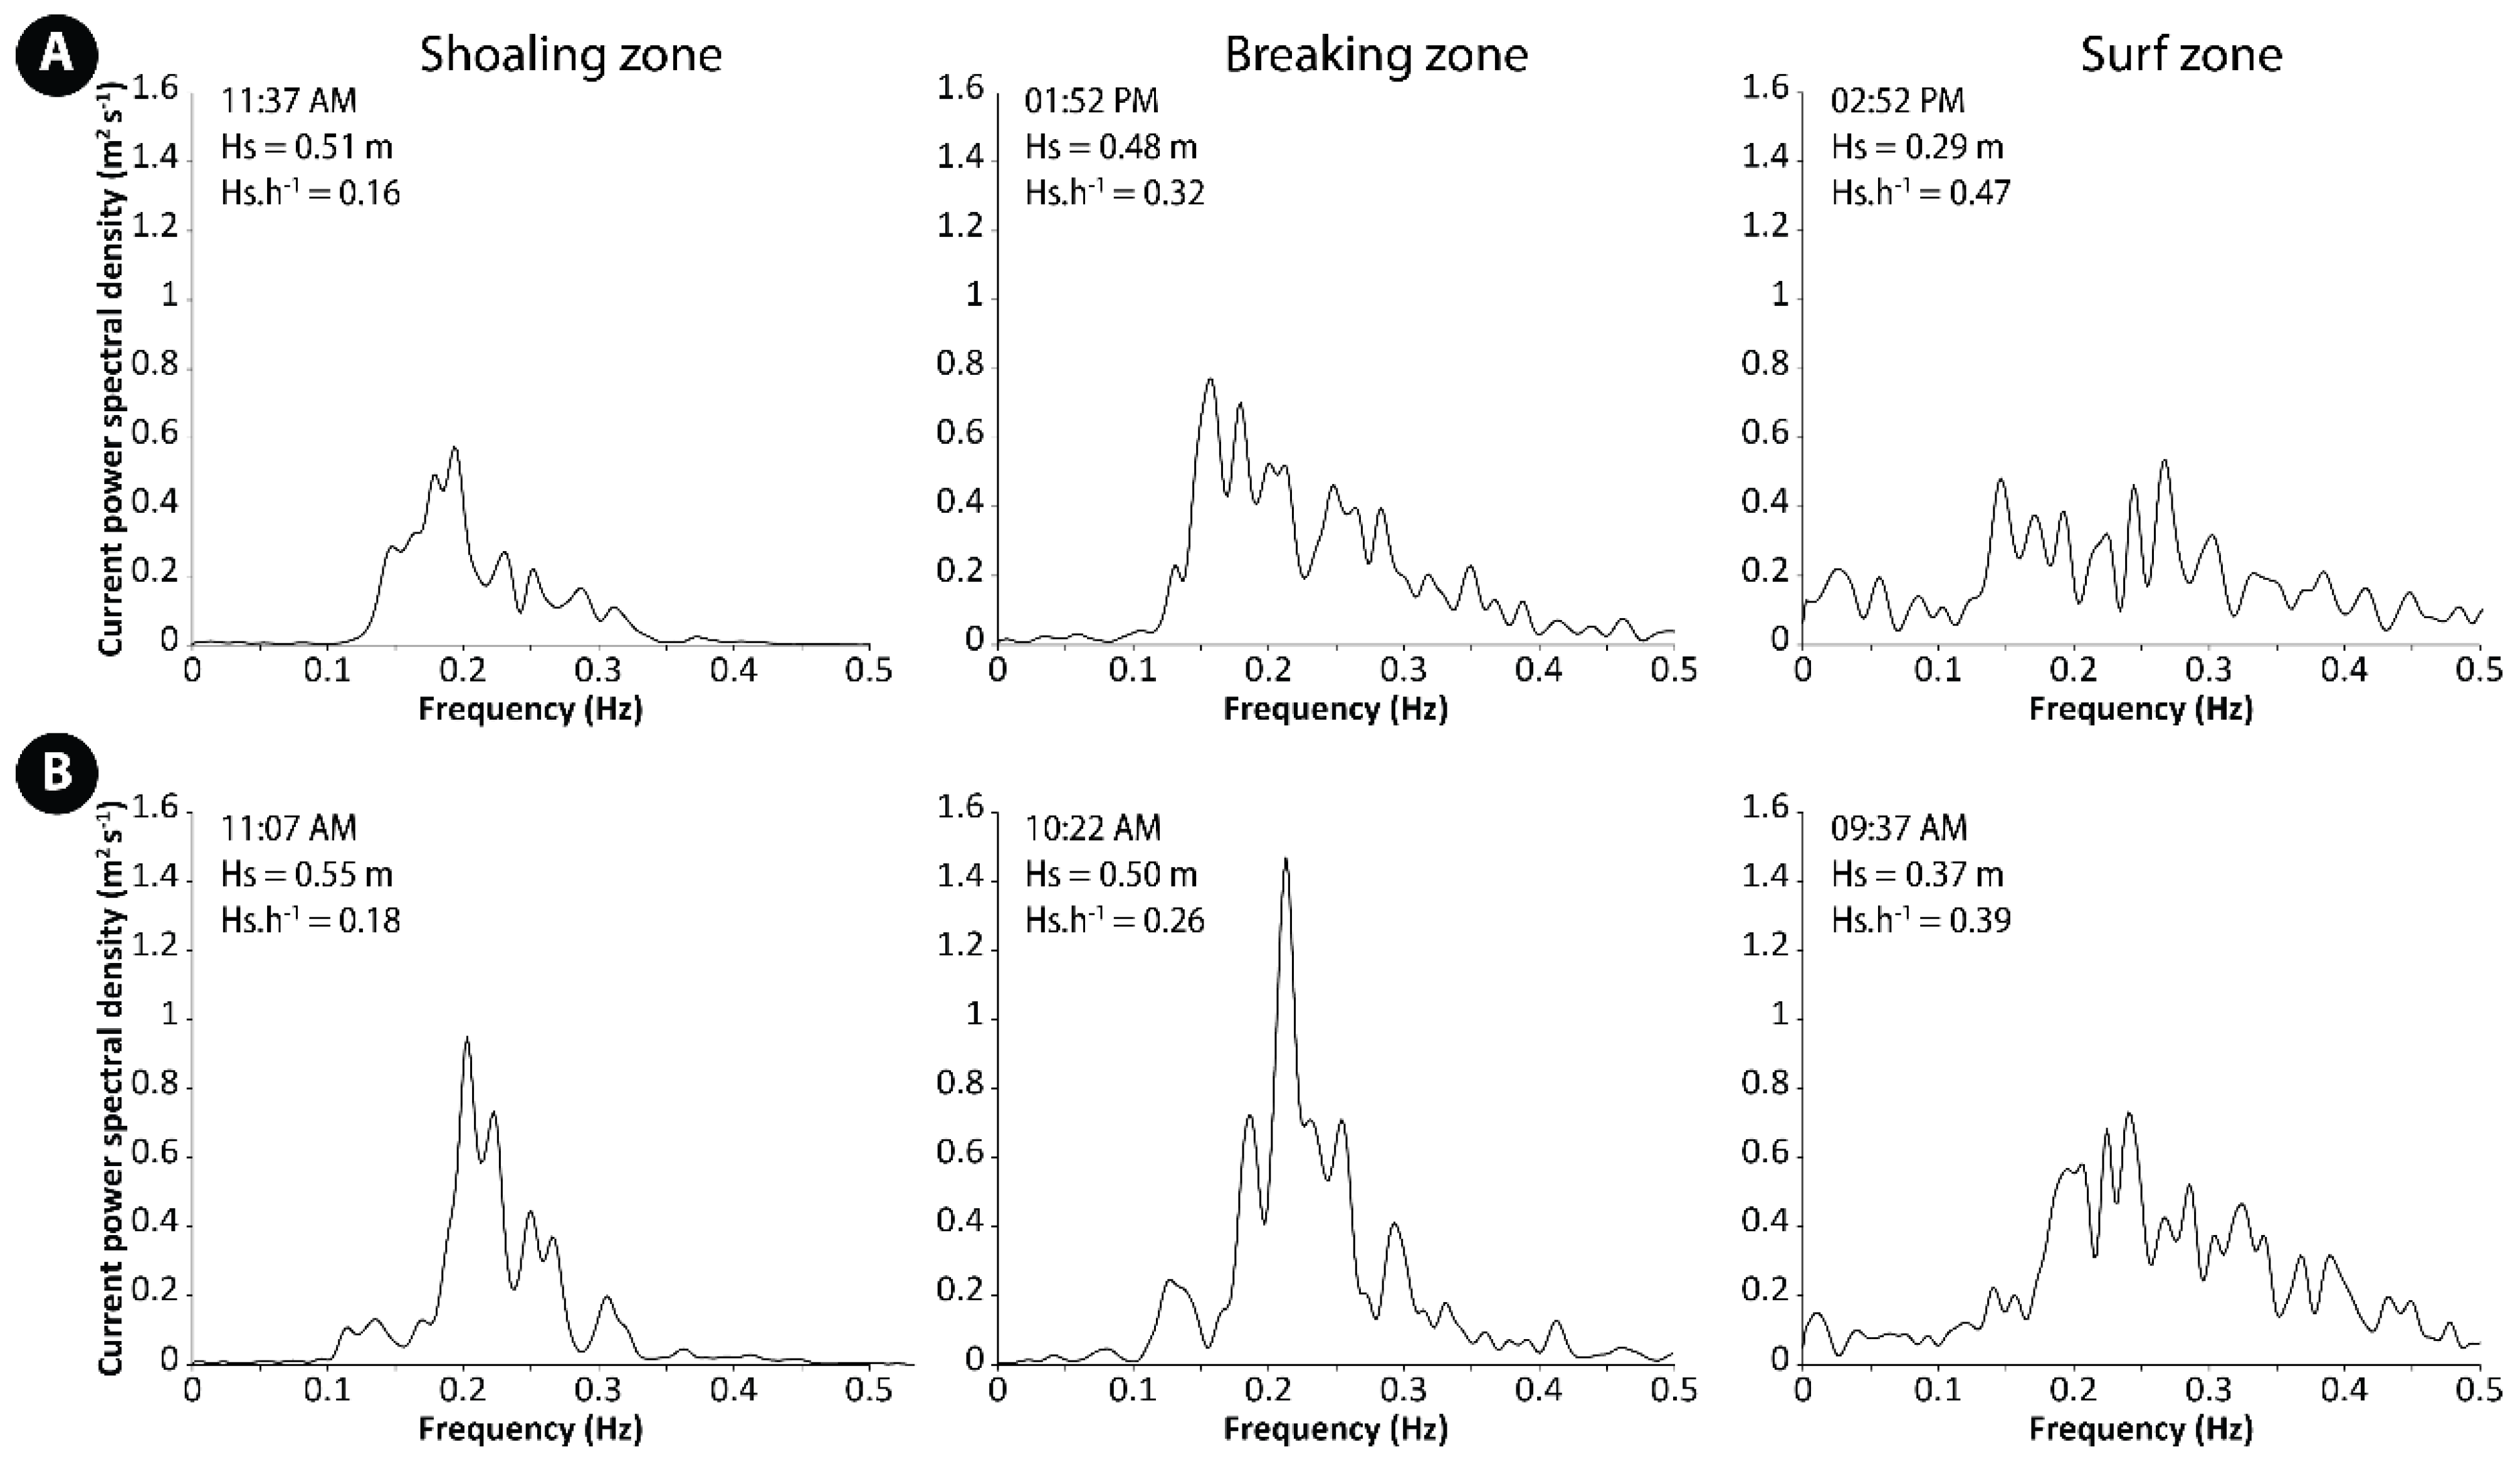
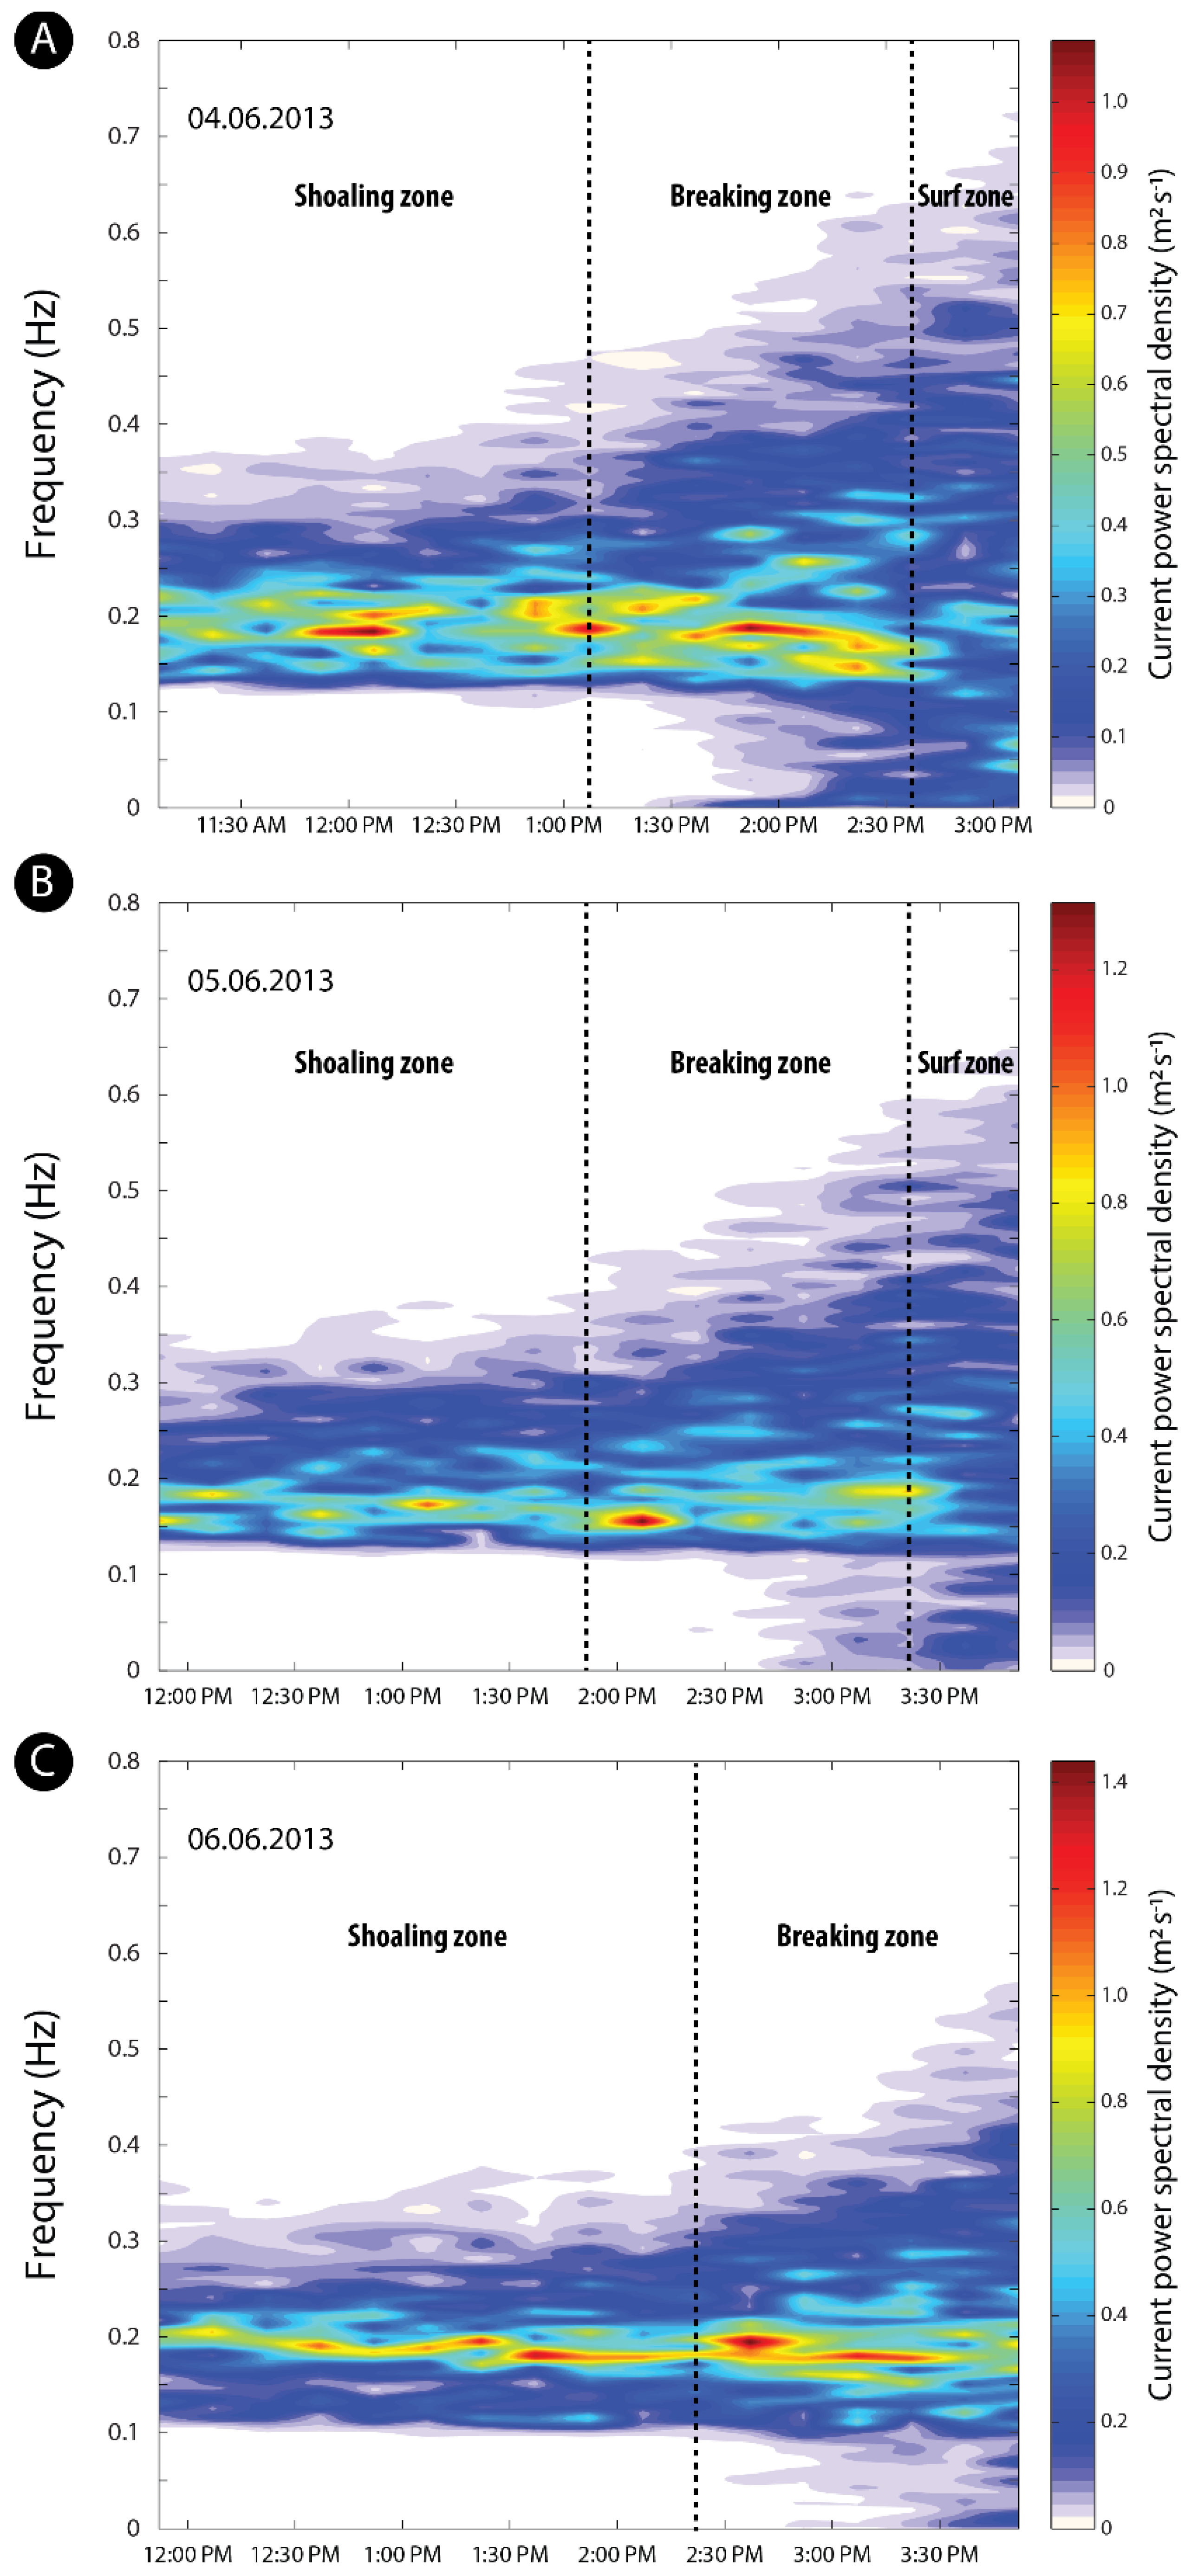
4.3. Characterization of Wave Spectra
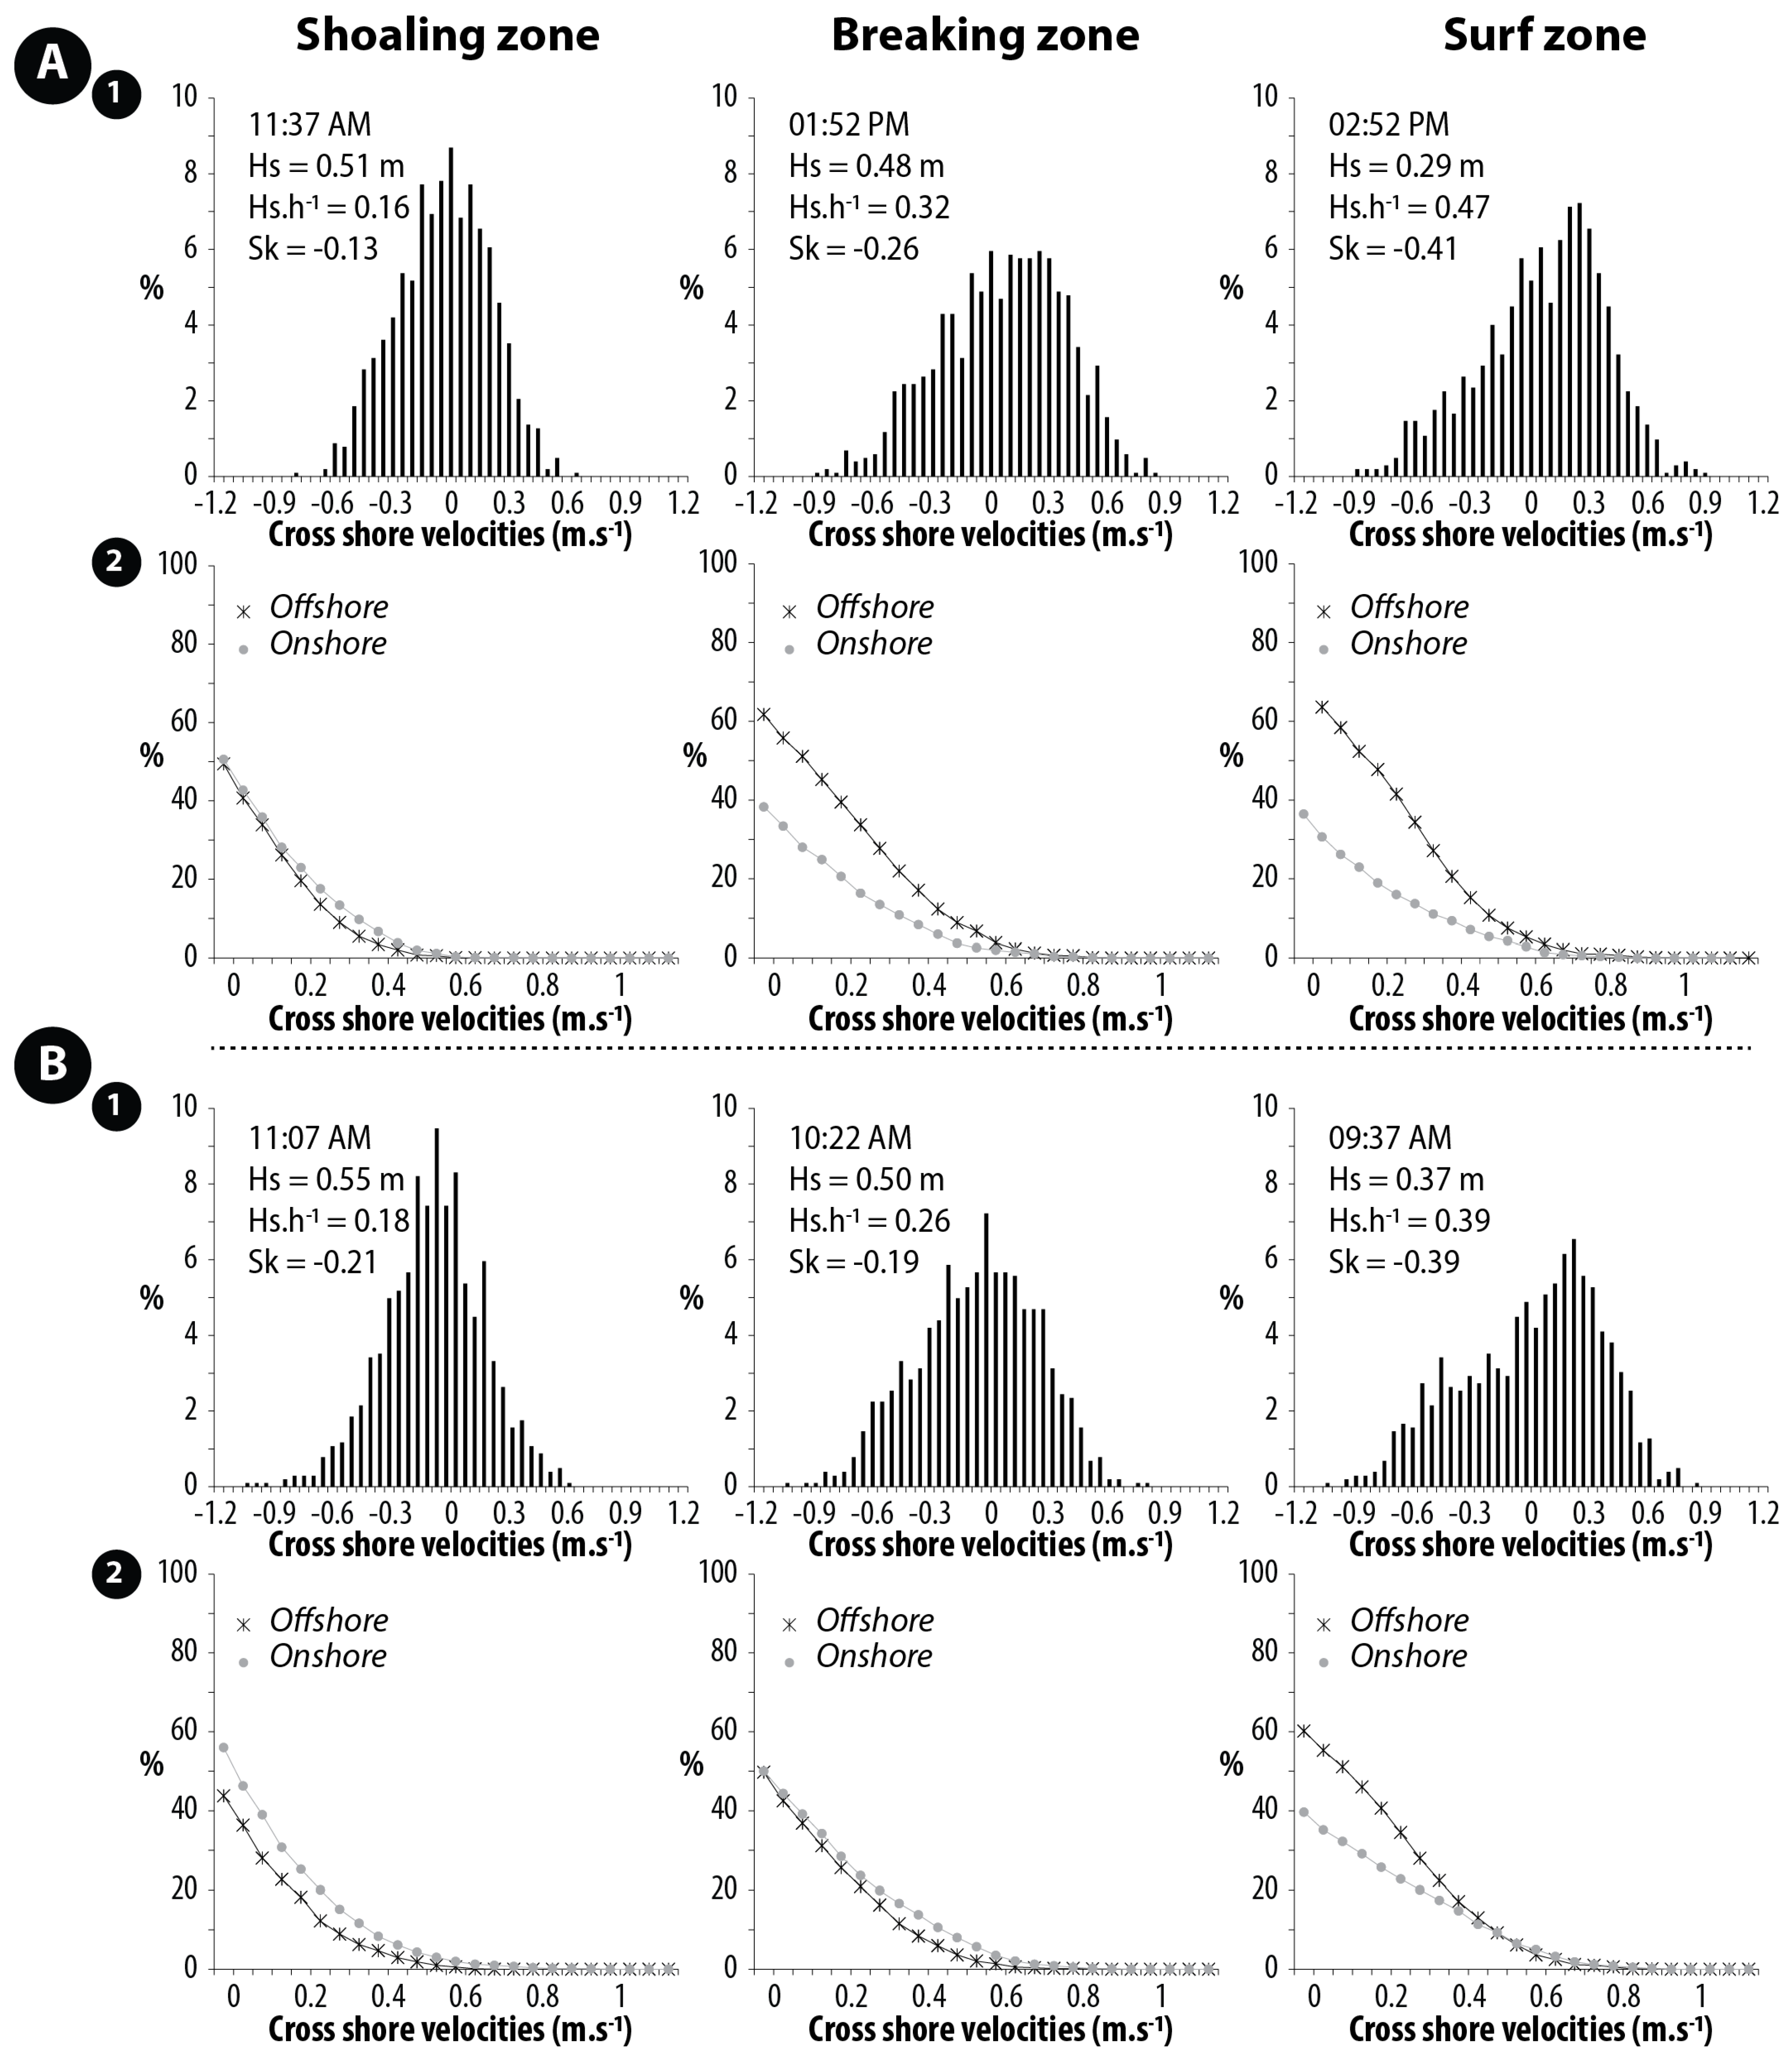
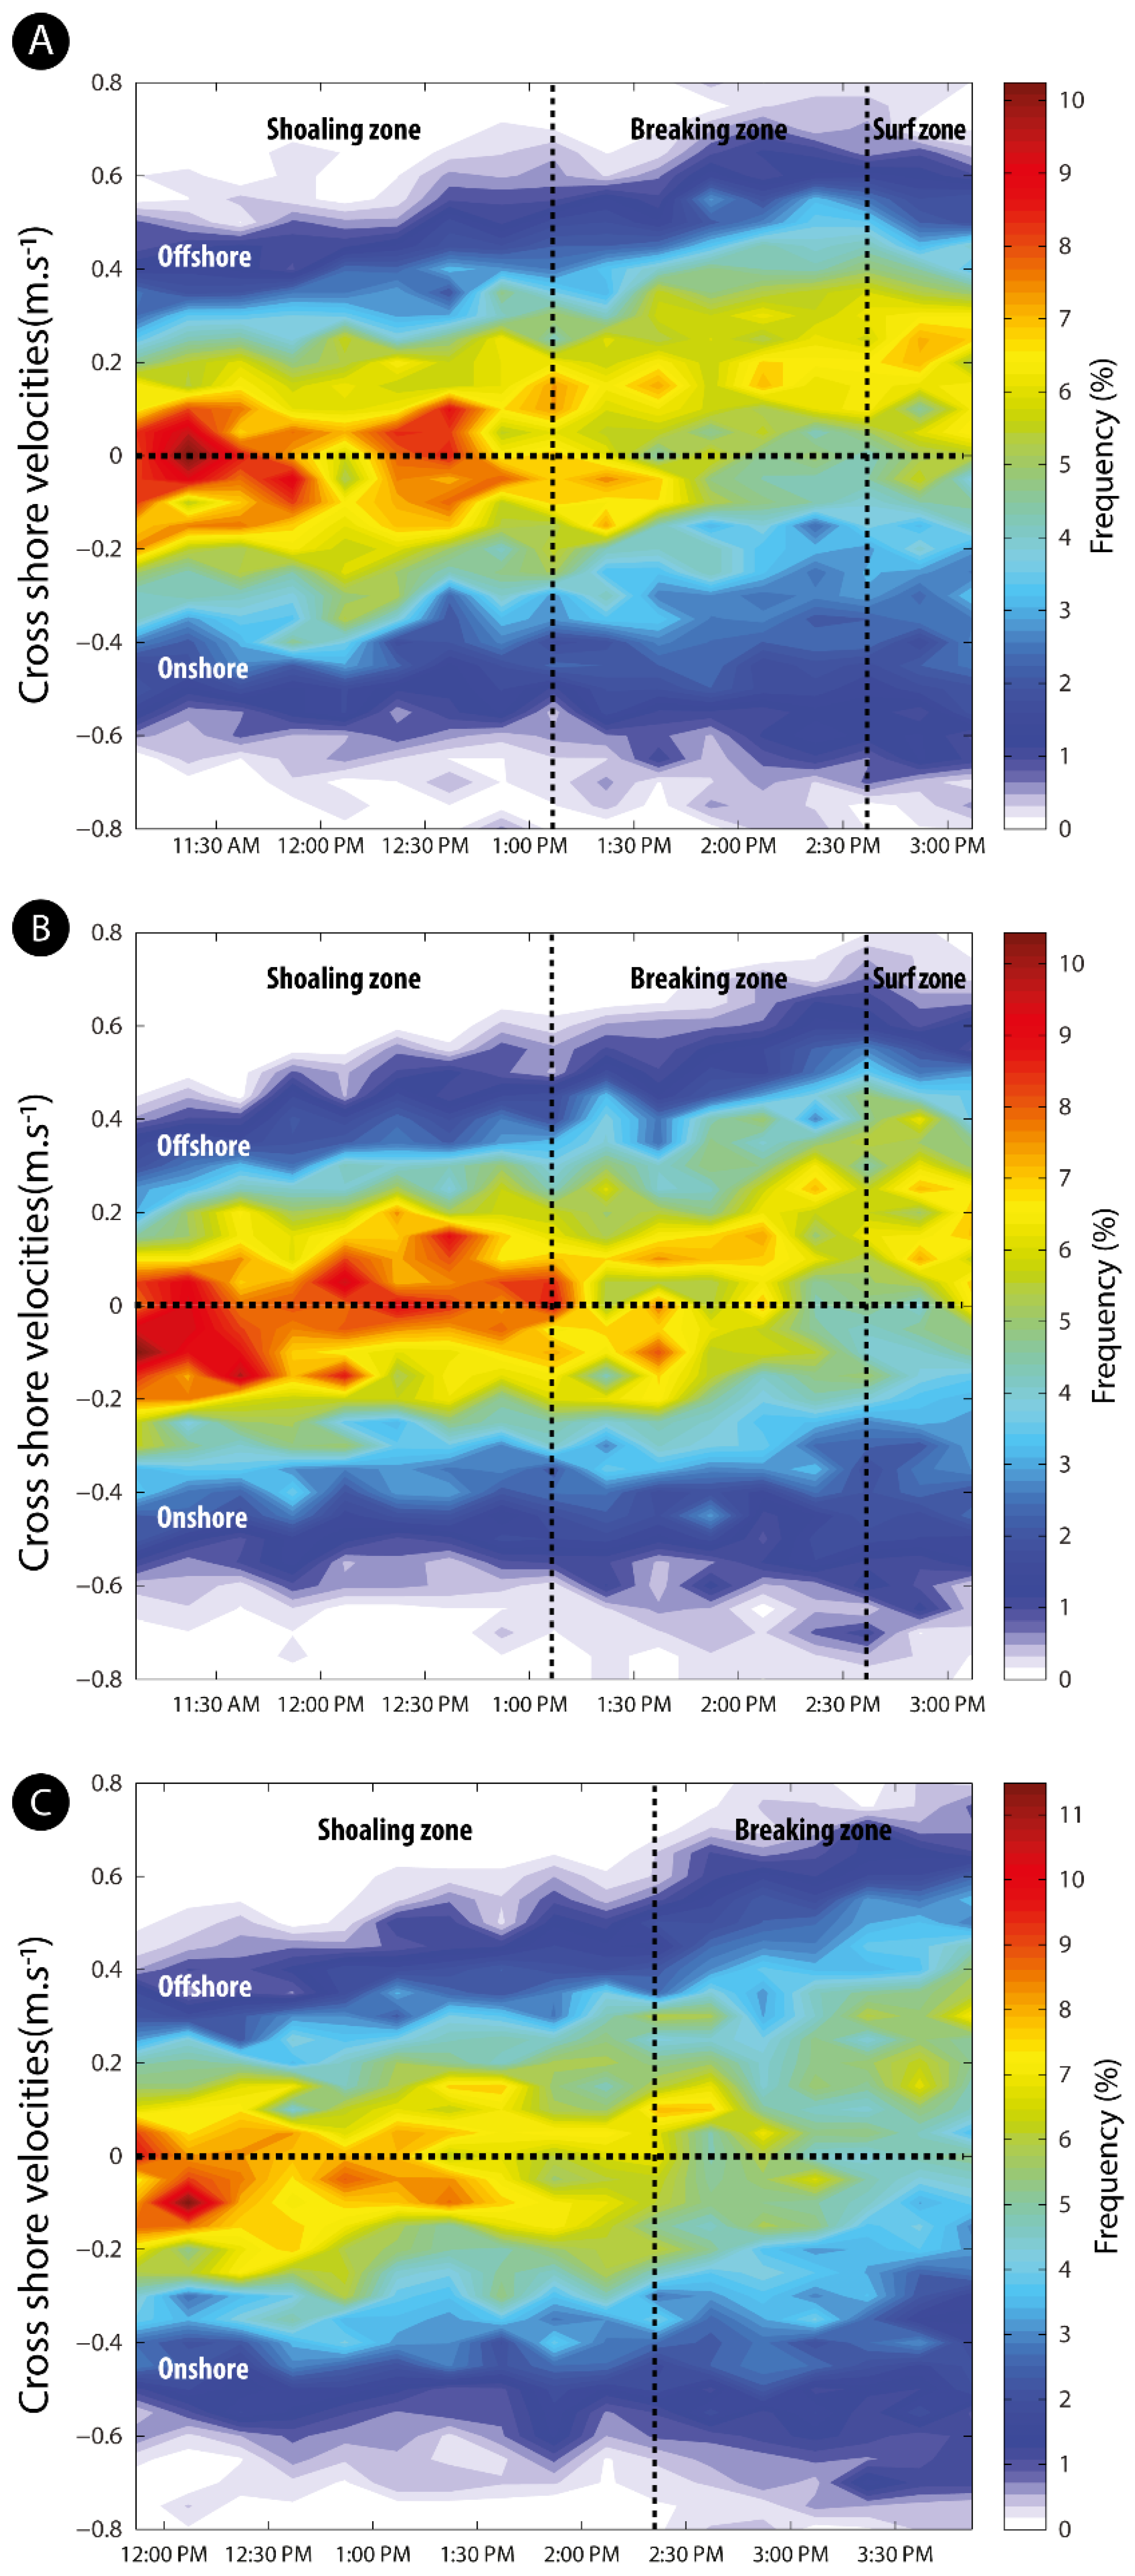
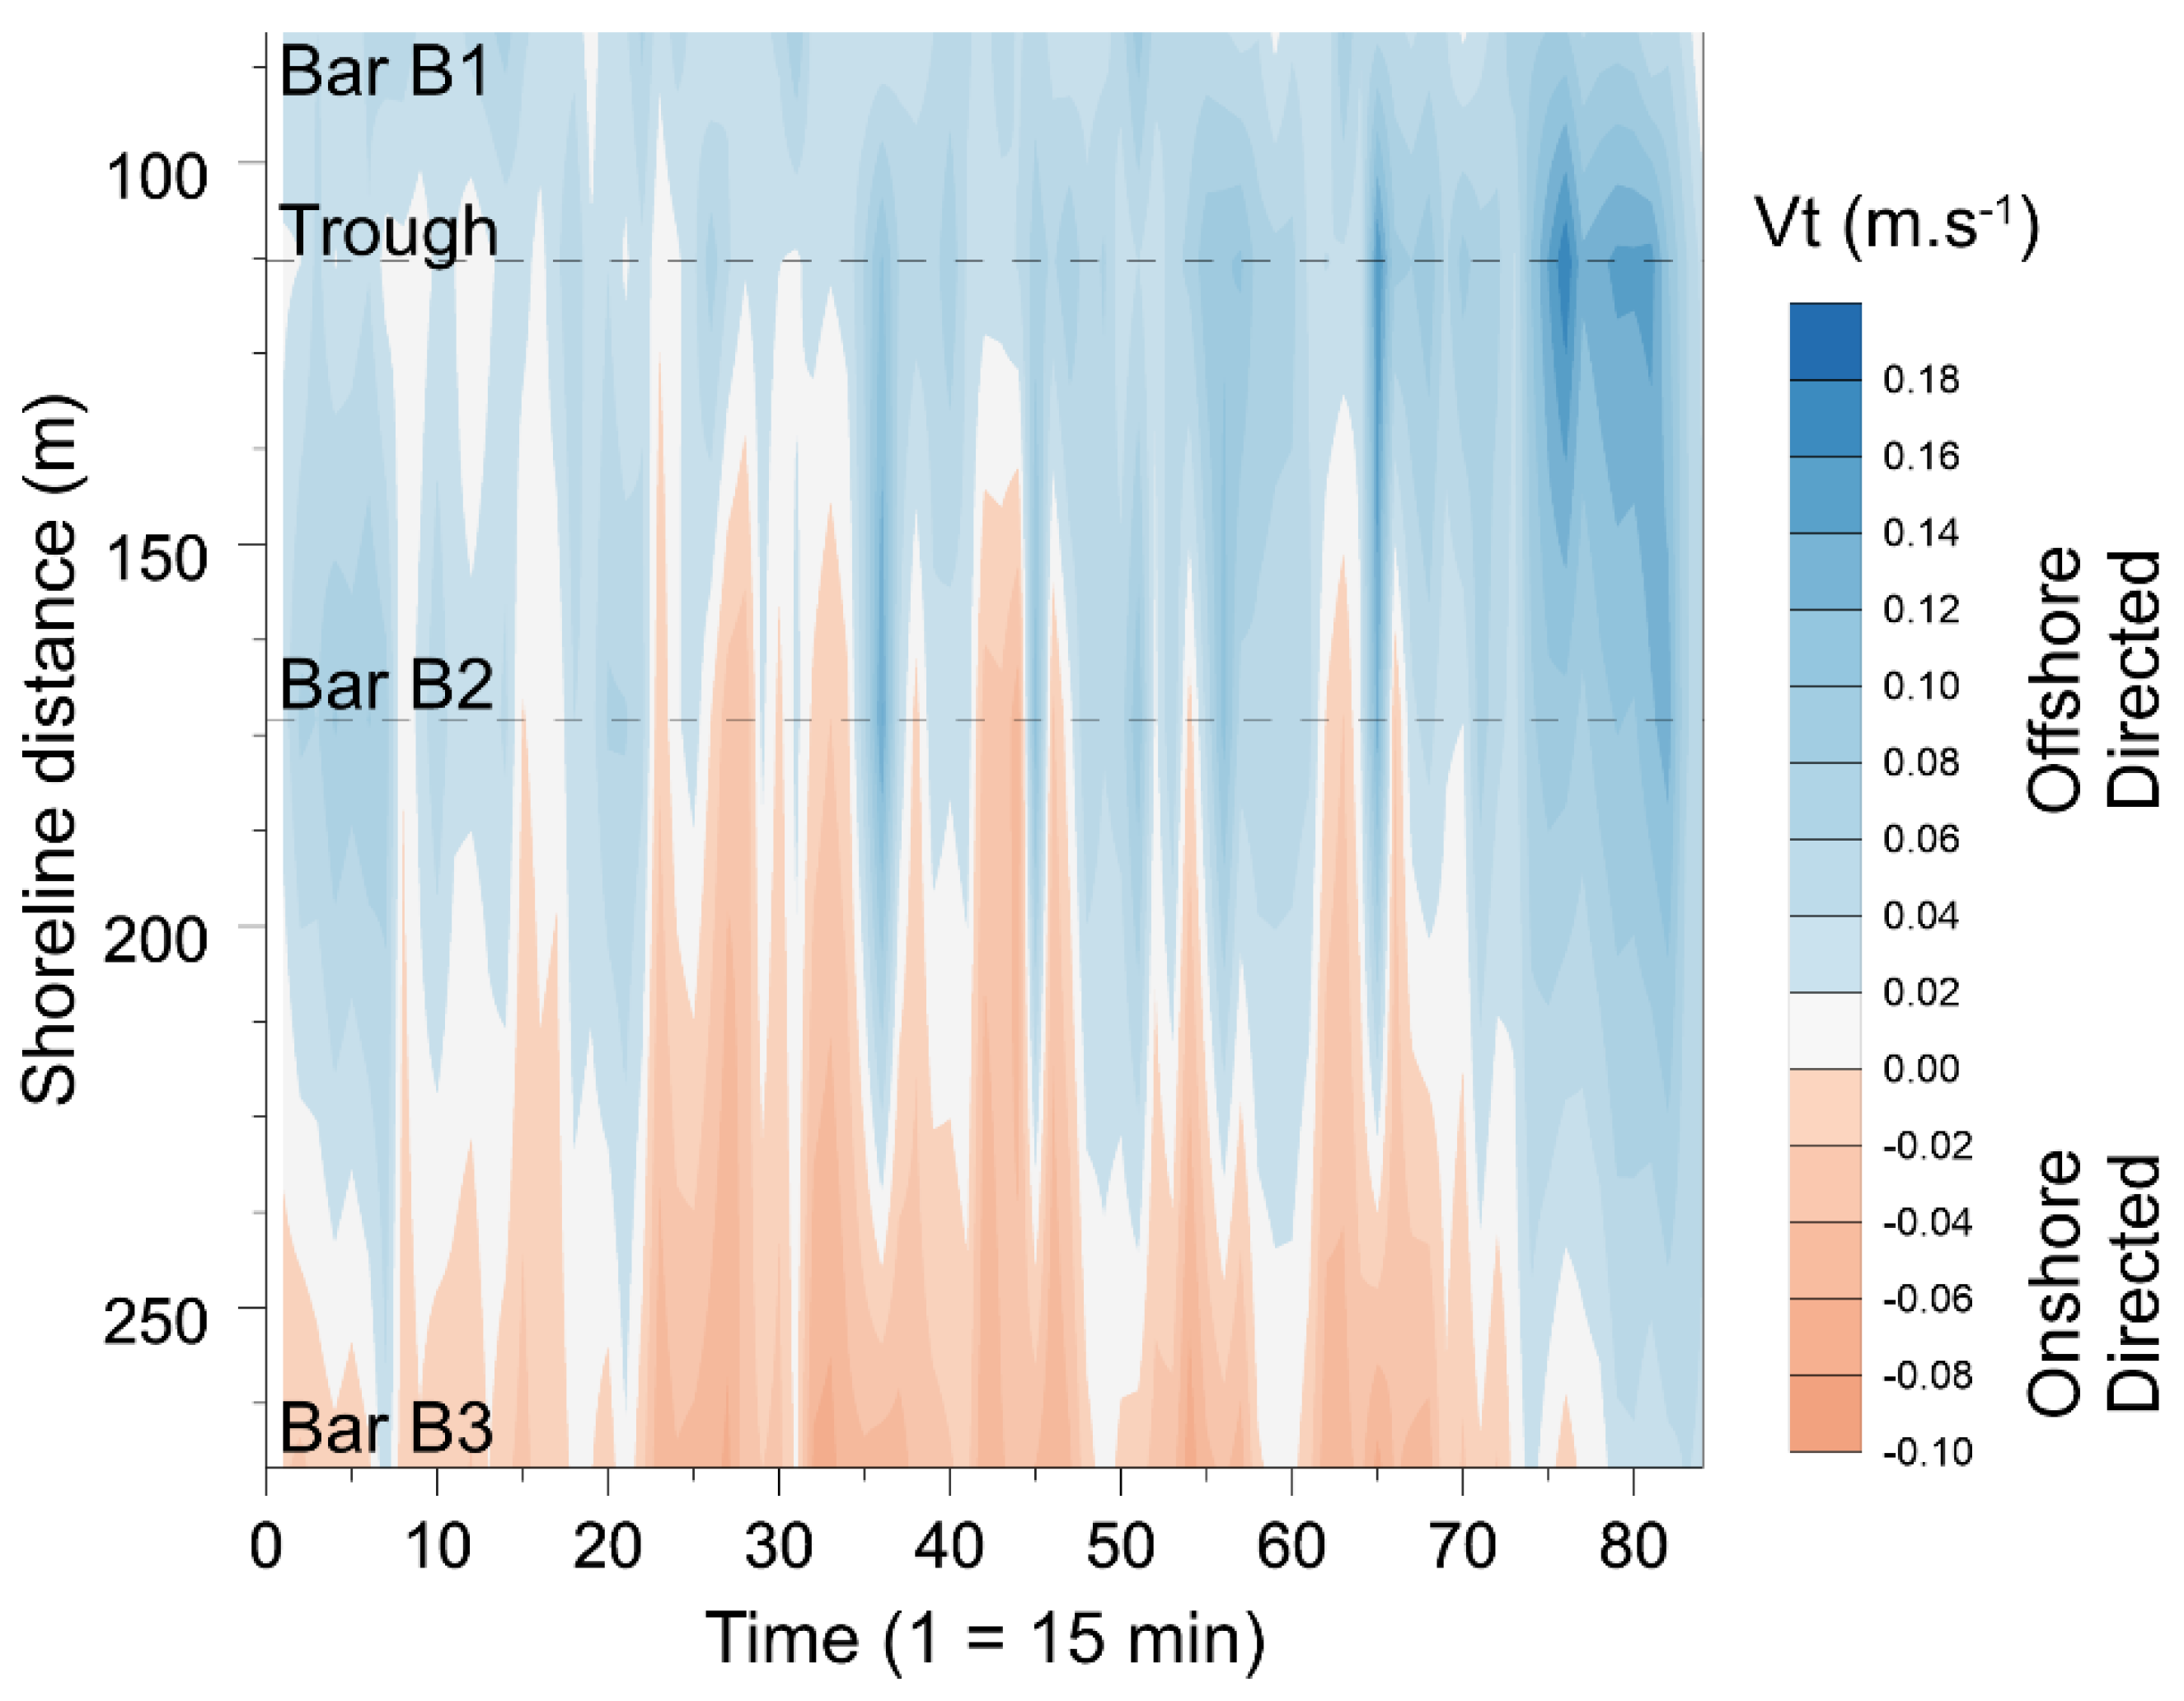
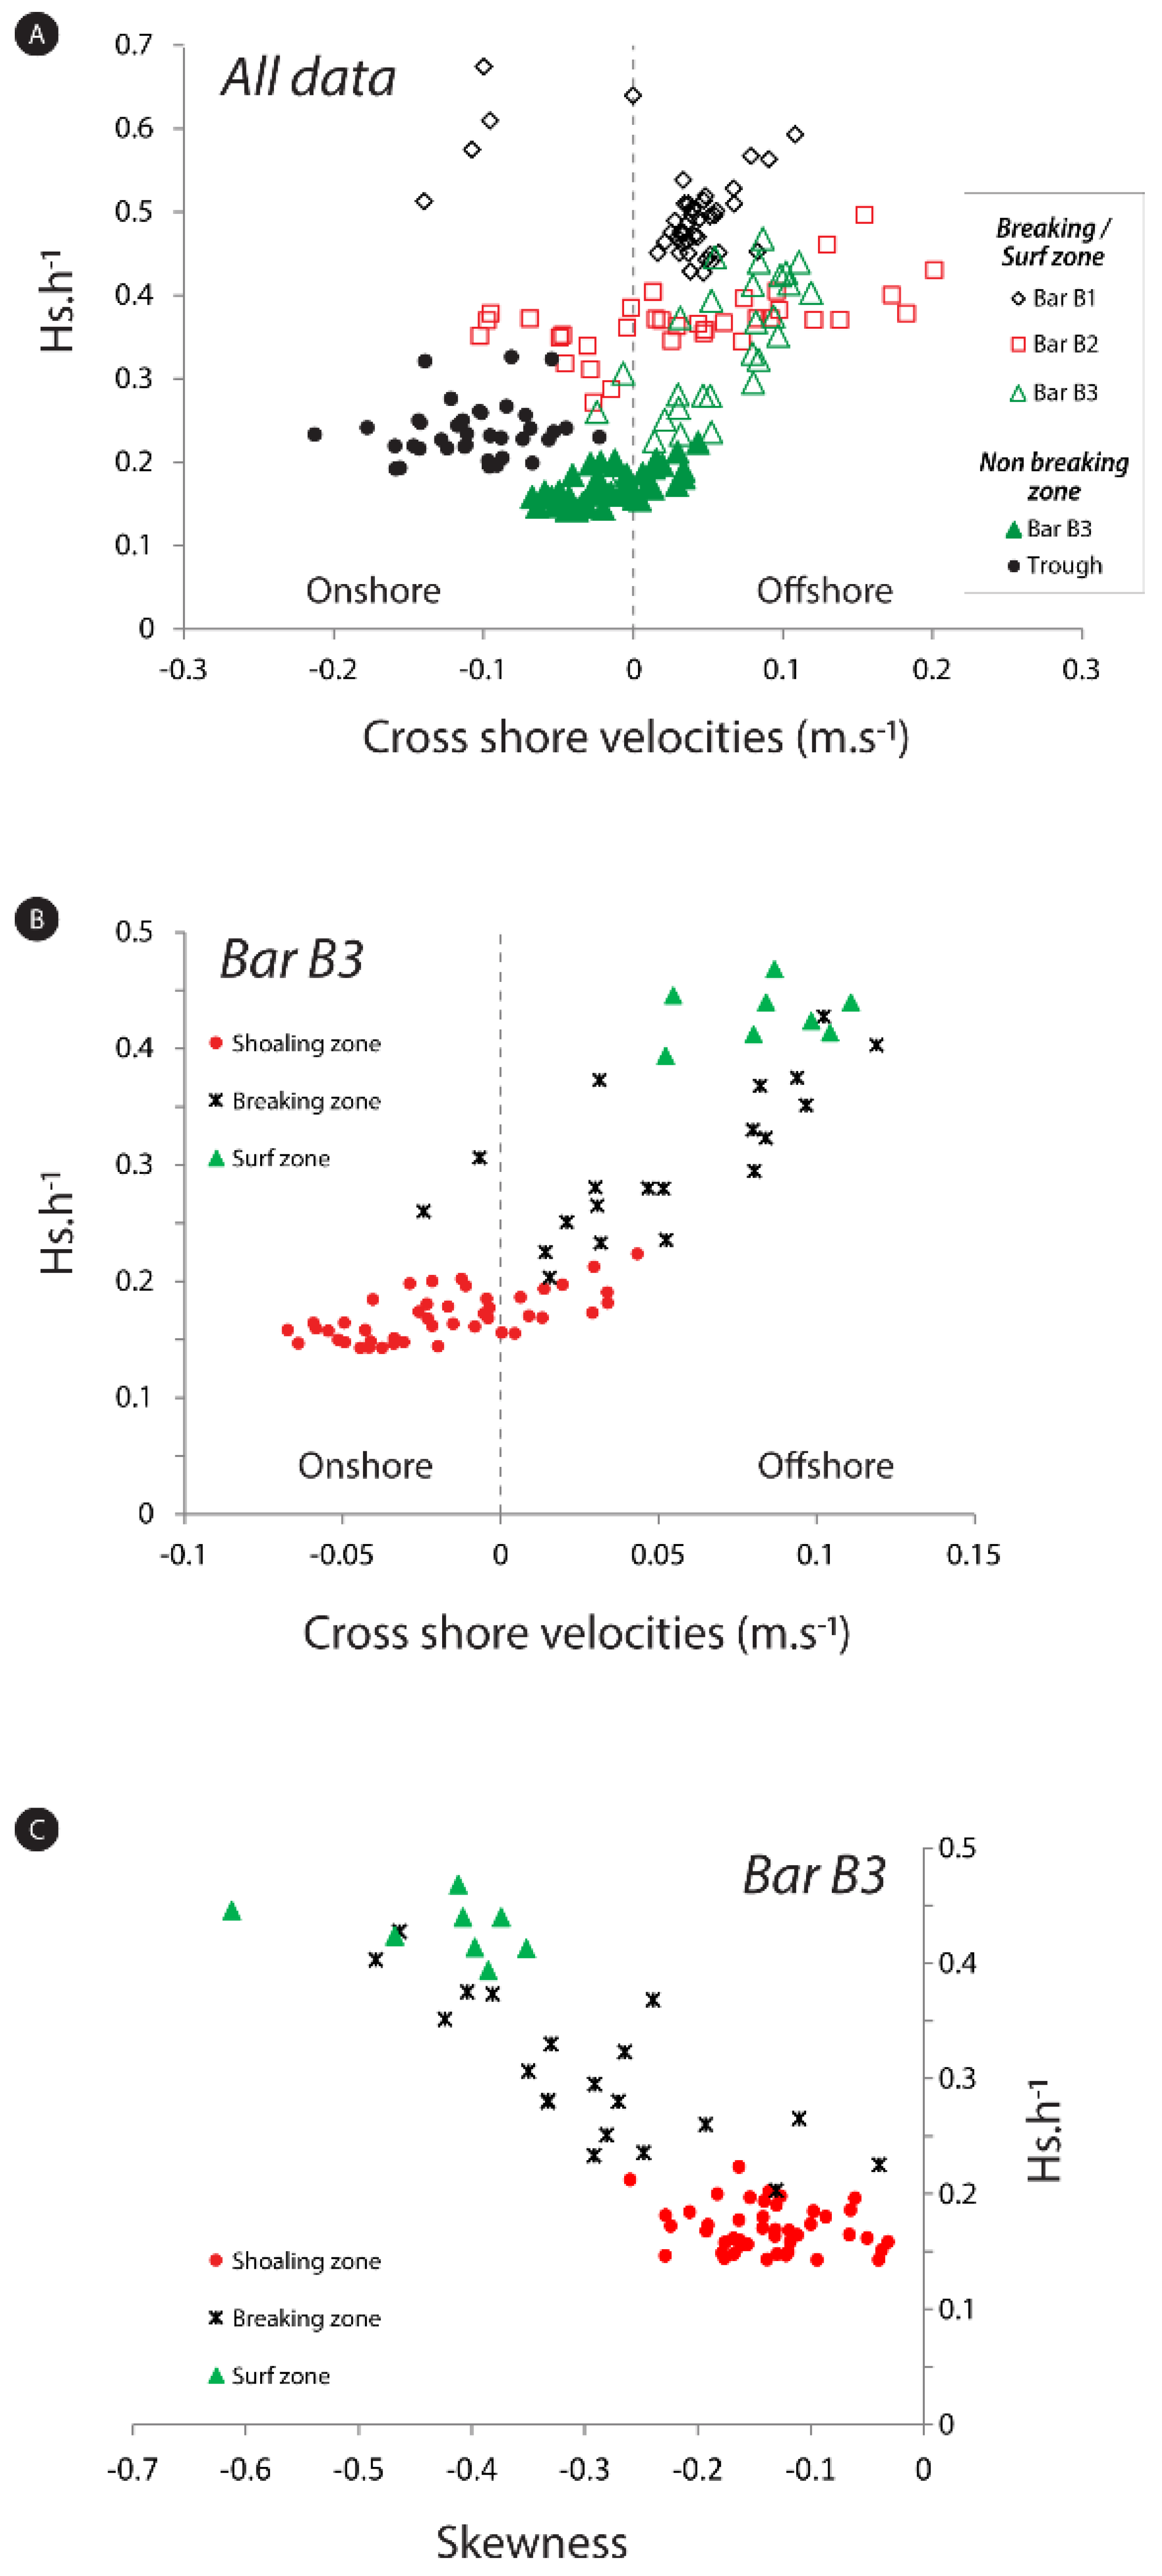
4.4. Characterization of Cross-Shore Currents
5. Discussion
6. Conclusions
Author Contributions
Funding
Institutional Review Board Statement
Informed Consent Statement
Data Availability Statement
Acknowledgments
Conflicts of Interest
References
- Levoy, F.; Monfort, O.; Larsonneur, C. Hydrodynamic variability on megatidal beaches, Normandy, France. Cont. Shelf Res. 2001, 21, 563–586. [Google Scholar] [CrossRef]
- Masselink, G.; Anthony, E.J. Location and height of inter-tidal bars on macrotidal ridge and runnel beaches. Earth Surf. Process. Landf. 2001, 26, 759–774. [Google Scholar] [CrossRef]
- Kroon, A.; Masselink, G. Morphodynamics of intertidal bar morphology on a macrotidal beach under low-energy wave conditions, North Lincolnshire, England. Mar. Geol. 2002, 190, 591–608. [Google Scholar] [CrossRef]
- Anthony, E.J.; Levoy, F.; Montfort, O. Morphodynamics of intertidal bars on a megatidal beach, Merlimont, Northern France. Mar. Geol. 2004, 208, 73–100. [Google Scholar] [CrossRef]
- Reichmüth, B.; Anthony, E.J. Tidal influence on the intertidal bar morphology of two contrasting macrotidal beaches. Geomorphology 2007, 90, 101–114. [Google Scholar] [CrossRef]
- Cartier, A.; Héquette, A. The influence of intertidal bar-trough morphology on sediment transport on macrotidal beaches, northern France. Zeits. Geomorph. 2013, 57, 325–347. [Google Scholar] [CrossRef]
- Anthony, E.J.; Levoy, F.; Montfort, O.; Degryse-Kulkarni, C. Patterns of short-term intertidal bar mobility on a ridge and runnel beach, Merlimont, Northern of France. Earth Surf. Process. Landf. 2005, 30, 81–93. [Google Scholar] [CrossRef]
- Masselink, G. Formation and evolution of multiple intertidal bars on macrotidal beaches application of a morphodynamic model. Coast. Eng. 2004, 51, 713–730. [Google Scholar] [CrossRef]
- Masselink, G.; Kroon, A.; Davidson-Arnott, R. Morphodynamics of intertidal bars in wave-dominated coastal settings—A review. Geomorphology 2006, 73, 33–49. [Google Scholar] [CrossRef]
- Reichmüth, B.; Anthony, E.J. Dynamics of intertidal drainage channels on a multi barred macrotidal beach. Earth Surf. Process. Landf. 2008, 33, 142–151. [Google Scholar] [CrossRef]
- Poate, T.; Masselink, G.; Russell, P.; Austin, M. Morphodynamic variability of high-energy macrotidal beaches, Cornwall, UK. Mar. Geol. 2014, 350, 97–111. [Google Scholar] [CrossRef]
- Davidson, M.A.; Russell, P.; Huntley, D.; Hardisty, J. Tidal asymmetry in suspended sand transport on a macrotidal intermediate beach. Mar. Geol. 1993, 110, 333–353. [Google Scholar] [CrossRef]
- Voulgaris, G.; Simmonds, D.; Michel, D.; Howa, H.; Collins, M.B.; Huntley, D. Measuring and modelling sediment transport on a macrotidal ridge and runnel beach: An intercomparison. J. Coast. Res. 1998, 14, 315–330. [Google Scholar]
- Masselink, G.; Pattiaratchi, C. Tidal asymmetry in sediment resuspension on a macrotidal beach in northwestern Australia. Mar. Geol. 2000, 163, 257–274. [Google Scholar] [CrossRef]
- Corbau, C.; Ciavola, P.; Gonzalez, R.; Ferreira, O. Measurements of cross-shore sand fluxes on a macrotidal pocket beach (Saint-Georges Beach, Atlantic Coast, SW France). J. Coast. Res. 2002, 36, 182–189. [Google Scholar] [CrossRef][Green Version]
- Sedrati, M.; Anthony, E.J. Storm-generated morphological change and longshore sand transport in the intertidal zone of a multi-barred macrotidal beach. Mar. Geol. 2007, 244, 209–229. [Google Scholar] [CrossRef]
- Austin, M.; Masselink, G.; O’Harea, T.; Russell, P. Onshore sediment transport on a sandy beach under varied wave conditions: Flow velocity skewness, wave asymmetry or bed ventilation? Mar. Geol. 2009, 259, 86–101. [Google Scholar] [CrossRef]
- Cartier, A.; Héquette, A. Variation in longshore sediment transport under low to moderate conditions on barred macrotidal beaches. J. Coast. Res. 2011, 64, 45–49. [Google Scholar]
- Cartier, A.; Héquette, A. Vertical distribution of longshore sediment transport on barred macrotidal beaches, Northern France. Cont. Shelf Res. 2015, 93, 1–16. [Google Scholar] [CrossRef]
- Dehouck, A.; Dupuis, H.; Sénéchal, N. Pocket beach hydrodynamics: The example of four macrotidal beaches, Brittany, France. Mar. Geol. 2009, 266, 1–17. [Google Scholar] [CrossRef]
- Austin, M.; Scott, T.; Brown, J.; Brown, J.; MacMahan, J.; Masselink, G.; Russell, P. Temporal observations of rip current circulation on a macro-tidal beach. Cont. Shelf Res. 2010, 30, 1149–1165. [Google Scholar] [CrossRef]
- Haines, J.W.; Sallenger, A.H., Jr. Vertical structure of mean cross-shore currents across a barred surf zone. J. Geophys. Res. 1994, 99, 14223–14242. [Google Scholar] [CrossRef]
- Kuriyama, Y.; Nakatsukasa, T. A one-dimensional model for undertow and longshore current on a barred beach. Coast. Eng. 2000, 40, 39–58. [Google Scholar] [CrossRef]
- Rattanapitikon, W.; Shibayama, T. Simple model for undertow profile. Coast. Eng. Jour. 2000, 42, 1–30. [Google Scholar] [CrossRef]
- Cambazoglu, M.K.; Haas, K.A. Numerical modeling of breaking waves and cross-shore currents on barred beaches. J. Water. Port Coast. Ocean Eng. 2011, 137, 310–323. [Google Scholar] [CrossRef]
- Biausque, M.; Grottolia, E.; Jackson, D.W.T.; Cooper, J.A.G. Multiple intertidal bars on beaches: A review. Earth-Sci. Rev. 2020, 210, 103358. [Google Scholar] [CrossRef]
- Kamphuis, J.W. Alongshore sediment transport rate. J. Water. Port Coast. Ocean Eng. 1991, 117, 624–640. [Google Scholar] [CrossRef]
- Smith, E.R.; Wang, P.; Ebersole, B.A.; Zhang, J. Dependence of total longshore sediment transport rates on incident wave parameters and breaker type. J. Coast. Res. 2009, 25, 675–683. [Google Scholar] [CrossRef]
- Van Rijn, L.C. Prediction of dune erosion due to storms. Coast. Eng. 2009, 56, 441–457. [Google Scholar] [CrossRef]
- Corbella, S.; Stretch, D.D. Predicting coastal erosion trends using non-stationary statistics and process-based models. Coast. Eng. 2012, 70, 40–49. [Google Scholar] [CrossRef]
- D’Alessandro, F.; Tomasicchio, G.R. Wave-dune interaction and beach resilience in large-scale physical model tests. Coast. Eng. 2016, 116, 15–25. [Google Scholar] [CrossRef]
- Giardino, A.; van der Werf, J.; van Ormondt, M. Simulating Coastal Morphodynamics with Delft3D: Case Study Egmond aan Zee. Ph.D. Thesis, Delft University of Technology, Delft, The Netherlands, 2010; 78p. [Google Scholar]
- Simmons, J.A.; Harley, M.D.; Marshall, L.A.; Turner, I.L.; Splinter, K.D.; Cox, R.J. Calibrating and assessing uncertainty in coastal numerical models. Coast. Eng. 2017, 125, 28–41. [Google Scholar] [CrossRef]
- Hieu, P.D.; Katsutoshi, T.; Ca, V.T. Numerical simulation of breaking waves using a two-phase flow model. Appl. Math. Model. 2004, 28, 983–1005. [Google Scholar] [CrossRef]
- Cienfuegos, R.; Barthélemy, E.; Bonneton, P. Wave-breaking model for Boussinesq-type equations including roller effects in the mass conservation equation. J. Water. Port Coast. Ocean Eng. 2010, 136, 10–26. [Google Scholar] [CrossRef]
- Kasinatha Pandian, P.; Emmanuel, O.; Ruscoe, J.P.; Side, J.C.; Harris, R.E.; Kerr, S.A.; Bullen, C.R. An overview of recent technologies on wave and current measurement in coastal and marine applications. J. Ocean. Mar. Sci. 2010, 1, 1–10. [Google Scholar]
- Héquette, A.; Cartier, A. Theoretical and observed breaking wave height on a barred macrotidal beach: Implications for the estimation of breaker index on beaches with large tidal range. J. Coast. Res. 2016, 75, 861–866. [Google Scholar] [CrossRef]
- Thornton, E.B.; Guza, R.T. Energy saturation and phase speeds measured on a natural beach. J. Geophys. Res. 1982, 87, 9499–9508. [Google Scholar] [CrossRef]
- Sallenger, A.H., Jr.; Hollman, R.A. Wave energy saturation on a natural beach of variable slope. J. Geophys. Res. 1985, 90, 11939–11944. [Google Scholar] [CrossRef]
- Anthony, E.J.; Héquette, A. The grain-size characterisation of coastal sand from the Somme estuary to Belgium: Sediment segregation processes and sources consideration. Sed. Geol. 2007, 202, 369–382. [Google Scholar] [CrossRef]
- SHOM. Références Altimétriques Maritimes—Ports de France Métropolitaine et D’outre-Mer. In Cotes du Zéro Hydrographique et Niveaux Caractéristiques de la Marée; Service Hydrographique et Océanographique de la Marine: Brest, France, 2013; 116p. [Google Scholar]
- Héquette, A.; Hemdane, Y.; Anthony, E.J. Sediment transport under wave and current combined flows on a tide-dominated shoreface, northern coast of France. Mar. Geol. 2008, 249, 226–242. [Google Scholar] [CrossRef]
- Héquette, A.; Hemdane, Y.; Anthony, E.J. Determination of sediment transport paths in macrotidal shoreface environments: A comparison of grain-size trend analysis with near-bed current measurements. J. Coast. Res. 2008, 24, 695–707. [Google Scholar] [CrossRef]
- Ruz, M.H.; Héquette, A.; Maspataud, A. Identifying forcing conditions responsible for foredune erosion on the northern coast of France. J. Coast. Res. 2009, 56, 356–360. [Google Scholar]
- CEREMA. Dynamiques et Évolution du Littoral—Fascicule 1: De la Frontière Belge à la Pointe du Hourdel; Ministère de la Transition Écologique et Solidaire: Bron, France, 2018; 499p. [Google Scholar]
- Karimpour, A.; Chen, Q. Wind wave analysis in depth limited water using OCEANLYZ, A MATLAB toolbox. Comput. Geosc. 2013, 106, 181–189. [Google Scholar] [CrossRef]
- Garcez Faria, A.F.; Thornton, E.B.; Stanton, T.P.; Soares, C.V.; Lippmann, T.C. Vertical profiles of longshore currents and related bed shear stress and bottom roughness. J. Geophys. Res. 1998, 103, 3217–3232. [Google Scholar] [CrossRef]
- Guza, R.T.; Thornton, E.B. Velocity moments in nearshore. J. Water. Ports Coast. Ocean Eng. 1985, 111, 235–256. [Google Scholar] [CrossRef]
- Greenwood, B.; Osborne, P.D. Equilibrium slopes and cross-shore velocity asymmetries in a storm-dominated, barred nearshore system. Mar. Geol. 1991, 96, 211–235. [Google Scholar] [CrossRef][Green Version]
- Bowen, A.J. Nearshore Velocity Measurements and Beach Equilibrium. In Proceedings of the Canadian Coastal Conference, Burlington, ON, Canada, 22–24 April 1980; National Research Council Canada: Ottawa, ON, Canada, 1980; pp. 21–30. [Google Scholar]
- Bailard, J.A. An energetics model for a plane sloping beach. J. Geophys. Res. 1981, 86, 10938–10954. [Google Scholar] [CrossRef]
- Grasso, F.; Michallet, H.; Barthélemy, E. Sediment transport associated with morphological beach changes forced by irregular asymmetric, skewed waves. J. Geophys. Res. 2011, 116, C03020. [Google Scholar] [CrossRef]
- Galvin, C.J.; Eagleson, P.E. Experimental Study of Longshore Currents on a Plane Beach; Technical Memo No. 10; US Army Coastal Engineering Research Center: Washington, DC, USA, 1965; 80p. [Google Scholar]
- Grasso, F.; Ruessink, B.G. Vertical structure of the turbulent dissipation rate in the surf zone. J. Coast. Res. 2011, 64, 90–94. [Google Scholar]
- Ruessink, B.G.; Houwman, K.T.; Koestra, P. The systematic contribution of transporting mechanisms to the cross-shore sediment transport in water depths of 3 to 9 m. Mar. Geol. 1998, 152, 295–324. [Google Scholar] [CrossRef]
- Masselink, G.; Black, K.P. Magnitude and cross-shore distribution of bed return flow measured on natural beaches. Coast. Eng. 1995, 25, 165–190. [Google Scholar] [CrossRef]
- Garcez Faria, A.F.; Thornton, E.B.; Lippmann, T.C.; Stanton, T.P. Undertow over a barred beach. J. Geophys. Res. 2000, 105, 16999–17010. [Google Scholar] [CrossRef]
- Svendsen, I.A. Analysis of surf zone turbulence. J. Geophys. Res. 1987, 92, 5115–5124. [Google Scholar] [CrossRef]
- Schmitt, F.G.; Huang, Y.; Lu, Z.; Liu, Y.; Fernandez, N. Analysis of velocity fluctuations and their intermittency properties in the surf zone using empirical mode decomposition. J. Mar. Syst. 2009, 77, 473–481. [Google Scholar] [CrossRef]
- Elgar, S.; Guza, R.T. Observations of bispectra of shoaling surface gravity waves. J. Fluid Mech. 1985, 161, 425–448. [Google Scholar] [CrossRef]
- Rijnsdorp, D.P.; Ruessink, G.; Zijlema, M. Infragravity-wave dynamics in a barred coastal region, a numerical study. J. Geophys. Res. Oceans. 2015, 120, 4068–4089. [Google Scholar] [CrossRef]
- Longuet-Higgins, M.S.; Stewart, R.W. Radiation stress and mass transport in surface gravity waves with application to ‘surf beats’. J. Fluid Mech. 1962, 13, 481–504. [Google Scholar] [CrossRef]
- Battjes, J.A.; Bakkenes, H.J.; Janssen, T.T.; Van Dongeren, A.R. Shoaling of subharmonic gravity waves. J. Geophys. Res. 2004, 109, C02009. [Google Scholar] [CrossRef]
- Sénéchal, N.; Dupuis, H.; Bonneton, P.; Howa, H.; Pedreros, R. Observations of irregular wave transformation in the surf zone over a gently sloping sandy beach on the French Atlantic coastline. Ocean. Acta 2001, 24, 545–556. [Google Scholar] [CrossRef]


| Instrument | Distance from Shoreline (m) | Depth/Elevation Relative to HD (m) | Depth/Elevation Relative to CD (m) |
|---|---|---|---|
| Valeport bar B1 | 85 | 4.7 | 2.0 |
| ADCP trough | 105 | 4.1 | 1.4 |
| ADCP bar B2 | 165 | 3.48 | 0.78 |
| Valeport bar B3 | 260 | 2.35 | −0.35 |
| ADW S4 | 785 | −5.0 | −7.7 |
Publisher’s Note: MDPI stays neutral with regard to jurisdictional claims in published maps and institutional affiliations. |
© 2021 by the authors. Licensee MDPI, Basel, Switzerland. This article is an open access article distributed under the terms and conditions of the Creative Commons Attribution (CC BY) license (https://creativecommons.org/licenses/by/4.0/).
Share and Cite
Héquette, A.; Cartier, A.; Schmitt, F.G. The Effects of Tidal Translation on Wave and Current Dynamics on a Barred Macrotidal Beach, Northern France. J. Mar. Sci. Eng. 2021, 9, 909. https://doi.org/10.3390/jmse9080909
Héquette A, Cartier A, Schmitt FG. The Effects of Tidal Translation on Wave and Current Dynamics on a Barred Macrotidal Beach, Northern France. Journal of Marine Science and Engineering. 2021; 9(8):909. https://doi.org/10.3390/jmse9080909
Chicago/Turabian StyleHéquette, Arnaud, Adrien Cartier, and François G. Schmitt. 2021. "The Effects of Tidal Translation on Wave and Current Dynamics on a Barred Macrotidal Beach, Northern France" Journal of Marine Science and Engineering 9, no. 8: 909. https://doi.org/10.3390/jmse9080909
APA StyleHéquette, A., Cartier, A., & Schmitt, F. G. (2021). The Effects of Tidal Translation on Wave and Current Dynamics on a Barred Macrotidal Beach, Northern France. Journal of Marine Science and Engineering, 9(8), 909. https://doi.org/10.3390/jmse9080909