
Analysis and Experimental Research on Vibration Reduction in Ship High-Temperature Pipeline Based on Long Coated Damping Structure


Abstract
:1. Introduction
2. Modeling of the Long Coated Damping Structure
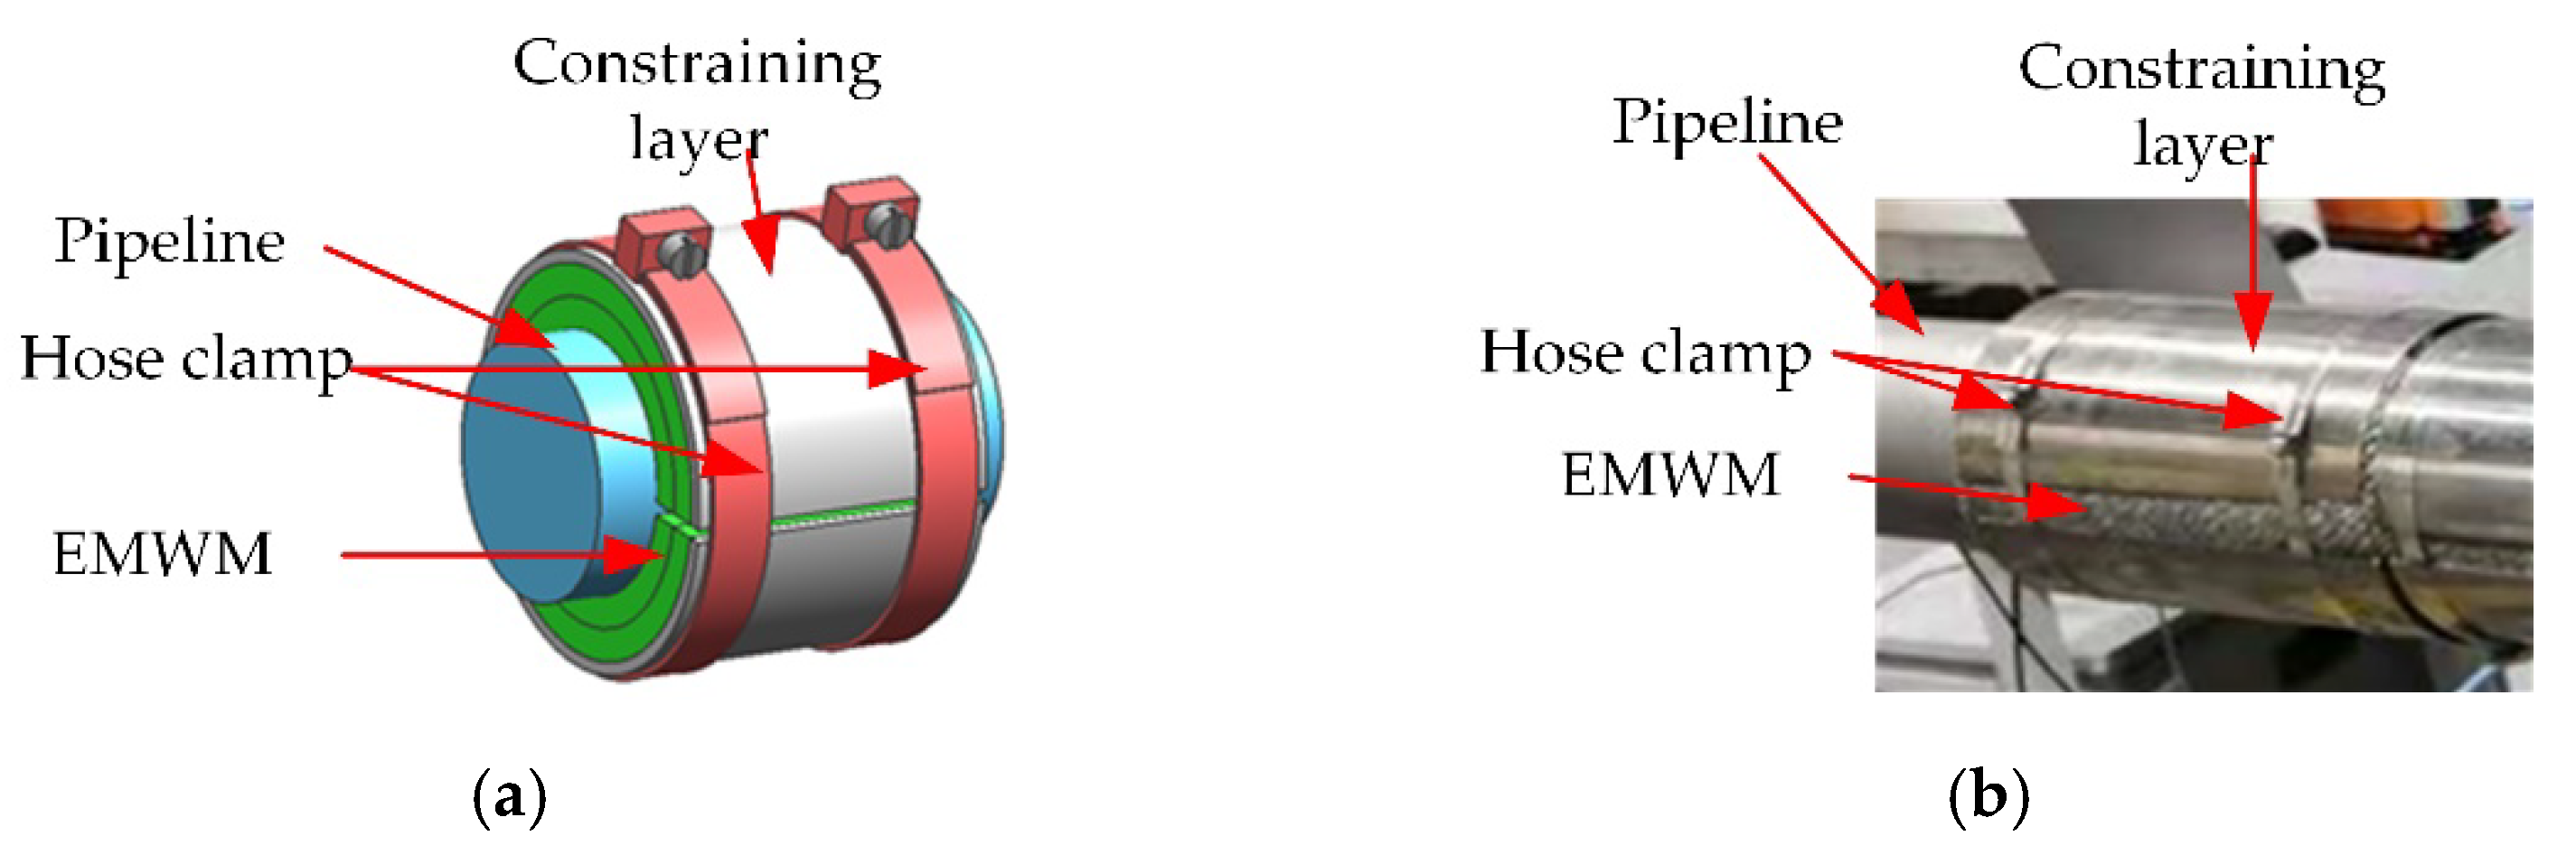
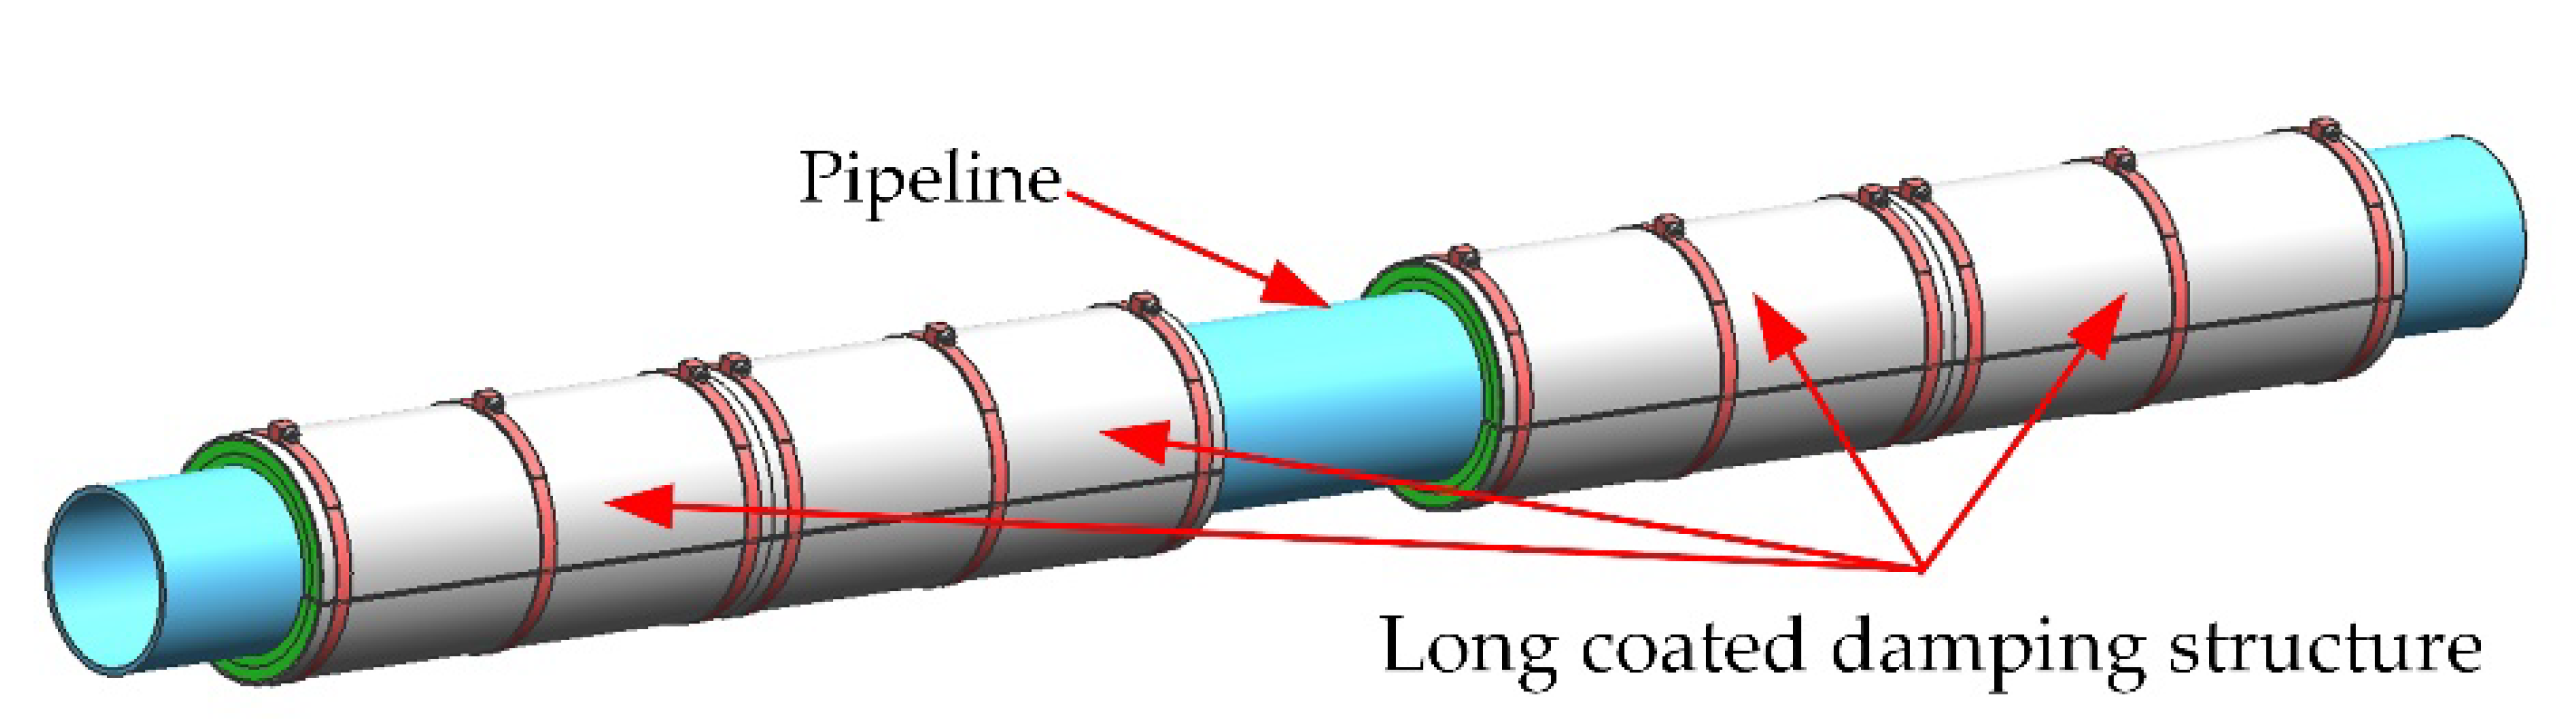
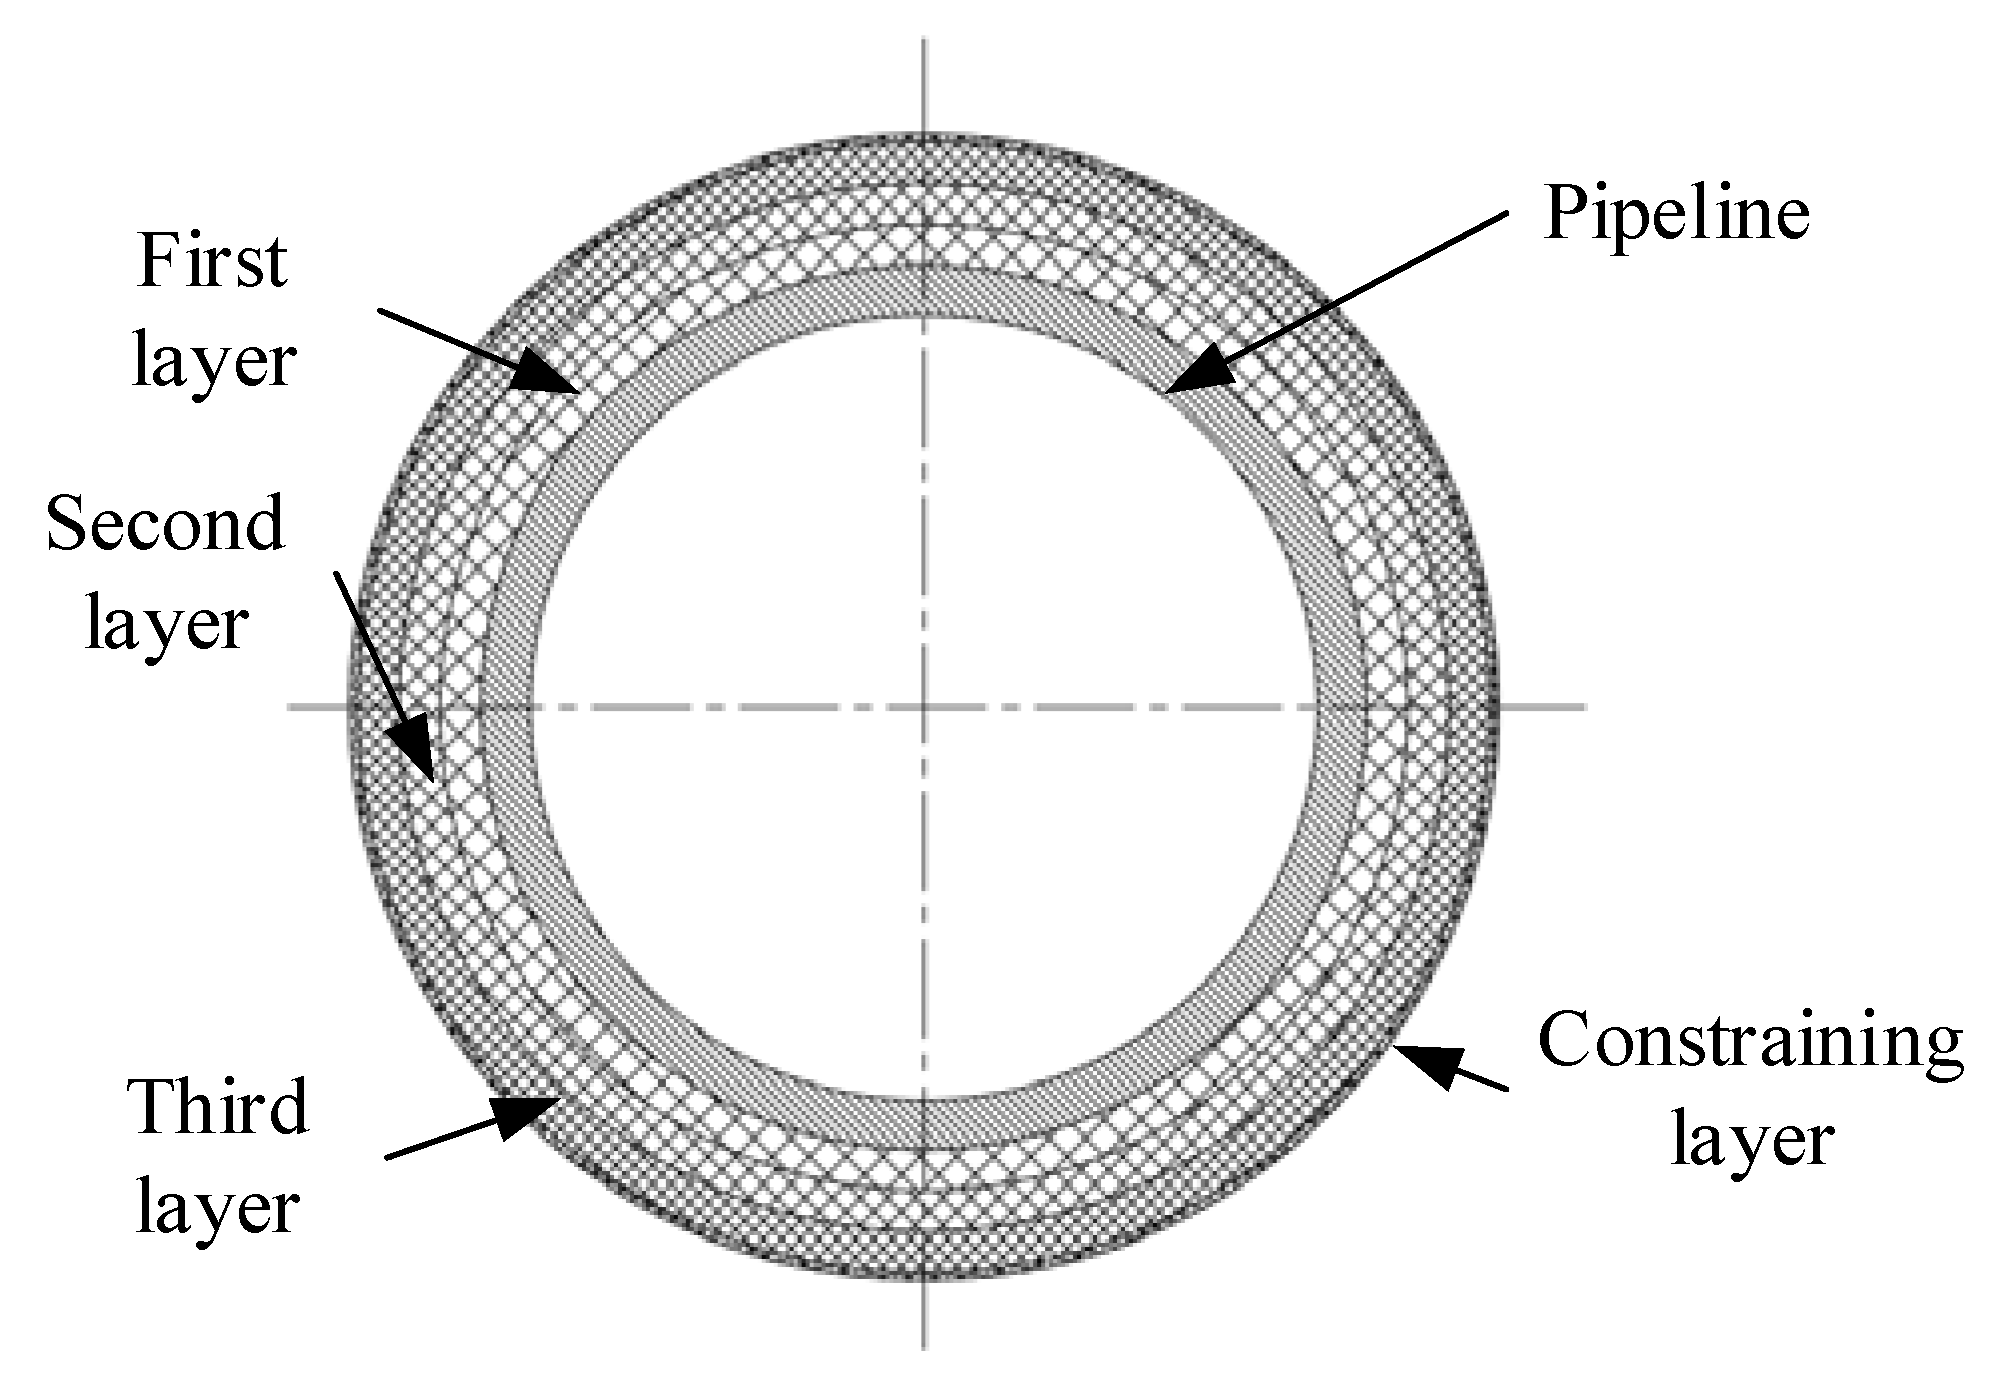
2.1. Long Coated Damping Structure
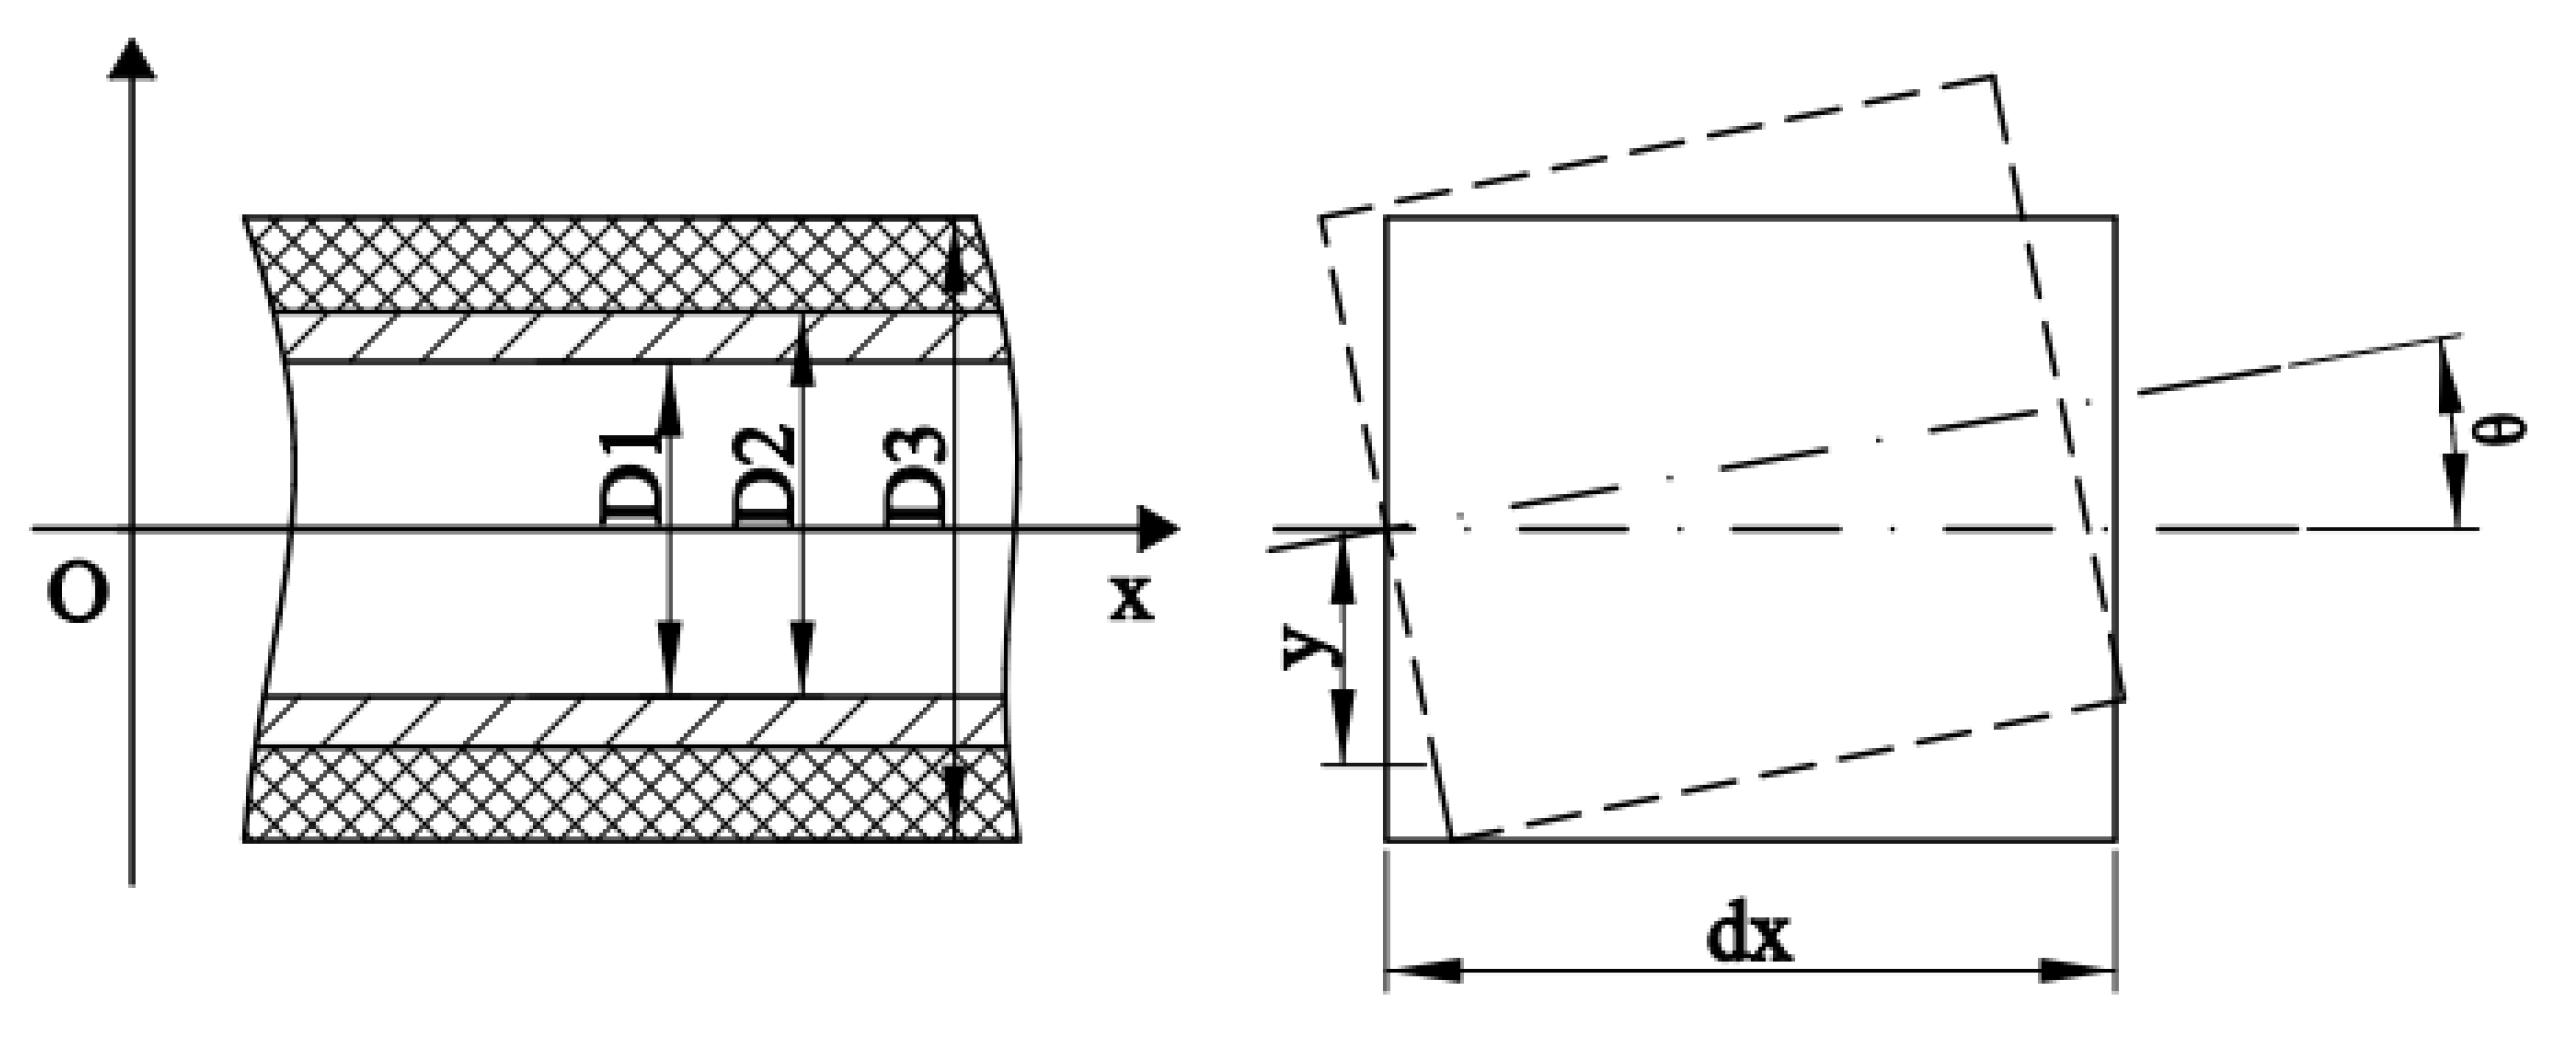
2.2. Mechanical Analysis
3. Specimen and Test Design
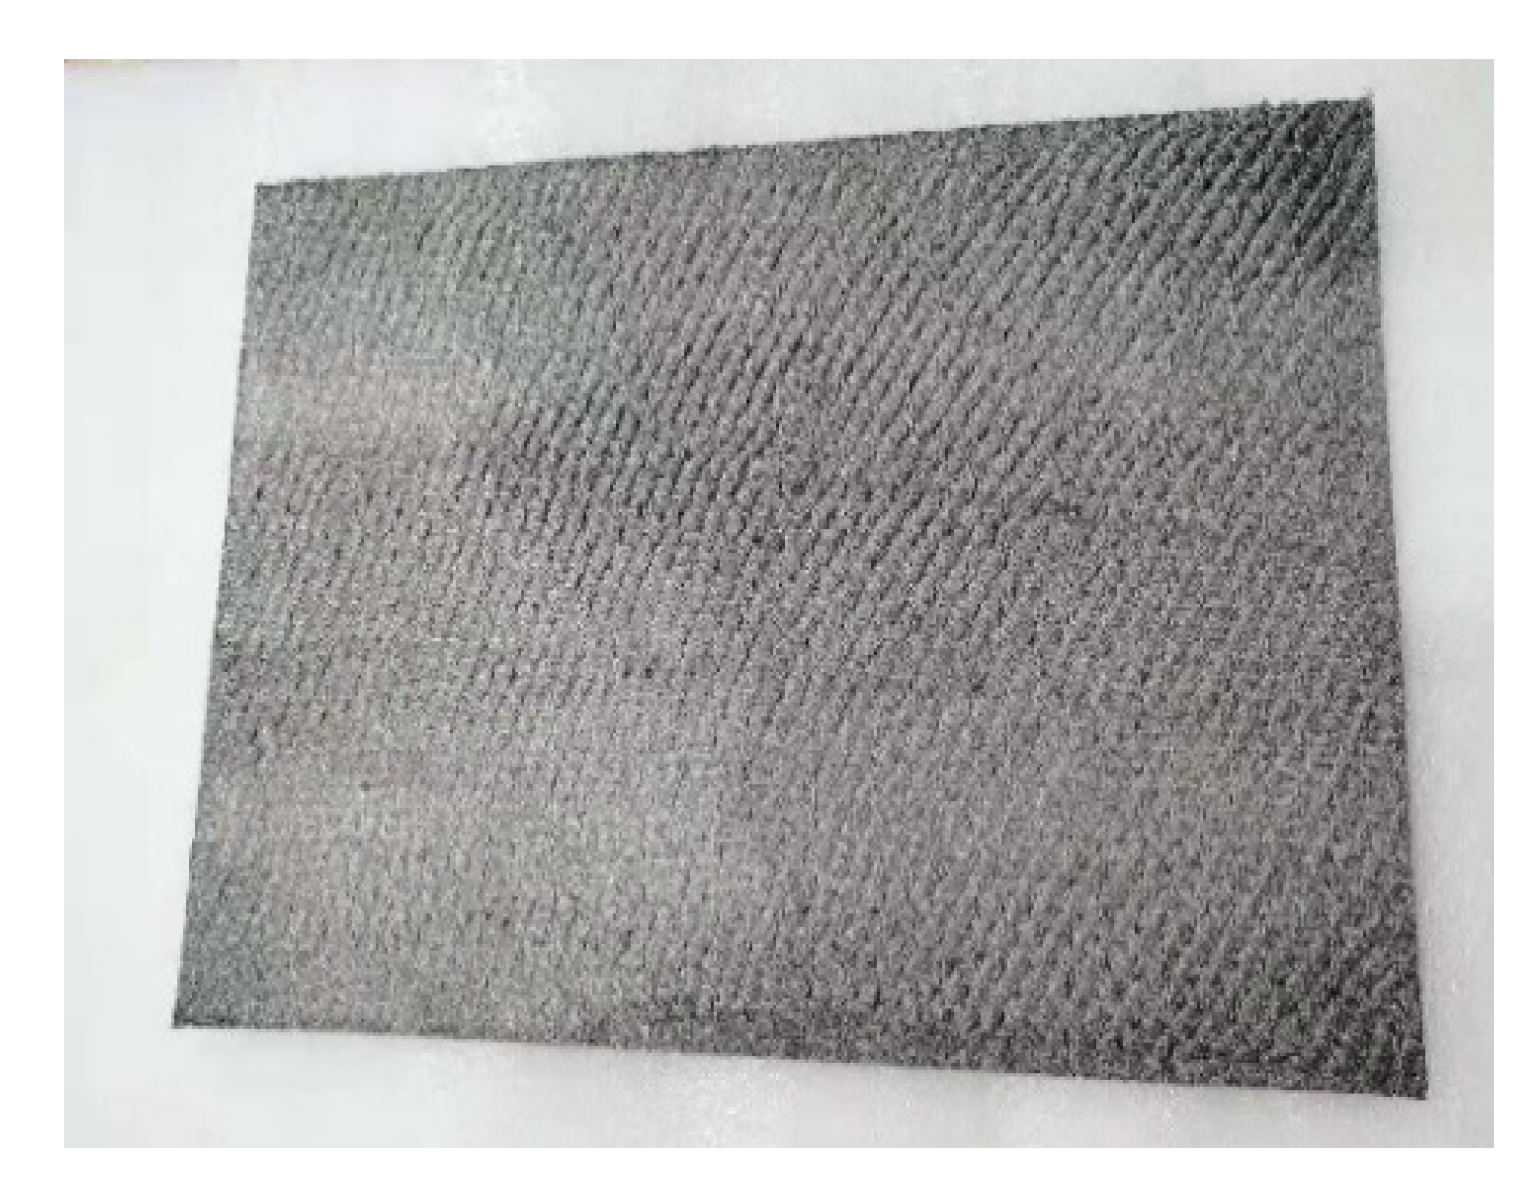
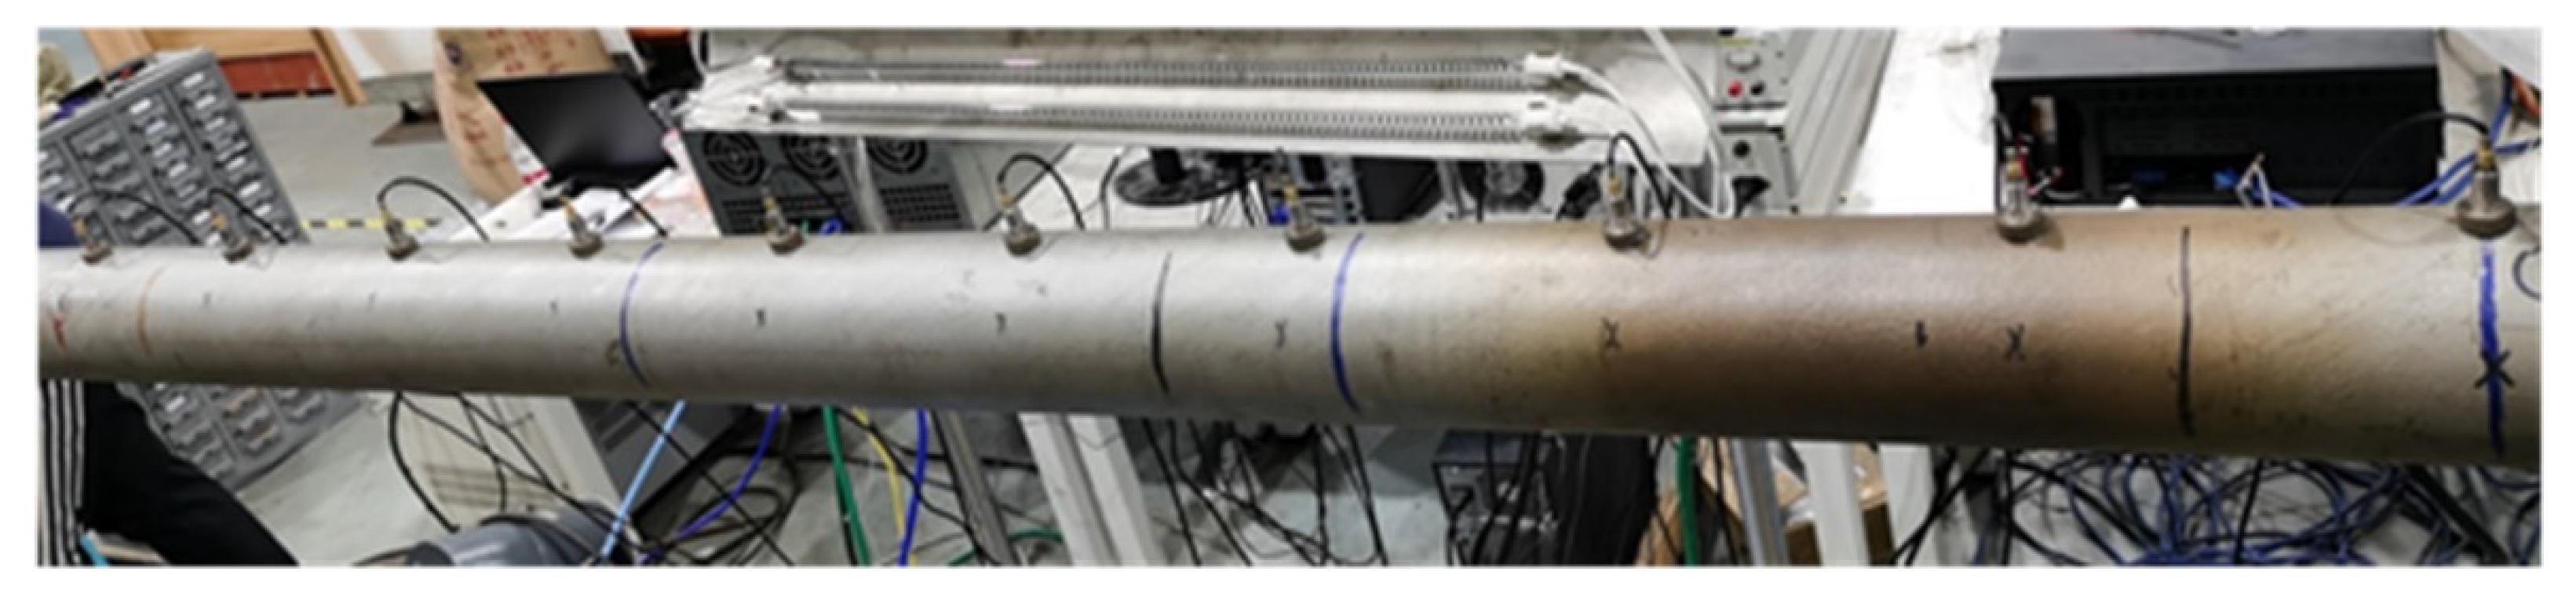
3.1. EMWM Specimen
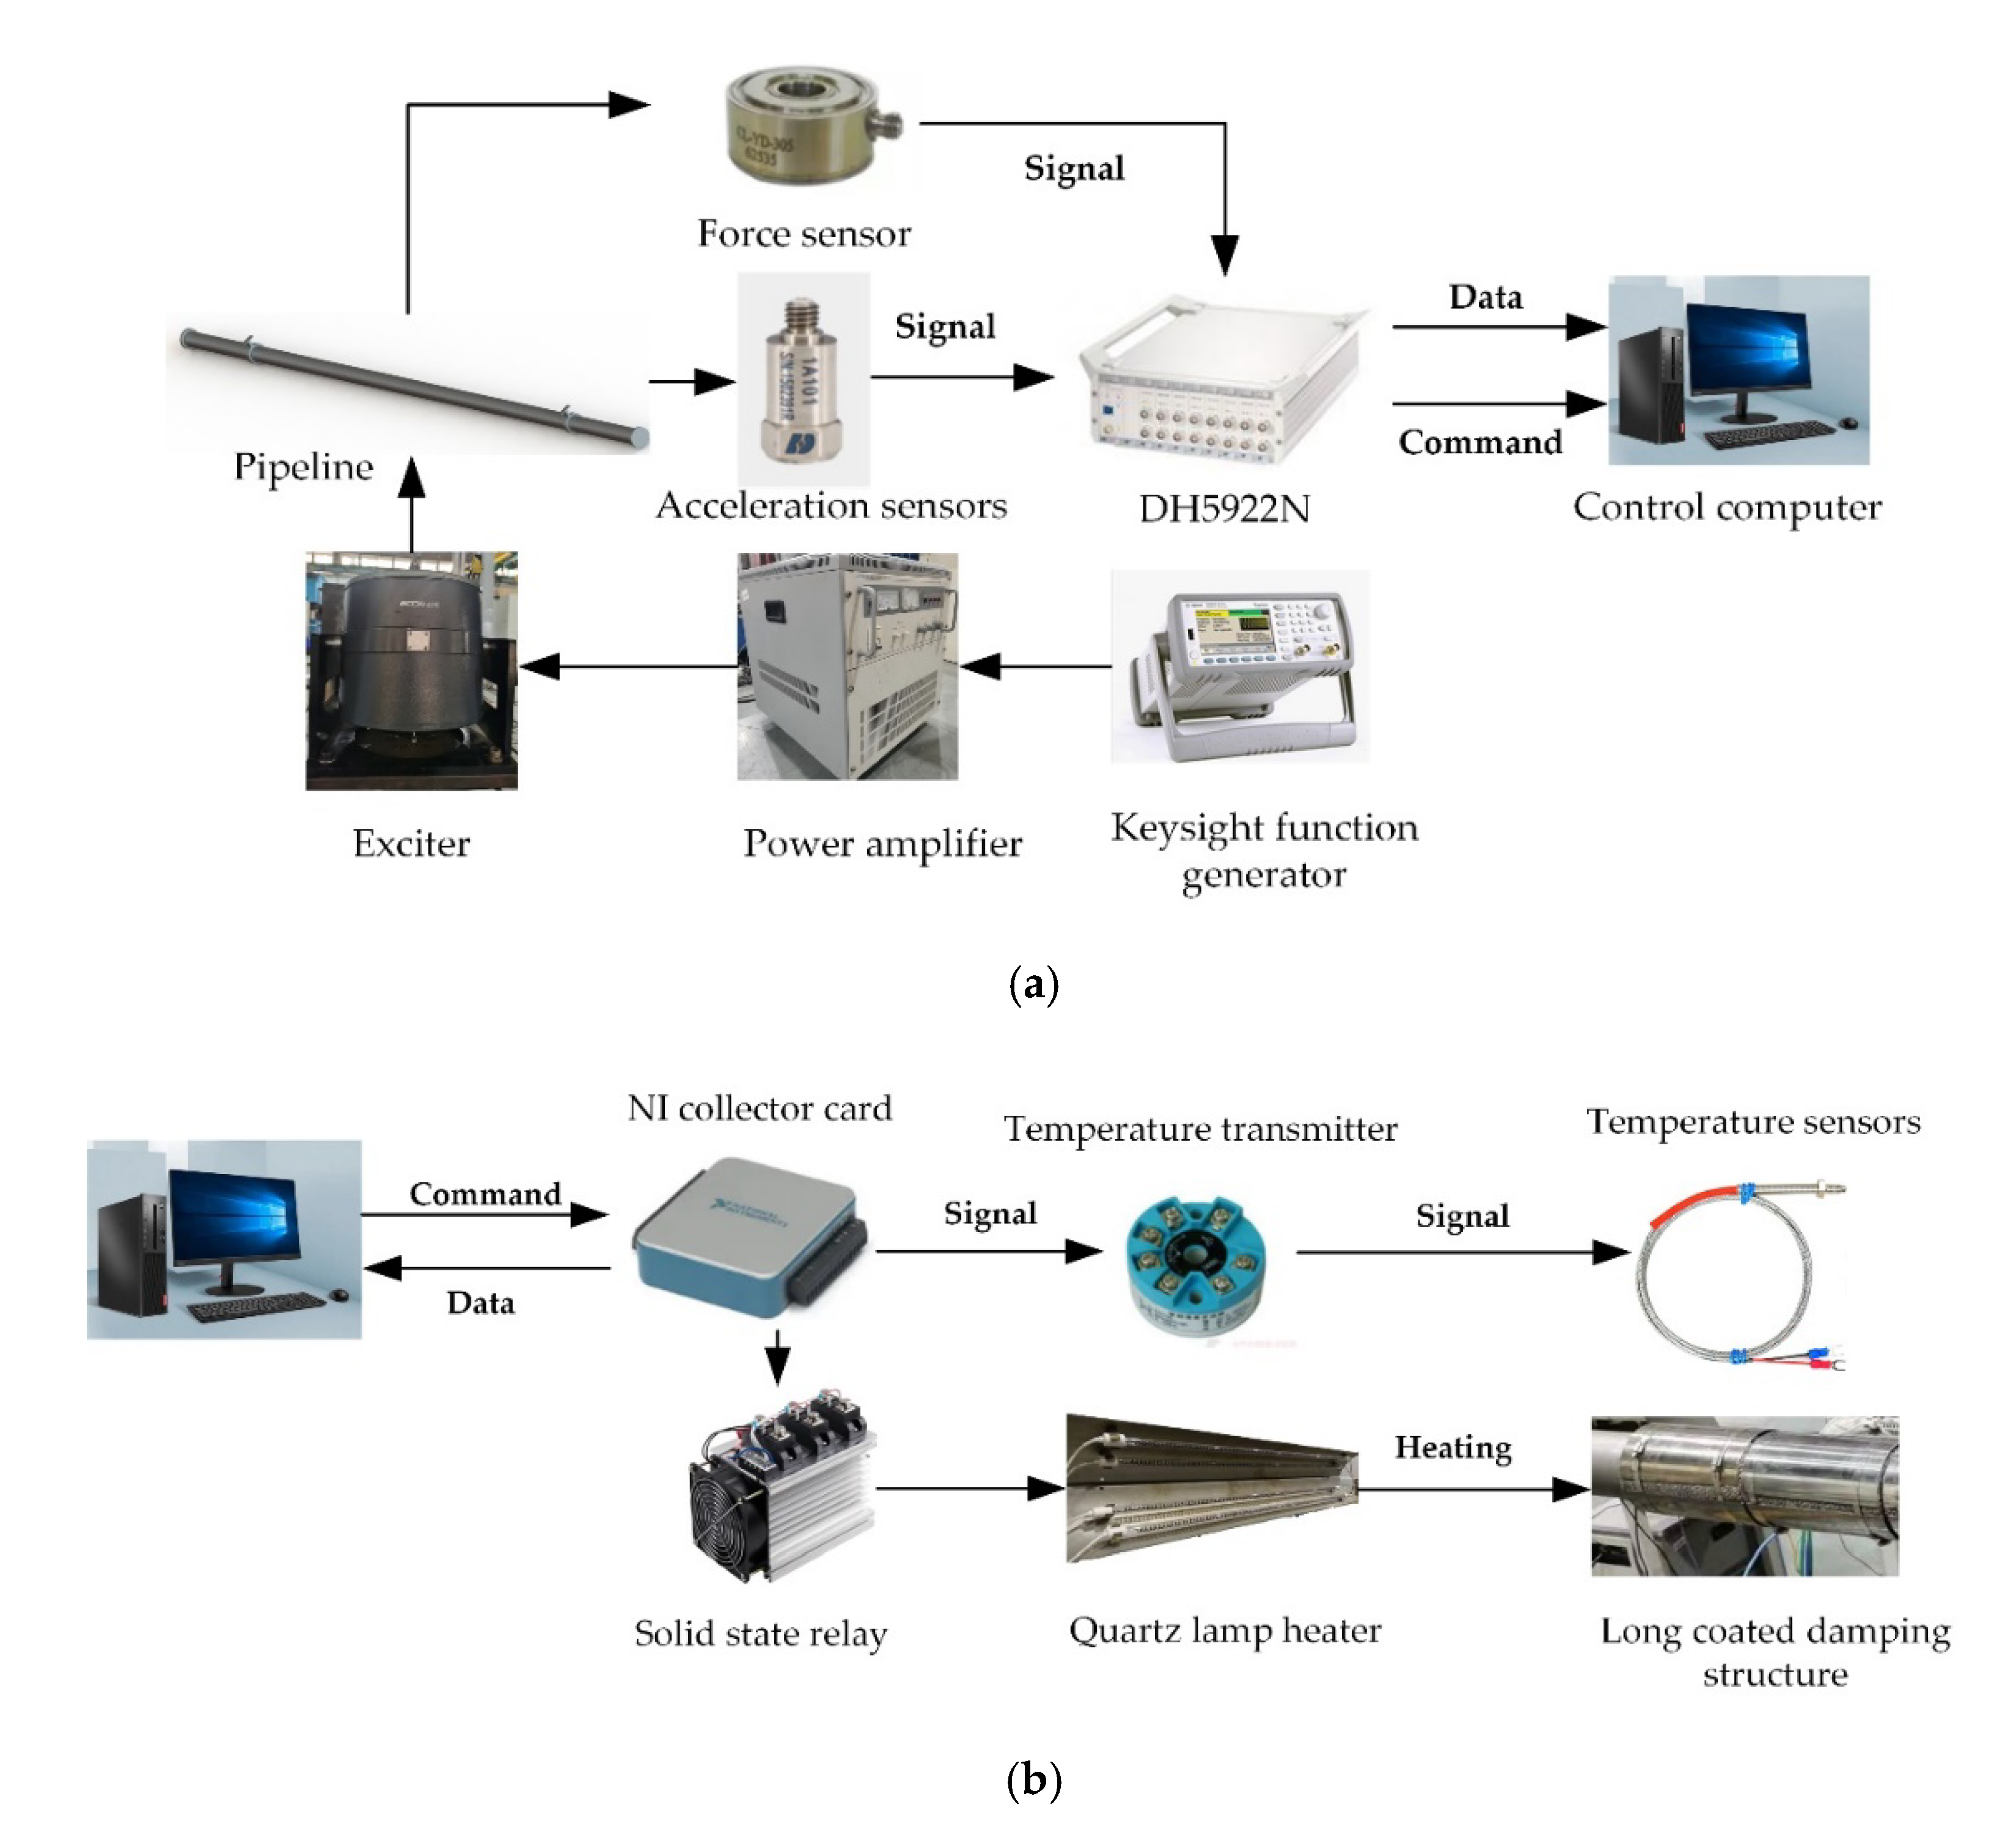
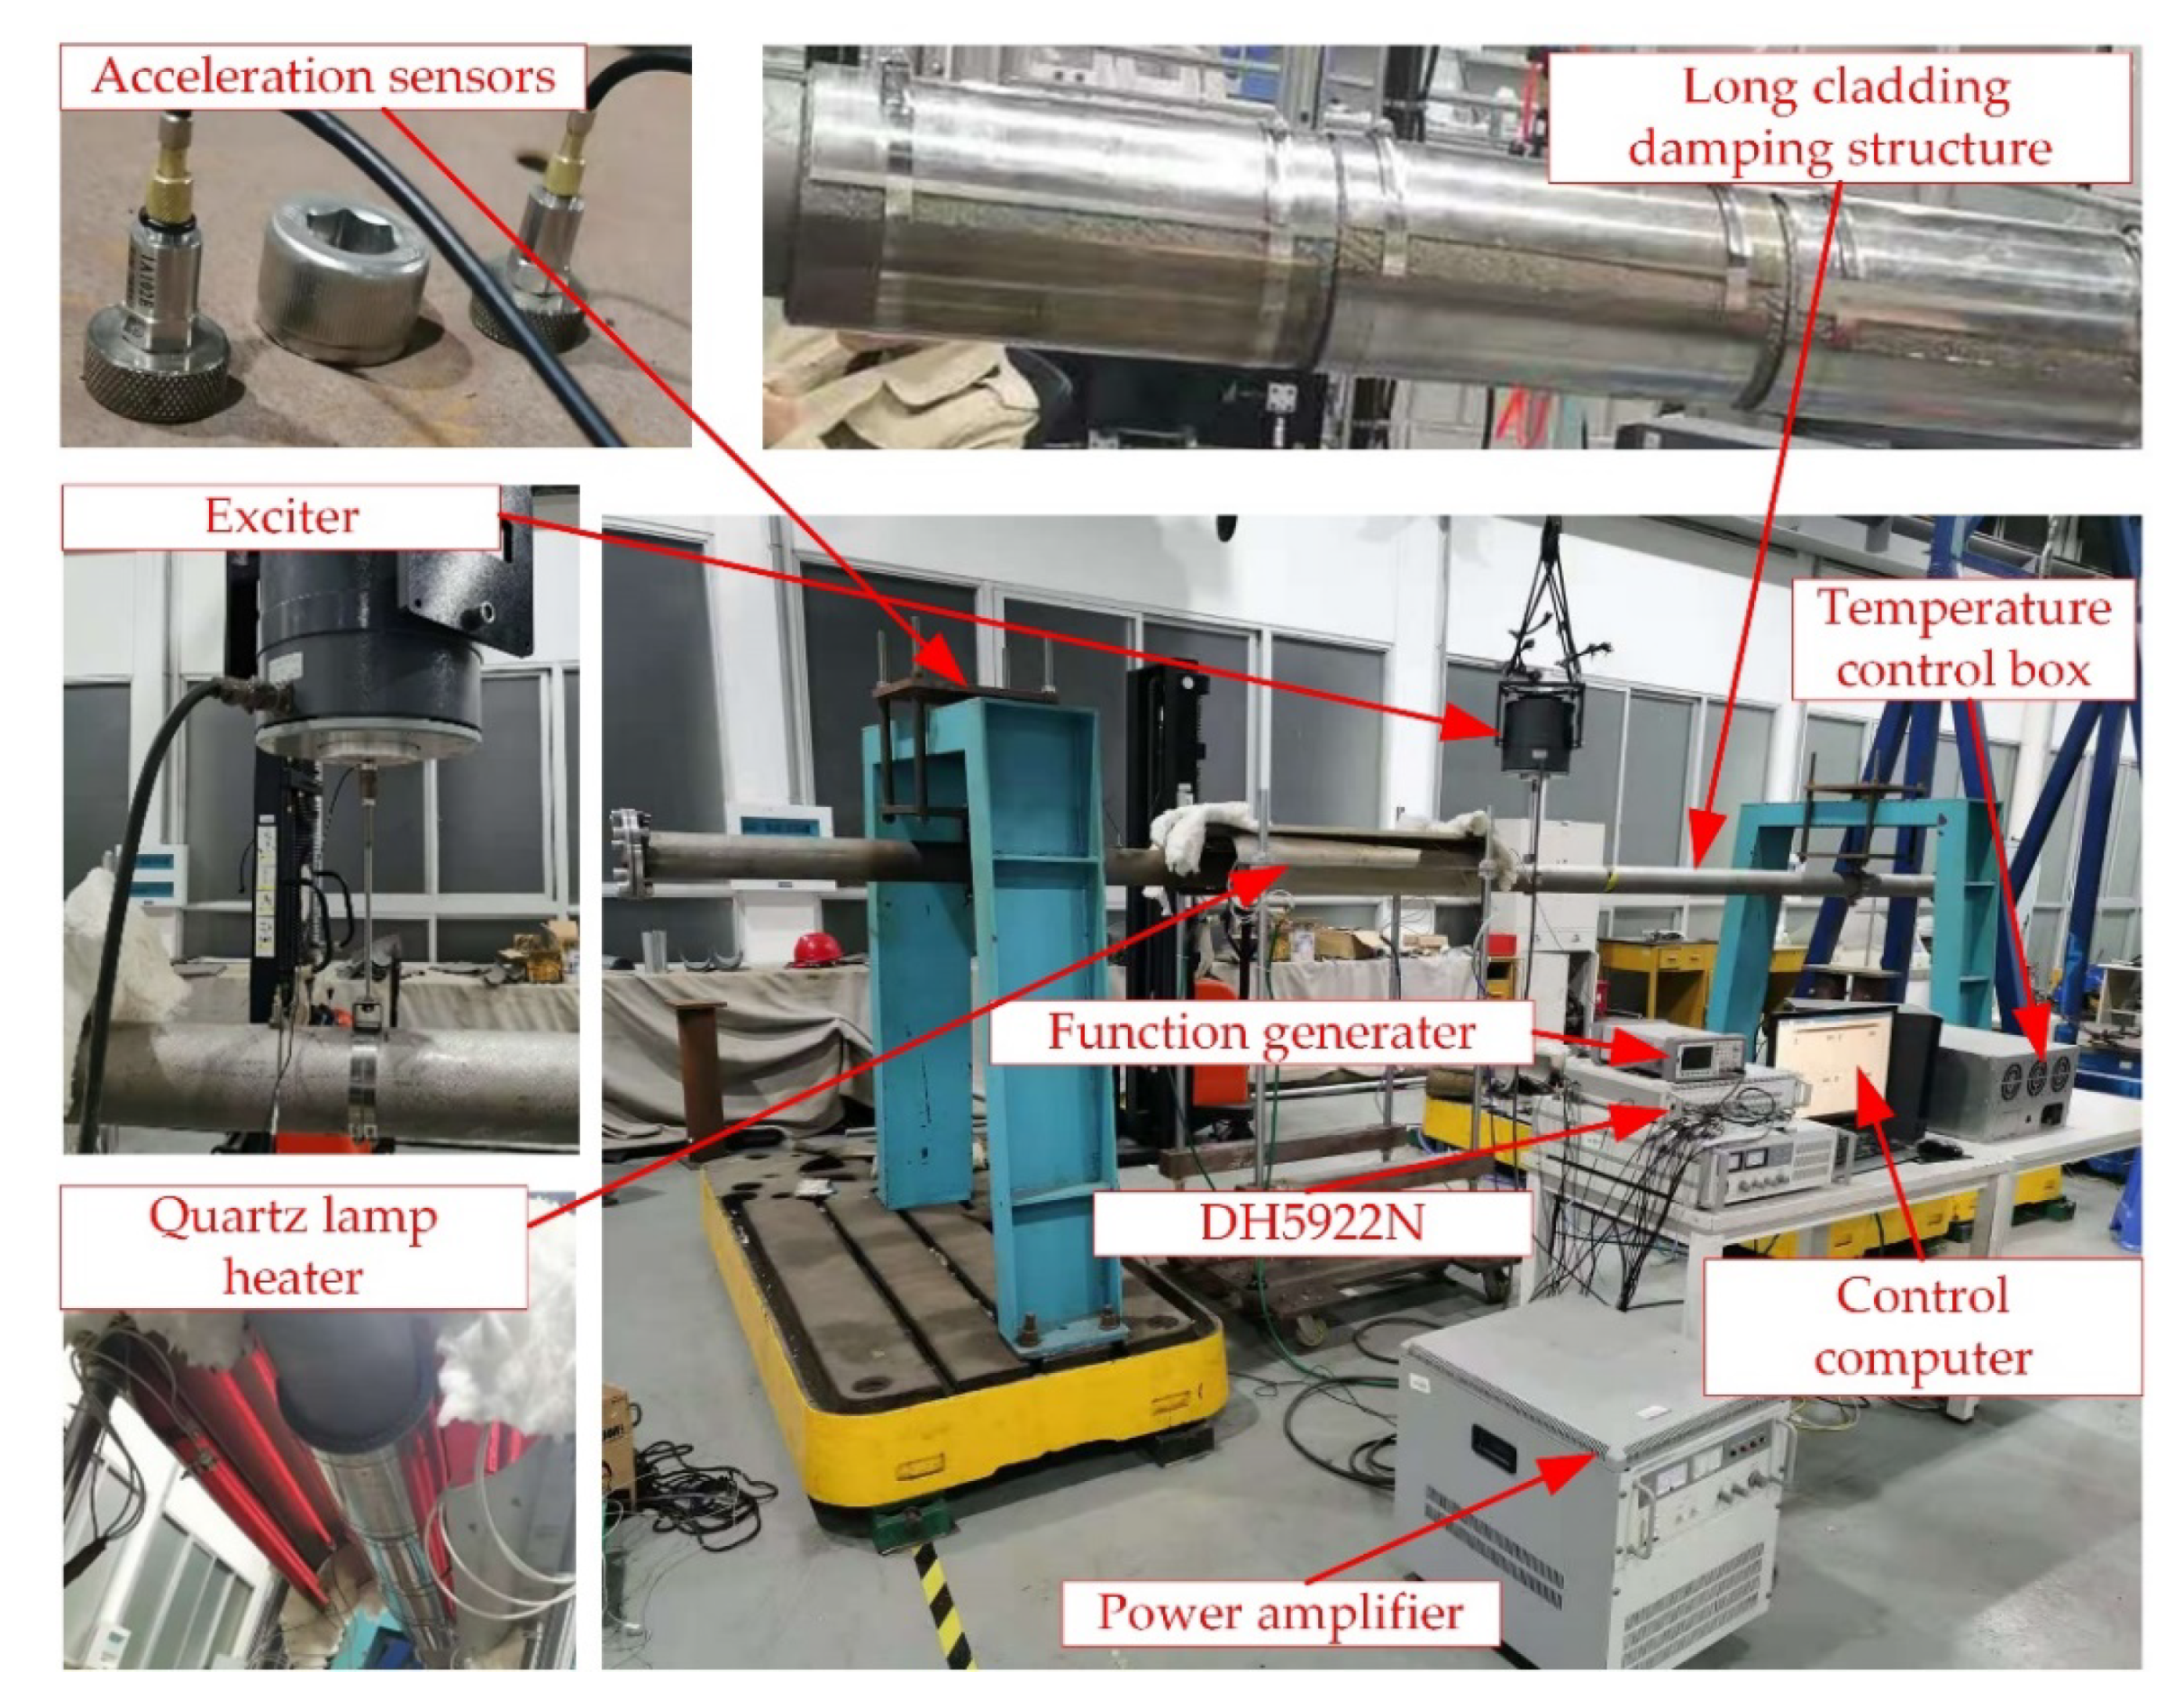
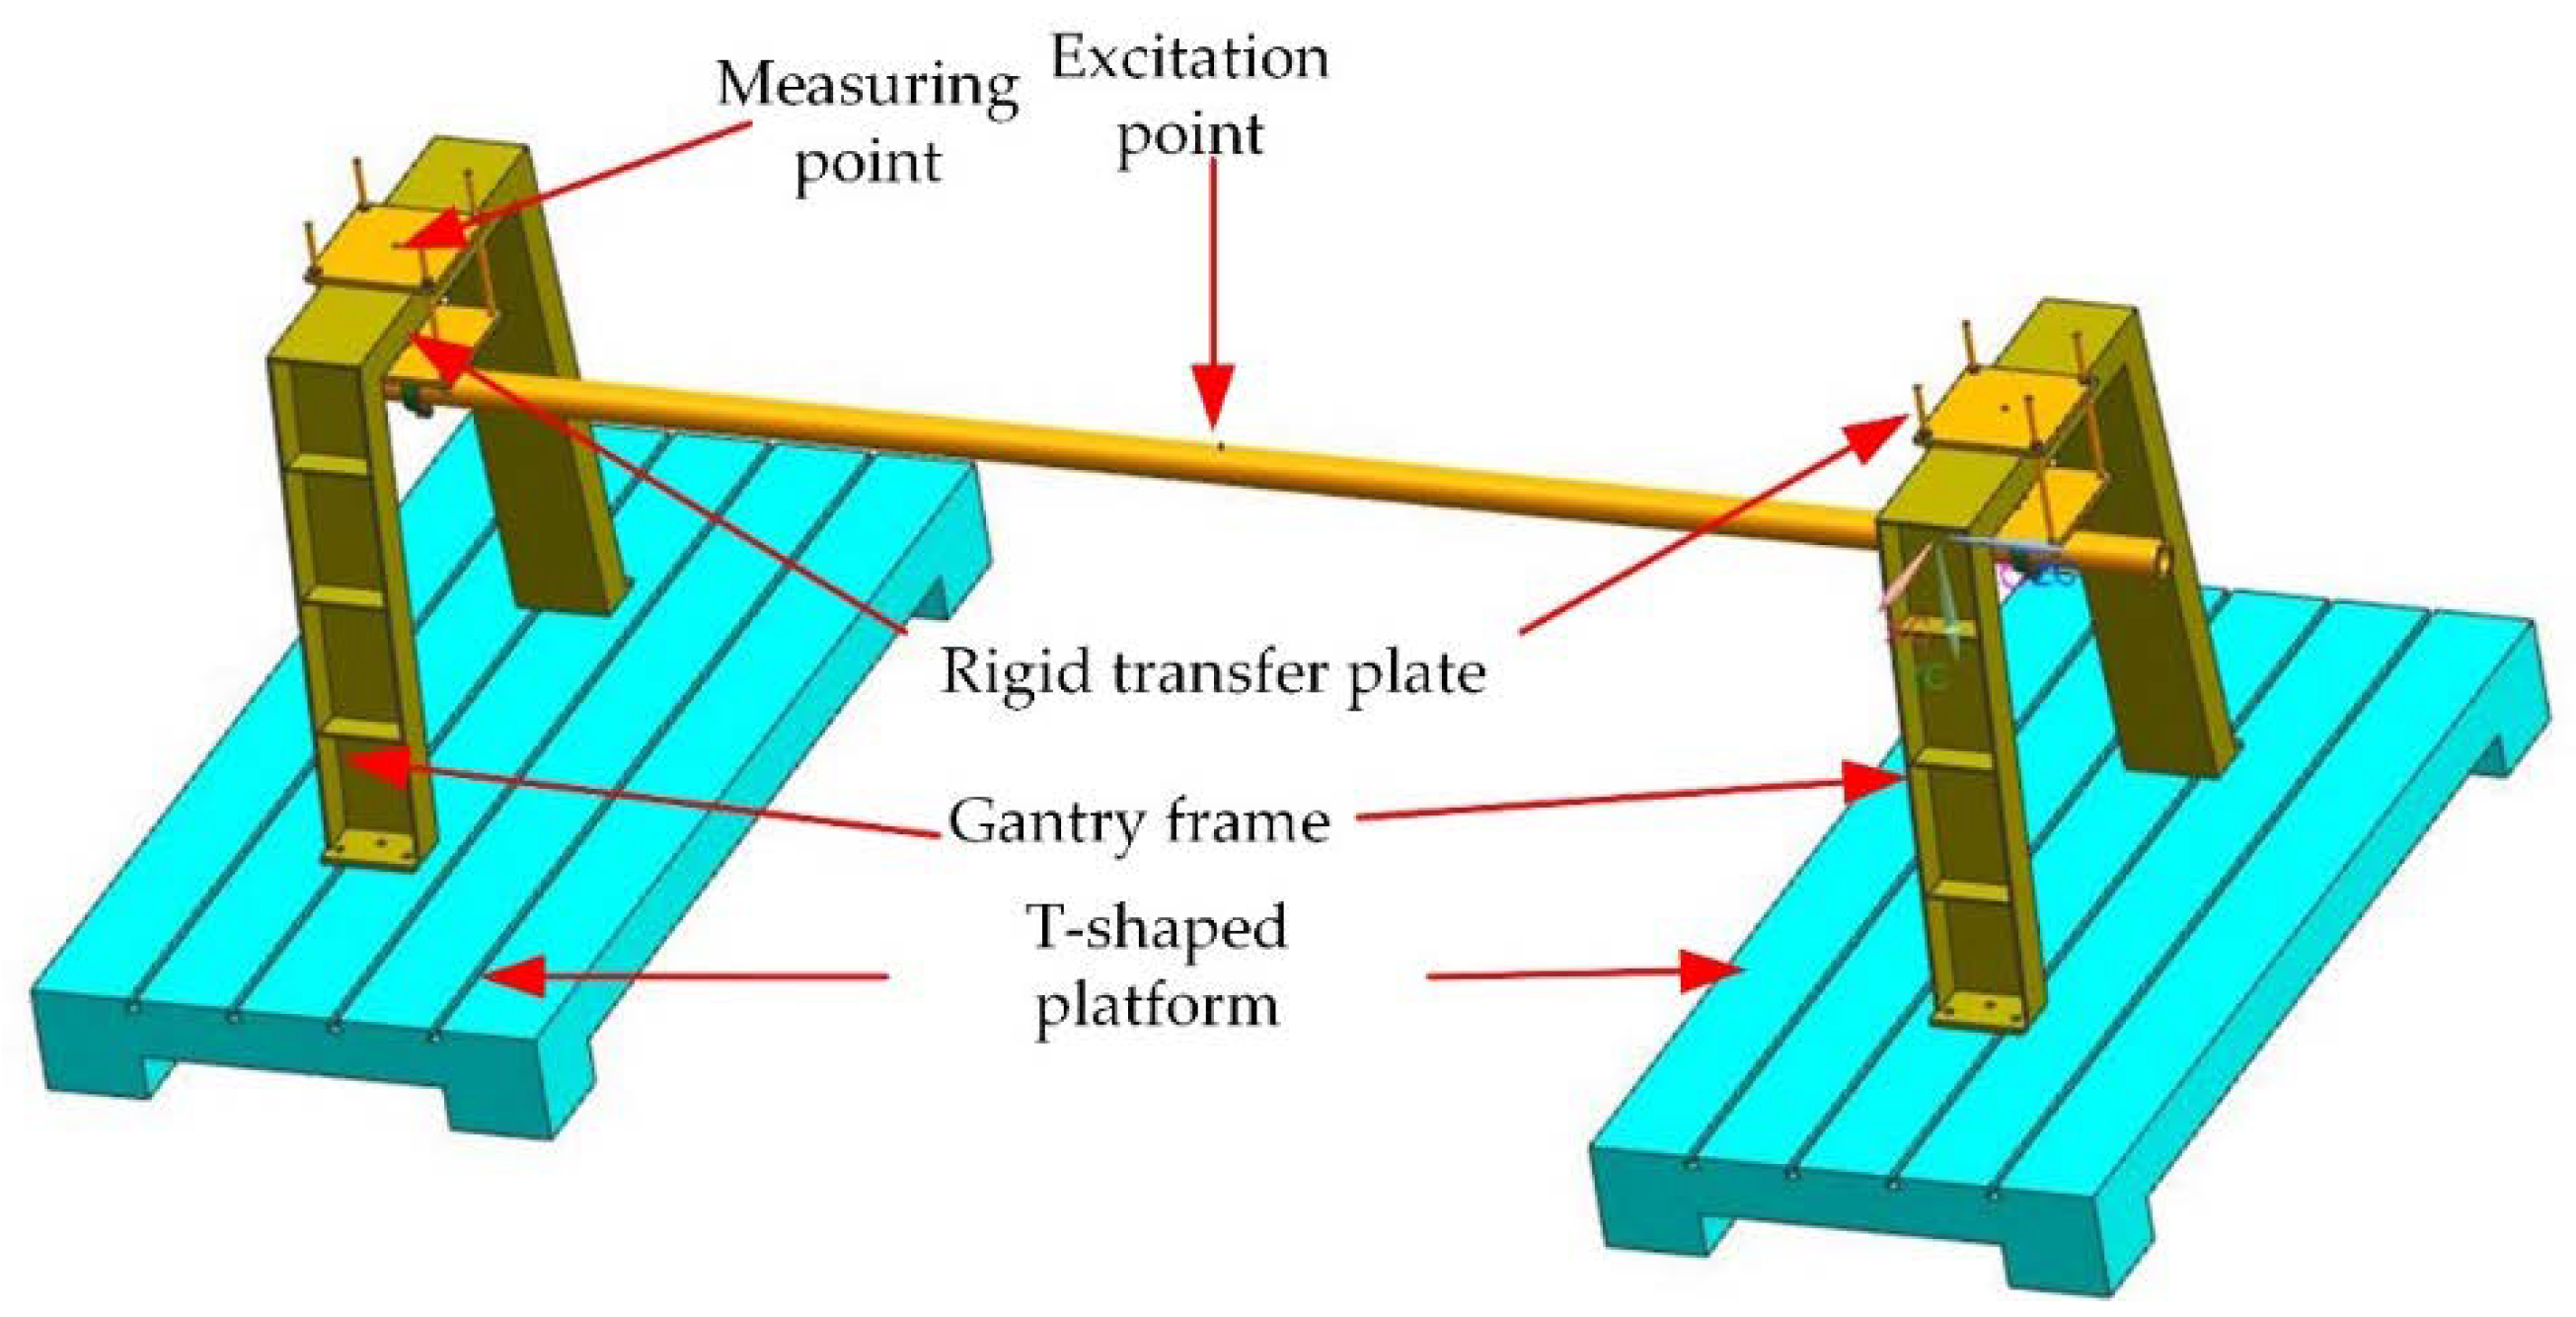
3.2. Test System
4. Performance Characterization
5. Results and Discussion
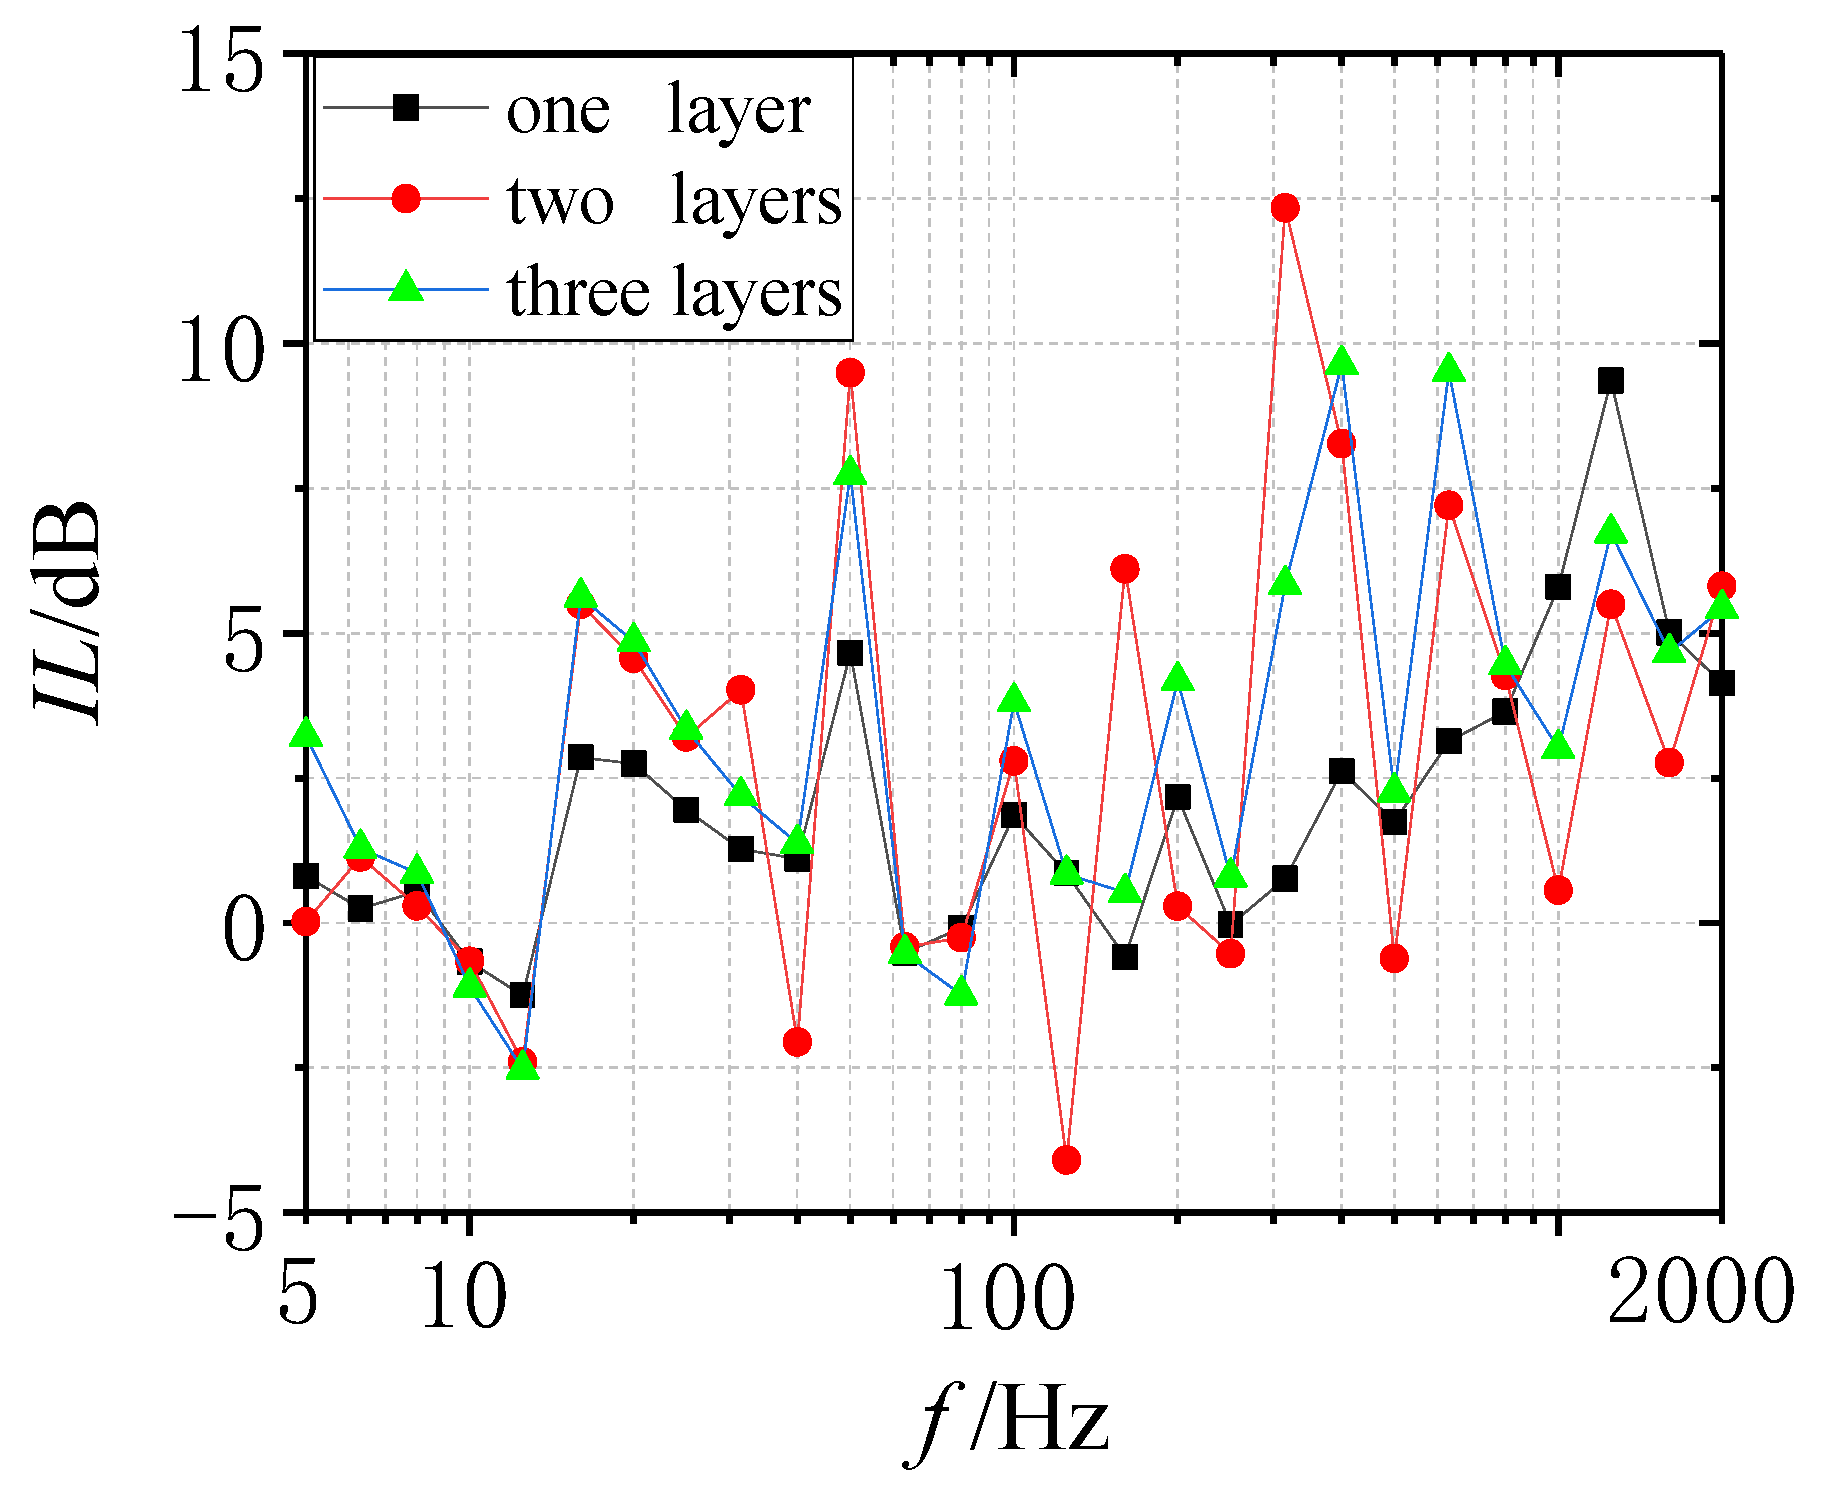
5.1. Effect of the Number of Coated Layers
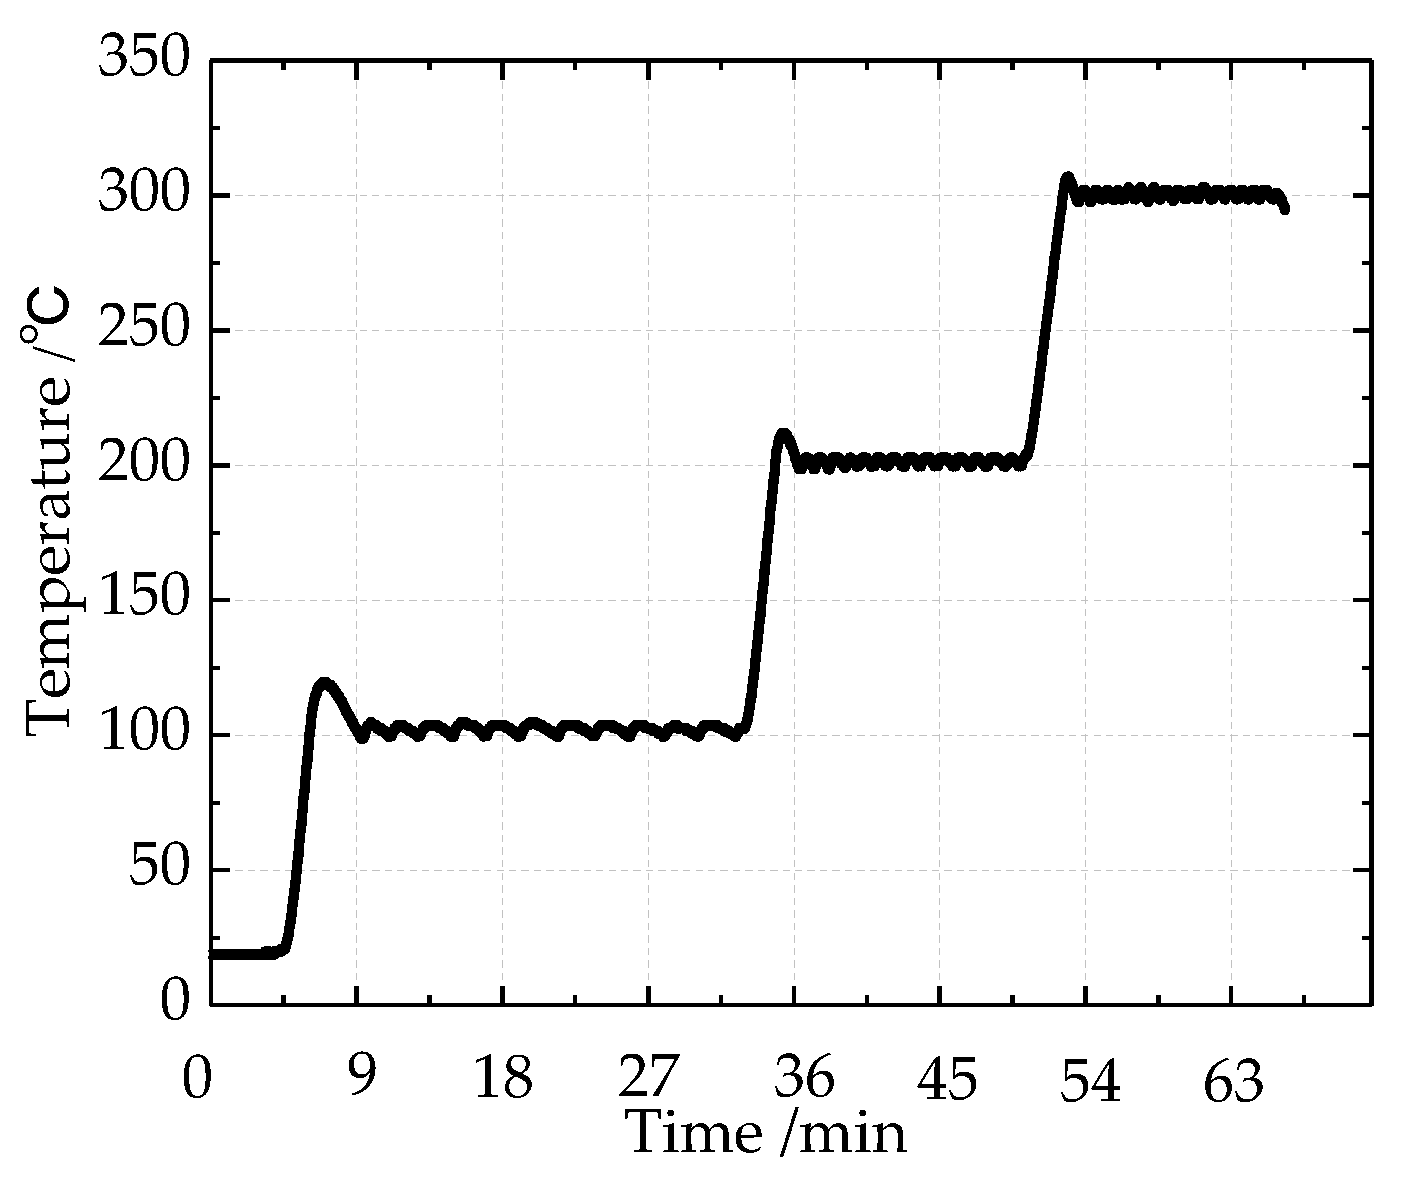
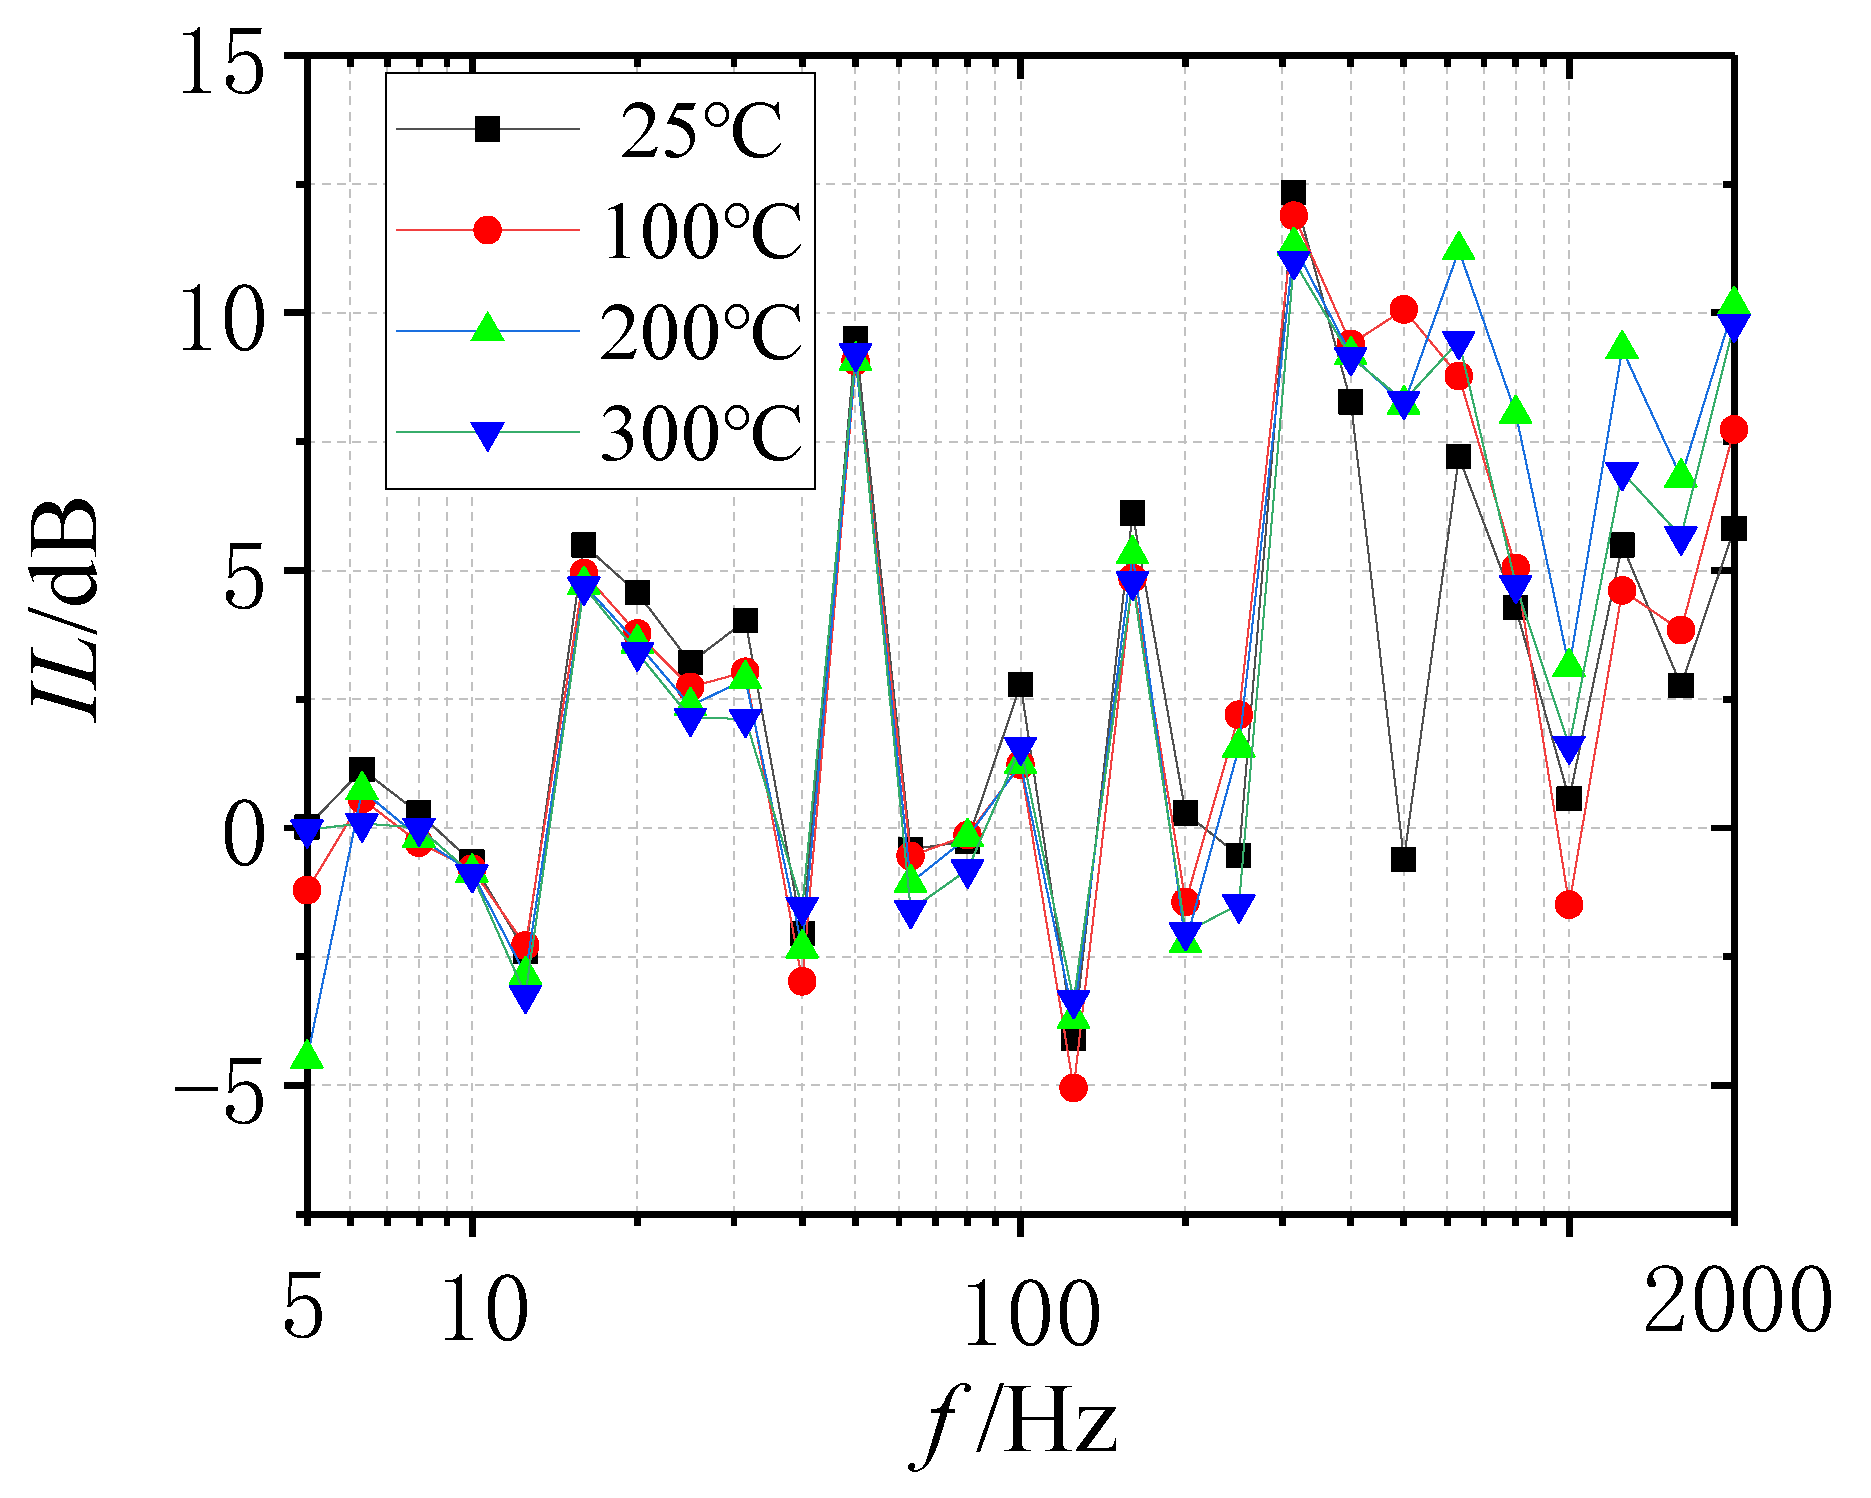
5.2. Effect of the Temperature
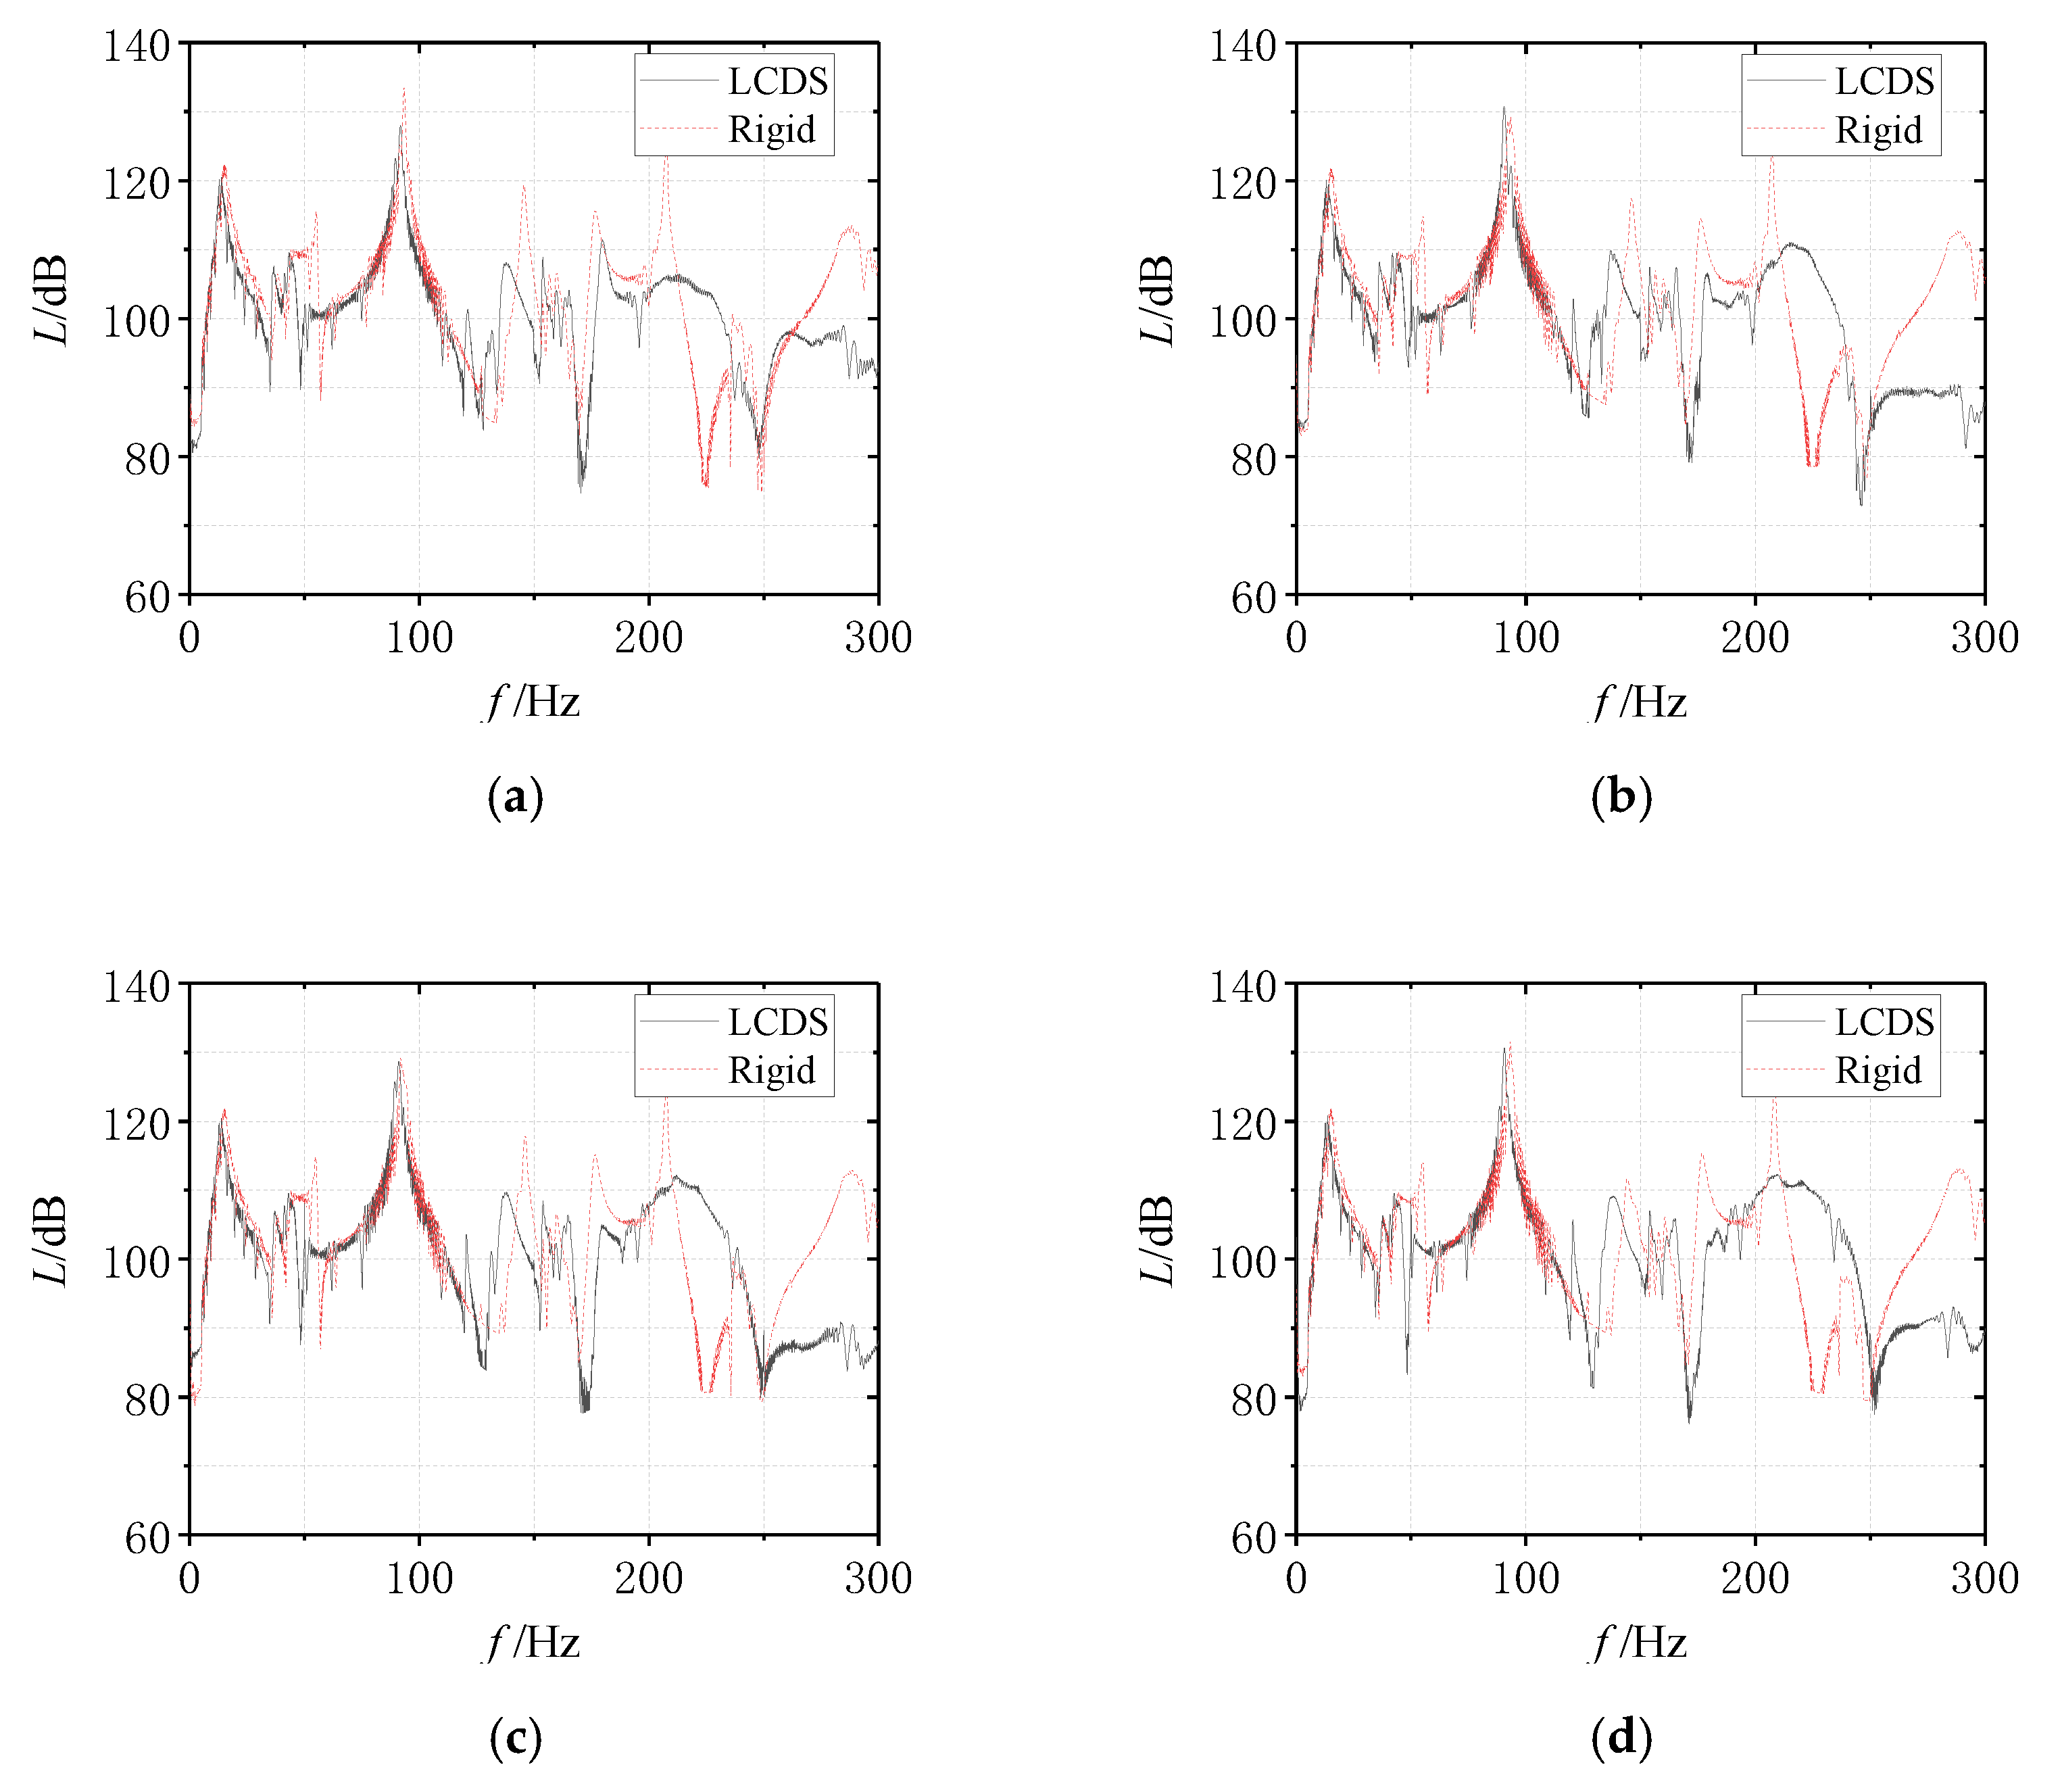
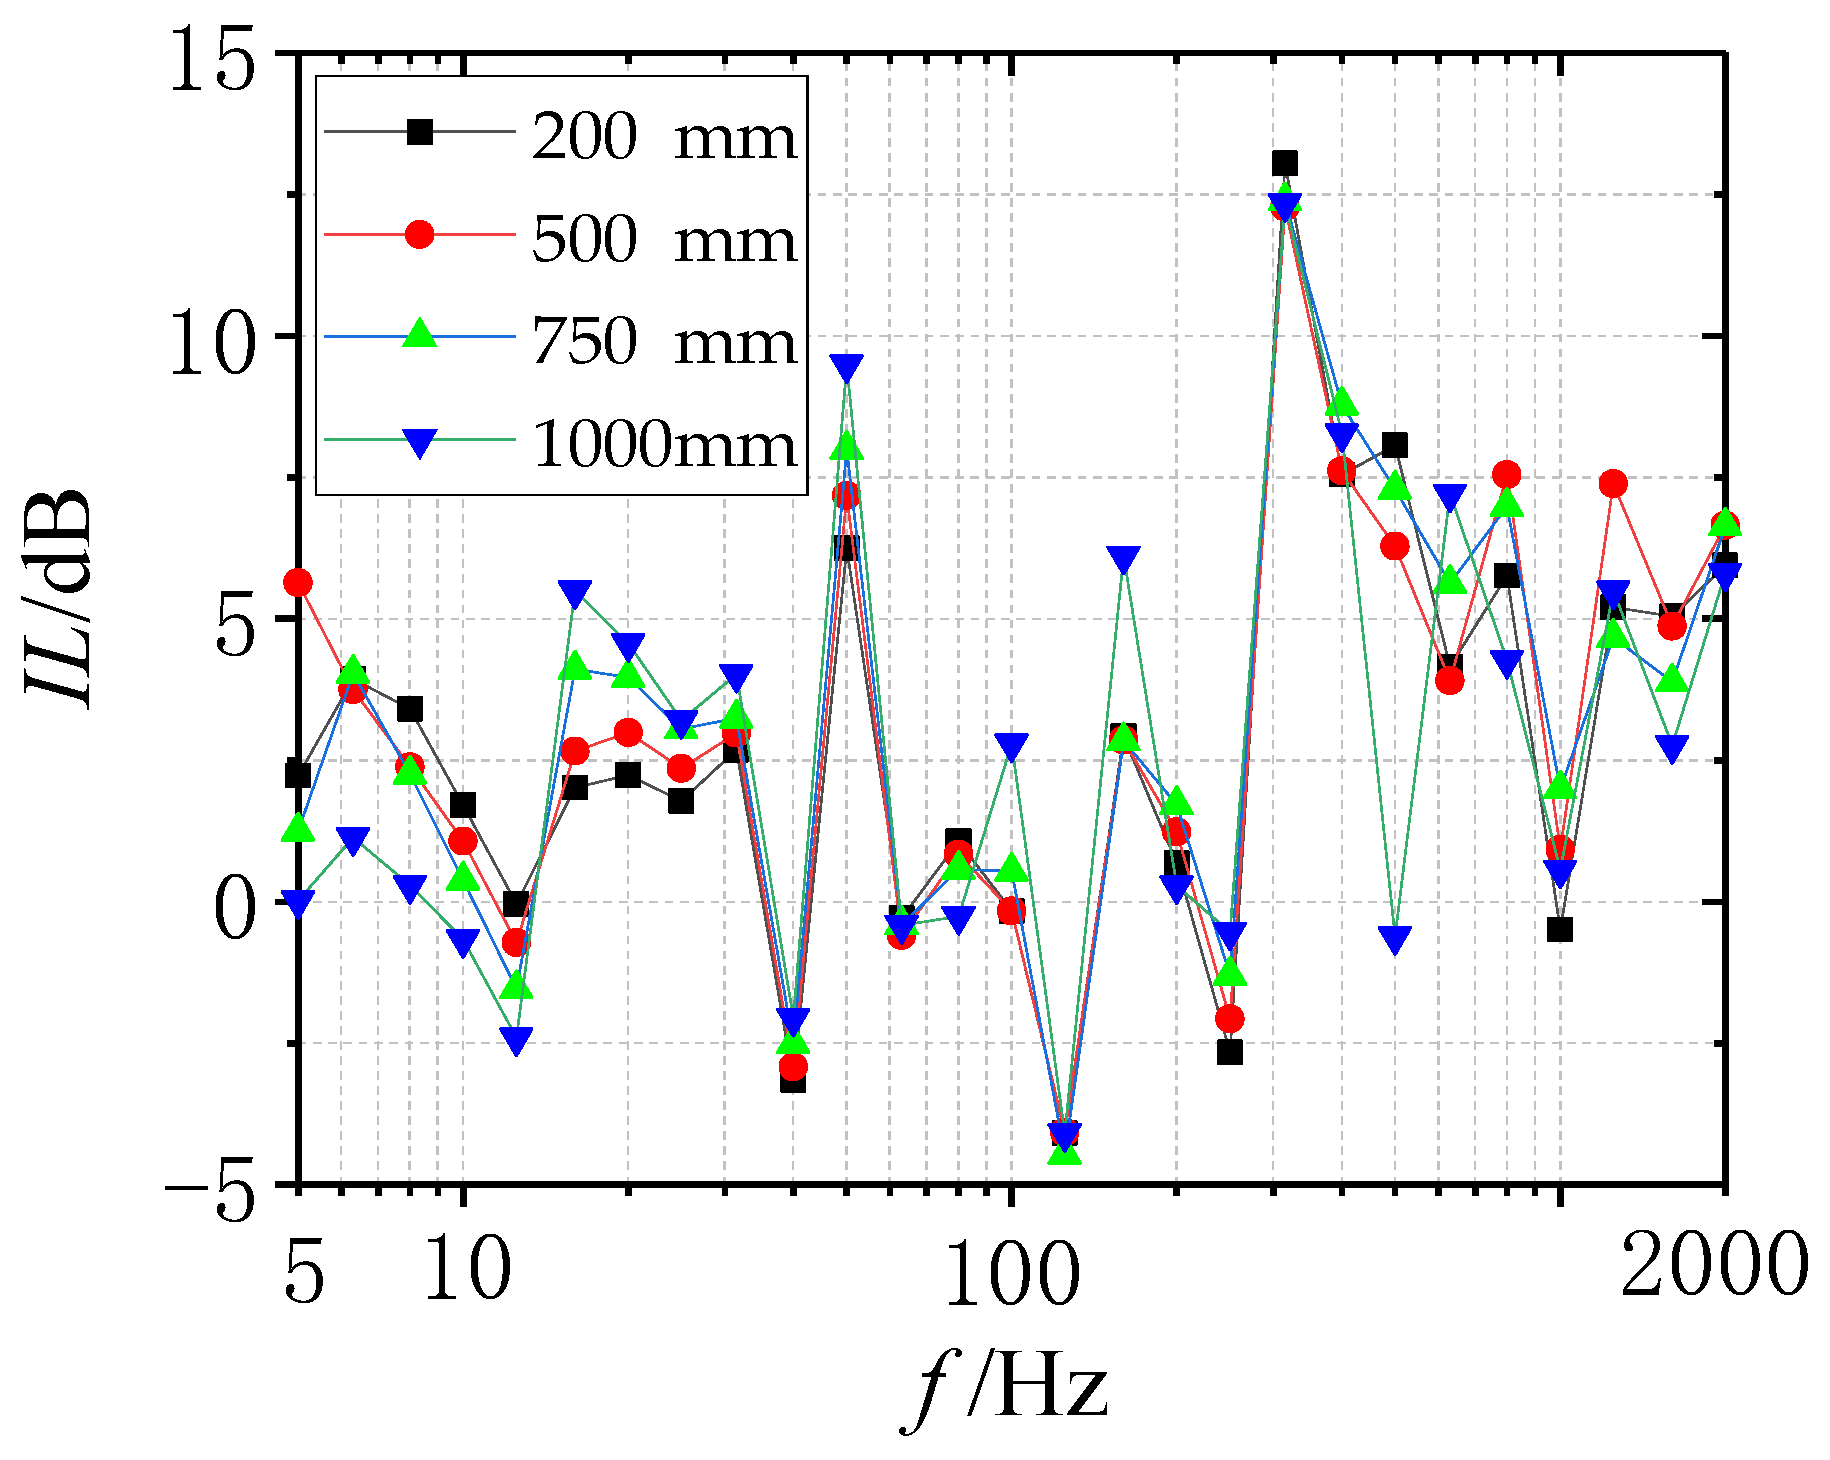
5.3. Effect of the Length of Coated Structure
6. Conclusions
- (1)
- When other conditions were consistent, with the increase in the number of coated layers, the insertion loss of the pipeline increased, which improved the vibration attenuation effect of the pipeline.
- (2)
- With the change of temperatures, the variation of the insertion loss was less than 0.5 dB, indicating that the damping property of the LCDS could work well at high temperature.
- (3)
- With the increase in the coated length of the pipeline, the increase in the insertion loss was not obvious.
- (4)
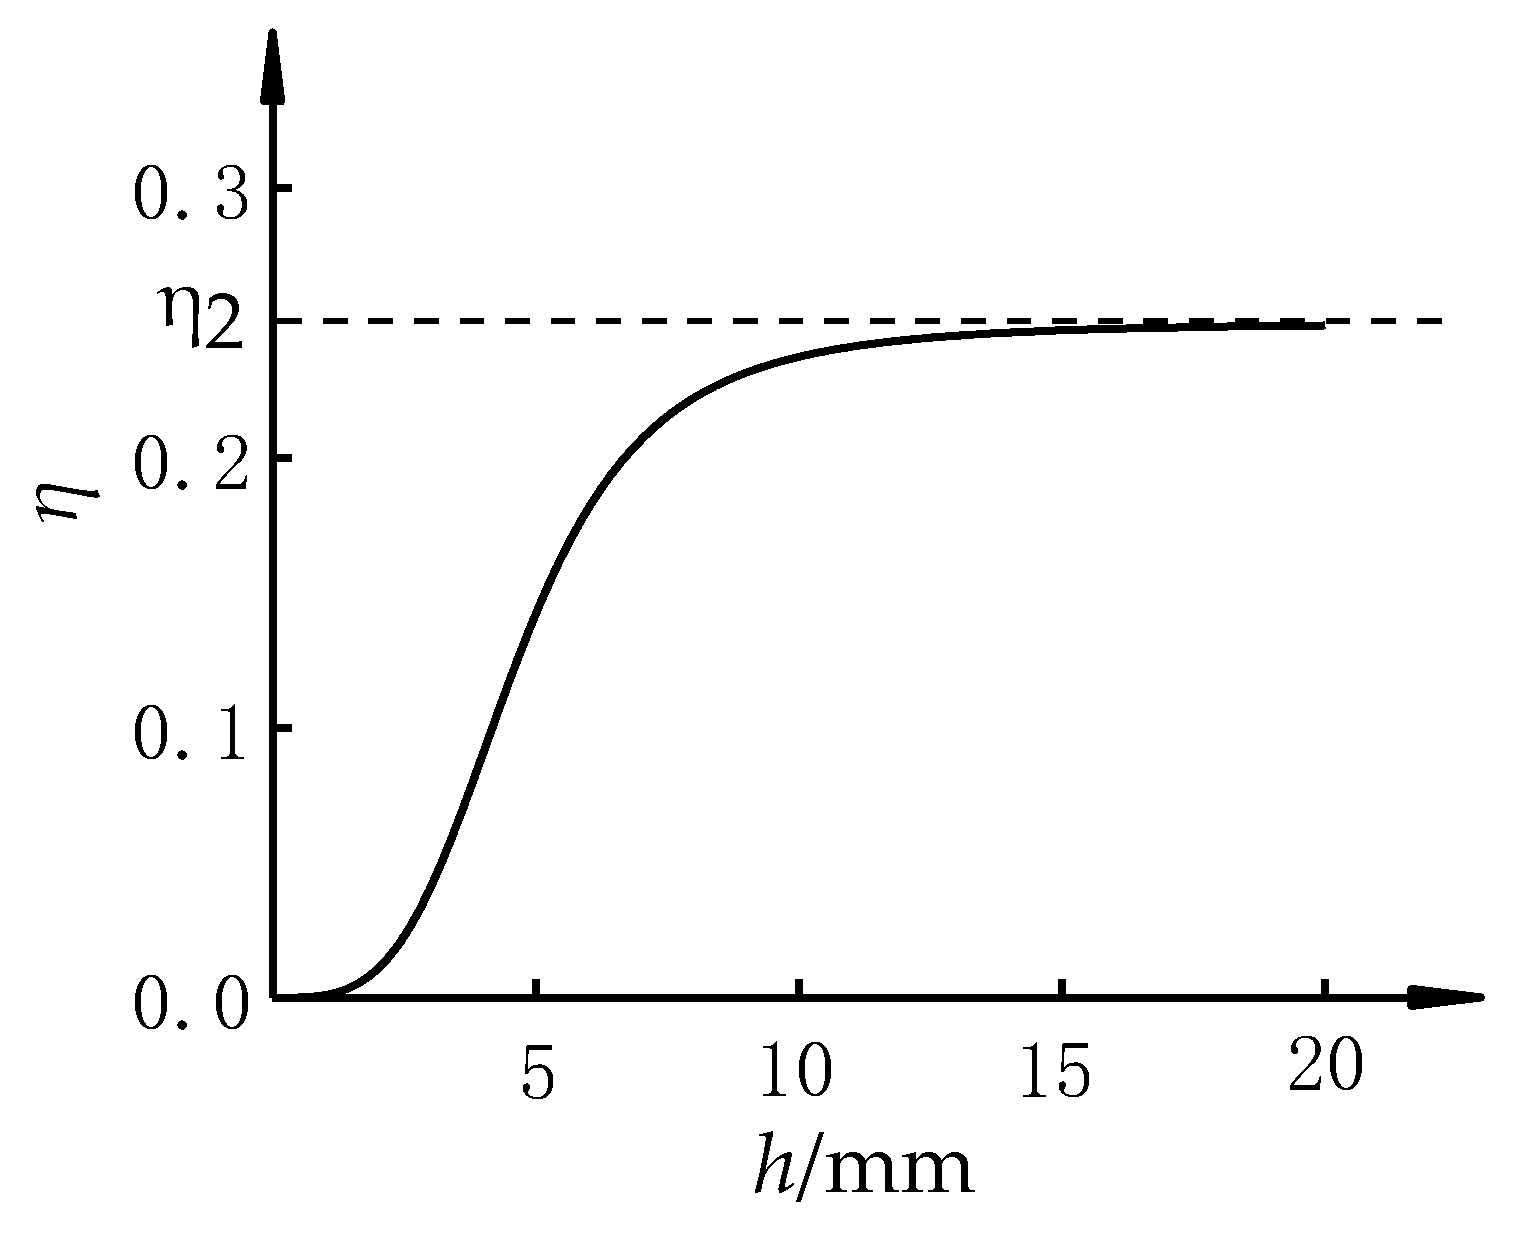
- The loss factor of the LCDS was related to the loss factor of EMWM and the number of damping layers. Changing the number of damping layers could affect the loss factor of the LCDS.
Author Contributions
Funding
Institutional Review Board Statement
Informed Consent Statement
Data Availability Statement
Conflicts of Interest
References
- Fang, J.; Lyons, G.J. Structural damping of tensioned pipes with reference to cables. J. Sound Vib. 1996, 193, 891–907. [Google Scholar] [CrossRef]
- Kung, S.W.; Singh, R. Vibration analysis of beams with multiple constrained layer damping patches. J. Sound Vib. 1998, 212, 781–805. [Google Scholar] [CrossRef]
- Hamdaoui, M.; Robin, G.; Jrad, M.; Daya, E.M. Optimal design of frequency dependent three-layered rectangular composite beams for low mass and high damping. Compos. Struct. 2015, 120, 174–182. [Google Scholar] [CrossRef]
- Pilipenko, A.E.; Rudyaga, E.V.; Kukartsev, V.V.; Tynchenko, V.S.; Kurashkin, S.O.; Rogova, D.V. A method for monitoring the violation of the integrity of pipeline communications using a radio wave vibration sensor. IOP Conf. Ser. Mater. Sci. Eng. 2021, 1064, 12023. [Google Scholar] [CrossRef]
- Vestrum, O.; Langseth, M.; Borvik, T. Finite element analysis of porous polymer coated pipelines subjected to impact. Int. J. Impact Eng. 2021, 152, 103825. [Google Scholar] [CrossRef]
- Maria, S.G.; Daniela, F.; Francesco, C. Effect of Coriolis Force on Vibration of Annulus Pipe. Appl. Sci. 2021, 11, 1058. [Google Scholar]
- Kiryukhin, A.V.; Milman, O.O.; Sereshkin, L.N.; Korljakova, M.O.; Miloserdov, V.O. Physical features of fluid and structure interaction inside power unit pipeline vibration-isolating expansion joints. J. Phys. Conf. Ser. 2020, 1565, 12088. [Google Scholar] [CrossRef]
- Hassani, V.; Tjahjowidodo, T.; Soetarto, A.D. Modeling Hysteresis with Inertial-Dependent Prandtl-Ishlinskii Model in Wide-Band Frequency-Operated Piezoelectric Actuator. Smart Mater. Res. 2012, 2012, 1–15. [Google Scholar] [CrossRef] [Green Version]
- Arnaldo, M.; Leonel, P.M.; Gelman, M.; Bián, C.F.; Palacio, C.A. A Novel and Inexpensive Approach for Force Sensing Based on FSR Piezocapacitance Aimed at Hysteresis Error Reduction. J. Sens. 2018, 2018, 6561901. [Google Scholar]
- Thomas, A.C.; Luis, S.A. Measurements of Rotordynamic Response and Temperatures in a Rotor Supported on Metal Mesh Foil Bearings. J. Eng. Gas Turbines Power 2013, 135, 122507.1–122507.10. [Google Scholar]
- Lazutkin, G.V.; Ermakov, A.I.; Davydov, D.P.; Boyarov, K.V.; Bondarchuk, P.V. Analysis of characteristics of all-metal vibration insulators made of different wire materials. Russ. Aeronaut. 2014, 57, 327–332. [Google Scholar] [CrossRef]
- Lazutkin, G.V.; Boyarov, K.V.; Davydov, D.P.; Volkova, T.V.; Varzhitckii, L.A. Design of Elastic-damping Supports Made of MR Material for Pipeline Supports. Procedia Eng. 2017, 176, 326–333. [Google Scholar] [CrossRef]
- Jiang, F.; Ding, Z.; Wu, Y.; Bai, H.; Shao, Y.; Zi, B. Energy Dissipation Characteristics and Parameter Identification of Symmetrically Coated Damping Structure of Pipelines under Different Temperature Environment. Symmetry 2020, 12, 1283. [Google Scholar] [CrossRef]
- Xiao, K.; Bai, H.; Xue, X.; Wu, Y.; Tusset, A.M. Damping Characteristics of Metal Rubber in the Pipeline Coating System. Shock Vib. 2018, 2018, 3974381. [Google Scholar] [CrossRef] [Green Version]
- Teng, T.; Hu, N. Analysis of damping characteristics for viscoelastic laminated beams. North-Hollwood 2001, 190, 3881–3892. [Google Scholar] [CrossRef]
- Bagley, R.L.; Torvik, P.J. Fractional calculus in the transient analysis of viscoelastically damped structures. AIAA J. 1985, 23, 918–925. [Google Scholar] [CrossRef]
- Wang, Y. Finite element analysis and experimental study on dynamic properties of a composite beam with viscoelastic damping. J. Sound Vib. 2013, 332, 6177–6191. [Google Scholar] [CrossRef]
- Mead, D.J. The measurement of the loss factors of beams and plates with constrained and unconstrained damping layers: A critical assessment. J. Sound Vib. 2006, 300, 744–762. [Google Scholar] [CrossRef]
- Aenlle, M.L.; Pelayo, F. Frequency Response of Laminated Glass Elements: Analytical Modeling and Effective Thickness. Appl. Mech. Rev. 2013, 65, 020802. [Google Scholar] [CrossRef]
- Cravero, C.; Davide, M. Criteria for the Stability Limit Prediction of High Speed Centrifugal Compressors with Vaneless Diffuser: Part I—Flow Structure Analysis. Turbo Expo: Power for Land, Sea, and Air. Am. Soc. Mech. Eng. 2020, 84102, V02ET39A013. [Google Scholar]
- Kartik, C.; Jem, R.; Elizabeth, C. Mechanical behavior of tangled metal wire devices. Mech. Syst. Signal Process. 2019, 118, 13–29. [Google Scholar]
- Jianwen, Z. Preparation Process and Performance Analysis of Metal Rubber with Large-Size Flat Plate with Holes. Master’s Thesis, Fuzhou University, Fuzhou, China, 2019. [Google Scholar]
- Hui, C. Winding Crafts and Equipment Researching of Metal Rubber. Master’s Thesis, Xi’an Technological University, Xi’an, China, 2014. [Google Scholar]
- Ding, Z.; Bai, H.; Wu, Y.; Zhu, Y.; Shao, Y. Experimental Investigation of Thermal Modal Characteristics for a Ship’s Foundation under 300 °C. Shock Vib. 2019, 2019, 2714930. [Google Scholar] [CrossRef]


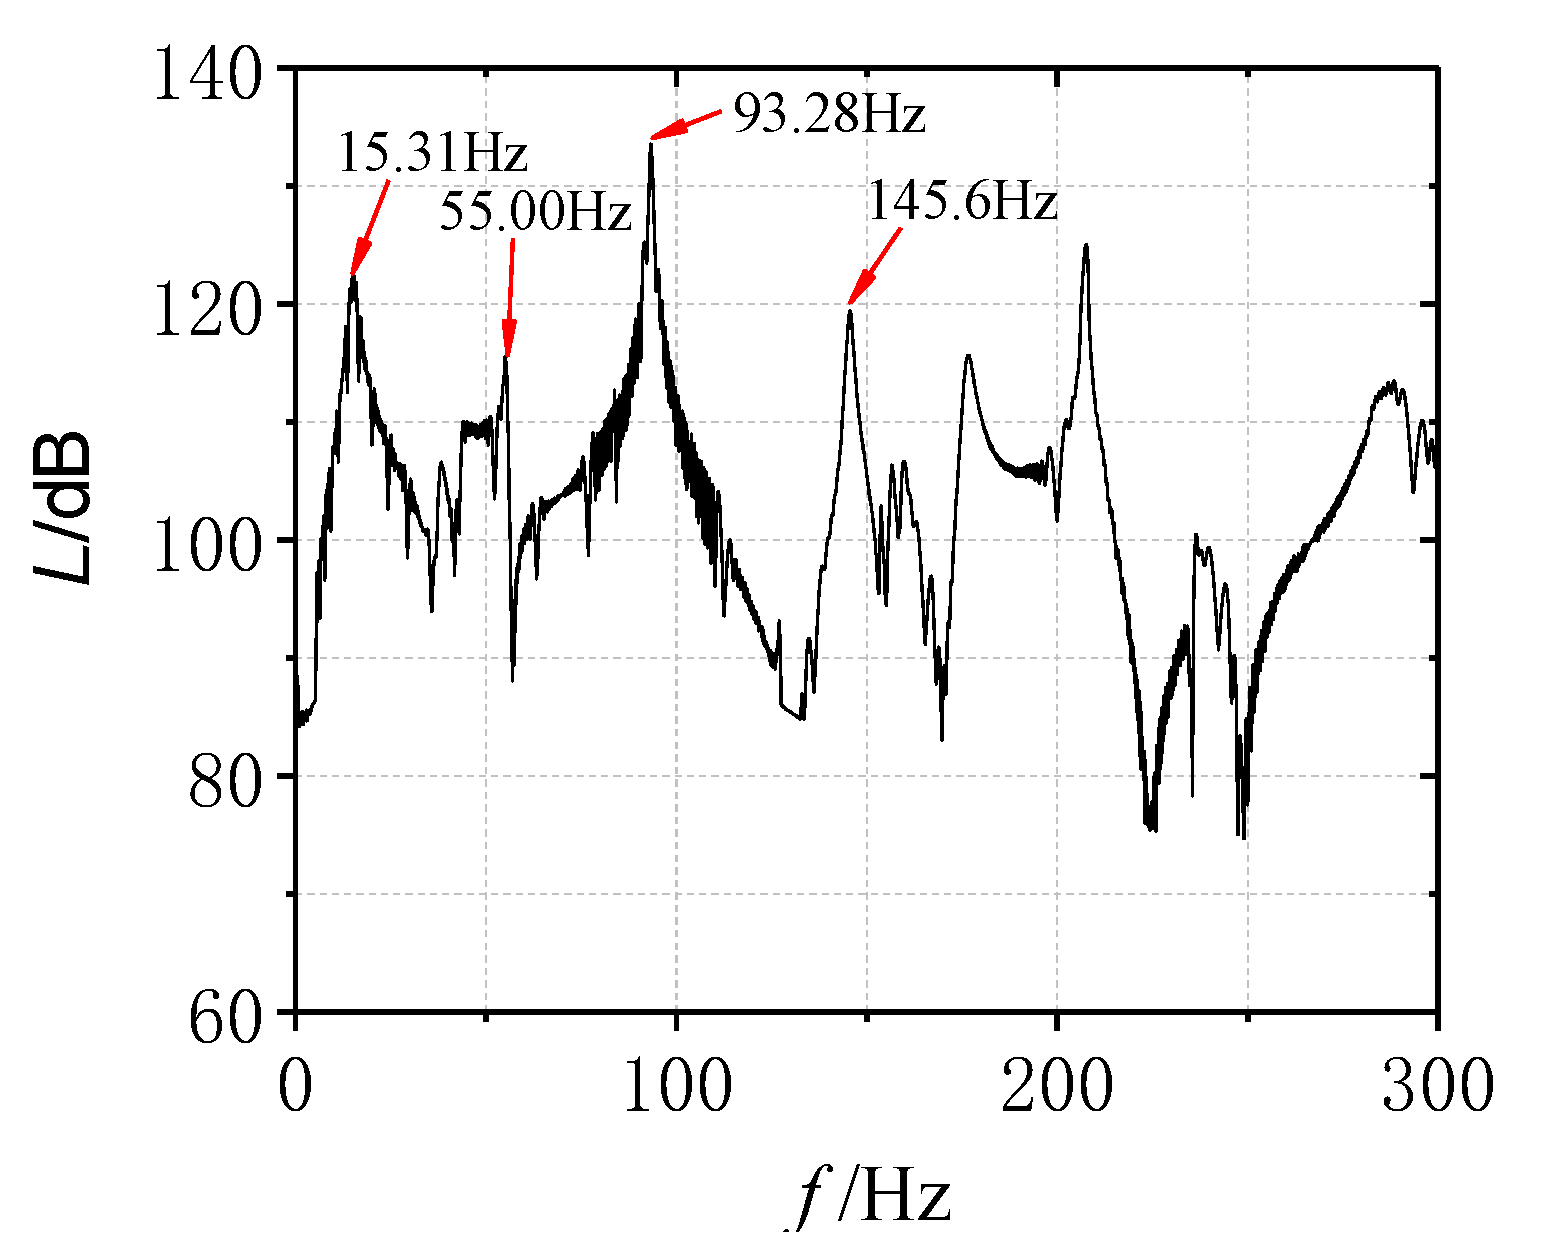
| Experiments | FEMA | Error | |
|---|---|---|---|
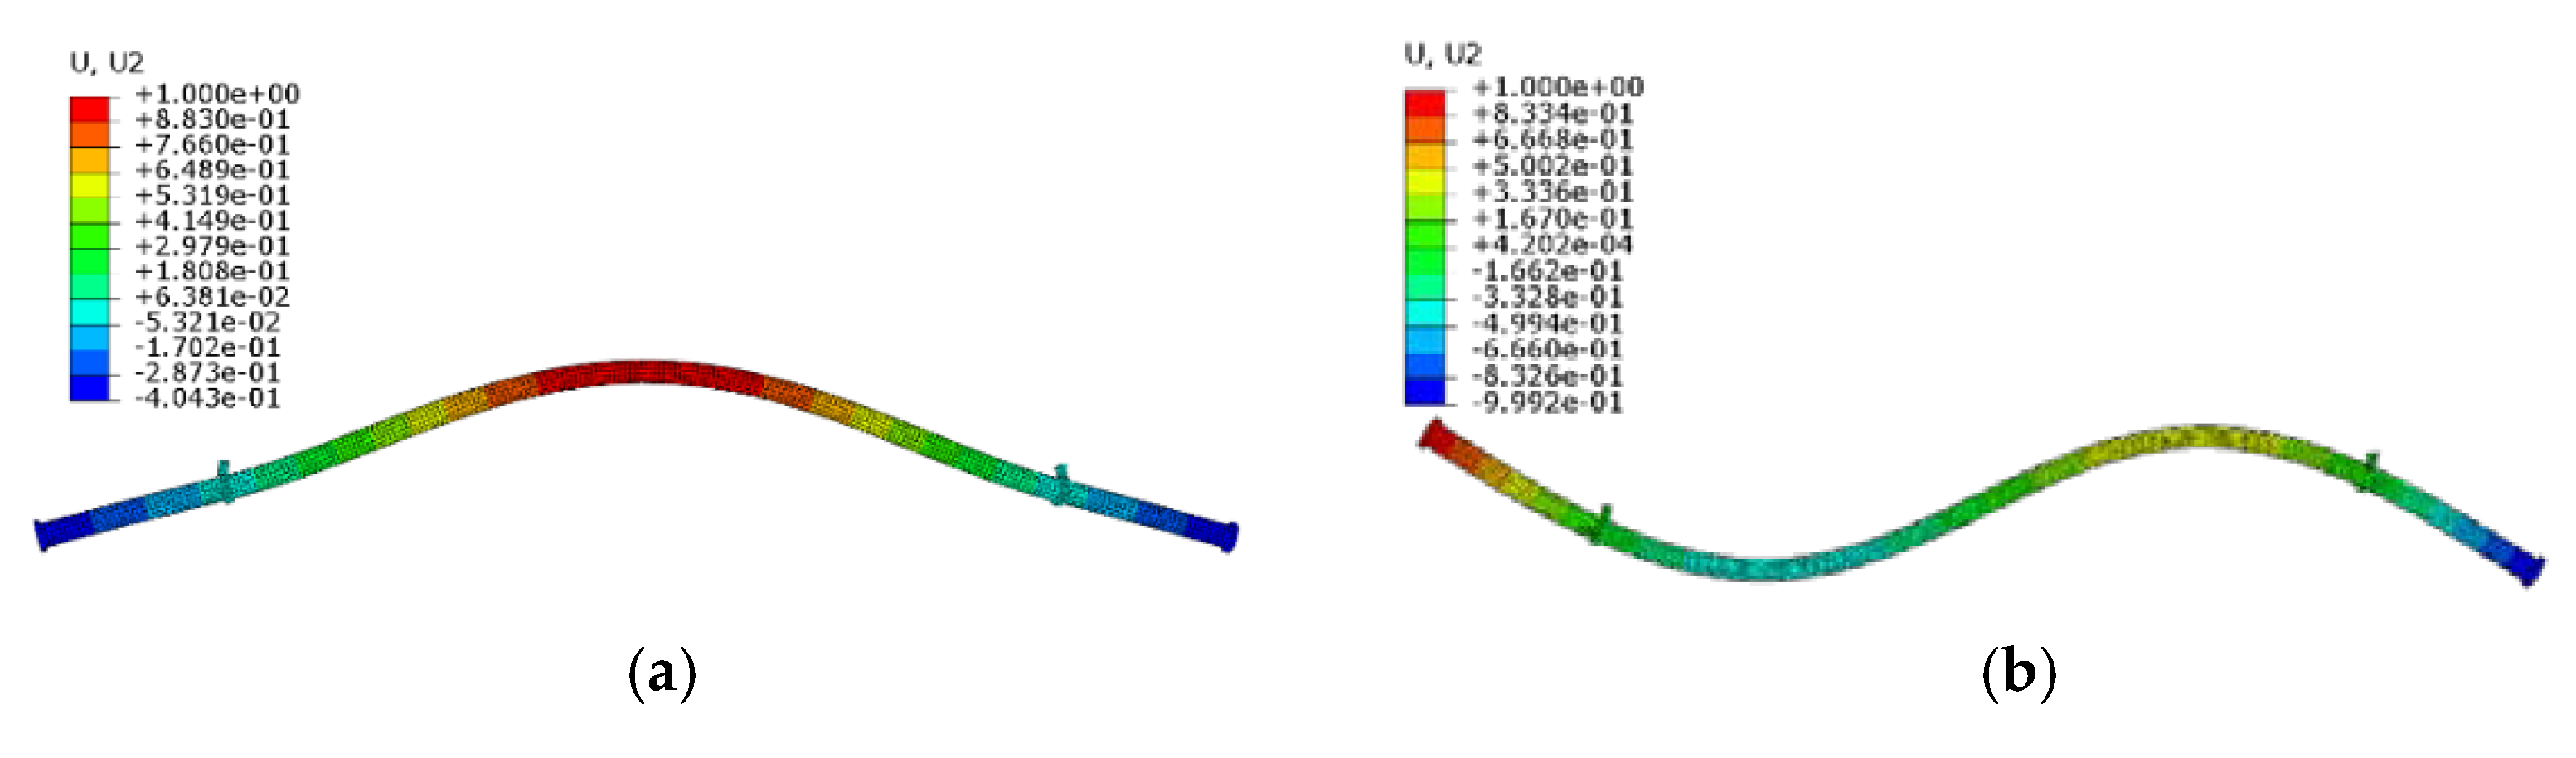
| First-order | 15.31 Hz | 15.36 Hz | 0.33% |
| Second-order | 55.00 Hz | 45.27 Hz | 17.7% |
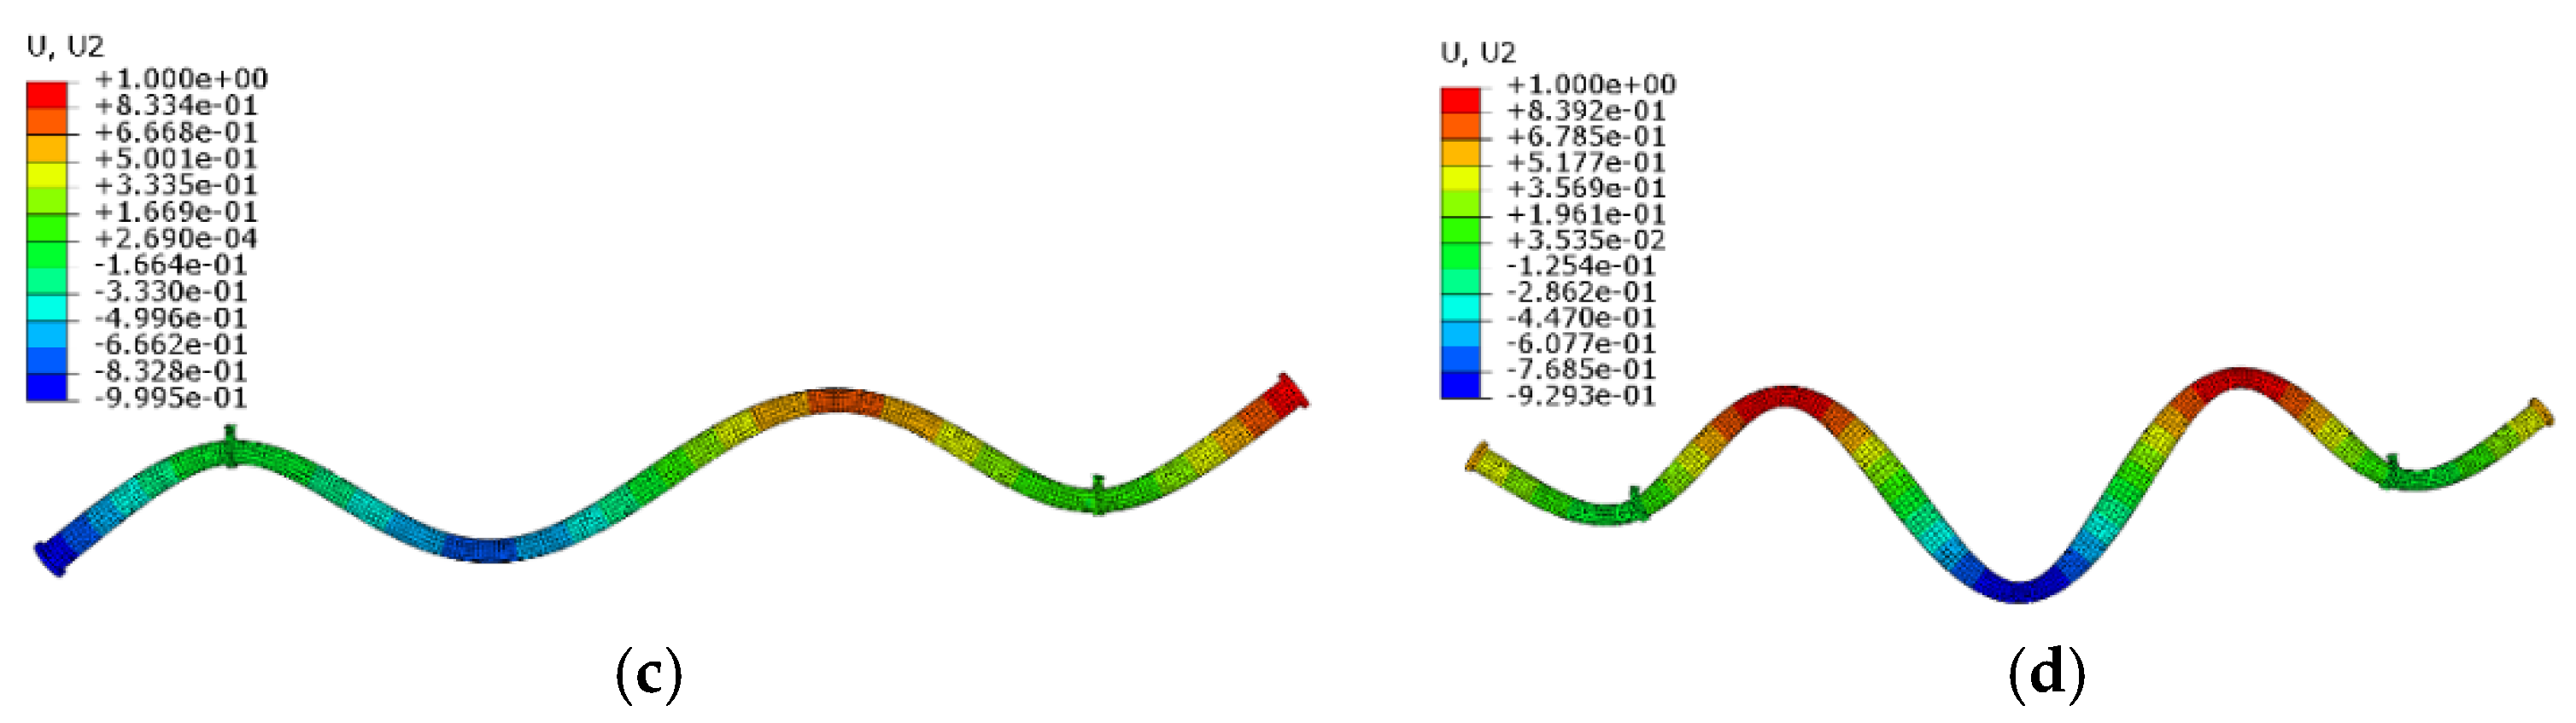
| Third-order | 93.28 Hz | 95.31 Hz | 2.18% |
| Fourth-order | 145.6 Hz | 161.9 Hz | 11.2% |
| Layers | Length (mm) | Temperature (°C) | |
|---|---|---|---|
| ① | 1/2/3 | 1000 | 25 |
| ② | 2 | 250/500/750/1000 | 25 |
| ③ | 2 | 1000 | 25/100/200/300 |
| Number of EMWM Layer | One | Two | Three |
|---|---|---|---|
| First-order | 0.877 | 1.928 | 1.126 |
| Second-order | 6.151 | 5.957 | 5.593 |
| Third-order | 1.705 | 5.511 | 5.538 |
| Fourth-order | 0.587 | 11.304 | 7.663 |
| Frequency range 5–2 kHz | 1.719 | 2.559 | 2.970 |
| Temperature | 25 °C | 100 °C | 200 °C | 300 °C |
|---|---|---|---|---|
| First-order | 1.928 | 1.881 | 1.391 | 1.007 |
| Second-order | 5.957 | 5.975 | 5.318 | 4.614 |
| Third-order | 5.511 | 1.080 | 0.547 | 1.034 |
| Fourthorder | 11.31 | 7.787 | 8.285 | 2.524 |
| Entire frequency range 5–2 kHz | 2.559 | 2.600 | 2.889 | 2.563 |
| Coated Length | 250 mm | 500 mm | 750 mm | 1000 mm |
|---|---|---|---|---|
| First-order | 1.616 | 1.233 | 1.248 | 1.928 |
| Second-order | 5.229 | 5.041 | 5.555 | 5.957 |
| Third-order | 1.023 | 2.564 | 3.176 | 5.511 |
| Fourth-order | 7.302 | 7.773 | 7.065 | 11.304 |
| Entire frequency range 5–2 kHz | 2.519 | 5.757 | 2.863 | 2.559 |
Publisher’s Note: MDPI stays neutral with regard to jurisdictional claims in published maps and institutional affiliations. |
© 2021 by the authors. Licensee MDPI, Basel, Switzerland. This article is an open access article distributed under the terms and conditions of the Creative Commons Attribution (CC BY) license (https://creativecommons.org/licenses/by/4.0/).
Share and Cite
Zi, B.; Jiang, F.; Wu, Y.; Bai, H.; Tang, Y.; Lu, C. Analysis and Experimental Research on Vibration Reduction in Ship High-Temperature Pipeline Based on Long Coated Damping Structure. J. Mar. Sci. Eng. 2021, 9, 838. https://doi.org/10.3390/jmse9080838
Zi B, Jiang F, Wu Y, Bai H, Tang Y, Lu C. Analysis and Experimental Research on Vibration Reduction in Ship High-Temperature Pipeline Based on Long Coated Damping Structure. Journal of Marine Science and Engineering. 2021; 9(8):838. https://doi.org/10.3390/jmse9080838
Chicago/Turabian StyleZi, Bao, Feng Jiang, Yiwan Wu, Hongbai Bai, Yu Tang, and Chunhong Lu. 2021. "Analysis and Experimental Research on Vibration Reduction in Ship High-Temperature Pipeline Based on Long Coated Damping Structure" Journal of Marine Science and Engineering 9, no. 8: 838. https://doi.org/10.3390/jmse9080838
APA StyleZi, B., Jiang, F., Wu, Y., Bai, H., Tang, Y., & Lu, C. (2021). Analysis and Experimental Research on Vibration Reduction in Ship High-Temperature Pipeline Based on Long Coated Damping Structure. Journal of Marine Science and Engineering, 9(8), 838. https://doi.org/10.3390/jmse9080838