Article

Experimental Study on the Unsteady Natural Cloud Cavities: Influence of Cavitation Number on Cavity Evolution and Pressure Pulsations

1
School of Naval Architecture, State Key Laboratory of Structural Analysis for Industrial Equipment, Dalian University of Technology, Dalian 116024, China
2
Beijing Institute of Machinery Equipment, Beijing 100854, China
3
School of Astronautics, Harbin Institute of Technology, Harbin 150001, China
*
Author to whom correspondence should be addressed.
J. Mar. Sci. Eng. 2021, 9(5), 487; https://doi.org/10.3390/jmse9050487
Submission received: 18 March 2021 / Revised: 19 April 2021 / Accepted: 22 April 2021 / Published: 30 April 2021
(This article belongs to the Section Ocean Engineering)

Abstract

:
High-speed underwater vehicles are subjected to complex multiphase turbulent processes, such as the growth, development, shedding, and collapse of cavitation bubbles. To study the cavity evolution and pressure pulsation characteristics, in this paper, cloud cavitation over a conical axisymmetric test body with four pressure sensors is investigated. A multi-field simultaneous measurement experiment method for the natural cavitation of underwater vehicles is proposed to understand the relationship between cavity evolution and instantaneous pressure. The results show that the evolution of cloud cavitation can be mainly divided into three stages: (I) the growth process of the attached cavity, (II) the shedding process of the attached cavity, and (III) the collapse of detached cavities. The evolution of the attached cavity and collapse of the large-scale shedding cavity will cause strong pressure pulsations. It is found that the cavitation number plays an important role in cavitation evolution and pressure pulsation. Interestingly, as the cavitation number decreases, the fluctuation intensity of cavitation increases significantly and gradually presents obvious periodicity. Moreover, the unstable cavitating flow patterns are highly correlated with the time domain and frequency domain characteristics of pressure. Especially, as the cavitation number decreases, the main frequency becomes lower and the pressure band becomes more concentrated.

1. Introduction

Cavitation is a phase change phenomenon, and it extensively exists in various fluid machinery, such as hydrofoils, propellers, high-speed vehicles, etc. [1,2,3]. Cavitation can usually produce pressure fluctuations, sudden load changes, vibration, noise and many other problems [4,5,6,7,8]. The cavitation phenomenon can be categorized into primary cavitation, sheet cavitation, cloud cavitation and supercavitation according to the cavitation form [9,10,11,12]. Among them, in the cloud-like cavitation stage, due to the influence of factors such as re-entrant flow, cavitation shows a quasi-periodical unsteady evolution phenomenon, and the hydrodynamic load on the surface of the object also undergoes complex changes. Therefore, the study of unsteady cavitation flow is of great significance to industrial design.
Knapp and Hollander [13] conducted experimental observations of the cavitation bubble and pointed out that the re-entrant flow may be an important source of cloud-like cavitation separation and instability. Rouse and McNown [14] studied the underwater cavitation characteristics of different head models such as a flat head, cone head and ellipsoid head through water tunnel experiments. Their results clarified the natural cavitation characteristics of different head shapes and the associated surface pressure of the body. Logvinovich et al. [15] examined the evolution of natural cavitation and ventilated cavitation under different cavitation parameters and model parameters. Their analysis of the stability of ventilated cavitation under different aeration rates laid the foundation for future supercavitation research. Callenaere et al. [16] used ultrasonic technology and LDV to study the characteristics of cavitation instabilities and the problem of re-entrant flow. Wang et al. [17] studied the cavitation flow structure of ventilation through a combination of experimental and numerical methods, and also considered the effects of gravity. They found that when the gas entrainment coefficient is constant, there are two typical gas leakage mechanisms under different Froude numbers, one with an annular vortex and a second with two hollow tube vortex modes. Shao et al. [18] systematically studied the supercavitation behavior of ventilation in unsteady flow through a high-speed water tunnel. By changing the ventilation rate and the size of the cavitator, different shapes of cavities were produced, revealing five different cavity states. Many scholars have conducted experiments and numerical calculations on the shedding of unsteady cavitating flow, cavity closure, and the formation and development mechanism of re-entrant flow, which are helpful to understand the cavitating flow problem.
Cavitation bubbles are unstable, and cavitation dynamics will cause periodic cloud shedding and collapse. Many scholars have investigated the evolution of different cavitation bubbles [19,20,21]. Kubota et al. [22] conducted an experimental study on the flow structure around the unsteady cloud cavitation on a two-dimensional hydrofoil, and successfully measured the unstable structure of the cloud cavitation through laser Doppler anemometry. Huang et al. [23] studied the unsteady cloud cavitation of the Clark-Y hydrofoil through a combination of experimental and numerical methods, and observed the periodic formation, shedding and collapse of the sheet/cloud cavity, as well as the related baroclinic pressure and viscous torque, which is an important mechanism for generating and changing vortices. Hu et al. [24] studied the evolution of the primary cavity around a bluff body and the interaction between primary cavitation and local turbulence. Their study showed that the primary cavity has certain vortex characteristics and moves downstream at a relatively low speed. At the same time, the primary cavity has a substantial influence on the local flow field and makes the vortex structure unstable. Sun et al. [25] studied the influence of the gas ventilation rate on cavity evolution and dynamic pressure. Three unsteady flow modes were observed, namely the foam cavity, continuous transparent foam cavity, and continuous transparent asymmetric cavity modes. Due to the complexity of cavitating flow, in order to fully understand cavitating flow and its evolution mechanism, more research on cavitating flow is very necessary, especially for the pulsation of vehicle surface pressure caused by cavity evolution.
The pressure characteristic is an important parameter of unsteady cavitating flow [26,27], and it has long been paid attention to by researchers [28,29,30,31,32]. Kawanami et al. [33] studied the mechanism of attached cavitation flow and its control method. A pressure sensor is used to measure the severe pressure pulsation caused by the shedding cavitation cloud moving downstream, leading to the conclusion of a classic cavitation cloud shedding mechanism, and a means of controlling the cavitation loss. Astolfi et al. [34] analyzed the local cavitation characteristics of a hydrofoil through a series of experiments, and discussed the stability of cavitation under different cavitation numbers, before establishing a measurement method for the cavitation shape and the cavitation length. Zhang et al. [35] studied the structure of ventilating cavitation flow around an underwater axisymmetric body by observing the evolution of the unsteady cavitation flow cavity and by comparing the results with numerical simulations. They concluded that the vortices will cause pressure fluctuations due to the periodic shedding downstream. Wang et al. [36] analyzed the unstable flake/cloud cavitation flow under two different types of rupture and shedding mechanisms accompanied by the pressure fluctuations associated with cavitation behavior through both experiments and calculations. Their experimental results show that the significant quasi-periodic pressure fluctuations in sheet/cloud cavitation are caused by instantaneous cavitation behavior. Scholars have performed a lot of work for the pressure pulsation characteristics of unsteady cavitating flow. However, the law of pressure pulsation and internal relations caused by the evolution of cavitation under different cavitation numbers still need to be improved.
Although considerable research on the evolution of cavitation and pressure pulsation has been conducted, there are certain limitations in the simultaneous measurement of cavity dynamics and the law of pressure pulsation, which needs to be improved. In this study, we used experimental methods to address the characteristics of cavitation flows, especially their evolution behavior and dynamic pressure. The cavitation morphology evolution and pressure under four different cavitation numbers are compared. The structure of this paper is as follows: Section 2 introduces the experimental setup and test methods in detail. Subsequently, Section 3 presents the experimental results and discusses the evolution of the cavity and the shedding mechanism of cavitation flow under different cavitation numbers, the temporal characteristics of the pressure fluctuations, and frequency domain analysis. Finally, the main findings are summarized in Section 4.

2. Experimental Setup

Experiments were carried out in a closed-loop cavitation water tunnel with a test section of 0.26 m × 0.26 m × 1.0 m. Transparent plexiglass is installed on the upper, lower, front and rear sides of the test section to observe the flow field. The flow velocity in the test section ranges from 0 to 18 m/s. A vacuum pump is connected to the top of the tank to adjust the test pressure. Figure 1b shows the multi-field synchronous measurement system for the recording of cavity evolution and pressure signals. The cavitating flows are captured by the high-speed camera at a sampling frequency of 3000 fps with an image resolution of 1024 × 1024 pixels. LEDs are used during the experiment to ensure sufficient background light. In this study, a multi-field synchronous measurement system for cavitation flow was established. A schematic diagram of the synchronous measurement method is shown in Figure 1.
As shown in Figure 2, we used a conical axisymmetric test body placed in the middle of the test section in the present study. The test body is a hollow cylindrical structure, made of aluminum alloy, with a diameter of 40 mm. There are four pressure sensors in the test body. These are installed on the internal adapter and communicate with the outside through the holes on the surface of the test body. The center point of P1 is 30 mm away from the head of the test body, the center point of P2 is 82 mm from the head of the test body, and the distance between the two subsequent pressure monitoring points is 30 mm, as shown in Figure 2.

3. Results and Discussion

The high-speed camera system and dynamic force measurement system are used to analyze the structures and cavitation shapes under four cavitation numbers of σ = 0.82, σ = 0.68, σ = 0.62 and σ = 0.52. The cavitation number is defined as:
σ = P P v 0.5 ρ l v 2
where P is the free stream pressure, P v is the saturated vapor pressure at the local temperature,   ρ l is the liquid density, and v is the free stream velocity.

3.1. The Evolution Patterns of Cloud Cavitating Flows

Figure 3 shows the evolution of the cloud cavitation morphology over one cycle when σ = 0.68. It can be seen that the typical quasi-periodic cloud cavitation development process can be divided into three main stages: (I) the growth process of the attached cavity, (II) the shedding process of the attached cavity, and (III) the collapse process of detached cavities. In stage I, from t0 to t0 + 8 ms, the cavity that shed in the last cycle moves downstream like a diagonal line A, and at the same time the small vortex cavities merge with each other, forming an attached cavity at the shoulder again. Over time, the attached cavity gradually grows and covers the wall surface. At t0 + 8 ms, the cavitation on the shoulders of the body develops to the maximum length, is relatively stable, as shown in line B; interestingly, from t0 to t0 + 3 ms, we found that there is a translucent cavity near the head. Due to the influence of the re-entrant flow, the transparent cavity gradually disappears as the cavity grows. In stage II, as the re-entrant flow continues to move in the cavity and reaches the shoulder of the vehicle, the re-entrant flow interacts with the surface of the cavity, causing the cavity at the shoulder of the vehicle to break up, as shown by the t0 + 9 ms arrow. At this time, the attached cavity began to shed near the cavity closure region, and some small separated cavities were observed, from t0 + 9 ms to t0 + 21 ms, as shown in line C; as the attached cavity shed, new cavities regenerated and gradually grew on the shoulders. It breaks at approximately t0 + 21 ms. In stage III, at t0 + 22 ms, the large separation cavity is completely broken from the attachment cavity. From t0 + 22 ms to t0 + 32 ms, the large shedding cavity gradually transforms into a small-scale cavity, and moves downstream, such as the diagonal D. The vortex cavity reappears near the shoulder and immediately forms a new attachment cavity until it reaches a maximum at about t0 + 32 ms. In general, when the cavitation number is 0.68, the growth of the cavity and the fracture and shedding of the separation cavity show obvious periodicity. It is worth noting that the growth of the separation cavity basically grows at the same time as the newly formed attachment cavity. When the separation cavity breaks and moves downstream near the middle of the vehicle, the attachment cavity grows to the maximum and a new cycle begins.
Figure 4 shows the pressure fluctuations obtained by the simultaneous measurement of cloud-like cavitation shapes. P1, P2, P3, and P4 denote the pressure fluctuations at the corresponding sensor positions. The distribution positions of the sensors on the surface of the vehicle are as shown in Figure 3. As shown in Figure 3, we can observe the relationship of pressure fluctuation with the shedding of cavities.
In one cycle, corresponding to the growth of the shoulder cavity and the break off of the shedding cavity, the pressure pulsation at P1 and P2 first increases, and then decreases after reaching the peak. As the shedding cavity moves downstream, to the P3 and P4 positions, the pressure will pulsate and reach a peak again. In stage I, combining the evolution of the cavity shape in Figure 3 and the pressure pulsation in Figure 4 from t0 to t0 + 8 ms, when the shoulder cavities cover the sensor P1, the pressure value is smaller. As the shedding cavities move downstream, the pressure gradually increases and reaches a peak at this time. Afterwards, due to the generation of the re-entrant flow, the interaction between re-entrant flow and the surface of the cavitation leads to pressure fluctuations and is accompanied by the growth and collapse of the small-scale shedding cavities. The pressure changes on the surface of the vehicle are more complicated. In stage II, after t0 + 9 ms, due to the influence of the re-entrant flow, the shoulder cavities break at the shoulder, and the large-scale cavity gradually forms in the tail and moves downstream. Correspondingly, the pressure fluctuations of the four sensors increase in turn (as shown by the red dotted line in Figure 4), and reach the peak. After t0 + 18 ms, as the cavity breaks and separates from the main cavity, the P1 sensor measures a large number of local pressure pulsations, as shown in the rectangular boxes a in Figure 4. In stage III, after t0 + 22 ms, when this large-scale shedding cavity moves along the vehicle to the downstream high-pressure area, the pressure fluctuations in the corresponding area will first decrease and then increase, as shown in rectangular boxes b. At the same time, as the cavity breaks and leaves the main cavitation region, obvious fluctuations appear at the end of the cavity, and severe pressure fluctuations are measured at the positions of sensors P3 and P4, as shown in rectangular boxes c and d in Figure 4. Hence, due to the generation of cloud cavitation, the pressure fluctuation on the surface of the vehicle is more complicated, and each stage corresponds to a different pressure pulsation characteristic. When the attachment cavity sheds and moves downstream, the pressure sensors show strong pulsation. However, the overall pressure fluctuation corresponds to the cavitation evolution process, which has obvious periodic evolution characteristics.

3.2. The Effects of Cavitation Number on Cavitation Evolution and Pressure Fluctuation

Figure 5 shows the evolution of the natural cavity morphology at 10 different moments under four cavitation numbers, in which the direction of the incoming flow is from right to left. When the cavitation number is equal to 0.81, there are only a few micro-sized vapor bubbles near the shoulder. From Figure 5a, it is found that when σ = 0.81, because the cavitation number is large at this time, the cavity length, cavity shedding scale and fluctuation amplitude are small, and the cavity develops and covers the sensor P1 at this time. There is no obvious natural cavitation from sensor P2 to sensor P4; Figure 5b is the evolution process of the cavity shape when σ = 0.68. Relatively stable sheet cavitation is observed, but there are unstable fluctuations in the enclosed area of the cavity. As it causes the most severe pressure fluctuations and instabilities, special emphasis will be given to sheet/cloud cavitation. From t0 to t0 + 3.6 ms, the cavity is in a relatively stable state and a re-entrant flow is generated at the tail of the cavity, as shown in the red vertical dotted line. From t0 + 7.1 ms and t0 + 14.2 ms, as the re-entrant flow from the tail of the cavity develops into the cavity, the shoulder cavity gradually break off and sheds, and at the same time, some small-scale shedding cavity clusters are produced, as shown in Figure 5b by the red inclined dotted line F. From t0 + 17.8 ms to t0 + 32 ms, the shedding cavity gradually moves downstream (see the red dashed line G), and the shoulder cavity gradually grows to its maximum size (see the red dashed line H). At the same time, the cavity continues to move to the downstream high pressure zone, the shedding cavity group gradually collapses, the cavitation on the fractured shoulder gradually grows and reaches the maximum, and the cavity is temporarily stabilized and the next shedding cycle begins to develop; Figure 5c,d show the evolution of a cycle of cloud cavitation when σ = 0.62 and σ = 0.52, and the evolution of the overall cavitation shape under the two low cavitation numbers behaves similarly to that when σ = 0.68. The shoulder is produced and gradually grows, eventually breaking at the end of the cavity. As the cavitation number decreases further, we can find that more violent void growth/shedding occurs, which is called sheet/cloud cavitation. It is worth noting that the decrease in the cavitation number increases the length of shoulder cavitation, the duration of one cycle increases, and the shedding cycle becomes more obvious:
Figure 6 shows the variation in the surface pressure of the vehicle with time obtained from different pressure monitoring points within 0.5 s under four different cavitation numbers. It can be seen that the pressure fluctuations show obvious periodic characteristics. Additionally, the amplitude of pressure fluctuation is between 10 kPa and 60 kPa. For sheet cavitation, when the cavitation number equals 0.81, 0.68 and 0.62, relatively stable attached cavities are obtained. For these cases, the pressure fluctuation intensity becomes larger. However, when the cavitation number is further decreased to 0.52, typical cavity growth/shedding appears, and a significant increase in pressure fluctuation intensity is detected on four transducers. Especially, the pressure fluctuation intensity of the pressure sensor 3 is high due to the detached cloud cavities collapse there, as shown in Figure 6. It can be seen from the pressure curve that when σ = 0.81 a small natural cavity forms at the shoulder of the sailing body, and there is less air leakage at the tail of the cavity, and no obvious cavity shedding.
When σ = 0.68, it can be seen that the shoulder cavity has shifted to the area between sensors P1 and P2. After passing through the shedding cavity, the pressures measured by the four sensors all show significant fluctuations, with periodic fluctuation characteristics beginning to emerge. This is because sensors P2, P3 and P4 are located at the tail of the cavitation bubble and the large-scale shedding cavities collapse area (as shown in Figure 5). Thus, the pressure fluctuation amplitude at sensors P2, P3 and P4 is obviously greater than the pressure fluctuation intensity obtained by sensor P1. When the cavitation number decreases to σ = 0.62, the pressure fluctuation amplitude measured by the two sensors P1 and P2 further increases, and more obvious periodic characteristics appear. A further decrease in the cavitation number to σ = 0.52 produces slightly different fluctuation characteristics from the higher cavitation numbers. The degree of transformation is more severe. The cavity sheds and collapses, causing vibrations in the vehicle. As a result, the pressure fluctuations measured by the four sensors present weak periodicity. As the cavitation number decreases, the pressure pulsation increases due to the intensification of cloud cavitation, especially for the pressure pulsation of the three sensors P2, P3, and P4. Hence, as the cavitation number decreases and the cavity size increases, the cloud cavitation phenomenon becomes more obvious. The greater pressure pulsation caused by the closing of the cavitation tail and the collapse of the large-scale shedding cavity causes strong instability downstream of the vehicle.

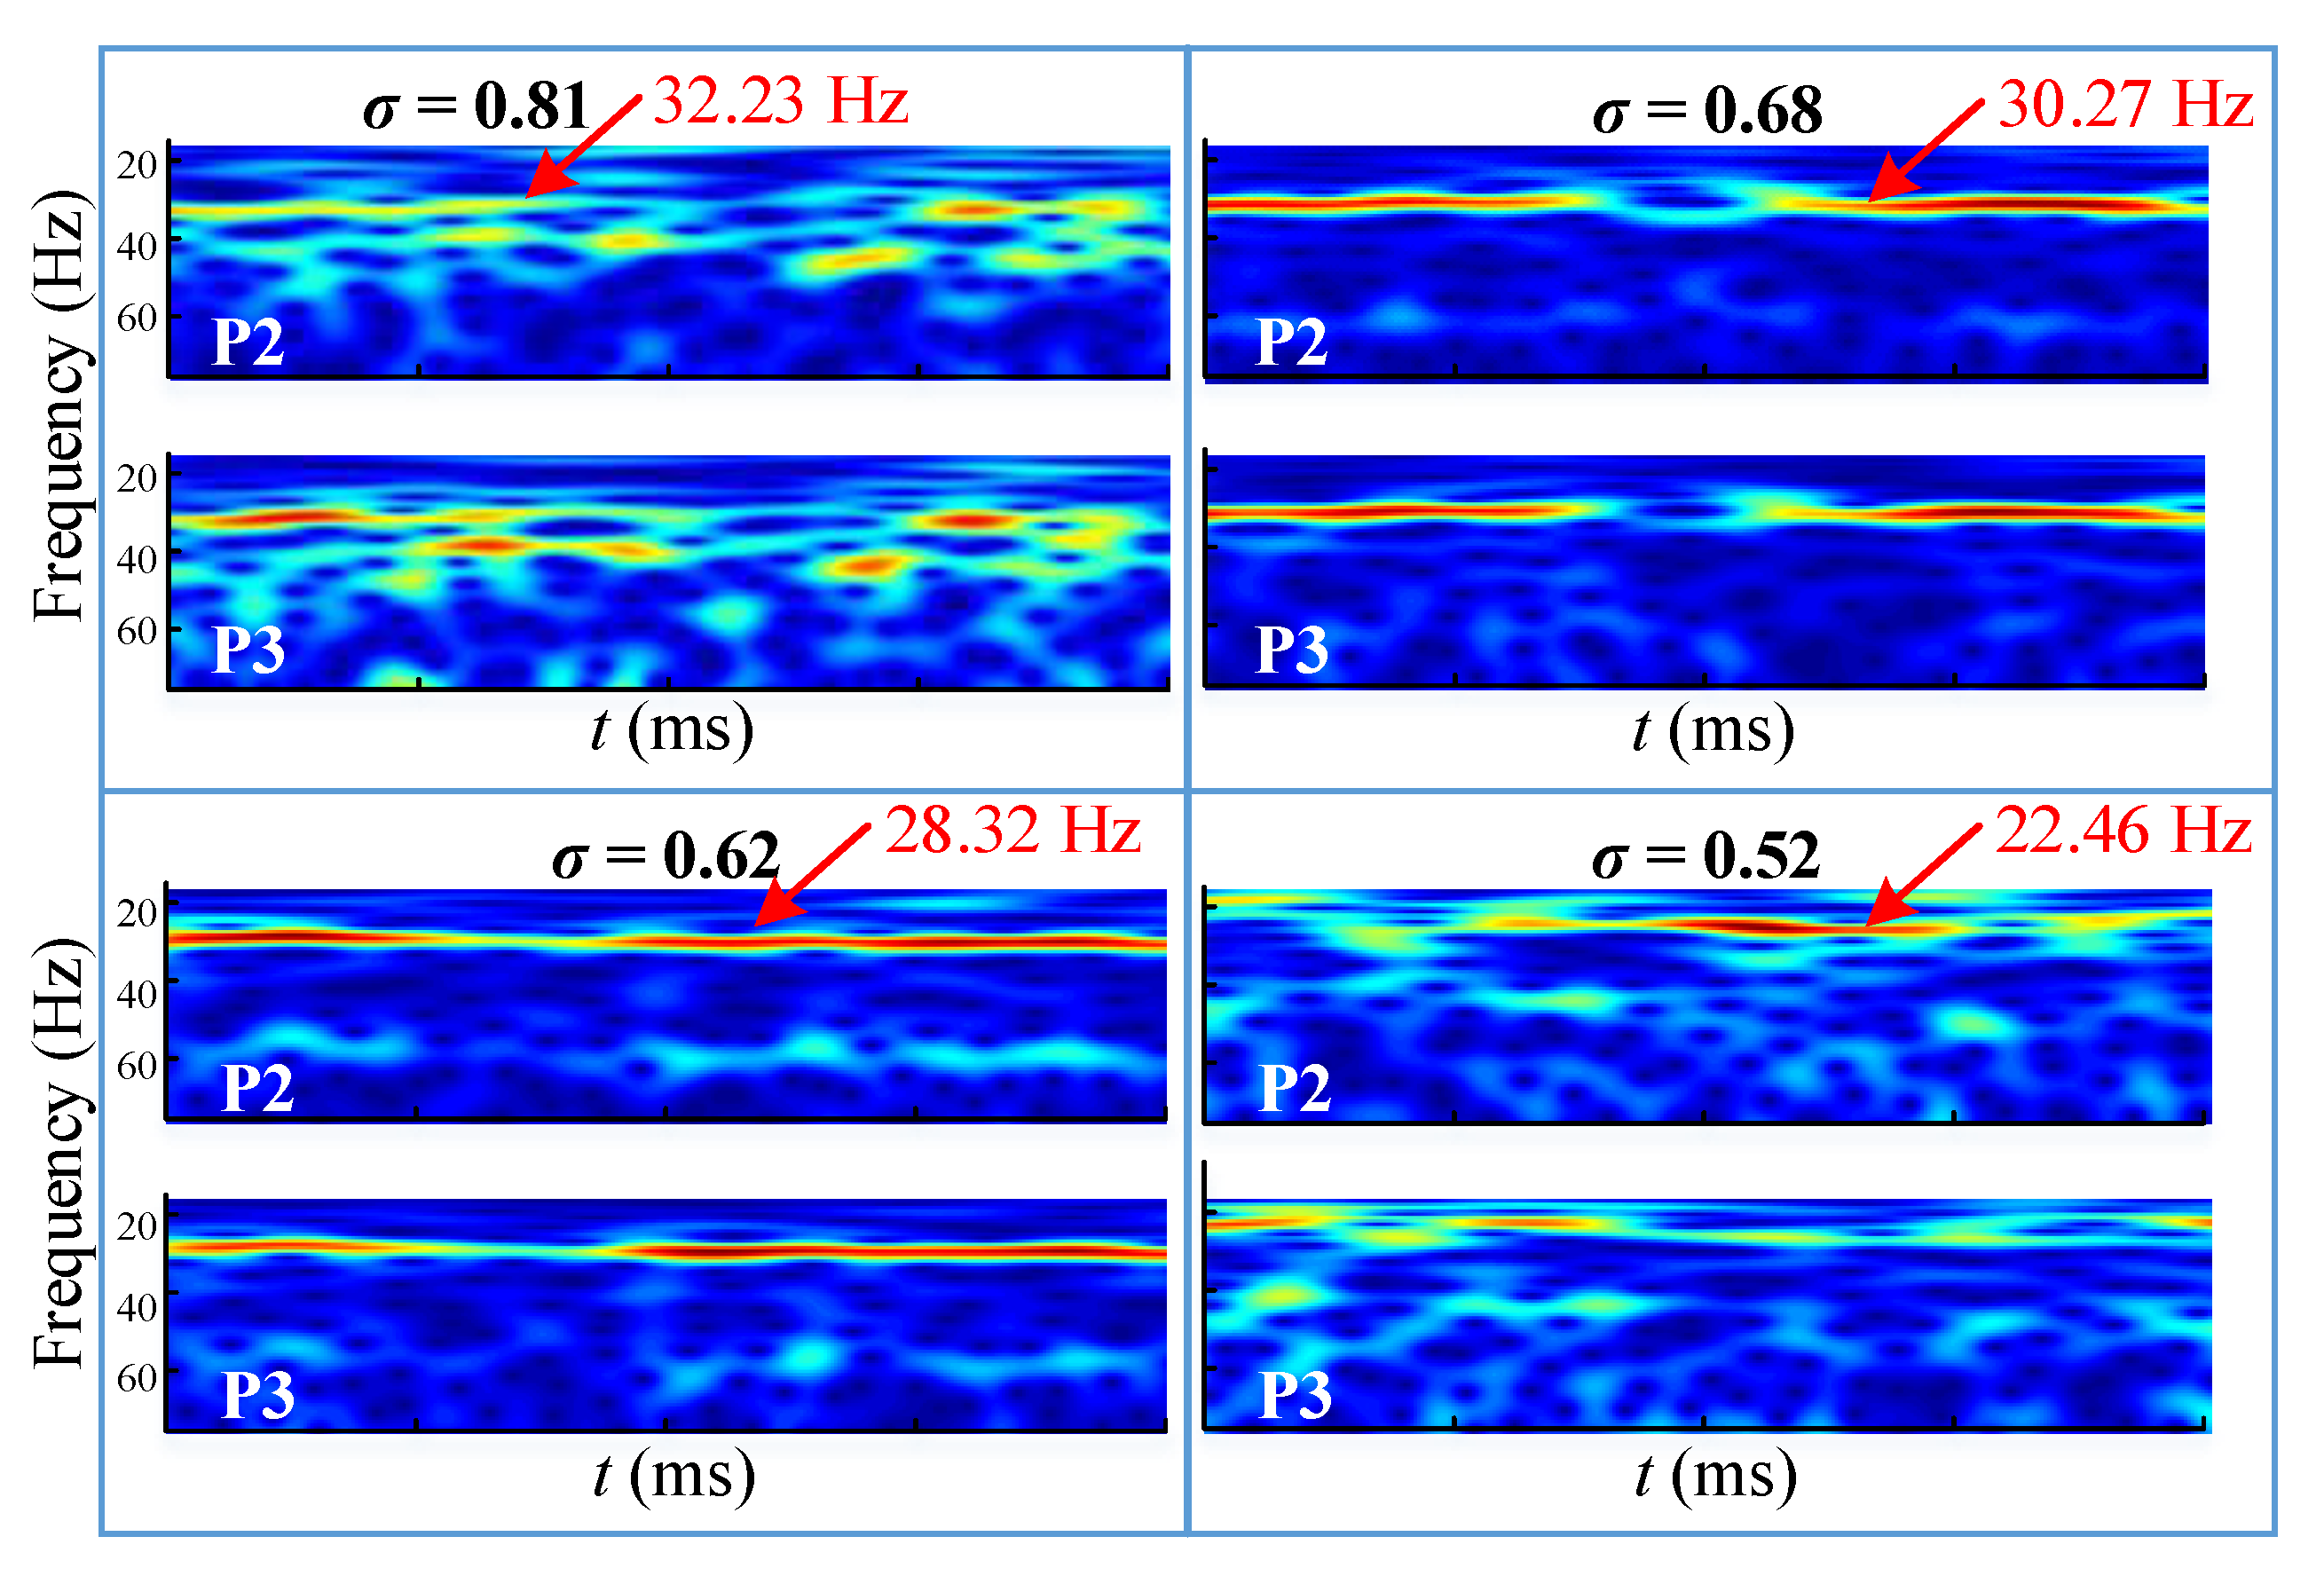
3.3. Influence of Cavitation Number on Frequency Characteristics of Cavitating Flows

Figure 7 shows the frequency domain distribution of pressures measured by sensors P1–P4 after applying the fast Fourier transform. Comparing the spectrum distribution results under different cavitation numbers, when σ = 0.81, as shown in Figure 7a, there is a small-amplitude oscillation with a main frequency of 32.23 Hz, and a secondary frequency of 51.43 Hz. Figure 7b shows the frequency domain distribution of the pressure changes in the four sensors when σ = 0.68. The frequency domain under this cavitation number is relatively consistent, and the energy is concentrated in a frequency band around 30.27 Hz, indicating an obvious large-scale periodic development process for cavity shedding. At the same time, sensor P4 displays a higher frequency energy band, at around 64.03 Hz, but its energy is significantly less than that at 30.27 Hz. Therefore, the dominant frequency of the pressure fluctuations of the four sensors is 30.27 Hz; analysis indicates that the secondary dominant frequencies corresponding to different dominant frequencies under different cavitation numbers are related to the small-scale cavities formed during the shedding of large-scale cavities. Further observations show that, as the cavitation number decreases, the amplitude of the main frequency of oscillation gradually increases. This is due to the large pressure fluctuations, with the strength of the signal energy reflecting the magnitude of the signal fluctuations.
As shown in Figure 7c, when σ = 0.62, there is an energy-intensive frequency band at 28.32 Hz for the four sensors. As the cavitation number is further reduced to σ = 0.52, the closed area at the end of the cavity is nearby, and this low frequency is mainly caused by the re-entrant flow at the end of the cavity. There are two frequency bands in which the energy is concentrated for all four sensors, 22.46 Hz and 43.94 Hz, and the dominant frequency is not obvious. As with the previous pressure analysis, this is caused by the vibration of the vehicle. When cavitation occurs at the shoulder of the vehicle, the cavitation gradually shows a cyclical development and change process, and the frequency of pressure fluctuation is basically the same as the frequency of cavity shedding. The cavitation number decreases, the first and second order frequencies of pressure fluctuations decrease, and the period becomes longer.
According to the results in Figure 7, Table 1 summarizes the dominant frequency f1 and secondary frequency f2 under the four cavitation numbers. When σ = 0.81, the secondary frequency is 1.6 times the dominant frequency; when σ = 0.68, 0.62, and 0.52, the secondary frequency of cavitation shedding is approximately twice the dominant frequency. Under the different cavitation numbers, the dominant frequency decreases as the cavitation number decreases, and the secondary frequency gradually comes to be double the dominant frequency.
Figure 8 shows the time–frequency distribution obtained by applying a wavelet transform to the pressure fluctuations at points P2 and P3 on the vehicle. In the figure, the signal intensity is represented by different colors, with blue denoting low intensity and red denoting high intensity, (the main frequencies of different cavitation numbers are shown by the red arrow) and the signal intensity reflects the magnitude of the pressure fluctuations. It can be seen that when σ = 0.81, the time–frequency distribution of the surface pressure of the vehicle is not sufficiently concentrated. As shown in Figure 5, the cavitation is relatively stable and not easy to shed at this cavitation number, and the periodicity of the pressure pulsation is not obvious. In the time–frequency distribution diagram, it can be seen that the main frequency is 32.23 Hz, which is consistent with the results in Figure 7a; when σ = 0.68, there is a concentrated frequency band in the time–frequency distribution of the surface pressure of the vehicle, at around 30.27 Hz, indicating that this is the cavitation shedding period. A concentrated frequency band also appears in the time–frequency distribution when σ = 0.62. This frequency band corresponds to approximately 28.32 Hz, indicating that this is the cavity development period. When σ = 0.52, there are multiple discontinuous frequency bands in the time–frequency distribution of the surface pressure of the vehicle, and the corresponding frequency range is from 15 Hz to 40 Hz. This suggests that the periodicity of the surface pressure of the vehicle is not obvious, which is consistent with the result in Figure 7d. It can be seen that when the natural cavity at the shoulder of the vehicle is relatively large and the cavity is not clearly shedding, the continuous frequency domain amplitude of the measured surface pressure of the vehicle is small, and the frequency band distribution is not concentrated. With the decrease in the cavitation number, the time–frequency distribution of the pressure of the four sensors is complex, and there are multiple intermittent and energy-intensive frequency bands. These frequency bands correspond to different frequencies, indicating that the coupling of cavity shedding, vehicle vibration, etc., leads to irregular and unsteady pressure fluctuations.

4. Conclusions

In the present study, unsteady cavitating flows and the corresponding wall pressure fluctuations are studied using a water tunnel with a simultaneous sampling system. The main findings of this study are summarized as follows.
(1) The periodic evolution of unsteady natural cloud cavitation can be mainly divided into three stages: (I) the growth process of the attached cavity, (II) the shedding process of the attached cavity, and (III) the collapse of detached cavities. In stage I, a new attachment cavity appears on the shoulder of the vehicle and gradually grows to its maximum length, at which time the pressure gradually increases. In stage II, the cavity collapses and sheds at the shoulder due to the influence of the return flow, causing a strong pressure pulsation. In stage III, the large shedding cavity gradually transforms into a small-scale cavity and moves downstream, causing large fluctuations in downstream pressure.
(2) The cavitation number has a significant influence on the evolution of the cavity. With the decrease in the cavitation number, the amplitude of the cavitation fluctuation increases obviously, the size of shoulder cavities increases, and the degree of cloud cavitation further intensifies. Correspondingly, the large-scale cavity collapses and sheds more severely. For the four different cavitation numbers, pressure pulsation corresponds to the severity of cavitation. As the cavitation number decreases, the amplitude of pressure pulsation increases. Especially for a small cavitation number, we found that the shedding and collapse of the cavity will also cause the vehicle to vibrate, which intensifies the pressure pulsation.
(3) The cavitation number also changes the frequency of pressure pulsation. As the cavitation number decreases, the first and second order frequencies of cloud cavitation show a downward trend, and the secondary frequency gradually shows a double relationship with the dominant frequency. Meanwhile, when the cavitation number is relatively large, the pressure band is not concentrated. Moreover, as the cavitation number further decreases, there is a continuous and concentrated frequency band of surface pressure. When the cavitation number decreases to a certain value, the pressure band becomes complicated again.
This paper realizes the synchronous acquisition of the natural cavitation morphology evolution and pressure pulsation change process, and simultaneously analyzes the cavitation morphology on the shoulder of the vehicle and the unsteady flow characteristics of the pressure pulsation on the surface of the vehicle. At the same time, the natural cavitation shedding patterns, shedding frequency characteristics and the change law of the vehicle surface pressure pulsation are obtained. However, due to experimental conditions, the range of cavitation numbers is limited. The pressure pulsation mechanism and frequency change of a higher cavitation number still need to be further clarified.

Author Contributions

The manuscript was written by T.S., J.Z., X.Z. and C.W.; all authors discussed the original idea; conceptualization, T.S. and X.Z.; methodology, T.S.; formal analysis, T.S. and X.Z.; investigation, C.W.; resources, C.W.; data curation, C.W.; writing—original draft preparation, T.S.; writing—review and editing, T.S., J.Z., X.Z. and C.W.; visualization, X.Z.; supervision, T.S.; project administration, T.S.; funding acquisition, T.S. All authors have read and agreed to the published version of the manuscript.

Funding

This work was supported by the National Natural Science Foundation of China (52071062), the China Postdoctoral Science Foundation (2019T120211), the Natural Science Foundation of Liaoning Province of China (2020MS106), the 2018QNRC001, the Liao Ning Revitalization Talents Program (XLYC1908027), and the Fundamental Research Funds for the Central Universities (DUT21LK25, DUT20TD108, DUT20LAB308).

Conflicts of Interest

The authors declare no conflict of interest.

References

  1. Long, X.; Cheng, H.; Ji, B.; Arndt, R.E.; Peng, X. Large eddy simulation and Euler–Lagrangian coupling investigation of the transient cavitating turbulent flow around a twisted hydrofoil. Int. J. Multiph. Flow 2018, 100, 41–56. [Google Scholar] [CrossRef]
  2. Wittekind, D.; Schuster, M. Propeller cavitation noise and background noise in the sea. Ocean. Eng. 2016, 120, 116–121. [Google Scholar] [CrossRef]
  3. Ilieva, G.; Pirovsky, C. Modelling of Cavitation around Hydrofoils with Included Bubble Dynamics and Phase Changes. In Engineering Design Applications II; Springer: Berlin/Heidelberg, Germany, 2020; pp. 187–200. [Google Scholar]
  4. Ausoni, P.; Farhat, M.; Escaler, X.; Egusquiza, E.; Avellan, F. Cavitation influence on von Karman vortex shedding and induced hydrofoil vibrations. J. Fluids Eng. 2007, 129, 966–973. [Google Scholar] [CrossRef] [Green Version]
  5. Liu, M.; Tan, L.; Liu, Y.; Xu, Y.; Cao, S. Large eddy simulation of cavitation vortex interaction and pressure fluctuation around hydrofoil ALE 15. Ocean. Eng. 2018, 163, 264–274. [Google Scholar] [CrossRef]
  6. Wu, Q.; Huang, B.; Wang, G.; Cao, S. The transient characteristics of cloud cavitating flow over a flexible hydrofoil. Int. J. Multiph. Flow 2018, 99, 162–173. [Google Scholar] [CrossRef]
  7. Wu, Q.; Wang, C.C.; Huang, B.; Wang, G.Y.; Cao, S.L. Measurement and prediction of cavitating flow-induced vibrations. J. Hydrodyn. B 2018, 30, 1064–1071. [Google Scholar] [CrossRef]
  8. Ma, X.; Huang, B.; Zhao, X.; Wang, Y.; Chang, Q.; Qiu, S.; Wang, G. Comparisons of spark-charge bubble dynamics near the elastic and rigid boundaries. Ultrason. Sonochem 2018, 43, 80–90. [Google Scholar] [CrossRef]
  9. Knapp, R.T. Recent investigations of the mechanics of cavitation and cavitation damage. J. Appl. Mech. 1955, 77, 1045–1054. [Google Scholar]
  10. Dular, M.; Bachert, R.; Stoffel, B.; Širok, B. Experimental evaluation of numerical simulation of cavitating flow around hydrofoil. Eur. J. Mech. B Fluids 2005, 24, 522–538. [Google Scholar] [CrossRef]
  11. Chang, N.A.; Choi, J.; Yakushiji, R.; Ceccio, S.L. Cavitation inception during the interaction of a pair of counter-rotating vortices. Phys. Fluids 2012, 24, 014107. [Google Scholar] [CrossRef]
  12. Kinzel, M.P.; Krane, M.H.; Kirschner, I.N.; Moeny, M.J. A numerical assessment of the interaction of a supercavitating flow with a gas jet. Ocean. Eng. 2017, 136, 304–313. [Google Scholar] [CrossRef]
  13. Knapp, R.T.; Hollander, A. Laboratory investigations of the mechanism of cavitation. J. Appl. Mech. 1948, 70, 419–433. [Google Scholar]
  14. Rouse, H.; McNown, J.S. Cavitation and Pressure Distribution: Head Forms at Zero Angle of Yaw; The State University of Iowa: Ames, IA, USA, 1948. [Google Scholar]
  15. Logvinovich, G.V. Hydrodynamics of Flows with Free Boundaries; Naukova Dumka: Kiev, Ukraine, 1969; p. 16. [Google Scholar]
  16. Callenaere, M.; Franc, J.P.; Michel, J.M.; Riondet, M. The cavitation instability induced by the development of a re-entrant jet. J. Fluid Mech. 2001, 444, 223–256. [Google Scholar] [CrossRef]
  17. Wang, Z.; Huang, B.; Wang, G.; Zhang, M.; Wang, F. Experimental and numerical investigation of ventilated cavitating flow with special emphasis on gas leakage behavior and re-entrant jet dynamics. Ocean. Eng. 2015, 108, 191–201. [Google Scholar] [CrossRef]
  18. Shao, S.; Wu, Y.; Haynes, J.; Arndt, R.E.; Hong, J. Investigation into the behaviors of ventilated supercavities in unsteady flow. Phys. Fluids 2018, 30, 052102. [Google Scholar] [CrossRef] [Green Version]
  19. Wienken, W.; Stiller, J.; Keller, A. A method to predict cavitation inception using large-eddy simulation and its application to the flow past a square cylinder. J. Fluids Eng. 2006, 128, 316–3252006. [Google Scholar] [CrossRef]
  20. Sato, K.; Taguchi, Y.; Hayashi, S. High speed observation of periodic cavity behavior in a convergent-divergent nozzle for cavitating water jet. J. Flow Control Meas. Vis. 2013, 1, 102–107. [Google Scholar] [CrossRef] [Green Version]
  21. Wang, G.; Kong, D.; Wu, Q.; Liu, T.; Zheng, Y.; Huang, B. Physical and numerical study on unsteady shedding behaviors of ventilated partial cavitating flow around an axisymmetric body. Ocean. Eng. 2020, 197, 106884. [Google Scholar] [CrossRef]
  22. Kubota, A.; Kato, H.; Yamaguchi, H.; Maeda, M. Unsteady structure measurement of cloud cavitation on a foil section using conditional sampling technique. J. Fluids Eng. 1989, 111, 204–210. [Google Scholar] [CrossRef]
  23. Huang, B.; Young, Y.L.; Wang, G.; Shyy, W. Combined experimental and computational investigation of unsteady structure of sheet/cloud cavitation. J. Fluids Eng. 2013, 135, 071301. [Google Scholar] [CrossRef]
  24. Hu, C.L.; Wang, G.Y.; Huang, B.; Zhao, Y. The inception cavitating flows over an axisymmetric body with a blunt headform. J. Hydrodyn. B 2015, 27, 359–366. [Google Scholar] [CrossRef]
  25. Sun, T.; Zhang, X.; Xu, C.; Zhang, G.; Wang, C.; Zong, Z. Experimental investigation on the cavity evolution and dynamics with special emphasis on the development stage of ventilated partial cavitating flow. Ocean. Eng. 2019, 187, 106140. [Google Scholar] [CrossRef]
  26. Arndt, R.E.A. Cavitation in fluid machinery and hydraulic structures. Annu. Rev. Fluid Mech. 1981, 13, 273–328. [Google Scholar] [CrossRef]
  27. Arndt, R.E.A. Cavitation in vortical flows. Annu. Rev. Fluid Mech. 2002, 34, 143–175. [Google Scholar] [CrossRef]
  28. Le, Q.; Franc, J.P.; Michel, J.M. Partial cavities: Global behavior and mean pressure distribution. J. Fluids Eng. 1993, 115, 243–248. [Google Scholar] [CrossRef]
  29. Reisman, G.E.; Wang, Y.C.; Brennen, C.E. Observations of shock waves in cloud cavitation. J. Fluid Mech. 1998, 355, 255–283. [Google Scholar] [CrossRef] [Green Version]
  30. Pham, T.M.; Larrarte, F.; Fruman, D.H. Investigation of unsteady sheet cavitation and cloud cavitation mechanisms. J. Fluids Eng. 1999, 121, 289–296. [Google Scholar] [CrossRef]
  31. Wang, G.; Senocak, I.; Shyy, W.; Ikohagi, T.; Cao, S. Dynamics of attached turbulent cavitating flows. Prog. Aerosp. Sci. 2001, 37, 551–581. [Google Scholar] [CrossRef]
  32. Zhang, X.; Wang, C.; Wei, Y.; Sun, T. Experimental investigation of unsteady characteristics of ventilated cavitation flow around an under-water vehicle. Adv. Mech. Eng. 2016, 8. [Google Scholar] [CrossRef] [Green Version]
  33. Kawanami, Y.; Kato, H.; Yamaguchi, H.; Tanimura, M.; Tagaya, Y. Mechanism and control of cloud cavitation. J. Fluids Eng. 1997, 119, 788–794. [Google Scholar] [CrossRef]
  34. Astolfi, J.A.; Dorange, P.; Billard, J.Y.; Tomas, I.C. An experimental investigation of cavitation inception and development on a two-dimensional Eppler hydrofoil. J. Fluids Eng. 2000, 122, 164–173. [Google Scholar] [CrossRef]
  35. Zhang, X.; Wang, C.; Wekesa, D.W. Numerical and experimental study of pressure-wave formation around an underwater ventilated vehicle. Eur. J. Mech. B Fluids 2017, 65, 440–449. [Google Scholar] [CrossRef]
  36. Wang, C.; Huang, B.; Wang, G.; Zhang, M.; Ding, N. Unsteady pressure fluctuation characteristics in the process of breakup and shedding of sheet/cloud cavitation. Int. J. Heat Mass Transf. 2017, 114, 769–785. [Google Scholar] [CrossRef]
Figure 1. Schematic diagram of the experimental setup. (a) Schematic diagram of the water tunnel. (b) Schematic diagram of working section and synchronous measurement system.
Jmse 09 00487 g001
Figure 2. Schematic of the test body.
Jmse 09 00487 g002
Figure 3. The transient evolution of natural cloud cavity at σ = 0.68. ((a) represents the fracture of the shoulder cavity; (A,C,D) represent the trajectory of cloud cavitation shedding and collapse; (B) represents the closed position of the shoulder cavity).
Jmse 09 00487 g003
Figure 4. The sensor P1–P4 pressure signals during the cavity evolution at σ = 0.68. ((a–d) represent the pressure pulsation at different pressure points).
Jmse 09 00487 g004
Figure 5. Comparison of the evolution of natural cavity with different cavitation numbers. (a) σ = 0.81 (b) σ = 0.68 (c) σ = 0.62 (d) σ = 0.52. ((E,H) represent the periodical growth of the cavity, when σ = 0.68; (F,G) represent the periodical shedding of the cavity, when σ = 0.68).
Jmse 09 00487 g005aJmse 09 00487 g005b
Figure 6. The evolution of pressure on four transducers for different cavitation numbers. (a) σ = 0.81 (b) σ = 0.68 (c) σ = 0.62 (d) σ = 0.52.
Jmse 09 00487 g006aJmse 09 00487 g006b
Figure 7. Frequency spectrum distribution for different cavitation numbers. (a) σ = 0.81 (b) σ = 0.68 (c) σ = 0.62 (d) σ = 0.52.
Jmse 09 00487 g007
Figure 8. Wavelet transform of pressure monitor signals under different cavitation numbers.
Jmse 09 00487 g008
Table 1. The dominant frequency and secondary frequency for different cavitation numbers.
Cavitation Number σMain Frequency f1 (Hz)Secondary Frequency f2 (Hz)Primary and Secondary Frequency Ratio f2/f1
0.8132.2351.431.6
0.6830.2764.032.1
0.6228.3256.682.0
0.5222.4643.942.0
Publisher’s Note: MDPI stays neutral with regard to jurisdictional claims in published maps and institutional affiliations.

