
Development of Augmented Reality System for Productivity Enhancement in Offshore Plant Construction


Abstract
1. Introduction
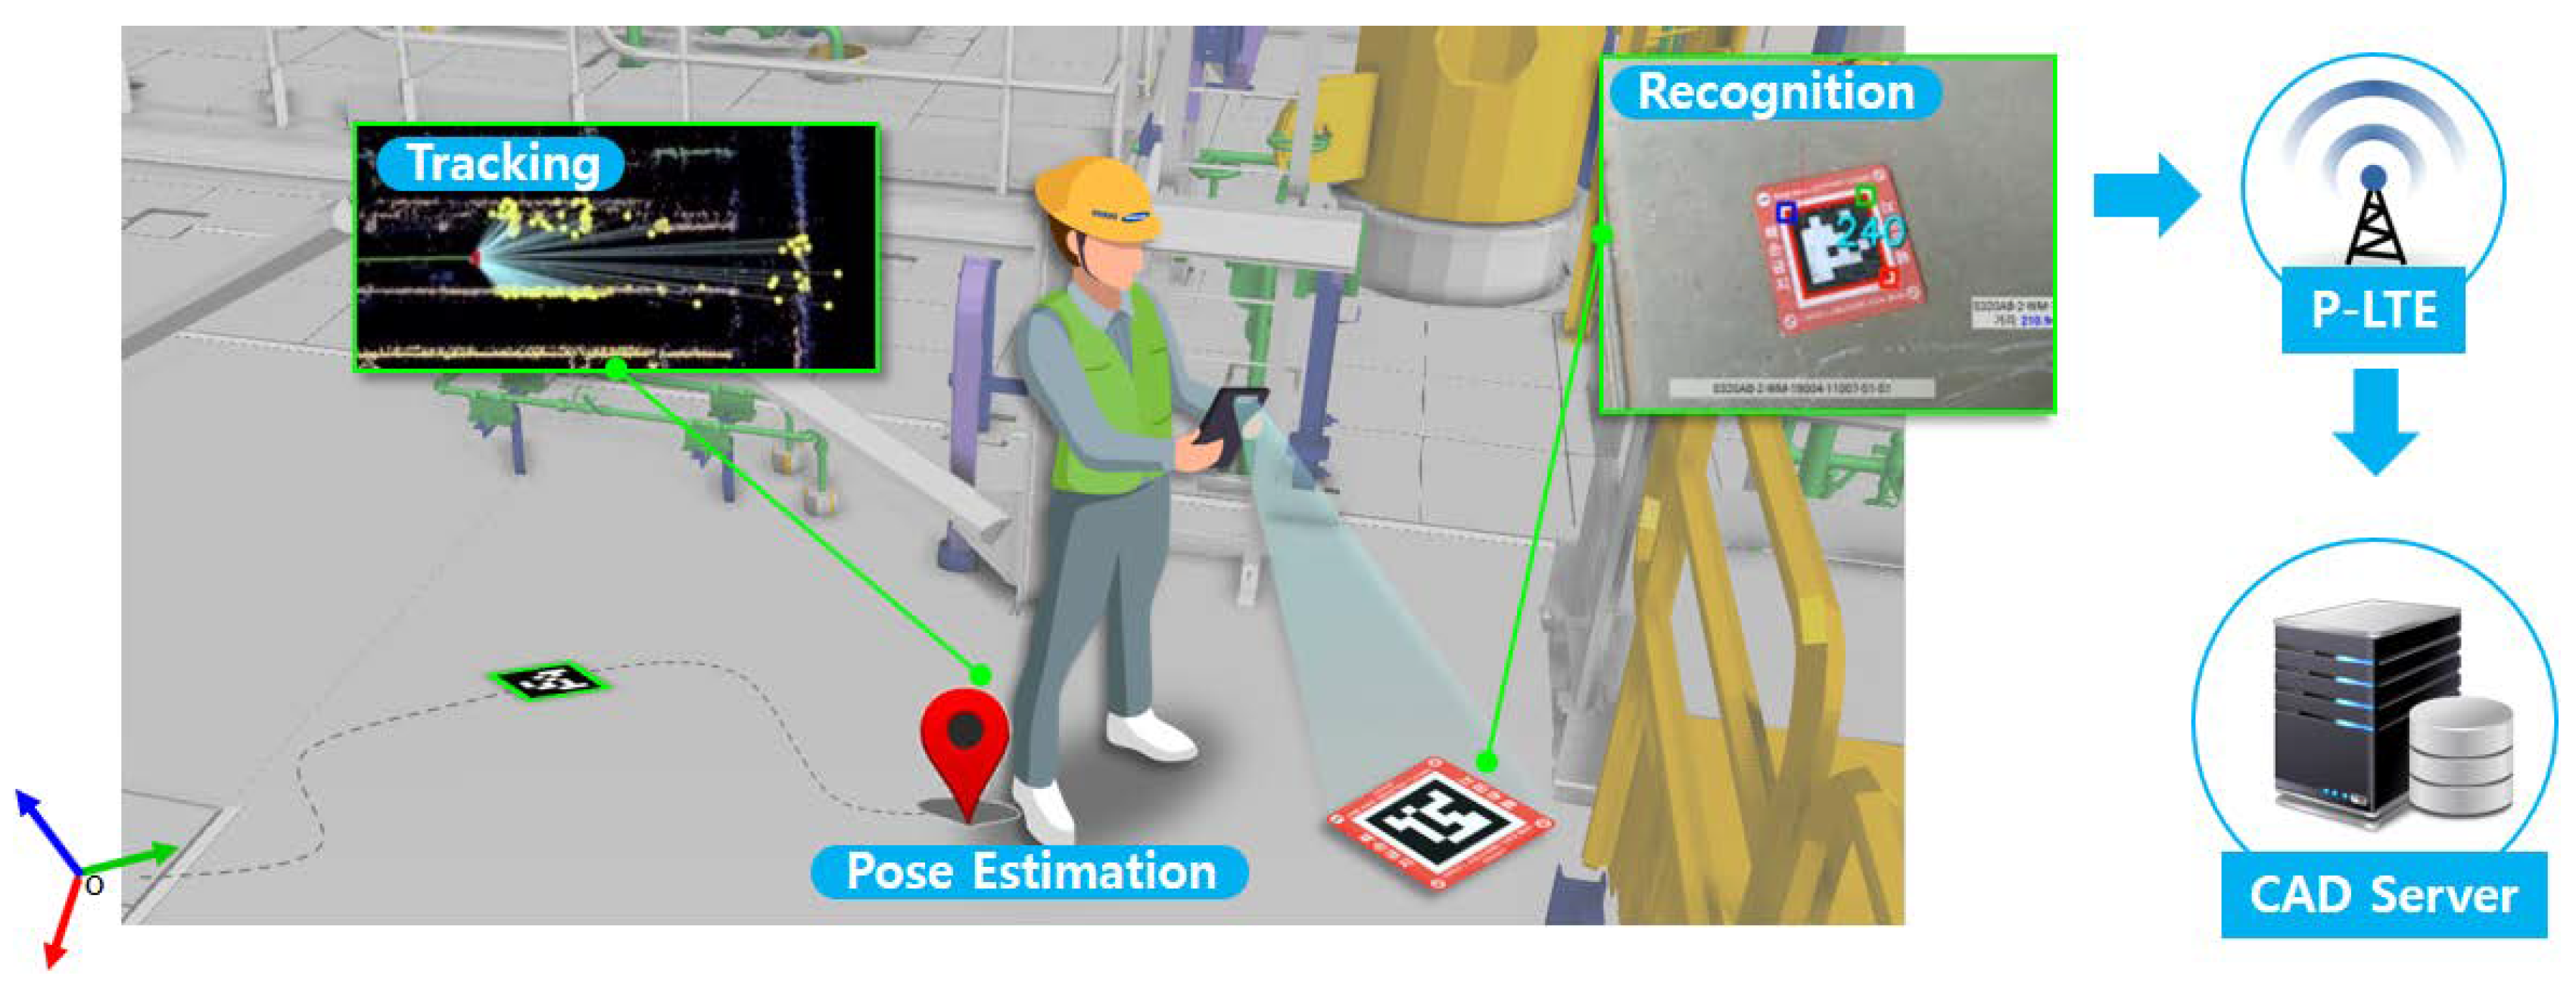
2. Solution
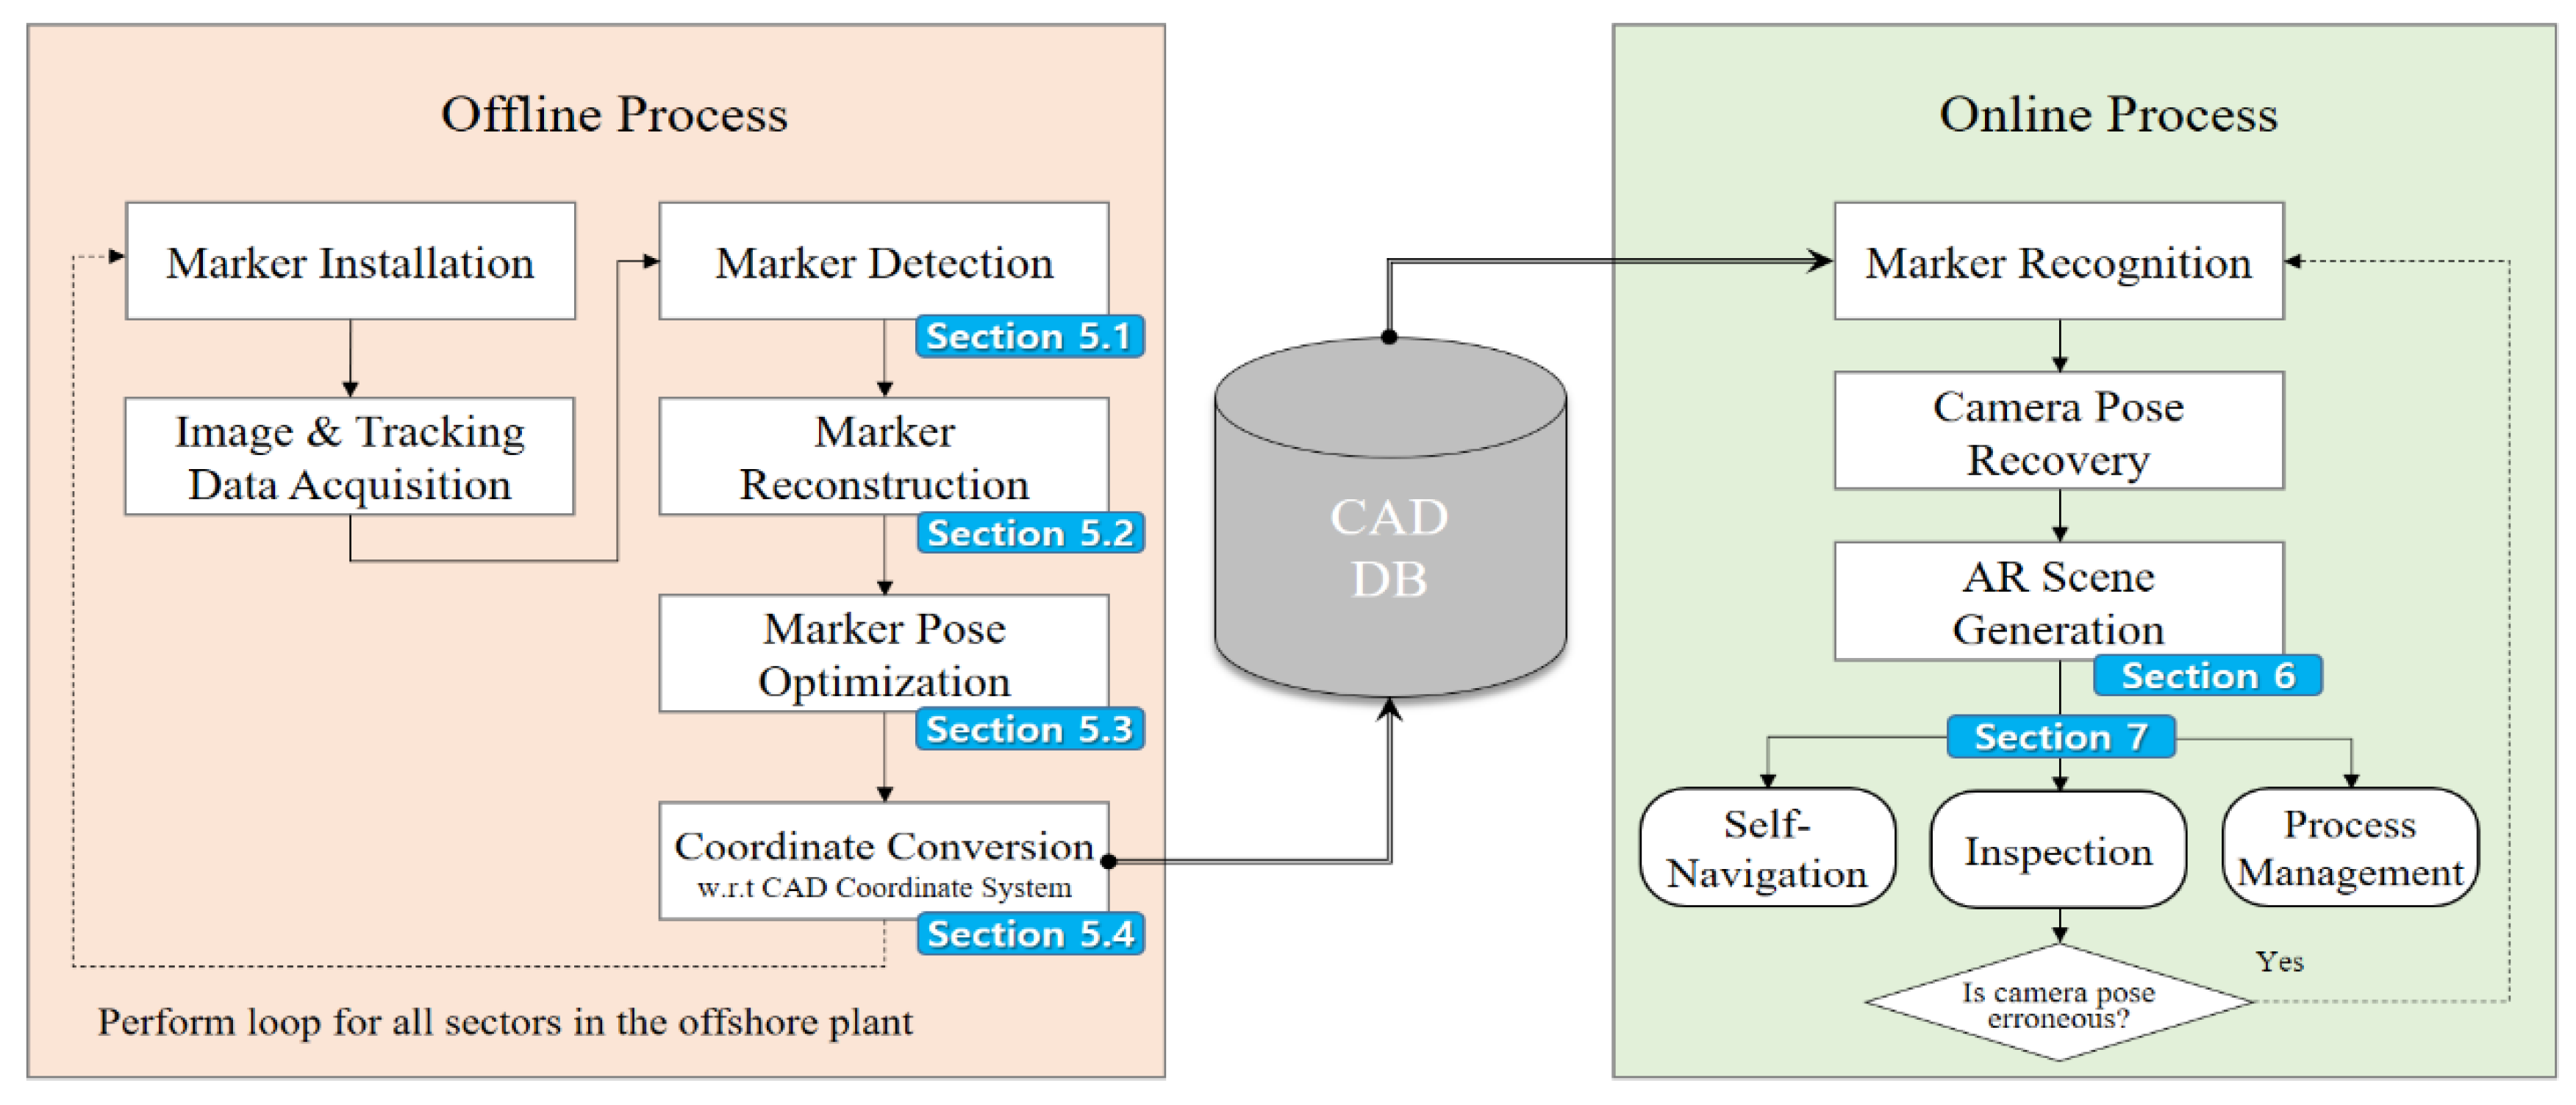
3. System Overview
4. H/W Configuration
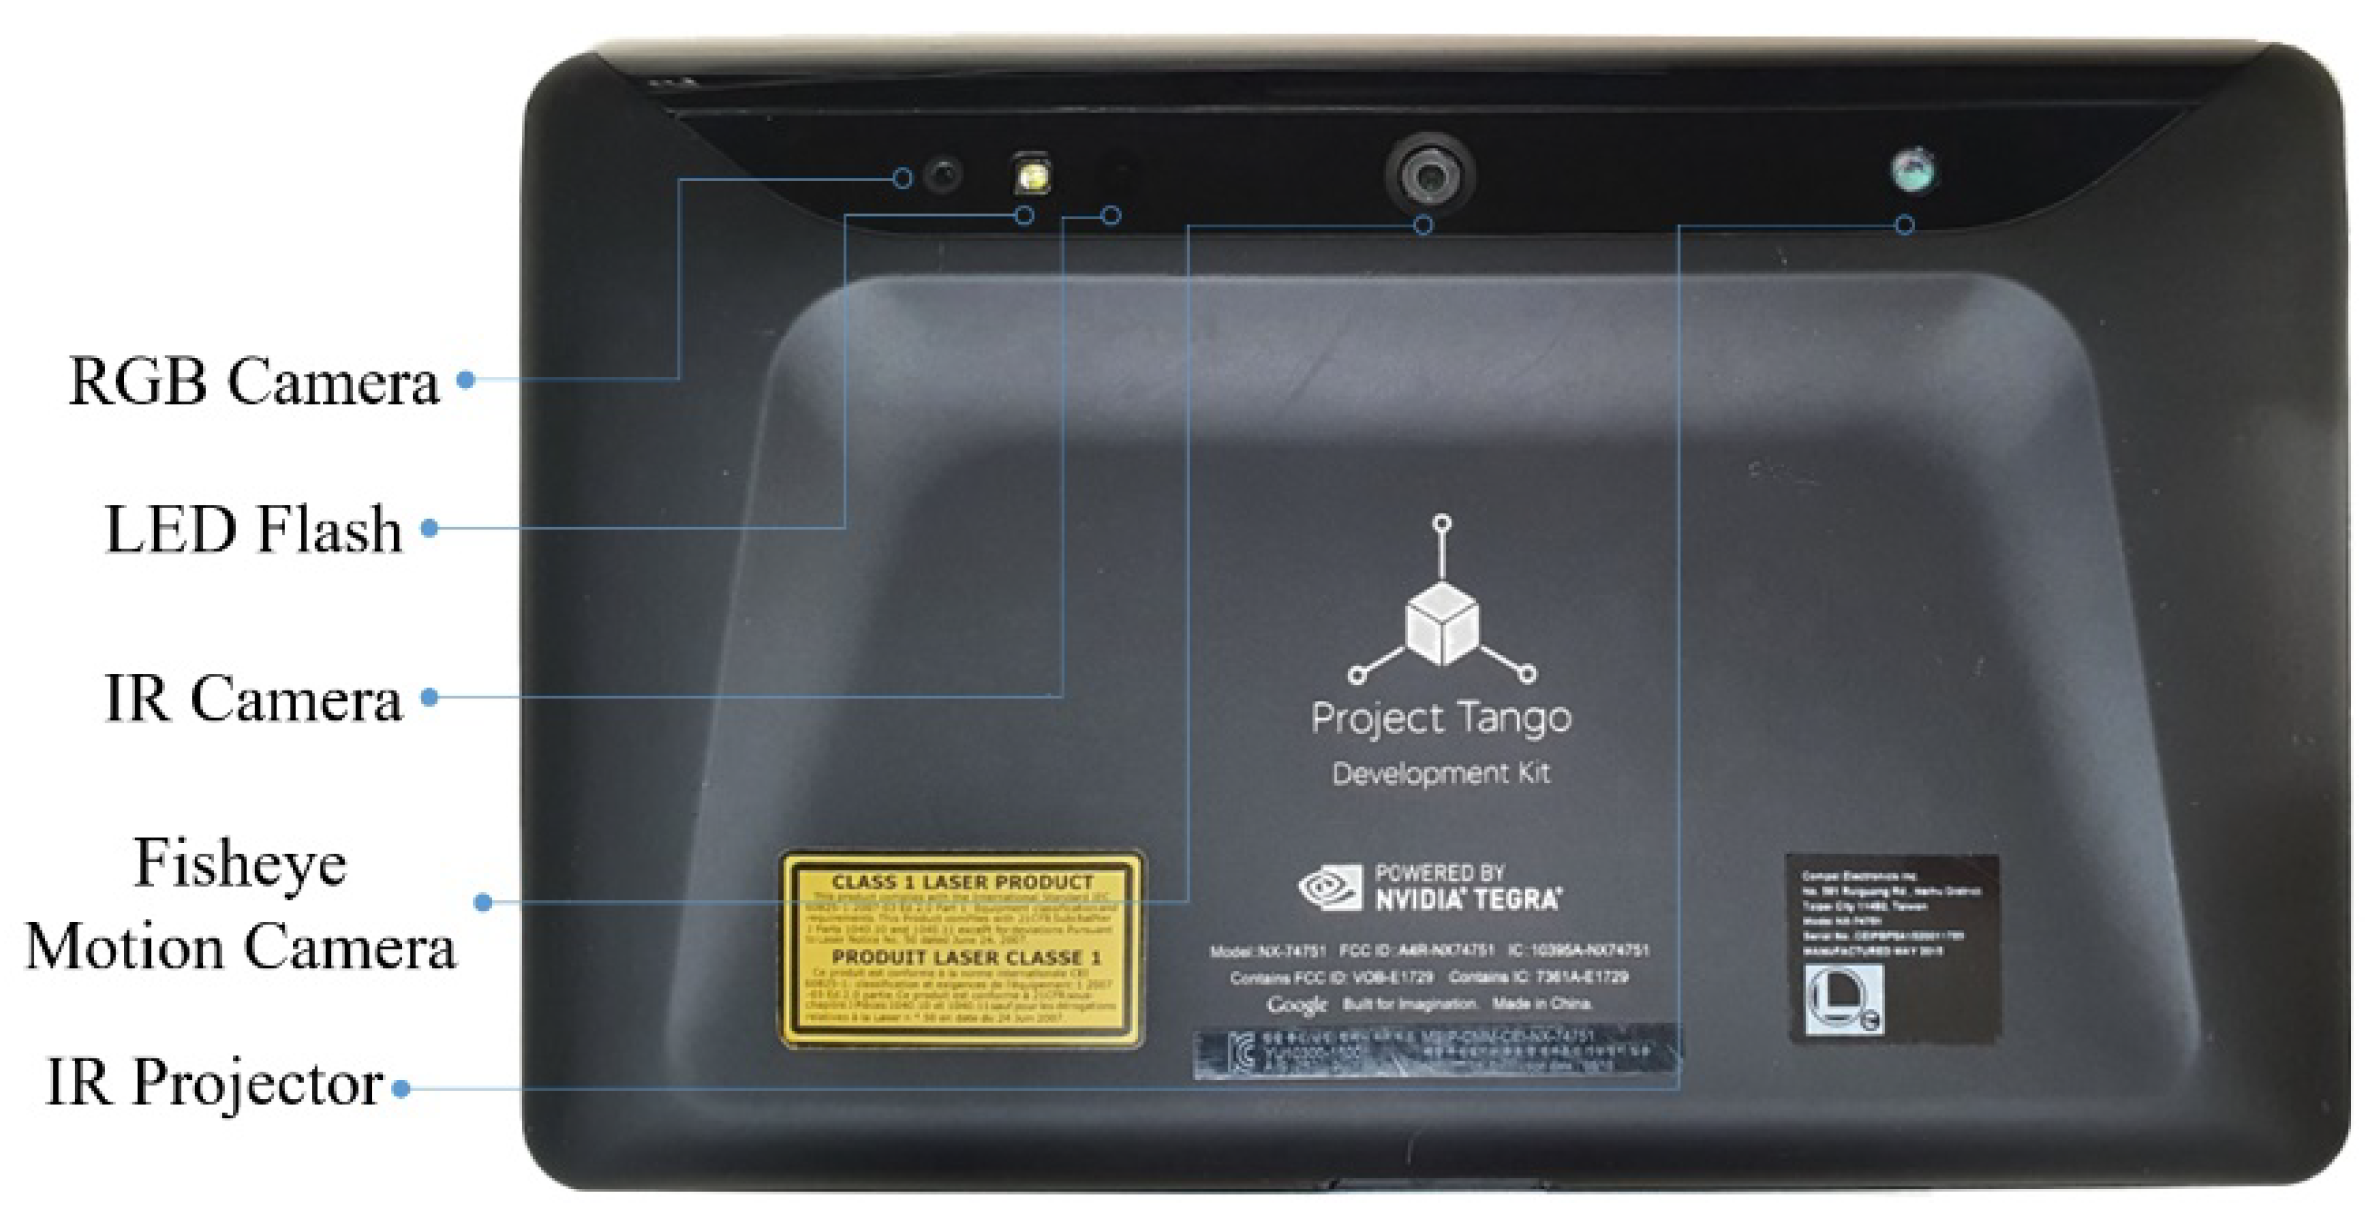
4.1. AR Platform
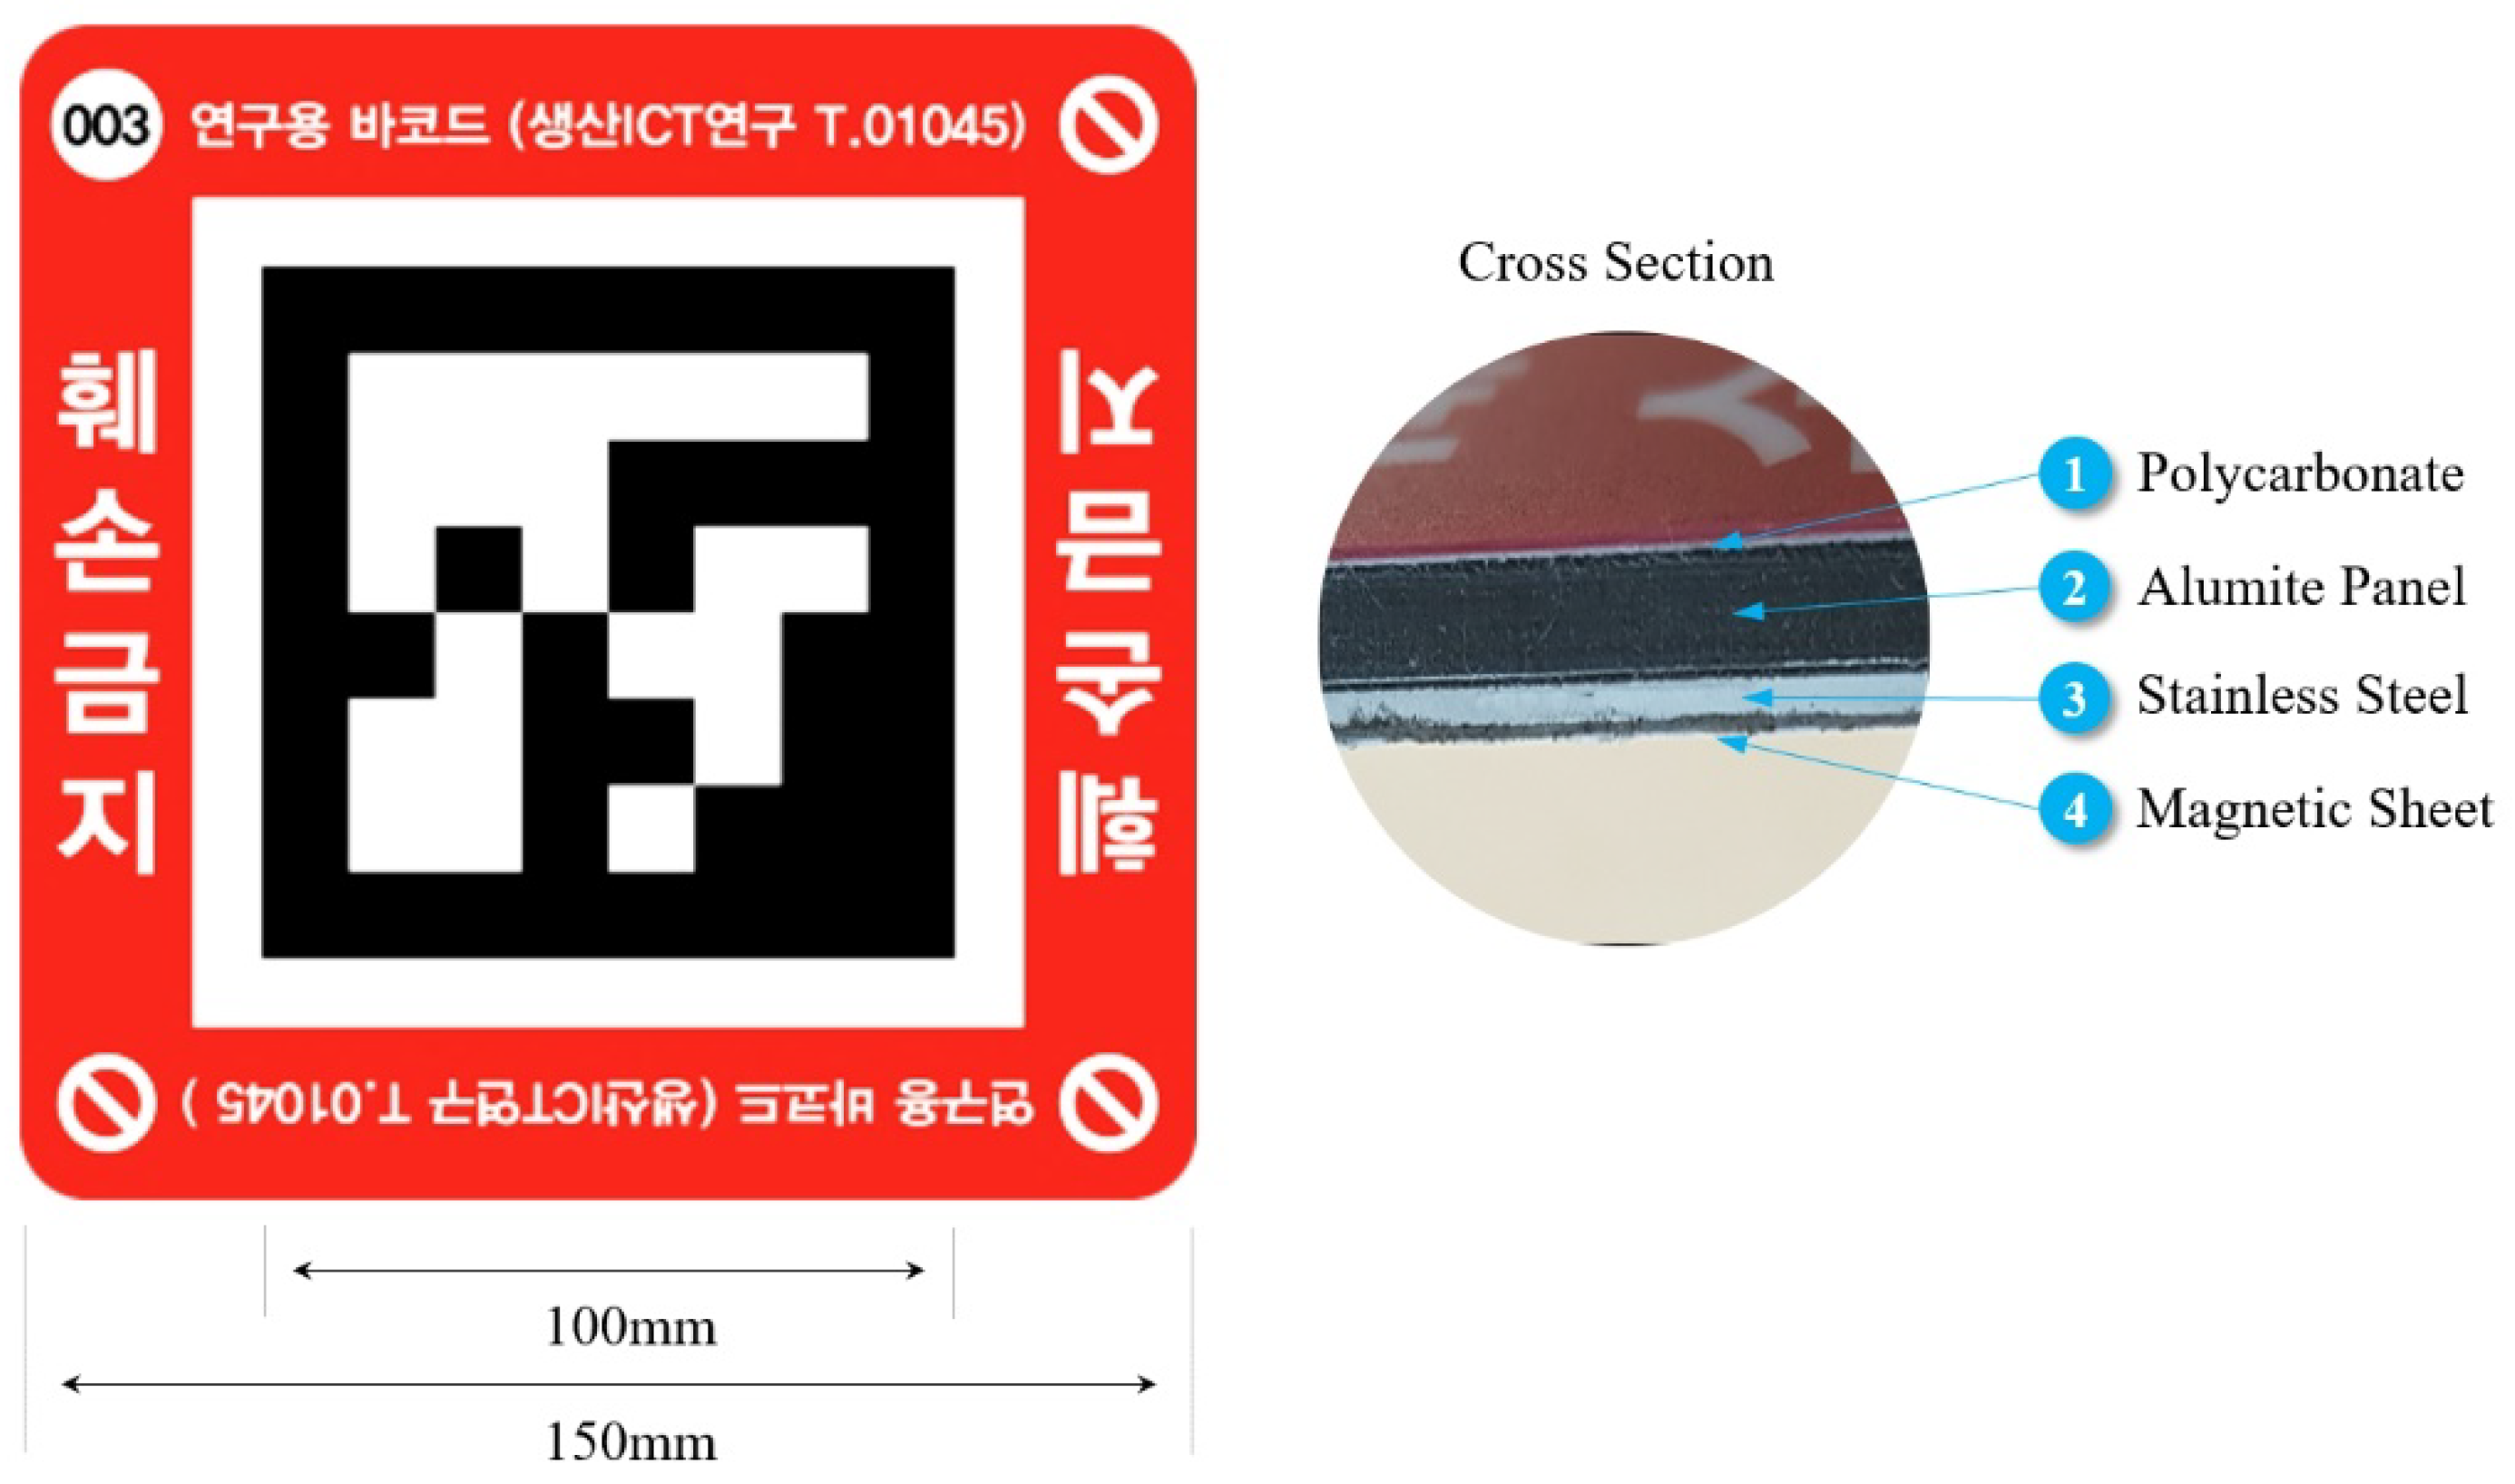
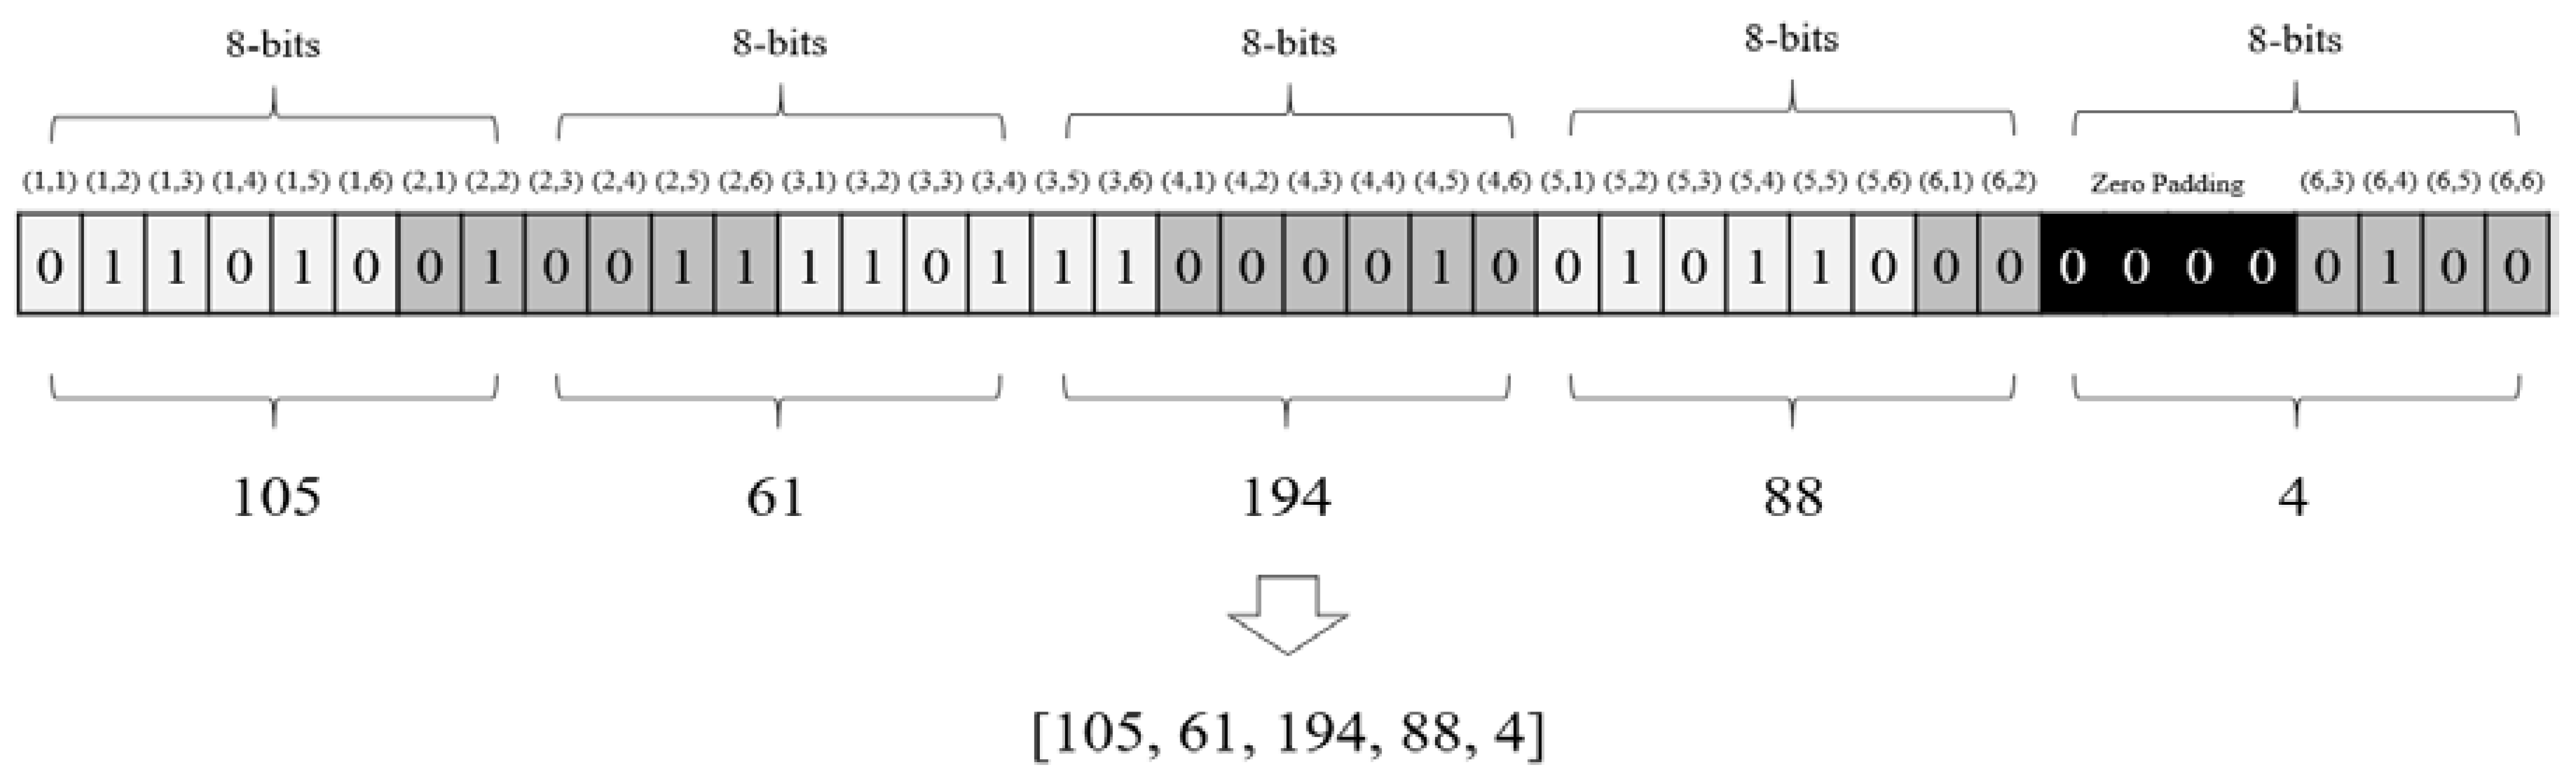
4.2. Marker Design
5. Automatic Marker Registration
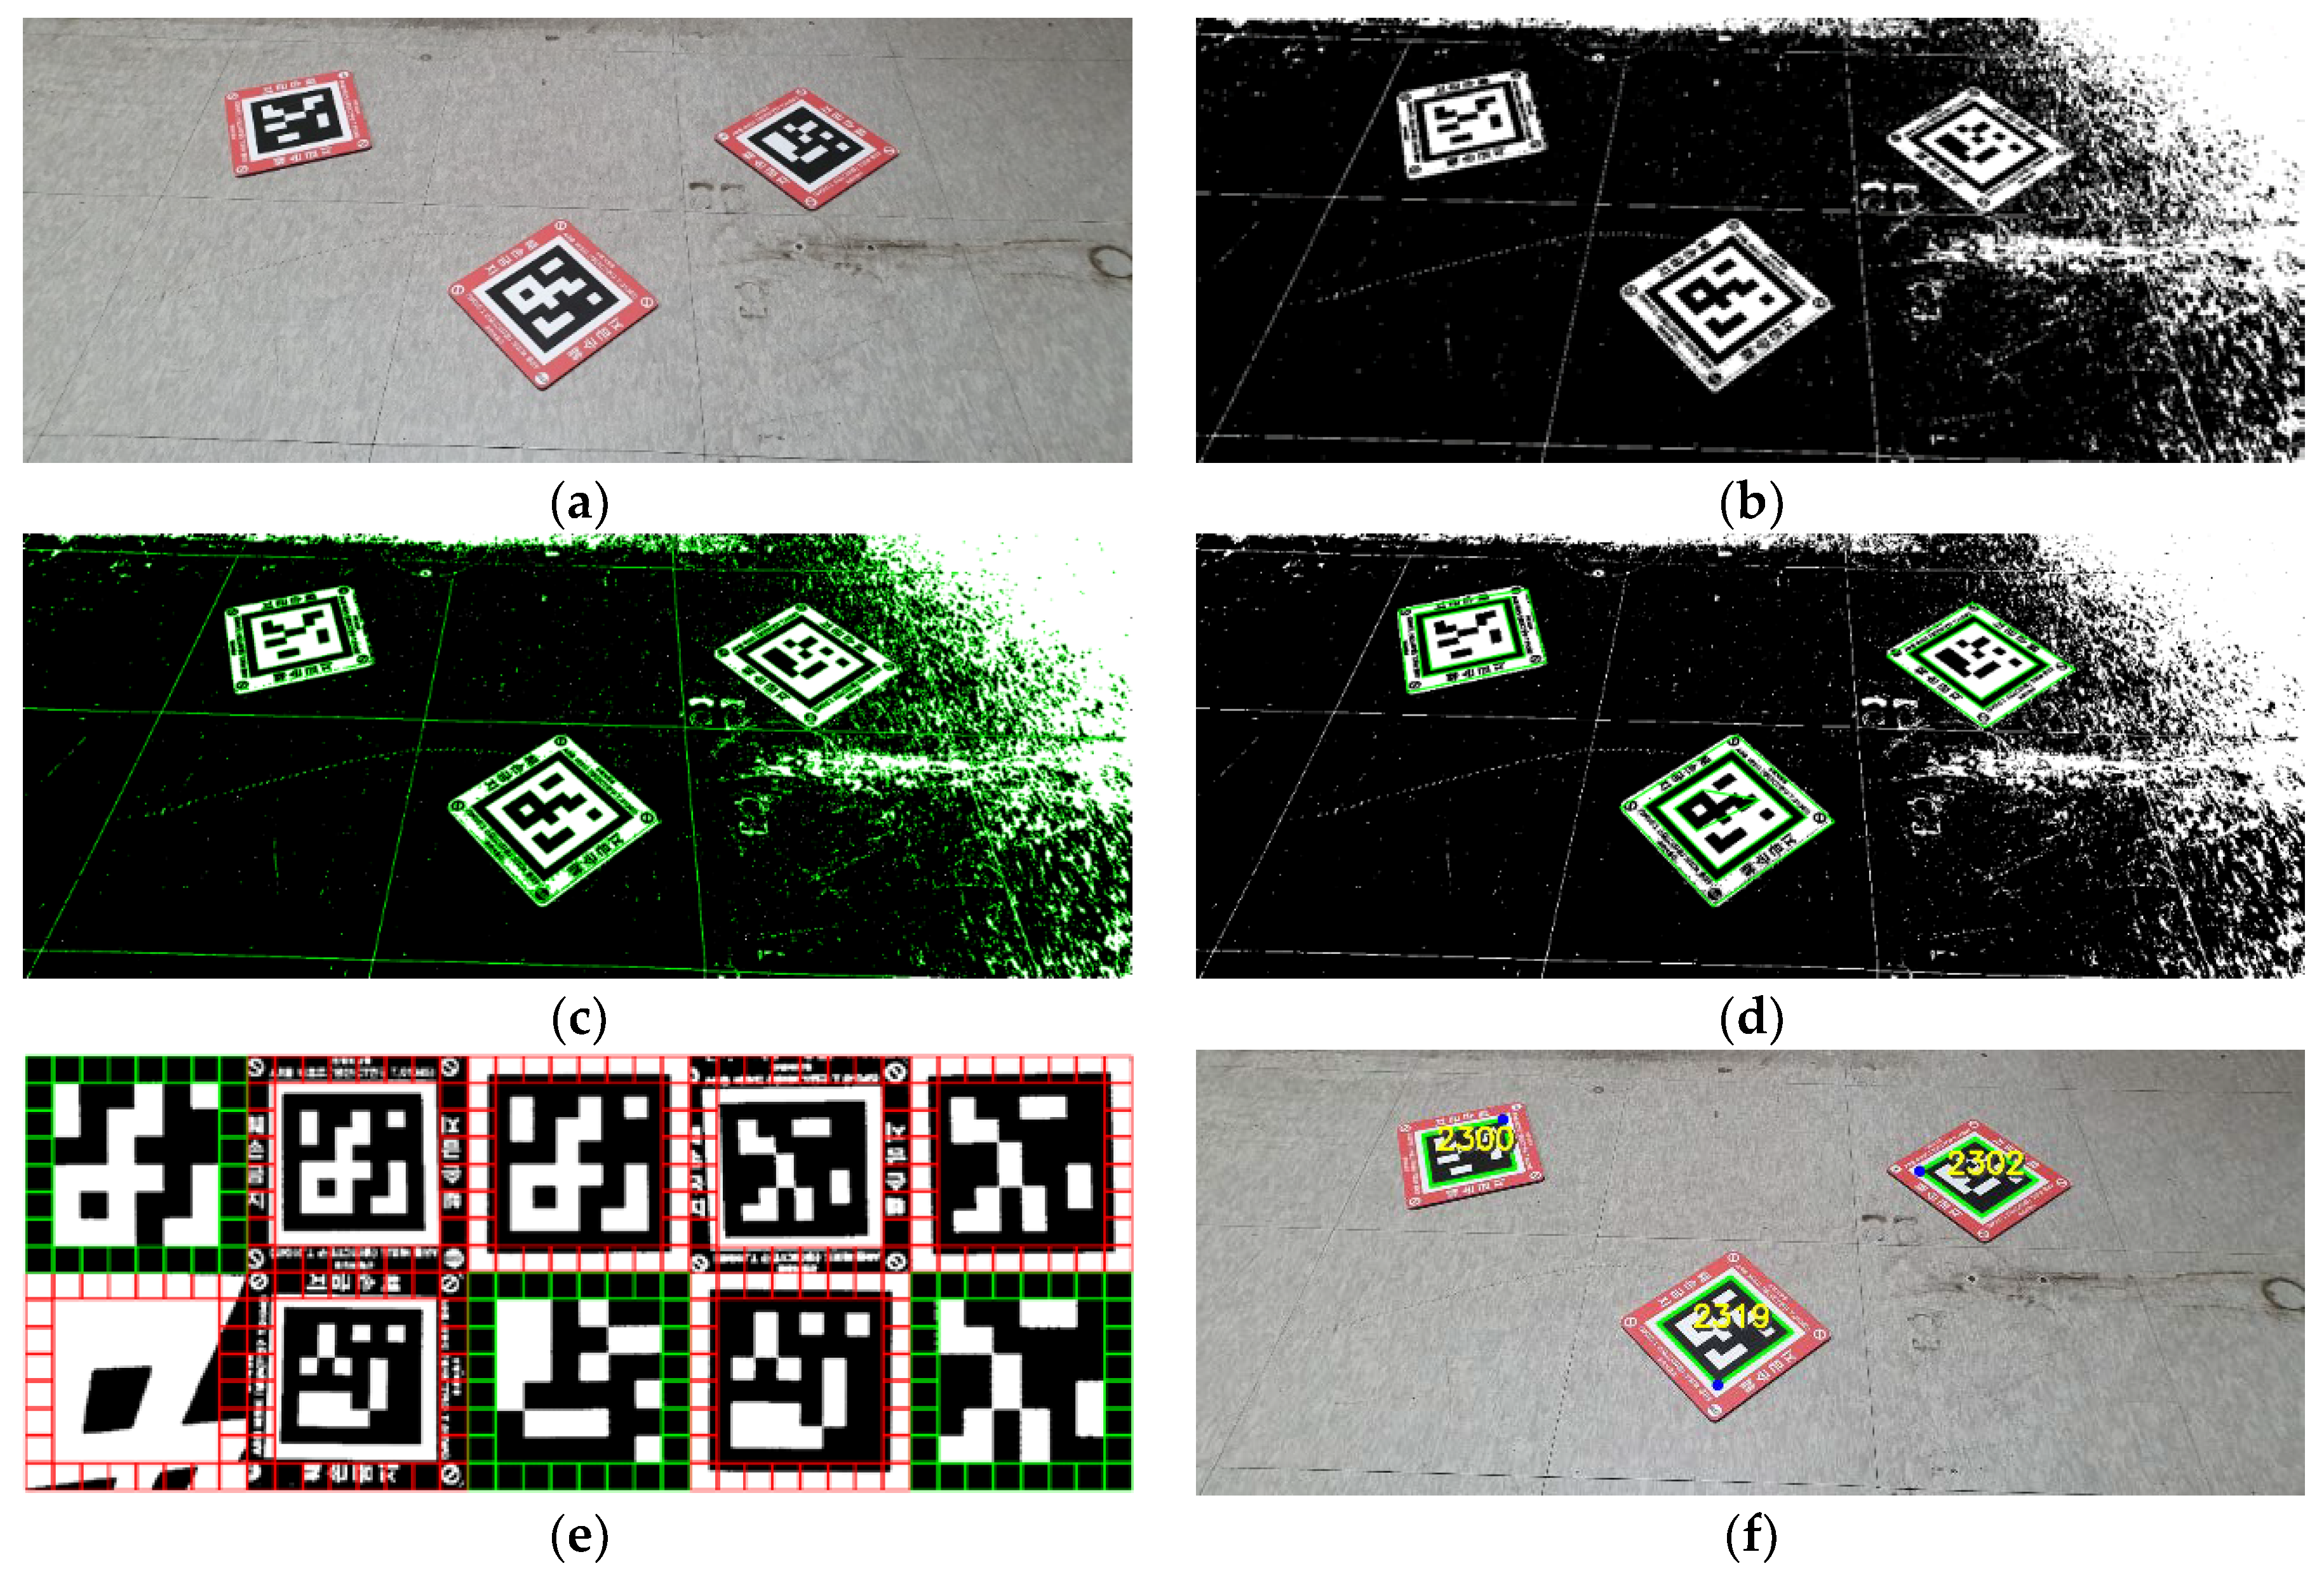
5.1. Marker Detection
- The shape of the approximated contour must have four corner points;
- The shape of the approximated contour must be convex;
- The area of the approximated contour must be at least d pixels (in general, 500 ≤ d ≤ 1000).
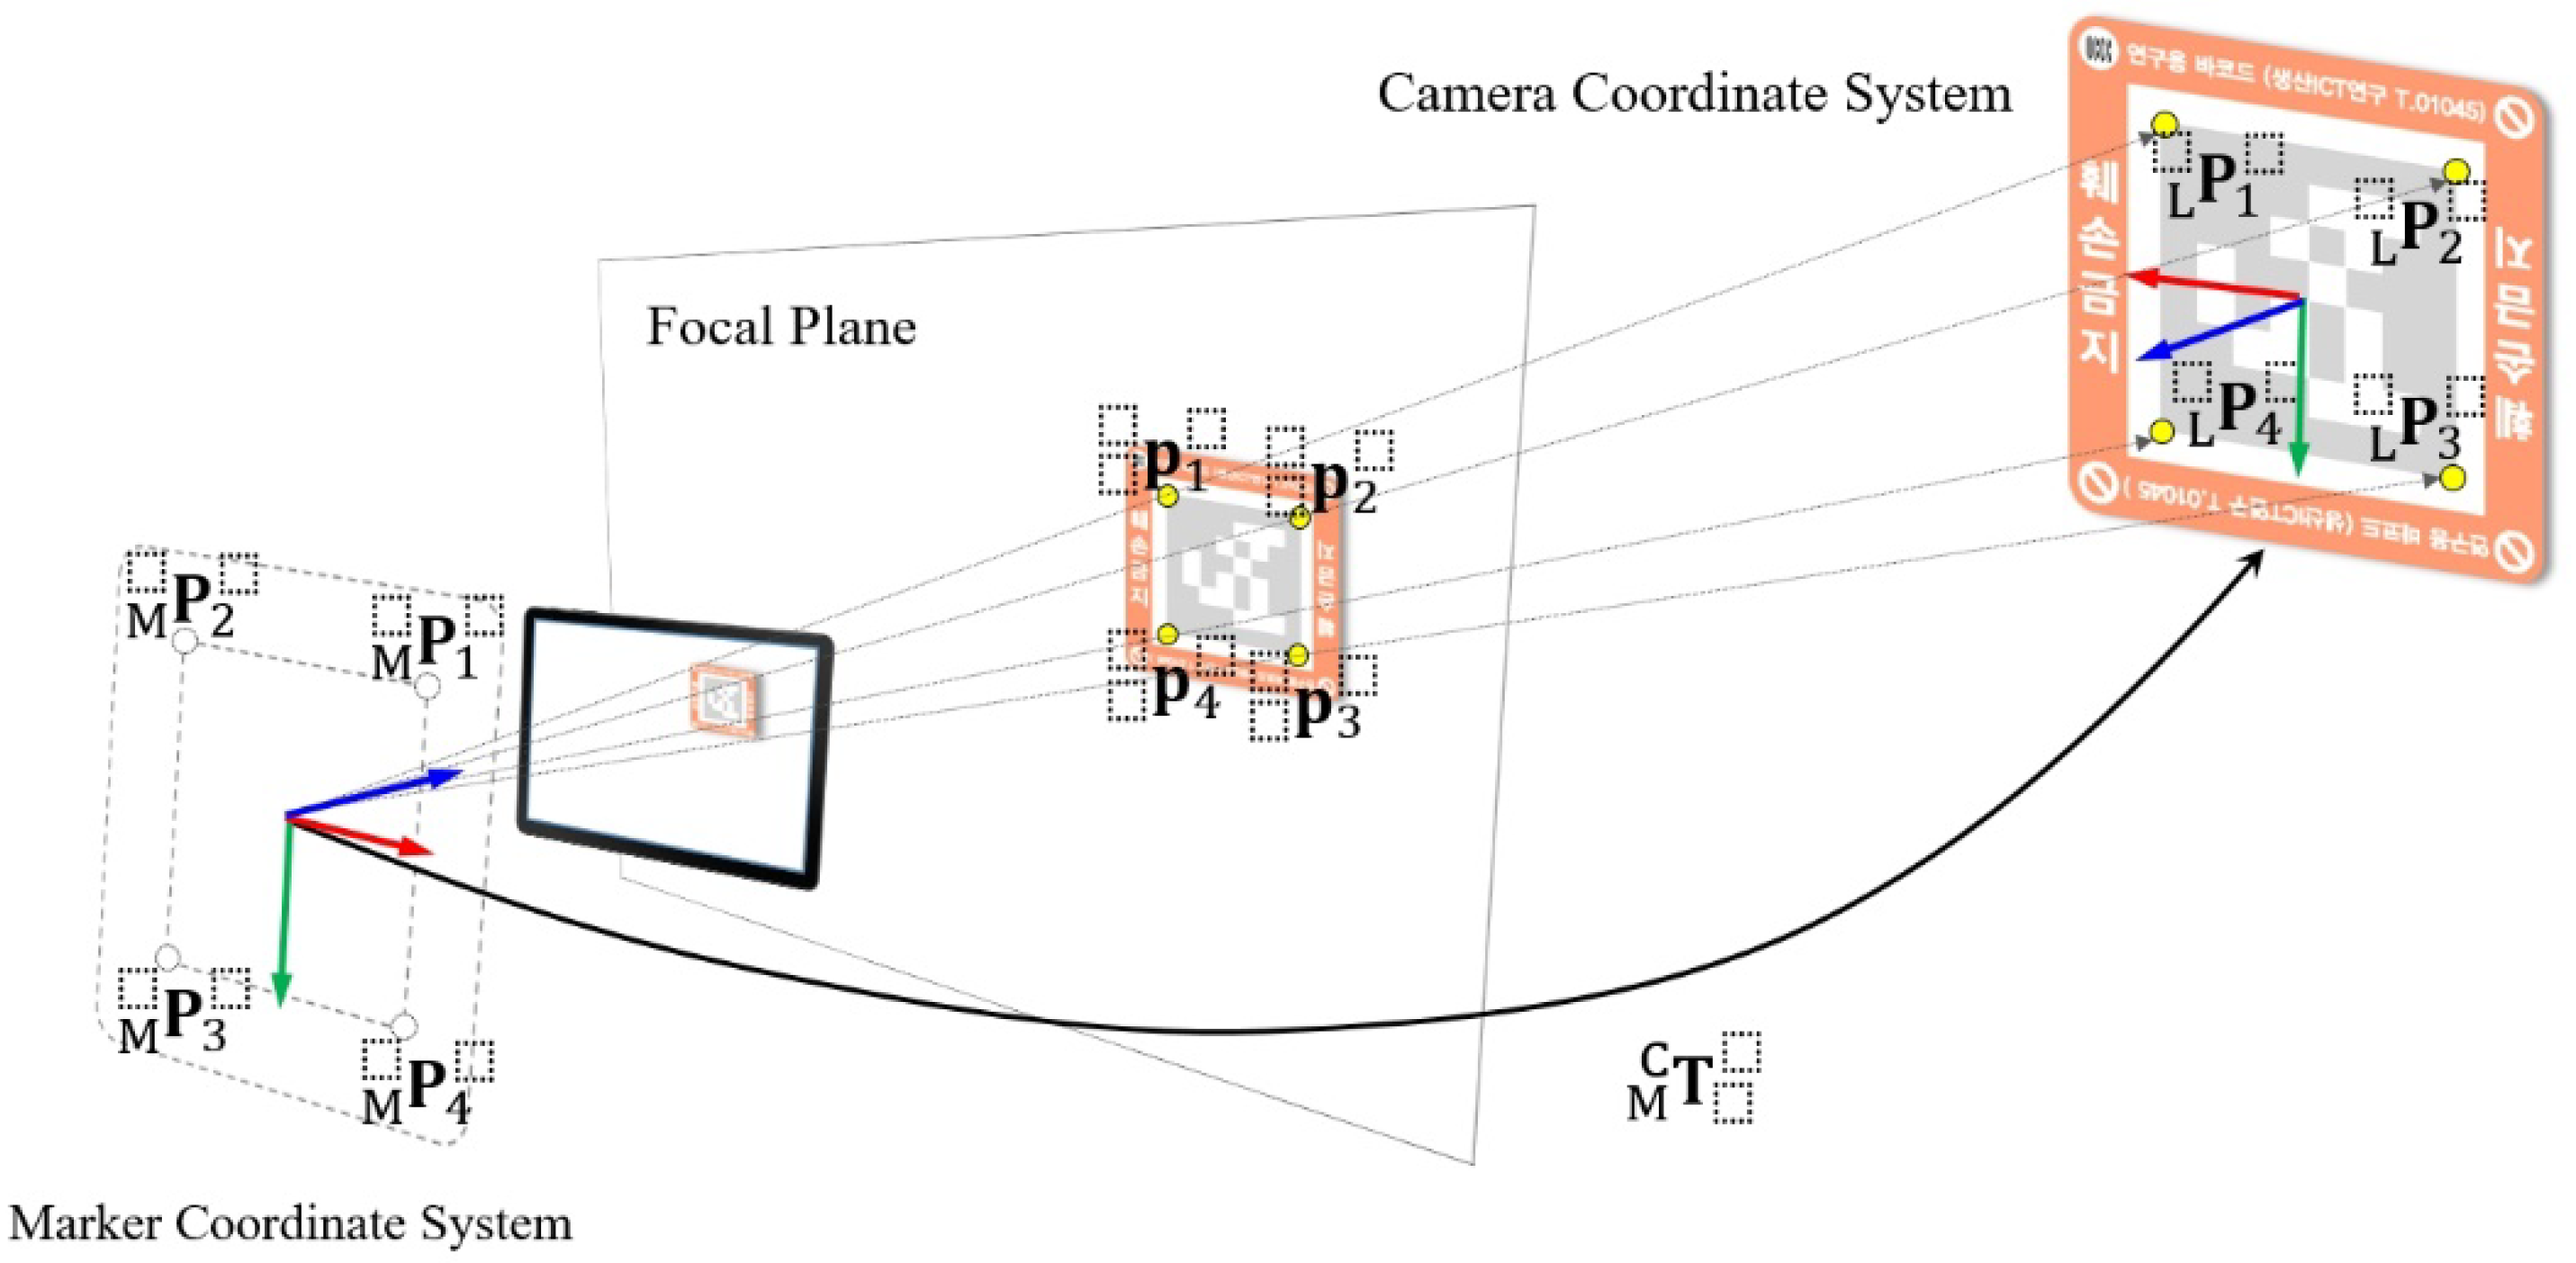
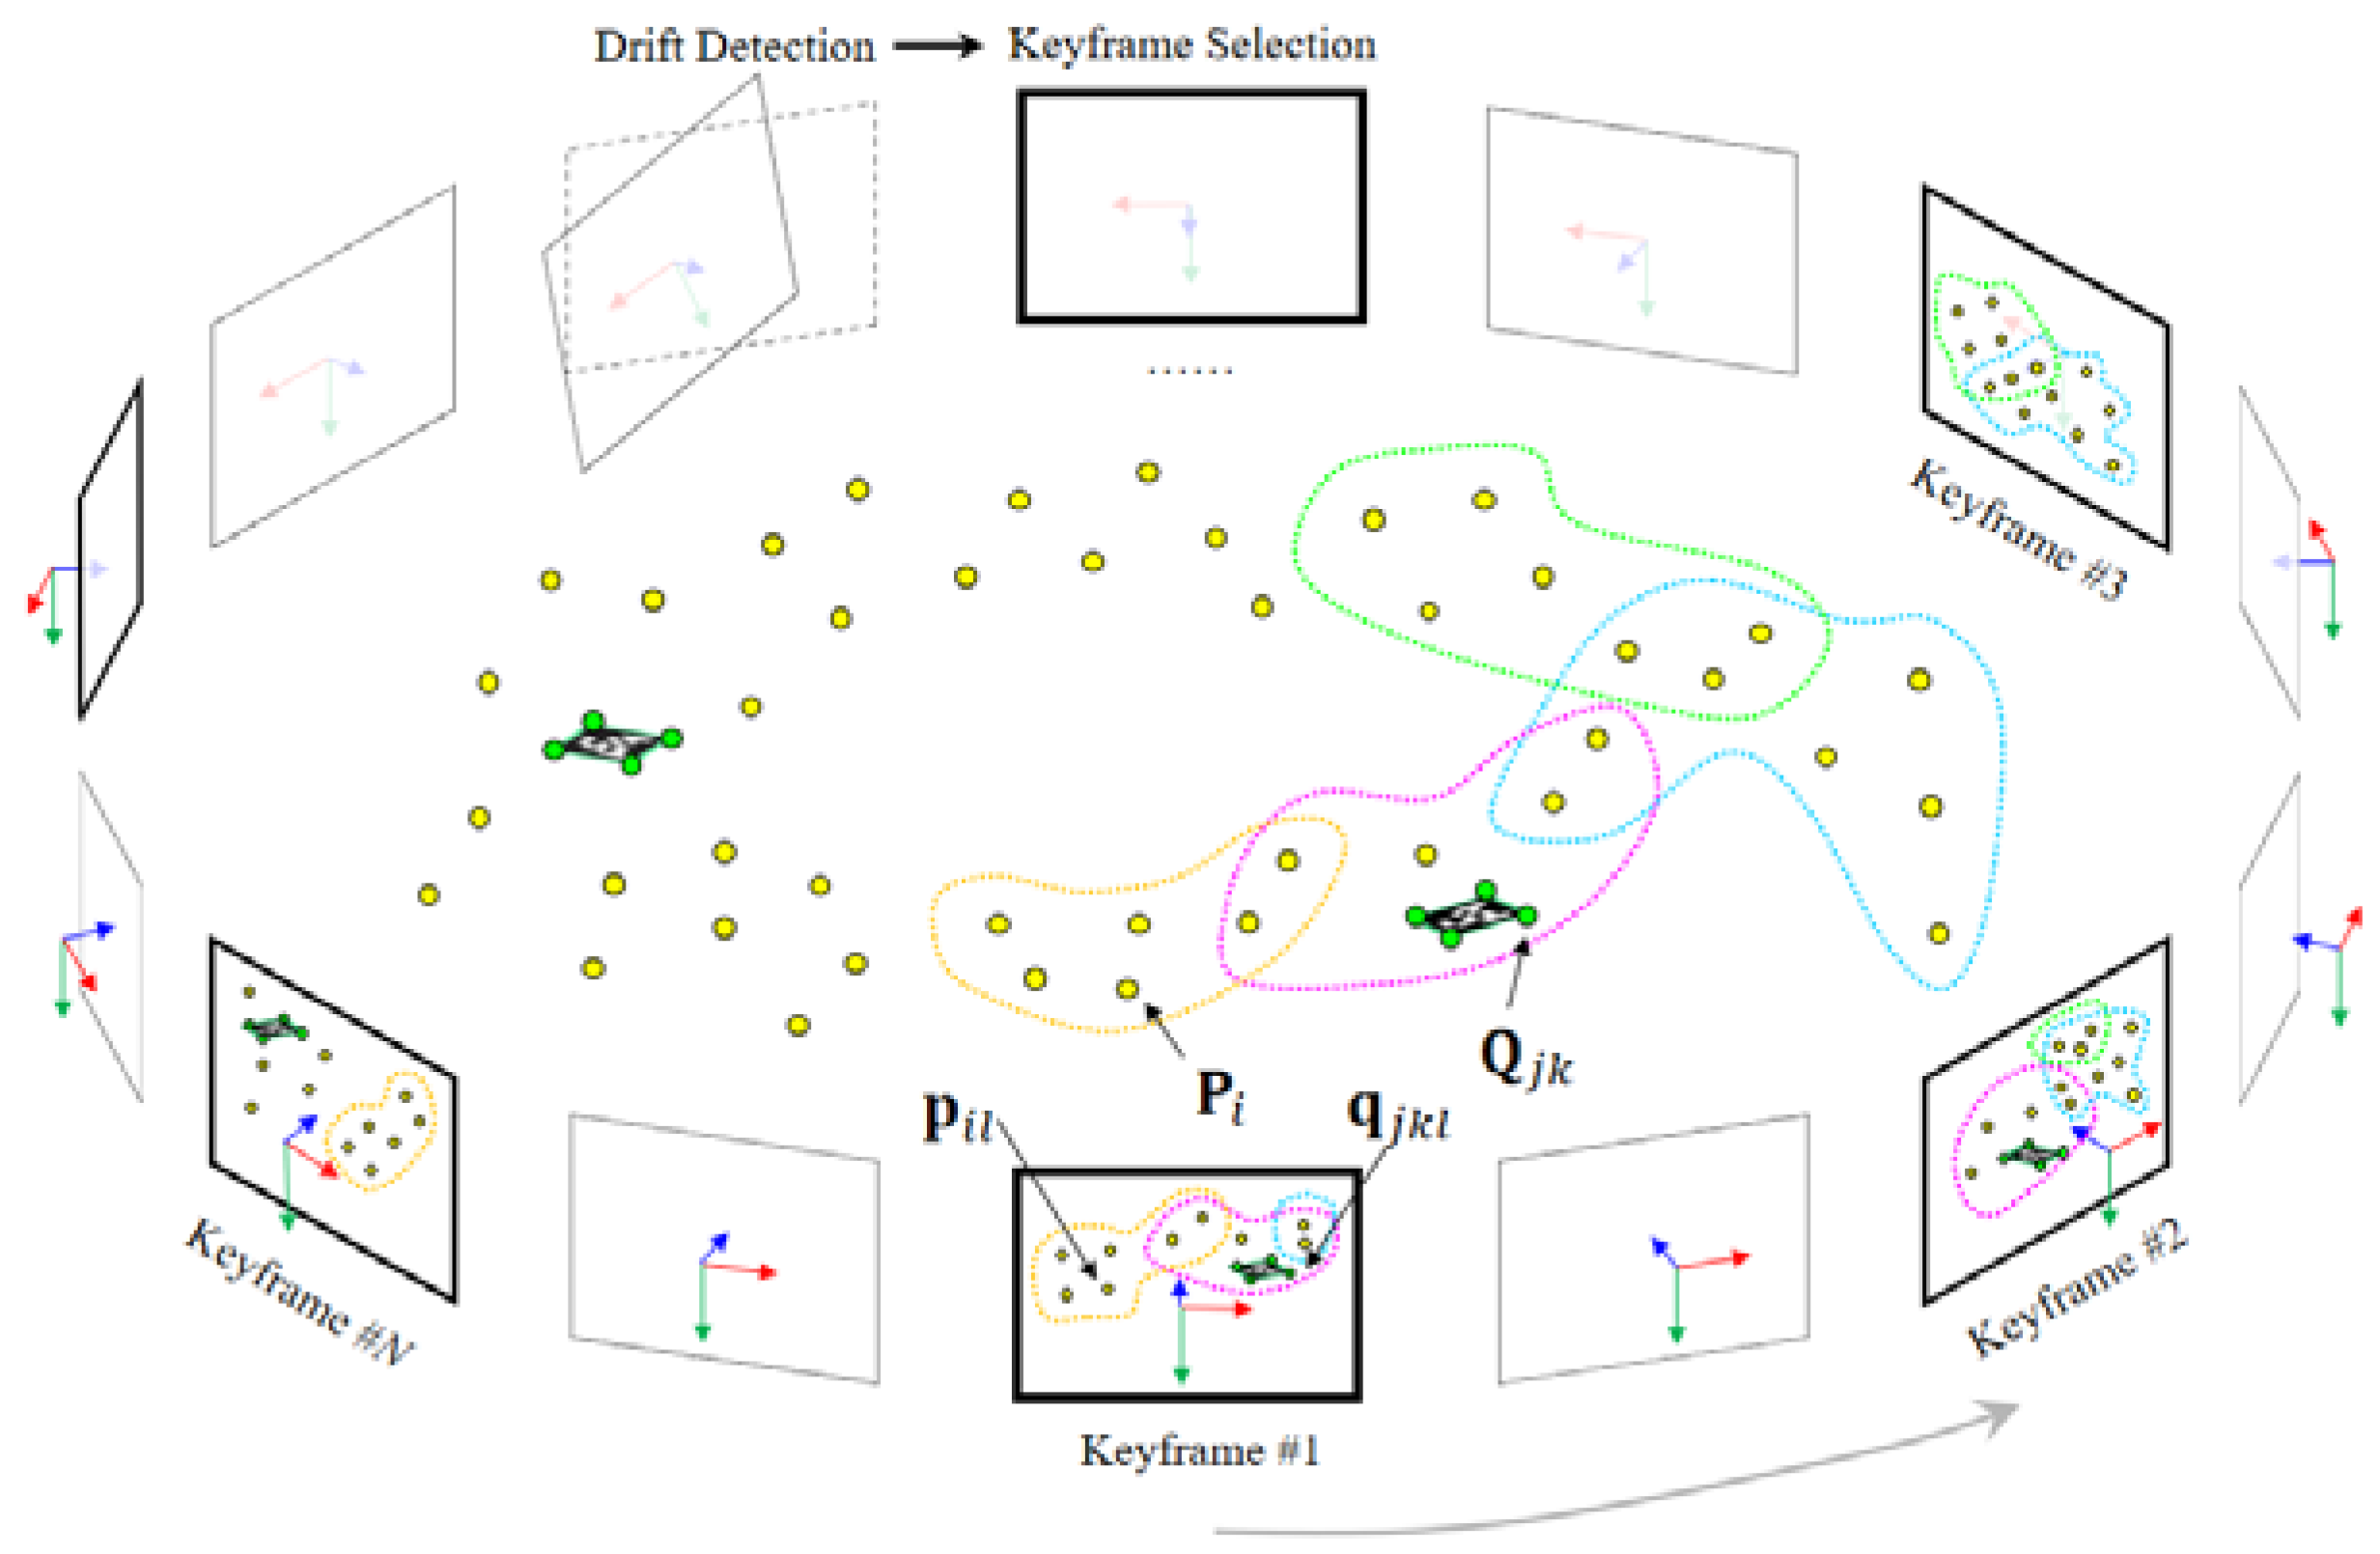
5.2. Marker Reconstruction
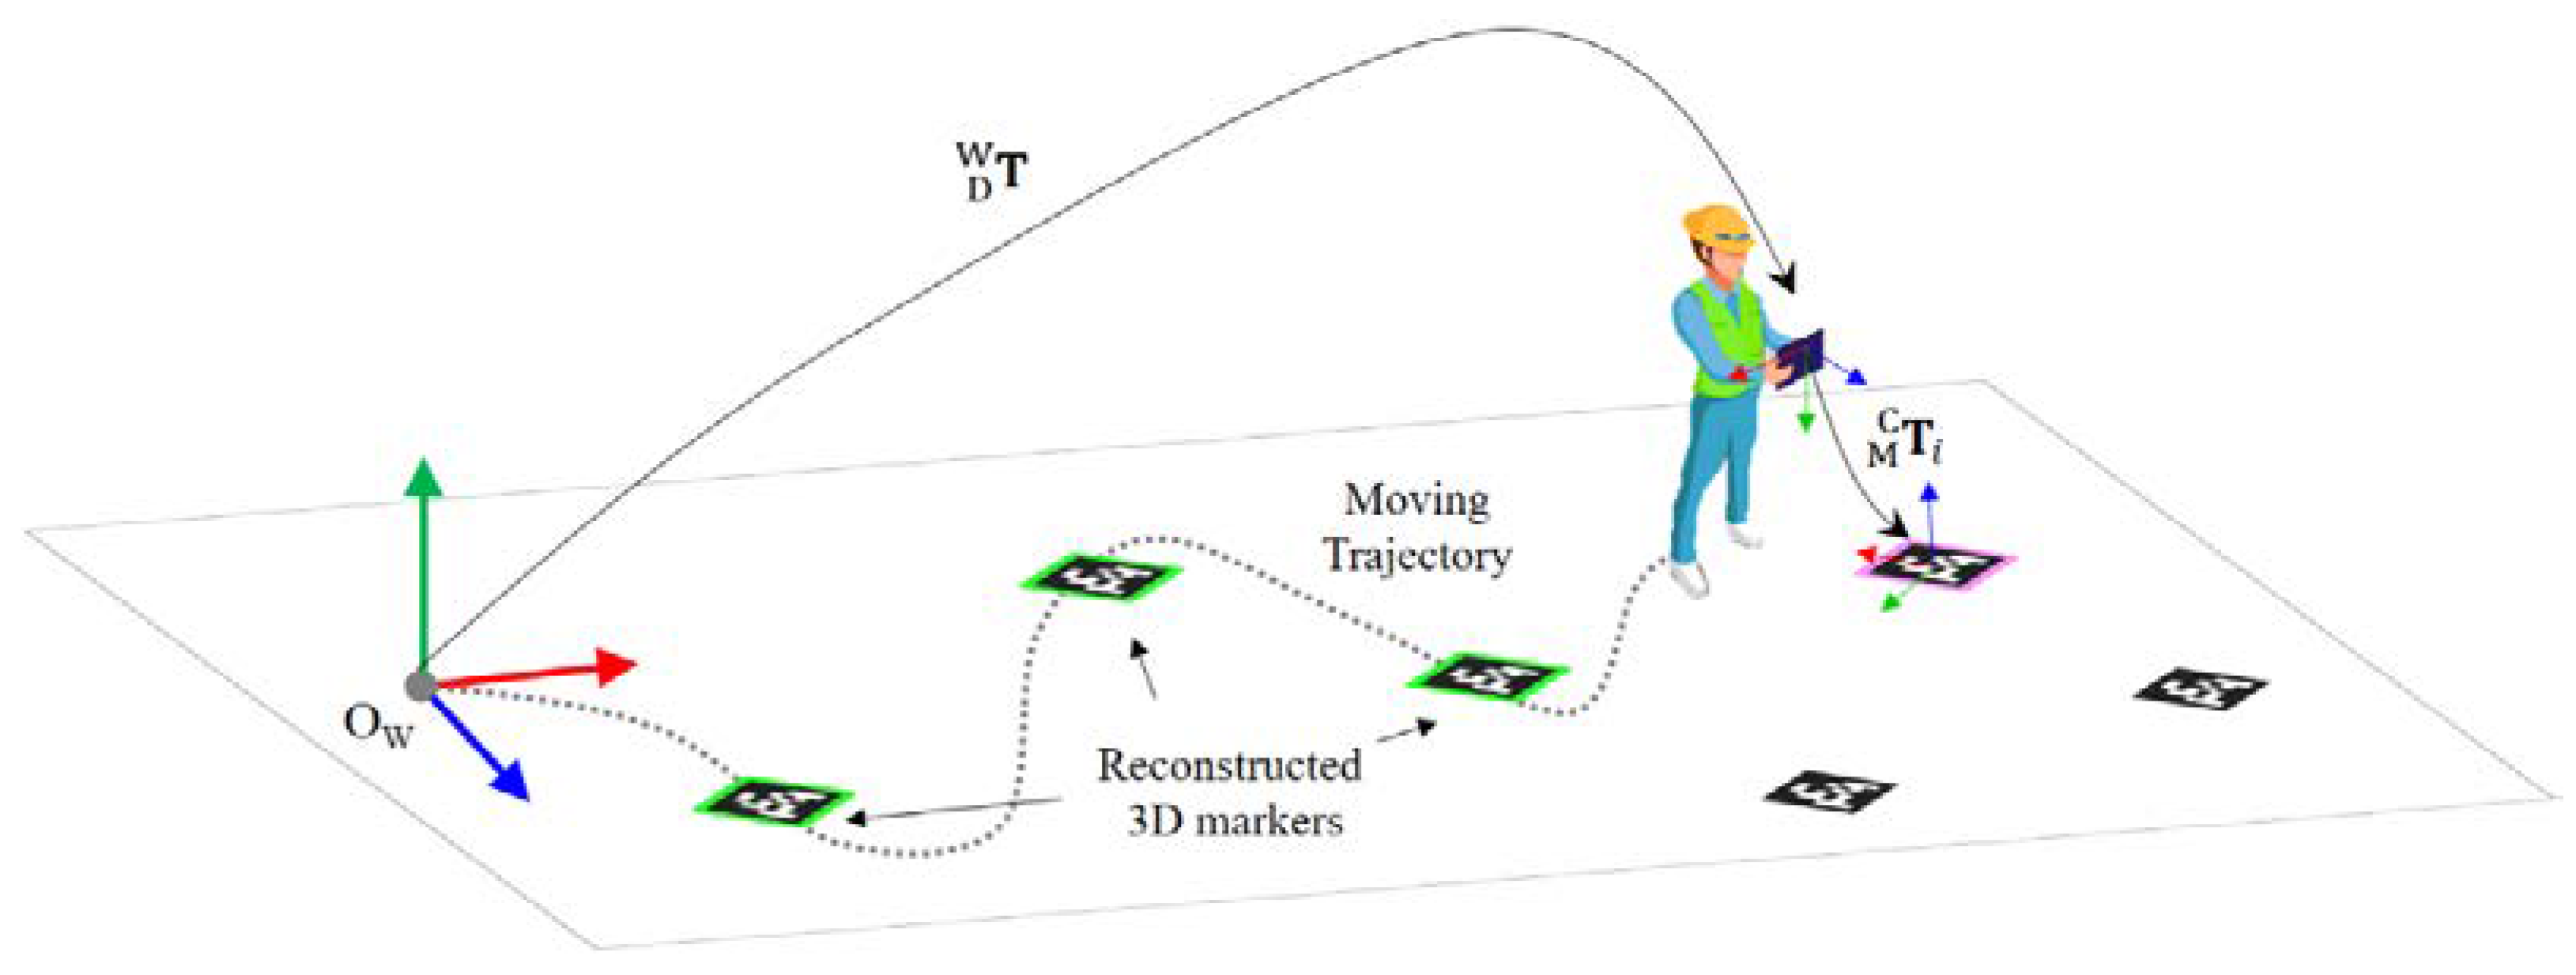
5.3. Reconstruction Refinement
- When a marker is detected in the image sequence;
- When the number of feature points newly started to be tracked exceeds 30% of the number of feature points tracked from the reference keyframe;
- When the ratio of the number of feature points tracked from the reference frame falls to 50% or less;
- When the distance from the reference frame exceeds 2 m.
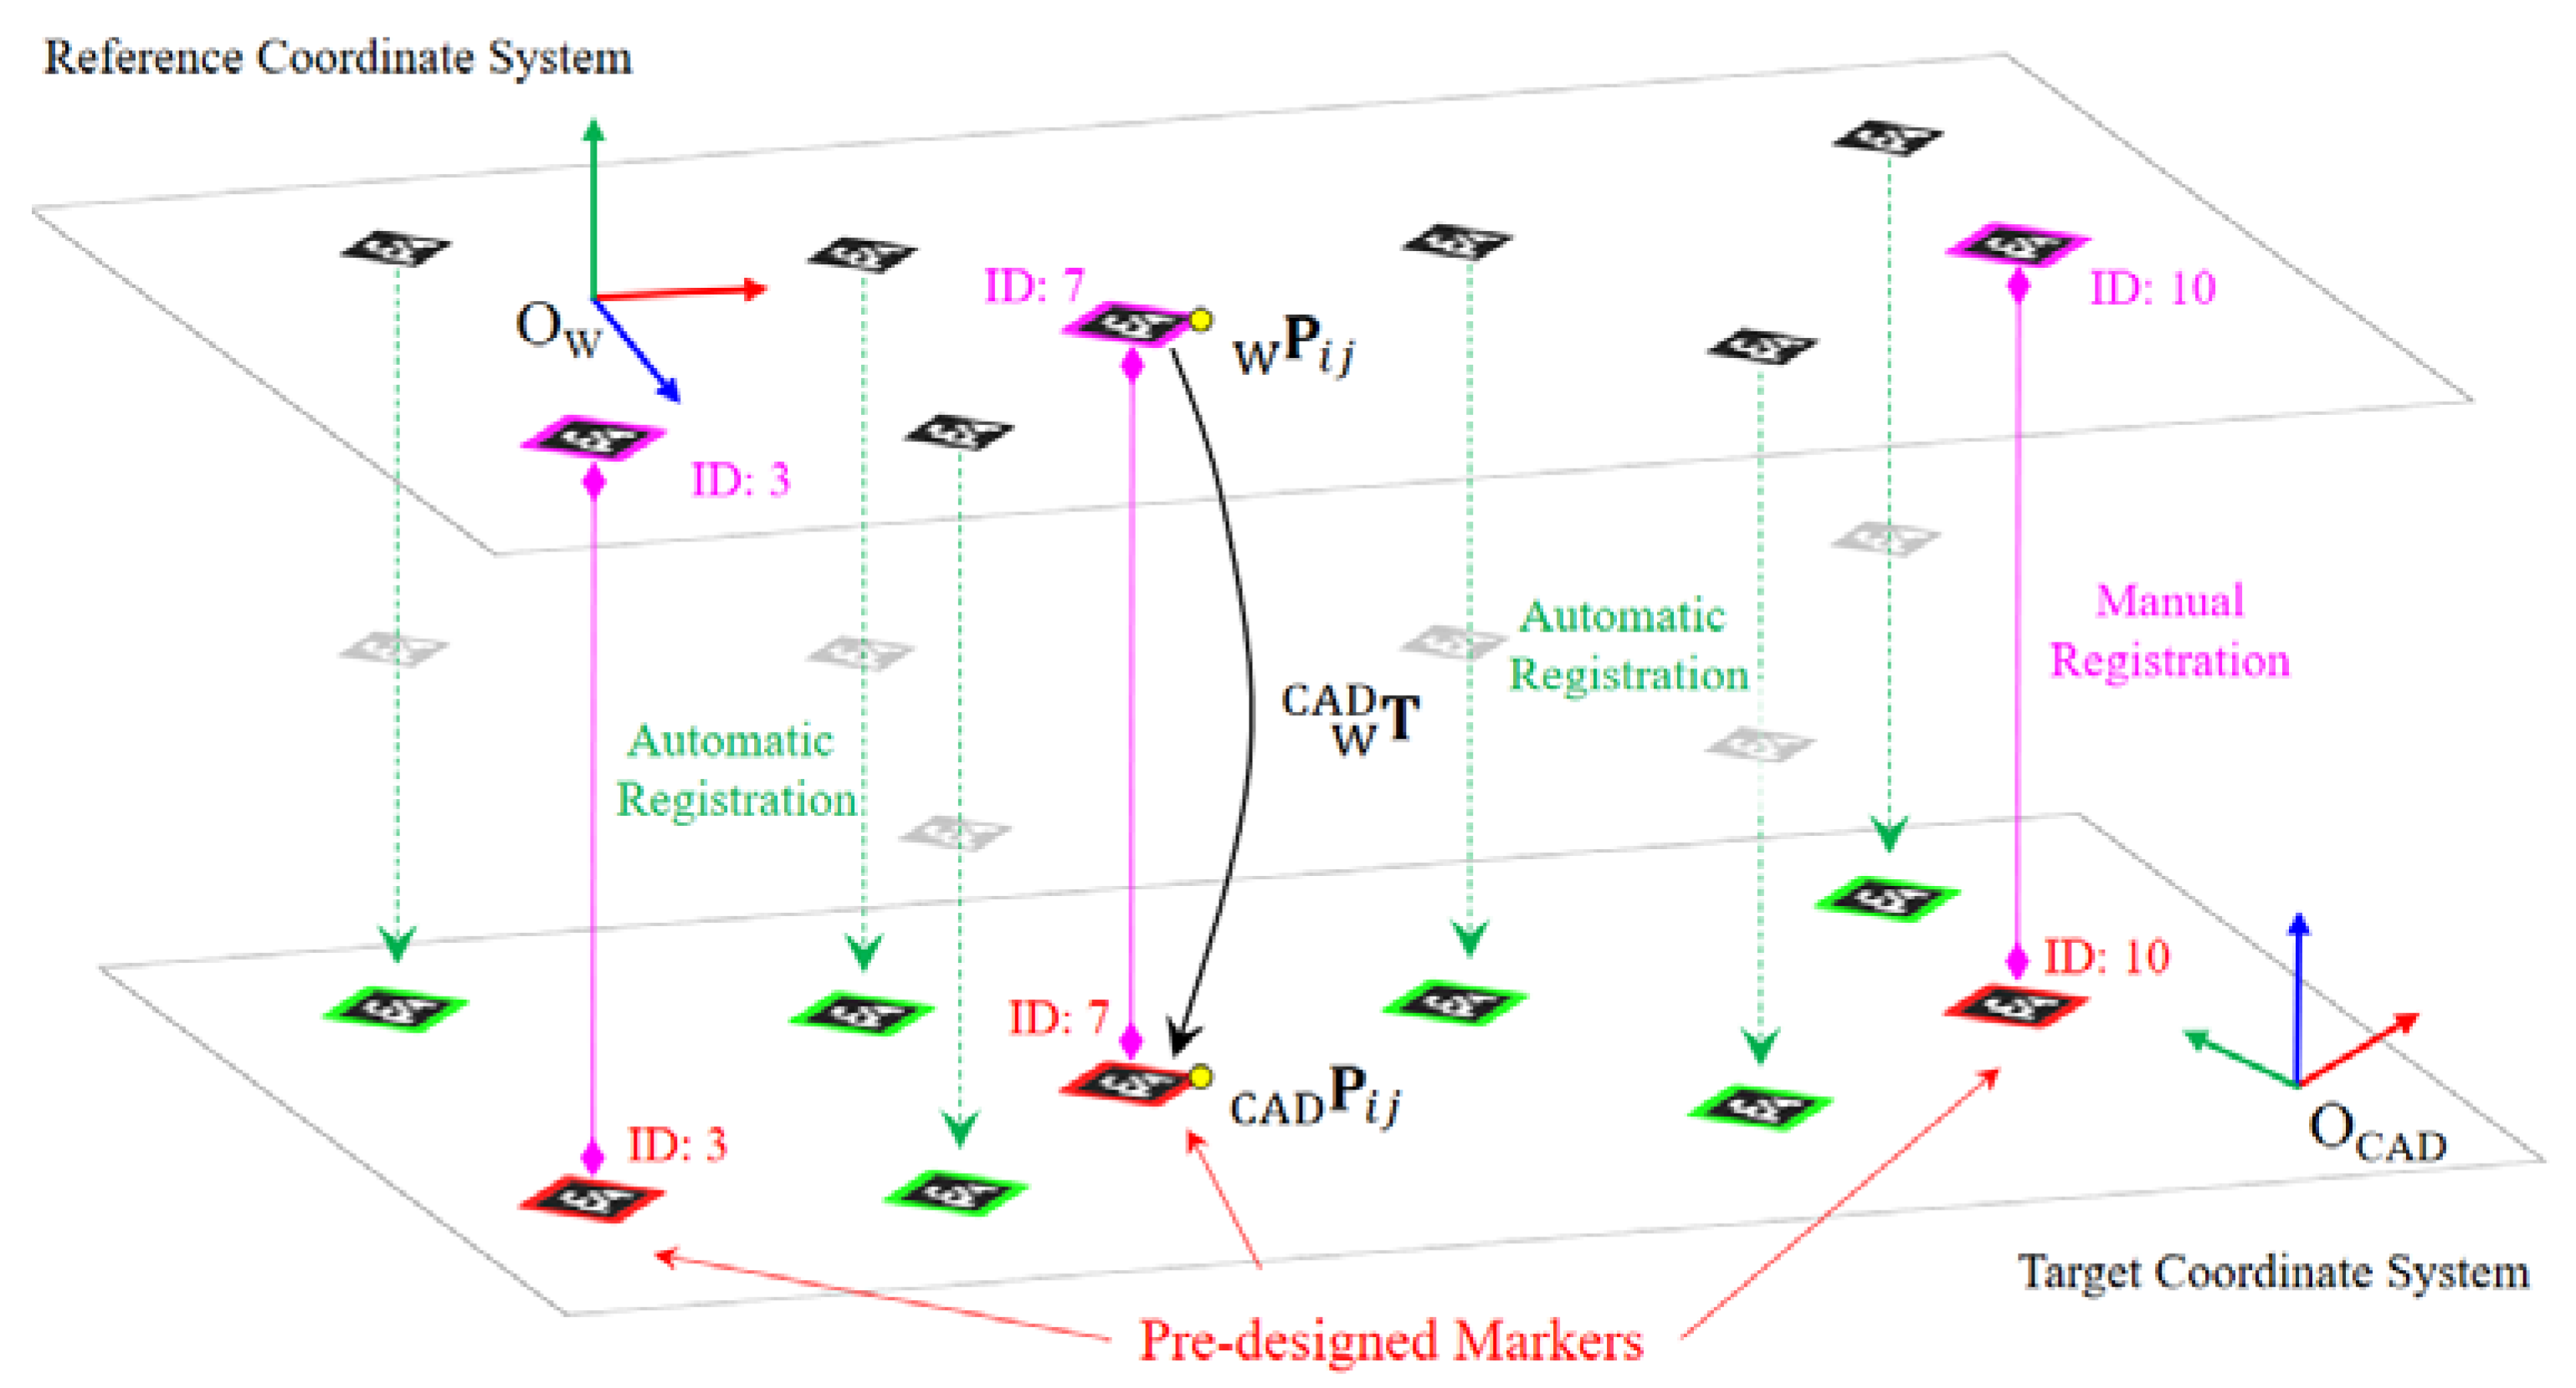
5.4. Coordinate System Conversion
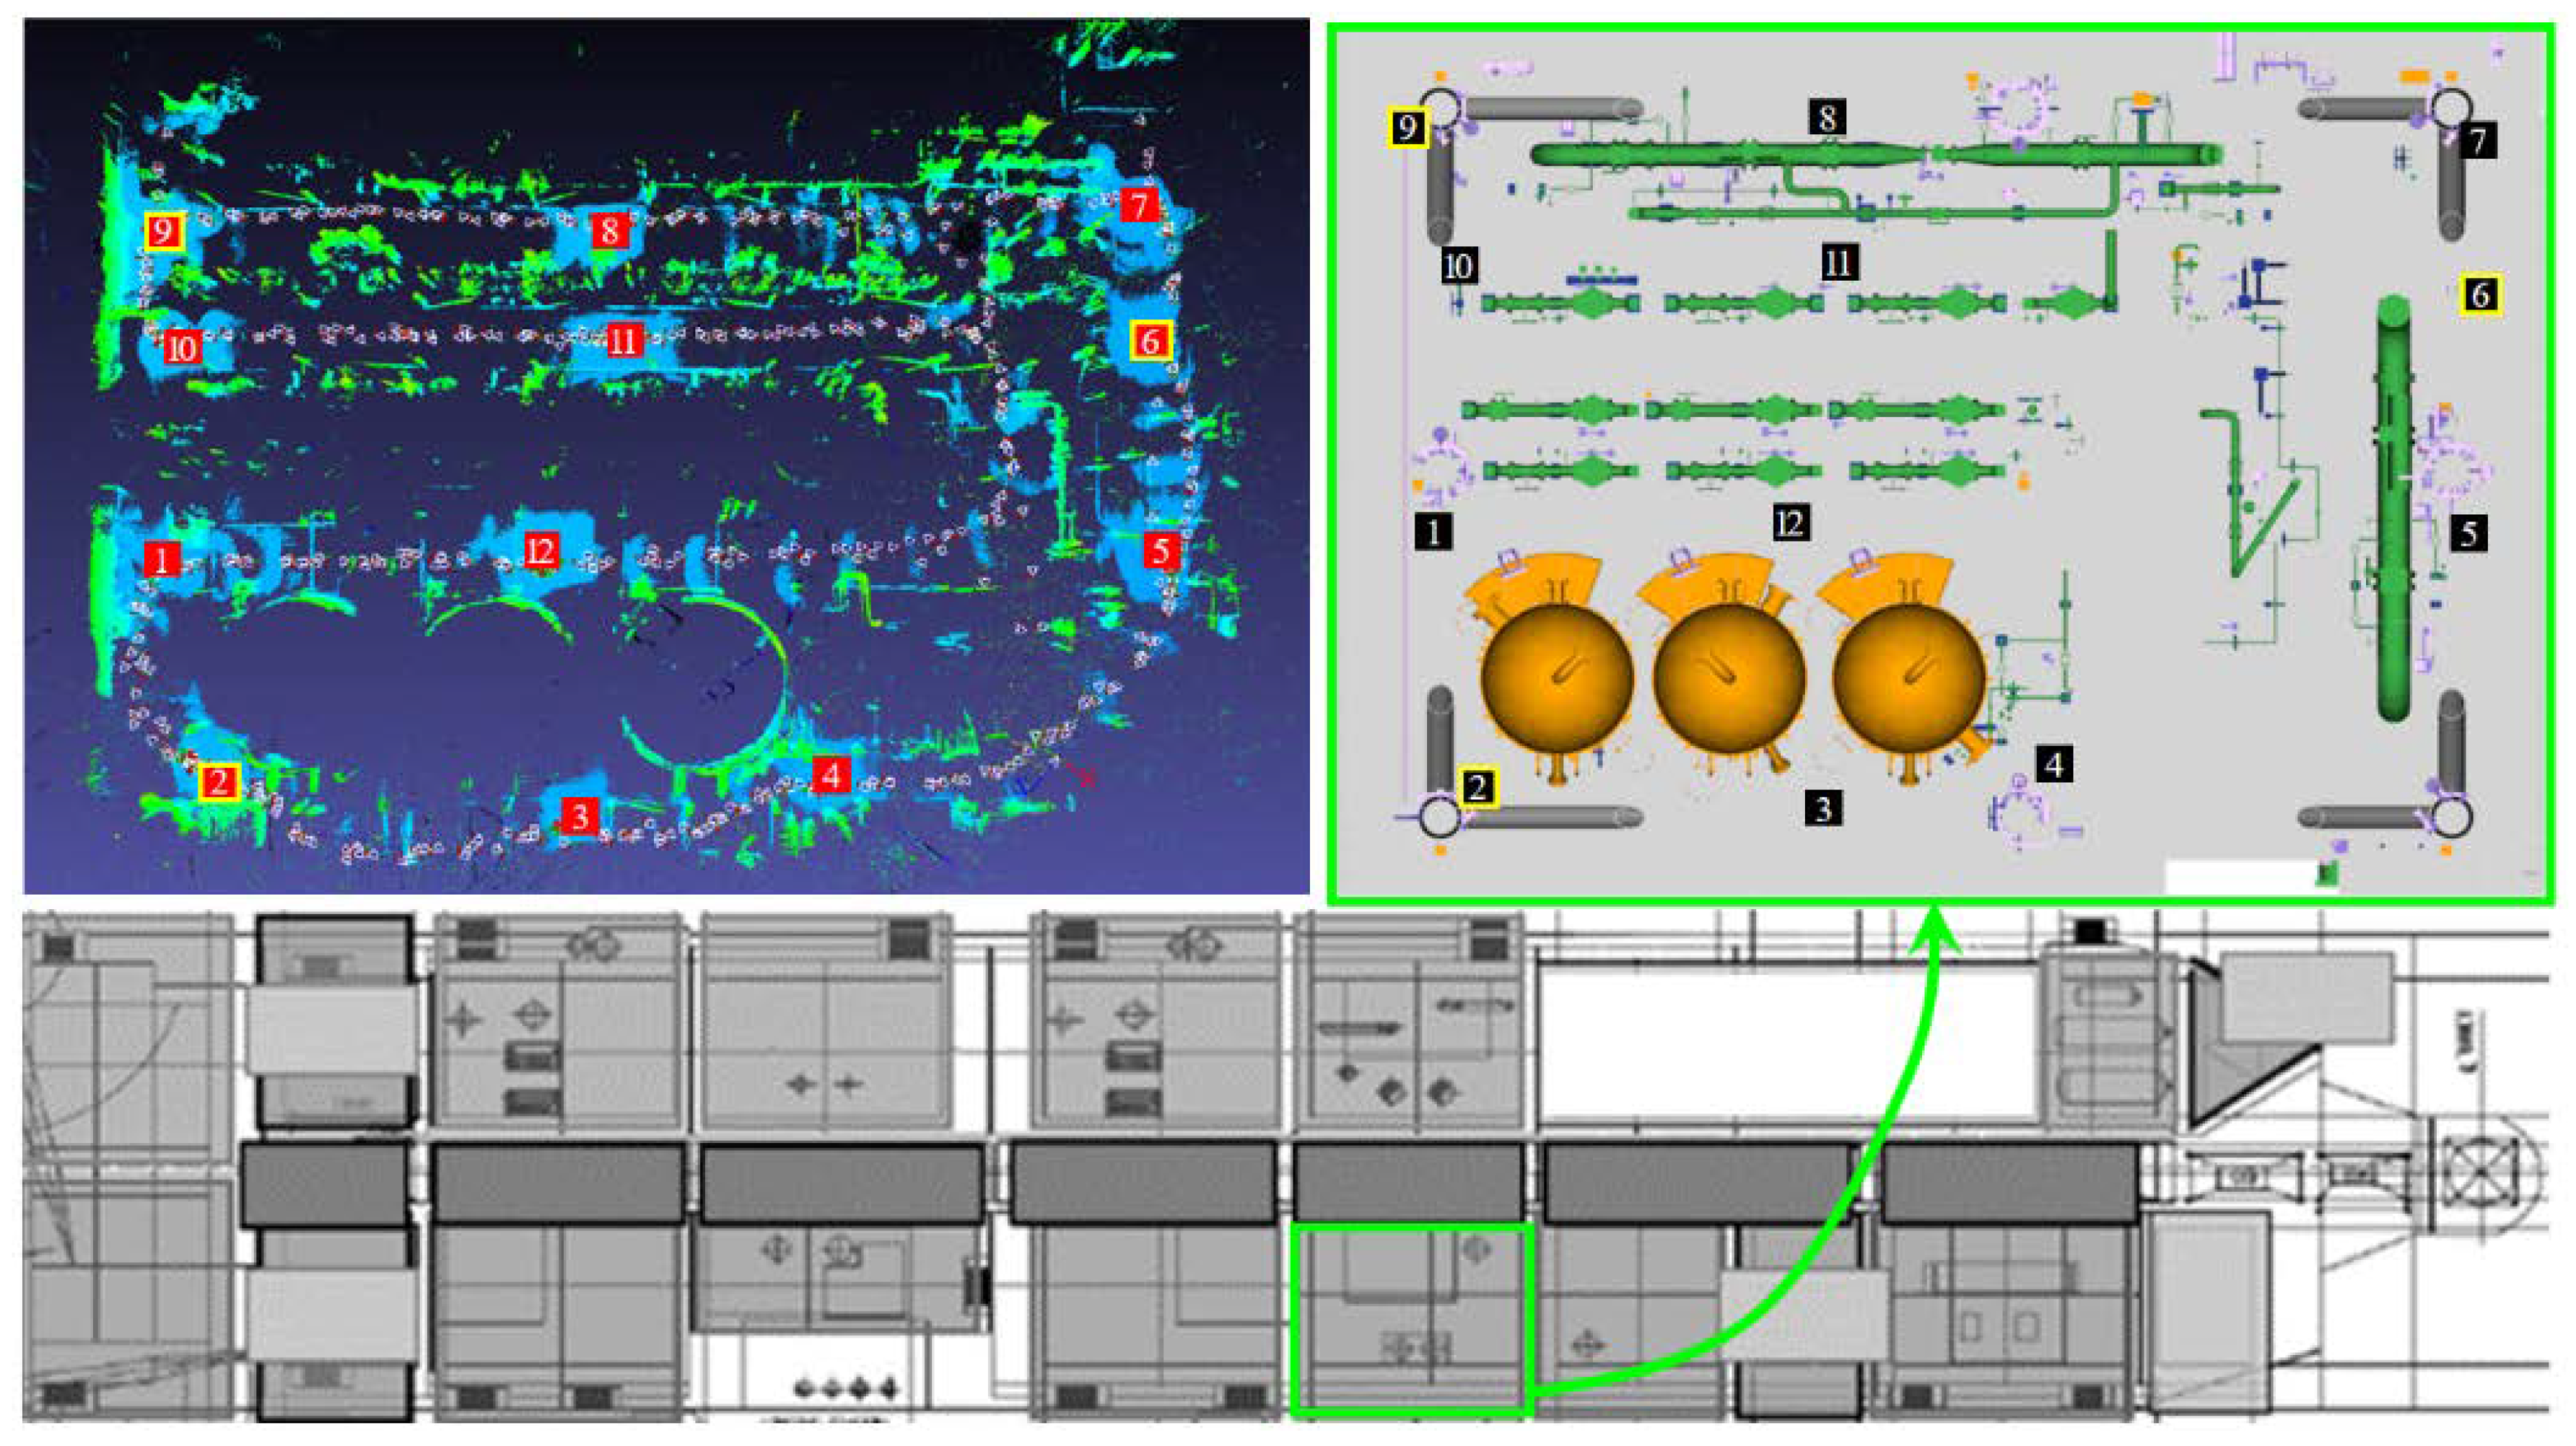
5.5. Experimental Results
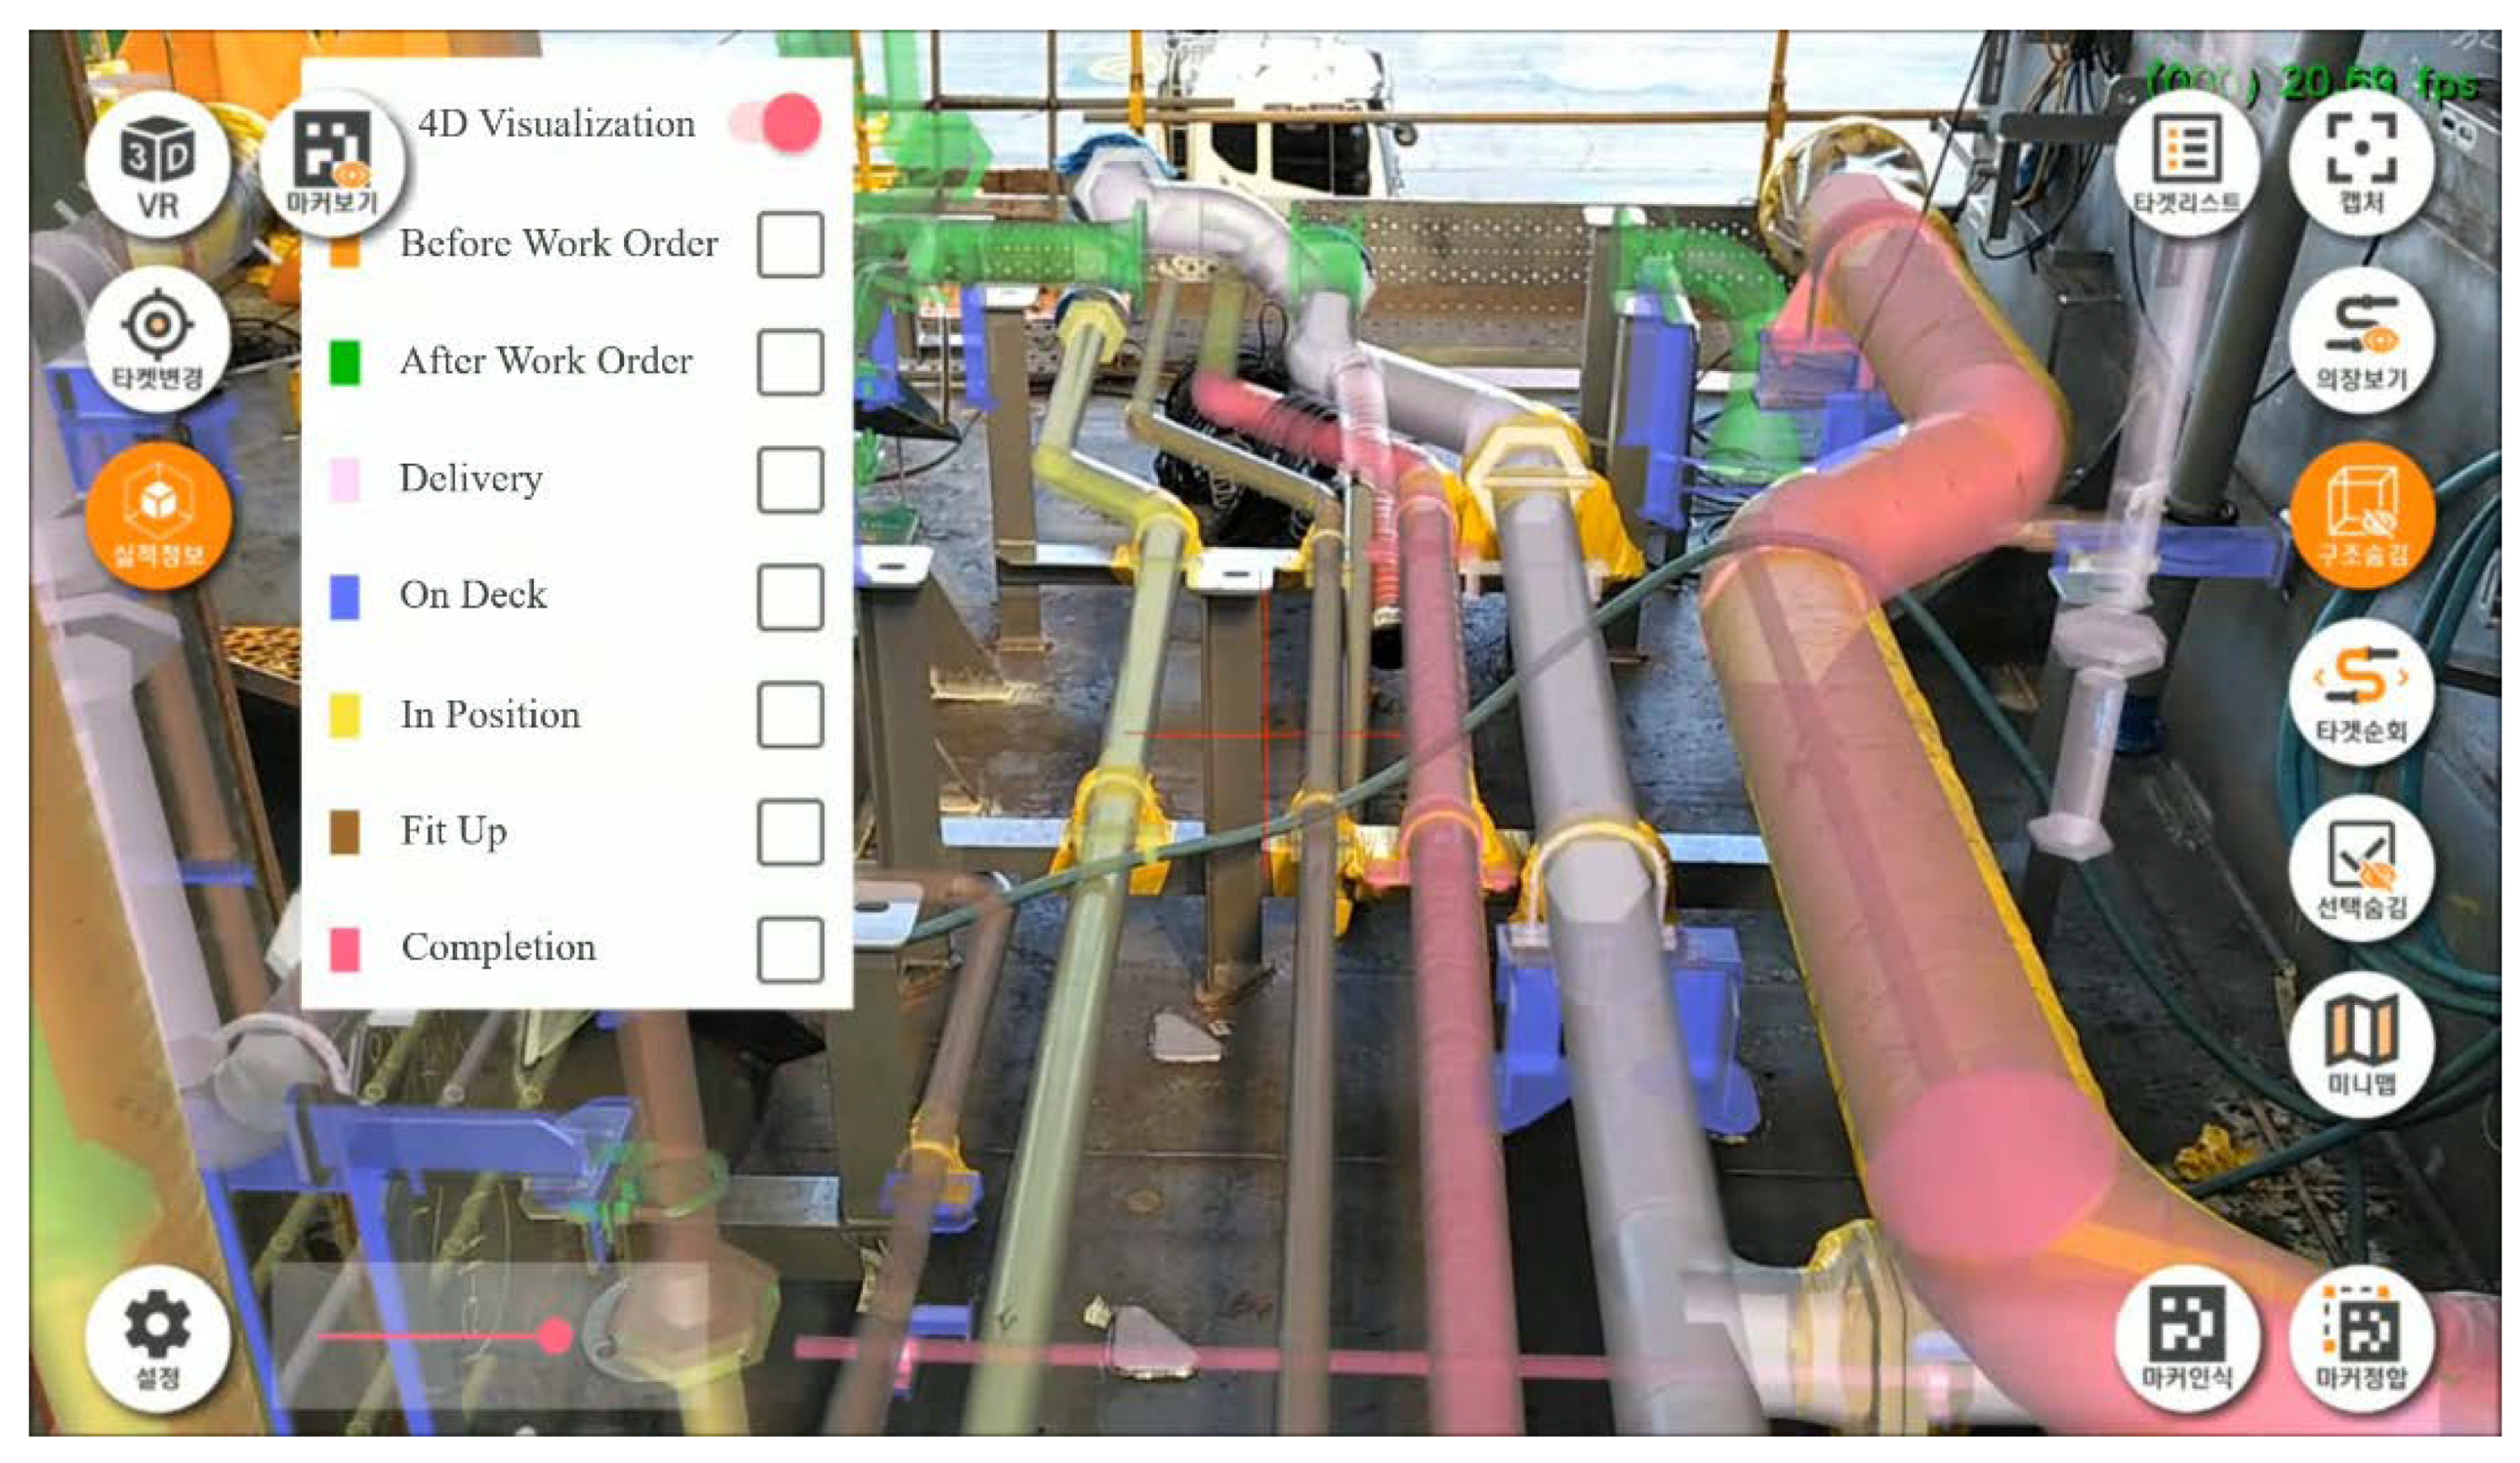
6. Visualization
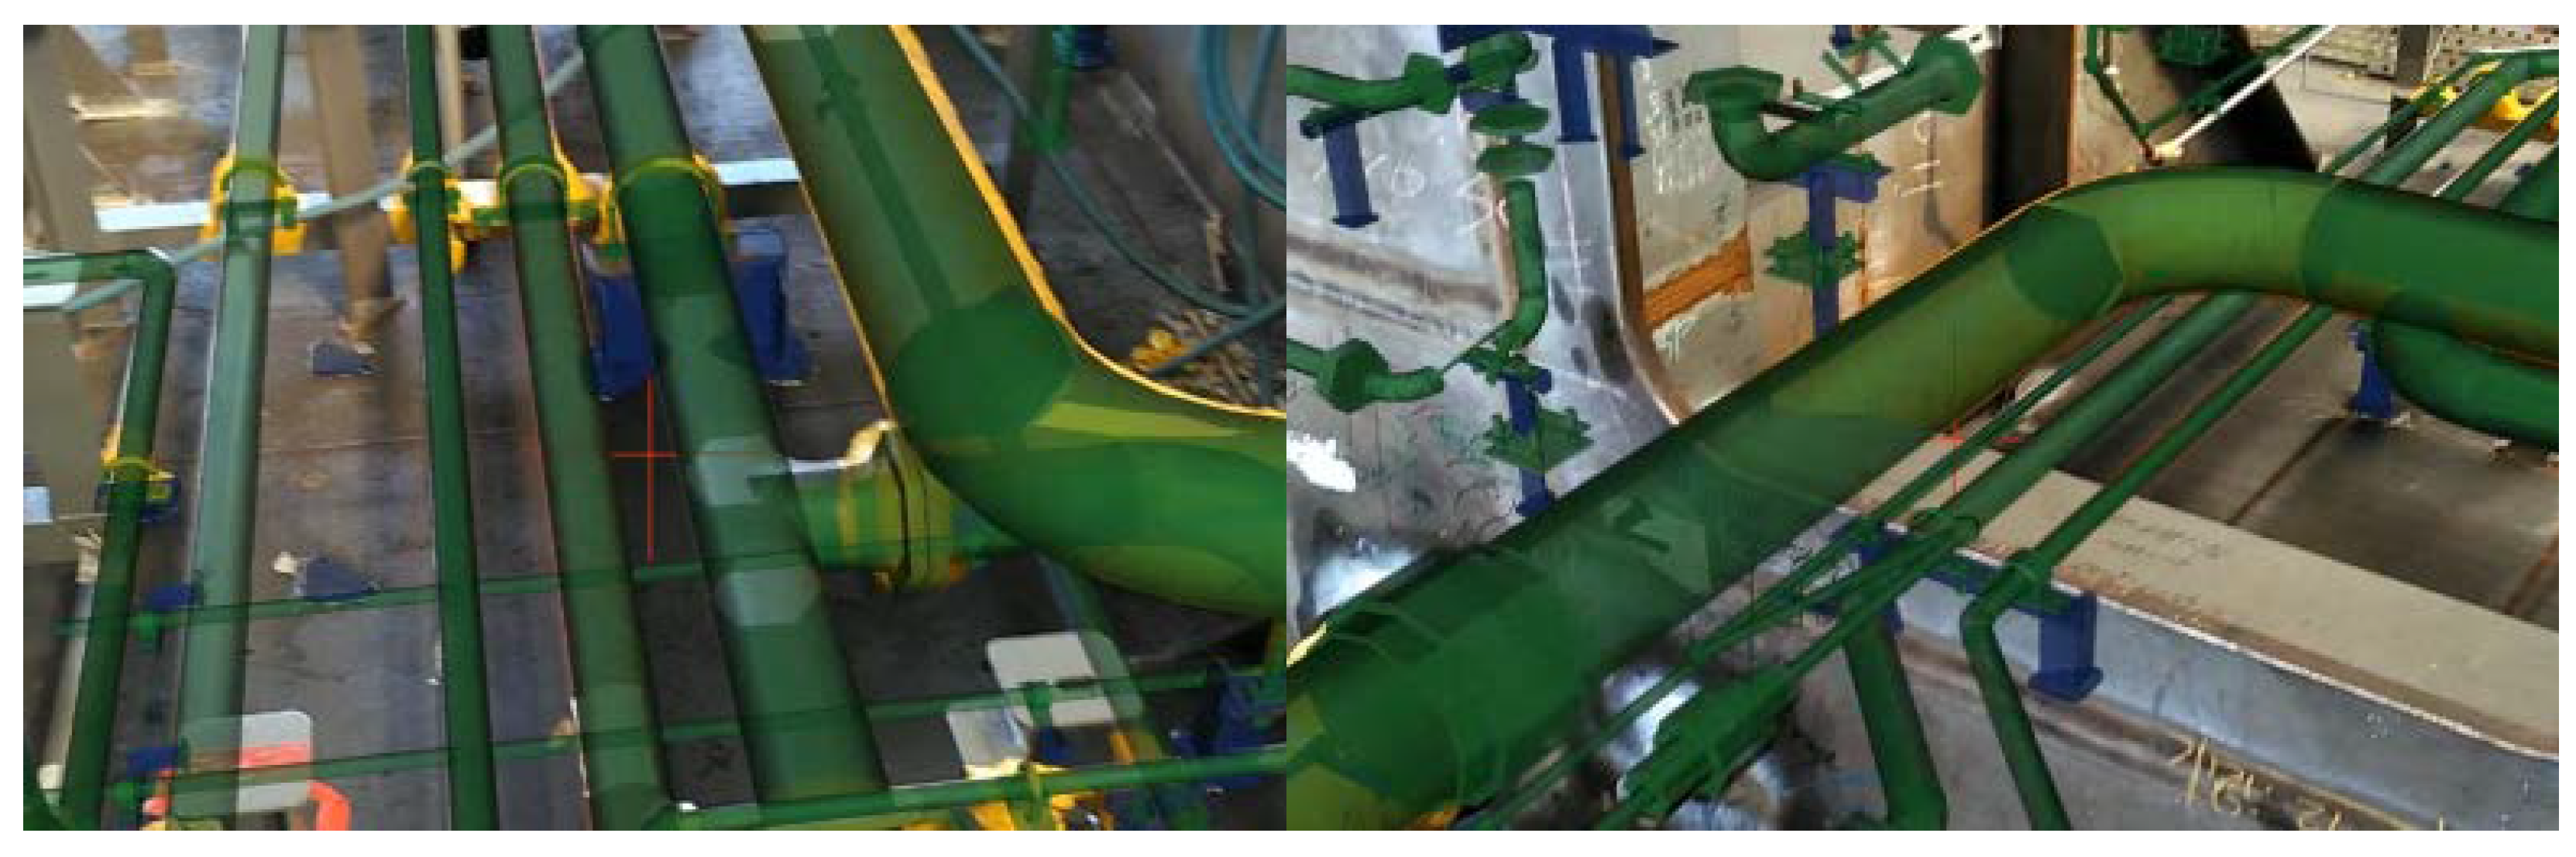
6.1. AR Scene Generation
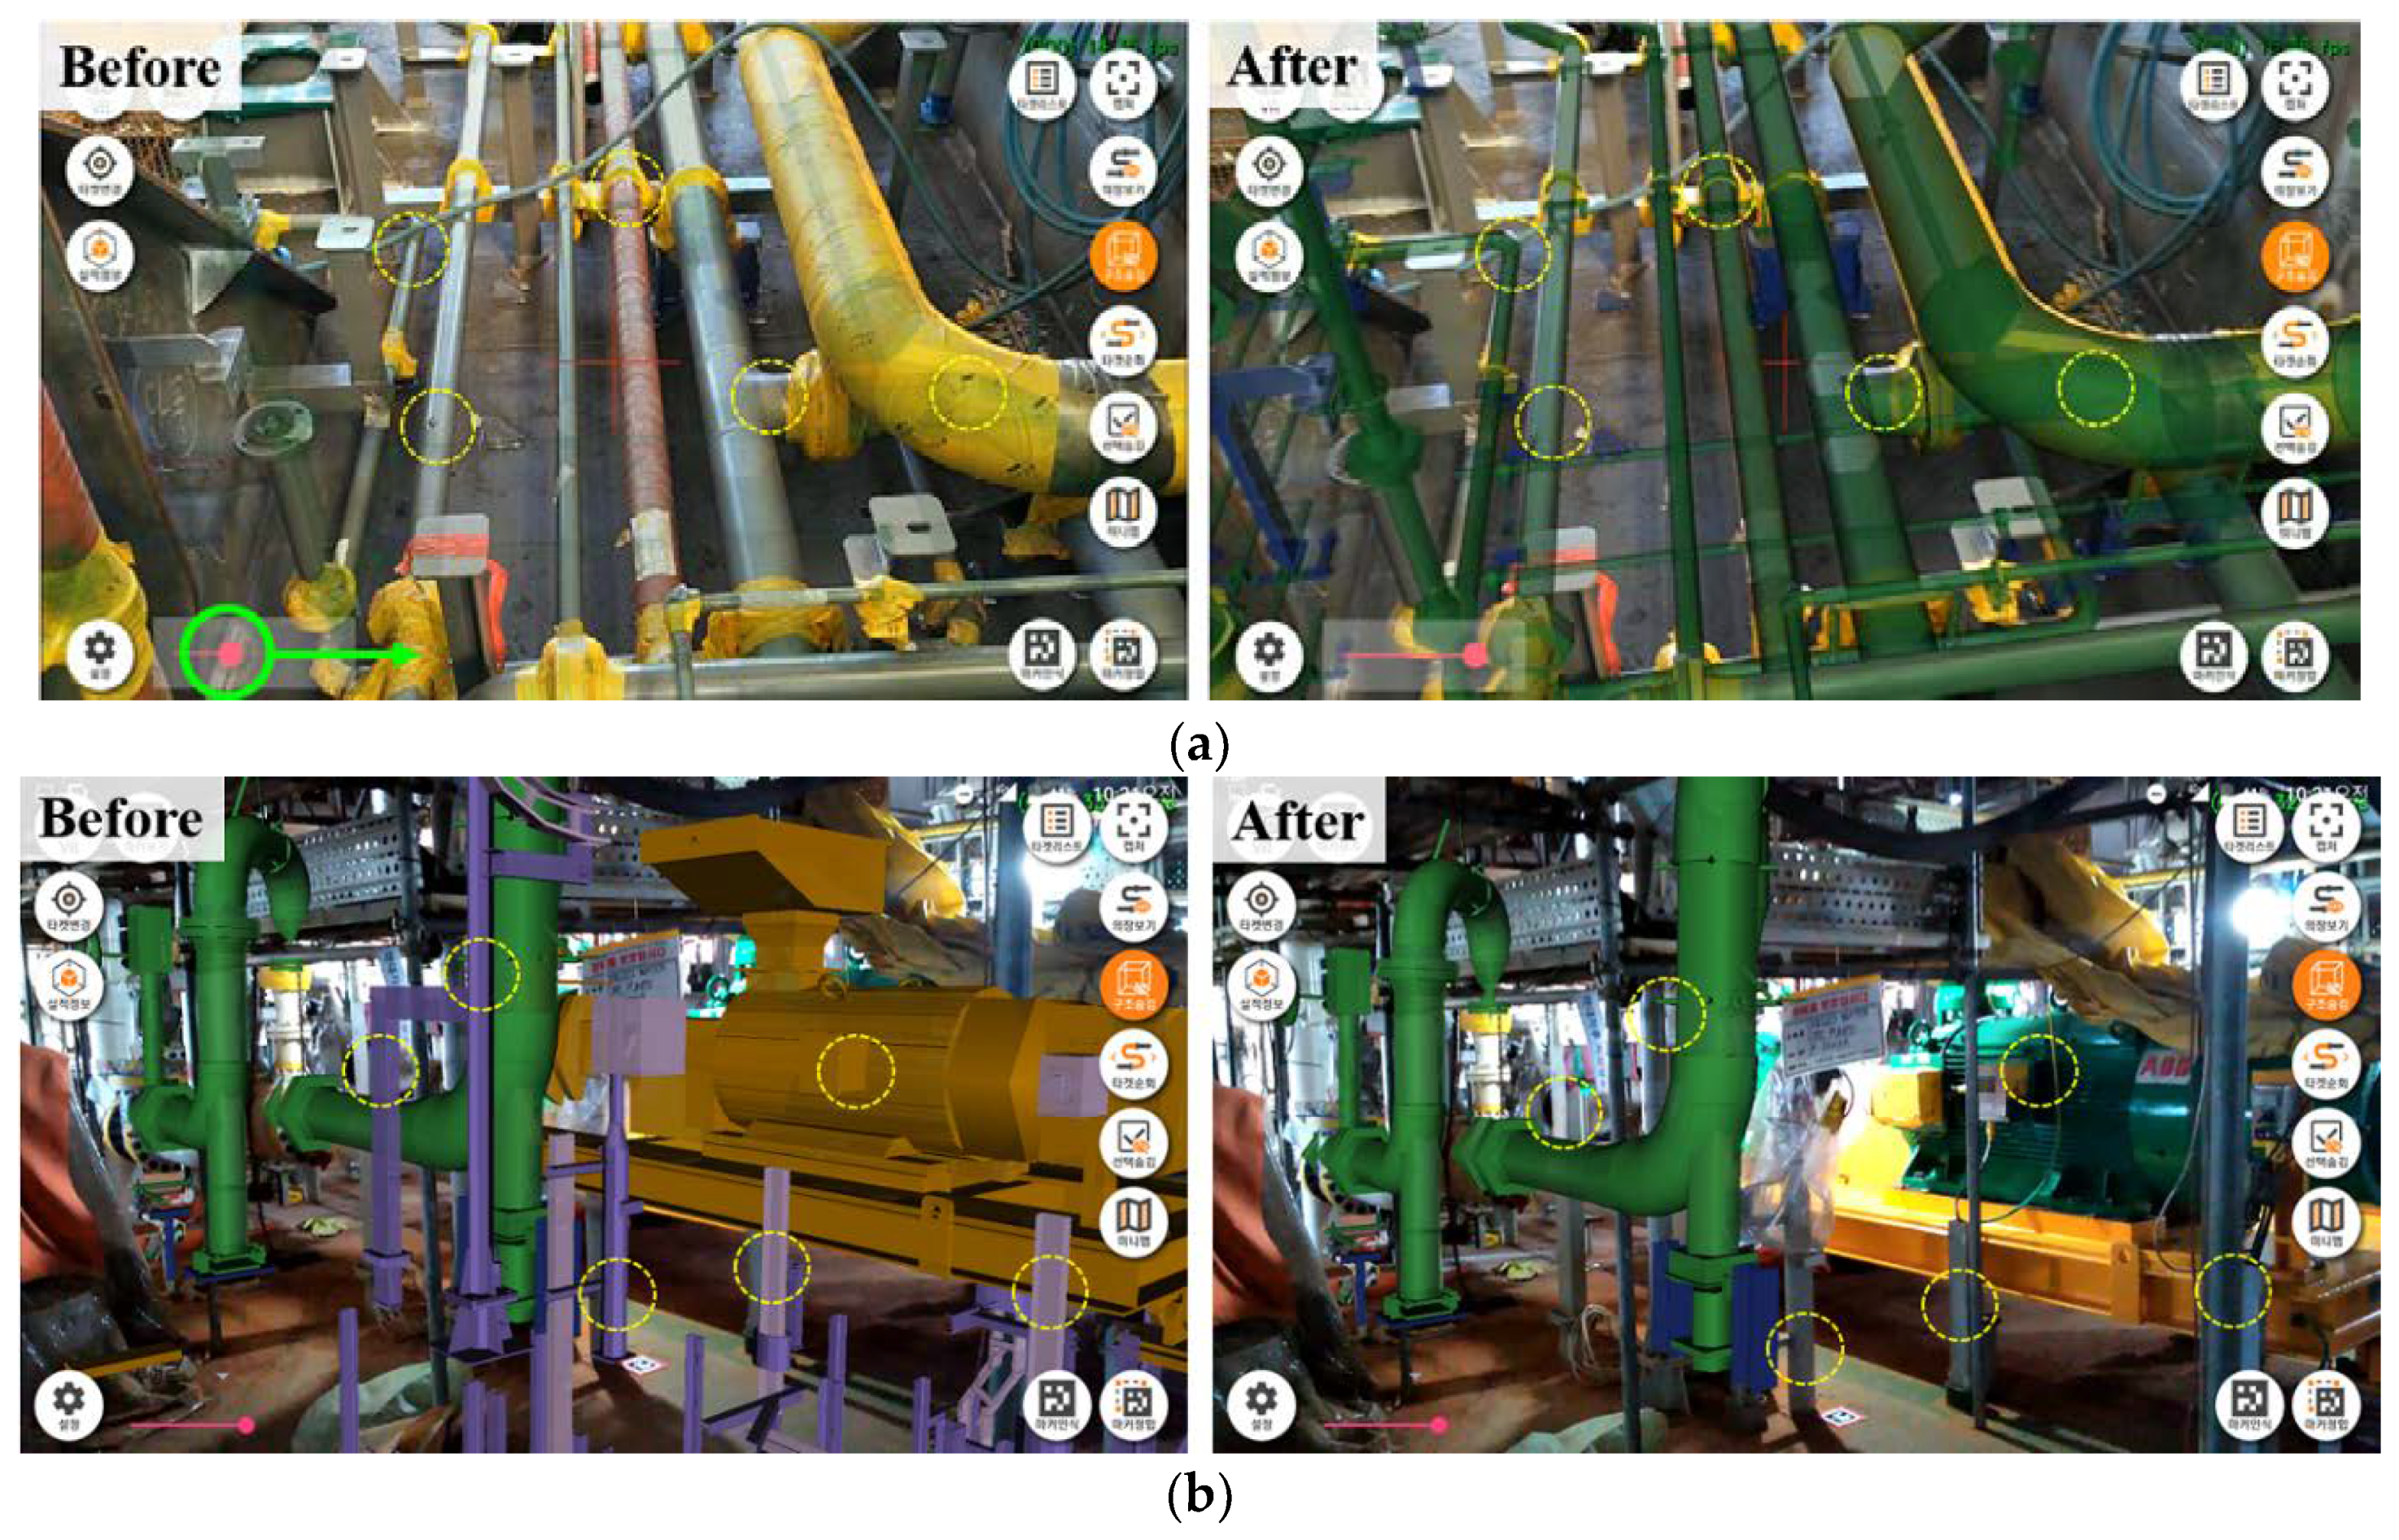
6.2. Useful Functions
- Transparency Control
- b.
- Discipline Filtering
- c.
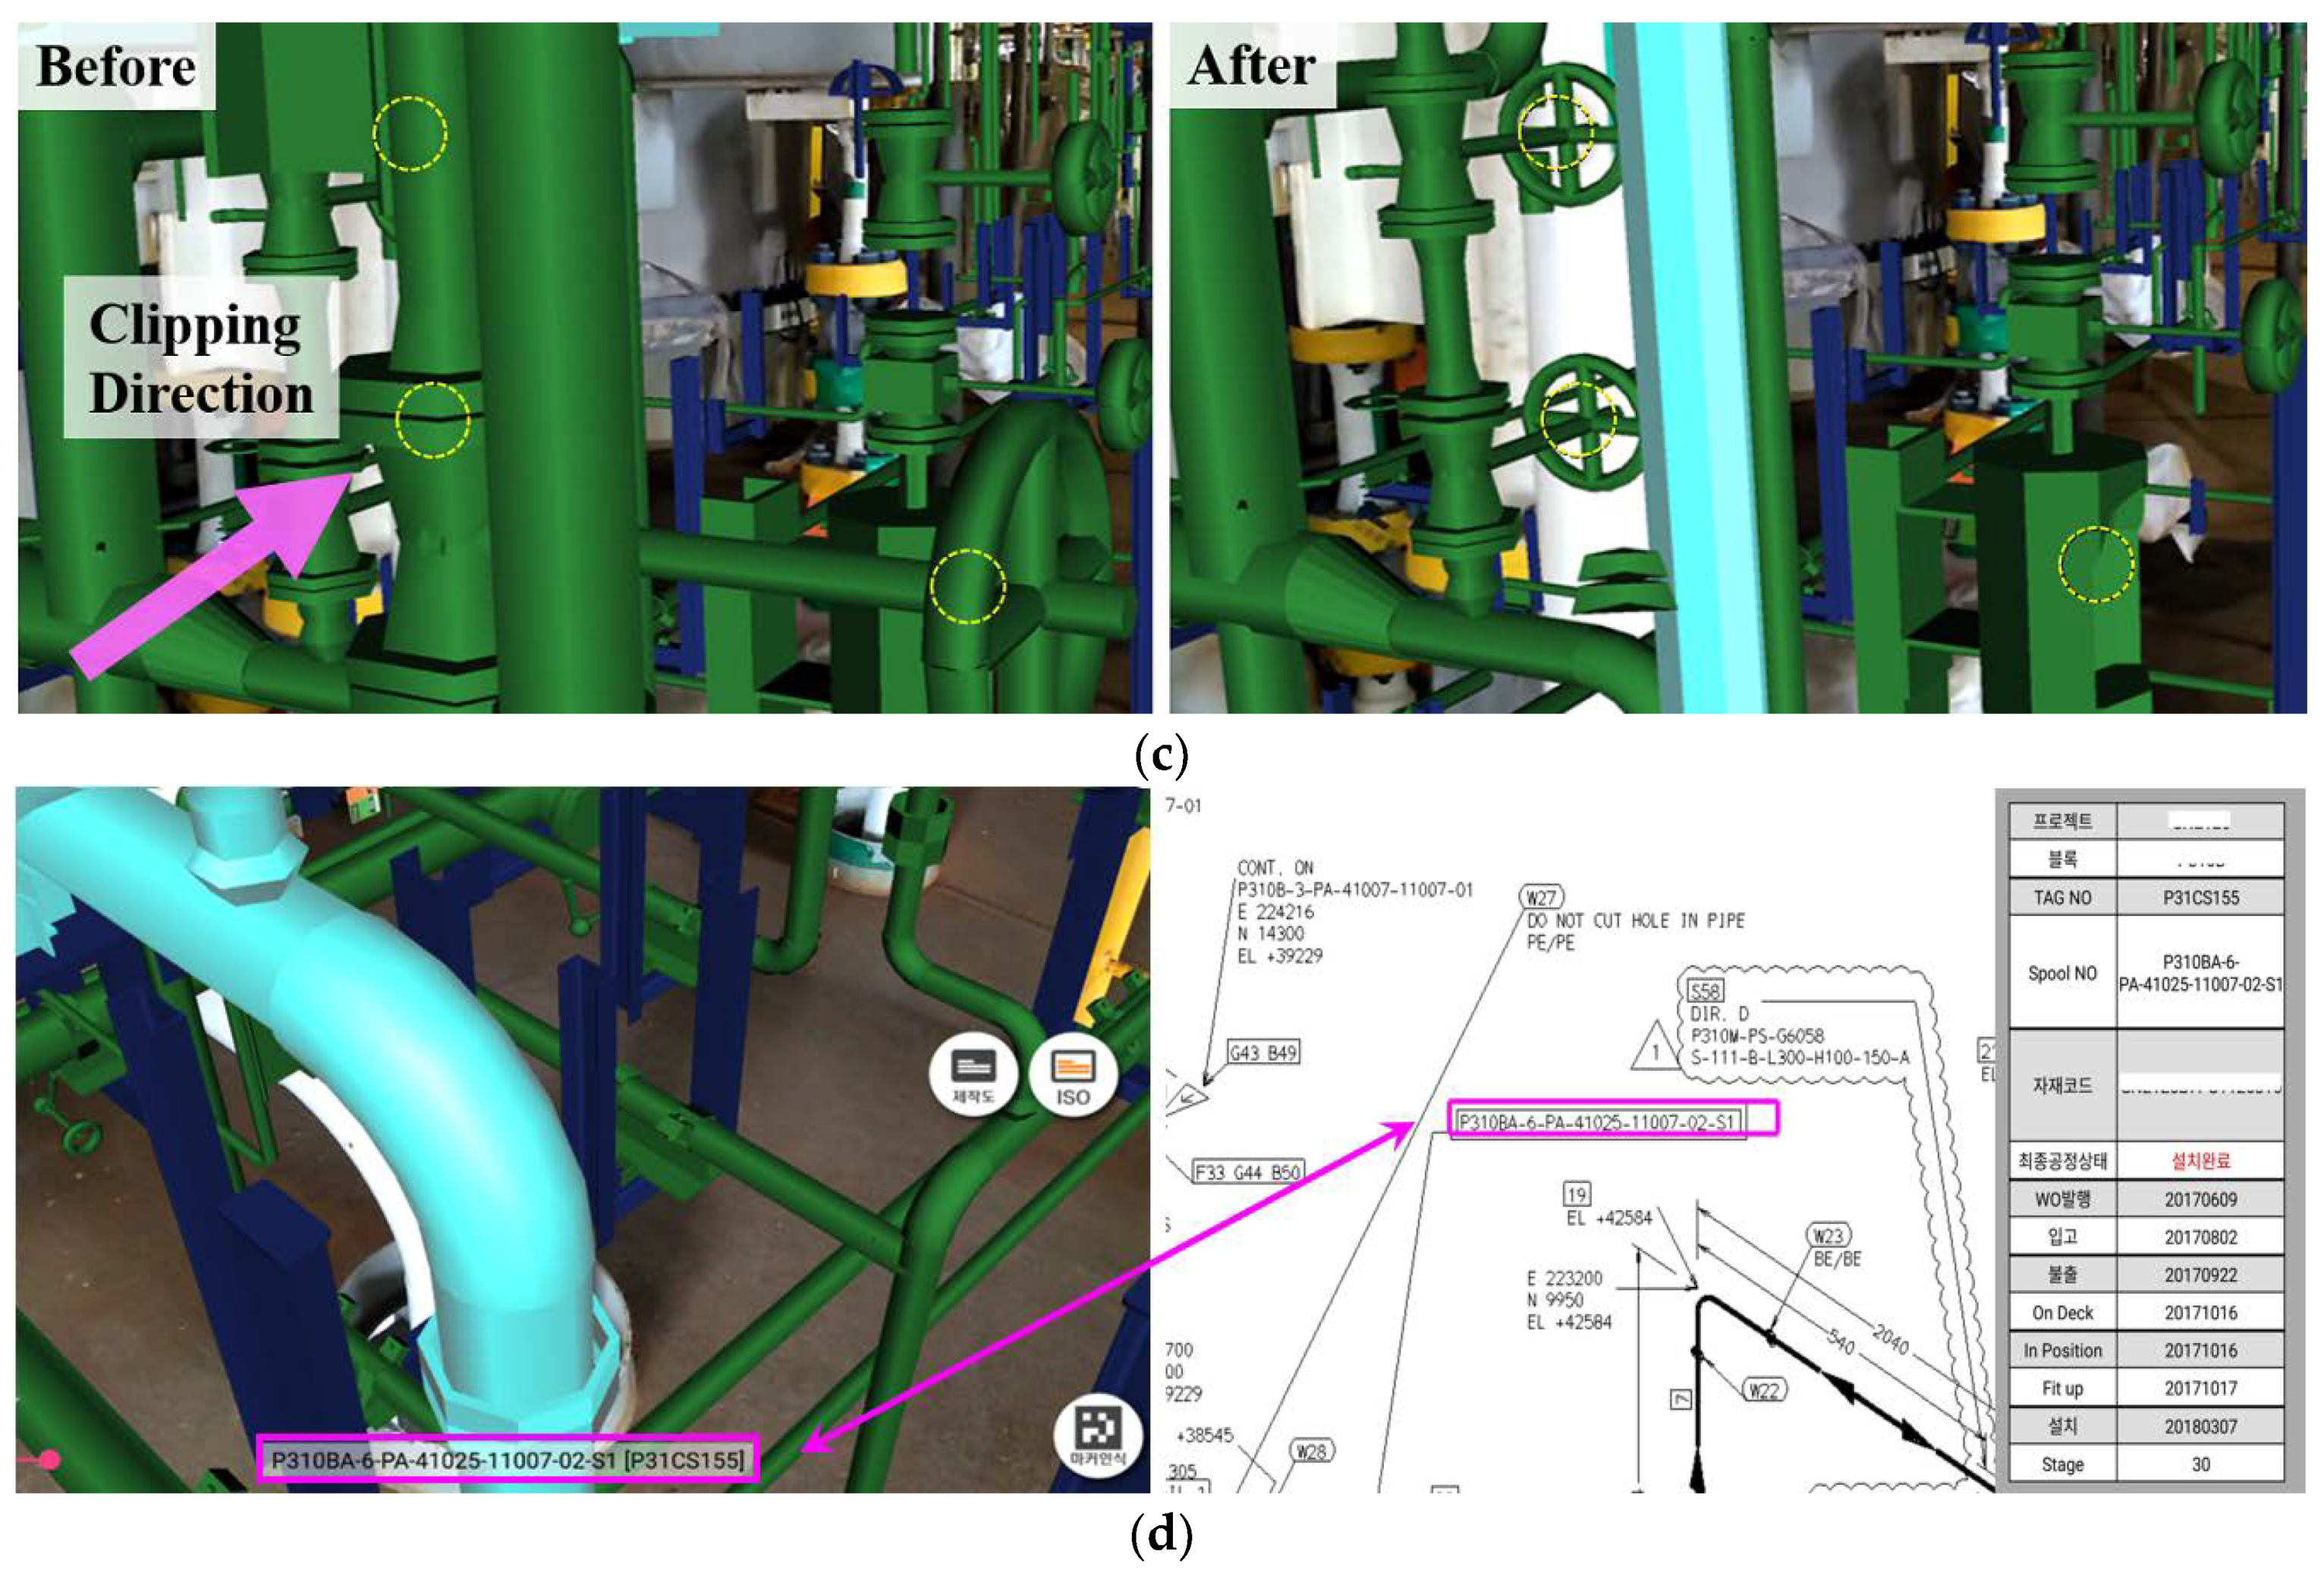
- View Clipping
- d.
- Drawing Linkage
7. Applications
7.1. Validation
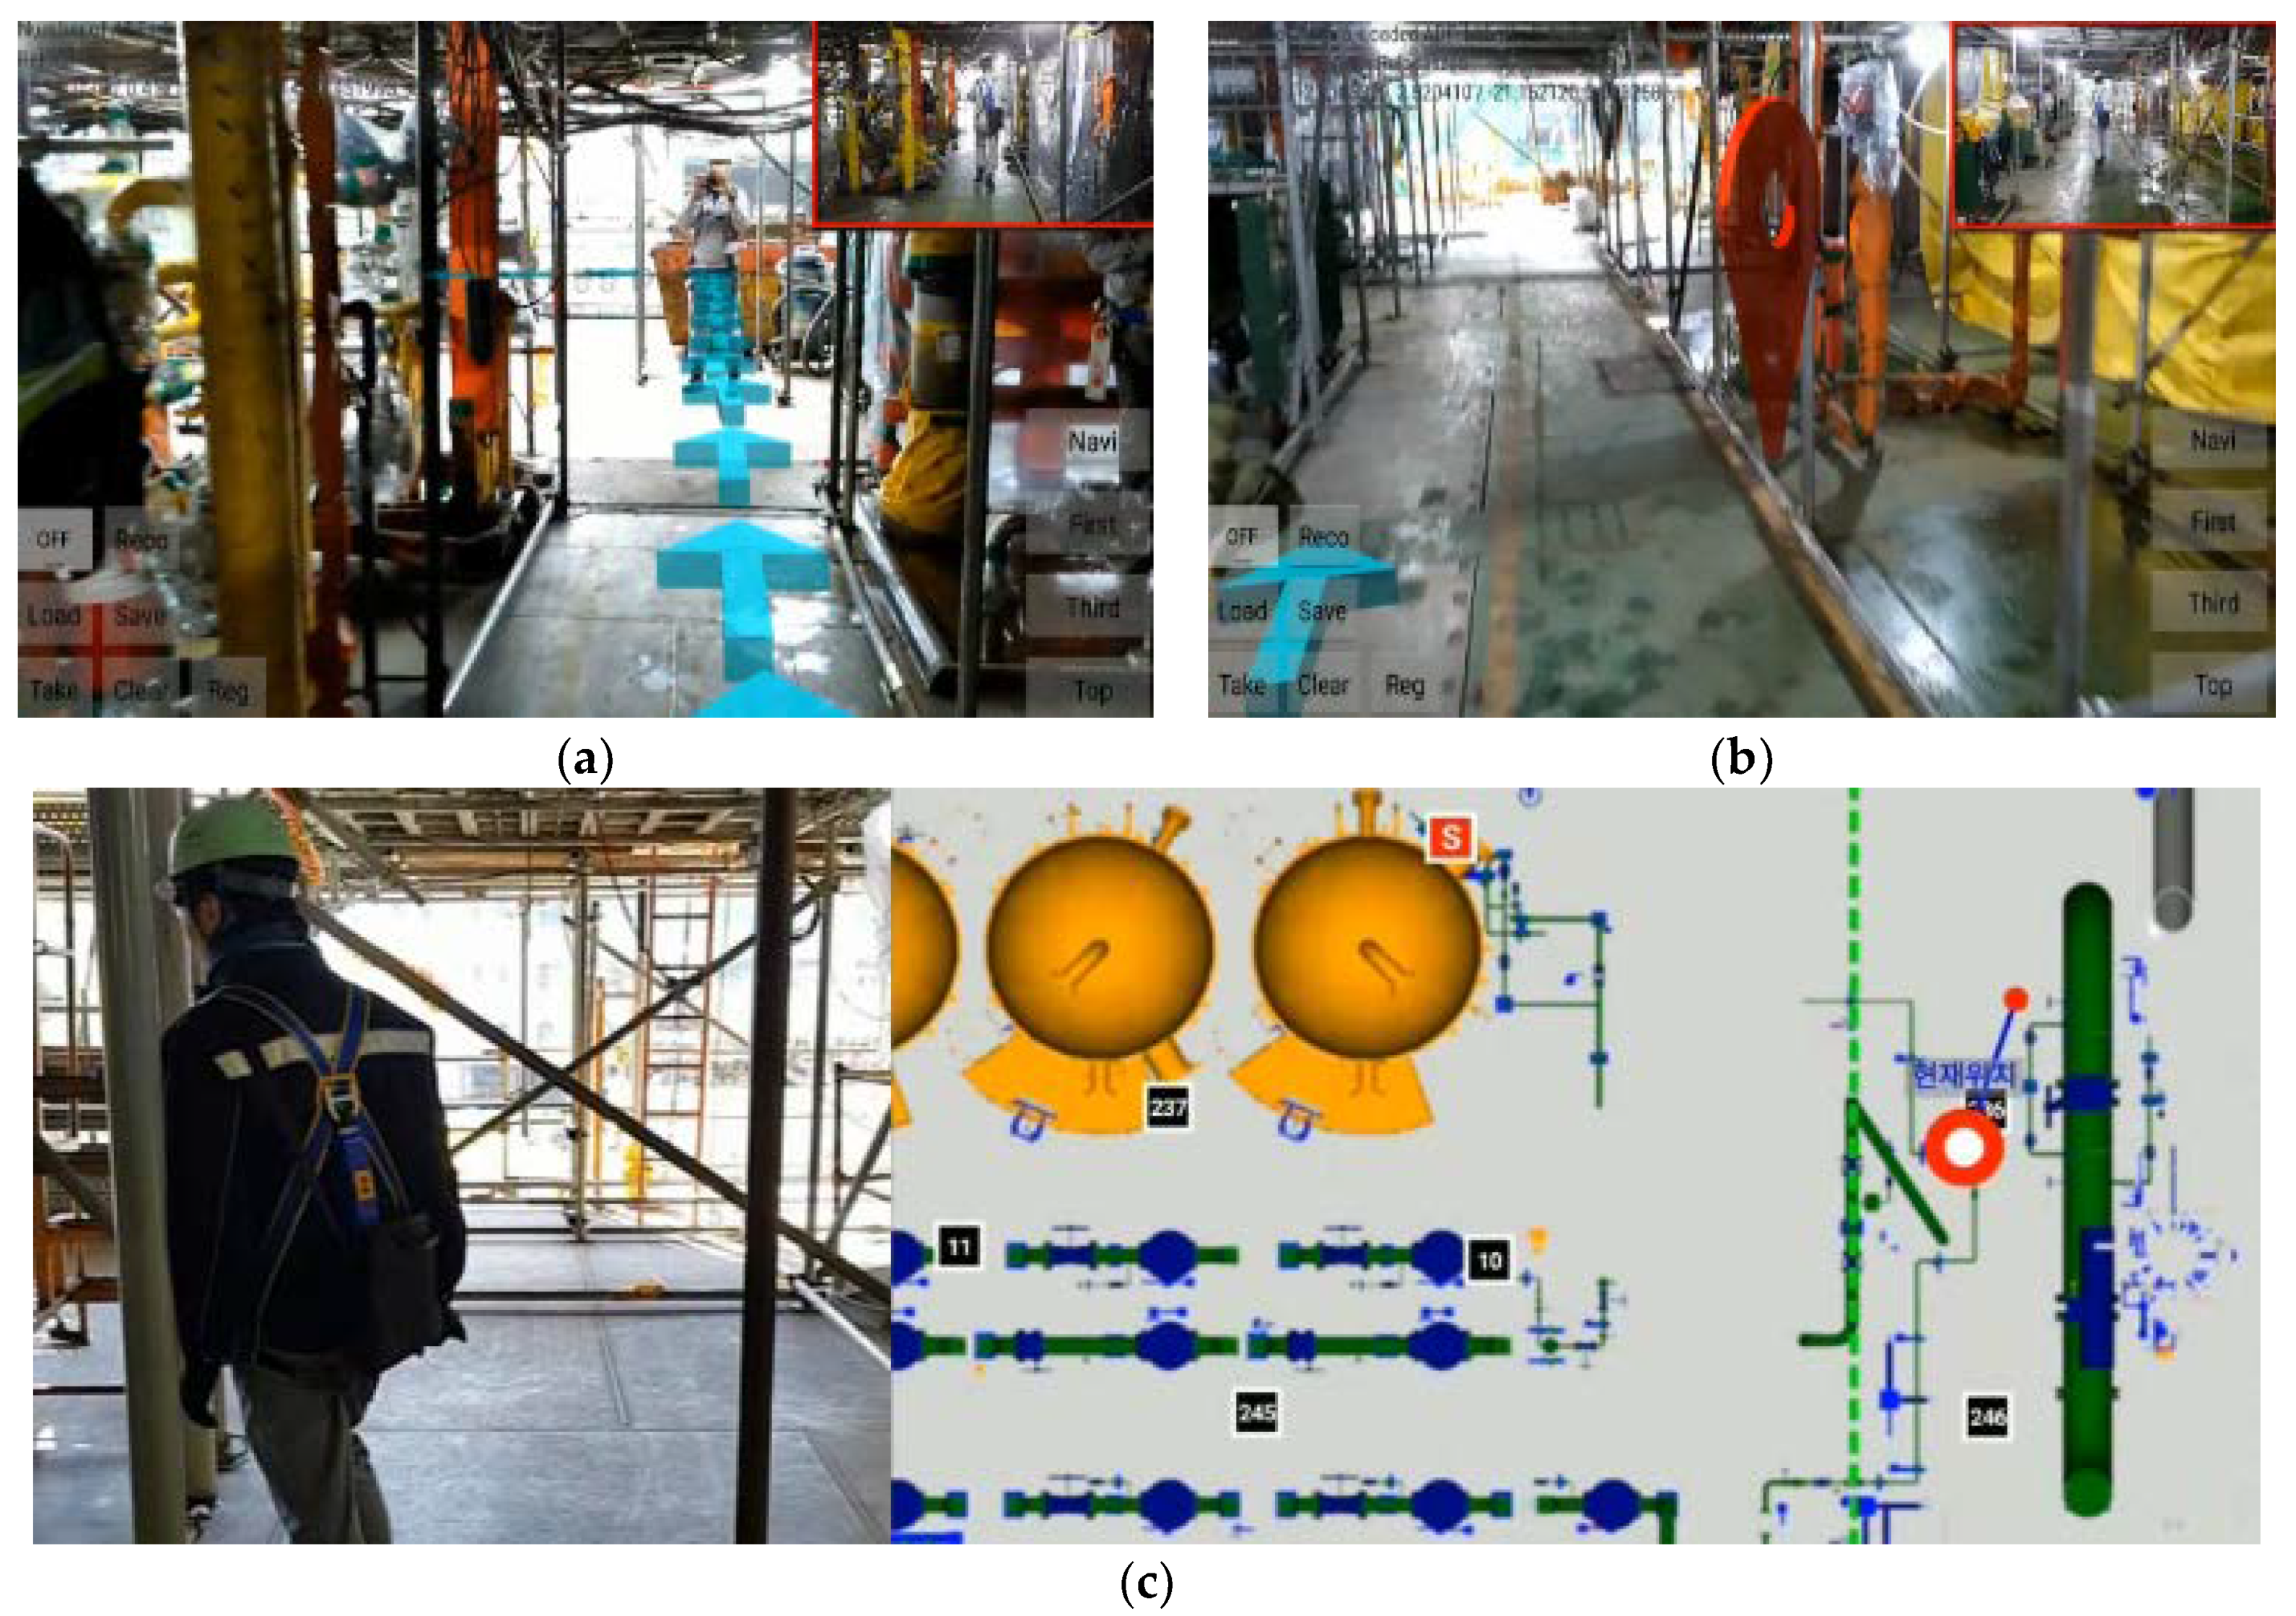
7.2. Self-Navigation
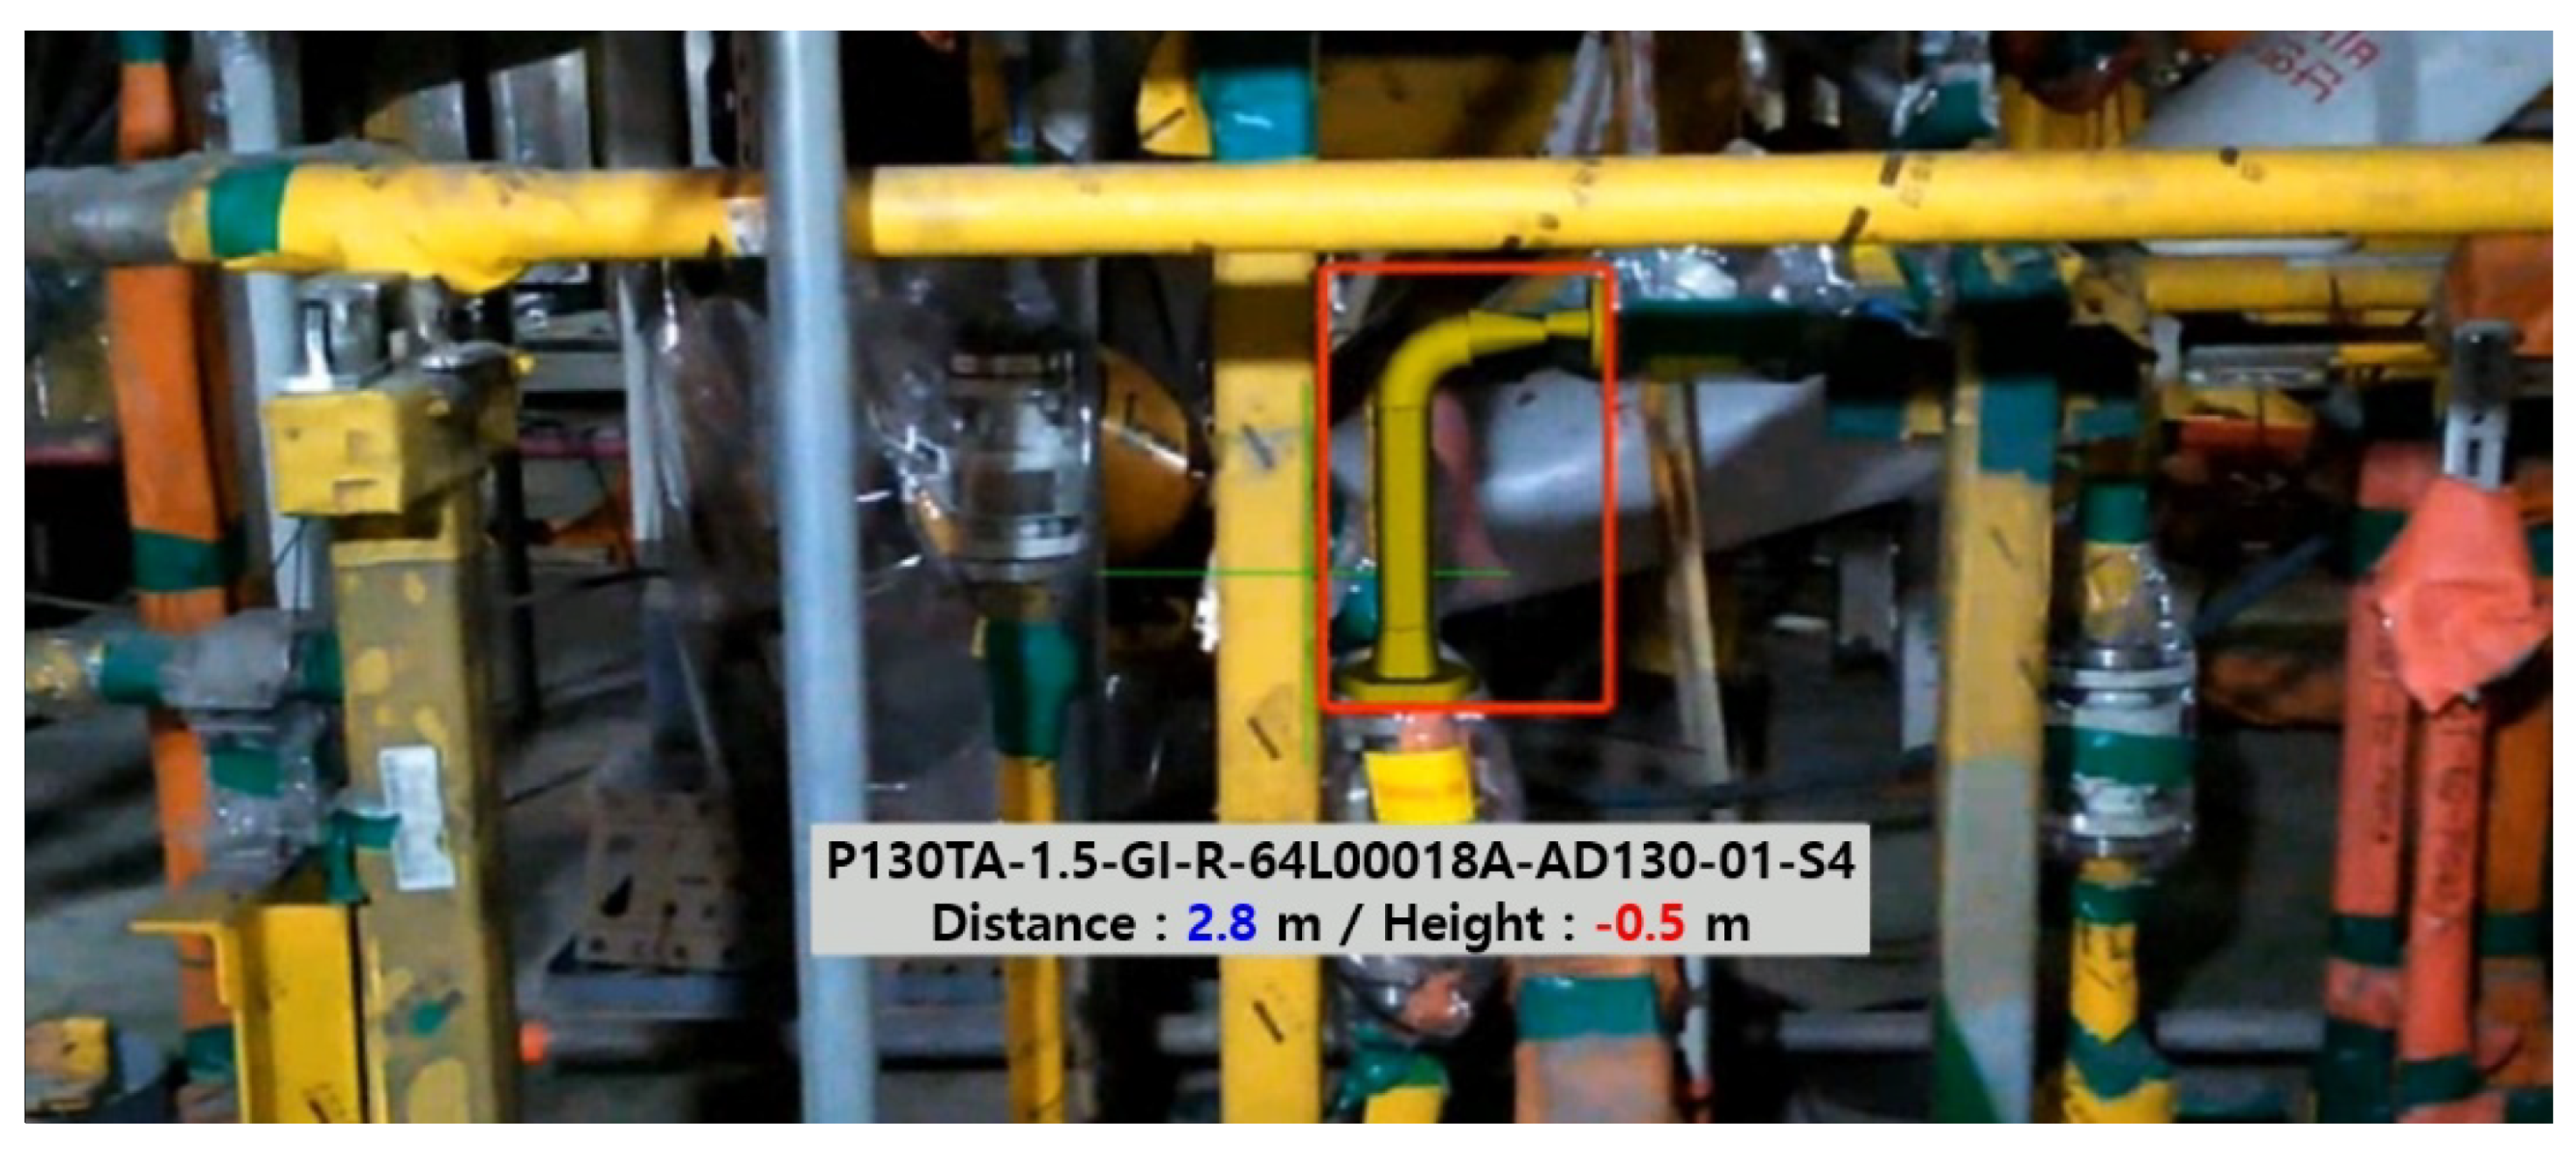
7.3. Fabrication Support
7.4. Inspection Support
7.5. Process Management
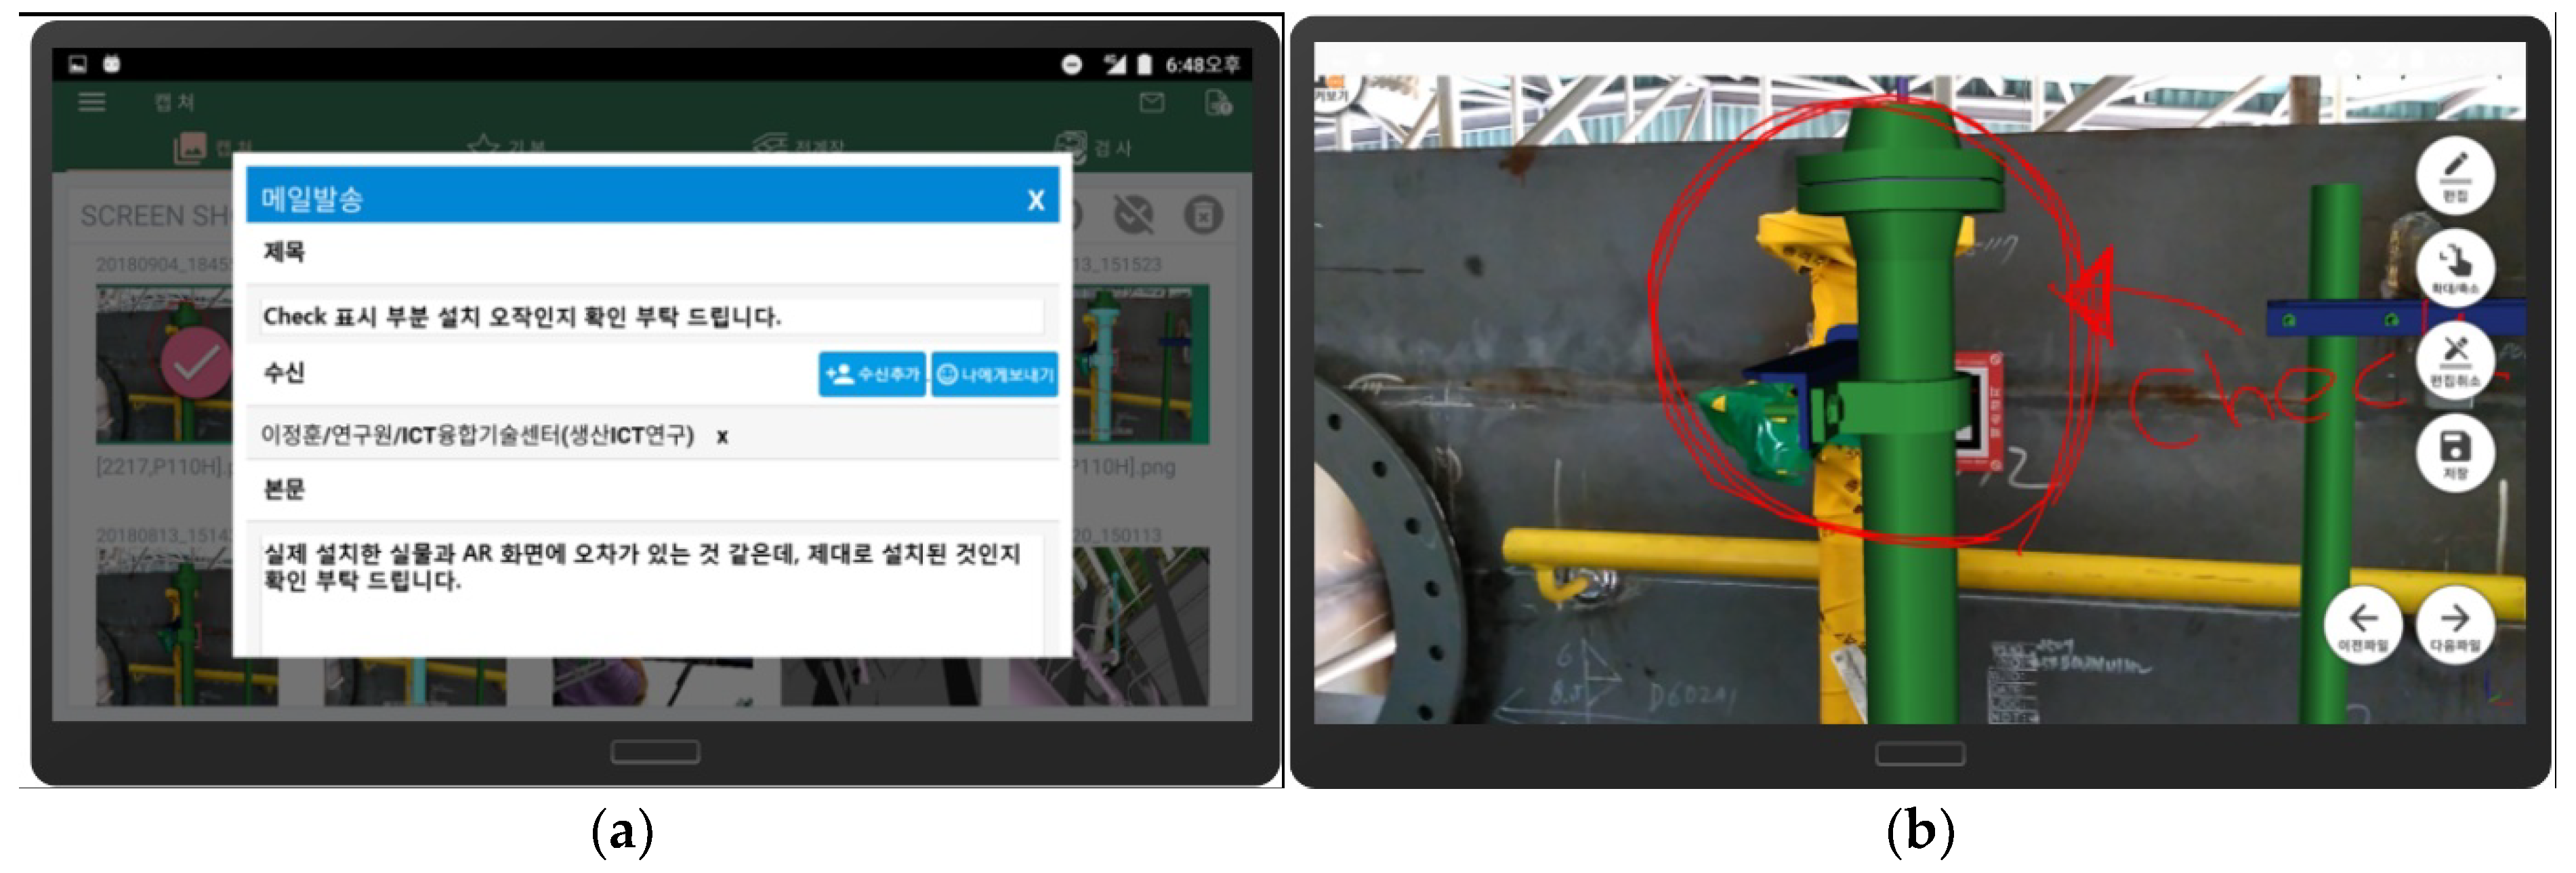
7.6. Issue Sharing
8. Conclusions
Author Contributions
Funding
Institutional Review Board Statement
Informed Consent Statement
Data Availability Statement
Conflicts of Interest
References
- Goldman Sachs Global Investment Research Technical Report: Virtual and Augmented Reality—Understanding the Race for the Next Computing Platform. Available online: http://www.goldmansachs.com/our-thinking/pages/technology-drivinginnovation-folder/virtual-and-augmented-reality/report.pdf (accessed on 15 January 2021).
- Sutherland, I.E. The ultimate display. In Proceedings of the International Federation for Information Processing (IFIP), New York, NY, USA, 24–29 May 1965; pp. 506–508. [Google Scholar]
- Caudell, T.P.; Mizell, D.W. Augmented reality: An application of heads-up display technology to manual manufacturing processes. In Proceedings of the 25th Hawaii International Conference on System Sciences (HICSS), Kauai, HI, USA, 7–10 January 1992; pp. 659–669. [Google Scholar]
- Friedrich, W. ARVIKA-augmented reality for development, production and service. In Proceedings of the International Symposium on Mixed and Augmented Reality (ISMAR), Darmstadt, Germany, 30 September–1 October 2002; pp. 3–4. [Google Scholar]
- Fraga-Lamas, P.; Fernandez-Carames, T.M.; Blanco-Novoa, O.; Vilar-Montesinos, M.A. A review on industrial augmented reality systems for the industry 4.0 shipyard. IEEE Access 2018, 6, 13358–13375. [Google Scholar] [CrossRef]
- ABI Research’s Machine Vision in Augmented and Virtual Reality Markets Report. Available online: https://www.abiresearch.com/press/ar-vr-and-mobile-device-shipments-embedded-vision-/ (accessed on 15 January 2021).
- Agati, S.S.; Bauer, R.D.; Hounsell, M.D.S.; Paterno, A.S. Augmented Reality for Manual Assembly in Industry 4.0: Gathering Guidelines. In Proceedings of the 22nd International Symposium on Virtual and Augmented Reality (SVR), Porto de Galinhas, Brazil, 7–10 November 2020; pp. 179–188. [Google Scholar]
- Caricato, P.; Colizzi, L.; Gnoni, M.G.; Grieco, A.; Guerrieri, A.; Lanzilotto, A. Augmented reality applications in manufacturing: A multi-criteria decision model for performance analysis. In Proceedings of the 19th World Congress on International Federation of Automatic Control, Cape Town, South Africa, 24–29 August 2014; pp. 754–759. [Google Scholar]
- Wuest, H.; Engekle, T.; Wientapper, F.; Schmitt, F.; Keil, J. From cad to 3D tracking: Enhancing scaling model-based tracking for industrial appliances. In Proceedings of the International Symposium on Mixed and Augmented Reality (ISMAR), Merida, Mexico, 19–23 September 2016; pp. 346–347. [Google Scholar]
- Olbrich, M.; Wuest, H.; Riess, P. Augmented reality pipe layout planning in the shipbuilding industry. In Proceedings of the International Symposium on Mixed and Augmented Reality (ISMAR), Basel, Switzerland, 26–29 October 2011; pp. 269–270. [Google Scholar]
- Nee, A.; Ong, S.; Chryssolouris, G.; Mourtzis, D. Augmented reality applications in design and manufacturing. CIRP Ann. 2012, 61, 657–679. [Google Scholar] [CrossRef]
- Paelke, V. Augmented reality in the smart factory: Supporting workers in an industry 4.0. environment. In Proceedings of the 19th IEEE International Conference on Emerging Technologies and Factory Automation (ETFA), Barcelona, Spain, 16–19 September 2014; pp. 1–4. [Google Scholar]
- Leu, M.C.; ElMaraghy, H.A.; Nee, A.Y.C.; Ong, S.K.; Lanzetta, M.; Putz, M.; Zhu, W.; Bernard, A. Cad model based virtual assembly simulation, planning and training. CIRP Ann. Manuf. Technol. 2013, 62, 799–822. [Google Scholar] [CrossRef]
- Evans, G.; Miller, J.; Pena, M.I.; MacAllister, A.; Winer, E. Evaluating the Microsoft HoloLens through an augmented reality assembly application. In Proceedings of the SPIE Security + Defense 2017, Warsaw, Poland, 11–14 September 2017; Volume 10197. [Google Scholar]
- Wang, X.; Ong, S.K.; Nee, A.Y.C. A comprehensive survey of augmented reality assembly research. Adv. Manuf. 2016, 4, 1–22. [Google Scholar] [CrossRef]
- Holloway, R.L. Registration error analysis for augmented reality. Presence 1997, 6, 413–432. [Google Scholar] [CrossRef]
- Gherghina, A.; Olteanu, A.; Tapus, N. A marker-based augmented reality system for mobile devices. In Proceedings of the 11th RoEduNet International Conference, Sinaia, Romania, 17–19 January 2013; pp. 1–6. [Google Scholar]
- Lim, C.; Kim, C.; Park, J.; Park, H. Mobile Augmented Reality Based on Invisible Marker. In Proceedings of the International Symposium on Mixed and Augmented Reality (ISMAR), Merida, Mexico, 19–23 September 2016; pp. 78–81. [Google Scholar]
- Basiratzadeh, S.; Lemaire, E.D.; Baddour, N. Augmented Reality Approach for Marker-based Posture Measurement on Smartphones. In Proceedings of the 42th Annual International Conference of the IEEE Engineering in Medicine & Biology Society (EMBC), Montreal, QC, Canada, 20–24 July 2020; pp. 4612–4615. [Google Scholar]
- Engel, J.; Schöps, T.; Cremers, D. LSD-SLAM: Large-Scale Direct Monocular SLAM. In Proceedings of the European Conference on Computer Vision (ECCV), Zürich, Switzerland, 6–12 September 2014. [Google Scholar]
- Mur-Artal, R.; Tardós, J.D. ORB-SLAM2: An Open-Source SLAM System for Monocular. IEEE Trans. Robot. 2017, 33, 1255–1262. [Google Scholar] [CrossRef]
- Engel, J.; Koltun, V.; Cremers, D. Direct Sparse Odometry. IEEE Tans. Pattern Anal. Mach. Intell. 2018, 40, 611–625. [Google Scholar] [CrossRef]
- Frigo, M.A.; da Silva, E.C.C.; Barbosa, G.F. Augmented Reality in Aerospace Manufacturing: A Review. J. Ind. Intell. Inf. 2016, 4, 125–130. [Google Scholar] [CrossRef]
- Google Developer Website. Available online: https://developers.google.com/project-tango (accessed on 14 February 2017).
- Davison, A.J.; Reid, I.; Stasse, O. MonoSLAM: Real-Time Single Camera SLAM. IEEE Trans. Pattern Anal. Mach. Intell. 2007, 29, 1052–1067. [Google Scholar] [CrossRef] [PubMed]
- Romero-Ramirez, F.J.; Muñoz-Salinas, R.; Medina-Carnicer, R. Speeded Up Detection of Squared Fiducial Markers. Image Vision Comput. 2018, 76, 38–47. [Google Scholar] [CrossRef]
- Otsu, N. A Threshold Selection Method from Gray-level Histograms. IEEE Trans. Syst. Man Cybern. 1979, 9, 62–66. [Google Scholar] [CrossRef]
- Teh, C.H.; Chin, R.T. On the Detection of Dominant Points on Digital Curve. IEEE Trans. Pattern Anal. Mach. Intell. 1989, 11, 859–872. [Google Scholar] [CrossRef]
- Penate-Sanchez, A.; Andrade-Cetto, J.; Moreno-Noguer, F. Exhaustive Linearization for Robust Camera Pose and Focal Length Estimation. IEEE Trans. Pattern Anal. Mach. Intell. 2013, 35, 2387–2400. [Google Scholar] [CrossRef] [PubMed]
- Levenberg, K. A Method for the Solution of Certain Non-Linear Problems in Least Squares. Quart. Appl. Math. 1944, 2, 164–168. [Google Scholar] [CrossRef]
- Wu, C.; Agarwal, S.; Curless, B.; Seitz, S.M. Multicore Bundle Adjustment. In Proceedings of the IEEE Conference on Computer Vision and Pattern Recognition (CVPR), Colorado Springs, CO, USA, 20–25 June 2011. [Google Scholar]
- Alcantarilla, P.F.; Bartoli, A.; Davison, A.J. KAZE Features. In Proceedings of the European Conference on Computer Vision (ECCV), Firenze, Italy, 7–13 October 2012. [Google Scholar]
- Hartley, R.; Zisserman, A. Multiple View Geometry in Computer Vision, 2nd ed.; Cambridge University Press: Cambridge, UK, 2003; pp. 239–259. [Google Scholar]


| Experiment Title | # of Images | # of Markers | Moving Distance (In Meters) | Re-Projection Error (In Pixels) | |||
|---|---|---|---|---|---|---|---|
| Min | Max | Mean | StdDev | ||||
| Deck #1 | 946 | 12 | 580.28 | 0.41 | 2.71 | 1.06 | 0.64 |
| Deck #2 | 655 | 10 | 381.21 | 0.22 | 1.57 | 0.98 | 0.41 |
| Deck #3 | 761 | 10 | 422.87 | 0.38 | 1.46 | 0.95 | 0.43 |
| Self-Navigation | Fabrication | Inspection | Process | Issue | |
|---|---|---|---|---|---|
| Support | Support | Management | Sharing | ||
| Quality Control | ✓ | ✓ | ✓ | ||
| Pre-Outfitting | ✓ | ✓ | ✓ | ✓ | |
| Electrical Installation | ✓ | ✓ | ✓ |
| Participants | Purpose of Use | Average Working Time (in min) | Efficiency | |
|---|---|---|---|---|
| Before | After | |||
| Advanced Manager #1 | Installation interference check | >40 | <15 | >2.7× |
| Advanced Manager #2 | Workload estimation | >180 | <60 | >3.0× |
| Installation error check | >480 | <60 | >8.0× | |
| Working records verification | >480 | <60 | >8.0× | |
| Advanced Manager #3 | Installation error check | >120 | <80 | >1.5× |
Publisher’s Note: MDPI stays neutral with regard to jurisdictional claims in published maps and institutional affiliations. |
© 2021 by the authors. Licensee MDPI, Basel, Switzerland. This article is an open access article distributed under the terms and conditions of the Creative Commons Attribution (CC BY) license (http://creativecommons.org/licenses/by/4.0/).
Share and Cite
Choi, S.; Park, J.-S. Development of Augmented Reality System for Productivity Enhancement in Offshore Plant Construction. J. Mar. Sci. Eng. 2021, 9, 209. https://doi.org/10.3390/jmse9020209
Choi S, Park J-S. Development of Augmented Reality System for Productivity Enhancement in Offshore Plant Construction. Journal of Marine Science and Engineering. 2021; 9(2):209. https://doi.org/10.3390/jmse9020209
Chicago/Turabian StyleChoi, Sungin, and Jung-Seo Park. 2021. "Development of Augmented Reality System for Productivity Enhancement in Offshore Plant Construction" Journal of Marine Science and Engineering 9, no. 2: 209. https://doi.org/10.3390/jmse9020209
APA StyleChoi, S., & Park, J.-S. (2021). Development of Augmented Reality System for Productivity Enhancement in Offshore Plant Construction. Journal of Marine Science and Engineering, 9(2), 209. https://doi.org/10.3390/jmse9020209