Article

Assessment of the Performance of an Artificial Reef Made of Modular Elements through Small Scale Experiments

by
Dea Cardenas-Rojas
1,2,
Edgar Mendoza
2,*,
Mireille Escudero
2 and
Manuel Verduzco-Zapata
1
1
Facultad de Ciencias Marinas, Universidad de Colima, Manzanillo, Colima 28860, Mexico
2
Instituto de Ingeniería, Universidad Nacional Autónoma de México, Mexico City 04510, Mexico
*
Author to whom correspondence should be addressed.
J. Mar. Sci. Eng. 2021, 9(2), 130; https://doi.org/10.3390/jmse9020130
Submission received: 12 January 2021 / Revised: 22 January 2021 / Accepted: 24 January 2021 / Published: 28 January 2021
(This article belongs to the Special Issue Breakwater Behaviour)

Abstract

:
Artificial reefs have proven to be an optimal and effective solution in stabilizing coastlines around the world. They are submerged structures that imitate the protection service provided by natural reefs accomplishing the functions of dissipating wave energy and protecting beach morphology, but also being an ecological solution. In this paper, 2D small-scale experiments were performed to analyze the hydrodynamic, morphological, and ecological behavior of an artificial reef constructed of modular elements. Two typical beach-dune profiles were constructed in a wave flume over which two locations of an artificial reef were tested. From these tests, transmission coefficients were obtained as well as the beach profile response to the presence of the artificial reef. These results are used to discuss about the hydrodynamic, morphological, and ecological performance of the artificial reef. The proposed artificial reef showed good morphological performance while its hydrodynamic function had limited success. In turn, the ecologic performance was theoretically addressed.

1. Introduction

Coastal areas hold some of the most dynamic and shifting ecosystems in the world. This, and the ever-growing human occupation of the coast, has led to the need to protect the coast [1]. Nevertheless, many beaches around the world are currently affected by serious erosion problems [2]. These processes are due to many causes; some of them occur in large time scales, for example, those related to climate change that has resulted in a greater risk of flooding under extreme wave conditions [3]. There are other natural phenomena that modify the coast in lesser time spans, for example, the huge energy discharged on the coast by extreme events such as hurricanes. Occasionally, after those events, the sediment budget of the beach results permanently broken and cannot be naturally restored; then, the erosion process can become chronic. Arguably, the most efficient driver of coastal erosion is human activity. The construction of a diversity of barriers to assist navigation and provide shelter, modifies the direction of currents and waves, thus creating areas of erosion. Regardless of its origin, coastal erosion must be addressed, since the consequences of narrowing the coastal strip are dire for the physical, environmental, and social ambits [4].
In this sense, coastal protection is transforming into a more complex and complete practice, in which engineers are asked to offer solutions that are, at least, friendly with the natural, economic, and social elements in the particular region of interest. Given this, artificial barriers designed to protect the coast can be integrated in different types of solutions depending on the available space, location and the social urgency of its placement. An example of one of these solutions is the use of artificial coral reefs, i.e., submerged structures placed on the substratum (seabed) deliberately, to mimic some characteristics of a natural reef [5].
Artificial reefs have been used around the world mainly for habitat restoration [6,7] and beach erosion control [8,9]. Comprehensive reviews on their design and performance as well as on their ecologic and socioeconomic trends can be found in Baine 2001 [10] and Silva et al. 2019 [11]. From the literature review it can be stated that the success of these structures depends on their capacity to replicate three main functions: hydrodynamic, morphological, and ecological. A brief description of each is presented next.

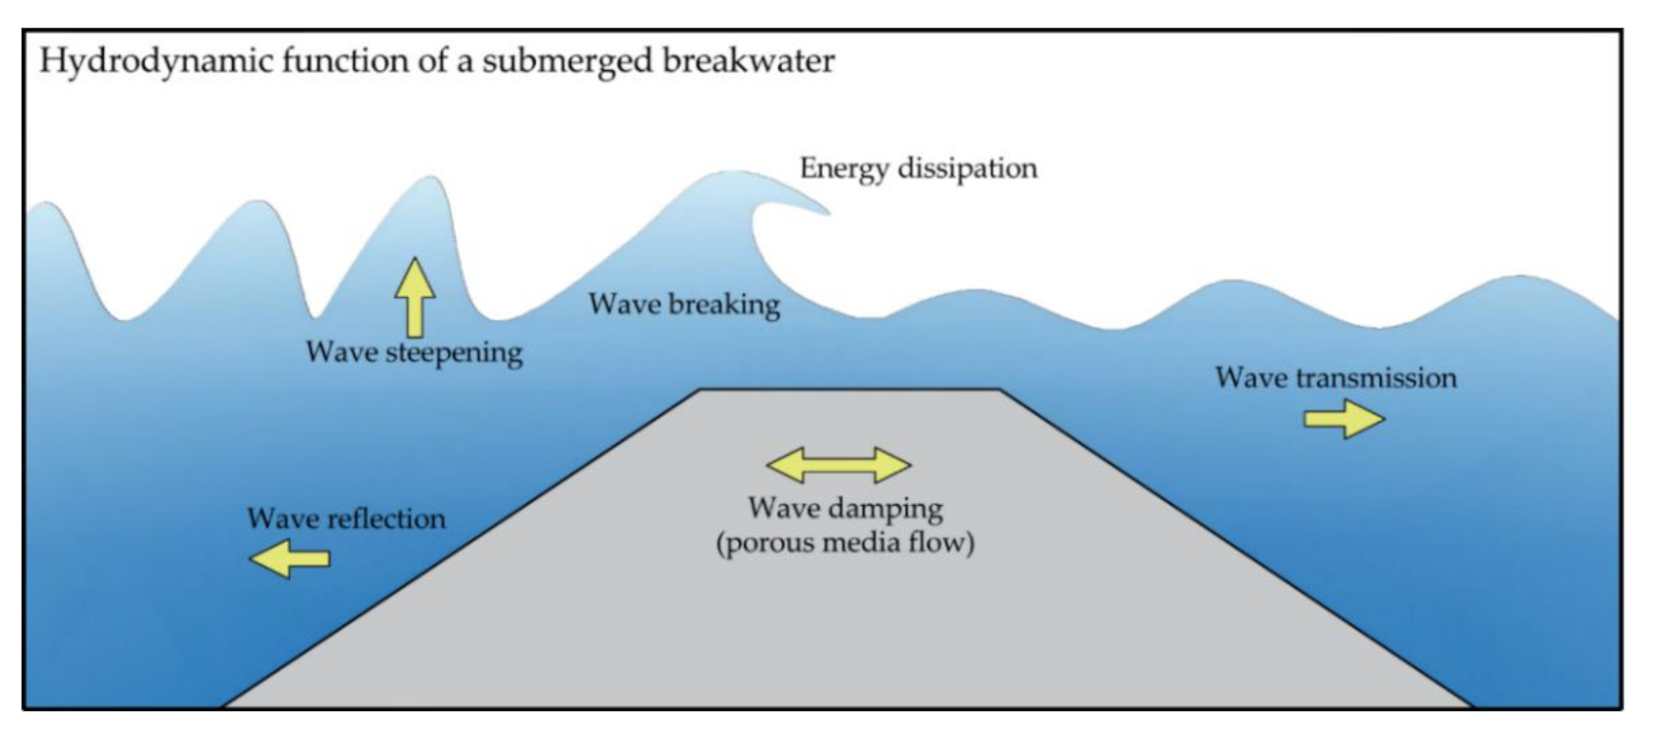
1.1. Hydrodynamic Function

The main hydrodynamic effect to be reproduced with an artificial one, is the control of the energy of the waves that attack the beach. Although the interaction between the complex structure of the coral and the water flow in the ocean is difficult to understand and characterize, it is possible to identify a group of characteristics whose occurrence is indicative of a proper functioning of the artificial reef barrier. In short, the goal to be achieved is causing as little agitation as possible on the protected side of the structure [12]. This can be quantified as a low transmission coefficient, which can be defined as the proportion of waves on the protected side of the structure with respect to those that originally reached the coast [13]. Following the conservation of energy law, the mechanisms of energy transformation that occur when waves interact with an obstacle are reflection, steepening, breakage, and dissipation. The transformation of energy due to an artificial reef is a combination of the characteristics of the flow, the local environment and the geometry of the structure. Thus, submerged structures high enough with respect to the water depth, will cause the breakage of a high percentage of the waves and with it, a greater dissipation of energy (Figure 1). On the other hand, structures with low porosity will tend to produce greater reflection. A special case occurs when the water depth above the structure is large and therefore the percentage of broken waves is low; here it can happen that waves propagate over the structure without breaking and the potential energy of the waves that reach the beach is greater than that without the barrier.
In general, it is preferable to dissipate the energy by wave breaking and turbulence over keeping it in the flow. An additional energy dissipation mechanism is caused by interstitial flow, where the complexity of the reef plays a fundamental role. In structures built with traditional elements such as rocks or concrete cubes this flow is not very important because of the low porosity. When the artificial reef is manufactured with elements with important cavities, this mechanism becomes more relevant.

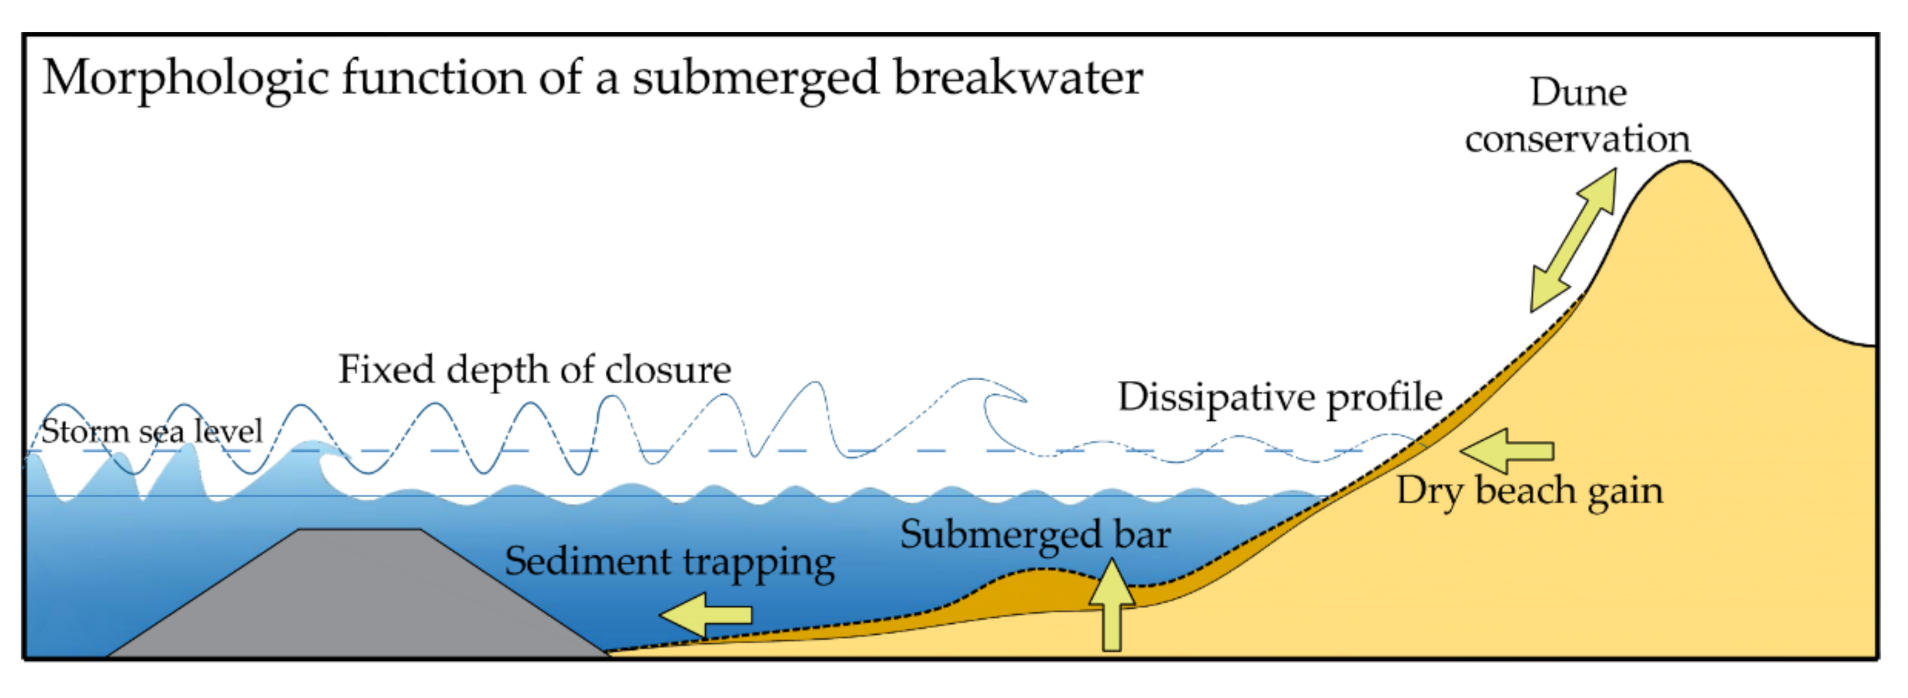
1.2. Morphological Function

The morphological function refers to the effects produced by the placement of the barrier in the beach profile, in other words, its intervention in the sediment budget of the beach. The construction of the structure alone means an interruption to the beach profile, that is, the depth of closure is arbitrarily fixed and with it, the length and shape of the profile. A first effect, given the low or null permeability of the base of the barrier is that it serves as a trap for the cross-shore sediment transport [14]. In a sense, this function could be sufficient in places where the beach is exposed to storms and the presence of the barrier facilitates the maintenance of the beach by having a fixed and protected site from where to take material to fill the beach recurrently. In conditions of medium regime, the breaking of the waves occurs on the crest of the structure, which provides a calm zone. In the case of extreme events, when the sea level rises, wave breaking occurs near the coast and the sediment trapped between the coast and the structure tends to form bars which, when the storm passes, contribute to the protection of the beach [15]. The morphological function includes the gain of dry beach due to the arrival of suspended sediment (hanging profile) combined with a lower ability to carry sediment. The new profile may have a slightly larger slope than the original profile, just like the grain size. As a result of the decrease in the wave energy that attacks the beach, the flow over the profile reduces its travelling distance and with it, the maximum ascent. This characteristic prevents water from reaching the upper part of the dunes, favoring its conservation, allowing the growth and establishment of vegetation and, ultimately, preventing flooding (Figure 2).

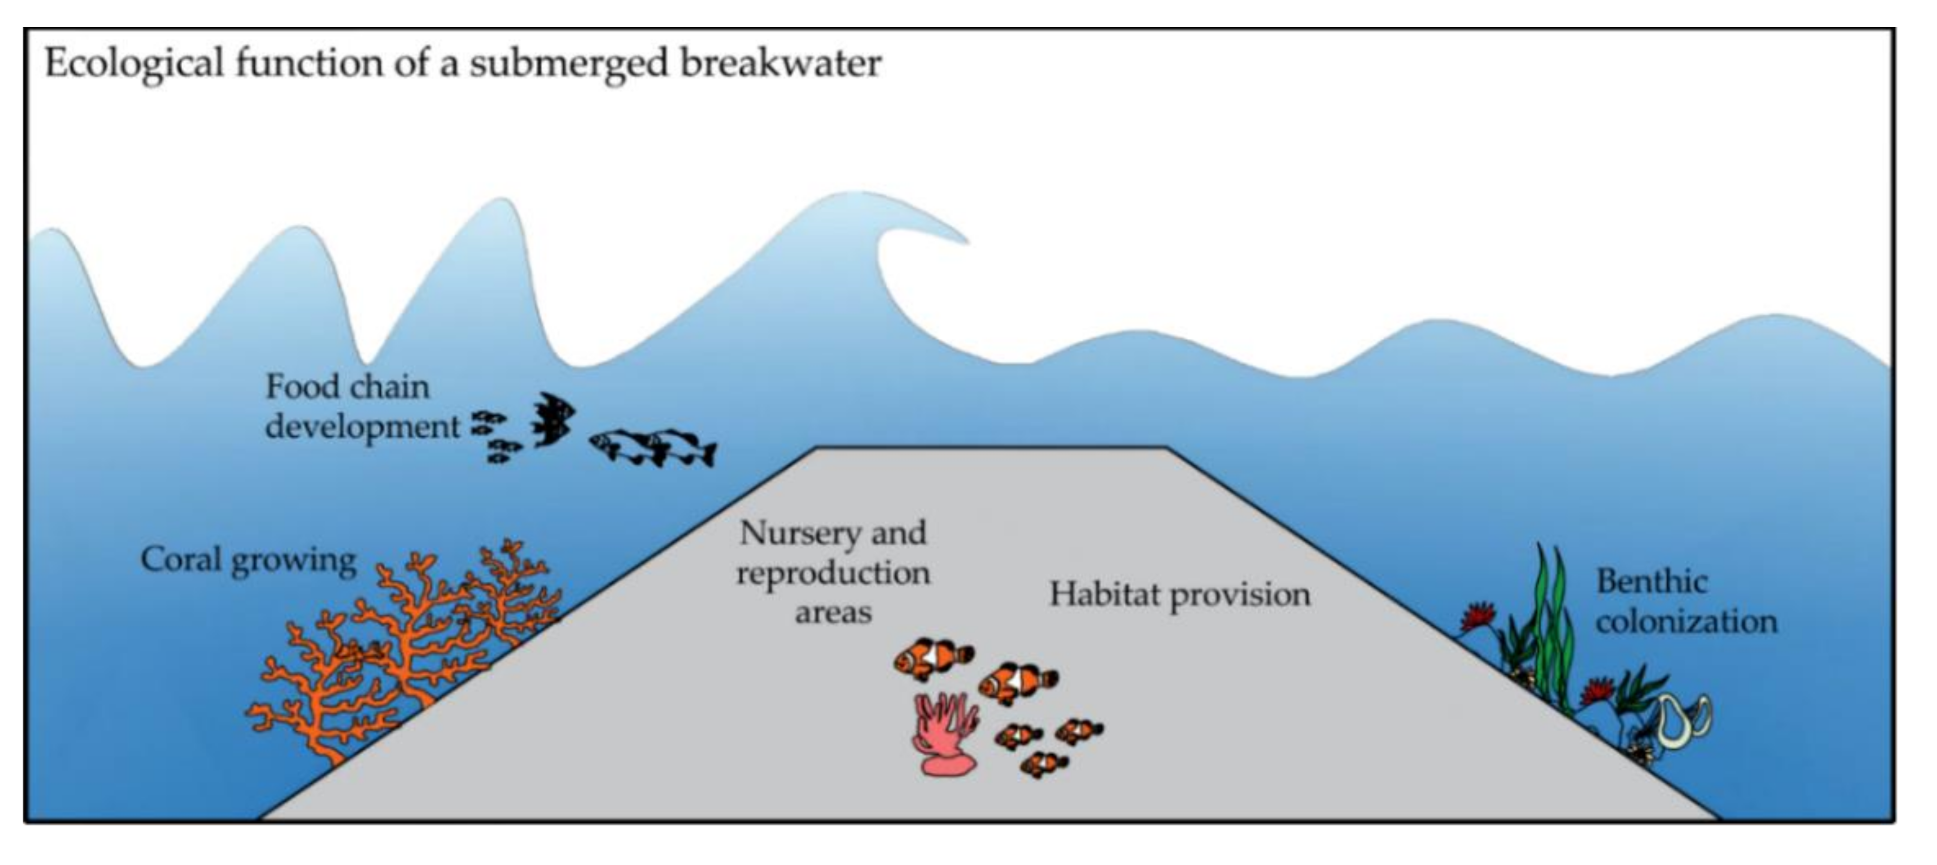
1.3. Ecological Function

The ecological function of a submerged breakwater is its relationship with marine organisms and the ecosystems. This function is what, mainly, can give a barrier of coastal protection the character of an artificial reef, since it is the mechanism by which it can imitate complex natural structures (Figure 3). The main ecological aspect that is sought by constructing submerged breakwaters is the provision of a space that can be colonized by a variety of marine species. Organisms with swimming capacities that seek refuge will be among the first to occupy cavities and interstices. From there, more or less diverse communities will be developed depending on the characteristics of the site. If hydrodynamic conditions (currents and turbulence) and water quality (temperature and nutrients) permit it, some species will find sufficient calm and safety to use the barrier as a breeding area [16]. At the same time, the benthic colonization will begin; that is, the fixation and growth of algae and other species (polychaetes, bryozoans, barnacles, hydrozoans, ascites, among others). Faced with a successful colonization, there would be the beginning of a succession process and a food chain dominated by invertivores, planktivorous, and some secondary consumers. In specific and relatively rare situations, colonization would include the growth of polyps of different coral species, which would mark the maximum success in imitating the performance of a natural barrier.
In the recent decades, several types, shapes, and materials of construction have been developed and used for coastal protection and/or conservation. Extensive reviews have been previously performed, such as [17,18] regarding artificial reef (submerged breakwater) design, [19] concerning shoreline response, and [10,20] related to the ecological function. As a result, various studies have been conducted to assess and improve the hydrodynamic [21,22], morphological [8,23], and ecological [24,25] functions; some few works address two functions together, e.g., [26]. It is worth mentioning that the methodologies and data used to evaluate each function have not changed much in time, which evidences some homogeneity in the field. Nevertheless, there are scarce or none artificial reef developments and their corresponding assessments, focused on mimicking and evaluating the three functions simultaneously.
The approach proposed here is to evaluate each function following known methodologies in order to keep comparability but the emphasis is set into the simultaneous performance. It has to be noted that it is impossible to reproduce the ecological function in laboratory conditions, so it will be assessed theoretically and based on the available specialized literature.
In this work, a recently developed modular element designed for artificial reef construction is presented. The artificial reefs made of them, are intended to provide the three functions previously described. Therefore, the main goal of the research presented here is to use this artificial reef as an example for the simultaneous assessment proposed. To achieve this, Section 2 describes the modular element and the experimental work conducted. Section 3 shows the results regarding each function to be mimicked and its evaluation. Finally, the discussion and conclusions highlight the need for an objective and quantitative tool for the simultaneous assessment of the artificial reefs’ performance; a simple threefold Artificial Reef Performance Index is proposed.

2. Materials and Methods

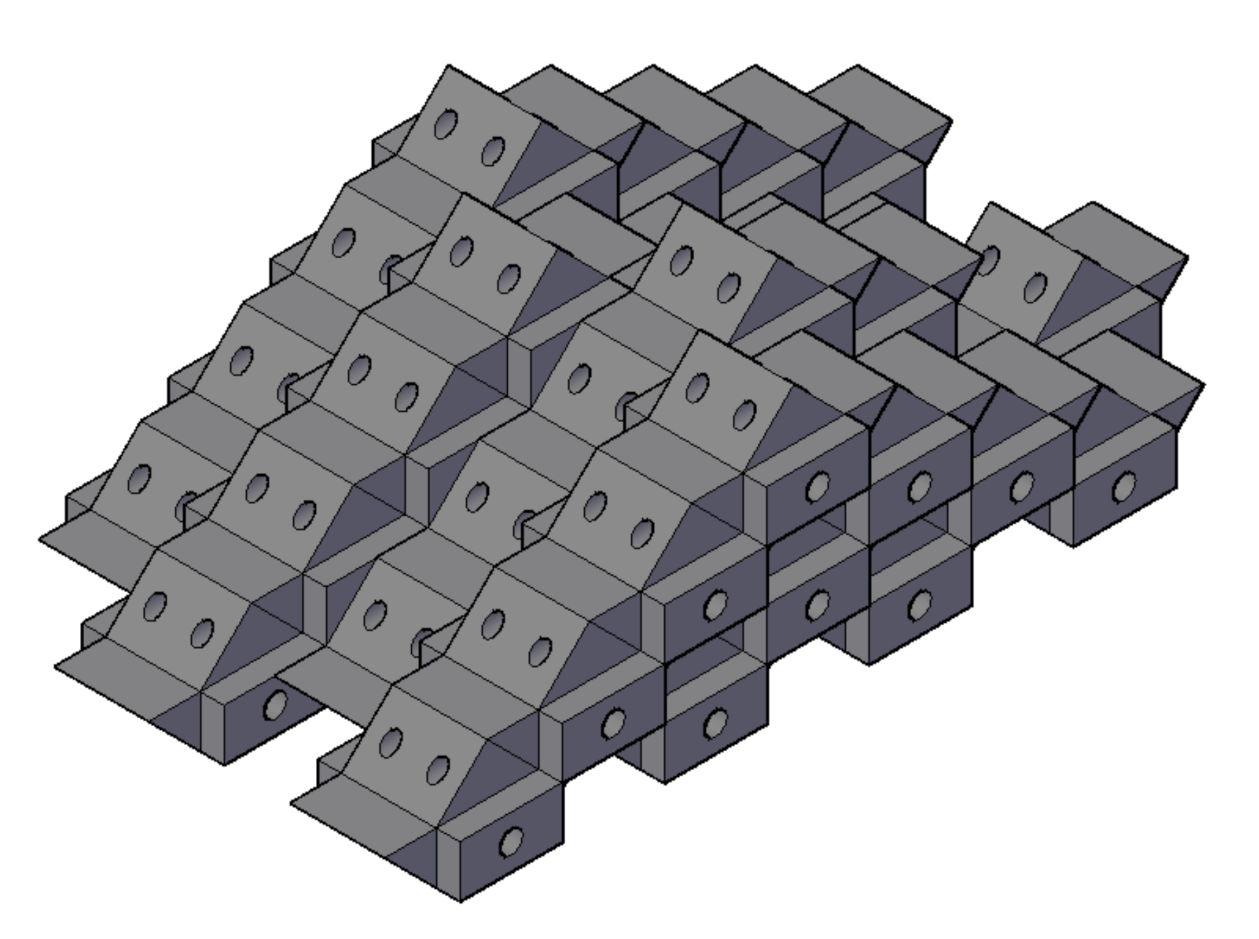
2.1. Modular Element Description

The geometry of the modular elements combines trapezoidal, rectangular, and triangular prisms, as can be seen in Figure 4. This geometry allows staggering elements from one horizontal layer to the above. In turn, this means that the construction strategy is to place the elements one by one. The seaside face of the armor units is shown in Figure 4b. Furthermore, for construction simplicity, the angles of the pieces are limited to 45 and 90°. In order to reduce the weight and total volume of the material needed for the construction of each unit as well as to provide ecological functions, five holes are distributed in the element (3 in the bottom face and 2 in the top).
The prototype dimensions of the proposed element are 1.2 m high and 2.4 m between its front and rear edges. The holes are 20 and 40 cm in diameter in the upper and bottom part, respectively. Given the pyramidal shape of the structure and the staggered placement of the modules, the crest width of the artificial reef is equivalent to two times the length of the modules, which is 4.8 m. The elements are thought to be fabricated with unreinforced concrete. Once some layers are placed, the resulting structure shows a slope of approximately 1:1.75 (V:H) that features high roughness, surface hollows, high stability, and partial permeability all of which are prone for habitat provision [27,28]. An example of an artificial reef made of these elements is shown in Figure 5.

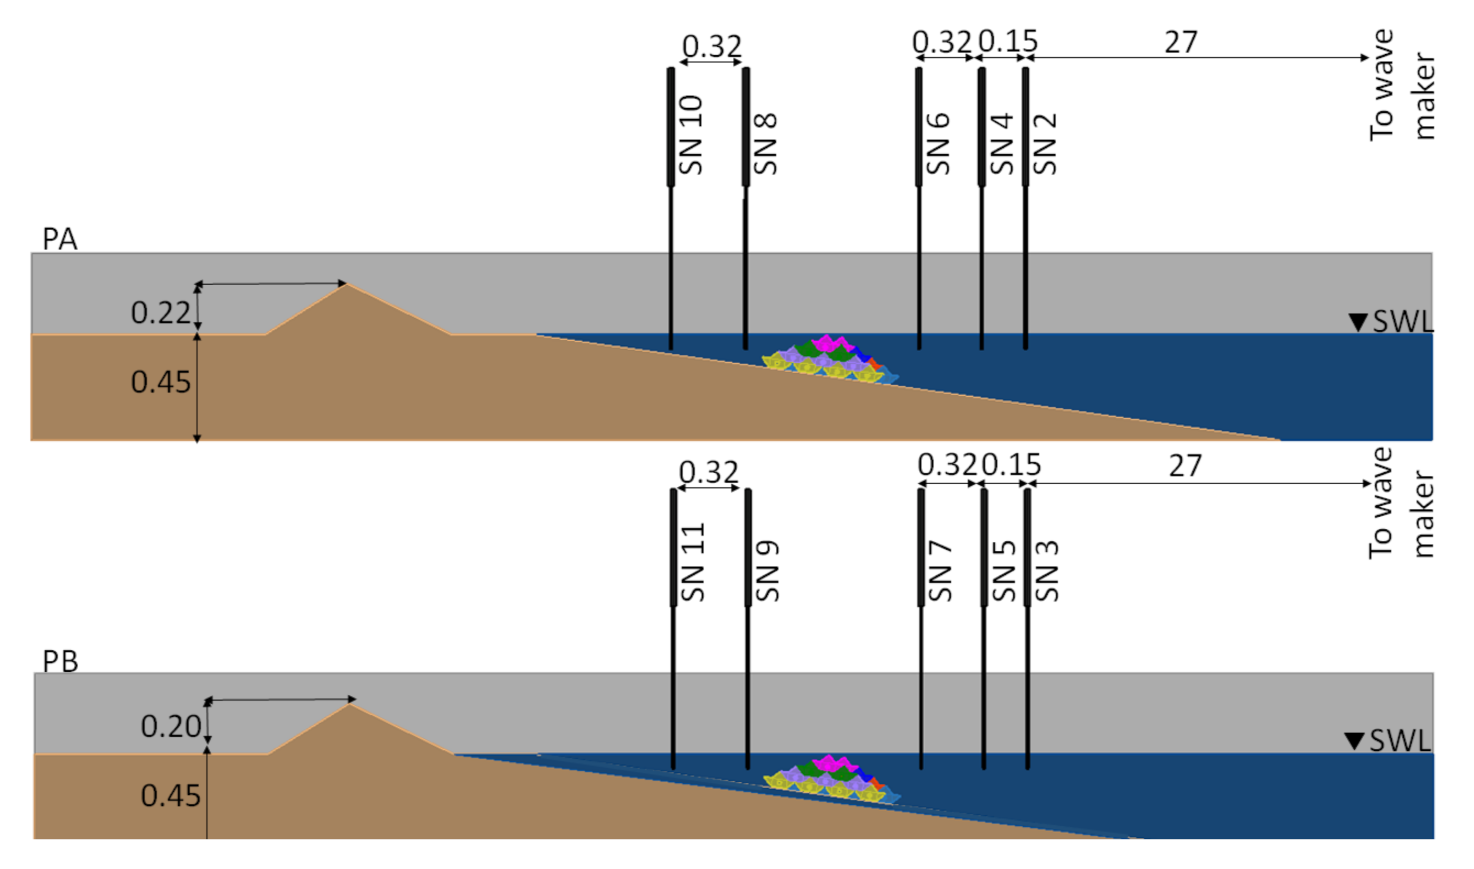
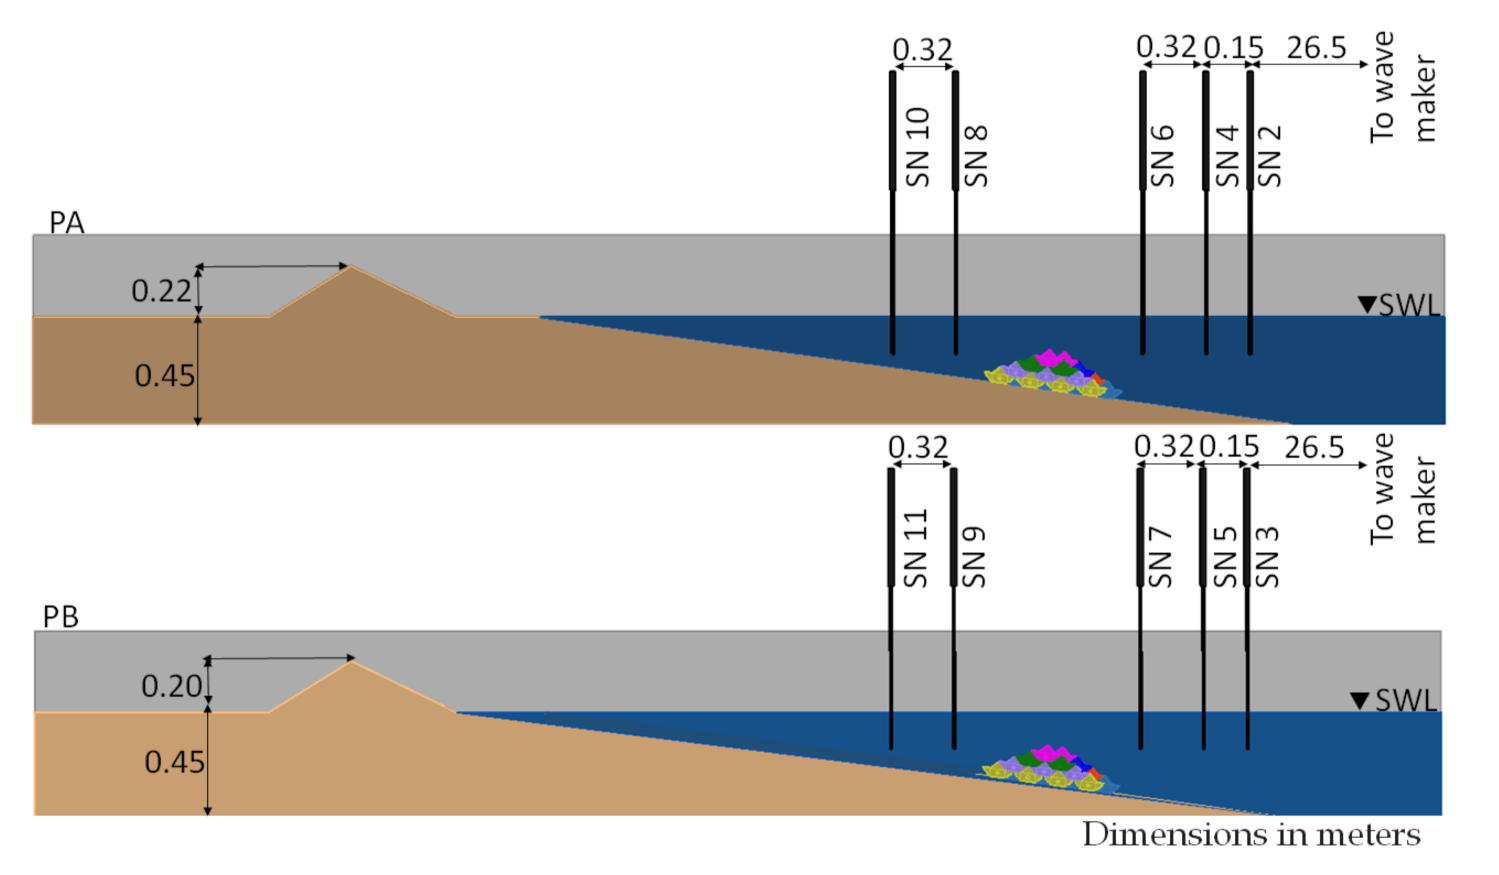
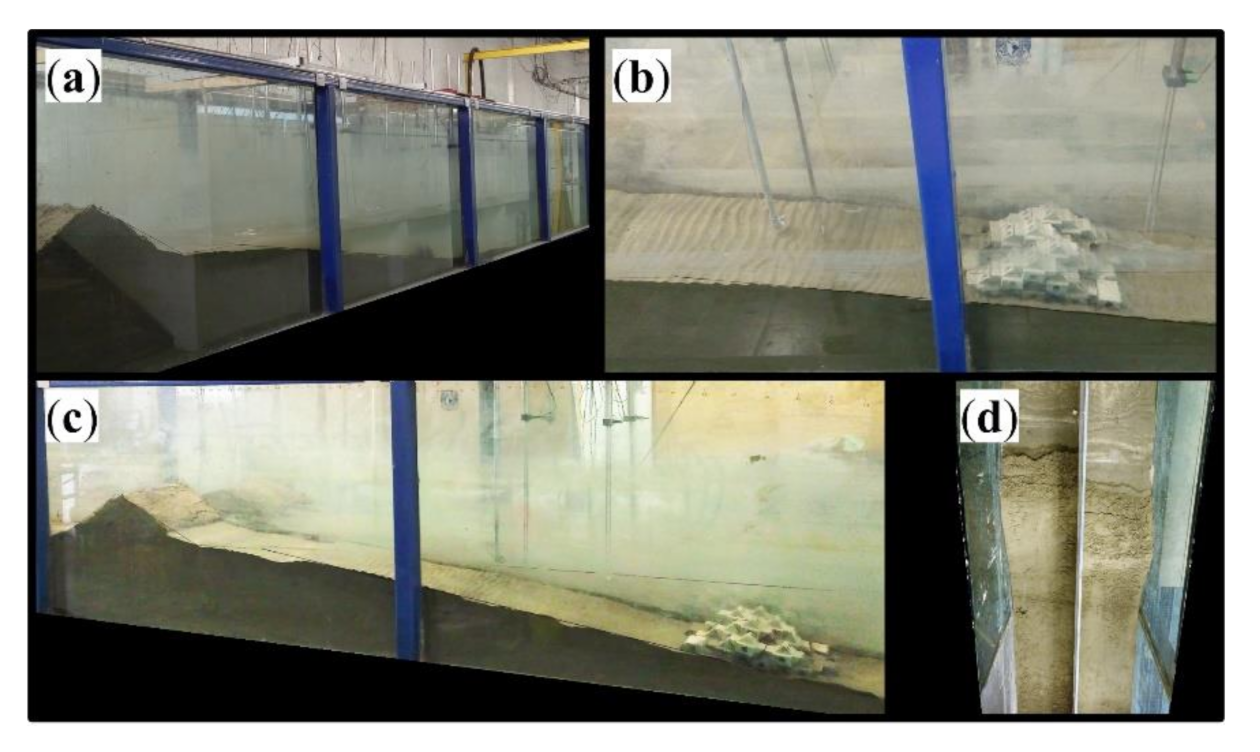
2.2. Experimental Set-Up and Procedure

The small-scale tests (scale factor 1:20 and Froude scaling) were conducted at the Laboratory of Ports and Coasts at UNAM. There, the wave flume (37.0 × 0.80 × 1.20 m) has a piston type wave-maker with an active wave absorption system attached to the paddle, which was activated to avoid multi-reflections. The wave maker is able to generate waves from 0.02 to 0.4 m in height and periods from 0.8 to 4.0 s. The wave flume was divided into two for the last 8.0 m of its length, in order to analyze the response of two beach-dune profiles simultaneously, namely, PA and PB. The division was made with a 1 cm thick acrylic sheet and it was previously tested not to produce significant cross waves or wave diffraction. The submerged part of both profiles had a gentle slope of 1/32 from the bottom of the flume to a depth of 8.5 cm below the still water level (SWL). From there, PA had a second slope of 1/7 until 2 cm above the SWL were reached; then a horizontal berm, 35 cm long, extended to the toe of the dune which rose up to 22 cm above the SWL, with a 1/2.25 slope. The lee of the dune had a 1/1.36 slope which descended to reach the SWL. In turn, from 8.5 cm depth, PB had a 1/9 slope until 5 cm above the SWL were reached. From there a dune face rose with a 1/4.6 slope up to 20 cm above the SWL and the lee of the dune descended with a 1/2.75 slope to reach again the SWL. Behind the dunes a horizontal section was left and a vertical impermeable wall was placed behind. PA is similar to that tested by [29] and PB is a representative profile of those found on the Mexican coast of the Gulf of Mexico (see Figure 6 and Figure 7); further details were described in [30]. These profiles let study and compare the response of morphological elements such as a horizontal berm versus a homogeneous slope and different widths and heights of the dune to the presence of the artificial reef. The sand used in the tests was brought from Tuxpan, Veracruz, Mexico. This sand has a diameter, D50, of 0.142 mm, contains 6% of fine material, uniformity coefficient of 1.42 and specific gravity of 2.7.
Eleven capacitive wave gauges, SN, were used to measure the water free surface elevation. SN1 was placed before the flume division (approx. 2 wave lengths from the wave maker). The water elevation over PA was measured with SN2, SN4 and SN6 which were placed following Baquerizo’s recommendations for incident and reflected wave separation [31]. SN8 and SN10 recorded the water elevation at the lee of the structure. In turn, SN3, SN5 and SN7 recorded the water elevation over PB; while SN9 and SN11 measured at the lee side of the corresponding structure.
Free surface elevation was measured at 100 Hz along each test. Topographic data was recorded before and after each test using a laser total station and recording elevations every 0.05 m along each profile.
Three scenarios with two different locations of the artificial reef along the beach profile were considered for each beach profile: (1) without structure (PWS); (2) profile with 0.15 m high structure (PEN), crowned at still water level (SWL) as shown in Figure 6 and (3) profile with 0.15 m high structure, crowned 0.15 m below the SWL (PES) as seen in Figure 7. The total depth at the PES reef toe was 0.3 m. In summary, PEN and PES tests used the same artificial reef placed at two different locations of the beach profile, thus allowing a valid comparison. A total of 12 irregular wave tests, following the JONSWAP spectrum (γ = 3.3 which is widely used in engineering experimental tests [32,33]), were carried out for calm and storm scenarios over a time of 45 min. Two significant wave heights, two wave peak periods and two water depths in the wave flume define the different wave conditions in the experiments, which are summarized in Table 1. RM corresponds to an idealized, low energetic mean regime, while T1–T3 correspond to storm conditions which were defined by increasing the wave height, wave period and still water level in order to study the performance of the artificial reef under mean and storm waves.
As can be seen in Table 1, T2 cases included the effect of storm surge which was modeled as an increase in the still water level before starting the corresponding test. The experimental procedure consisted in constructing the beach profile, placing the structure (PEN and PES scenarios), recording the initial topography, running waves for 45 min while recording with SN1–SN11 and recording the final topography.
It is worth noting that it is not possible to scale the sand density and grain size so, to some extent, the results of these experiments are qualitative. This means that scale affects are unavoidable and their quantification falls beyond the scope of this work. Figure 8 shows some images of the experiments.

3. Results

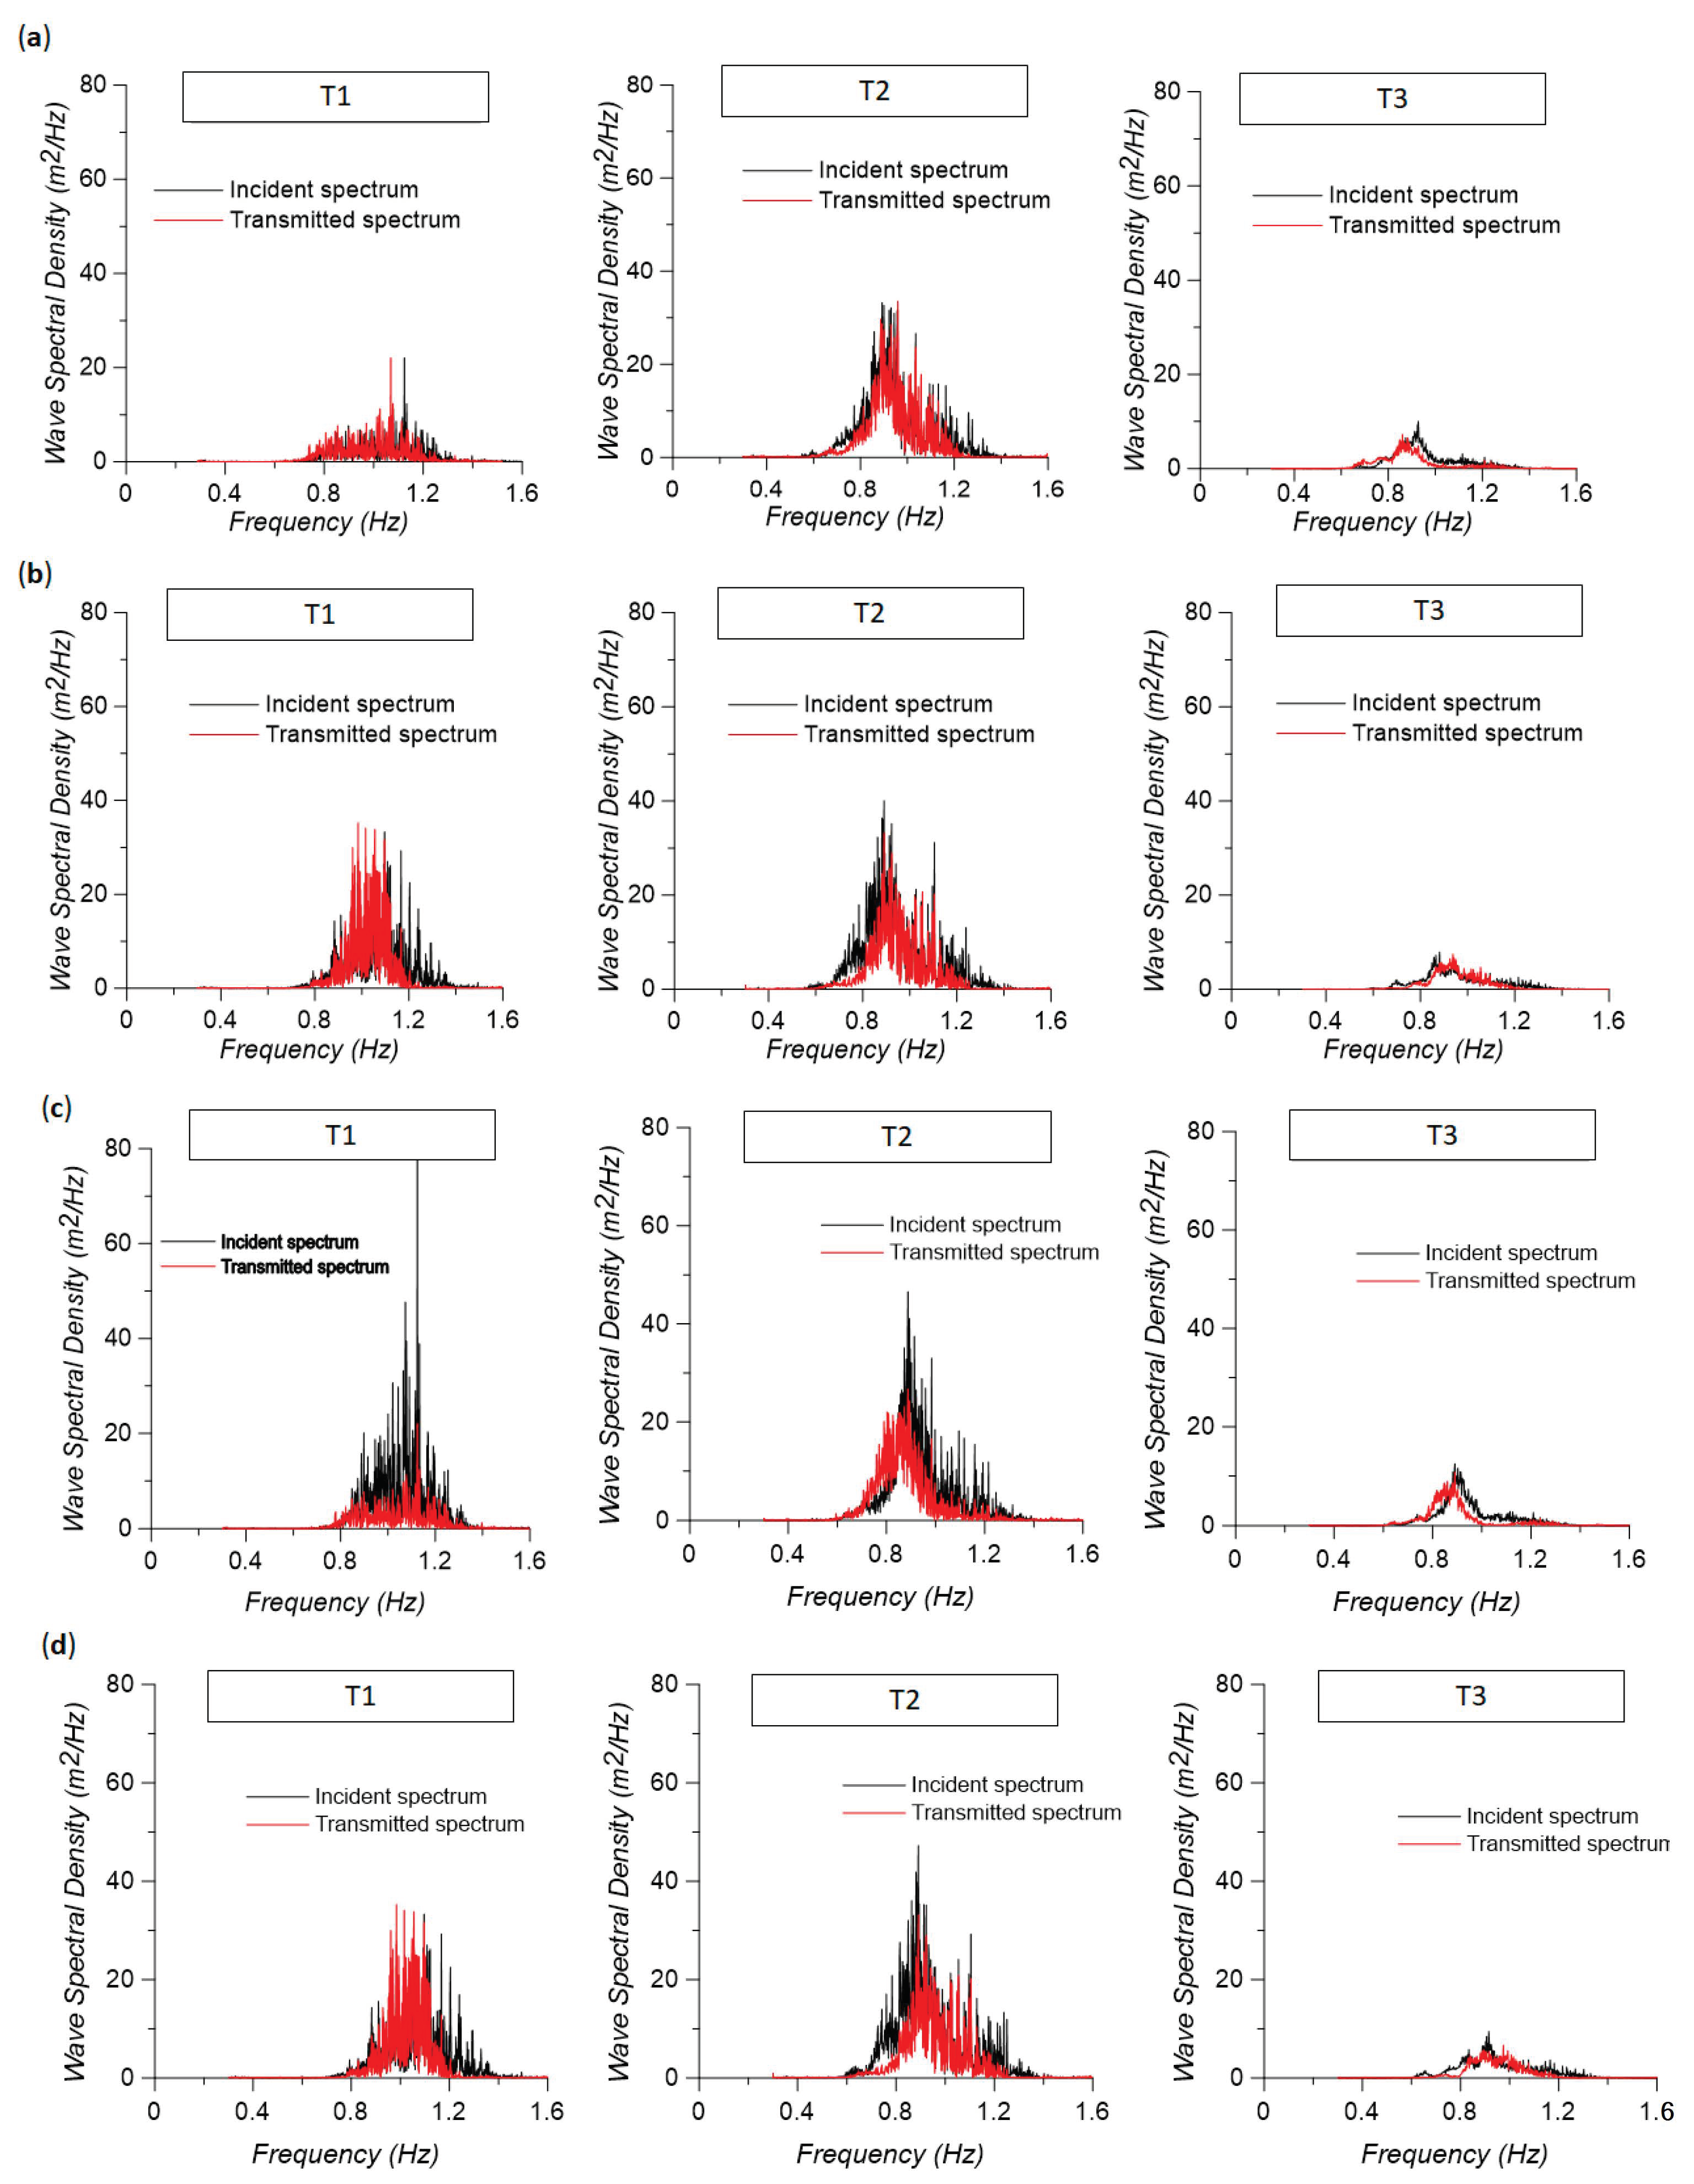
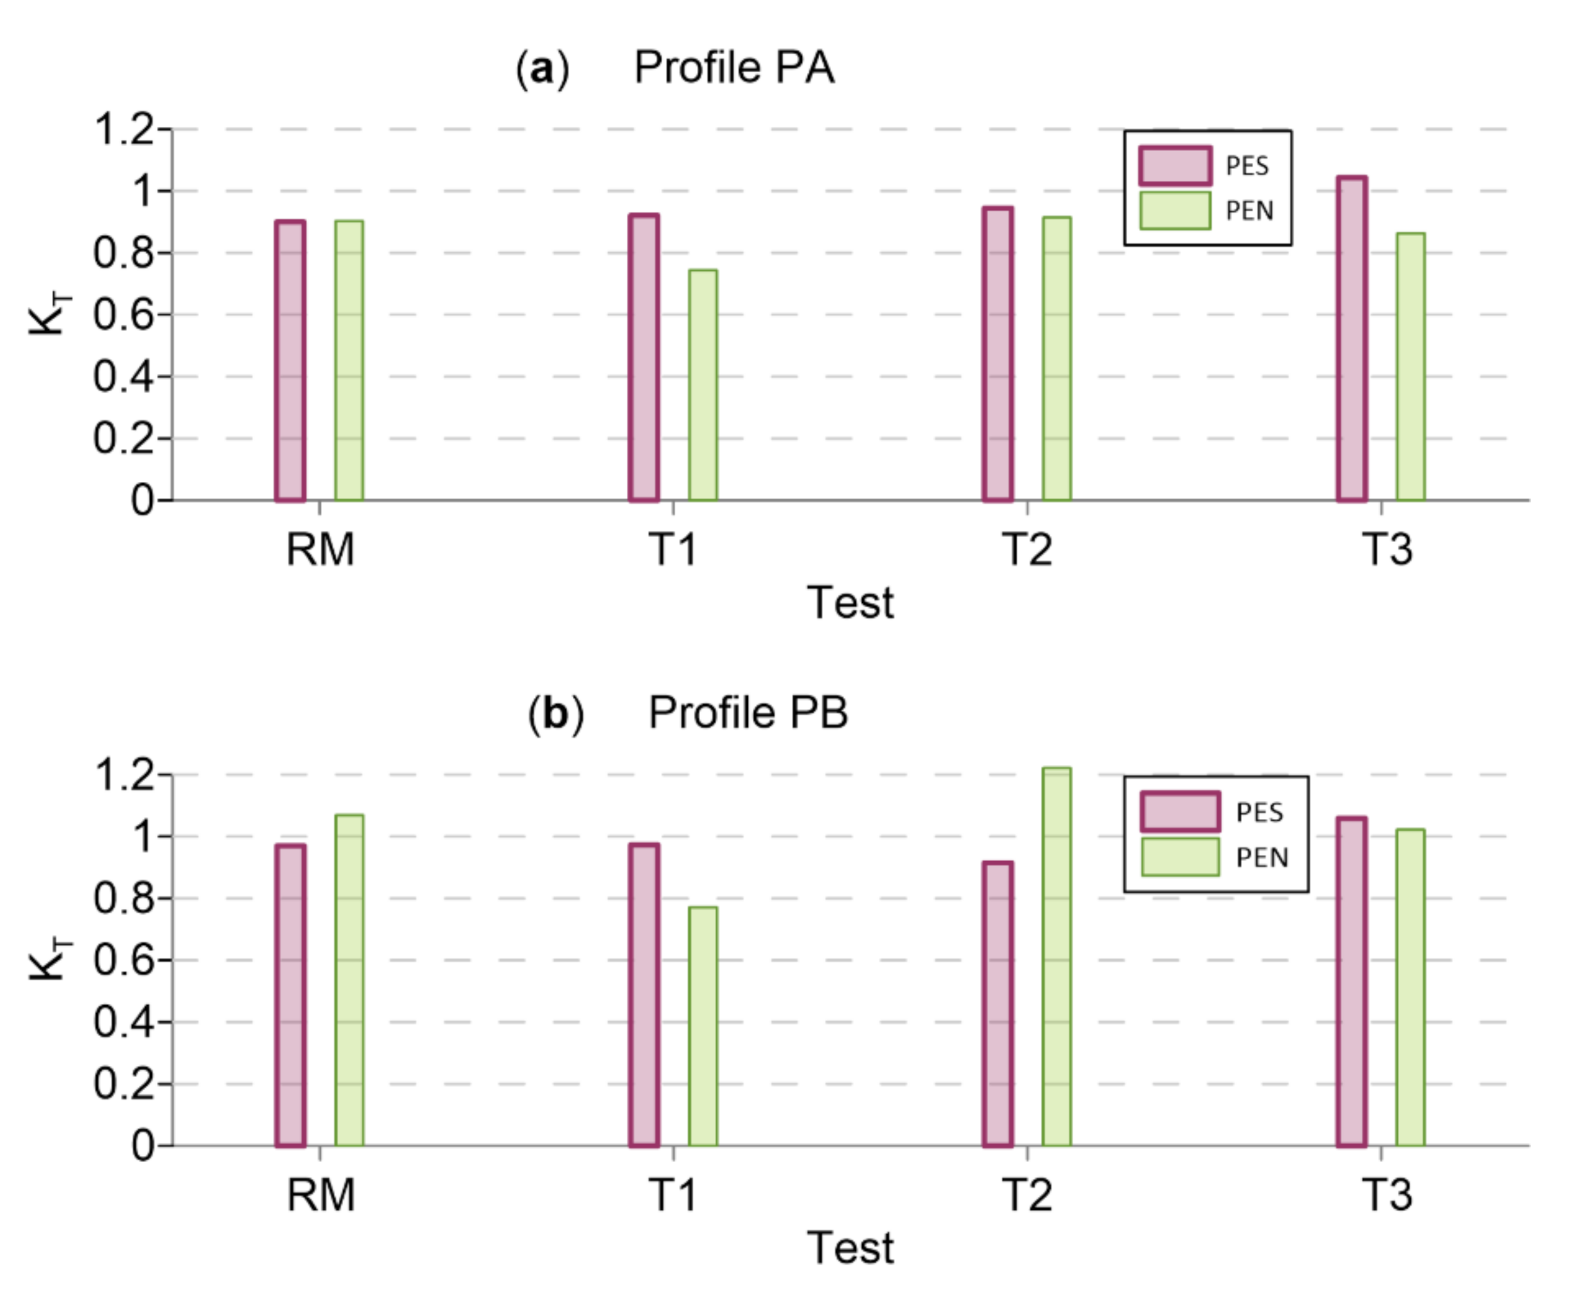
3.1. Hydraulic Performance

Given that from the hydraulic point of view, the main objective of deploying artificial reefs is wave energy control, the performance evaluation presented here of the modular elements structure, is limited to wave transmission. Transmitted wave energy is the one that will effectively attack the beach after the construction of the artificial reef, and thus it is considered the most relevant within the scope of the present work. It is not necessary to mention that the analysis of the reflected and dissipated wave energies is mandatory for the structural and detailed design of the reef.
The fast Fourier transform was applied to the whole time series recorded during each test. No smoothing or window averaging was performed given that the hydrodynamic performance is assessed through the bulk transmission coefficient and not from the spectral shape changes. To get an overview of the wave transmission, the incident (obtained following [31]) and the transmitted spectra, computed from SN10 (PA) and SN11 (PB) recordings, are compared in Figure 9. There, the tests with a structure and storm conditions have been plotted; lines (a) and (b) show PA results, while lines (c) and (d) show PB results for PEN and PES tests, respectively. In turn, the columns of Figure 9 correspond to storms T1, T2, and T3. The spectra plotted in Figure 9 have not been thoroughly smoothed to evidence the variations between the tests.
Observing the spectra obtained, it stands out that the wave transmission for the two reef locations show a similar trend independently of the wave conditions tested. The most unfavorable results (greater transmission) are for the PES scenario where the transmitted spectra are very similar to the incident ones (see lines (b) and (d) of Figure 9). In other words, the transmitted spectra results, highlight a better hydraulic performance when the reef is closer to the shore (PEN tests) because the presence of the reef is enhanced with the reduced depth increasing the proportion of broken waves. Comparing profiles PA and PB, no significant differences were found. Thus, it can be concluded that, for the tests conducted, the hydrodynamic performance depends on the deployment depth and submergence to a larger extent than on the shape of the beach profile.
The root mean square transmitted (HrmsT) and incident (Hrmsi) wave heights were computed from the water surface elevation time series. The transmission coefficients were calculated as the ratio of those wave heights, as given by Equation (1):
K T = H r m s T H r m s i
where KT is the transmission coefficient. The transmission coefficients for the experiments with a structure were plotted in Figure 10.
From Figure 10 it is clear that being porous, low crested structures, the transmission coefficients are large. This is not necessarily a bad performance but an evidence of a low proportion of broken waves and wave energy going through the porous media in a similar way as for natural reefs. For low energy waves (tests RM), the performance of PEN and PES reefs is similar independently of the beach profile shape. The best performance is found in test PEN-T1 which gave the lesser transmission coefficient (~0.8). The performance of PEN and PES reefs is similar for both profiles during storm T1, in which only the wave height was increased compared to RM tests. When the wave period and still water lever are increased, tests T2, PES reef showed a similar performance for both beach profiles, but PEN reef had the worst performance overall in profile PB. This may be due to the larger waves combined with the lesser dissipative profile. In tests T3, PES reef produced very limited wave braking on both profiles; while PEN reef had a better performance. Again, PEN reef works better on profile PA. Two characteristics of the proposed artificial reef can be stated, for the present test conditions: (i) It has a better performance for wave height increase but worse for larger wave periods and (ii) it works better on dissipative beach profiles such as PA.
Transmission coefficients larger than one mean that waves steepened due to the reef but did not break, which is seen as an increase in wave potential energy that should be compensated by a decrease in kinetic energy in order to comply the conservation of energy law. Transmission coefficients of these magnitude (very close to and larger than one) are commonly measured in experiments with porous artificial reefs as can be seen in [34,35,36,37,38].

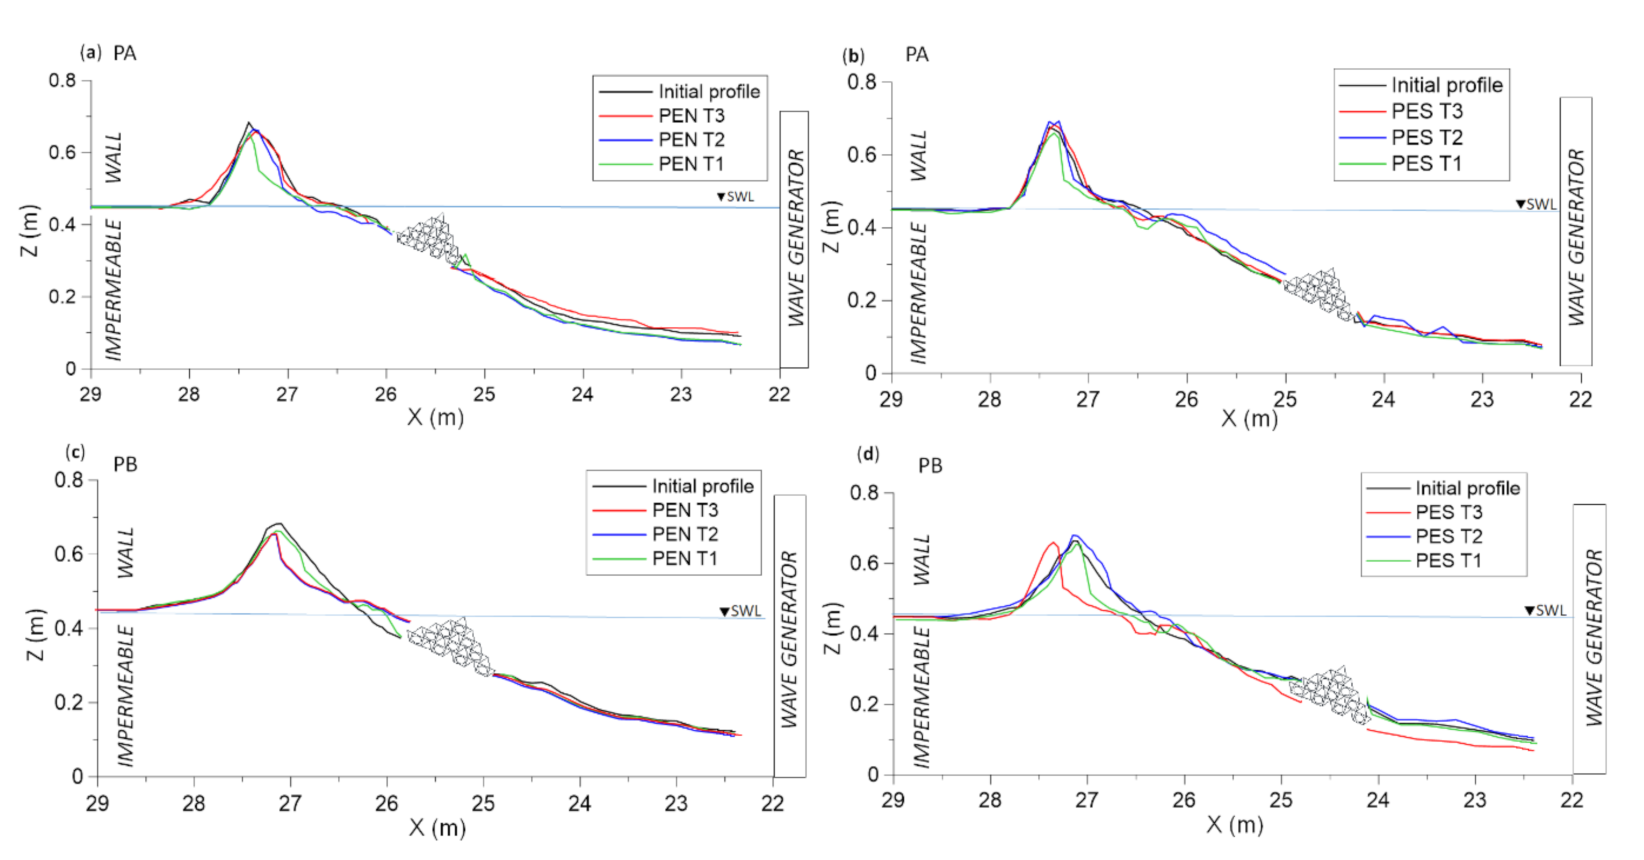
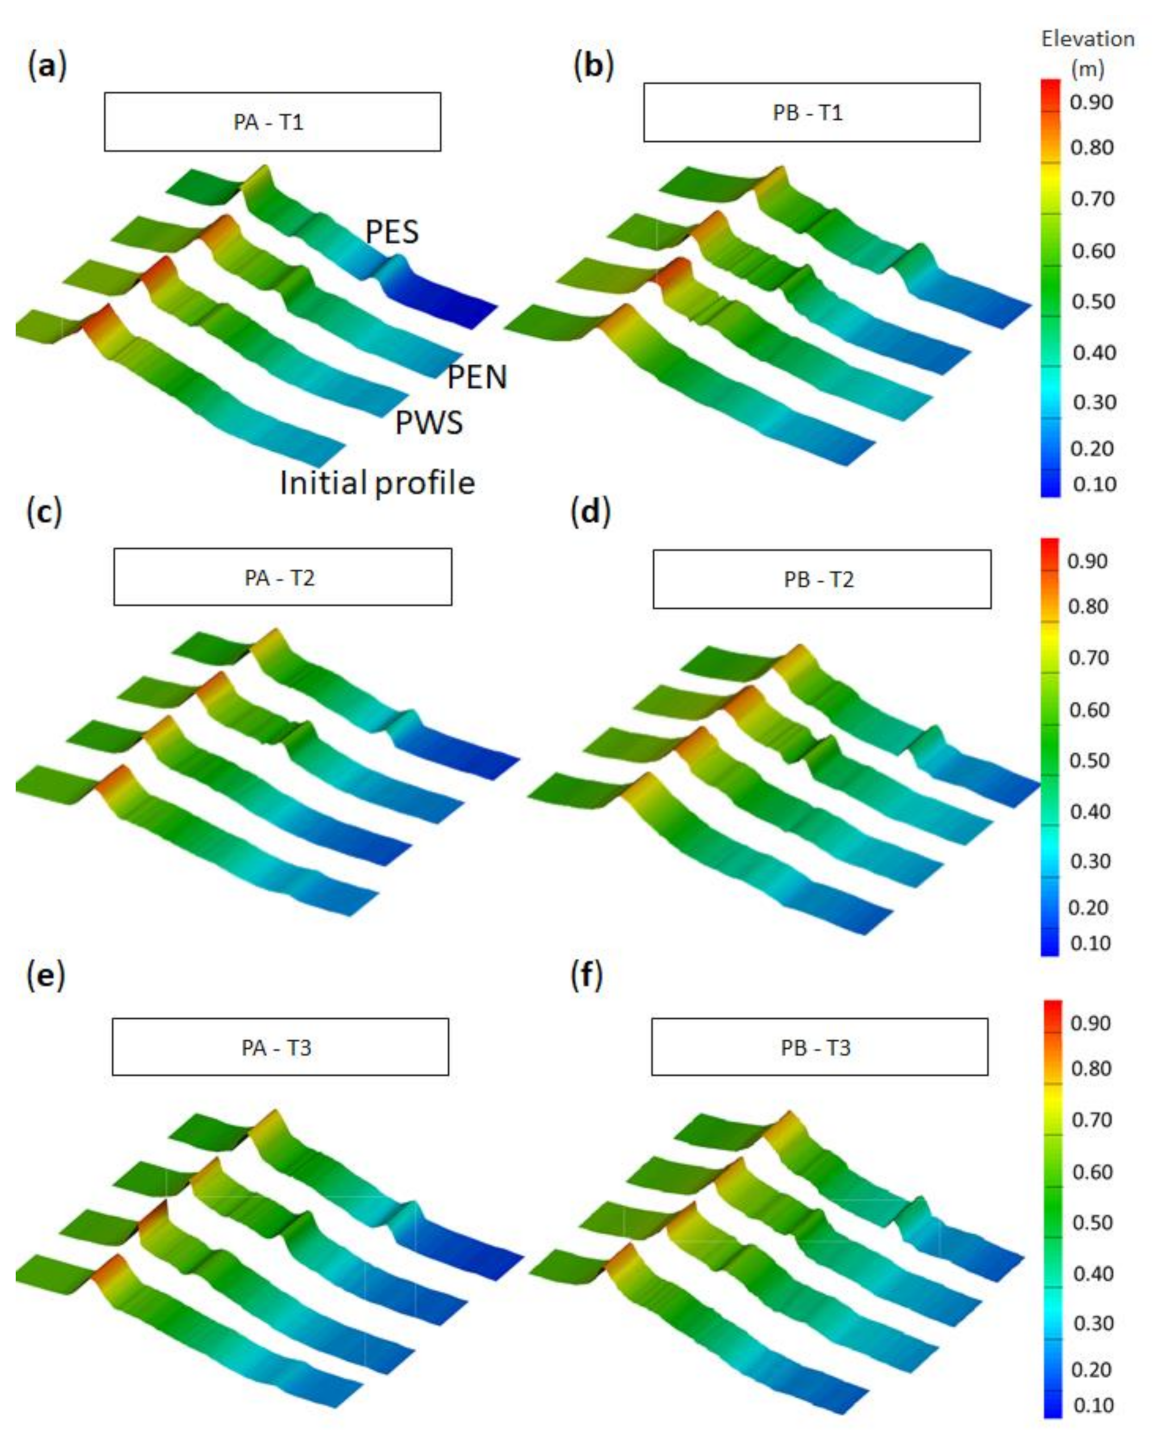
3.2. Morphodynamic Performance

The assessment of the morphological performance is conducted through a comparison between the initial and final profile of each test, these comparisons are plotted in Figure 11. There, it can be seen that in general, the profiles did not suffer great changes. The morphological changes measured in the beach-dune system behind the structures were larger for the submerged artificial reef scenario (PES) and lesser for the PEN scenario.
In general, for the PES structures, an increase in wave height produced dune erosion and sand movement from the dry to the submerged part of the beach profiles (as seen in Figure 11), with the formation of a sand bar at the toe of the structures in the leeward side. The response in test T2 (increased wave period and still water level in relation to test T1) was the creation of a sand bar very close to the coastline and a greater dune erosion (Figure 11). In the PEN scenarios, where the structure is located closer to the beach, the sand also tends to accumulate and retain at the toe of the breakwater, although some of it is transported further seaward.
The comparison in the response of profiles PA and PB shows more sand moving from the emerged to the submerged beach in profile PB, and a higher volume lost from the submerged beach for profile PA. The protection provided by the artificial reef to the dune was higher for the beach profile PA. In both profiles, greater protection of the dune was shown when the artificial reef is far from the beach.
With a small wave height but a large wave period (e.g., test T3 vs. test T2), it is observed that the waves produce greater effects on the dune, because the wave breaks closer to the berm. This may lead to think that having the artificial reef too close to the shore can accelerate the erosion process.
The results indicate that the artificial reef located farther from the coast, produced a dissipative dynamic profile with a submerged bar. In contrast, the artificial reef placed near the coast tended to produce an undesirable reflective beach profile. In this sense and for the present tests, PES location of the artificial reef can be considered as showing a better morphologic performance.
In summary, three main issues were observed during the tests: (i) sediment transport towards the submerged part of the profile; (ii) formation of submerged bars and ripples in the protected part of the beach profile (see Figure 8); and (iii) dune erosion. All of which fall within the expected response of a beach profile to the presence of such an artificial reef [15].
In order to provide a quantitative assessment (disregarding scale effects) of the morphological performance, Table 2 presents the ratios of the final profile sand volume (per width unit) to the initial sand volume along the beach profile. The total volume and the volumes above and below the SWL have been computed.
Table 2 shows that the total sand volume was acceptably kept during the tests; as evidenced by the total ratios’ values being close to one. This means that a negligible percentage of the sand travelled towards the wave generator and was lost. In turn, the values larger than one fall within the measurement error range. Most of the tests show cross-shore sediment transport from the upper (lost volume) to the submerged part (gain volume) of the beach profile, which is a common response to storm conditions. A good performance is seen in tests PEN-T3, PES-T2, and PES-T3 for PA for which the upper part of the beach profile increased in volume, that is, the artificial reef is working as a sand trap. The same could be said in regard to PES-T1 for PB. From Figure 11 and Table 2 it is clear that T3 produced the greatest sediment movement, being the tests T3 for PB the only ones in which the dune resulted severely eroded. The latter leads to conclude that the artificial reef performance strongly decays with wave period in presence of a low proportion of broken waves. In terms of design, this means that a large crown width may be needed.
In Figure 12 the profiles for tests PWS, PEN, and PES have been plotted together for each storm condition and beach profile. This let compare the different experimental setups for the same wave condition. There, it can be seen that for profile PA, in most of the tests, the dune resulted better protected than in profile PB. This is due to the combination of the artificial reef presence and the dissipative character of the beach profile with a berm. Figure 12a,b show the formation of a submerged bar in all T1 tests, which is considered a good performance as it increases wave dissipation even after the storm conditions. The largest bar is formed after PES tests. During T2 tests (Figure 12c,d) no bar formation was seen but ripples were found in the lee side of the structure instead (see also Figure 8). These are the tests for which the largest amount of sand was carried from the dry to the submerged part of the beach profile without significantly eroding the dune. As can be seen in these same panels of Figure 12, some scour was found at the toe of the lee side of the artificial reef in PEN tests for both profiles; this may be due to the proximity of the artificial reef and the reflected waves from the beach. In T3 tests (Figure 12e,f) a large bar is seen after PWS tests formed with sand eroded from the dune, which is the common response of an unprotected profile. When artificial reefs were placed, no bar formation was seen although the dune resulted eroded. This means that the sand taken from the dune was distributed along the profile and the reef itself worked as a bar. This response of the beach is known as the formation of a perched beach, which is favorable in touristic beaches [39].
It can be affirmed, from the conditions represented in the tests and the results obtained, that the reef helps keeping the sediment budget along the profile. This is in agreement with [40,41] who mention that the sediment budget depends on the balance that exists between accretion and erosion. As the results show, there seems to be a direct relation between the eroded volume of the dune and the volume of accretion (bar formation).
It is important to understand the local sediment transport processes in the wider area in which the structure will be constructed. The expected impact on coastal morphology of submerged structures should be investigated, at least along the length of the coast which is relatively autonomous in regard to the movement of sand and other sediments, and where the interruption of these movements may have a significant effect on nearby beaches [42]. Evidently, with the present tests, nothing can be said regarding the long-shore sediment transport. Nevertheless, it has to be noted that natural reefs produce mainly salients and scarcely tombolos [43]; thus, artificial reefs should be placed in such a way that also this feature is adequately mimicked.

3.3. Ecological Performance
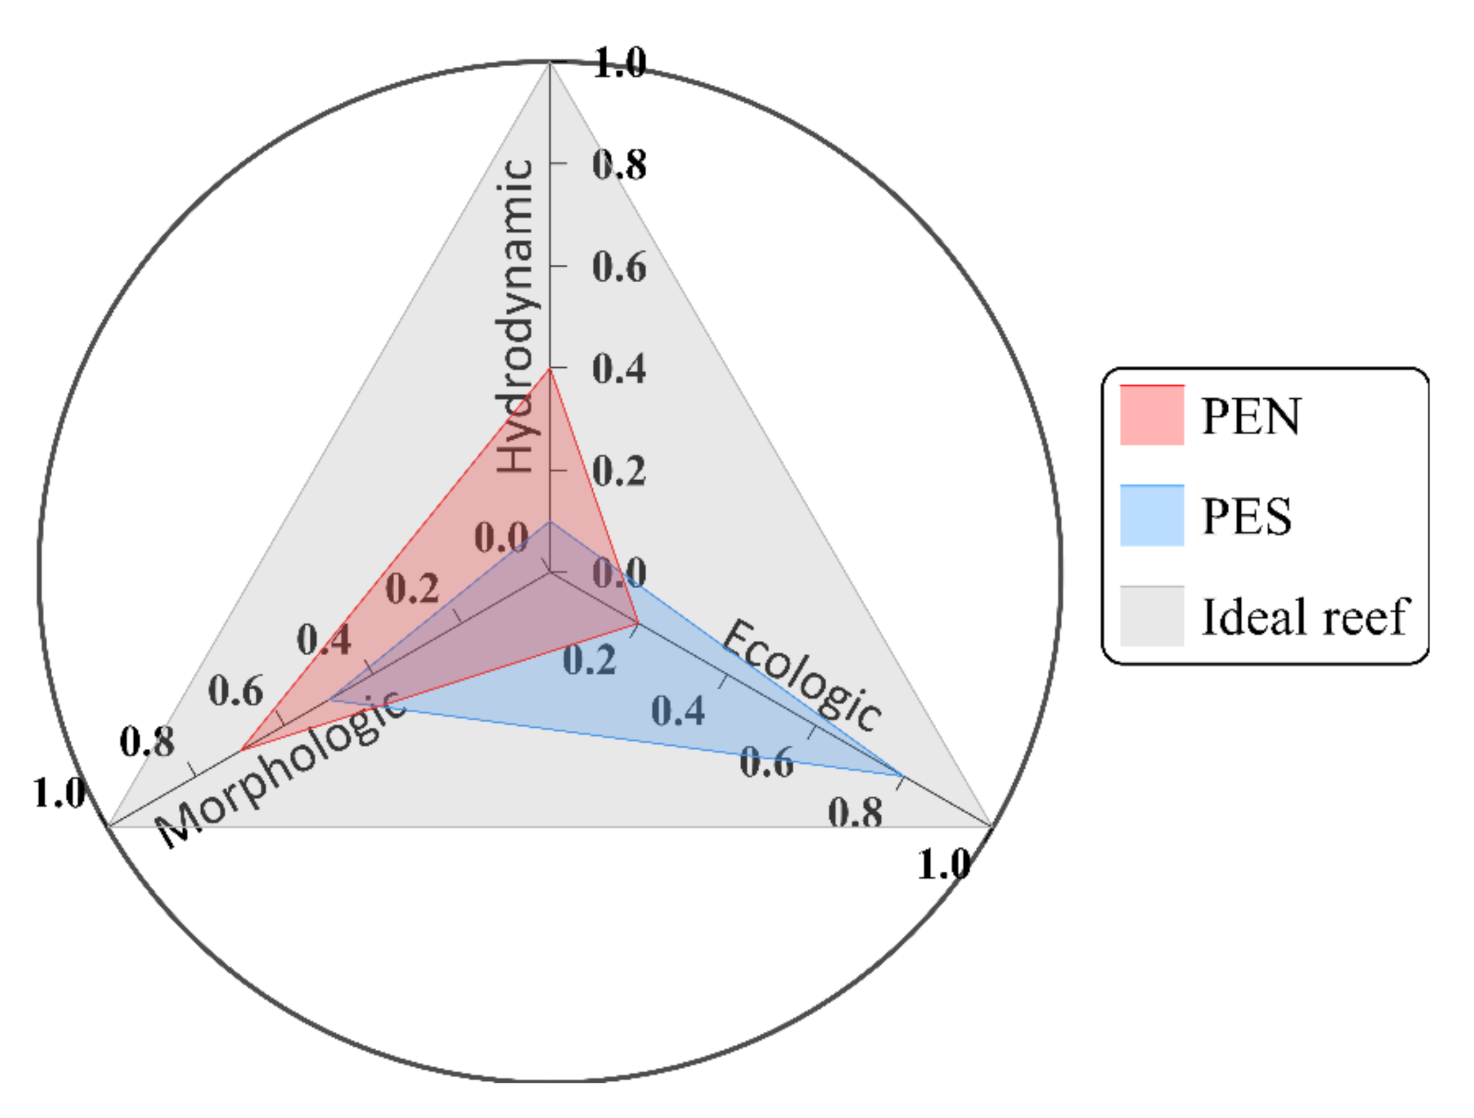
The ecological performance of an artificial reef is related to its capacity of integrating the processes of conserving and improving the quality of the coastal ecosystems. When applying an ecosystem-based approach, it is necessary to understand key aspects related to the coastal protection services of ecosystems, as well as the critical variables that determine their effectiveness [44]. In this regard, some of the environmental services provided by natural reefs such as wave energy dissipation and sediment trapping have already been addressed in Section 3.1 and Section 3.2 as well as in the concept of the artificial reef proposed herein (i.e., porosity, surface roughness, and voids). In this sense, the ecological performance will be evaluated specifically regarding the capacity of the artificial reef of providing habitat and producing a food chain in its surroundings. To do so, one of the main aspects to be evaluated is the artificial reef’s capability of inducing or enhancing primary production [16]. In this sense, the surface roughness and presence of voids of the proposed artificial reef can be considered as having a good performance considering [45], where it is demonstrated that the incorporation of voids can lead to a larger area of the structure colonized by benthic species and that productivity rates of suspension feeders can be 2.4 times higher on artificial reefs constructed from complex blocks compared to reefs constructed from simple blocks (such as concrete cubes).
Sandy beach–coral reef systems can be of four general types: reflective micro tidal, micro/meso intermediate tidal, dissipative micro/meso tidal, and ultra-dissipative micro tidal. In dissipative beaches a larger number of species can be housed, while in reflective types smaller numbers of species can be accommodated. Near the coastline, up to the surf zone, there are species such as the gastropod Bullia tenuis, donax serra adults, Urothoe sp., and other amphipods and mysid Gastrosaccus psammodytes, species that are initiators of the eutrophic chain [46]. The modular submerged structure will dissipate energy, providing flow conditions good for the distribution of autotrophic and benthic organisms, thus favoring species richness and protection of the coastline.
It has been shown that PEN reef produces calm conditions at its leeside which may induce benefits for nursery and reproduction for some species, but being so close to the shore the habitat provision may be limited due to lack of nutrients and water circulation. This is in agreement with Reeds et al. [47] who found that the area benefited by the habitat provision of an artificial reef could extend up to 15 times the basal area of the structure. Furthermore, the high proportion of waves braking on the crown of PEN reef may not let the colonization of the artificial reef. PES reef, as it leaves a larger protected area between the structure and the shoreline, may shelter existent seagrass and benthic biota as well as help trapping sand.
Another aspect to be considered is the density and diversity of species around the artificial reef. Komyakova et al. [48] showed that providing a large variety of refuge sites (i.e., holes, cracks, and crevices) makes the artificial reef able to support more species. This indicates a possible good ecological performance of the proposed reef. In this same regard, [48,49] state that the higher densities and diversities are found when artificial reefs are located in close proximity (~2 km) to natural reefs as it increases connectivity, which is a positive point only for our PES reef. Although it is expected that the proposed artificial reef shows good ecological performance, once placed in the field it should be noted that Becker et al. [50] reported that the fish assemblages associated to artificial reefs showed more species and larger inter-annual variations than on natural reefs. If these changes are acceptable or not, requires a site-specific analysis.

4. Discussion

Of all the dynamic actions on the coast, wave breaking is the most important process in turbulent energy dissipation. Energy dissipation plays a central role in the reduction of wave heights, as well as in the creation of currents close to the coast, which is an important factor in the transport of sediments [51]. However, it was observed that the position of the artificial reef that closer to the shoreline better protected the beach profile, since the final profile maintained its initial shape and both accretion and erosion volumes were similar, indicating some stability.
When the crown of the structure is at SLW it is suggested that the structure be positioned further away from the beach, so that the waves can break before reaching the beach and energy be dissipated. If the structure is too close, the waves will break with more energy causing the slope of the profile to be modified or eroded. When there are extreme conditions, such as storms, the structure that produces an increase in energy, influenced by the relative depth of the water, consequentially producing waves at a greater depth, there will be greater energy concentration near the surface, which is why it is easily transmitted through the structure [51]. Some works have focused on designing multifunctional submerged breakwaters, where the focus of energy is sought, or to generate surf zones, as well as an environmental solution [52].
Usually, coastal protection is focused on the use of rigid structures and these are still perceived as one of the best management strategies to attack erosion problems. Nevertheless, it has been seen that it is not necessarily the best option, problems occur as a consequence of the implementation of these structures, such as acceleration in erosion in front of the structure, alteration to the sediment supply, modification to the longitudinal transport [42]. These negative results are found not only with rigid solutions, it has been observed that the distance of the structure from the beach and its level of submersion must be taken into account when using submerged breakwaters, to avoid increasing the energy that reaches the coastline. In the PES and PEN tests, even in storm conditions, the modular submerged breakwater induced the formation of a small bar after the berm, this could allow the balance of the profile to be recovered over time and avoid its erosion.
The above leads to a first approach for quantifying the performance of the artificial reef in the form of a threefold index. This index lets simultaneously but separately assessing the performance of the barrier regarding each function. In this sense, three values ranging from 0 to 1 are assigned to each function and the result is mapped in radar chart (see Figure 13). In turn, the hydrodynamic function can be evaluated through a standardized transmission coefficient (to let 0 be the worst performance and 1 the best), the morphodynamic function through a parametrization of the ratio of the final and initial dry beach width and the ecological function can be evaluated through the ratio of the parametrization of the existent and recovered/newly provided ecosystem services (following [53]). Futher, a recent effort focused on quantifying the ecological performance has been developed by Silva Lima et al. [54] who built an Artificial Reef Multimetric Index (ARMI) which considers the assemblage structure, mean trophic level, vulnerability and economic importance associated with the artificial reef. The detailed formulation of such an index needs further research and testing.
As a preliminary, semi-quantitative application of the threefold and simultaneous evaluation tool, Figure 13 shows PEN and PES reefs semi-quantitatively evaluated with the proposed index. PEN case, in red color, behaves as a traditional low crested structure, which shows a moderate hydrodynamic performance due to the relatively low transmission coefficients found in the present tests, so a value of 0.4 is given. The morphologic performance of PEN reef is also considered good as the dune resulted eroded to a lesser extent than for PES reef and wider final dry beaches were obtained; a value of 0.7 is given. Given its proximity to the shoreline and that it is not considered to be placed near natural reefs, the ecologic performance of PEN reef is considered poor; a value of 0.2 is set. The blue structure, PES reef, is considered to show good ecologic performance so a value of 0.8 is given. Its morphologic performance is moderate as it produces a larger sheltered area but the dune resulted severely eroded during case T3; a value of 0.5 is given. Finally, the hydrodynamic performance of PES reef is poor due to the high transmission found in the tests; a value of 0.1 is given. As a reference, the grey area in Figure 13 would indicate a “perfect” structure (values of 1.0 for each performance) which is unlikely to exist. With this simple example, the use and applicability of the index is evident.

5. Conclusions

A modular submerged breakwater can solve various coastal problems. When it is sought to dissipate energy and retain sediment, in order to create sand bars and salients, the crown of the breakwater must be at SLW and it must be placed near the coastline. This use would not be an ecological solution, allowing colonization of benthic species, since wave breaking causes the sediment suspension and, in excess, this is unfavorable for some species, such as corals. If you want to dissipate energy and stabilize the beach profile, then the structure must be submerged, so the energy is dissipated by friction, the waves break with less intensity and a bar is gradually created which, in time, will allow a balanced profile to return. Conditions will also be provided in the flow for the distribution of autotrophs and benthic organisms, thus favoring species richness and protecting the coastline. If the main objective is the restoration of a habitat or to avoid the pressure of the bottom sea fisheries by trawling methods, a modular submerged breakwater would function as a zone of refuge when it is placed far from the surf zone.
There are cases which are so serious that the most viable and solution is the rapid construction of a rigid structure. However, these must be designed in a way that they modify the conditions of the environment in which they will be built as little as possible. They must also take into account ecological factors and make them a friendly solution to the environment.

Author Contributions

Conceptualization, D.C.-R. and E.M.; methodology, D.C.-R., M.E., and E.M.; validation, D.C.-R., E.M., M.E., and M.V.-Z.; investigation, D.C.-R. and E.M.; data curation, D.C.-R. and M.V.-Z.; writing—original draft preparation, D.C.-R. and E.M.; writing—review and editing, E.M., M.E., and M.V.-Z. All authors have read and agreed to the published version of the manuscript.

Funding

This work was partially funded by CONACYT-SENER/Sustentabilidad Energética through the Centro Mexicano de Inovación en Energías del Océano (CEMIE-Océano), grant number 249795.

Acknowledgments

M.V.-Z. and E.M. wish to thank CONACYT/Ciencia Básica (grant number 256802) for its support to this research.

Conflicts of Interest

The authors declare no conflict of interest.

References

  1. Sánchez, A.; Jiménez, J.A. Ingeniería de Playas (I): Conceptos de Morfología Costera. Ingen. Agua. 1994, 1, 97–114. [Google Scholar]
  2. Pilkey, O.H.; Thieler, E.R. Erosion of the United States shoreline. In Quaternary Coasts of the United States. Marine and Lacustrine Systems; Fletcher, C.H., III, Wehmiller, J.F., Eds.; SEPM Society for Sedimentary Geology: Raleigh, NC, USA, 1992; Volume 48, pp. 3–7. [Google Scholar]
  3. Donnelly, J.P.; Cleary, P.; Newby, P.; Ettinger, R. Coupling instrumental and geological records of sea-level change: Evidence from southern New England of an increase in the rate of sea-level rise in the late 19th century. Geophys. Res. Lett. 2004, 31, 1–4. [Google Scholar] [CrossRef] [Green Version]
  4. Barragán, J.M.; de Andrés, M. Analysis and trends of the world’s coastal cities and agglomerations. Ocean Coast. Manag. 2015, 114, 11–20. [Google Scholar] [CrossRef]
  5. Jensen, A.; Collins, K.; Lockwood, P. Current issues relating to artificial reefs in European Seas. In Artificial Reefs in European Seas; Jensen, A.C., Collins, K.J., Lockwood, A.P.M., Eds.; Springer: Dordrecht, The Netherlands, 2000; pp. 489–499. [Google Scholar]
  6. Wu, Z.; Tweedley, J.R.; Loneragan, N.R.; Zhang, X. Artificial reefs can mimic natural habitats for fish and macroinvertebrates in temperate coastal waters of the Yellow Sea. Ecol. Eng. 2019, 139, 1–44. [Google Scholar] [CrossRef]
  7. Jayanthi, M.; Patterson, J.K.; Malleshappa, H.; Gladwin, N.; Mathews, G.; Diraviya, K.; Deepak, S.B.; Ashok, T.K.; Sannasiraj, S.A. Perforated trapezoidal artificial reefs can augment the benefits of restoration of island and its marine ecosystem. Restor. Ecol. 2019, 28, 233–243. [Google Scholar] [CrossRef]
  8. Kim, I.; Kim, J.; Nam, J.; Song, D.; Lee, H. Changes in the behavioral characteristics of the Gangmun and Anmok beaches following the construction of artificial reefs. J. Coast. Res. 2019, SI 91, 26–30. [Google Scholar] [CrossRef]
  9. Kim, K.H.; Shim, K.T.; Shin, B.S. Morphological Change near the Artificial Reefs as a Beach Erosion Countermeasure. J. Coast. Res. 2016, SI 75, 403–407. [Google Scholar] [CrossRef]
  10. Baine, M. Artificial reefs: A review of their design, application, management and performance. Ocean Coast. Manag. 2001, 44, 241–259. [Google Scholar] [CrossRef]
  11. Silva, J.; Rosental, I.; Milton, Z. Overview and trends of ecological and socioeconomic research on artificial reefs. Mar. Environ. Res. 2019, 145, 81–96. [Google Scholar]
  12. Seabrook, S.R.; Hall, K.R. Wave transmission at submerged rubblemound breakwaters. In Proceedings of the 26th International Conference on Coastal Engineering, ASCE, Copenhagen, Denmark, 22–26 June 1998; pp. 2000–2013. [Google Scholar]
  13. van der Meer, J.W.; Pilarczyk, K.W. Stability of low-crested and reef breakwaters. In Proceedings of the 22nd International Conference on Coastal Engineering, ASCE, Delft, The Netherlands, 2–6 June 1990; pp. 1375–1388. [Google Scholar]
  14. Ma, Y.; Kuang, C.; Han, X.; Niu, H.; Zheng, Y.; Shen, C. Experimental Study on the Influence of an Artificial Reef on Cross-Shore Morphodynamic Processes of a Wave-Dominated Beach. Water 2020, 12, 2947. [Google Scholar] [CrossRef]
  15. Kuang, C.; Mao, X.; Gu, J.; Niu, H.; Ma, Y.; Yang, Y.; Qui, R.; Zhang, J. Morphological processes of two artificial submerged shore-parallel sandbars for beach nourishment in a nearshore zone. Ocean Coast. Manag. 2019, 179, 104870. [Google Scholar] [CrossRef]
  16. Layman, C.A.; Allgeier, J.E. An ecosystem ecology perspective on artificial reef production. J. Appl. Ecol. 2020, 57, 2139–2148. [Google Scholar] [CrossRef]
  17. Pilarczyk, K.W. Design of low-crested (submerged) structures: An overview. In Proceedings of the 6th COPEDEC (Int. Conf. on Coastal and Port Engng. in Develop. Countries), Colombo, Sri Lanka, 15–19 September 2003; pp. 1–19. [Google Scholar]
  18. ‘Izzat Na’im, I.; Razak Mohd Shahrizal, A.R.; Safari, M.D. A Short Review of Submerged Breakwaters. MATEC Web Conf. 2008, 203, 01005. [Google Scholar] [CrossRef]
  19. Ranasinghe, R.; Turner, I.L. Shoreline response to submerged structures: A review. Coast. Eng. 2006, 53, 65–79. [Google Scholar] [CrossRef]
  20. Bohnsack, J.A.; Sutherland, D.L. Artificial reef research: A review with recommendations for future priorities. Bullet. Marine Sci. 1985, 37, 11–39. [Google Scholar]
  21. Mahmoudi, A.; Hakimzadeh, H.; Ketabdari, M.J.; Cartwright, N.; Vaghefi, M. Experimental Study on Wave Transmission and Reflection at Impermeable Submerged Breakwaters. Int. J. Coast. Offshore Eng. 2017, 1, 19–27. [Google Scholar]
  22. Lokesha; Sannasiraj, S.A.; Sundar, V. Hydrodynamic characteristics of a submerged trapezoidal artificial reef unit. Proc. Inst. Mecha. Eng. Part M J. Eng. Marit. Environ. 2019, 233, 1226–1239. [Google Scholar] [CrossRef]
  23. da Silva, G.V.; Hamilton, D.; Murray, T.; Strauss, D.; Shaeri, S.; Faivre, G.; Silva, A.P.; Tomlinson, R. Impacts of a Multi-Purpose Artificial Reef on Hydrodynamics, Waves and Long-Term Beach Morphology. J. Coast. Res. 2020, 95, 706–710. [Google Scholar] [CrossRef]
  24. Hammond, M.; Bond, T.; Prince, J.; Hovey, R.K.; McLean, D.L. An assessment of change to fish and benthic communities following installation of an artificial reef. Region. Stud. Marine Sci. 2020, 39, 101408. [Google Scholar] [CrossRef]
  25. Lemoine, H.R.; Paxton, A.B.; Anisfeld, S.C.; Rosemond, R.C.; Peterson, C.H. Selecting the optimal artificial reefs to achieve fish habitat enhancement goals. Biol. Conserv. 2019, 238, 108200. [Google Scholar] [CrossRef]
  26. Silva, R.; Mendoza, E.; Mariño-Tapia, I.; Martínez, M.L.; Escalante, E. An artificial reef improves coastal protection and provides a base for coral recovery. J. Coast. Res. 2016, 75, 467–471. [Google Scholar] [CrossRef]
  27. Hawkins, S.J.; Burcharth, H.F.; Zanuttigh, B.; Lamberti, A. Environmental Design Guidelines for Low Crested Coastal Structures; Elsevier: Cham, Switzerland, 2007; 448p. [Google Scholar]
  28. Strain, E.M.A.; Olabarria, C.; Mayer-Pinto, M.; Cumbo, C.; Morris, R.L.; Bugnot, A.B.; Dafforn, K.A.; Heery, E.; Firth, L.B.; Brooks, P.R.; et al. Eco-engineering urban infrastructure for marine and coastal biodiversity: Which interventions have the greatest ecological benefit? J. Appl. Ecol. 2018, 55, 426–441. [Google Scholar] [CrossRef]
  29. Kobayashi, N.; Buck, M.; Payo, A.; Johnson, B.D. Berm and dune erosion during a storm. J. Waterw. Port Coast. Ocean Eng. 2009, 135, 1–10. [Google Scholar] [CrossRef] [Green Version]
  30. Silva, R.; Martínez, M.L.; Odériz, I.; Mendoza, E.; Feagin, R.A. Response of vegetated dune–beach systems to storm conditions. Coast. Eng. 2016, 109, 53–62. [Google Scholar] [CrossRef]
  31. Baquerizo, A. Reflexión del Oleaje en Playas. Métodos de Evaluación y de Predicción. Ph.D. Thesis, Universidad de Cantabria, Santander, Spain, 1995; 180p. [Google Scholar]
  32. Goda, Y. Random Seas and Design of Maritime Structures, 3rd ed.; World Scientific: New York, NY, USA, 2010; 732p. [Google Scholar]
  33. Pecher, A.; Kofoed, J.P. Handbook of Ocean Wave Energy; Springer International Publishing: Cham, Switzerland, 2017; 287p. [Google Scholar]
  34. Webb, B.M.; Allen, R. Wave transmission through artificial reef breakwaters. In Proceedings of the Coastal Structures and Solutions to Coastal Disasters, Boston, MA, USA, 9–11 September 2015; pp. 432–441. [Google Scholar]
  35. Shin, S.; Bae, I.; Lee, J.I. Three-dimensional Variation of Wave Transmission around the Artificial Reefs: An Experimental Study. J. Coast. Res. 2018, 85, 1011–1015. [Google Scholar] [CrossRef]
  36. Srineash, V.K.; Murali, K. Effects of Seaward Slope on Wave Transmission of Porous and Non-Porous Reef Breakwaters with Smooth and Stepped Slopes. In Proceedings of the Coastal Structures 2019, Hannover, Germany, 30 September–2 October 2019; pp. 275–285. [Google Scholar]
  37. Frau, L.; Marzeddu, A.; Dini, E.; Gracia, V.; Gironella, X.; Erioli, A.; Zomparelli, A.; Sánchez-Arcilla, A. Effects of ultra-porous 3D printed reefs on wave kinematics. J. Coast. Res. 2018, 75, 851–855. [Google Scholar] [CrossRef]
  38. Ab Razak, M.S.; Yusof, B.; Desa, S.M. The performance of narrow and broad-crested submerged breakwaters in dissipating wave heights. J. Teknologi. 2020, 82, 25–33. [Google Scholar]
  39. Gonzalez, M.; Medina, R.; Losada, M.A. Equilibrium beach profile model for perched beaches. Coast. Eng. 1999, 36, 343–357. [Google Scholar] [CrossRef]
  40. Silva, R.; Villatoro, M.; Ramos, F.; Pedroza, D.; Ortiz, M.; Mendoza, E.; Cid, A. Caracterización de la Zona Costera y Planteamiento de Elementos Técnicos para la Elaboración de Criterios de Regulación y Manejo Sustentable; UNAM/SEMARNAT: Mexico City, Mexico, 2014; 125p. [Google Scholar]
  41. Komar, P.D. Handbook of Coastal Processes and Erosion; CRC Press: Galveston, TX, USA, 1997; Volume 53, pp. 1689–1699. [Google Scholar]
  42. Kubowicz-Grajewska, A. Morpholithodynamical changes of the beach and the nearshore zone under the impact of submerged breakwaters-A case study (Orłowo Cliff, the Southern Baltic). Oceanologia 2015, 57, 144–158. [Google Scholar] [CrossRef] [Green Version]
  43. de Alegria-Arzaburu, A.R.; Mariño-Tapia, I.; Enriquez, C.; Silva, R.; González-Leija, M. The role of fringing coral reefs on beach morphodynamics. Geomorphology 2013, 198, 69–83. [Google Scholar] [CrossRef]
  44. Gracia, A.; Rangel-Buitrago, N.; Oakley, J.A.; Williams, A.T. Use of ecosystems in coastal erosion management. Ocean Coast. Manag. 2017, 156, 277–289. [Google Scholar] [CrossRef]
  45. Rouse, S.; Porter, J.S.; Wilding, T.A. Artificial reef design affects benthic secondary productivity and provision of functional habitat. Ecol. Evol. 2020, 10, 2122–2130. [Google Scholar] [CrossRef] [PubMed] [Green Version]
  46. McLachlan, A. Physical factors in benthic ecology: Effects of changing particle size on beach fauna. Mar. Ecol. Prog. Ser. 1996, 131, 205–217. [Google Scholar] [CrossRef]
  47. Reeds, K.A.; Smith, J.A.; Suthers, I.M.; Johnston, E.L. An ecological halo surrounding a large offshore artificial reef: Sediments, infauna, and fish foraging. Mar. Environ. Res. 2018, 141, 30–38. [Google Scholar] [CrossRef] [PubMed]
  48. Komyakova, V.; Chamberlain, D.; Jones, G.P.; Swearer, S.E. Assessing the performance of artificial reefs as substitute habitat for temperate reef fishes: Implications for reef design and placement. Sci. Total Environ. 2019, 668, 139–152. [Google Scholar] [CrossRef]
  49. Keller, K.; Smith, J.A.; Lowry, M.B.; Taylor, M.D.; Suthers, I.M. Multispecies presence and connectivity around a designed artificial reef. Marine Freshwater Res. 2017, 68, 1489–1500. [Google Scholar] [CrossRef] [Green Version]
  50. Becker, A.; Taylor, M.D.; Lowry, M.B. Monitoring of reef associated and pelagic fish communities on Australia’s first purpose built offshore artificial reef. ICES J. Marine Sci. 2017, 74, 277–285. [Google Scholar] [CrossRef]
  51. Del Vita, I. Hydraulic Response of Submerged Breakwaters. Ph.D. Thesis, University of Naples Federico II, Naples, Italy, 2016. [Google Scholar]
  52. Black, K.; Mead, S. Design of the Gold Coast reef for surfing, public amenity and coastal protection: Surfing aspects. J. Coast. Res. 2001, 29, 115–130. [Google Scholar]
  53. Matlock, M.; Morgan, R.A. Ecological Engineering Design, Restoring and Conserving Ecological Services; John Wiley & Sons: Hoboken, NJ, USA, 2011; 353p. [Google Scholar]
  54. Silva Lima, J.S.; Atalah, J.; Sanchez-Jerez, P.; Zalmon, I.R. Evaluating the performance and management of artificial reefs using artificial reef multimetric index (ARMI). Ocean Coast. Manag. 2020, 198, 105350. [Google Scholar] [CrossRef]
Figure 1. Diagram of the hydrodynamic function of a submerged breakwater.
Jmse 09 00130 g001
Figure 2. Diagram of the morphological function of a submerged breakwater.
Jmse 09 00130 g002
Figure 3. Diagram of the ecological function of a submerged breakwater.
Jmse 09 00130 g003
Figure 4. Views of modular element (a) Side; (b) Front and (c) Isometric.
Jmse 09 00130 g004
Figure 5. Isometric view of the modular artificial reef.
Jmse 09 00130 g005
Figure 6. PEN scenario. Top: profile PA; bottom, profile PB.
Jmse 09 00130 g006
Figure 7. PES scenario. Top: profile PA; bottom, profile PB.
Jmse 09 00130 g007
Figure 8. Images of the experimental tests. (a) Panoramic view of the facility; (b) PA after test PES-T1 with ripple formation; (c) PA after test PES-T2; (d) Damaged coastal dunes of PA and PB after test PES-T2 (waves propagated downwards).
Jmse 09 00130 g008
Figure 9. Wave transmission coefficients for all the tests with an artificial reef. (a) shows PA-PEN; (b) PA-PES; (c) PB-PEN and (d) PB-PES scenarios. Left panels correspond to storm T1; middle panels to storm T2 and right panels to storm T3.
Jmse 09 00130 g009
Figure 10. Wave transmission coefficients in the experimental tests: (a) Profile PA, (b) Profile PB.
Jmse 09 00130 g010
Figure 11. Beach profile response to (a) PA-PEN; (b) PA-PES; (c) PB-PEN and (d) PB-PES test cases.
Jmse 09 00130 g011
Figure 12. Morphological response of beach profiles. Left panels show profile PA and right panels, profile PB. (a) and (b) show storm T1; (c) and (d) storm T2 and (e) and (f) storm T3.
Jmse 09 00130 g012
Figure 13. Artificial Reef Performance Index plotted in radar chart.
Jmse 09 00130 g013
Table 1. Experimental program. Case name, Hs is the significant wave height, Tp is the peak period and h is the water depth in the flume.
Test Hs (m)Tp (s)h (m)
Profiles
PA and PB
PWSRM
T1
T2
T3
0.05
0.10
0.10
0.05
0.894
0.894
1.118
1.118
0.45
0.45
0.48
0.45
PENRM
T1
T2
T3
0.05
0.10
0.10
0.05
0.894
0.894
1.118
1.118
0.45
0.45
0.48
0.45
PESRM
T1
T2
T3
0.05
0.10
0.10
0.05
0.894
0.894
1.118
1.118
0.45
0.45
0.48
0.45
Table 2. Ratios of initial to final sand volumes (per width unit) for the storm tests.
Total ProfileAbove SWLBelow SWL
PAPBPAPBPAPB
PEN-T10.9990.9620.6200.9181.0510.971
PEN-T21.0390.9330.7830.7491.0750.979
PEN-T30.8780.9331.2790.7490.8210.979
PES-T10.9920.9480.7480.8271.0220.967
PES-T20.9471.0051.0091.1940.9400.972
PES-T30.9901.0931.0350.6190.9831.172
Publisher’s Note: MDPI stays neutral with regard to jurisdictional claims in published maps and institutional affiliations.

