
Understanding the Spatial and Temporal Distribution and Environmental Characteristics of Polychaete Assemblages in the Coastal Waters of Ulleungdo, East Sea of Korea


Abstract
1. Introduction
2. Materials and Methods
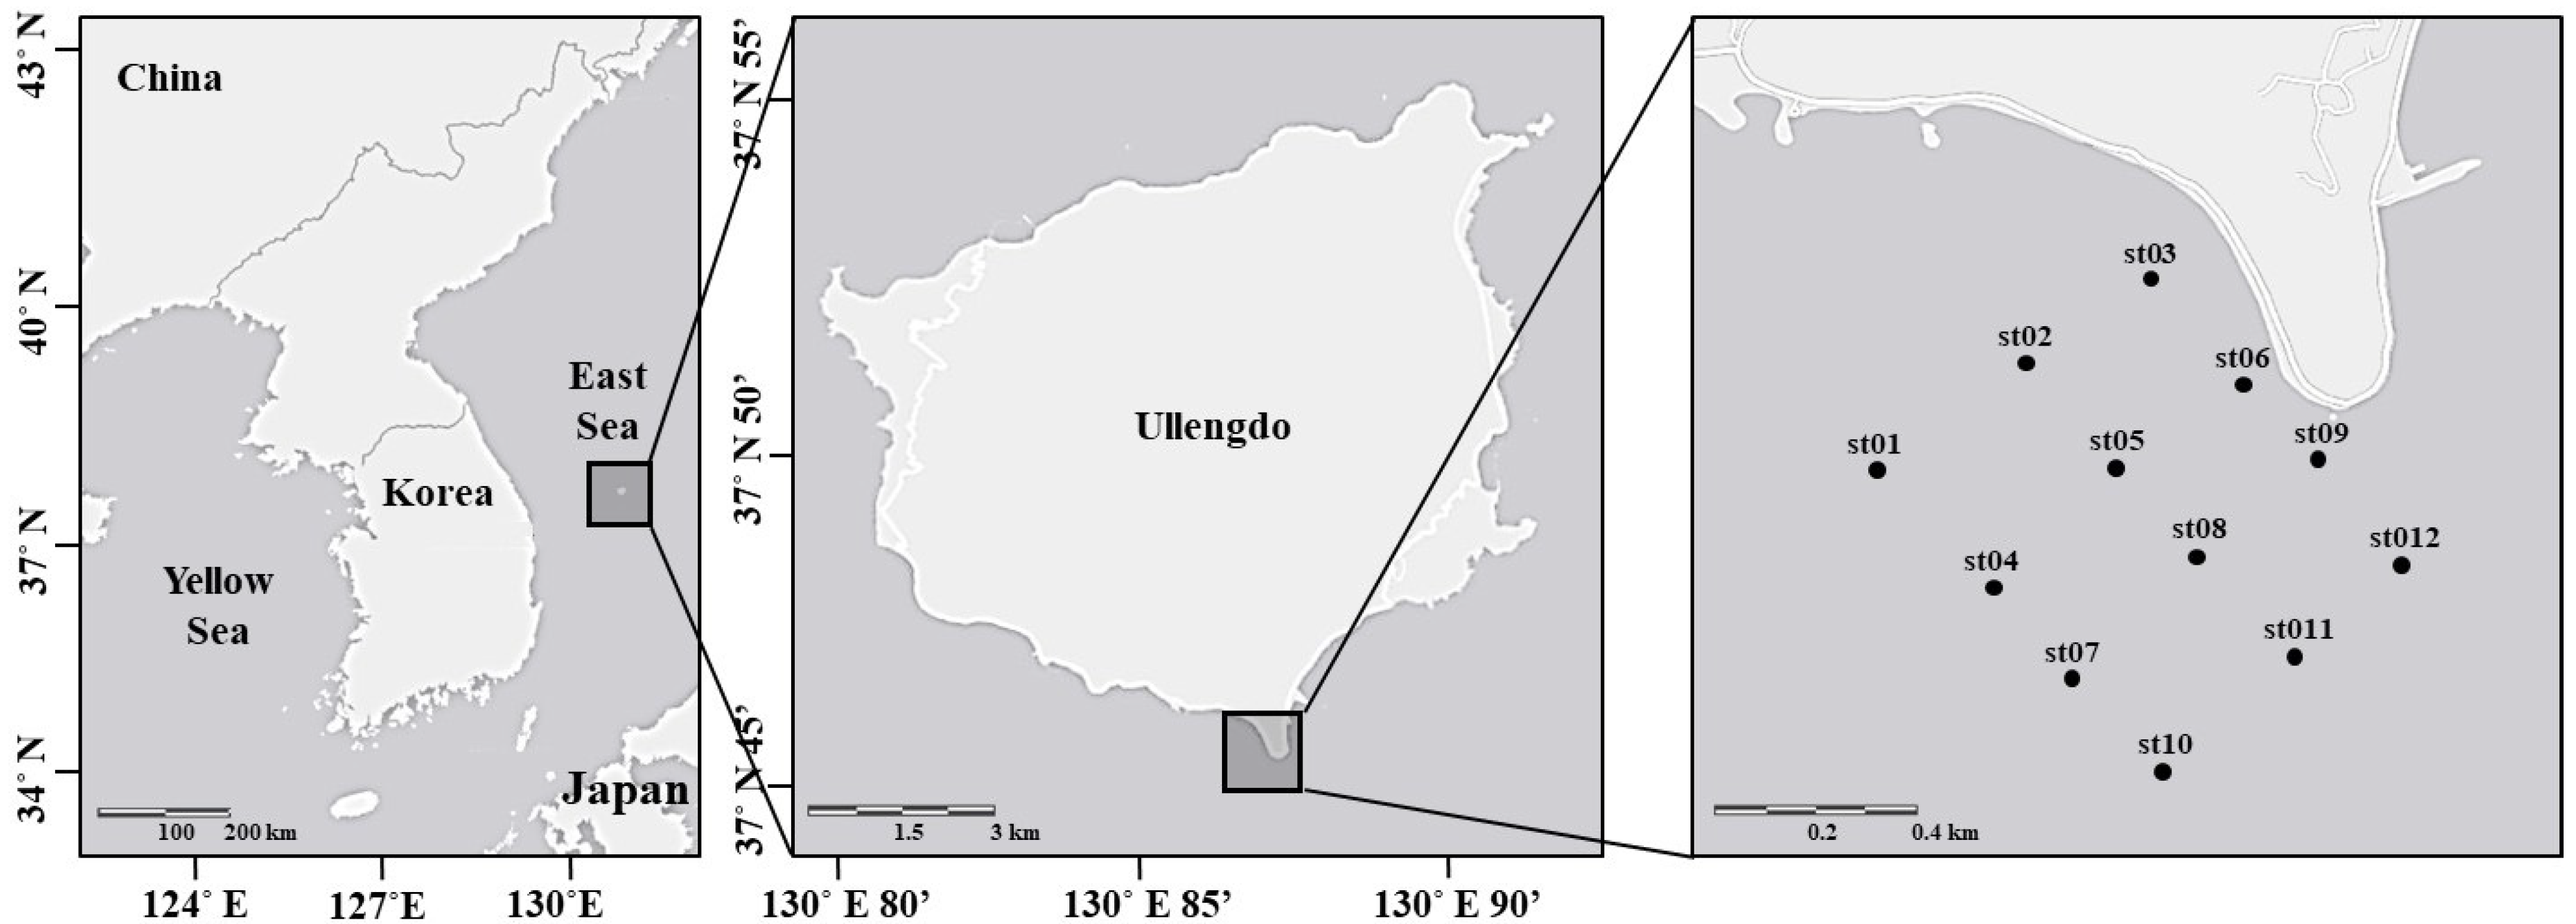
2.1. Study Area
2.2. Sample Processing
2.3. Data Processing
3. Results
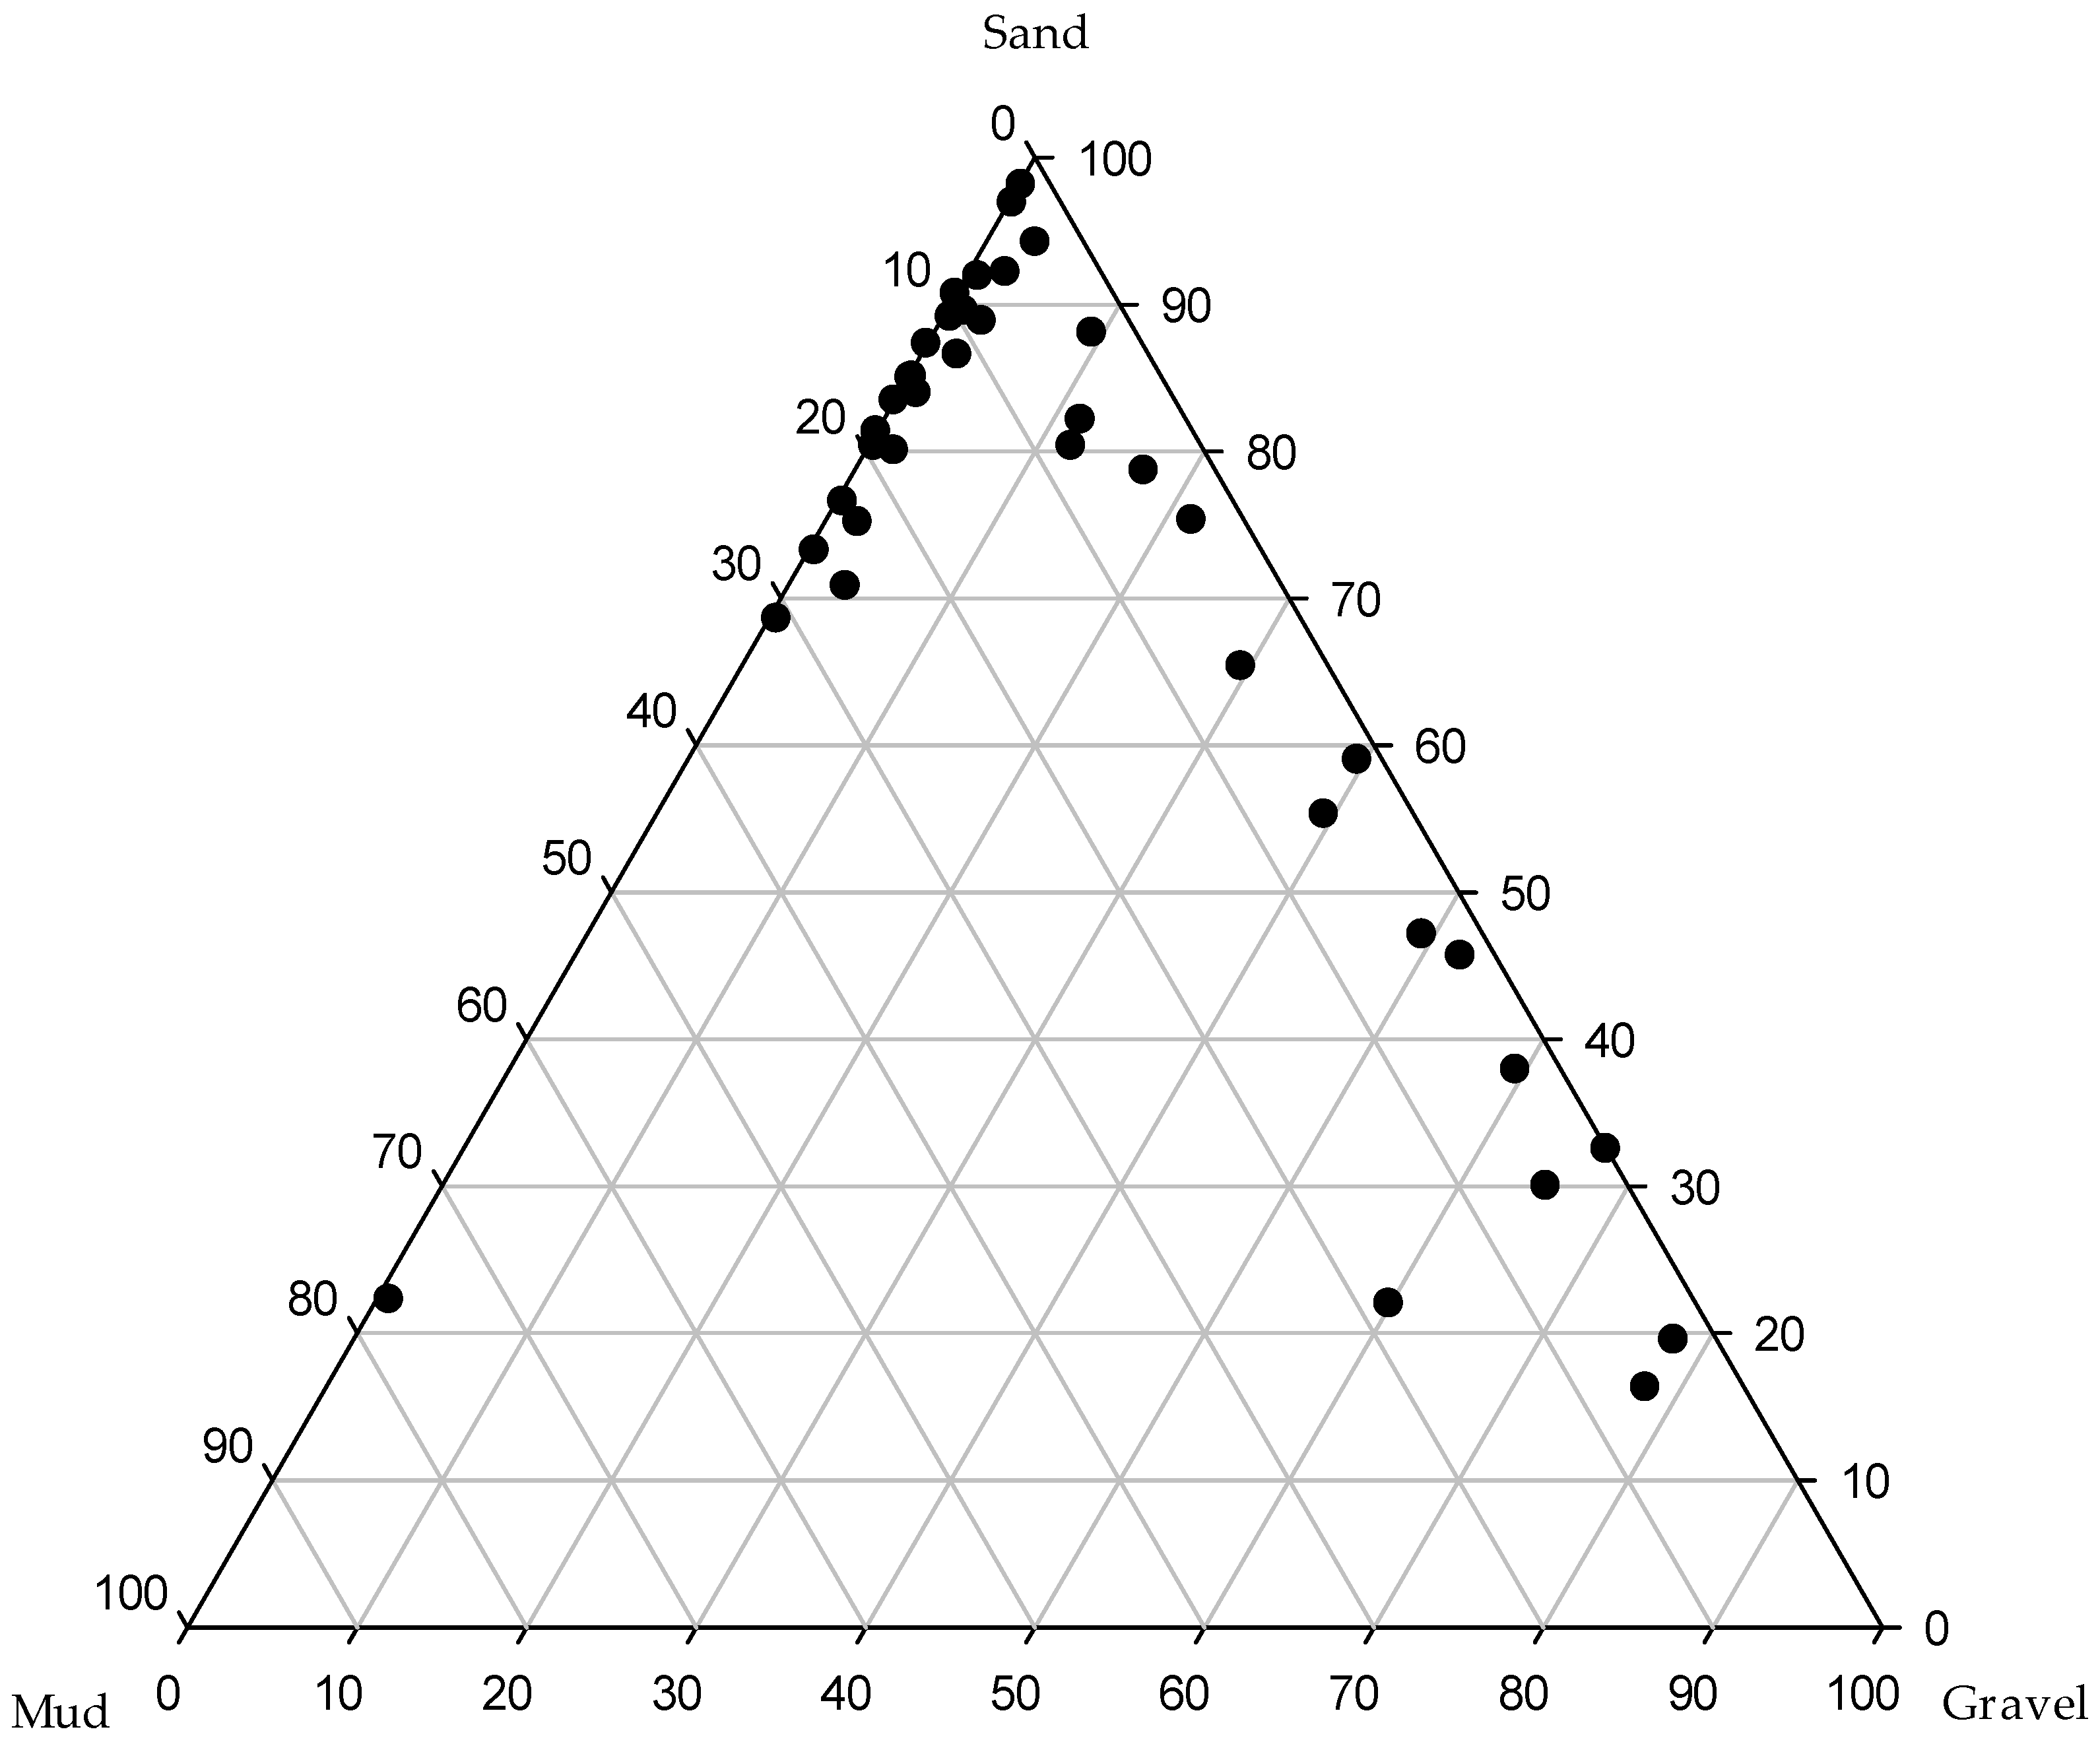
3.1. Environmental Variability
3.2. Dominant Species
3.3. Ecological Indices
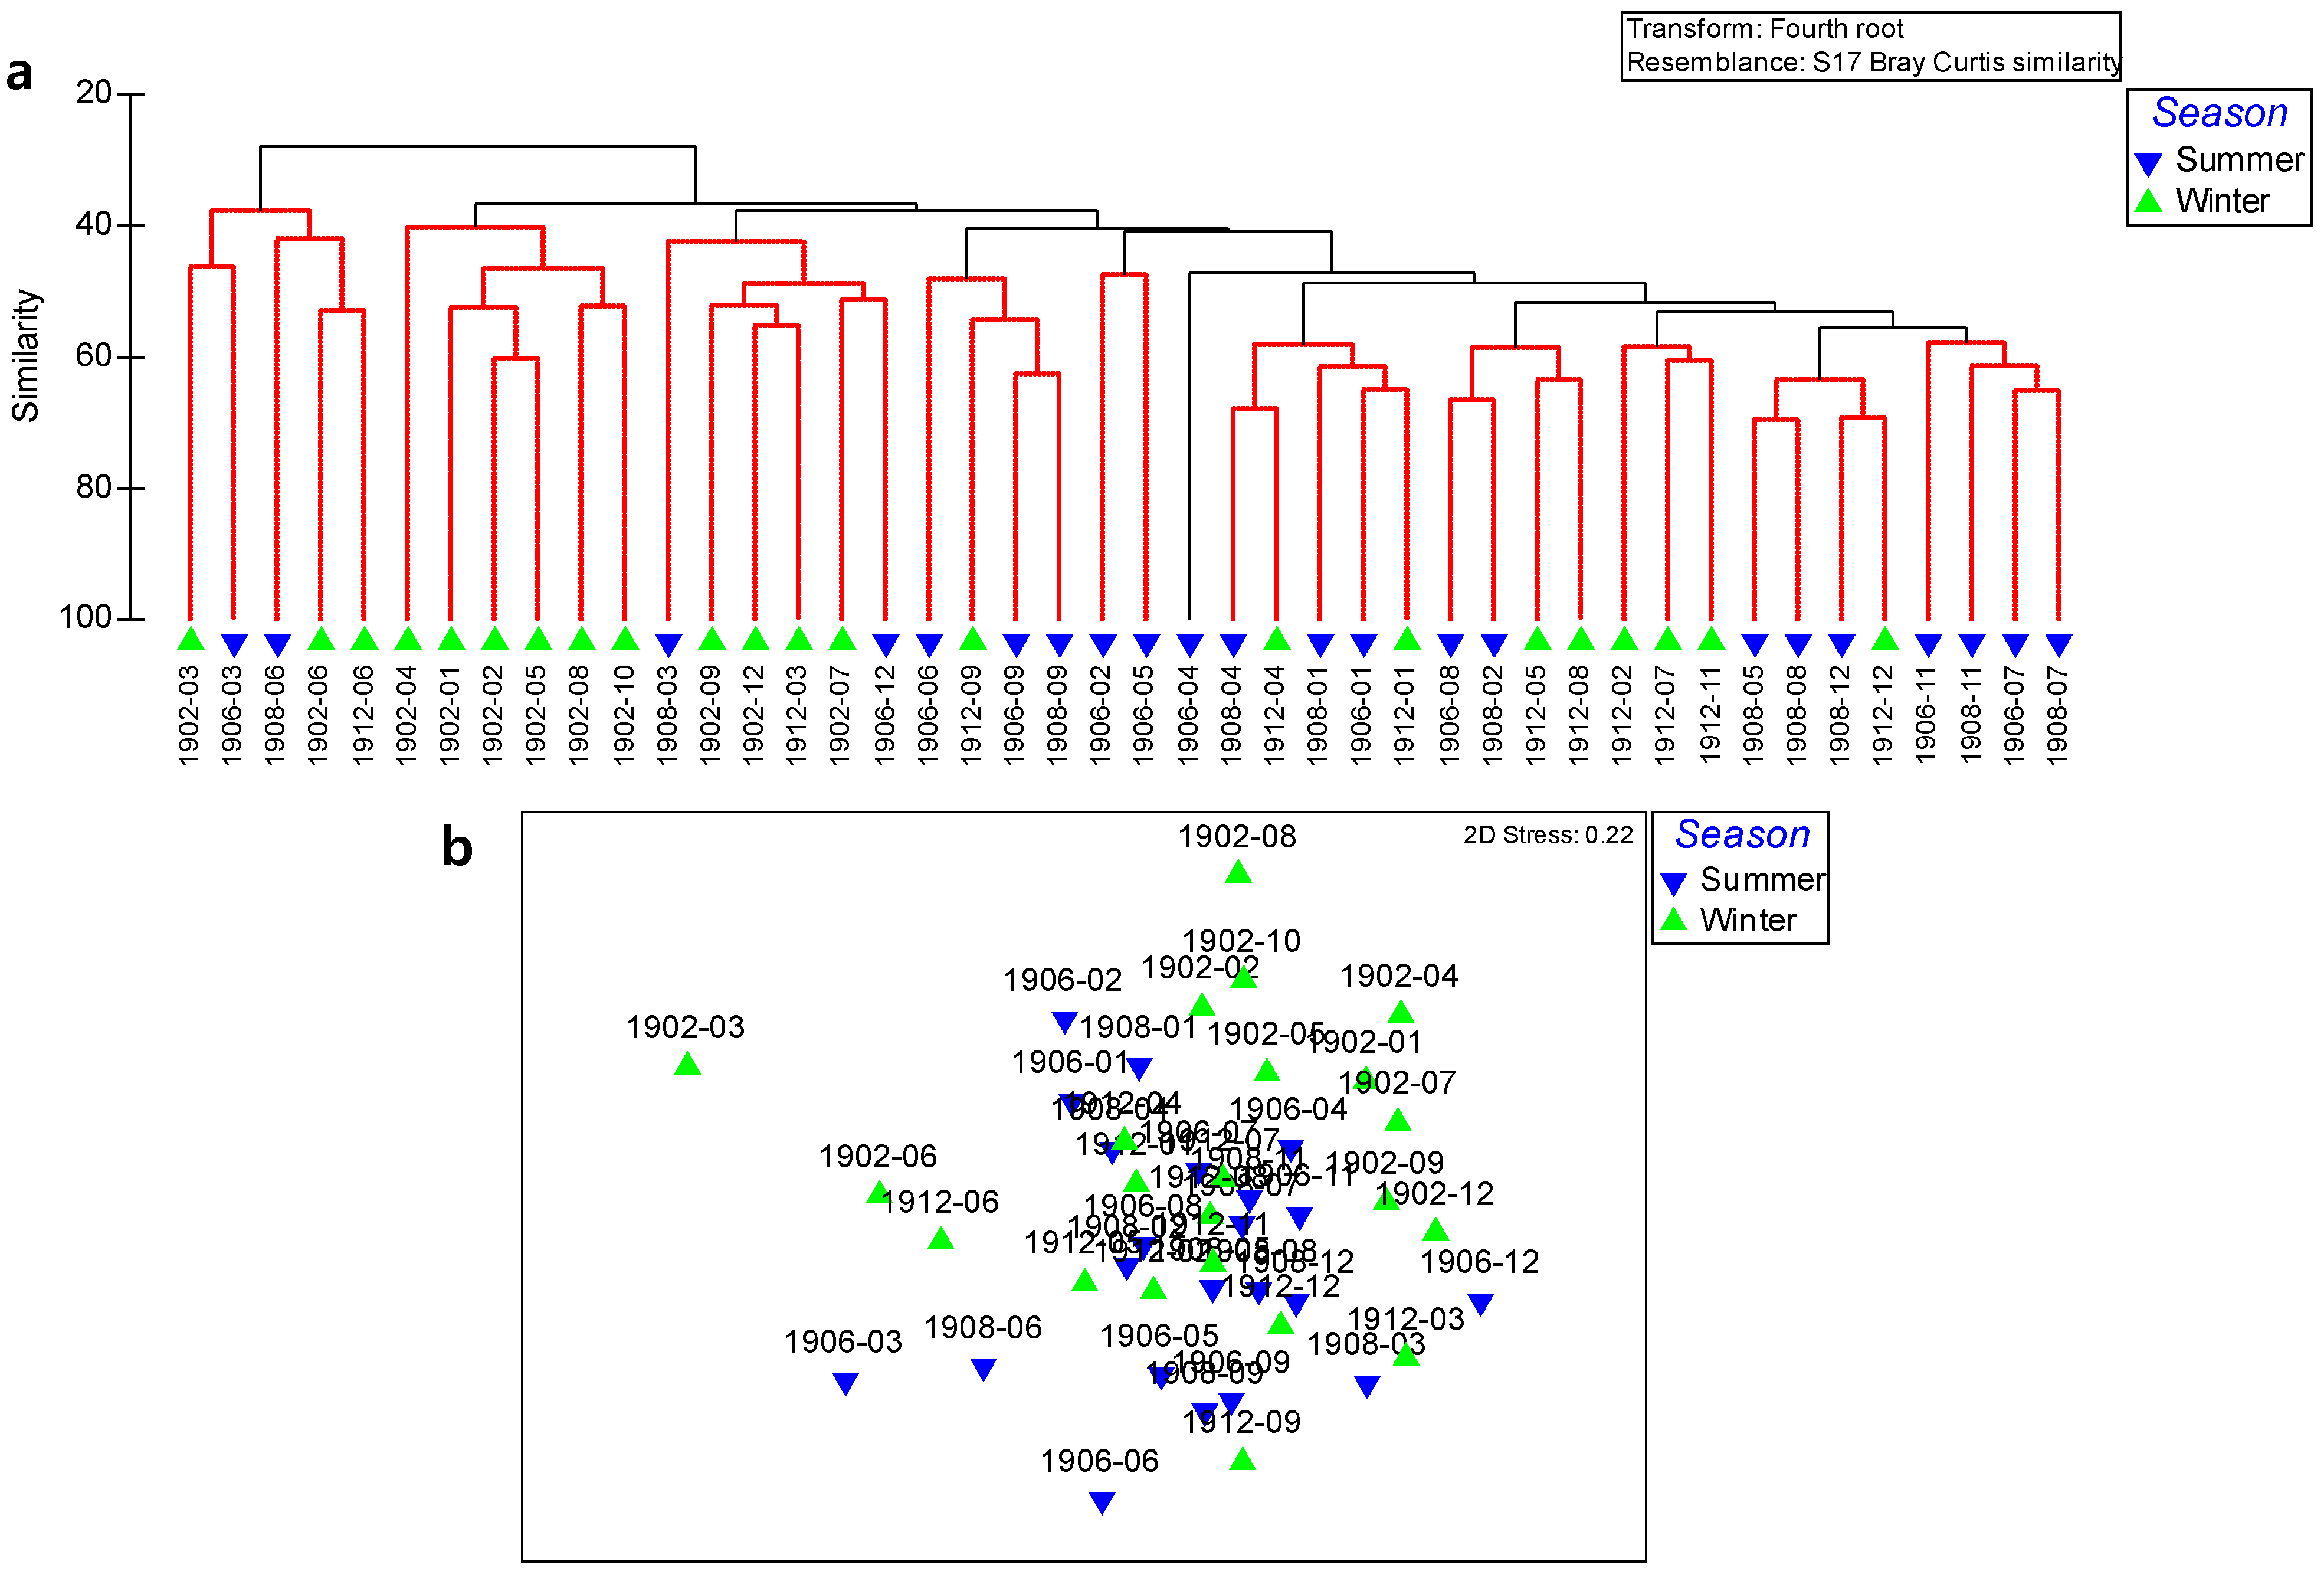
3.4. Polychaete Assemblages
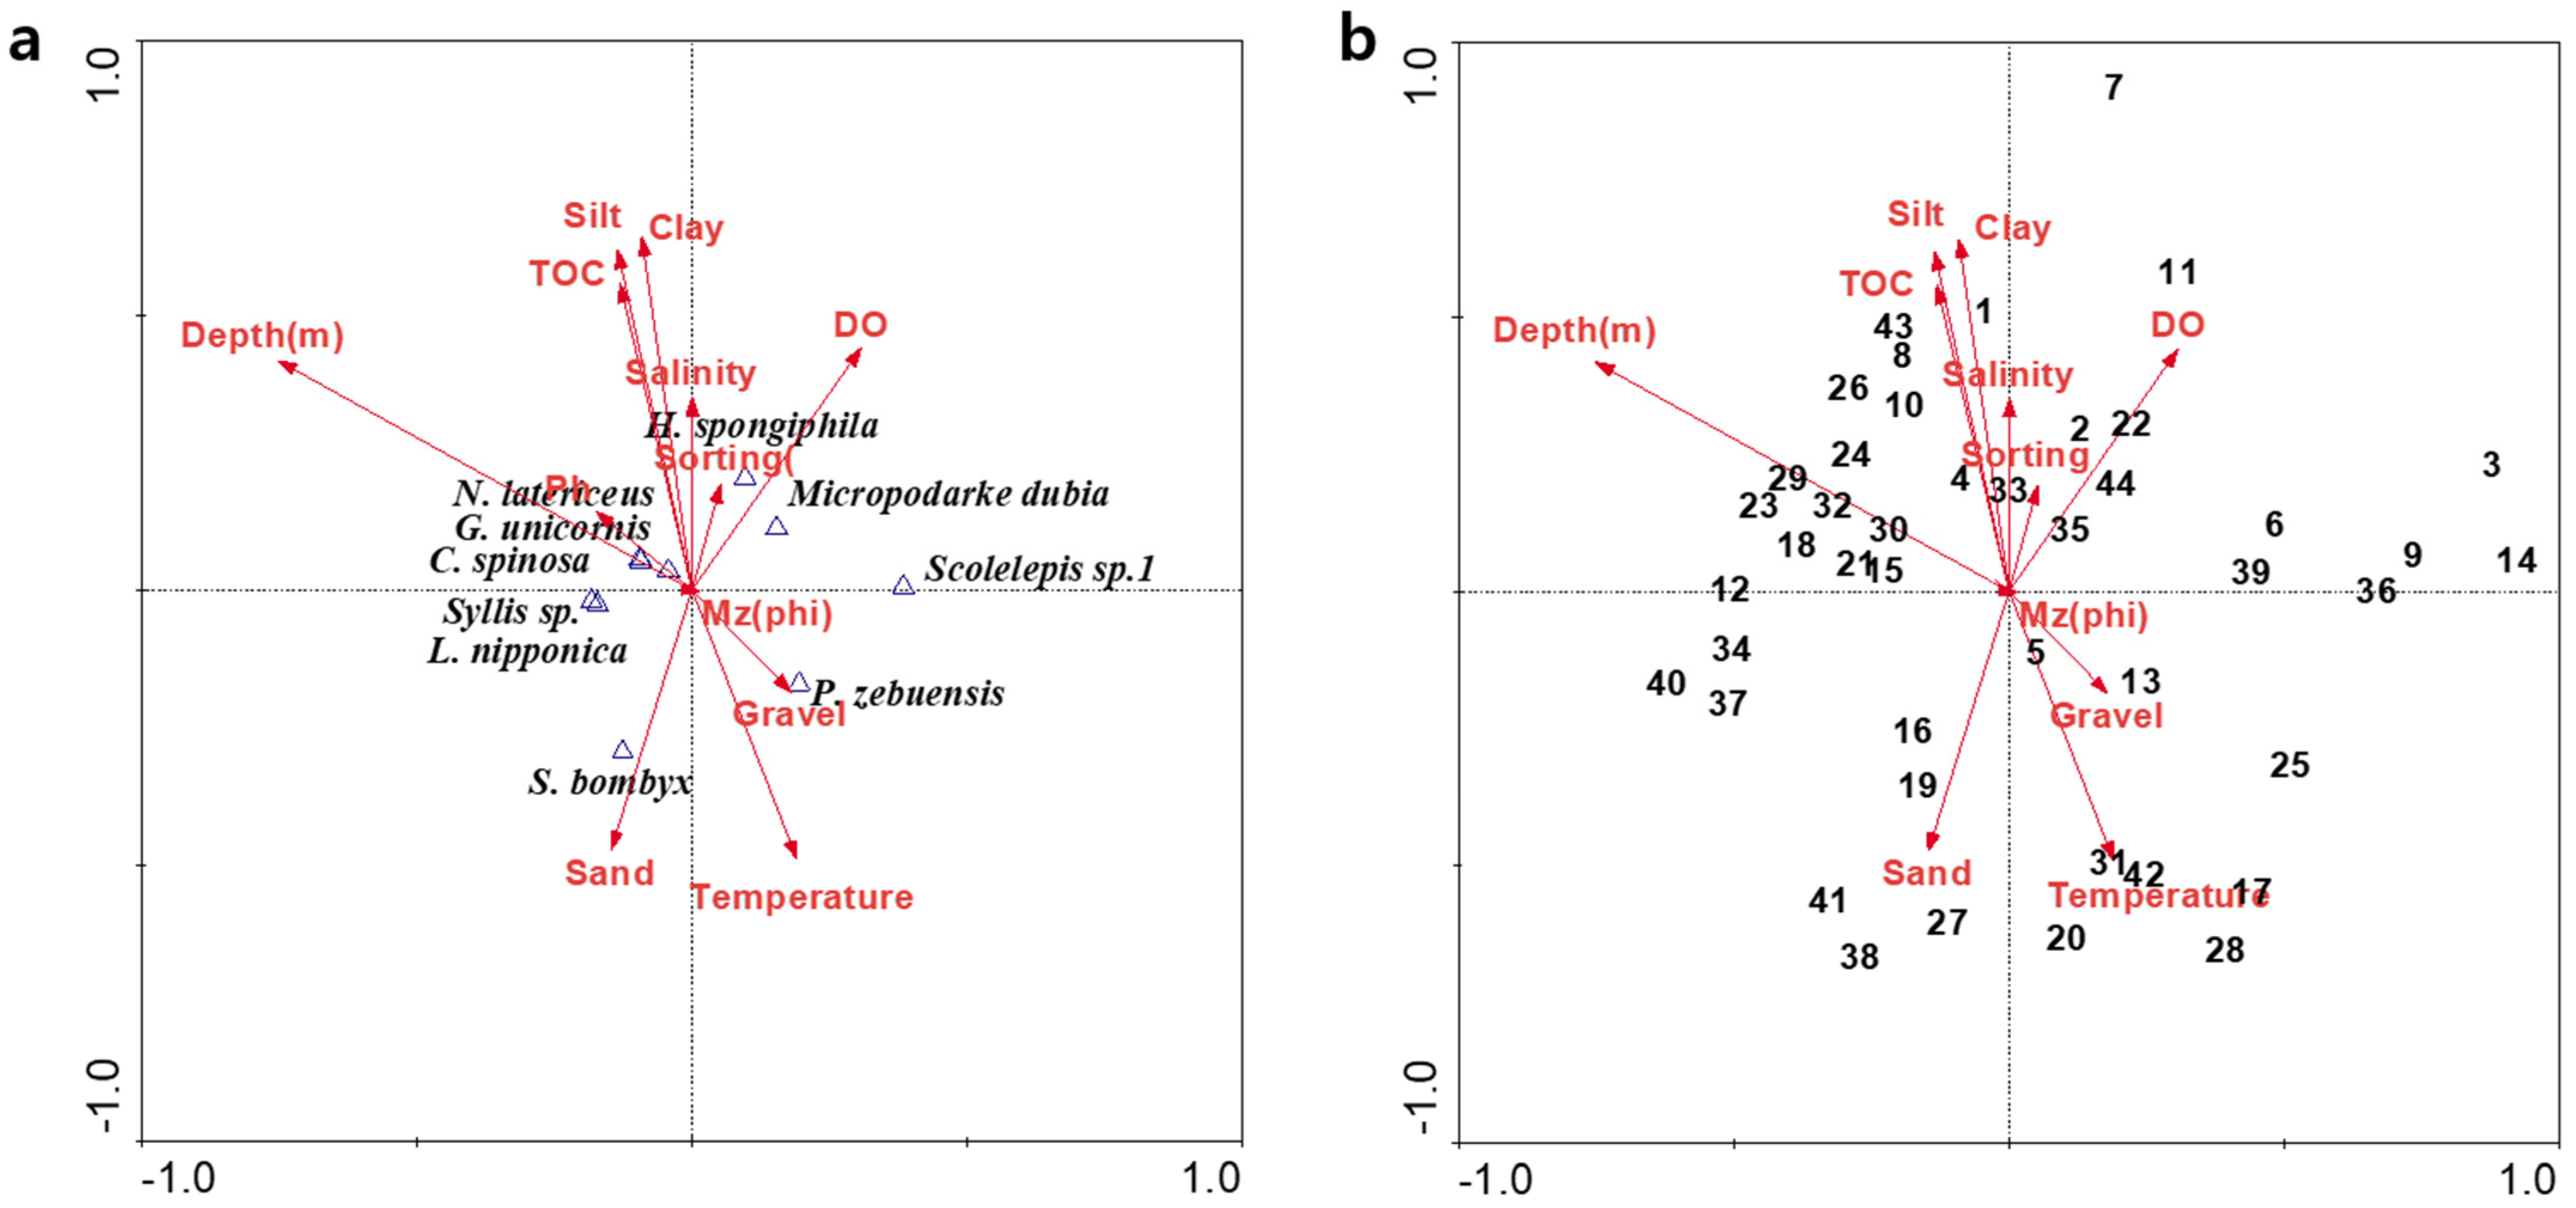
3.5. Environmental Correlation
4. Discussion
Author Contributions
Funding
Institutional Review Board Statement
Informed Consent Statement
Acknowledgments
Conflicts of Interest
References
- Tian, Y.; Kidokoro, H.; Watanabe, T.; Iguchi, N. The late 1980s regime shift in the ecosystem of Tsushima warm current in the Japan/East Sea: Evidence from historical data and possible mechanisms. Prog. Oceanogr. 2008, 77, 127–145. [Google Scholar] [CrossRef]
- Jenkins, W.J. The biogeochemical consequences of changing ventilation in the Japan/East Sea. Mar. Chem. 2008, 108, 137–147. [Google Scholar] [CrossRef]
- Lee, J.Y.; Kang, D.J.; Kim, I.N.; Rho, T.; Lee, T.; Kang, C.K.; Kim, K.R. Spatial and temporal variability in the pelagic ecosystem of the East Sea (Sea of Japan): A review. J. Mar. Syst. 2009, 78, 288–300. [Google Scholar] [CrossRef]
- Senjyu, T. The japan sea intermediate water; its characteristics and circulation. J. Oceanogr. 1999, 55, 111–122. [Google Scholar] [CrossRef]
- Lee, C.; Suh, Y.; Hwang, J. Development on Real Time Application system for Fisheries Oceanography Information. J. Korean Assoc. Geogr. Inf. Stud. 2005, 8, 142–149. [Google Scholar]
- Katoh, O. Long-term fluctuations of water temperature in the Japan Sea and the Tsushima Strait shown by data from prefectural oceanographic observations along the coastal offshore measurement lines. Bull. Coast. Oceanogr. 2006, 44, 19–24. [Google Scholar]
- Kang, Y.S.; Kim, J.Y.; Kim, H.G.; Park, J.H. Long-term changes in zooplankton and its relationship with squid, Todarodes pacificus, catch in Japan/East Sea. Fish. Oceanogr. 2002, 11, 337–346. [Google Scholar] [CrossRef]
- Zhang, C.I.; Lee, J.B.; Seo, Y.I.; Yoon, S.C.; Kim, S. Variations in the abundance of fisheries resources and ecosystem structure in the Japan/East Sea. Prog. Oceanogr. 2004, 61, 245–265. [Google Scholar] [CrossRef]
- Brodeur, R.D.; Ware, D.M. Long-term variability in zooplankton biomass in the subarctic Pacific Ocean. Fish. Oceanogr. 1992, 1, 32–38. [Google Scholar] [CrossRef]
- Sakurai, Y.; Kiyofuji, H.; Saitoh, S.; Goto, T.; Hiyama, Y. Changes in inferred spawning waters of Todarodes pacificus (Cephalopoda: Ommastrephidae) due to chan- ging environmental conditions. ICES J. Mar. Sci. 2000, 57, 24–30. [Google Scholar] [CrossRef]
- Jung, S.W.; Oh, Y.S.; Rho, H.S.; Choi, C.G. Subtidal Marine Algal Community and Endangered Species in Dokdo and Ulleungdo, Two Oceanic Islands in the East Sea of Korea. Ocean Sci. J. 2020, 55, 537–547. [Google Scholar] [CrossRef]
- Yoo, S.J.; Park, J.S. Why is the southwest the most productive region of the East Sea/Sea of Japan? J. Mar. Syst. 2009, 78, 301–315. [Google Scholar] [CrossRef]
- Kwak, J.H.; Lee, S.H.; Park, H.J.; Choy, E.J.; Jeong, H.D.; Kim, K.R.; Kang, C.K. Monthly measured primary and new productivities in the Ulleung Basin as a biological “hot spot” in the East/Japan Sea. Biogeosciences 2013, 10, 4405–4417. [Google Scholar] [CrossRef]
- Kwak, J.H.; Hwang, J.S.; Choy, E.J.; Park, H.J.; Kang, D.J.; Lee, T.S.; Chang, K.I.; Kim, K.R.; Kang, C.K. High primary productivity and f-ratio in summer in the Ulleung basin of the East/Japan Sea. Deep Res. Part I Oceanogr. Res. Pap. 2013, 79, 74–785. [Google Scholar] [CrossRef]
- Mitchell, D.A.; Watts, D.R.; Wimbush, M.; Teague, W.J.; Tracey, K.L.; Book, J.W.; Chang, K.I.; Suk, M.S.; Yoon, J.H. Upper circulation patterns in the Ulleung Basin. Deep Res. Part II Top. Stud. Oceanogr. 2005, 52, 1617–1638. [Google Scholar] [CrossRef]
- Kim, S.T.; Hwang, K.S.; Park, G.J.; Choi, C.G. Benthic algal community of Ulleungdo, East coast of Korea. J. Fish. Mar. Sci. Educ. 2016, 28, 83–90. [Google Scholar]
- Kim, M.K.; Kim, K.T. Studies on the Seaweeds in the Islands of Ullungdo and Dokdo: I. Decrease of Algal Species Compositions and Changes of Marine Algal Flora. Korean Soc. Phycol. 2000, 15, 199. [Google Scholar]
- Patrício, J.; Neto, J.M.; Teixeira, H.; Salas, F.; Marques, J.C. The robustness of ecological indicators to detect long-term changes in the macrobenthos of estuarine systems. Mar. Environ. Res. 2009, 68, 25–36. [Google Scholar] [CrossRef]
- Sanagoudra, S.N.; Bhat, U.G. Species Diversity and Environmental Relationships of Marine Macrobenthic in Gulf of Kutch, Gujarat, West Coast of India. Am. J. Mar. Sci. 2013, 1, 33–37. [Google Scholar]
- Lv, W.; Zhou, W.; Zhao, Y. Macrobenthos functional groups as indicators of ecological restoration in reclaimed intertidal wetlands of China’s Yangtze Estuary. Reg. Stud. Mar. Sci. 2018, 22, 93–100. [Google Scholar] [CrossRef]
- D’Alessandro, M.; Porporato, E.M.D.; Esposito, V.; Giacobbe, S.; Deidun, A.; Nasi, F.; Ferrante, L.; Auriemma, R.; Berto, D.; Renzi, M.; et al. Common patterns of functional and biotic indices in response to multiple stressors in marine harbours ecosystems. Environ. Pollut. 2020, 259, 113959. [Google Scholar] [CrossRef]
- Thistle, D. Natural physical disturbances and communites of marine soft bottoms. Mar. Ecol. 1981, 6, 223–228. [Google Scholar] [CrossRef]
- Hong, J.; Seo, I.S.; Lee, C.G.; Yoon, S.-P.; Jung, R.-H. An Ecological Feature of Benthic Macrofauna during Summer 1997 in Namdaechon Estuary, Yangyang, Korea. J. Korean Fish. Soc. 2000, 33, 230–237. [Google Scholar]
- Kim, A.; Lee, J.L.; Choi, B.H. Analysis of Wave Data and Estimation of Littoral Drifts for the Eastern Coast of Korea. Korean Soc. Coast. Ocean Eng. 2001, 13, 18–34. [Google Scholar]
- Yu, O.H.; Lee, H.G.; Lee, J.H.; Kim, K.T.; Myung, C.S.; Moon, H.T.; Byun, J.Y. Spatial variation in macrobenthic communities affected by the thermal discharge volumes of a nuclear power plant on the East Coast of Korea. Ocean Polar Res. 2013, 35, 299–312. [Google Scholar] [CrossRef][Green Version]
- Hong, S.E.; Choi, Y.K.; Jeong, H.D.; Lee, Y.; Kim, S.W. Community structure of macrobenthos at the intertidal zone of Jukbyeon in the east coast of Korea. J. Korean Soc. Oceanogr. 2017, 23, 331–337. [Google Scholar] [CrossRef]
- Kim, C.H.; Park, C.H. Detailed Bathymetry and Seabed Characteristics of Wangdol-cho, Hupo Bank in the East Sea. Econ. Environ. Geol. 2014, 47, 533–540. [Google Scholar] [CrossRef]
- Paik, S.G.; Kang, R.S.; Jeon, J.O.; Lee, J.H.; Yun, S.G. Distribution patterns of Sandy Bottom Macobenthic Community on the Hupo Coastal Area, in the East Sea of Korea. Ocean Polar Res. 2007, 29, 123–134. [Google Scholar] [CrossRef]
- Choi, C.G.; Lee, H.W.; Hong, B.K. Marine Algal Flora and Community Structure in Dokdo, East Sea, Korea. Korean J. Fish. Aquat. Sci. 2009, 42, 503–508. [Google Scholar]
- Lee, J.S.; An, S.U.; Park, Y.G.; Kim, E.; Kim, D.; Kwon, J.N.; Kang, D.J.; Noh, J.H. Rates of total oxygen uptake of sediments and benthic nutrient fluxes measured using an in situ autonomous benthic chamber in the sediment of the slope off the southwestern part of Ulleung Basin, East Sea. Ocean Sci. J. 2015, 50, 581–588. [Google Scholar] [CrossRef]
- Um, I.K.; Choi, M.S.; Bahk, J.J.; Chun, J.H. Provenance of late Quaternary sediments on the southwestern slope of the Ulleung Basin, East/Japan Sea. Quat. Int. 2017, 459, 153–164. [Google Scholar] [CrossRef]
- Yi, S.; Yun, H.; Park, B.; Koo, W.M.; Yoo, S.; Kang, S. Biostratigraphy of the Ulleung Basin, East Sea (Japan Sea). Mar. Pet. Geol. 2020, 122, 104697. [Google Scholar] [CrossRef]
- Lee, T.; Jung, S.K.; Kim, K.H.; Lee, S.H.; Son, Y.B. Organic carbon cycle in the ulleung basin sediment, East/Japan sea. Appl. Ecol. Environ. Res. 2019, 17, 12165–12179. [Google Scholar] [CrossRef]
- Oh, D.C.; Park, M.K.; Choi, S.H.; Kang, D.J.; Park, S.Y.; Hwang, J.S.; Andreev, A.; Hong, G.H.; Kim, K.R. The air-sea exchange of CO2 in the East Sea (Japan Sea). J. Oceanogr. 1999, 55, 157–169. [Google Scholar] [CrossRef]
- Yoo, B.Y.; Choi, D.K.; Huh, C.; Kang, S.G.; Kim, I.S. A feasibility study on CO2 marine transport in South Korea. Energy Procedia 2013, 37, 3199–3211. [Google Scholar] [CrossRef]
- Choi, S.H.; Kim, D.; Shim, J.H.; Min, H.S. The spatial distribution of surface fCO2 in the Southwestern East Sea/Japan sea during summer 2005. Ocean Sci. J. 2011, 46, 13–21. [Google Scholar] [CrossRef]
- Huh, C.; Kang, S.G.; Hong, S.; Choi, J.S.; Baek, J.H.; Lee, C.S.; Park, Y.C.; Lee, J.S. CO2 storage in marine geological structure: A review of latest progress and its application in Korea. Energy Procedia 2009, 1, 3993–4000. [Google Scholar] [CrossRef]
- Giangrande, A.; Licciano, M.; Musco, L. Polychaetes as environmental indicators revisited. Mar. Pollut. Bull. 2005, 50, 1153–1162. [Google Scholar] [CrossRef]
- Musale, A.S.; Desai, D.V.; Sawant, S.S.; Venkat, K.; Anil, A.C. Distribution and abundance of benthic macroorganisms in and around Visakhapatnam Harbour on the east coast of India. J. Mar. Biol. Assoc. UK 2015, 95, 215–231. [Google Scholar] [CrossRef]
- Jumars, P.A.; Dorgan, K.M.; Lindsay, S.M. Diet of Worms Emended: An Update of Polychaete Feeding Guilds. Annu. Rev. Mar. Sci. 2015, 7, 497–520. [Google Scholar] [CrossRef]
- Shou, L.; Huang, Y.; Zeng, J.; Gao, A.; Liao, Y.; Chen, Q. Seasonal changes of macrobenthos distribution and diversity in Zhoushan sea area. Aquat. Ecosyst. Health Manag. 2009, 12, 110–115. [Google Scholar] [CrossRef]
- Won, E.J.; Raisuddin, S.; Shin, K.H. Evaluation of induction of metallothionein-like proteins (MTLPs) in the polychaetes for biomonitoring of heavy metal pollution in marine sediments. Mar. Pollut. Bull. 2008, 57, 544–551. [Google Scholar] [CrossRef] [PubMed]
- Sukumaran, S.; Vijapure, T.; Mulik, J.A.; Rokade, M.; Gajbhiye, S.N. Macrobenthos in anthropogenically influenced zones of a coralline marine protected area in the Gulf of Kachchh, India. J. Sea Res. 2013, 76, 39–49. [Google Scholar] [CrossRef]
- Silva, A.C.F.; Tavares, P.; Shapouri, M.; Stigter, T.Y.; Monteiro, J.P.; Machado, M.; Cancela da Fonseca, L.; Ribeiro, L. Estuarine biodiversity as an indicator of groundwater discharge. Estuar. Coast. Shelf Sci. 2012, 97, 38–43. [Google Scholar] [CrossRef]
- Sivadas, S.; Ingole, B.; Nanajkar, M. Benthic polychaetes as good indicators of anthropogenic impact. J. Mar. Sci. 2010, 39, 201–211. [Google Scholar]
- Cognetti, G.; Maltagliati, F. Biodiversity and adaptive mechanisms in brackish water fauna. Mar. Pollut. Bull. 2000, 40, 7–14. [Google Scholar] [CrossRef]
- Ansari, Z.A.; Ingole, B.S.; Parulekar, A.H. Effect of high organic enrichment of benthic polychaete population in an estuary. Mar. Pollut. Bull. 1986, 17, 361–365. [Google Scholar] [CrossRef]
- Olsgard, F.; Brattegard, T.; Holthe, T. Polychaetes as surrogates for marine biodiversity: Lower taxonomic resolution and indicator groups. Biodivers. Conserv. 2003, 12, 1033–1049. [Google Scholar] [CrossRef]
- Papageorgiou, N.; Arvanitidis, C.; Eleftheriou, A. Multicausal environmental severity: A flexible framework for microtidal sandy beaches and the role of polychaetes as an indicator taxon. Estuar. Coast. Shelf Sci. 2006, 70, 643–653. [Google Scholar] [CrossRef]
- Dixon-Bridges, K.; Hutchings, P.; Gladstone, W. Effectiveness of habitat classes as surrogates for biodiversity in marine reserve planning. Aquat. Conserv. Mar. Freshw. Ecosyst. 2014, 24, 463–477. [Google Scholar] [CrossRef]
- Jayaraj, K.A.; Josia, J.; Kumar, P.K.D. Infaunal Macrobenthic Community of Soft Bottom Sediment in a Tropical Shelf. J. Coast. Res. 2008, 243, 708–718. [Google Scholar] [CrossRef]
- Kim, S.; Cho, K.; Kim, Y.; Choi, Y. Distribution of fishing boats at night in the East Sea derived from DMSP/OLS imagery. J. Korean Fish. Soc. 2005, 38, 323–330. [Google Scholar]
- Kim, W.K.; Son, Y.S.; Lee, J.H.; Hong, J.P.; Kim, Y.S.; Lee, J.W.; Jo, Q. Macrobenthic community at type and age-different artificial reefs located along the Korean coast of the East Sea. J. Environ. Biol. 2008, 29, 501–505. [Google Scholar] [PubMed]
- Kwon, S.H.; Yu, O.H.; Lee, H.G. Community structure of macrobenthos around the thermal discharge area of the uljin nuclear power plant in the East Sea, Korea. Ocean Polar Res. 2017, 39, 125–148. [Google Scholar] [CrossRef]
- Chang, K.I.; Zhang, C.I.; Park, C.; Kang, D.J.; Ju, S.J.; Lee, S.H.; Wimbush, M. Oceanography of the East Sea (Japan Sea); Springer: Cham, Switzerland, 2015; p. 460. [Google Scholar]
- Won, J.H.; Lee, Y.W. Spatiotemporal Variations of Marine Environmental Parameters in the South-western Region of the East Sea. Sea 2015, 20, 16–28. [Google Scholar] [CrossRef]
- Yan, J.; Xu, Y.; Sui, J.; Li, X.; Wang, H.; Zhang, B. Long-term variation of the macrobenthic community and its relationship with environmental factors in the Yangtze River estuary and its adjacent area. Mar. Pollut. Bull. 2017, 123, 339–348. [Google Scholar] [CrossRef]
- Gage, J.D.; Hughes, D.J.; Vecino, J.L.G. Sieve size influence in estimating biomass, abundance and diversity in samples of deep-sea macrobenthos. Mar. Ecol. Prog. Ser. 2002, 225, 97–107. [Google Scholar] [CrossRef]
- Lambshead, P.; Platt, H.; Shaw, K. The detection of differences among assemblages of marine benthic species based on an assessment of dominance and diversity. J. Nat. Hist. 1983, 17, 859–874. [Google Scholar] [CrossRef]
- Rilov, G. Multi-species collapses at the warm edge of a warming sea. Sci. Rep. 2016, 6, 36897. [Google Scholar] [CrossRef]
- Musale, A.S.; Desai, D.V. Distribution and abundance of macrobenthic polychaetes along the South Indian coast. Environ. Monit. Assess. 2011, 178, 423–436. [Google Scholar] [CrossRef]
- Choi, J.W.; Je, J.G.; Lee, J.H.; Lim, H.S. Distributional Pattern of Macrobenthic Invertebrates on the Shallow Subtidal Sandy Bottos near Kangrung, East Coast of Korea. J. Korean Soc. Oceanogr. 2000, 5, 346–356. [Google Scholar]
- Arrighetti, F.; Penchaszadeh, P.E. Macrobenthos-sediment relationships in a sandy bottom community off Mar del Plata, Argentina. J. Mar. Biol. Assoc. UK 2010, 90, 933–939. [Google Scholar] [CrossRef]
- Fauchald, K.; Jumars, P.A. The diet of worms: A study of polychaete feeding guilds. Oceanogr. Mar. Biol. Annu. Rev. 1979, 17, 193–284. [Google Scholar]
- Pagliosa, P.R. Another diet of worms: The applicability of polychaete feeding guilds as a useful conceptual framework and biological variable. Mar. Ecol. 2005, 26, 246–254. [Google Scholar] [CrossRef]
- De Juan, S.; Thrush, S.F.; Demestre, M. Functional changes as indicators of trawling disturbance on a benthic community located in a fishing ground (NW Mediterranean Sea). Mar. Ecol. Prog. Ser. 2007, 334, 117–129. [Google Scholar] [CrossRef]
- Maurer, D.; Leathem, W.; Menzie, C. The impact of drilling fluid and well cuttings on polychaete feeding guilds from the US northeastern continental shelf. Mar. Pollut. Bull. 1981, 12, 342–347. [Google Scholar] [CrossRef]
- Lima, S.L.; Dill, L.M. Behavioral decisions made under the risk of predation: A review and prospectus. Can. J. Zool. 1990, 68, 619–640. [Google Scholar] [CrossRef]
- Serrano, A.; Velasco, F.; Olaso, I. Polychaete annelids in the diet of demersal fish from the southern shelf of the Bay of Biscay. J. Mar. Biol. Assoc. UK 2003, 83, 619–623. [Google Scholar] [CrossRef]
- Carvalho, S.; Moura, A.; Gaspar, M.B.; Pereira, P.; Cancela Da Fonseca, L.; Falcão, M.; Drago, T.; Leitão, F.; Regala, J. Spatial and inter-annual variability of the macrobenthic communities within a coastal lagoon (Óbidos lagoon) and its relationship with environmental parameters. Acta Oecol. 2005, 27, 143–159. [Google Scholar] [CrossRef]
- Dolbeth, M.; Teixeira, H.; Marques, J.C.; Pardal, M.Â. Feeding guild composition of a macrobenthic subtidal community along a depth gradient. Sci. Mar. 2009, 73, 225–237. [Google Scholar] [CrossRef]
- Carvalho, S.; Pereira, P.; Pereira, F.; de Pablo, H.; Vale, C.; Gaspar, M.B. Factors structuring temporal and spatial dynamics of macrobenthic communities in a eutrophic coastal lagoon (Óbidos lagoon, Portugal). Mar. Environ. Res. 2011, 71, 97–110. [Google Scholar] [CrossRef] [PubMed]
- Kim, J.C.; Park, K.W.; Yoo, K.D.; Jung, S.Y. Spatial and Temporal Distribution of Macrobenthos in Intertidal Hard Bottoms in Dokdo Island. Korean J. Environ. Ecol. 2015, 29, 221–227. [Google Scholar] [CrossRef]
- Kang, S.M.; Lee, H.G.; Kim, S.L.; Choi, J.W.; Park, C.H.; Yu, O.H. Species composition and community structure of macrobenthos during fall on the dokdo coast, Korea. Ocean Polar Res. 2019, 41, 47–61. [Google Scholar]
- Song, S.J.; Park, J.; Ryu, J.; Rho, H.S.; Kim, W.; Khim, J.S. Biodiversity hotspot for marine invertebrates around the Dokdo, East Sea, Korea: Ecological checklist revisited. Mar. Pollut. Bull. 2017, 119, 162–170. [Google Scholar] [CrossRef] [PubMed]
- Pearson, T.; Rosenberg, H. Macrobenthic succession in relation to organic enrichment and pollution of the marine environment. Oceanogr. Mar. Biol. Annu. Rev. 1978, 16, 229–311. [Google Scholar]
- Khan, S.A.; Murugesan, P. Polychaete diversity in Indian estuaries. Indian J. Mar. Sci. 2005, 34, 114–119. [Google Scholar]
- Kwon, S.H.; Lee, J.H.; Yu, O.H. Environmental effects on the benthic polychaete communities aroud the power plant areas in the East Sea of Koea. J. Ocenol. Soc. Korean 2017, 22, 18–30. [Google Scholar]
- Shin, H.C.; Koh, C.H. Polychaetous community in the coastal zone off Samchuntp, southern sea of Koea. J. Ocenol. Soc. Korean 1993, 28, 305–312. [Google Scholar]
- Shin, H.C. Benthic polychaetous community in Kamak Bay, Southern coast of Korea. J. Ocenol. Soc. Korean 1995, 30, 250–261. [Google Scholar]
- Yang, J.K.; Shin, H.C. The influence of the dissolved oxgen of bottom water on the temporal variation of the benthic polychaetous community structure in Dangdon Bay. Ocean Polar Res. 2020, 43, 233–247. [Google Scholar]
- Mandal, S.; Harkantra, S.N. Changes in the soft-bottom macrobenthic diversity and community structure from the ports of Mumbai, India. Environ. Monit. Assess. 2013, 185, 653–672. [Google Scholar] [CrossRef] [PubMed]


| Site | Depth (m) | Tem (°C) | Salinity (psu) | DO (mg/L) | Gravel (%) | Sand (%) | Silt (%) | Clay (%) | Mz (ø) | Sorting (ø) | TOC (%) |
|---|---|---|---|---|---|---|---|---|---|---|---|
| 1902-1 | 88.14 | 11.82 | 34.27 | 8.72 | 0.0 | 83.4 | 13.9 | 2.6 | 2.76 | 1.55 | 0.72 |
| 1902-2 | 59.45 | 11.97 | 34.29 | 8.69 | 2.2 | 92.1 | 4.7 | 1.0 | 2.26 | 1.05 | 0.46 |
| 1902-3 | 18.01 | 12.08 | 34.31 | 8.67 | 0.2 | 98.1 | 1.5 | 0.3 | 2.20 | 0.71 | 0.17 |
| 1902-4 | 107.83 | 11.85 | 34.28 | 8.72 | 3.5 | 70.8 | 21.8 | 4.0 | 3.50 | 2.05 | 0.46 |
| 1902-5 | 81.11 | 11.91 | 34.28 | 8.70 | 12.0 | 80.3 | 6.6 | 1.0 | 2.14 | 1.66 | 0.40 |
| 1902-6 | 33.87 | 12.14 | 34.32 | 8.66 | 3.0 | 94.2 | 2.4 | 0.4 | 2.13 | 0.77 | 0.25 |
| 1902-7 | 110.85 | 11.80 | 34.28 | 8.72 | 0.8 | 22.3 | 61.7 | 15.3 | 5.54 | 2.57 | 0.45 |
| 1902-8 | 92.12 | 11.86 | 34.28 | 8.71 | 0.0 | 90.7 | 7.7 | 1.6 | 2.75 | 0.95 | 0.38 |
| 1902-9 | 37.58 | 11.89 | 34.29 | 8.71 | 49.3 | 47.1 | 3.0 | 0.5 | −0.21 | 2.26 | 0.29 |
| 1902-10 | 114.07 | 11.83 | 34.28 | 8.72 | 0.5 | 80.4 | 15.7 | 3.5 | 2.94 | 1.70 | 0.60 |
| 1902-12 | 96.62 | 11.83 | 34.28 | 8.72 | 59.9 | 22.0 | 15.1 | 3.0 | 0.27 | 3.24 | 0.84 |
| 1906-1 | 96.28 | 11.95 | 34.35 | 6.63 | 0.25 | 96.86 | 2.40 | 0.49 | 2.29 | 0.73 | 0.15 |
| 1906-2 | 52.78 | 13.03 | 34.39 | 6.69 | 2.18 | 86.52 | 9.10 | 2.20 | 2.59 | 1.48 | 0.35 |
| 1906-3 | 19.98 | 16.10 | 34.46 | 6.20 | 0.36 | 80.33 | 16.90 | 2.42 | 2.98 | 1.73 | 0.37 |
| 1906-4 | 100.97 | 12.06 | 34.35 | 6.68 | 2.03 | 75.13 | 19.59 | 3.25 | 3.27 | 1.84 | 0.40 |
| 1906-5 | 64.03 | 16.94 | 34.35 | 5.77 | 2.47 | 88.83 | 7.28 | 1.42 | 2.55 | 0.92 | 0.28 |
| 1906-6 | 36.29 | 13.41 | 34.36 | 6.14 | 11.23 | 86.07 | 2.38 | 0.32 | 1.60 | 1.52 | 0.18 |
| 1906-7 | 111.63 | 11.90 | 34.34 | 6.66 | 1.08 | 83.90 | 13.05 | 1.96 | 2.26 | 1.54 | 0.36 |
| 1906-8 | 79.05 | 12.22 | 34.36 | 6.62 | 9.39 | 88.03 | 2.42 | 0.16 | 2.31 | 1.20 | 0.36 |
| 1906-9 | 55.54 | 12.02 | 34.36 | 6.09 | 29.53 | 65.34 | 4.19 | 0.95 | 1.03 | 2.01 | 0.17 |
| 1906-11 | 87.34 | 12.11 | 34.35 | 6.64 | 0.26 | 85.04 | 11.91 | 2.78 | 2.81 | 1.35 | 0.34 |
| 1906-12 | 60.64 | 12.22 | 34.35 | 6.05 | 77.97 | 19.51 | 2.22 | 0.29 | −1.48 | 1.00 | 0.09 |
| 1908-1 | 88.94 | 13.33 | 34.38 | 5.53 | 0.00 | 81.31 | 16.22 | 2.47 | 2.94 | 1.61 | 0.49 |
| 1908-2 | 60.10 | 14.15 | 34.45 | 5.31 | 0.48 | 89.09 | 8.66 | 1.77 | 2.59 | 1.23 | 0.73 |
| 1908-3 | 21.28 | 22.88 | 33.64 | 5.70 | 67.48 | 32.49 | 0.03 | 0.00 | −1.27 | 1.28 | 0.12 |
| 1908-4 | 102.85 | 12.10 | 34.34 | 5.79 | 0.50 | 68.56 | 26.89 | 4.05 | 3.72 | 1.86 | 1.07 |
| 1908-5 | 69.25 | 15.10 | 34.20 | 6.01 | 17.14 | 78.66 | 3.45 | 0.75 | 1.33 | 2.00 | 0.33 |
| 1908-6 | 27.55 | 22.79 | 33.70 | 5.77 | 39.59 | 58.96 | 1.24 | 0.21 | 0.84 | 2.25 | 0.24 |
| 1908-7 | 110.19 | 11.80 | 34.34 | 5.85 | 0.42 | 73.20 | 22.53 | 3.85 | 3.53 | 1.89 | 0.55 |
| 1908-8 | 72.42 | 13.48 | 34.38 | 5.61 | 1.72 | 80.01 | 15.51 | 2.77 | 3.08 | 1.71 | 0.57 |
| 1908-9 | 34.31 | 21.92 | 33.66 | 5.81 | 11.67 | 82.11 | 5.15 | 1.07 | 1.59 | 1.86 | 0.40 |
| 1908-11 | 100.34 | 12.70 | 34.39 | 5.65 | 65.20 | 29.97 | 4.20 | 0.63 | −0.63 | 2.25 | 0.27 |
| 1908-12 | 51.62 | 16.55 | 34.38 | 5.67 | 0.16 | 84.96 | 12.67 | 2.21 | 2.86 | 1.32 | 0.83 |
| 1912-01 | 81.83 | 14.77 | 33.69 | 5.54 | 52.34 | 45.64 | 1.69 | 0.34 | −0.64 | 1.56 | 0.80 |
| 1912-02 | 49.48 | 15.12 | 33.83 | 5.46 | 0.41 | 76.54 | 19.72 | 3.33 | 3.33 | 1.71 | 0.58 |
| 1912-03 | 16.40 | 15.63 | 33.88 | 5.44 | 0.73 | 91.86 | 6.27 | 1.14 | 2.60 | 0.80 | 0.51 |
| 1912-04 | 94.92 | 14.55 | 33.78 | 5.33 | 59.46 | 37.90 | 2.26 | 0.39 | −0.64 | 2.05 | 0.32 |
| 1912-05 | 69.35 | 14.96 | 33.71 | 5.58 | 21.67 | 75.28 | 2.55 | 0.51 | 1.30 | 2.00 | 0.24 |
| 1912-06 | 26.79 | 15.40 | 33.86 | 5.53 | 0.00 | 87.26 | 10.64 | 2.10 | 2.75 | 1.29 | 0.42 |
| 1912-07 | 88.31 | 14.85 | 33.69 | 5.61 | 1.07 | 89.53 | 7.94 | 1.46 | 2.68 | 1.12 | 0.38 |
| 1912-08 | 81.77 | 14.60 | 33.74 | 5.51 | 39.47 | 55.29 | 4.34 | 0.90 | 0.66 | 2.36 | 0.31 |
| 1912-09 | 34.67 | 15.25 | 33.84 | 5.55 | 11.67 | 82.11 | 5.15 | 1.07 | 1.59 | 1.86 | 0.40 |
| 1912-11 | 94.06 | 13.13 | 34.05 | 4.83 | 77.91 | 16.28 | 5.04 | 0.77 | −1.38 | 1.93 | 0.69 |
| 1912-12 | 38.83 | 14.66 | 33.80 | 5.59 | 0.16 | 84.96 | 12.67 | 2.21 | 2.86 | 1.32 | 0.83 |
| No | Family | SN | Adv (ind. m−2) | Summer | Winter | FT |
|---|---|---|---|---|---|---|
| 1 | Ampharetidae | 4 | 18.3 | * | * | SR-De |
| 2 | Aphroditidae | 1 | 0.5 | - | * | SS/Pr |
| 3 | Capitellidae | 2 | 42.0 | * | * | SS-De |
| 4 | Chrysopetalidae | 1 | 2.4 | * | * | Pr |
| 5 | Cirratulidae | 5 | 50.0 | * | * | SR-De |
| 6 | Dorvilleidae | 2 | 10.0 | - | * | Pr |
| 7 | Eunicidae | 3 | 10.1 | * | * | Pr |
| 8 | Euphrosinidae | 1 | 7.5 | * | * | Pr |
| 9 | Flabelligeridae | 1 | 0.1 | - | * | Su |
| 10 | Glyceridae | 9 | 39.4 | * | * | Pr |
| 11 | Hesionidae | 7 | 34.9 | * | * | Pr |
| 12 | Lacydoniidae | 1 | 2.3 | * | * | SS-De |
| 13 | Lumbrineridae | 5 | 60.3 | * | * | De/Dt/Pr |
| 14 | Magelonidae | 2 | 1.6 | * | * | SR-De |
| 15 | Maldanidae | 10 | 21.3 | * | * | SS-De |
| 16 | Nephtyidae | 2 | 5.5 | * | * | Pr |
| 17 | Nereididae | 1 | 0.1 | - | * | Dt/Pr |
| 18 | Onuphidae | 2 | 4.2 | * | * | SS-De |
| 19 | Opheliidae | 4 | 1.1 | * | * | SS-De |
| 20 | Orbiniidae | 1 | 16.6 | * | * | SS-De |
| 21 | Oweniidae | 3 | 1.4 | * | * | Su |
| 22 | Paraonidae | 3 | 17.7 | * | * | SR-De |
| 23 | Pectinariidae | 1 | 0.6 | * | * | Su |
| 24 | Phyllodocidae | 3 | 1.4 | * | * | Pr |
| 25 | Pilargidae | 1 | 7.4 | * | * | Pr |
| 26 | Pisionidae | 1 | 2.8 | * | * | SS-De |
| 27 | Polynoidae | 5 | 5.8 | * | * | Pr |
| 28 | Sabellidae | 7 | 127.8 | * | * | Su |
| 29 | Scalibregmidae | 1 | 0.1 | * | - | SS-De |
| 30 | Sigalionidae | 2 | 1.1 | * | * | Pr |
| 31 | Spionidae | 16 | 142.8 | * | * | De/Su |
| 32 | Syllidae | 4 | 107.7 | * | * | Pr |
| 33 | Terebellidae | 5 | 25.5 | * | * | SR-De |
| 34 | Trichobranchidae | 2 | 2.5 | * | * | De |
| Species | Adv (ind. m−2) | Per (%) | Feeding Type |
|---|---|---|---|
| Pseudobranchiomma zebuensis | 120.45 | 15.59 | Su |
| Scolelepis sp. | 66.70 | 8.63 | De/Su |
| Haplosyllis spongiphila | 56.59 | 7.32 | Pr |
| Lumbrineris nipponica | 48.86 | 6.32 | De/Dt/Pr |
| Chaetozone spinosa | 44.55 | 5.76 | SR-De |
| Syllis sp. | 42.16 | 5.46 | Pr |
| Notomastus latericeus | 40.34 | 5.22 | SS-De |
| Micropodarke dubia | 27.95 | 3.62 | Pr |
| Spiophanes bombyx | 25.57 | 3.31 | De/Su |
| Glycera unicornis | 23.52 | 3.04 | Pr |
| Site | S | N | d | J’ | H’ (Loge) |
|---|---|---|---|---|---|
| 01 | 24.0 ± 4.1 | 761.2 ± 273.8 | 3.50 ± 0.55 | 0.78 ± 0.04 | 2.46 ± 0.08 |
| 02 | 24.2 ± 5.3 | 507.5 ± 110.7 | 3.75 ± 0.90 | 0.84 ± 0.03 | 2.69 ± 0.25 |
| 03 | 17.5 ± 6.3 | 848.7 ± 247.4 | 2.42 ± 0.85 | 0.67 ± 0.10 | 1.86 ± 0.30 |
| 04 | 23.7 ± 1.1 | 473.7 ± 85.2 | 3.70 ± 0.10 | 0.83 ± 0.05 | 2.64 ± 0.15 |
| 05 | 27.0 ± 1.6 | 565.0 ± 175.4 | 4.15 ± 0.42 | 0.77 ± 0.15 | 2.54 ± 0.53 |
| 06 | 24.7 ± 2.3 | 1280.0 ± 1275.0 | 3.57 ± 0.49 | 0.67 ± 0.21 | 2.15 ± 0.67 |
| 07 | 30.7 ± 2.9 | 601.2 ± 126.2 | 4.65 ± 0.38 | 0.83 ± 0.03 | 2.86 ± 0.12 |
| 08 | 24.2 ± 7.9 | 556.2 ± 278.2 | 3.72 ± 1.06 | 0.84 ± 0.04 | 2.62 ± 0.31 |
| 09 | 22.0 ± 2.7 | 727.5 ± 375.9 | 3.41 ± 0.51 | 0.69 ± 0.22 | 2.11 ± 0.68 |
| 10 | 17.0 ± 0.0 | 355.0 ± 0.0 | 2.72 ± 0.00 | 0.82 ± 0.00 | 2.33 ± 0.00 |
| 11 | 30.3 ± 5.2 | 795.0 ± 145.7 | 4.39 ± 0.75 | 0.78 ± 0.00 | 2.66 ± 0.15 |
| 12 | 30.7 ± 6.5 | 1495.0 ± 862.5 | 4.20 ± 1.08 | 0.70 ± 0.12 | 2.38 ± 0.48 |
| Group Summer | Average Similarity: 43.37 | ||||
|---|---|---|---|---|---|
| Species | Av.Abund | Av.Sim | Contrib % | Cum % | |
| Notomastus latericeus | 2.37 | 3.92 | 9.04 | 9.04 | |
| Syllis sp. | 2.33 | 3.65 | 8.41 | 17.45 | |
| Lumbrineris nipponica | 2.26 | 3.31 | 7.62 | 25.07 | |
| Glycera unicornis | 1.95 | 2.85 | 6.57 | 31.64 | |
| Thelepus sp. | 1.76 | 2.74 | 6.32 | 37.96 | |
| Chaetozone spinosa | 2.08 | 2.72 | 6.28 | 44.24 | |
| Prionospio sp. | 1.43 | 2.11 | 4.86 | 49.1 | |
| Glycera sp. | 1.35 | 2.04 | 4.7 | 53.8 | |
| Group Winter | Average similarity: 38.32 | ||||
| Species | Av.Abund | Av.Sim | Contrib % | Cum % | |
| Chaetozone spinosa | 2.29 | 4.22 | 11 | 11 | |
| Notomastus latericeus | 2.03 | 3.05 | 7.97 | 18.97 | |
| Thelepus sp. | 1.82 | 2.66 | 6.93 | 25.9 | |
| Lumbrineris nipponica | 1.79 | 2.22 | 5.81 | 31.71 | |
| Glycera unicornis | 1.6 | 2.16 | 5.62 | 37.33 | |
| Pseudobranchiomma zebuensis | 1.62 | 1.75 | 4.58 | 41.91 | |
| Clymenella koellikeri | 1.33 | 1.58 | 4.12 | 46.03 | |
| Ampharete arctica | 1.27 | 1.49 | 3.88 | 49.91 | |
| Groups Summer & Winter | Average dissimilarity = 61.95 | ||||
| Species | Av.Abund (Summer) | Av.Abund (Winter) | Av.Diss | Contrib % | Cum % |
| Pseudobranchiomma zebuensis | 1.82 | 1.62 | 1.91 | 3.09 | 3.09 |
| Syllis sp. | 2.33 | 1.23 | 1.77 | 2.87 | 5.95 |
| Scolelepis sp. | 0.93 | 1.35 | 1.61 | 2.6 | 8.55 |
| Haplosyllis spongiphila | 1.25 | 1.24 | 1.54 | 2.49 | 11.04 |
| Lumbrineris nipponica | 2.26 | 1.79 | 1.43 | 2.3 | 13.35 |
| Micropodarke dubia | 1.07 | 1.05 | 1.39 | 2.24 | 15.58 |
| Prionospio bocki | 1.14 | 1.2 | 1.34 | 2.16 | 17.75 |
| Leitoscoloplos pugettensis | 1.03 | 1.07 | 1.33 | 2.14 | 19.89 |
| Environmental Variables | Axis 1 | Axis 2 | Axis 3 | Axis 4 |
|---|---|---|---|---|
| Depth | −0.649 | 0.319 | −0.113 | −0.084 |
| Temperature | 0.165 | −0.375 | −0.076 | 0.045 |
| Salinity | 0.001 | 0.269 | 0.066 | −0.155 |
| DO | 0.265 | 0.337 | 0.028 | −0.392 |
| Gravel | 0.155 | −0.142 | −0.254 | 0.199 |
| Sand | −0.127 | −0.362 | 0.245 | −0.254 |
| Silt | −0.117 | 0.474 | −0.069 | −0.152 |
| Clay | −0.078 | 0.491 | −0.074 | −0.198 |
| Mz | 0.014 | −0.002 | 0.006 | −0.323 |
| Sorting | 0.046 | 0.148 | −0.236 | 0.015 |
| TOC | −0.113 | 0.427 | −0.096 | 0.090 |
| Eigenvalues | 0.298 | 0.132 | 0.064 | 0.026 |
| Species-environment correlations | 0.863 | 0.765 | 0.638 | 0.635 |
| Cumulative percentage variance | - | - | - | - |
| of species data | 26.7 | 38.6 | 44.4 | 46.7 |
| of species-environment relation | 54.4 | 78.6 | 90.3 | 95 |
| Tem | Sal | DO | Grav | Sand | Silt | Clay | Mz(phi) | Sorting Value | TOC | P. zebuensis | Scolelepis sp. | H. spongiphila | L. nipponica | C. spinosa | Syllis sp. | N. latericeus | M. dubia | S. bombyx | |
|---|---|---|---|---|---|---|---|---|---|---|---|---|---|---|---|---|---|---|---|
| Depth (m) | −0.645 *** | 0.108 | 0.252 | −0.01 | −0.319 * | 0.441 ** | 0.443 ** | 0.245 | 0.338 * | 0.286 | −0.398 ** | −0.351 * | 0.034 | 0.512 *** | 0.541 *** | 0.348 * | 0.62 *** | −0.105 | −0.218 |
| Temperature (°C) | −0.279 | −0.72 *** | 0.137 | 0.072 | −0.311 * | −0.332 * | −0.231 | −0.128 | −0.123 | 0.276 | −0.082 | −0.08 | −0.016 | −0.295 | 0.134 | −0.306 * | 0.007 | 0.362 | |
| Salinity (psu) | 0.234 | −0.25 | 0.219 | 0.243 | 0.192 | 0.291 | −0.184 | −0.056 | −0.095 | 0.060 | −0.018 | 0.080 | 0.208 | 0.155 | 0.085 | −0.011 | −0.11 | ||
| DO (mg/L) | 0.175 | −0.34 * | 0.039 | 0.041 | −0.065 | 0.333 * | 0.338 * | −0.057 | −0.24 | 0.043 | 0.117 | 0.055 | 0.112 | 0.092 | 0.049 | −0.048 | |||
| Gravel (%) | −0.642 *** | −0.56 *** | −0.558 *** | −0.802 *** | 0.451 ** | −0.367 * | 0.381 * | −0.147 | 0.125 | −0.040 | −0.153 | 0.177 | 0.019 | 0.108 | 0.324 * | ||||
| Sand (%) | −0.019 | −0.021 | 0.33 * | −0.788 *** | −0.039 | −0.143 | 0.284 | −0.255 | 0.002 | 0.076 | −0.145 | −0.232 | −0.210 | −0.015 | |||||
| Silt (%) | 0.98 *** | 0.837 *** | 0.211 | 0.68 *** | −0.281 | −0.071 | 0.159 | 0.118 | 0.199 | −0.056 | 0.203 | 0.118 | −0.267 | ||||||
| Clay (%) | 0.821 *** | 0.218 | 0.68 *** | −0.258 | −0.064 | 0.195 | 0.102 | 0.194 | −0.091 | 0.178 | 0.167 | −0.291 | |||||||
| Mz (ø) | −0.127 | 0.504 *** | −0.348 * | −0.018 | −0.030 | 0.114 | 0.217 | −0.167 | 0.036 | 0.005 | −0.284 | ||||||||
| Sorting (ø) | 0.123 | 0.065 | −0.273 | 0.136 | 0.071 | −0.116 | 0.025 | 0.058 | 0.089 | 0.095 | |||||||||
| TOC (%) | −0.216 | −0.14 | 0.226 | 0.153 | 0.243 | 0.093 | 0.264 | 0.112 | −0.109 | ||||||||||
| P. zebuensis | 0.177 | 0.384 * | −0.319 * | −0.47 ** | −0.107 | −0.132 | 0.59 *** | 0.049 | |||||||||||
| Scolelepis sp. | −0.081 | −0.489 *** | −0.328 * | −0.399 ** | −0.226 | 0.188 | −0.363 * | ||||||||||||
| H. spongiphila | −0.184 | −0.187 | 0.005 | 0.295 | 0.634 *** | −0.284 | |||||||||||||
| L. nipponica | 0.536 *** | 0.675 *** | 0.45 ** | −0.274 | 0.054 | ||||||||||||||
| C. spinosa | 0.386 ** | 0.496 *** | −0.34 * | 0.137 | |||||||||||||||
| Syllis sp. | 0.657 *** | −0.079 | 0.251 | ||||||||||||||||
| N. latericeus | 0.161 | −0.127 | |||||||||||||||||
| M. dubia | −0.362 * |
Publisher’s Note: MDPI stays neutral with regard to jurisdictional claims in published maps and institutional affiliations. |
© 2021 by the authors. Licensee MDPI, Basel, Switzerland. This article is an open access article distributed under the terms and conditions of the Creative Commons Attribution (CC BY) license (https://creativecommons.org/licenses/by/4.0/).
Share and Cite
Kim, S.-L.; Yu, O.-H. Understanding the Spatial and Temporal Distribution and Environmental Characteristics of Polychaete Assemblages in the Coastal Waters of Ulleungdo, East Sea of Korea. J. Mar. Sci. Eng. 2021, 9, 1310. https://doi.org/10.3390/jmse9111310
Kim S-L, Yu O-H. Understanding the Spatial and Temporal Distribution and Environmental Characteristics of Polychaete Assemblages in the Coastal Waters of Ulleungdo, East Sea of Korea. Journal of Marine Science and Engineering. 2021; 9(11):1310. https://doi.org/10.3390/jmse9111310
Chicago/Turabian StyleKim, Sang-Lyeol, and Ok-Hwan Yu. 2021. "Understanding the Spatial and Temporal Distribution and Environmental Characteristics of Polychaete Assemblages in the Coastal Waters of Ulleungdo, East Sea of Korea" Journal of Marine Science and Engineering 9, no. 11: 1310. https://doi.org/10.3390/jmse9111310
APA StyleKim, S.-L., & Yu, O.-H. (2021). Understanding the Spatial and Temporal Distribution and Environmental Characteristics of Polychaete Assemblages in the Coastal Waters of Ulleungdo, East Sea of Korea. Journal of Marine Science and Engineering, 9(11), 1310. https://doi.org/10.3390/jmse9111310