Article

Dynamic Pressure Test and Analysis of Marine Ballasted Centrifugal Pump under Rapid Changing Conditions

Research Center of Fluid Machinery Engineering and Technology, Jiangsu University, Zhenjiang 212013, China
*
Author to whom correspondence should be addressed.
J. Mar. Sci. Eng. 2021, 9(11), 1299; https://doi.org/10.3390/jmse9111299
Submission received: 14 October 2021 / Revised: 16 November 2021 / Accepted: 18 November 2021 / Published: 19 November 2021
(This article belongs to the Special Issue Maritime Engineering, Industry Development Prospects)

Abstract

:
Ship ballast pumps have stringent requirements for their transient characteristics. Here, the pneumatic control valve and programmable logic controller (PLC) are applied to realize the rapid reduction in flow rate for ballast pumps, and the dynamic pressure of steady and transient conditions and inner flow for the ballast pump are tested and analyzed. The results show that the dynamic pressure of each study scheme has cyclical increasing trends, however, the larger the amplitude of the flow rate reduction is, the greater the pressure increasing rate of the two measuring points. While the flow rate decreases to 0.4× Qd and 0.2× Qd, the rate of pressure increase is first fast and then slow. The dynamic pressure pulsation intensity is higher than the corresponding steady-state conditions after the transient conditions. With the increase in flow rate reduction, the characteristic frequencies of the dynamic pressure are 1APF (axial passing frequency) and 1BPF (blade passing frequency) and their harmonic frequency. The rapid decrease in flow rate causes the separation vortex in the impeller channel to be generated in advance, and the scale increases, which reduces the pulsation intensity of the pump outlet to prevent an increase in the level of broadband pulsation between 2APF and 1BPF.

1. Introduction

The ballast pump is used for drainage and injection in the water tanks on ships. The double suction pump is widely applied to ship ballast systems because of its small volume and large flow rate. Meanwhile, the water tanks of ships may have emergency adjustment under special running conditions on the ship, such as the pitch, adjusting the draught depth during ship navigation, which is accompanied by rapidly changing ballast pump conditions [1,2,3].
The moving mash method was put forward by Xu [4] to solve the unsteady flow caused by boundary movement, and to solve three-dimensional transient flow when the centrifugal pump has started and the simulation results on inner transient flow have been obtained. A complete system model, including circulating pipes and pump, has been established by Wu [5,6,7] and Frihandi [8], the flow evolution of transient processes during the start-up has been analyzed, and the effect of pipe resistance characteristics on transient characteristics have been studied. Jiang [9] studied the cause of transient conflict head through the analysis of transient hydraulic characteristics of the centrifugal pump during the starting period, and identified the cause as the time of the flow rate closed to the steady state as being longer than the rotating speed closed to the rated rotating speed. Rochuon [10] analyzed the pressure distribution in the impeller and volute, which shows severe pulsation as the main cause for the unsteady running of the impeller.
The rapid start test of a small centrifugal pump has been studied by Tsukamoto [11], and the starting time while the rotating speed was close to the maximum speed (1500 r/min) is about 0.6 s. Start tests were also taken in a closed test rig by Lefebvre [12], and the time of the rotating speed to the maximum rotating speed (2000 r/min) was about 0.6 s. Start tests on a centrifugal pump were undertaken in two kinds of pipeline systems by Thanapandi [13], and the time taken to reach the maximum rotating speed (1500 r/min) was about 1.2 s. The method above was applied by Wu [14] to experimental research on the transient hydraulic performance of a centrifugal pump under different starting accelerations, and the results show that while the rotating speed approaches the maximum, the transient head is lower than the quasi-stable head, and these values have obvious differences among the different starting accelerations. A new transient performance test system was put forward by Zhang and Khalifa [15,16,17]. The flow rate, head, rotating speed and cavitation characteristics under transient conditions were taken, and description formula and correction method for the transient parameters were proposed. The inner velocity distribution of the centrifugal pump during the starting period was tested by PIV under conditions of a full open, semi open and full closed ball valve, and the relationship between the transient external characteristics and the inner flow were analyzed [18,19]. Shao [20,21] studied the transient characteristics of the closing valve of ultra-low specific speed centrifugal pumps, and found that the impact head appeared at the end of the pump start under different starting accelerations, and the development of the internal flow field generally lags behind the closing dead point of the steady state process.
Transient processes, such as start-up and shutdown, have been studied extensively in experiments and numerical simulations. Rapid change in flow rate is another major form of transient process, but it has always been difficult to realize rapid flow change. A double suction ballast pump is set as the research object in this study, and an experimental system exploring the rapid change in flow rate is designed. The inner pressure fluctuation of a ballast pump under transient operation is studied to perfect a test method for transient study.

2. Experiment System and Scheme Design

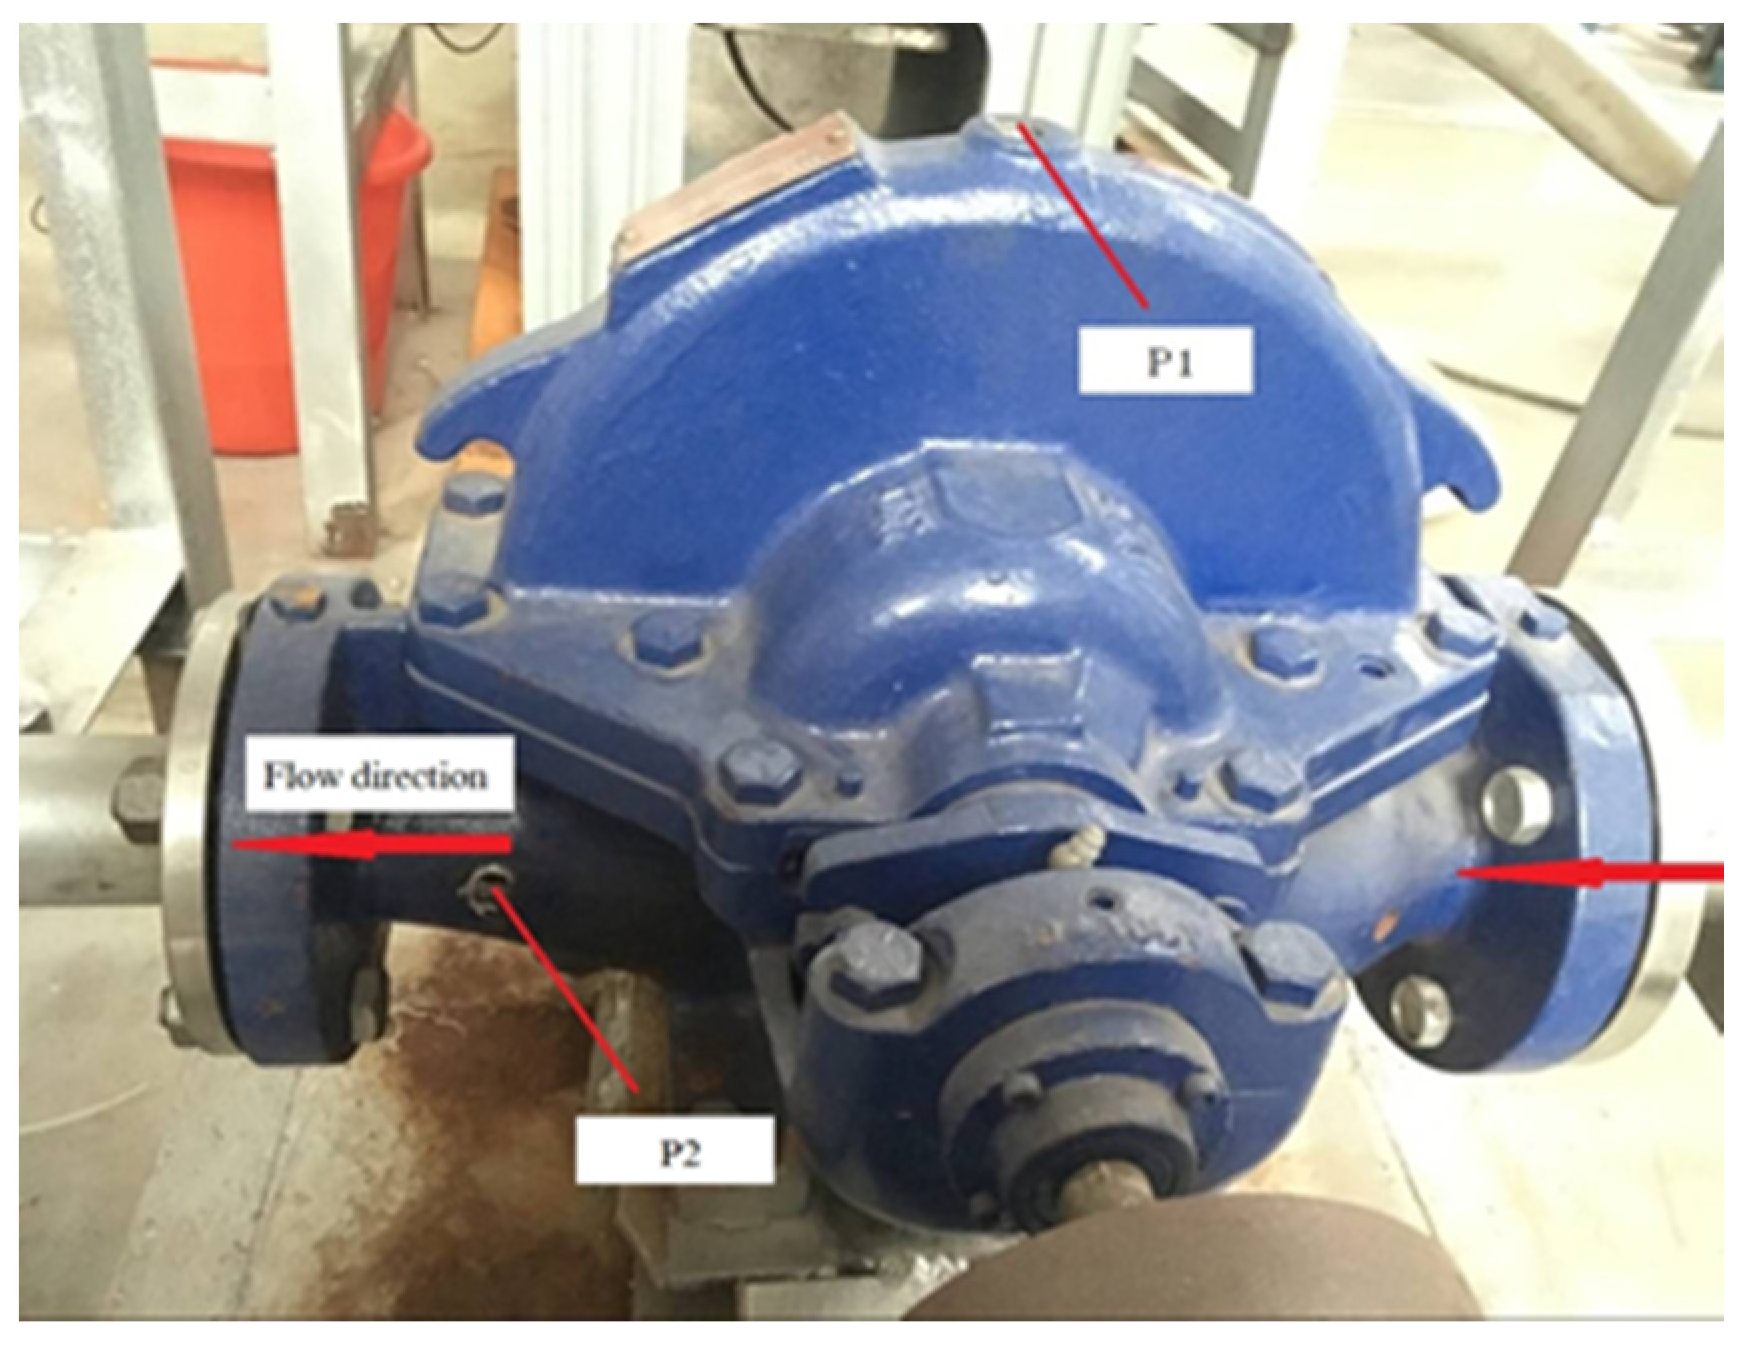
2.1. Research Object

A ballast pump was chosen as the research object, with the design parameters of a flow rate Qd = 32.6 m3/h, head H = 15.3 m, rotating speed n = 1450 r/min and the specific speed ns = 46. Its main geometric parameters are shown Table 1. As shown in Figure 1, the top and the outlet of the volute were chosen as monitoring points to monitor the inner dynamic pressure, respectively named as P1 and P2.

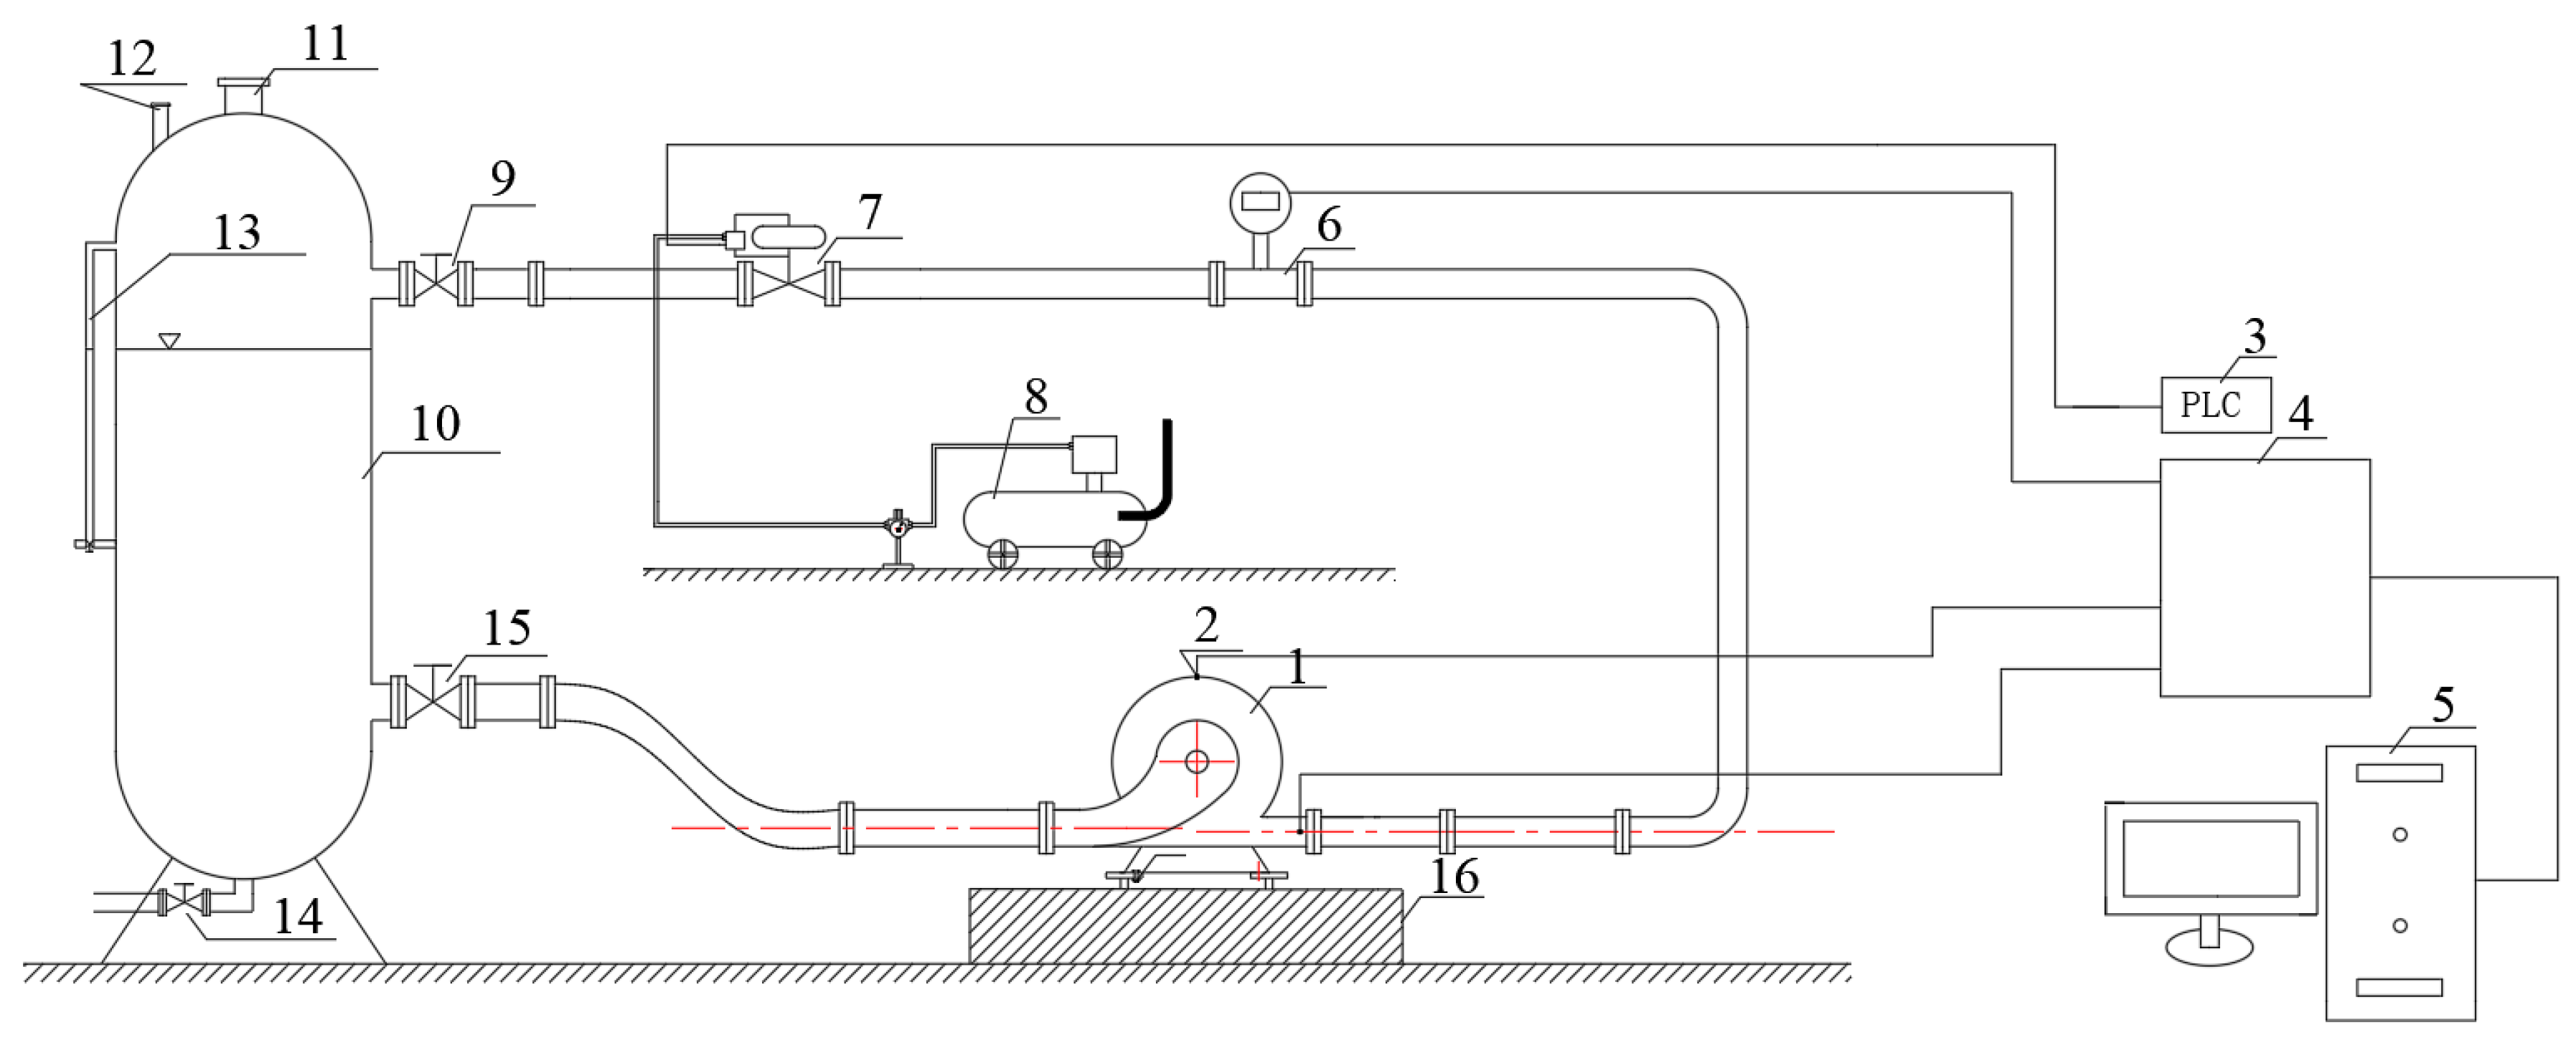
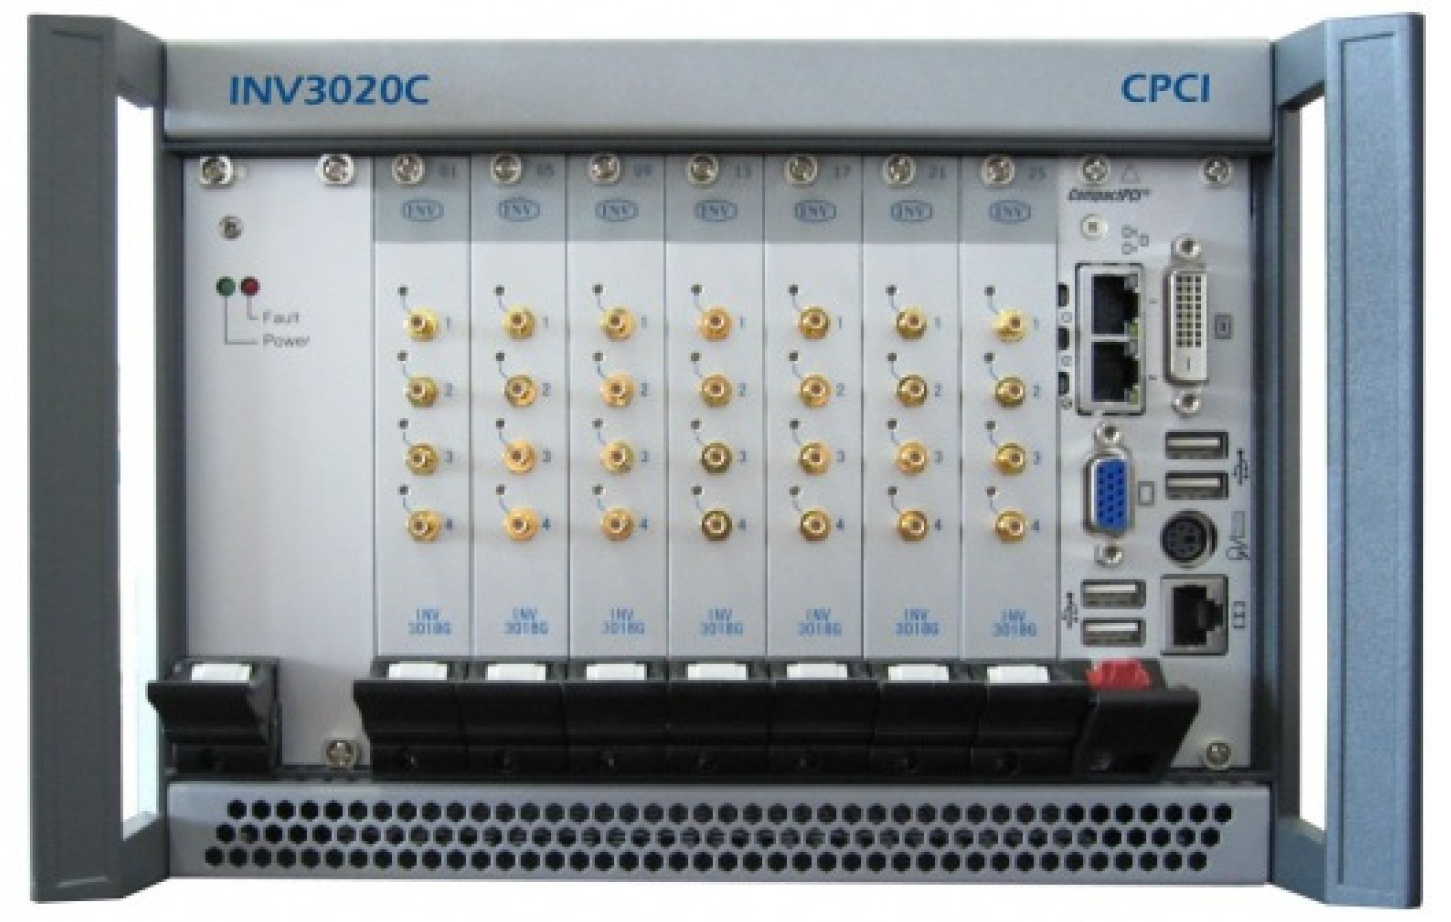
2.2. The Experimental Design

A sketch diagram of the experimental system is shown in Figure 2, which includes the ballast pump, motor, rapid change installation, and variable-frequency control cabinet.
The rapid change installation is the key part for achieving rapid change in flow rate, and is made up of the air compressor, pressure regulating valve, linear pneumatic control valve, Programmable Logic Controller (PLC) controller and so on. The pneumatic control valve is provided by the air compressor, with compressed air as the power source. It receives the PLC controller output signal to drive the valve with the aid of attachments, such as an electric valve positioner and converters, and can realize the switch or proportional adjustment of flow rate.
The dynamic pressure is tested by high frequency pressure sensor, and its main technical parameters are shown in Table 2.
The dynamic pressure is collected by high-performance 24-bit sampling instrument with a sampling frequency of 12.8 kHz and a sampling time of 30 s, which is shown in Figure 3.

2.3. The Experimental Scheme

As shown in Table 3, four changing amplitudes of the flow rate are schemed to analyse the inner dynamic pressure of the ballast pump under rapidly changing flow rate conditions. It takes 2 s for the valve to complete flow regulation, which means 2 s for completing the transient condition.

2.4. Test Operating Steps

Keep the inlet valve and outlet valve in the circulation system fully open, and inject enough water. Then start the frequency converter to make the ballast pump run at the designed speed. Close the outlet valve and adjust the flow rate to the design condition. Adjust the output signal of the PLC controller to correspond to 0.8× Qd condition, and start to collect dynamic pressure before the pneumatic control valve starts to execute the output signal. After sampling, the PLC controller returns to the original signal. Repeat the above operations to complete the test of S2, S3 and S4. Finally, slowly turn off the inverter after completing all the test.

3. Results and Analysis

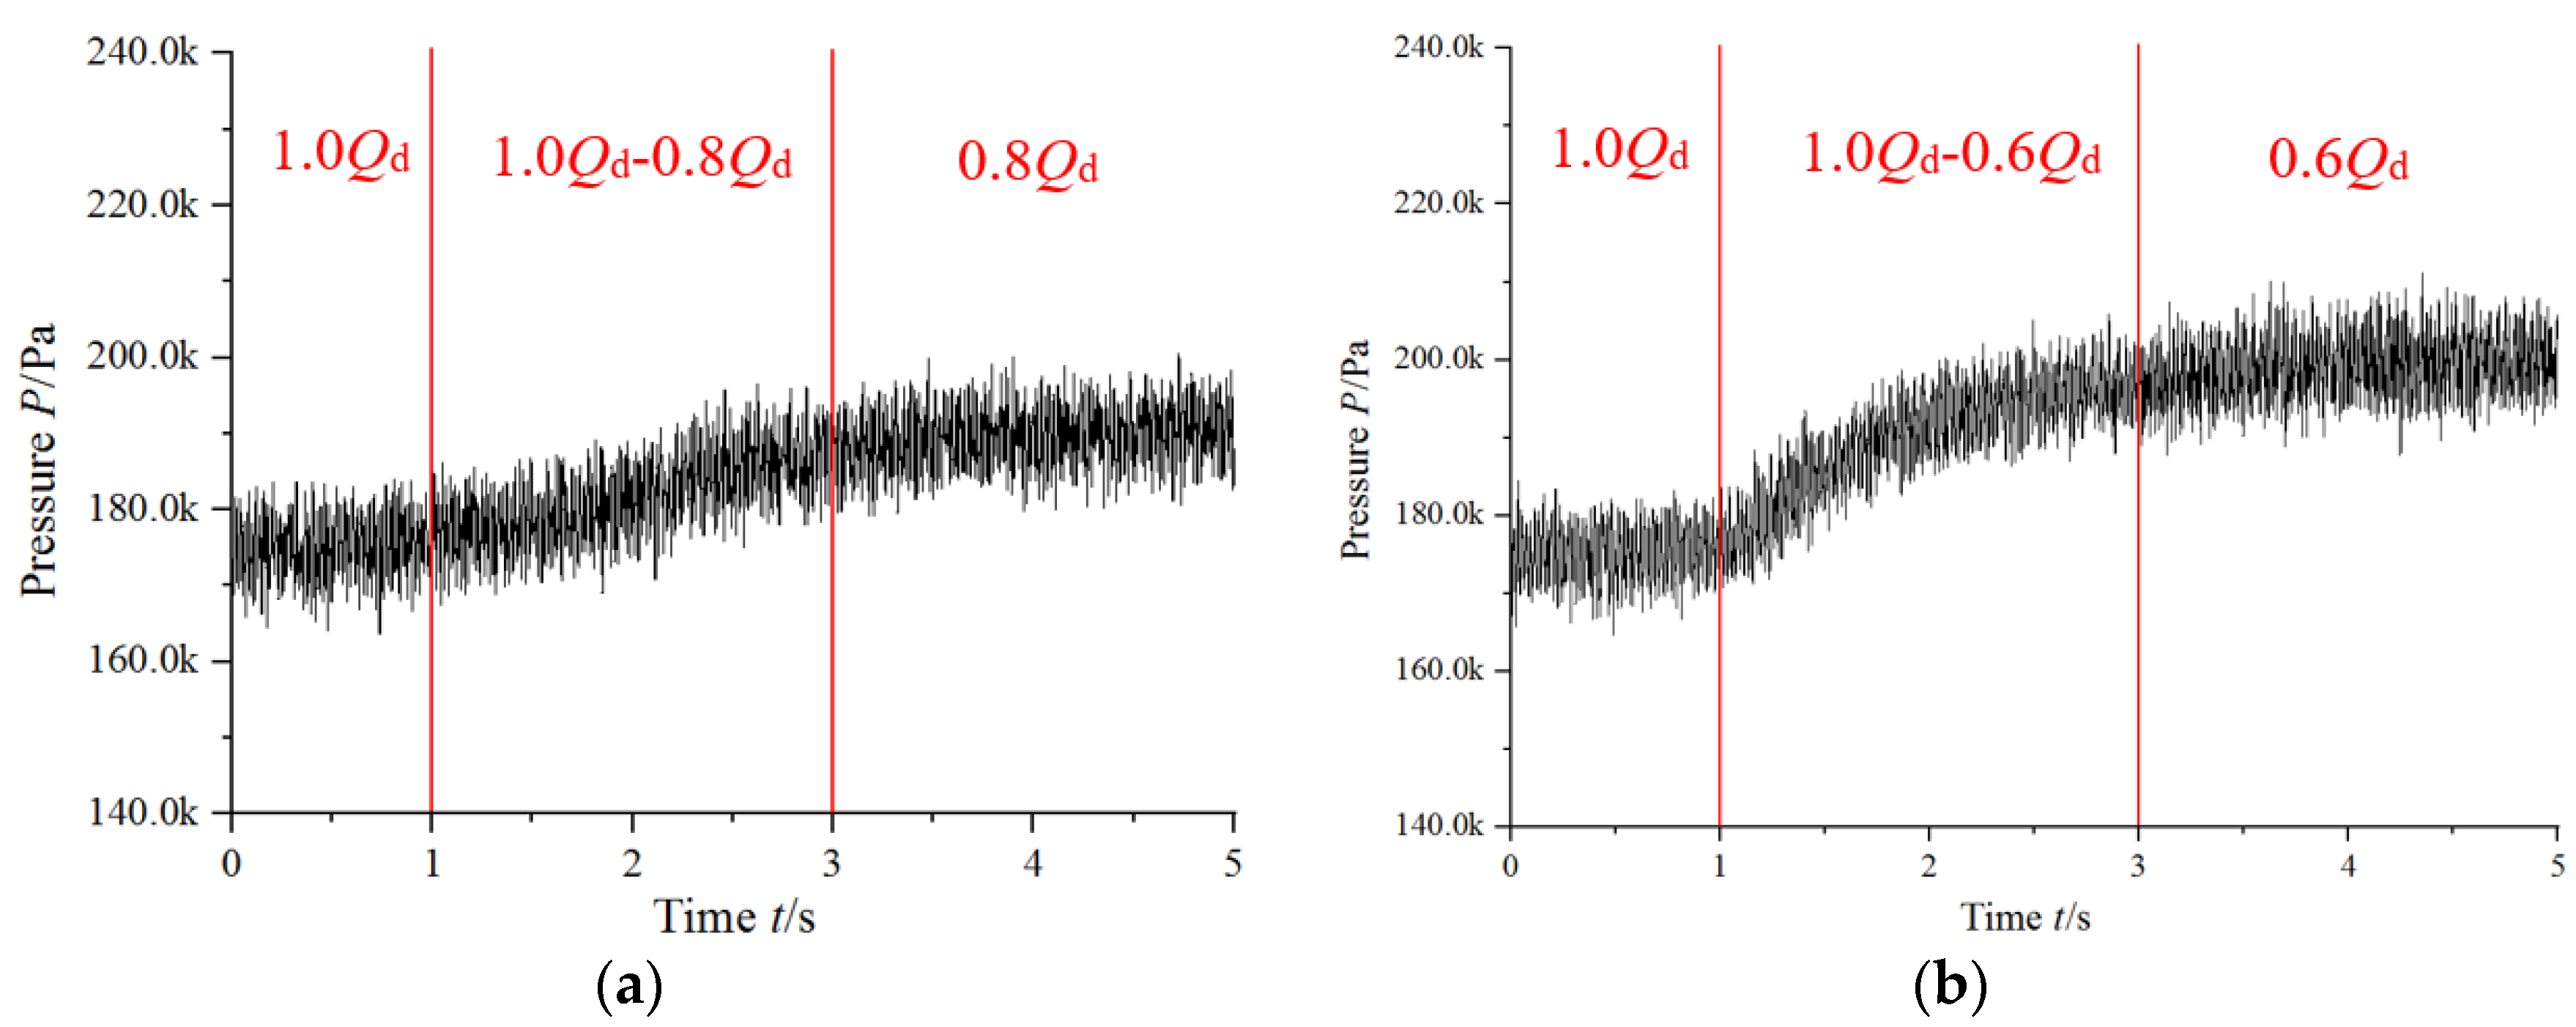
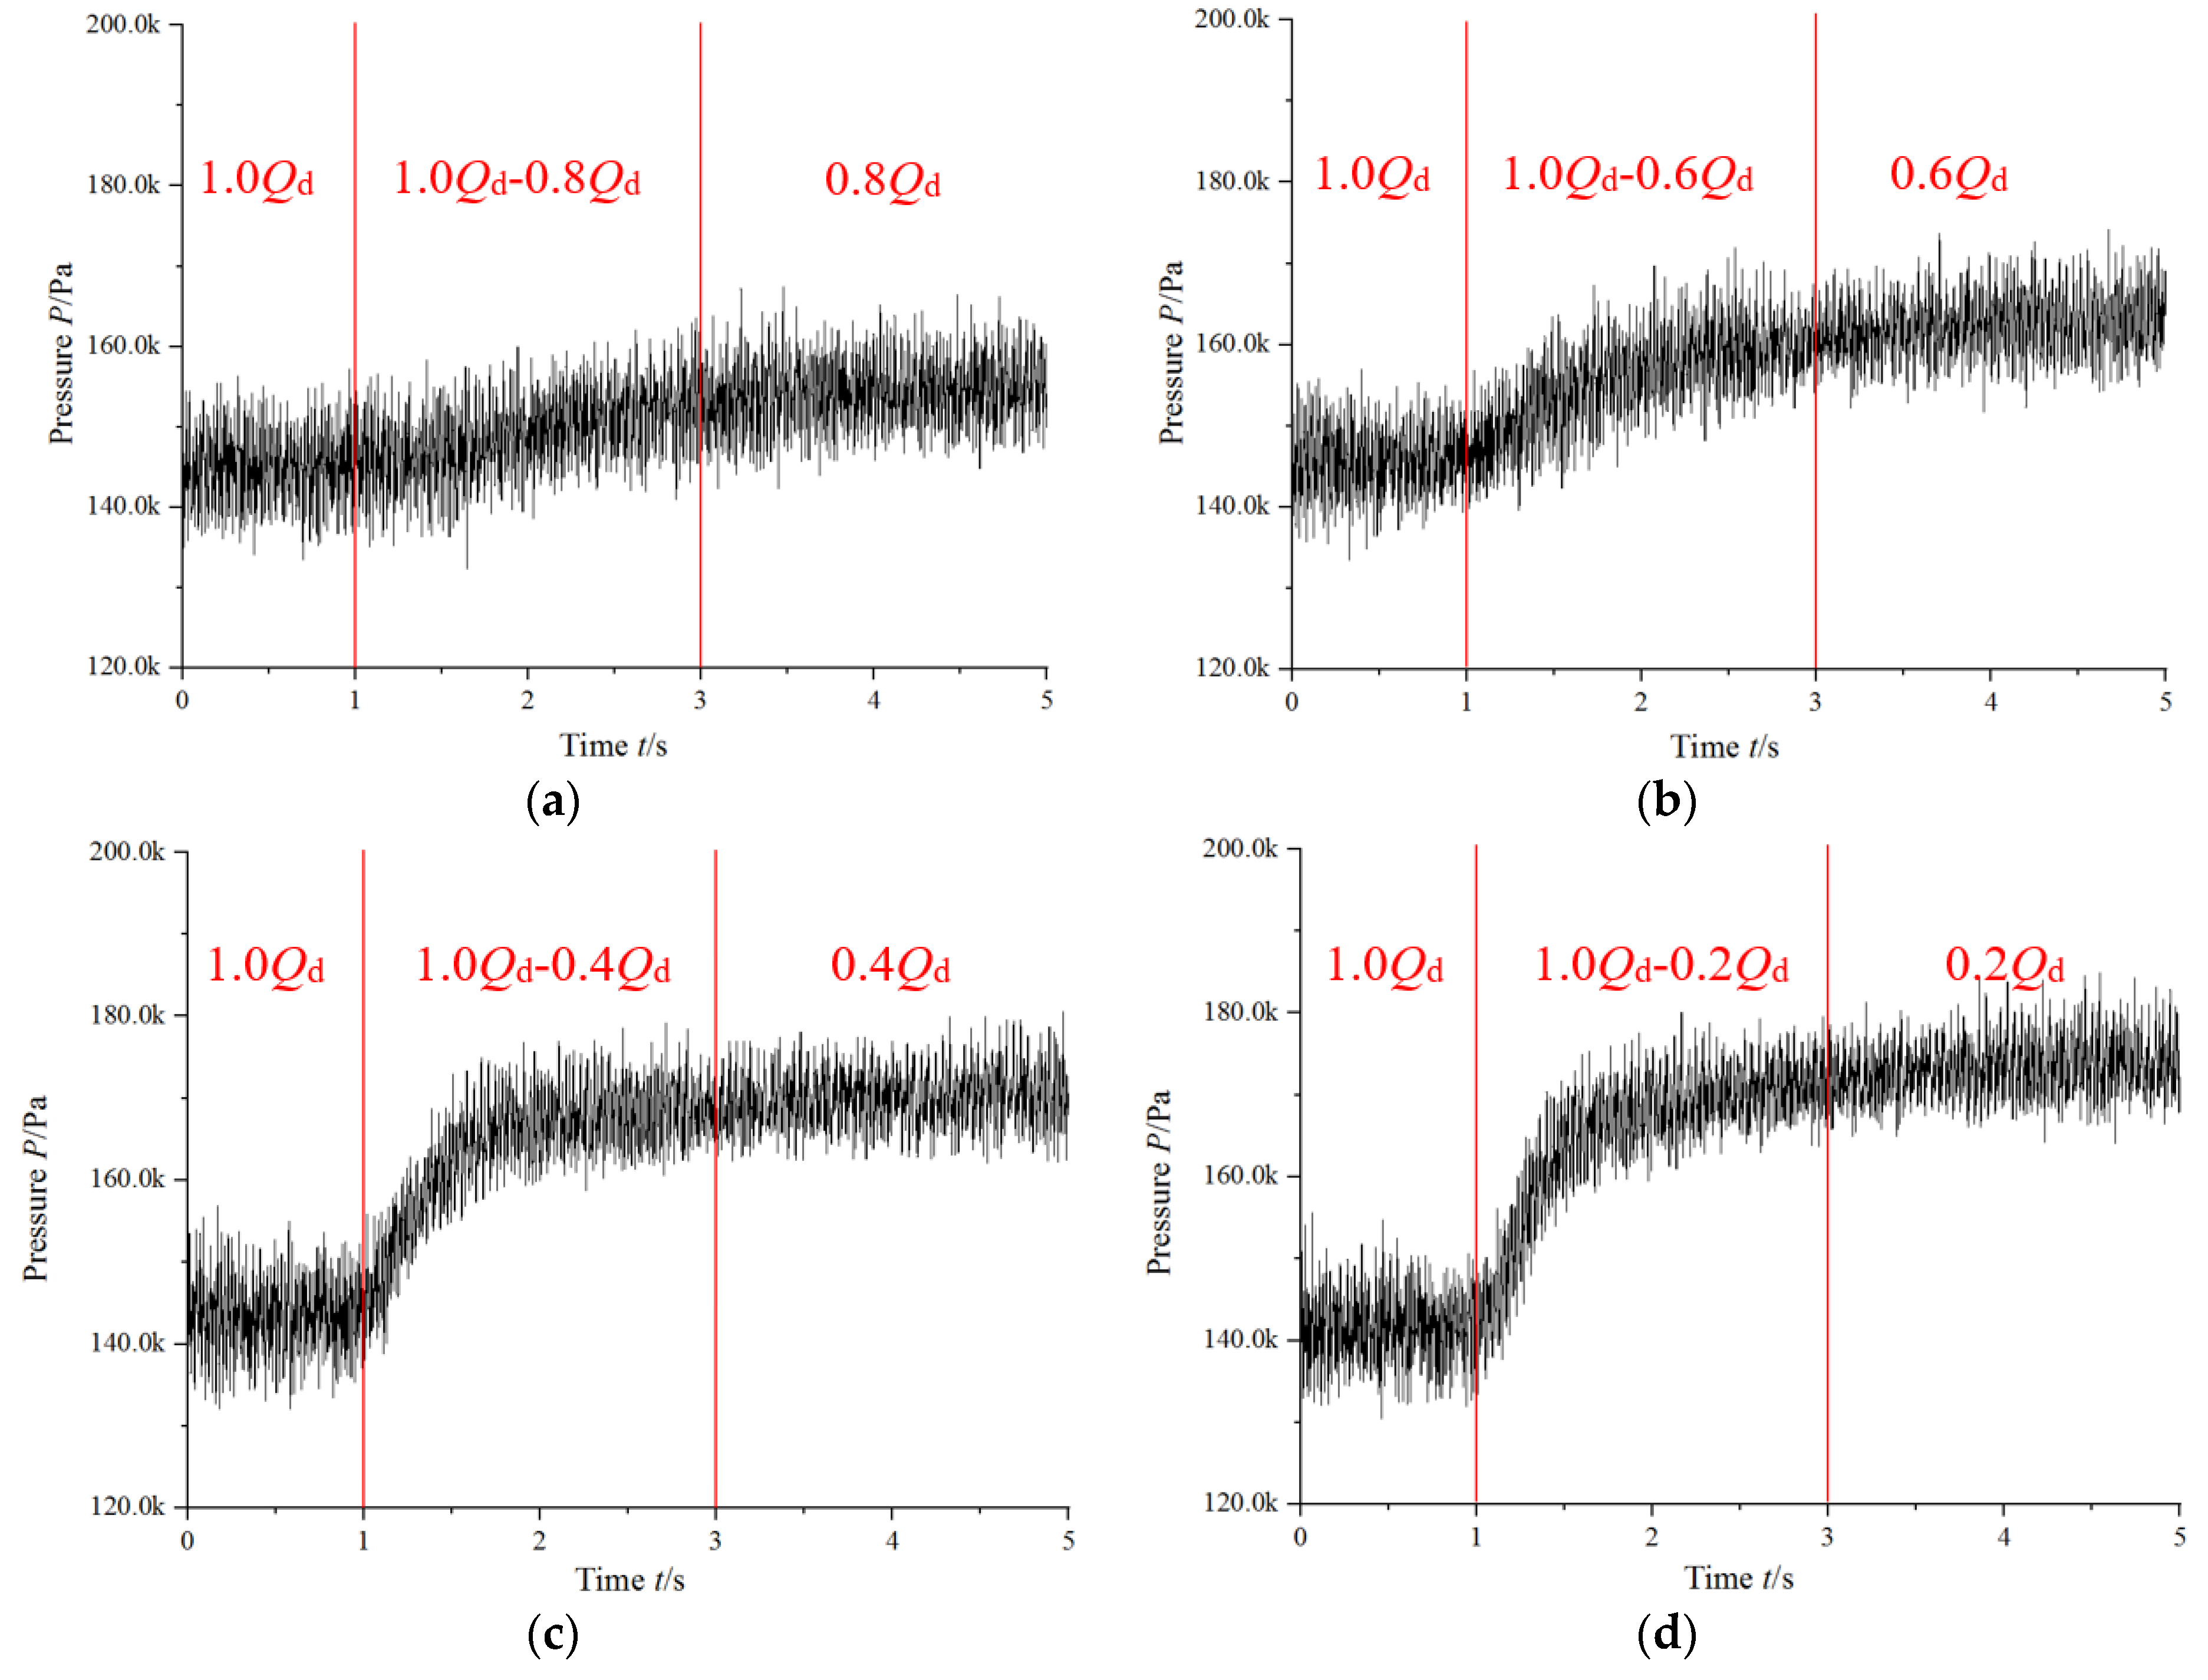
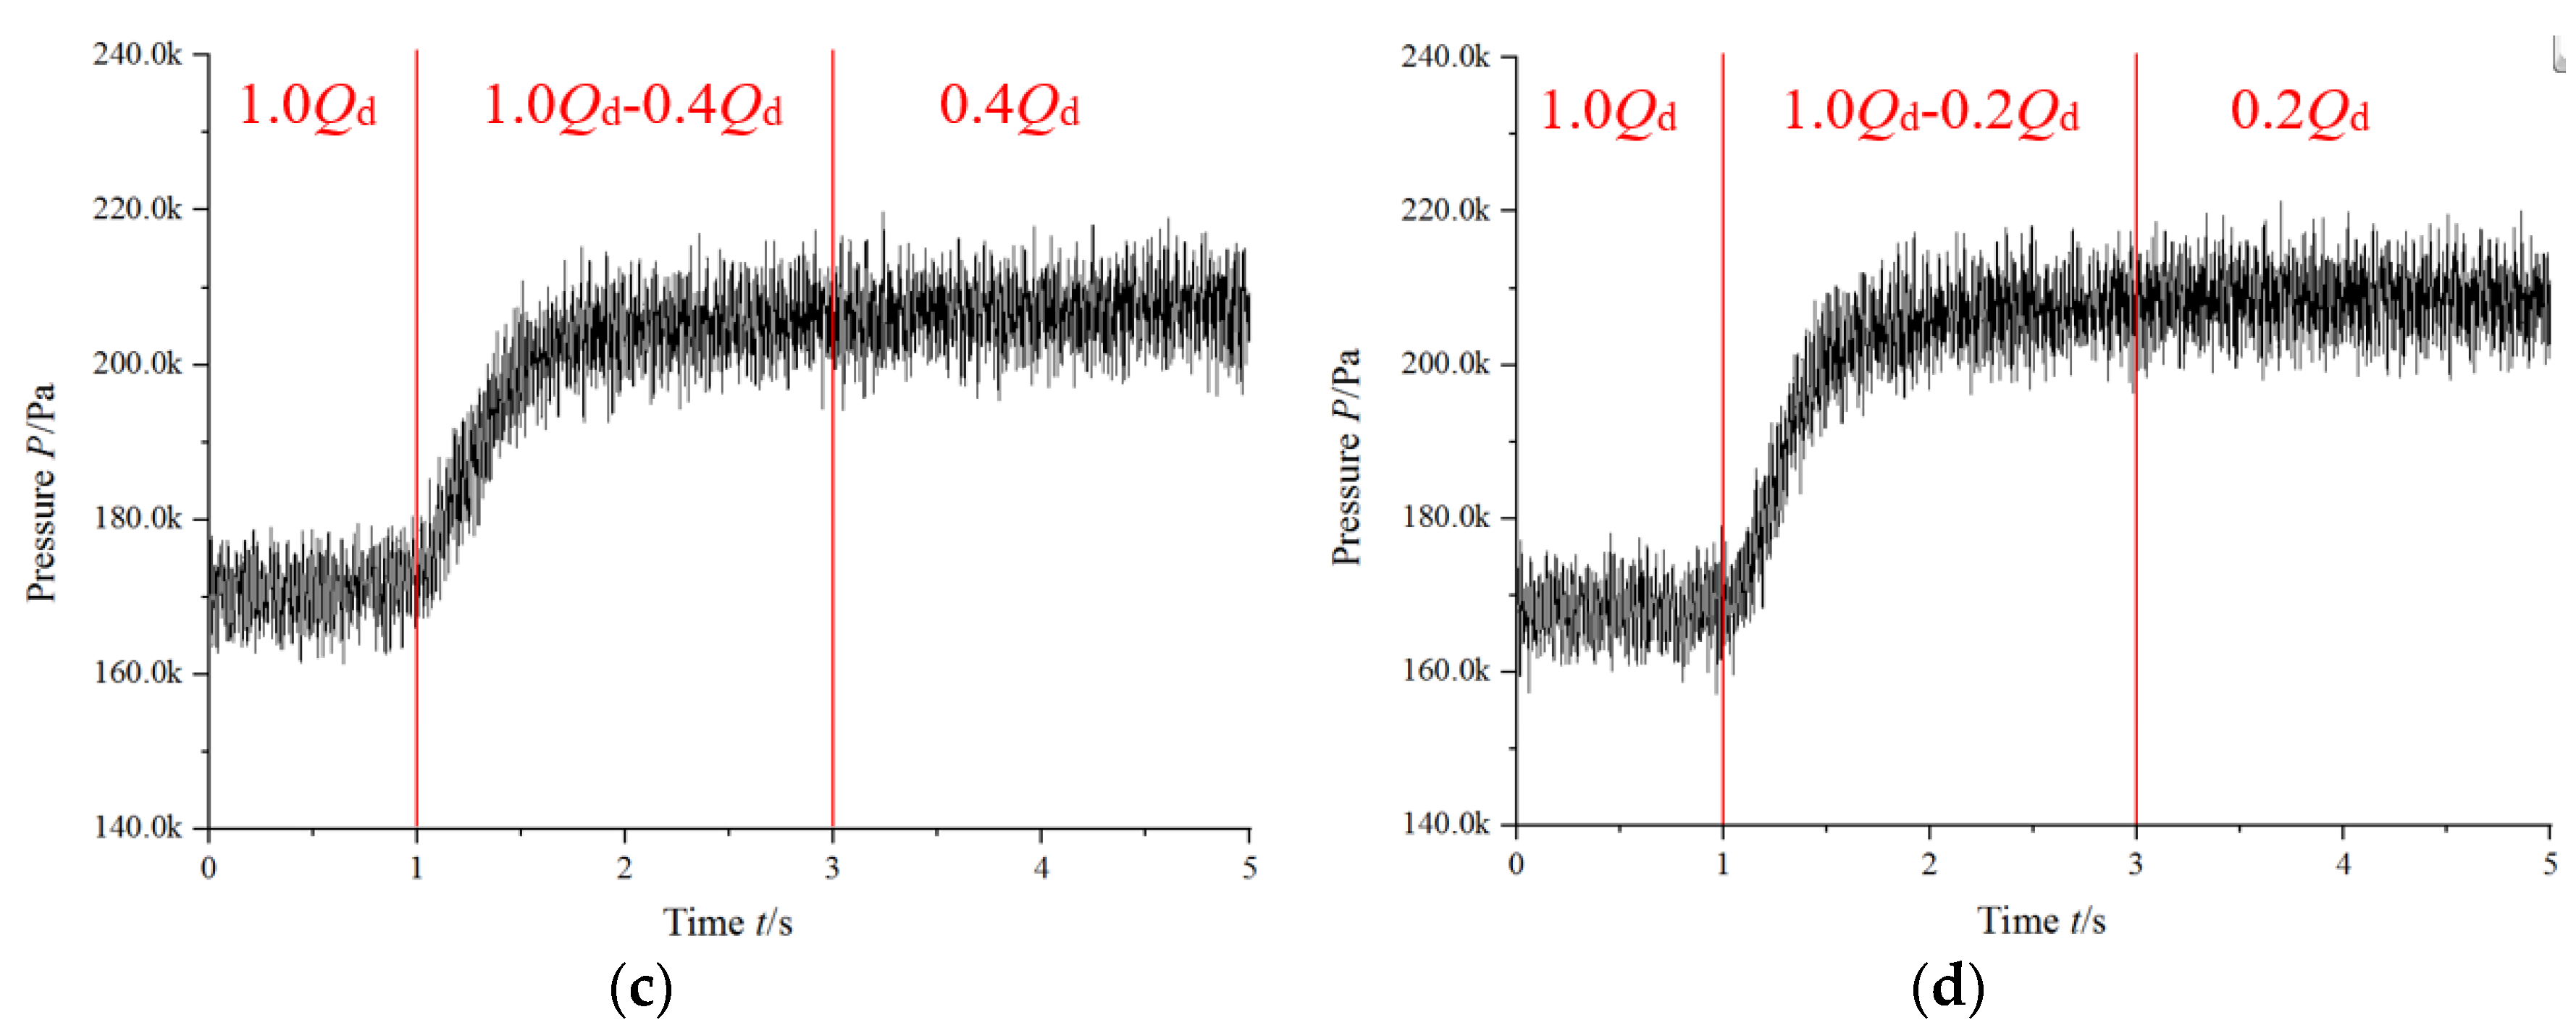
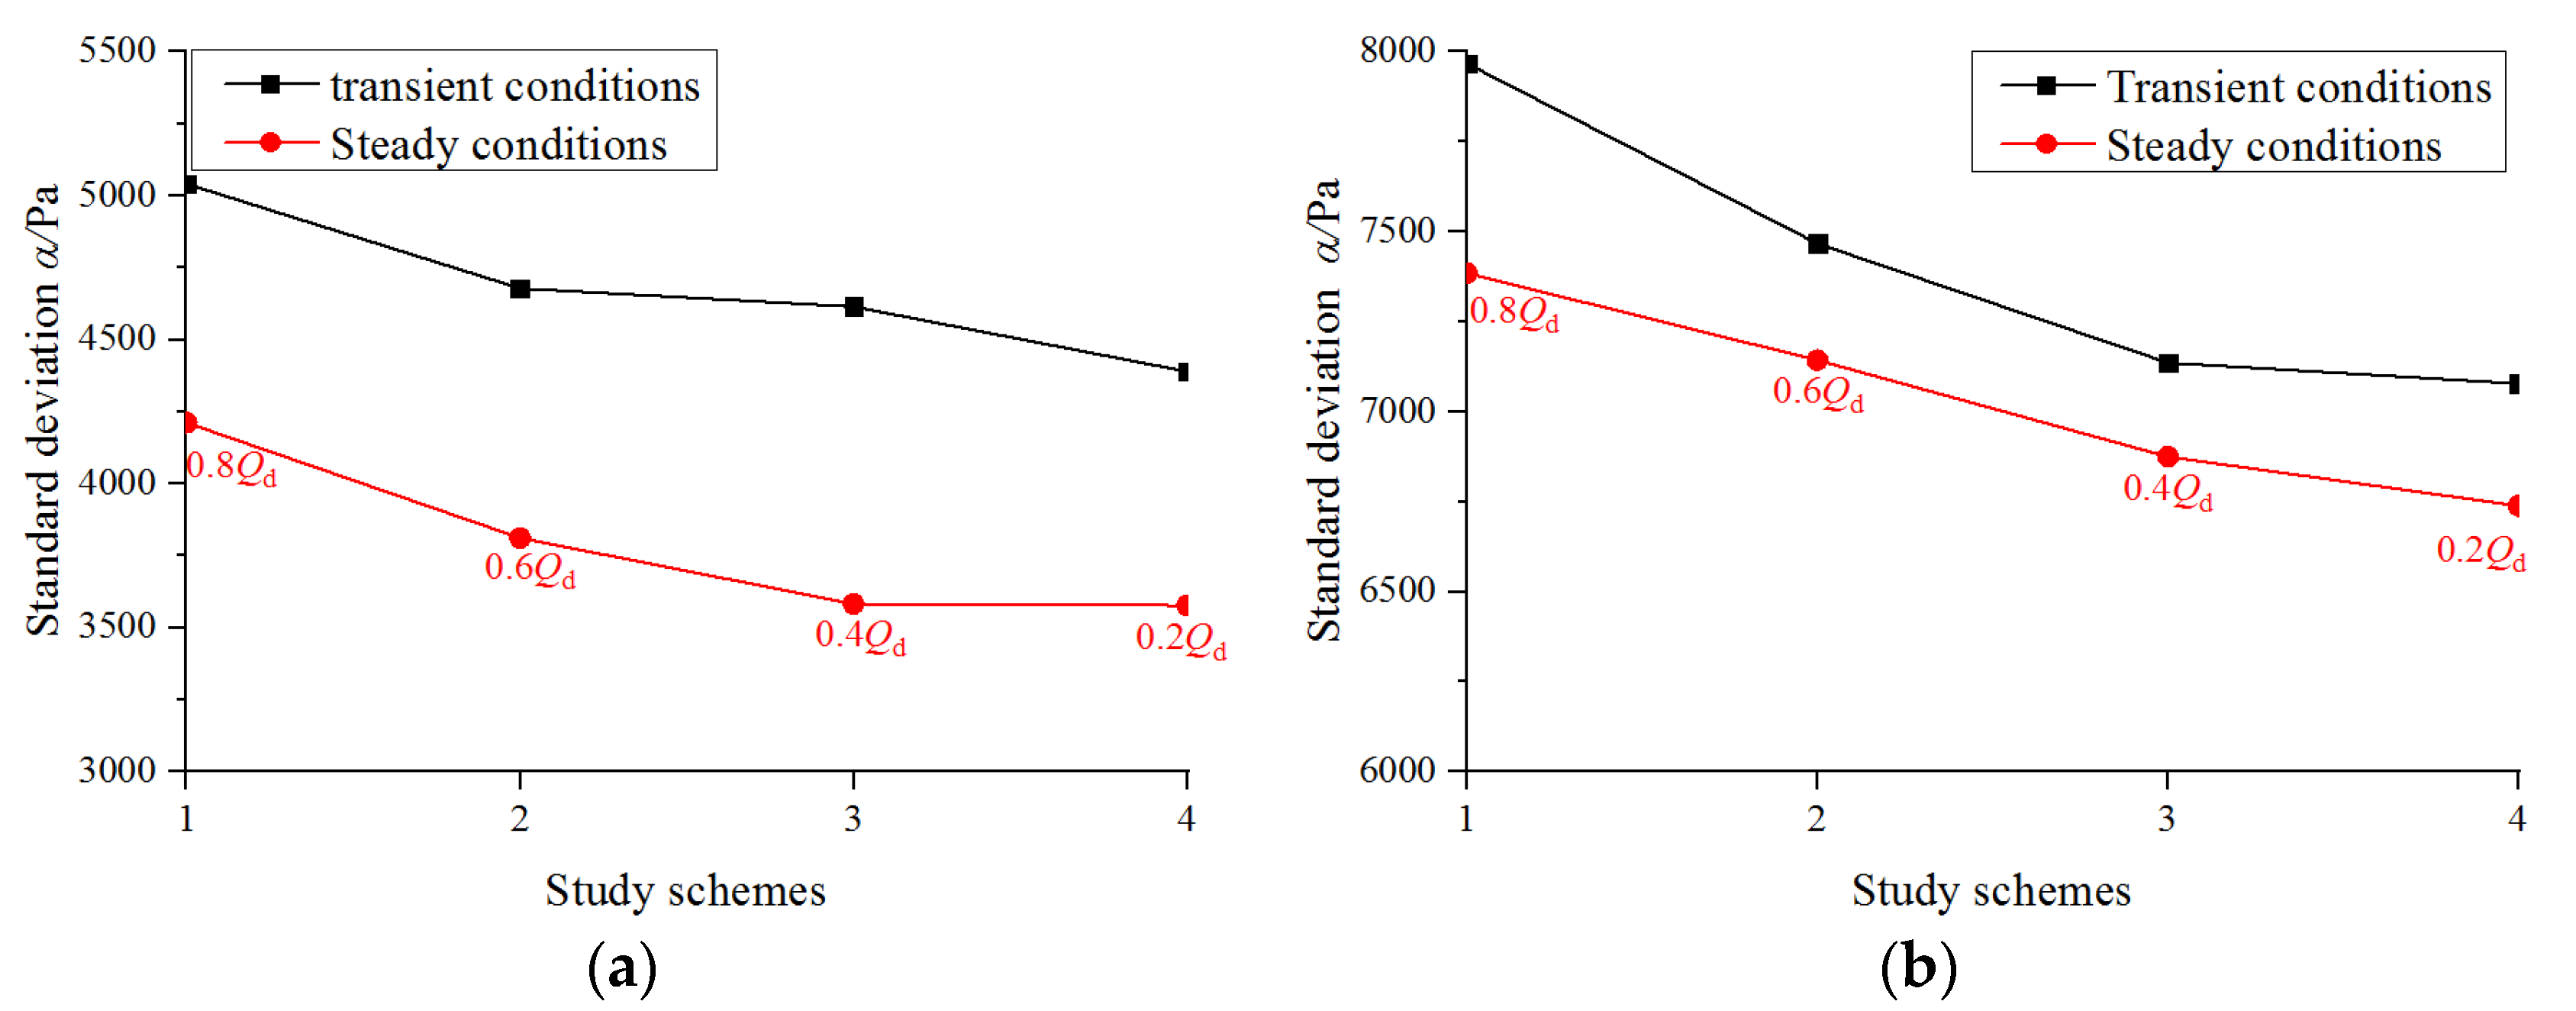
3.1. Time Domain Analysis of Pressure Fluctuation during the Rapid Reduction of Flow Rate

The pressure at about 5 s, which included the rapid reduction in flow rate, is selected for analysis, which is consistent at 1 s before the rapid changing conditions, 2 s during the rapid changing conditions and 2 s after.
Figure 4 shows the time domain of the dynamic pressure at P1 for each study scheme of the rapid changing condition. The pressure at P1, located at the top point of the volute, has an increasing trend, with the rapid increase in pressure is completed within 2 s. The pressure and its amplitude show different trends during the rapid changing of the flow rate. While the flow rate changes rapidly from 1.0× Qd to 0.8× Qd, the pressure at P1 gradually increases. As the amplitude of the decreasing flow rate increases, the pressure at P1 shows firstly a rapid increase and then a slow increase. The times of rapid increase are 1.2 s, 0.8 s and 0.6 s, respectively, which means that the larger the amplitude of the flow rate change is, the faster the pressure increases.
The time domain of dynamic pressure at P2 located at the outlet of the volute during the rapid reduction in flow rate is shown in Figure 5. The pressure at P2 has an increasing trend, and the pressure and its amplitude have different change rules during the rapid changing of the flow rate. While the flow rate changes rapidly from 1.0× Qd to 0.8× Qd, pressure at P2 increases uniformly. As the amplitude of the decreasing flow rate increases, the pressure at P2 shows firstly a rapid increase, followed by a slow increase, and the trend is consistent with P1.
The standard deviation of the dynamic pressure is chosen to measure the steady pressure fluctuation and the standard deviation of the dynamic pressure of each transient condition and steady condition, which were 0.8× Qd, 0.6× Qd, 0.4× Qd and 0.2× Qd, respectively, to analyse the steady dynamic pressure in the pump. The statistical data are shown in Figure 6. It can be seen from Figure 6 that the standard deviation of the dynamic pressure after the transient conditions of P1 and P2 is higher than the corresponding steady-state operating conditions. Meanwhile, the rapid change in flow leads to an increase in the amplitude of pressure pulsation, and enhances the internal turbulent flow characteristics. With the increase in flow rate change, the standard deviation of the dynamic pressure after the transient conditions becomes smaller and smaller. The rapid decrease in flow rate causes the relative velocity of the fluid in the impeller to decrease, and the effect of the dynamic and static interference between the fluid and the volute is weakened, which results in a decrease in the intensity of dynamic pressure pulsation.

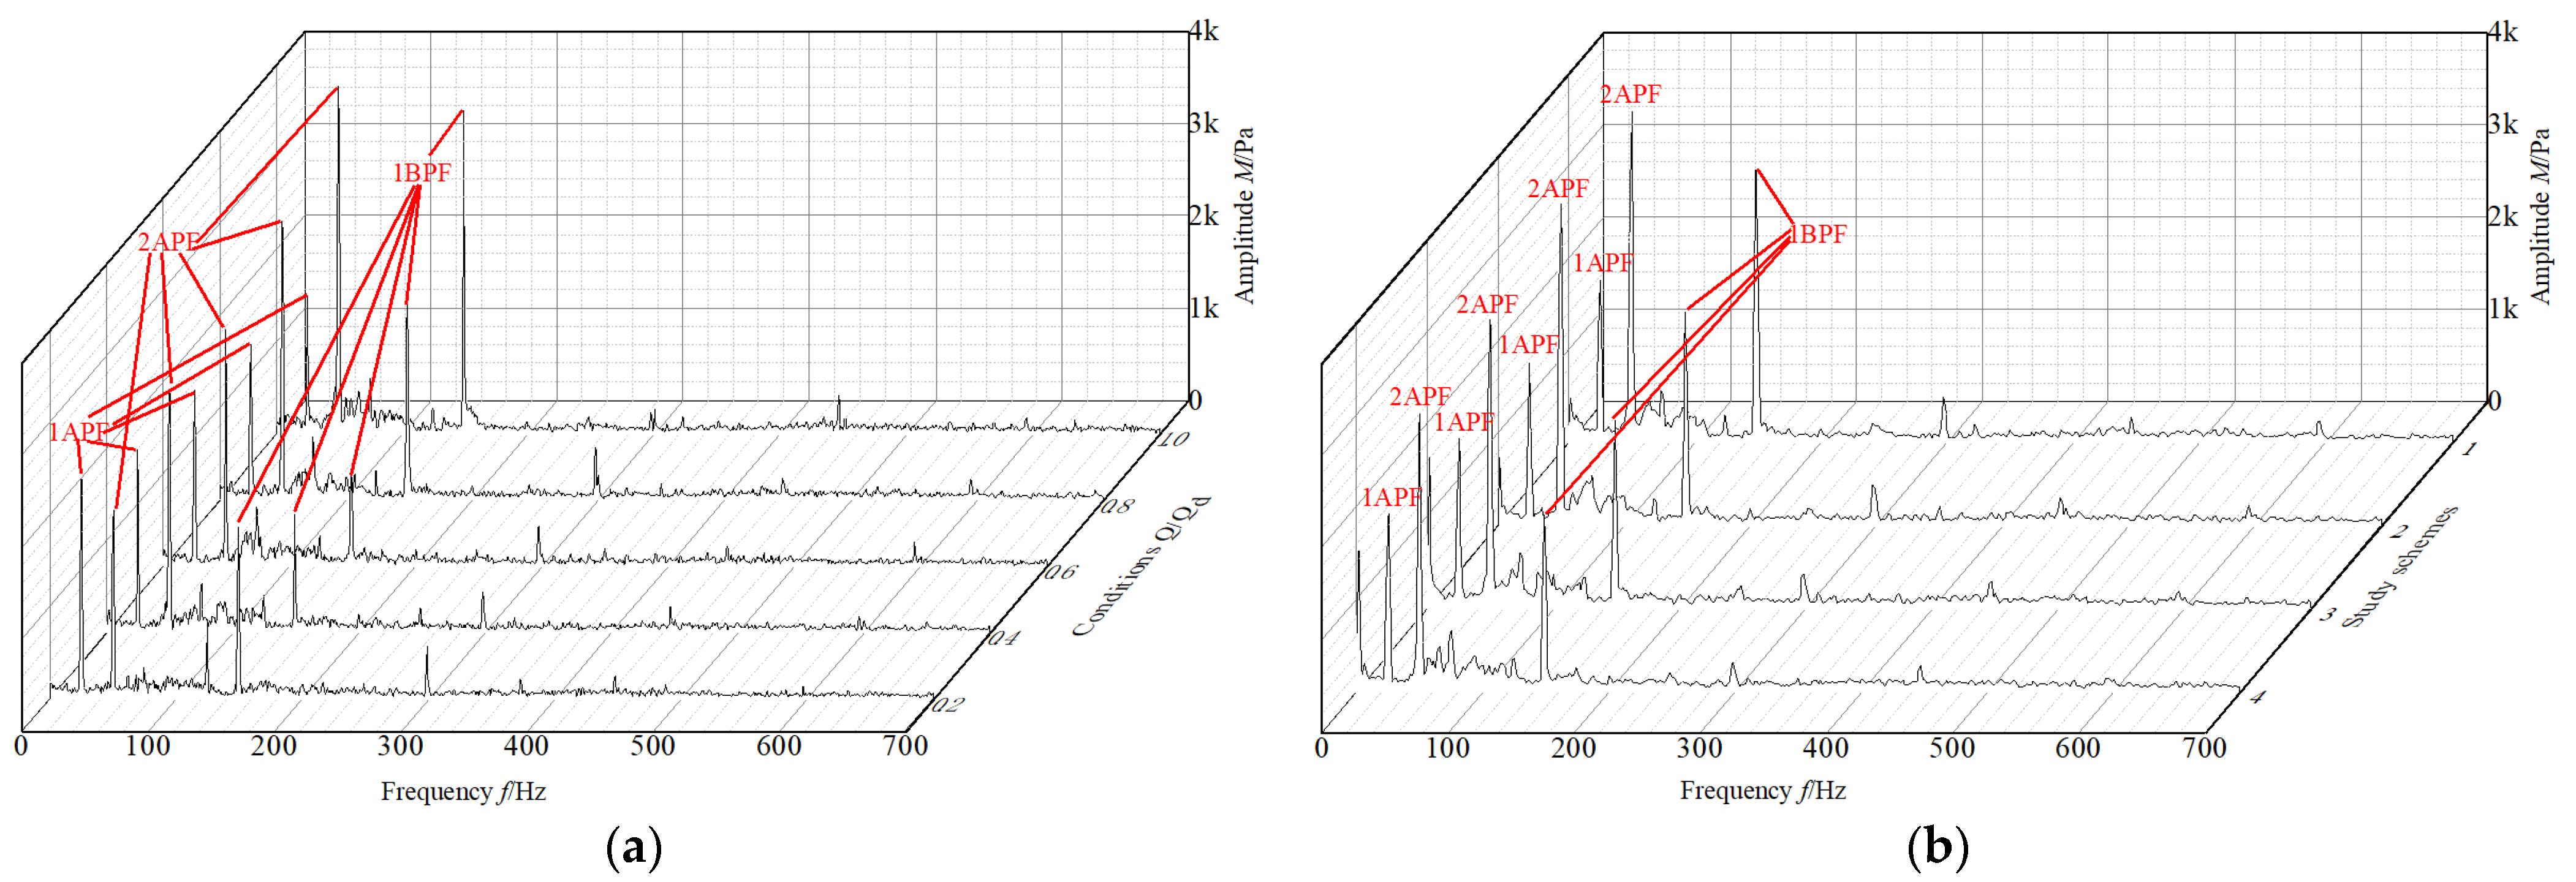
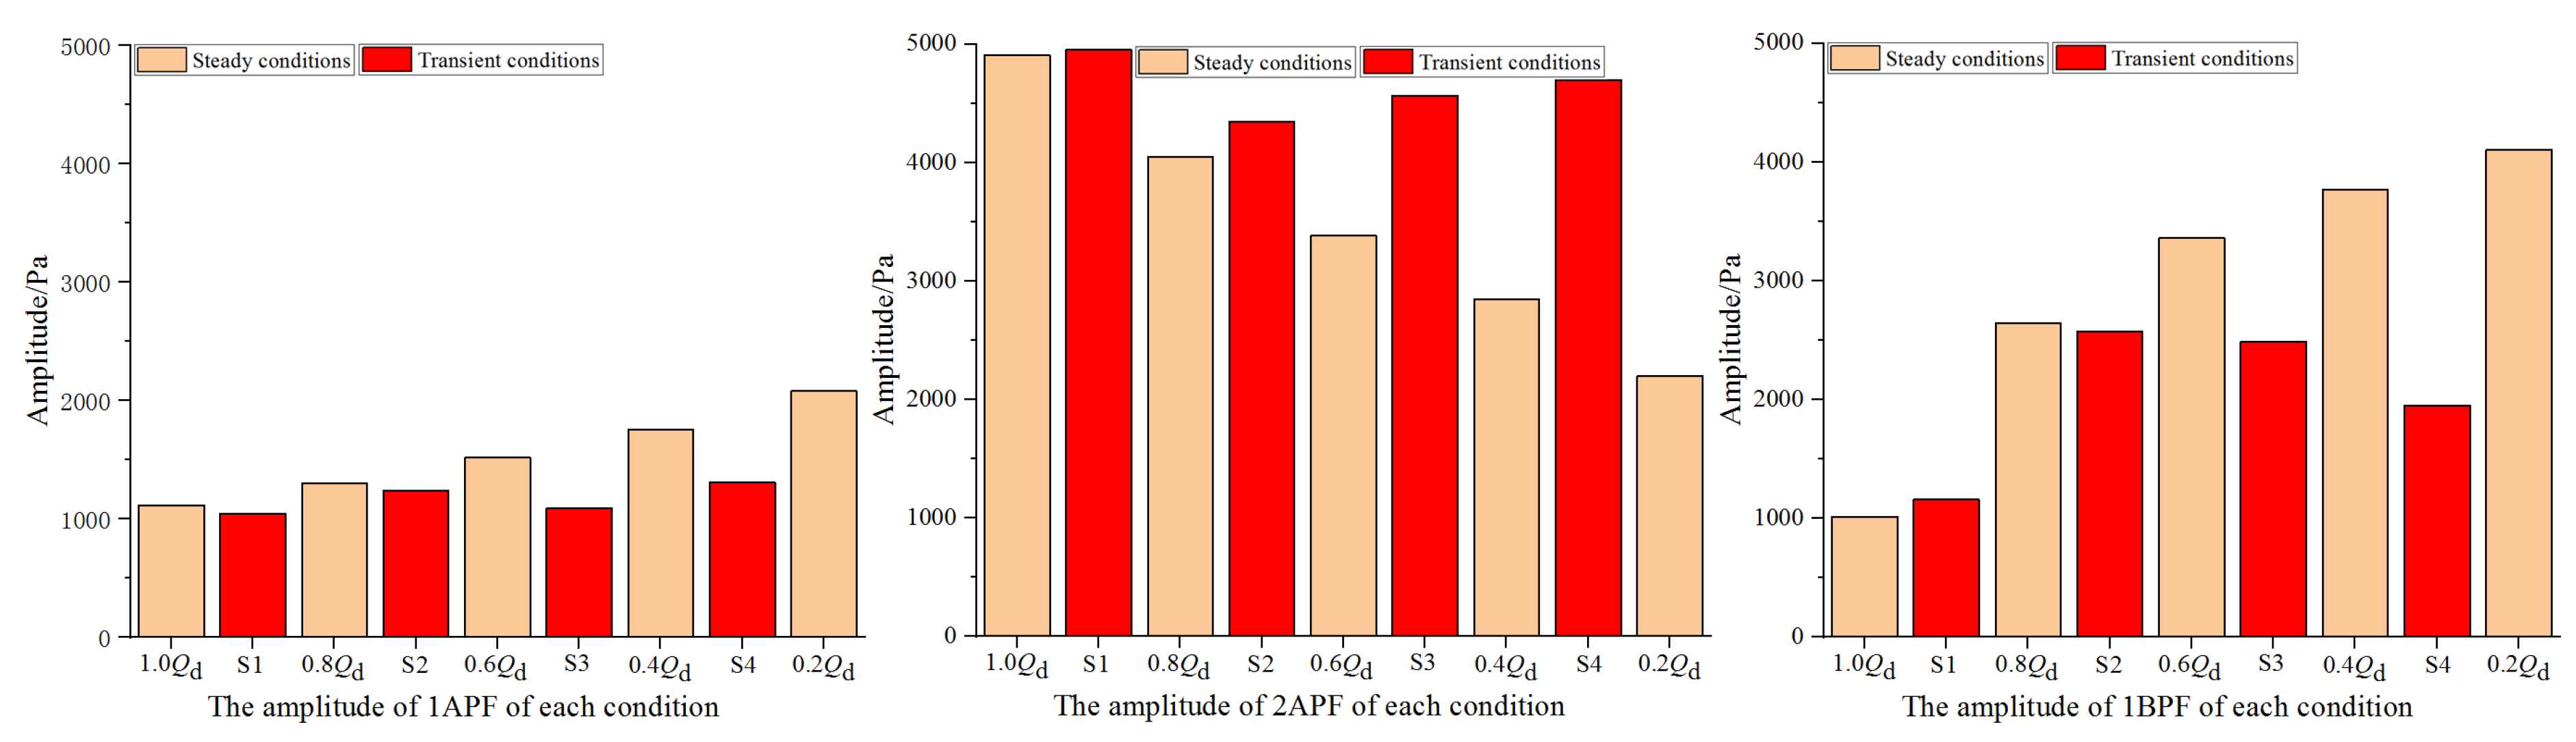
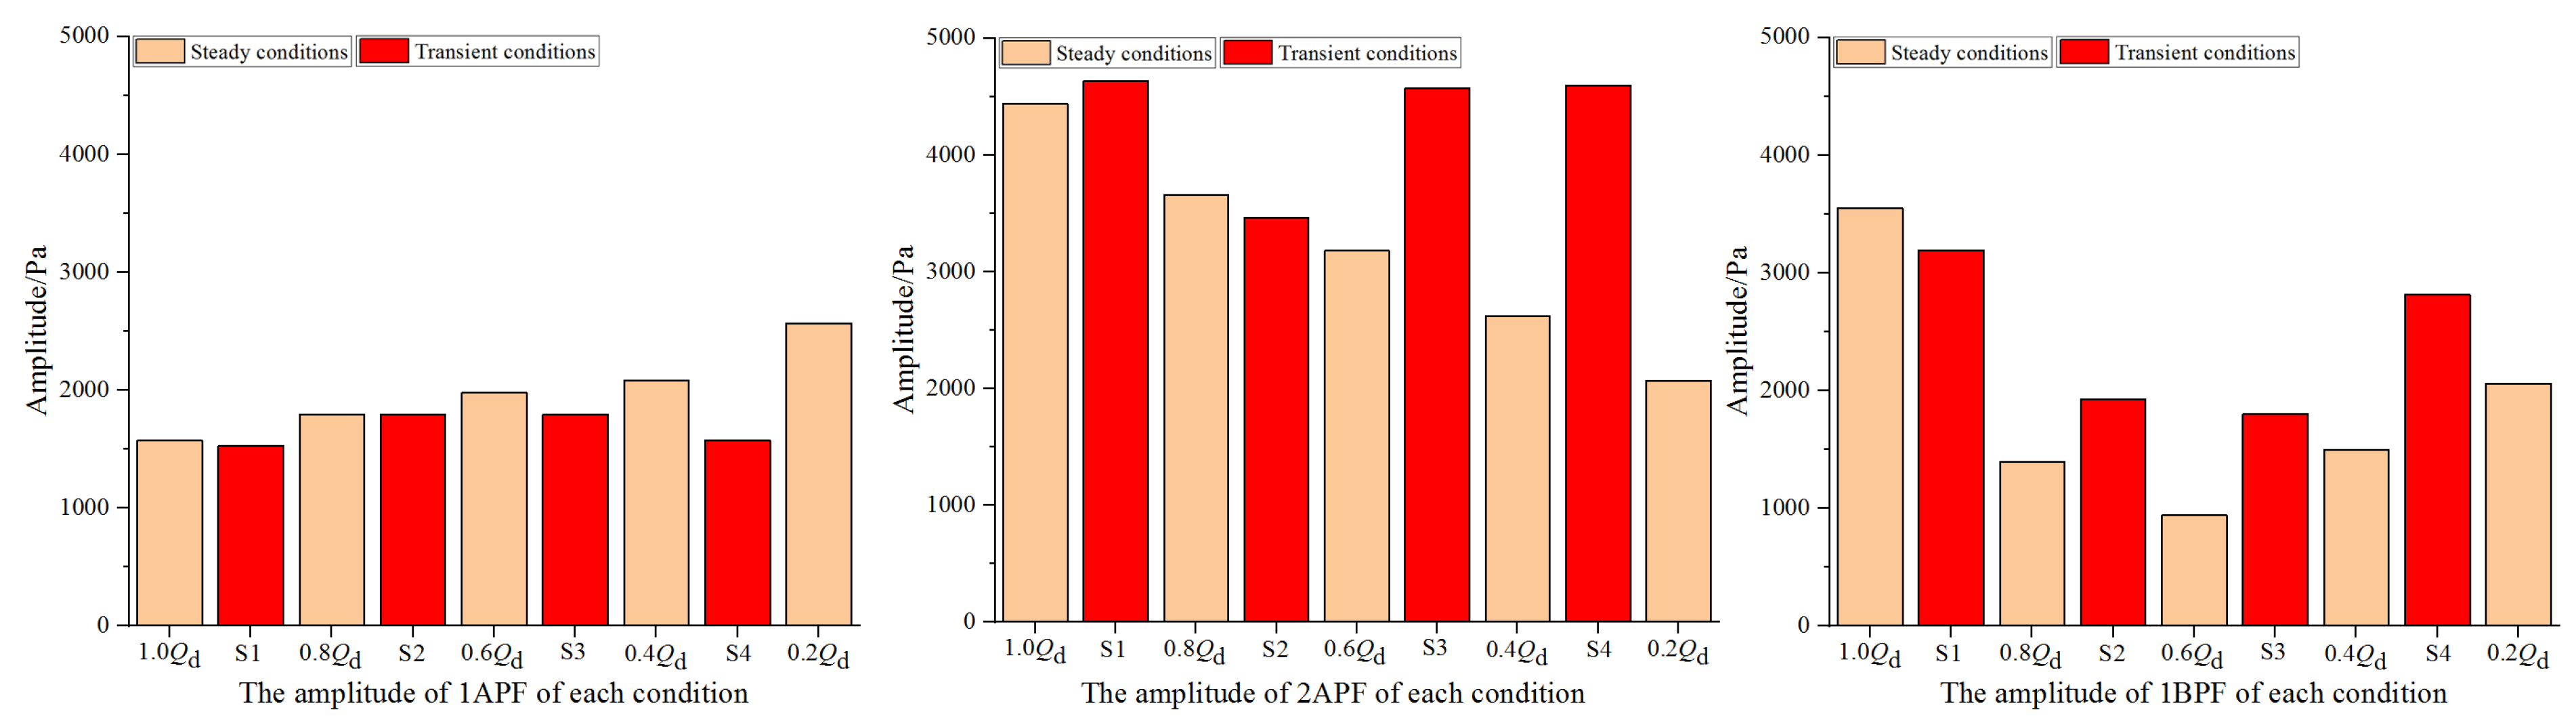
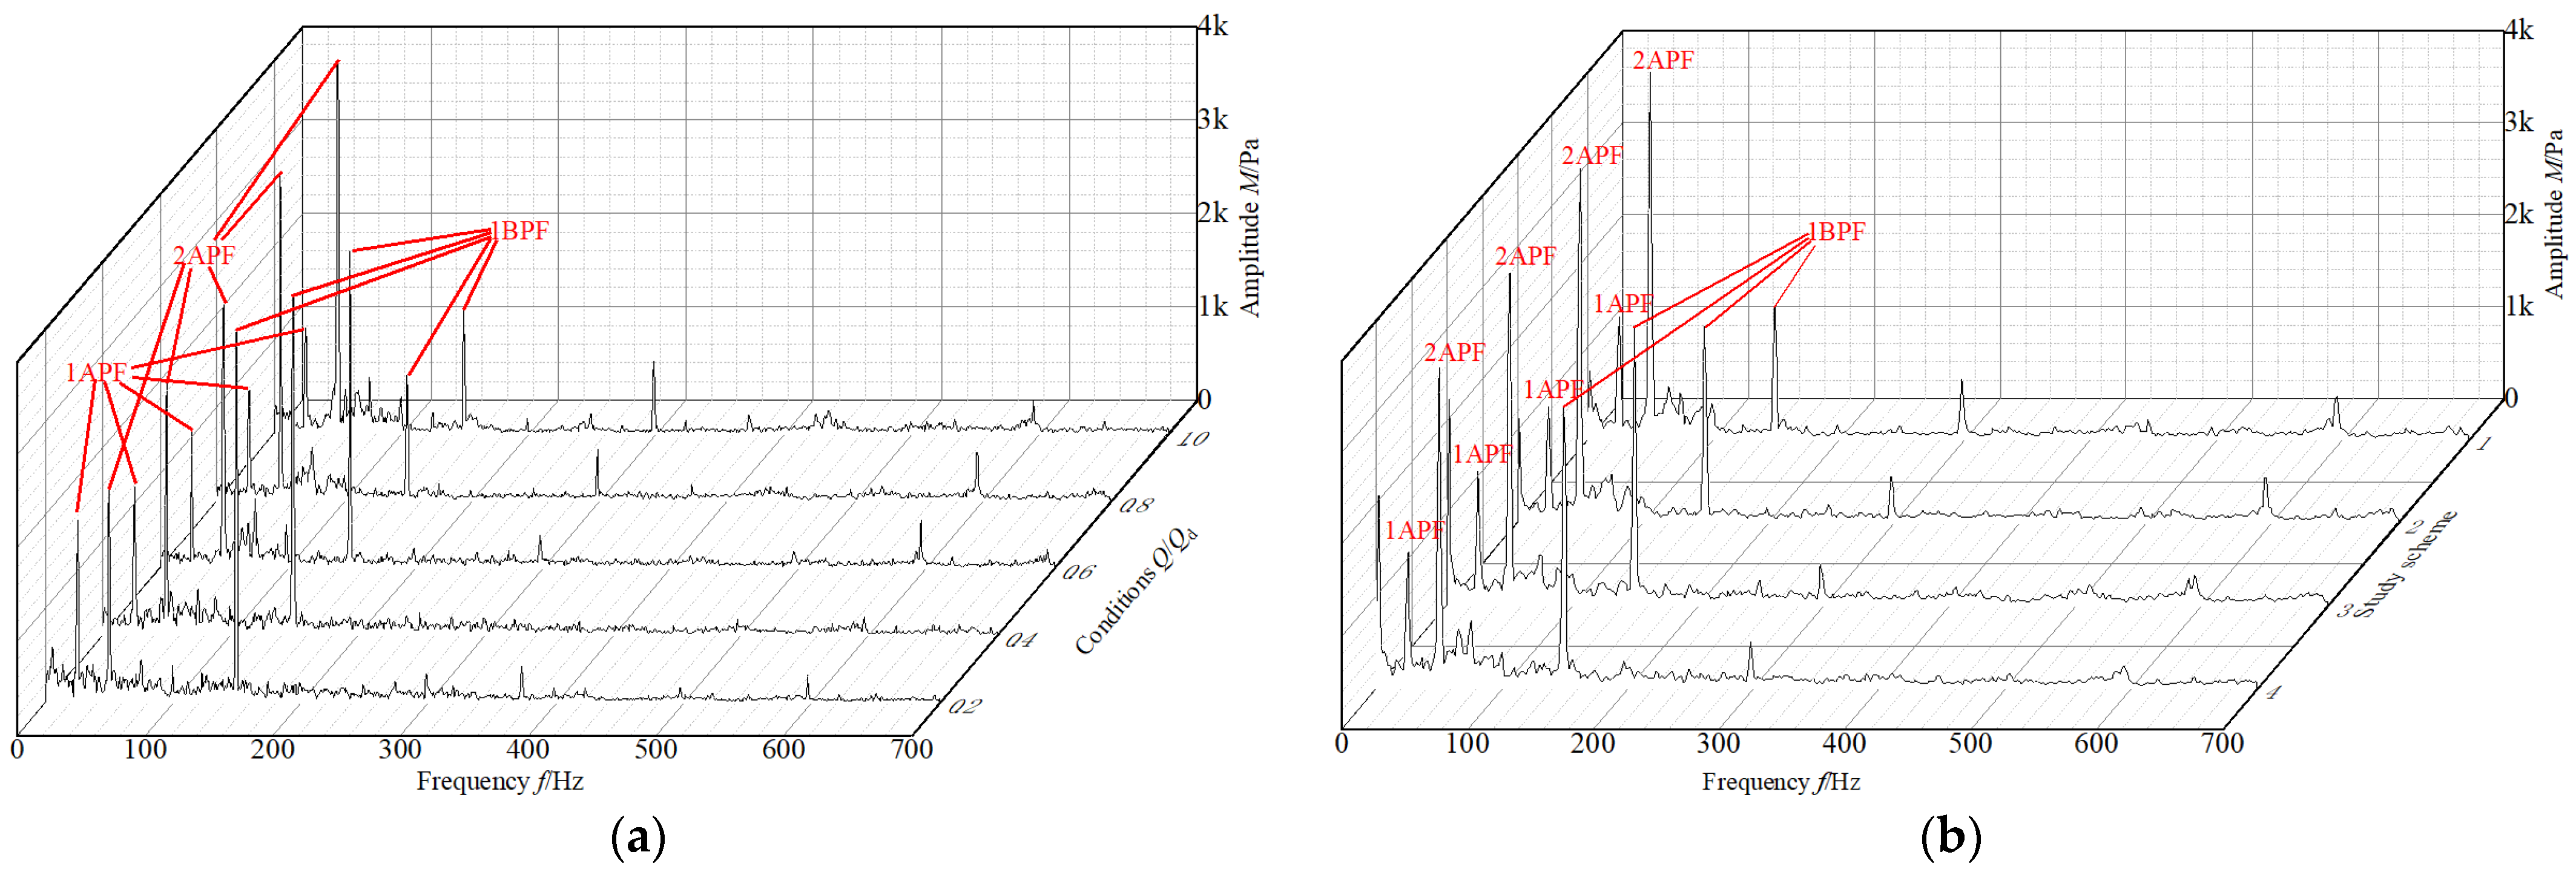
3.2. Dynamic Pressure Frequency Analysis

The time domain analysis has the advantages of being intuitive and easy-to-understand. It is hard for some characteristic frequencies to be distinguished from the time domain analysis during transient conditions. Therefore, two measuring points of steady-state operating conditions and transient operating conditions are selected for 2 s to perform FFT (Fast Fourier Transform) for studying the frequency characteristics of dynamic pressure under transient conditions.
The rotation speed of the test pump is 1489 rpm, the axial passing frequency (APF) of the ballast pump is 24.8 Hz, and the blade passing frequency (BPF) is 148.8 Hz.
(1)
The frequency analysis of the dynamic pressure for P1
Figure 7 shows the dynamic pressure frequency distribution of each of the steady-state and transient conditions at P1. It can be seen that the pulsation of dynamic pressure in transient, and the steady-state conditions are mainly distributed at 0~300 Hz, with the main pulsating frequencies being 1APF, 1BPF and their harmonic frequencies; there is a broadband frequency between the 2APF and 1BPF band. Therefore, the asymmetric structure of the spiral volute and the dynamic and static interference between the impeller and the inner wall of the volute are the main factors that cause the dynamic pressure pulsation inside the volute.
Figure 8 shows the amplitudes of each pulsation frequency of dynamic pressure at P1. It can be seen that the amplitude of 1APF first increases and then decreases with the increasing of the flow rate reduction, and the amplitude of the frequency of each scheme is lower than the corresponding steady-state operating conditions after the transient operating conditions. The amplitudes of 2APF and 1BPF first decrease and then increase, and the amplitudes of each research scheme are lower than the corresponding steady-state operating condition after the transient operating condition, 2BPF does not show obvious law due to its small amplitude.
(2)
The frequency analysis of the rapid reduction in flow rate for P2
Figure 9 shows the frequency domain diagram of the dynamic pressure of each of the steady-state and transient conditions at P2. The pulsating frequency of dynamic pressure in transient and steady-state conditions is distributed between 0~600 Hz, and the main pulsation frequencies are 1APF, 2APF, and 1BPF. There is a broadband pulsation frequency between 2APF and 1BPF, and when measuring P1, there is an obvious excitation frequency in 4BPF for some research schemes, and the amplitude of 4BPF gradually decreases as the flow rate increases.
Figure 10 shows the amplitudes of each pulsation frequency of dynamic pressure at P2. It can be seen that with the increase in flow rate reduction, the amplitude of 1APF fluctuates slightly, but the amplitude of the frequency of each research scheme is lower than the corresponding steady-state operating conditions after the transient conditions. The amplitude of 2APF first decreases and then increases. The amplitude of the frequency of each research scheme is lower than the corresponding steady-state operating condition after the transient condition ends. The amplitude of 1BPF first increases and then decreases, and the amplitude of the frequency of each research plan is lower than that after the transient condition ends.
It can be seen from Figure 7 and Figure 9 that broadband pulsation occurs between 2APF and 1BPF. The rapid change in flow interferes with the stable flow inside the pump, which adds more unstable flow components inside the pump and leads to the appearance of broadband pulsation.

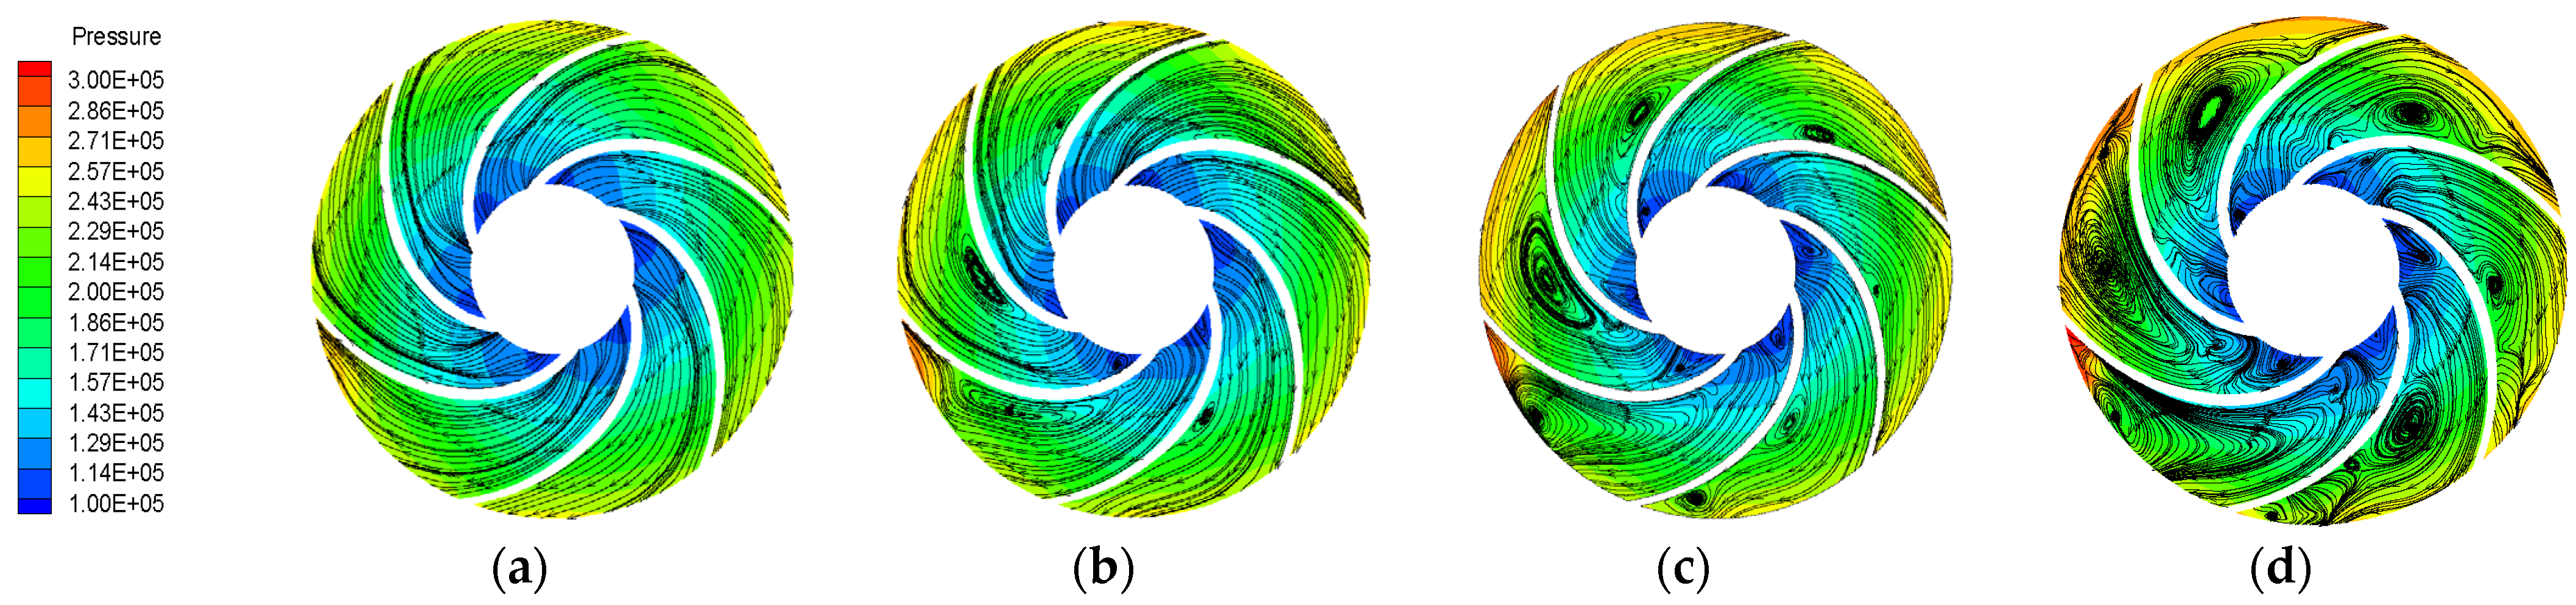
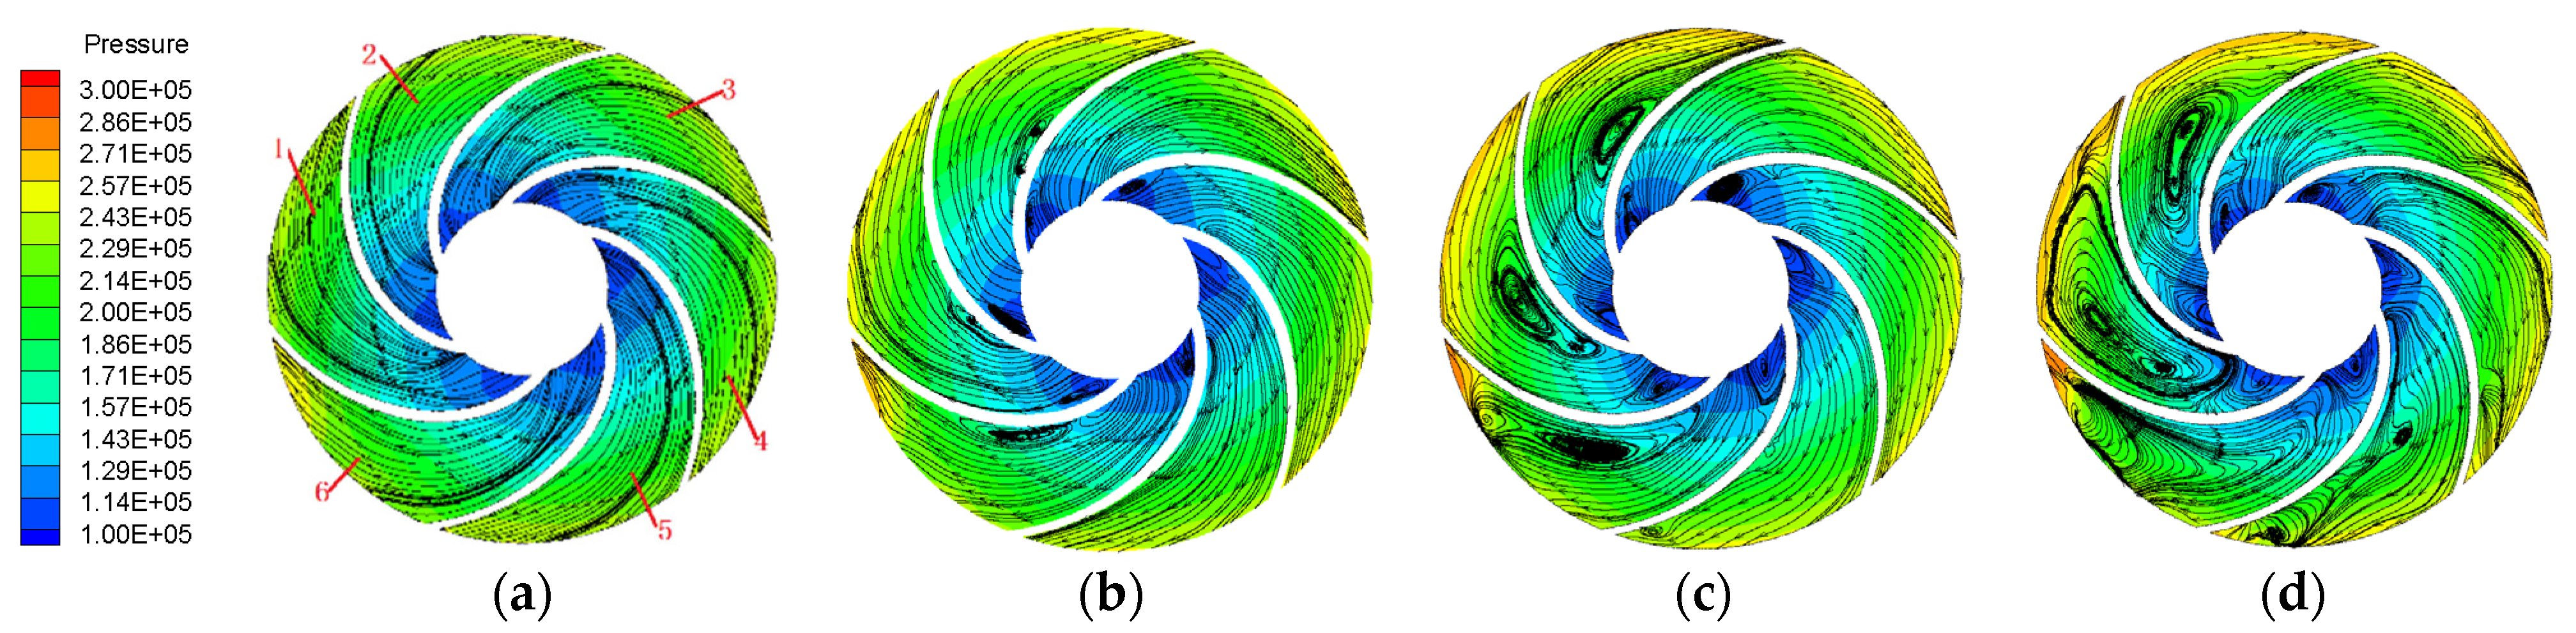
3.3. The Analysis of Inner Flow by Numerical Simulation Caiculation

When the flow rate of the ballast pump changes rapidly, the internal flow characteristics will be affected and change. In order to study the internal flow evolution mechanism of the ballast pump under the process of rapid change of flow rate, a numerical simulation of each steady and transient condition is calculated, and the ending of transient conditions and steady conditions of 0.8× Qd, 0.6× Qd, 0.4× Qd, 0.2× Qd are chosen to analyze inner flow. Figure 10 and the Figure 11 show the pressure and streamline at the middle plane of the impeller.
Figure 11 and Figure 12 show the pressure and streamline distribution in the middle section of the impeller under rapid change conditions and steady conditions. The regular separated vortices and other irregular unsteady flow structure are gradually generated in the impeller with a decrease in the flow rate. Under the action of impeller rotation, the Coriolis force and circumferential pressure gradient of the fluid near the pressure surface are unbalanced, and the mainstream outside the boundary layer will experience a reduction in kinetic energy to increase the pressure. While the velocity of the fluid near the pressure surface decreases to 0 m/s, the fluid near the pressure surface will be squeezed into the mainstream, and separated vortices are generated. As the flow rate decreases, the separated vortices expand and are subjected to viscous action, and the single vortices are separated into two independent vortices. The downstream vortices move to the impeller outlet and then its interaction with the volute tongue can cause a collapse and cessation of the vortices and an increase in pulsation frequency of downstream monitor points, which drives the 2BPF, 3BPFand 4BPF frequencies.
As shown in Figure 12, the inner flow of the rapid changing conditions is more complex than the steady conditions. When the flow rate rapidly decreases to 0.8× Qd, the meridian velocity of the fluid near the pressure surface of the blade and shear force continuously decreases. A separation of the vortices then occurs in the middle of the pressure surface of passage 2. However, no obvious reflux for the 0.8× Qd of the steady conditions has yet occurred in the impeller. For S2, when the flow rate is rapidly reduced to 0.6× Qd, the separation vortex structure appears in the middle position of the blade pressure surface in flow passages 1, 2, and 6, and the size of the separation vortex is significantly larger than the corresponding 0.6× Qd steady-state condition. For S3 and S4, the size of the separation vortex in the flow channel is also significantly larger than the corresponding steady-state operating condition, because as the flow rate change increases, the relative velocity of the fluid particles in the flow channel continues to decrease, and the absolute velocity continues to increase. This in turn increases the imbalance between the Coriolis force and circumferential pressure of the surrounding fluid particles, meaning the generation of separation vortices and the continuous increase in scale. The larger-scale separating vortex squeezes the fluid in the flow channel, which leads to an increase in the energy of the jet at the outlet of the impeller, and an increase in the pulsation intensity of 1BPF at P1. However, the larger scale backflows move to the impeller outlet under transient conditions, which then has a collision with the tongue of the volute, which decreases the strength of the interaction between the jet form impeller outlet and tongue. Therefore, the amplitude of 1BPF at P2 is reduced, and is lower than the corresponding steady conditions. The rapid change in flow has caused an increase in the uneven distribution of the impeller outlet pressure, and it reflects that the dynamic pressure pulsation of the impeller outlet does not have an obvious characteristic frequency, thus causing an increasing pulsation level of the broadband frequency between 2APF and 1BPF.

4. Conclusions

The rapidly changing flow rate for the ballast pump has been designed by experimental method. The dynamic pressure of four transient conditions is tested and the time domain and frequency of dynamic pressure under steady and transient conditions are analyzed. The following conclusions can be obtained.
  • The dynamic pressure in the ballast pump periodically increases. The larger the amplitude of the flow reduction is, the greater the rate of the pressure increase. While the flow rate rapidly decreases to 0.4× Qd and 0.2× Qd, the pressure builds up quickly and then slowly.
  • The dynamic pressure pulsation intensity of each transient scheme is higher than the corresponding steady-state conditions after the transient conditions. With the rapid reduction in the flow rate, the dominant frequencies of the dynamic pressure are 1APF and 1BPF and their harmonic frequencies.
  • The rapid reduction in flow rate accelerates the separation of the vortex in the impeller channel, which shows that the separating vortexes are generated in advance, and their scale increases, which in turn reduces the pulsation intensity of the pump outlet and also causes an increase in the level of broadband pulsation between 2APF and 1BPF.

Author Contributions

Conceptualization, Z.Z. and H.L.; methodology, Z.Z.; software, Z.Z.; validation, Z.Z., and H.L.; formal analysis, Z.Z.; investigation, Z.Z.; resources, Z.Z.; data curation, Z.Z.; writing—original draft preparation, Z.Z.; writing—review and editing, Z.Z.; visualization, H.L.; supervision, H.L.; project administration, H.L.; funding acquisition, H.L. All authors have read and agreed to the published version of the manuscript.

Funding

This research was funded by the National Science Foundation (Grant No. 1601440040 and 51779108) and the second level of scientific research funding for the fifth phase of “333 Project” in Jiangsu.

Institutional Review Board Statement

Not applicable.

Informed Consent Statement

Not applicable.

Data Availability Statement

The data used in this study are openly available in the public domain.

Conflicts of Interest

The authors declare no conflict of interest.

References

  1. Li, J.H. Design of simulation test platform for simi-submersible ship’s navigation ballast monitoring software. Ship Sci. Technol. 2020, 42, 191–193. [Google Scholar]
  2. Huang, C. Optimization Study on Ballast Pipe System for Large Barge Crane Vessel. Master’s Thesis, Shanghai Jiaotong University, Shanghai, China, 2012. [Google Scholar]
  3. Dazin, A.; Caignaert, G.; Bois, G. Transient behavior of turbomachinery: Applications to radial flow pump startups. J. Fluids Eng. 2007, 129, 1436–1444. [Google Scholar] [CrossRef]
  4. Xu, B.J.; Li, Z.F.; Wu, D.Z.; Wang, L.Q. Numerical simulation for transient turbulence flow of centrifugal pump during starting period. Sci. Online 2010, 5, 683–687. [Google Scholar]
  5. Wu, D.Z.; Xu, B.J.; Li, Z.F.; Wang, L.Q. Numerical simulation on internal flow of centrifugal pump during transient operation. J. Eng. Therm. 2009, 30, 781–783. [Google Scholar]
  6. Wu, D.Z.; Wang, L.Q.; Hu, Z.Y. Numerical simulation of centrifugal pump’s transient performance during rapid starting period. J. Zhejiang Univ. (Eng. Sci.) 2005, 39, 1427–1430. [Google Scholar]
  7. Li, W.; Zhang, Y.; Shi, W.D.; Ji, L.L.; Yang, Y.F.; Ping, Y.F. Numerical simulation of transient flow field in a mixed-flow pump during starting period. Int. J. Numer. Methods Heat Fluid Flow. 2018, 28, 927–942. [Google Scholar] [CrossRef]
  8. Farhadi, K.; Bousbia-salah, A.; D’Auria, F. A model for the analysis of pump start-up transients in Tehran Research Reactor. Prog. Nucl. Energy. 2007, 49, 499–510. [Google Scholar] [CrossRef]
  9. Jiang, Z.X.; Xie, J.L.; Gao, H. The Analysis of Transient Hydraulic Characteristics of Pump Startup-shutdown and Valve Closed in Closed Water System. Refri. Air Condi. 2015, 621–624. [Google Scholar]
  10. Rochuon, N.; Trébinjac, I.; Billonnet, G. An extraction of the dominant rotor-stator interaction modes by the use of proper orthogonal decomposition (POD). Int. J. Therm. Sci. 2006, 15, 109–114. [Google Scholar] [CrossRef]
  11. Tsukamoto, H.; Ohashi, H. Transient characteristics of a centrifugal pump during starting period. J. Fluids Eng. 1982, 104, 6–13. [Google Scholar] [CrossRef]
  12. Lefebvre, P.J.; Barker, W.P. Centrifugal pump performance during transient operation. J. Fluids Eng. 1995, 117, 123–128. [Google Scholar] [CrossRef]
  13. Thanapandi, P.; Prasad, R. A quasi-steady performance prediction model for dynamic characteristics of a volute pump. Proc. Inst. Mech. Eng., Part A 1994, 208, 47–58. [Google Scholar] [CrossRef]
  14. Wu, D.Z.; Jiao, L.; Wang, L.Q. Experimental study on transient performance of centrifugal pump under different starting acceleration. J. Eng. Thermophys. 2008, 29, 62–64. [Google Scholar]
  15. Zhang, S.S.; Wu, D.Z. Development of Transient Characteristic Test System of Centrifugal Pump. Acta Metr. Sini. 2005, 26, 159–162. [Google Scholar]
  16. Khalifa, A.E.; Alqutub, A.M.; Benmansour, R. Study of pressure fluctuations and induced vibration at blade-passing frequencies of a double volute pump. Arabian J. Sci. Eng. 2011, 36, 1333–1345. [Google Scholar] [CrossRef]
  17. Fu, S.; Zheng, Y.; Kan, K. Numerical simulation and experimental study of transient characteristics in an axial flow pump during start-up. Renew. Energy. 2020, 146, 879–1887. [Google Scholar] [CrossRef]
  18. Li, Z.F.; Wu, D.Z.; Wang, L.Q. Experiment on instantaneous characteristics in centrifugal pump during startup period. J. Drai. Irri. Mchi. Eng. 2010, 28, 389–393. [Google Scholar]
  19. Li, Z.F.; Wang, L.Q.; Dai, W.P. Diagnostics of a centrifugal pump during starting period based on vorticity dynamics. J. Eng. Thermphys. 2010, 31, 48–51. [Google Scholar]
  20. Wang, Y.; Chen, J.; Liu, H.L. Transient characteristic analysis of ultra-low specific-speed centrifugal pumps during startup period under shut-off condition. J. Agri. Eng. 2017, 33, 68–74. [Google Scholar]
  21. Shao, C. Research on Characteristic of Super-low Specific Speed Centrifugal Pumps during Transient Period. Master’s Thesis, Jiangsu University, Zhenjiang, China, 2016. [Google Scholar]
Figure 1. Test pump and the monitoring points distribution.
Jmse 09 01299 g001
Figure 2. Sketch diagram of the experimental system for rapid reduction of flow rate. 1 Model pump, 2 Pressure sensor, 3 PLC controller, 4 Data collection systems, 5 Computer, 6 Electromagnetic flowmeter, 7 Pneumatic control valve, 8 Air compressor, 9 Backwater valve, 10 Water tank, 11 Vent hole, 12 Inlet hole, 13 Level gauge, 14 Drain valve, 15 Water outlet valve, 16 Base.
Jmse 09 01299 g002
Figure 3. The sampling system.
Jmse 09 01299 g003
Figure 4. The time domain of pressure fluctuation at P1. (a) S1, (b) S2, (c) S3 and (d) S4.
Jmse 09 01299 g004
Figure 5. The time domain of pressure fluctuation at P2. (a) S1, (b) S2, (c) S3 and (d) S4.
Jmse 09 01299 g005aJmse 09 01299 g005b
Figure 6. The standard deviation of dynamic pressure of transient and steady conditions at (a) P1 and (b) P2.
Jmse 09 01299 g006
Figure 7. Frequency distribution at P1 under each (a) Steady conditions and (b) Transient conditions.
Jmse 09 01299 g007
Figure 8. The amplitude of the main characteristic frequencies of dynamic pressure at P1.
Jmse 09 01299 g008
Figure 9. Frequency distribution at P2 under each (a) Steady conditions and (b) Transient conditions.
Jmse 09 01299 g009
Figure 10. The amplitude of the main characteristic frequencies of dynamic pressure at P2.
Jmse 09 01299 g010
Figure 11. The pressure and streamline distribution in impeller under steady conditions (a) 0.8× Qd, (b) 0.6× Qd, (c) 0.4× Qd and (d) 0.2× Qd.
Jmse 09 01299 g011
Figure 12. Pressure and streamline distribution in impeller after rapid change conditions (a) 0.8× Qd, (b) 0.6× Qd, (c) 0.4× Qd and (d) 0.2× Qd.
Jmse 09 01299 g012
Table 1. The main geometry parameters of ballast pump.
Overflow ComponentGeometric Parameters/UnitSymbolValue
ImpellerInlet diameter/mmD165
Outlet diameter/mmD2214
Outlet width/mmb18
Blade numberZ6
VoluteDiameter of basic circle/mmD3240
Inlet width/mmb220
Outlet diameter/mmD450
Table 2. The main technical parameters of the pressure sensor.
ParametersValue
Measuring range0–1 MPa
Output signal4–20 mA
Precision grade0.25% Fs
Power supply10–28 VDC
Working condition−10–80 °C
Table 3. The experimental scheme of rapid changing of flow rate for ballast pump.
Experimental Schemes
S1S2S3S4
1.0× Qd–0.8× Qd1.0× Qd–0.6× Qd1.0× Qd–0.4× Qd1.0× Qd–0.2× Qd
Publisher’s Note: MDPI stays neutral with regard to jurisdictional claims in published maps and institutional affiliations.

