Article

Evolution of the Seismic Response of Monopile-Supported Offshore Wind Turbines of Increasing Size from 5 to 15 MW including Dynamic Soil-Structure Interaction

by
Cristina Medina
*,†,
Guillermo M. Álamo
and
Román Quevedo-Reina
Instituto Universitario de Sistemas Inteligentes y Aplicaciones Numéricas en Ingeniería, Universidad de Las Palmas de Gran Canaria, 35017 Las Palmas de Gran Canaria, Spain
*
Author to whom correspondence should be addressed.
These authors contributed equally to this work.
J. Mar. Sci. Eng. 2021, 9(11), 1285; https://doi.org/10.3390/jmse9111285
Submission received: 22 October 2021 / Revised: 8 November 2021 / Accepted: 12 November 2021 / Published: 18 November 2021
(This article belongs to the Section Ocean Engineering)

Abstract

:
As a result of wind power’s expansion over the globe, offshore wind turbines (OWTs) are being projected in seismic prone areas. In parallel, the industry develops increasingly larger and more powerful generators. Many of the seismic response analyses of wind turbines conducted so far only consider smaller units. In this paper, a finite element substructuring model in frequency domain is used to compute the seismic response of four reference OWTs from 5 to 15 MW founded on monopiles embedded in several homogeneous soil profiles with shear wave velocities from 100 to 300 m/s and subjected to different accelerograms. The foundation behaviour is obtained through a continuum model including kinematic and inertial interaction. The relevance of soil-structure interaction and main trends of the seismic response of OWTs are inferred from the presented results. Although the seismic maximum bending moments increase with the size of the OWT system, their relevance with respect to the ones produced by design loads decreases as the turbine gets bigger. The same effect is observed for the shear forces if the soil is soft enough. The inclusion of SSI effects almost duplicates the seismic response when compared to the rigid base scenario.

1. Introduction

During the last decades, the wind energy industry has been evolving in the direction of greater turbines, with longer blades, higher towers, and more powerful generators. The swept area of commercially available OWTs (Offshore Wind Turbines) increased by 230% in the 6-year period between 2010 and 2016 while the tip height increased from just over 100 m (3 MW turbine) to more than 200 m (8 MW turbine) in the same period. The industry is expecting to develop even larger 15–20 MW turbines for 2030 which would lead to even greater turbine sizes [1]. The increasing size and rating of OWTs over the last years implies a much more relevant impact of the consequences derived from the potential failure or collapse of one of these units.
Due to the wind power’s expansion around the world, regions exposed to seismic risk where its implementation was virtually absent so far are currently starting to be considered as potential sites for the installation of OWTs [2,3]. In the main standards and design guidelines available so far for this type of structures [4,5,6,7] only marginal attention was paid to seismic analysis, as it was addressed superficially and in a non-accurate manner [8]. This fact has been motivated by two main factors. On one hand, the majority of wind turbines are located in low seismic risk regions. On the other hand, a large portion of the seismic response analysis of wind turbines that can be found in the literature were conducted on common designs at the time, which size and power were generally much lower than those corresponding to the large wind turbines that are currently being installed or projected for the near future. Therefore, their conclusions are not necessarily transferable to present needs. Thus, further investigation is required to study the seismic response of these structures more deeply to estimate the seismic loads acting on them and their foundations. As a consequence of the increasing interest in guidance for the seismic design of wind power plants, a new recommended practice has been recently published [9].
Preliminary works addressing the seismic response of wind turbines such as those of Bazeos et al. [10] and Lavassas et al. [11] analysed units of 38 and 44 m in height, respectively, and concluded that seismic actions were of marginal relevance when compared to wind loads, being the latter the determining factor in structural design. However, Lavassas et al. pointed out that in more seismically hazardous areas with medium or soft soils the seismic design could become crucial. This idea was later corroborated by Wang and Zhang [12] for a wind turbine of 70 m high. More recent studies highlight the relevance of earthquake loads in the design of wind turbines considering 65 kW [13], 2 MW [14,15] or 5 MW [13,15,16,17,18,19,20,21] systems. However, to the extent of the authors knowledge, there are few studies (e.g., [3,22,23]) in the scientific literature analysing the seismic behaviour of larger OWTs.
The soil-structure interaction (SSI) effects have shown to significantly affect the dynamic properties of the foundation-structure system with respect to the fixed-base structure [24,25,26,27,28], leading to variations in the fundamental frequency that should be considered to prevent an increase in fatigue damage induced by resonance with the excitation frequencies. An accurate estimation of the OWT natural frequency is crucial to ensure that it falls in the narrow range defined by the DNV design recommendation [4] for the purpose of avoiding the rotor frequency (1P) as well as the blade-passing frequency (3P or 2P depending on the number of blades). The SSI effects are highly dependent of the foundation typology used. The majority (80%) of the OWTs installed in water depths of less than 50 m in Europe are supported on monopile foundations [29], due to its simplicity, adaptability and good structural behaviour [30]. Álamo et al. [24] analyse the effects that SSI has on the dynamic characteristics of OWTs founded on monopiles. The obtained results confirmed the relevance of considering the foundation stiffness in the design of OWT systems to estimate the equivalent damping of the structure and also to keep its fundamental frequency within the allowed range. Given that the cost of the foundation represents up to 35% of the cost of OWTs implementation [31], special attention should be spent on the foundation design.
This paper aims at studying the relative importance of seismic loads in the design of monopiles for supporting OWT depending on their size. For this purpose, the seismic response of four reference OWTs selected from the literature and subjected to ten different accelerograms is computed. A finite element substructuring model in the frequency domain is used to obtain the seismic response of each OWT and supporting monopile embedded in several homogeneous soil profiles representing different soft-to-medium sea beds. The foundation behaviour is computed through a previously developed continuum model [32] including SSI in terms of impedance functions and kinematic interaction factors. Results for the infinitely rigid base condition are also considered in order to analyse the SSI effects on the seismic response.

2. Methodology

The seismic response of the OWT and supporting monopile is computed through a finite element substructuring model in the frequency domain. In this model, the foundation linear behaviour, including its interaction with the surrounding soil, is reproduced by impedance functions and kinematic interaction factors, which are computed through a previously developed continuum model [32]. Figure 1 illustrates the substructuring model and the different problems that are solved in order to characterize the foundation response. In the following, details about the used models are given.
Once the Frequency Response Functions of the desired variables are computed, the time response is obtained following the frequency-domain method [33].

2.1. Superstructure Modelling

The response of the superstructure is computed through the substructuring model depicted in Figure 1a. The hollow tower and monopile are represented through two-noded Bernoulli’s beam finite elements. Based on a convergence analysis, a high enough number of elements is used in order to handle the conical shape of the tower and to adequately reproduce the inertial effect of the structure. Only the lateral behaviour is considered in the analyses. Thus, each node n presents two degrees of freedom, corresponding to the lateral displacement u n and rotation θ n . The vector containing the two degrees of freedom corresponding to the base node is denoted as u b , while the rest of degrees of freedom of the system are contained in the vector u s . Distributed inertial properties are considered for the tower and monopile elements, while the additional mass introduced by the rotor-nacelle assembly is considered as a punctual mass at the top node. Hysteretic material damping is assumed for all the structural elements through the definition of complex properties.
The interaction of the structure with the foundation is modelled through the foundation impedance matrix K S S I , representing the stiffness and damping of the embedded monopile, and the kinematic interaction factors I S S I , representing the filtering of the ground motion produced by the foundation. Details about these terms are given in the following Section 2.2.
With all these considerations, after following the typical assembly procedure of the finite element method, the system of equations that have to be solved in order to obtain the frequency response of the superstructure including the SSI effects can be written as:
K ss * K sb * K bs * K bb * + K S S I ω ω 2 M ss M sb M bs M bb u s ω u b ω = 0 f S S I ω ,
where the global stiffness (and hysteretic damping) K * = Re K 1 + 2 i ξ and mass M matrices are divided into the submatrices corresponding to the base ( u b ) and rest ( u s ) of degrees of freedom, being i the imaginary unit and ξ the hysteretic damping coefficient; and f S S I is the vector containing the force and moment that arise at the base node due to the interaction of the foundation, which is defined as:
f S S I ω = K S S I ω I S S I ω .
Note that the dependency on the circular frequency ω is explicitly indicated in the corresponding terms.
For comparison purposes, it is also interesting to compute the response of the system without including the SSI effects, i.e., under the rigid base assumption. In this scenario, the free-field unitary lateral motion is directly imposed into the base node, while restricting its rotation. Thus, the governing equations of the rigid base system can be written as:
K ss * ω 2 M ss u s ω = K sb * ω 2 M sb 1 0 .
Once the response of the system in terms of its degrees of freedom is known, the nodal values of the internal forces f e (shear forces V and bending moments M) of each element e can be directly computed through:
f e ω = K e * ω 2 M e u e ω ,
being K e * and M e * the elemental stiffness and mass matrices, and u e ω the vector containing the degrees of freedom of the element’s nodes.

2.2. Foundation Modelling

The foundation response is obtained through a previously developed numerical model [32,34] for the dynamic analysis of pile foundations. This model is based on the use of the integral expression of the Reciprocity Theorem together with specific Green’s functions for the layered half space for representing the soil behaviour, including its radiation and material (hysteretic) damping. In the soil formulation, piles are treated as load-lines in terms of soil-pile interaction tractions. On the other hand, the additional stiffness and inertia introduced by the piles are considered through a beam finite element representation of them. Soil and pile variables are coupled together by imposing compatibility and equilibrium conditions at the soil-pile interface in terms of displacements and interaction tractions, respectively. The main advantage of this model is its capability to rigurously reproduce the linear response of the soil-foundation system, without any discretization of soil variables, resulting in a compact formulation. The ability of this kind of model to reproduce the foundation behaviour (i.e., impedance functions and kinematic interaction factors) for OWT monopile and bucket geometries has been verified in [34].
The foundation model can consider different types of excitation of the soil-pile system, such as incident wavefronts, prescribed conditions at the pile head or loads acting over the soil surface. Thus, it will be used for computing the foundation impedance matrix and the kinematic interaction factors that are used in the substructuring approach.
The foundation impedance matrix for the lateral problem is defined as:
K S S I ω = K H ω K H R ω K R H ω K R ω ,
being its terms the lateral K H , rocking K R and cross-coupled K R H , K H R impedance functions. These terms are frequency-dependent complex values that represent the stiffness (real part) and damping (imaginary part) of the different modes of the soil-foundation system. For obtaining their values, the two problems depicted in Figure 1b are solved. The different terms of the impedance matrix correspond to the forces that should be applied at the pile head to achieve a unitary value in each of its degrees of freedom (lateral displacement or rotation), while restricting the rest.
The seismic excitation is assumed to be planar S waves vertically propagating through the soil, producing a free-field (without foundation) lateral displacement at ground level that will be denoted as u f f . The relative greater stiffness of the pile with respect to the soil filters this motion before transmitting it to the supported structure. This filtering is quantified by the kinematic interaction factors:
I S S I ω = I u ω I θ ω ,
where I u and I θ are the lateral and rotational kinematic interaction factors, respectively. Both terms are complex-valued and frequency-dependent and are computed by solving the problem depicted in Figure 1c as the ratio between the pile head displacement or rotation with respect to the free field motion, i.e., I u = u p / u f f and I θ = θ p / u f f .
As the seismic motion constitutes the excitation of the system, the response of the system in terms of displacements, rotations or internal forces obtained by solving Equations (2)–(4) should be understood as their Frequency Response Functions with respect to the free-field motion.

3. Problem Definition

3.1. OWT Properties

Four reference wind turbines are selected from the literature to define the structures used in this study. Table 1 shows the properties extracted for each case. The tower is modelled as a variable section tubular element; where the length is given by its height and the diameter and thickness are considered to vary linearly from the bottom to the top. Besides, the rotor-nacelle assembly is assumed to be as a punctual mass.
It has not been possible to find monopiles defined in the literature that were adapted to different wind turbines under similar environmental conditions, which would allow comparisons between them. For this reason, its sizing is carried out based on the procedure described by Arany et al. [39]. Some Metocean data [39] required for this analysis are summarized in Table 2. These parameters, which have been taken as a reference, define the depth of the water and characterize the wind and waves conditions.
Although several soil profiles are considered to analyse the influence of the soil stiffness on the seismic response (see Section 3.2), the monopile is defined assuming a single set of properties. By doing so, only one monopile design for each wind turbine is obtained; easing the comparison between the different soil cases. The soil properties considered for the design of the monopile are: shear wave propagation velocity of 200 m/s, density of 2000 kg/m3, Poisson’s ratio of 0.49, effective angle of internal friction of 30 and coefficient of subgrade reaction of 4000 kN/m3.
Table 3 shows the dimensions of the piles obtained for the four wind turbines to be studied, specifying the length over the mudline level and the embedded length. To simplify the analysis the transition piece is not considered, directly connecting the bottom of the tower with the monopile.
In order to have some preliminary information about the dynamic characteristics of the obtained systems, Table 4 shows the first two natural frequencies for the tower (considering its base fixed to a rigid base) and the superstructure, i.e., tower and monopile. For the later, both the values obtained considering (with SSI) or not (rigid base) the effects of the soil flexibility are presented. As expected, as the turbine power increases, the tower becomes more flexible due to the augment in both its height and rotor mass. For the first mode, the fundamental frequency values lie in the range of 0.23–0.29 Hz, while the natural frequency of the second mode can be found between 2 and 2.5 Hz. Note that an exception of this trend is the 8 MW tower, which is slightly stiffer than the one corresponding to the 5 MW in terms of their first mode (while for the second one, the general trend is observed). The addition of the monopile to the tower increases the flexibility of the system, reducing its fundamental frequency between 10–15% and its second natural frequency around 20–25%. Finally, the SSI effects further reduce the stiffness of the system. The decrease in the natural frequencies due to the SSI is around 5% for the fundamental mode and around 20% for the second mode.
As a result of the sizing process, Table 5 shows the shear forces and bending moments at the mudline level (critical point) that the monopile suffers under Normal Operating Conditions (E1) and in the most unfavorable hypothesis (see [39] for details about the environmental load conditions).

3.2. Soil Properties

Several homogeneous soil profiles with shear wave velocities v s from 100 to 300 m/s (with a step of 25 m/s) are considered in order to represent different soft-to-medium sea beds. The rest of properties needed to define these soils are kept the same for the different profiles and correspond to: density 2000 kg/m 3 , Poisson’s ratio 0.49 and hysteretic damping coefficient 2.5%. Note that these properties can be understood as linear-equivalent properties of a saturated medium.
As mentioned before, in order to quantify the influence of considering the SSI effects when analysing the structural response, results for the infinitely rigid base assumption are also presented.

3.3. Seismic Signals

The time response of the system is computed by assuming ten different accelerograms extracted from the PEER Ground Motion Database [40]. These acceleration signals have been selected from different earthquakes measured in stations located over soils whose mean shear wave velocities V s , 30 are within the values defined in the previous section. For reproducibility’s sake, Table 6 shows the following information of the considered accelerograms: Record Sequence Number (RSN) of the database, direction with respect to the north of the horizontal component used, name and year of the earthquake event, name of the measuring station and its mean shear wave velocity, and the maximum ground acceleration a g , max of the signal.
The measured acceleration signals are assumed to correspond to the free-field motion at surface level. In order to compare the results of the different earthquakes, the system response is presented divided by the maximum ground acceleration of each signal. To provide more information about these accelerograms, Figure 2 shows the normalized pseudo-spectral accelerations (PSA) and the frequency content, through the normalized Fast Fourier Transform (FFT), of the selected signals.

4. Results

The methodology described in Section 2 is used to analyse the seismic behaviour of the four OWT systems defined in Section 3. The arising results allow obtaining envelopes of maximum seismic forces as well as studying the influence of the seismic loads and SSI effects on their structural response.

4.1. Envelopes of Maximum Seismic Forces

Figure 3 shows the mean envelopes of maximum bending moments (M) and shear forces (V) along the 10 MW OWT superstructure normalized with the peak acceleration of the corresponding seismic excitation ( a g , max ). Results obtained considering the monopile foundation embedded in homogeneous soil profiles with different shear wave propagation velocities ( v s = 100 , 200 and 300 m/s) are depicted in columns. In each graphical area, results computed taking SSI into account are represented with a black line whereas the red line shows those corresponding to the assumption of fixed-base condition. It can be seen that the greatest values of seismic forces are reached at the mudline level both under the flexible and the rigid base assumptions, being the former significantly higher than the latter in all cases. A decrease of the mean maximum bending moments associated to flexible-base condition is observed when considering stiffer soils. A clear trend cannot be identified in mean maximum shear forces.
Results in the same terms are depicted in Figure 4 for each one of the four OWTs under study to illustrate that the increase of turbines sizes and ratings leads to greater seismic internal forces and it results in a more remarkable influence of soil-structure interaction. This figure allows confirming that the envelopes of maximum bending moments and shear forces show similar trends for all the OWTs considered in this work, reaching their maximum value at the mudline level. Since the maximum internal forces for the environmental loads also take place at this point, the studies presented in the following sections are focused on this location.

4.2. Relevance of the SSI Effects

In order to display the relevance of the SSI effects on the OWTs superstructure seismic response, the ratio between the results obtained under flexible and rigid base assumption in terms of maximum seismic bending moment ( M f l e x . / M r i g i d ) and shear force ( V f l e x . / V r i g i d ) at the mudline level are plotted in Figure 5 against the shear wave propagation velocity ( v s ) for the different OWT systems considered in this study. The solid line depicted in each graphical area represents the mean value of the results computed for the different accelerograms used in this investigation whereas dashed lines show their dispersion in terms of the standard deviation. The variability of the response with the seismic excitation can be clearly appreciated in this figure, which will be discussed in Section 5.1.
In the vast majority of cases, the inclusion of SSI implies greater seismic forces than those computed under rigid base assumption (black horizontal line). The differences are slightly higher for the bending moment than for the shear forces. The importance of the SSI effects are found to be equally important regardless the OWT size, as all of the studied configurations present similar ratios.
The results show that the SSI effects can double the maximum seismic internal forces obtained under the rigid assumption. For specific excitations, this increment can reach up to three times the rigid base values. Thus, including the foundation flexibility when analysing the seismic response of this kind of structures seems mandatory.

4.3. Relevance of the Seismic Load

In order to elucidate the relevance that seismic loads could have at the OWT superstructure design stage, the seismic internal forces are now compared against that obtained under the most unfavourable environmental scenario (Table 5). In order to carry out this comparison, the equivalent ground maximum acceleration a g , max e q is defined as the maximum acceleration of the seismic free field motion that makes the maximum seismic internal force equal to the one obtained for the most unfavourable environmental scenario. Different values are defined for the two internal forces considered: bending moment a g , max e q , M and shear forces a g , max e q , V . This variable gives an idea of how strong should be the seismic motion for the seismic load overpassing the design loads. Thus, larger values of the equivalent ground maximum acceleration imply smaller relevance of the seismic excitation.
Figure 6 shows the equivalent ground maximum accelerations for the bending moment and shear force at the mudline level as a function of the soil shear wave velocity for the four OWTs considered in this work. The mean value of the results corresponding to the different seismic signals is represented by the solid lines, while their variability is illustrated with the dashed lines. Results for the rigid-base scenario are also included in black colour. As commented in the previous section, it can be seen that seismic load affects the OWT superstructure to a greater extent when SSI is considered.
The relevance of the seismic excitation at the mudline level is found to be greater for the shear force rather than for the bending moment. In fact, only extreme events can reach the mean equivalent peak accelerations over 1 g that can equal the seismic bending moments with the design requirements. On the other hand, for the shear forces, the average value of 0.5 g is more possible to be reached by severe earthquake events. However, due to the great variability in the seismic response, this kind of excitation can not be totally neglected as the minimum values of the equivalent ground maximum accelerations among the considered earthquakes lie around 0.2 g.
For both internal forces, the importance of the seismic load increases as the soil stiffness decreases up to a certain value (around 150 m/s). For the softest soils (<125 m/s), the equivalent maximum acceleration augments, implying a loss of importance of the seismic loads for the OWT design. This change of trend is analysed in more detail in Section 5.2.
Regarding the variability of the results, it can be seen that almost the same dispersion is obtained for the two studied internal forces. This variability slightly increases as the soil gets softer and the size of the OWT gets larger. The dispersion of the results depending on the considered excitation signal is further discussed in Section 5.1.
In order to better identify trends as well as to illustrate the influence of the turbine size, Figure 7 and Figure 8 present the mean value of the equivalent ground motion acceleration for the bending moment and the shear force at the mudline level against both the soil shear wave velocity and turbine size through a three-dimensional plot. Also, the influence of each individual variable is shown in the two background projections. Seismic load is shown to have a more significant influence on the mean bending moment as the turbine size decreases. The same trend also applies to the mean shear force but only in the range of softest soils (<125 m/s). For stiffer soils, the relevance of the seismic loads on the base shear force is almost the same regardless the turbine size.
The mean results presented in Figure 6 for the different OWT sizes can be easily compared in Figure 7 and Figure 8. For the bending moment, exactly the same behaviour is found regardless the turbine power. On the contrary, for the shear forces, it is found that the increment of the equivalent maximum accelerations that takes place for the softest soils is more evident as the turbine size augments.

5. Discussion

5.1. Variability of the Response Depending on the Seismic Excitation

The high variability of the seismic response observed in the results depicted in Figure 5 and Figure 6 can be better understood through the analysis of 
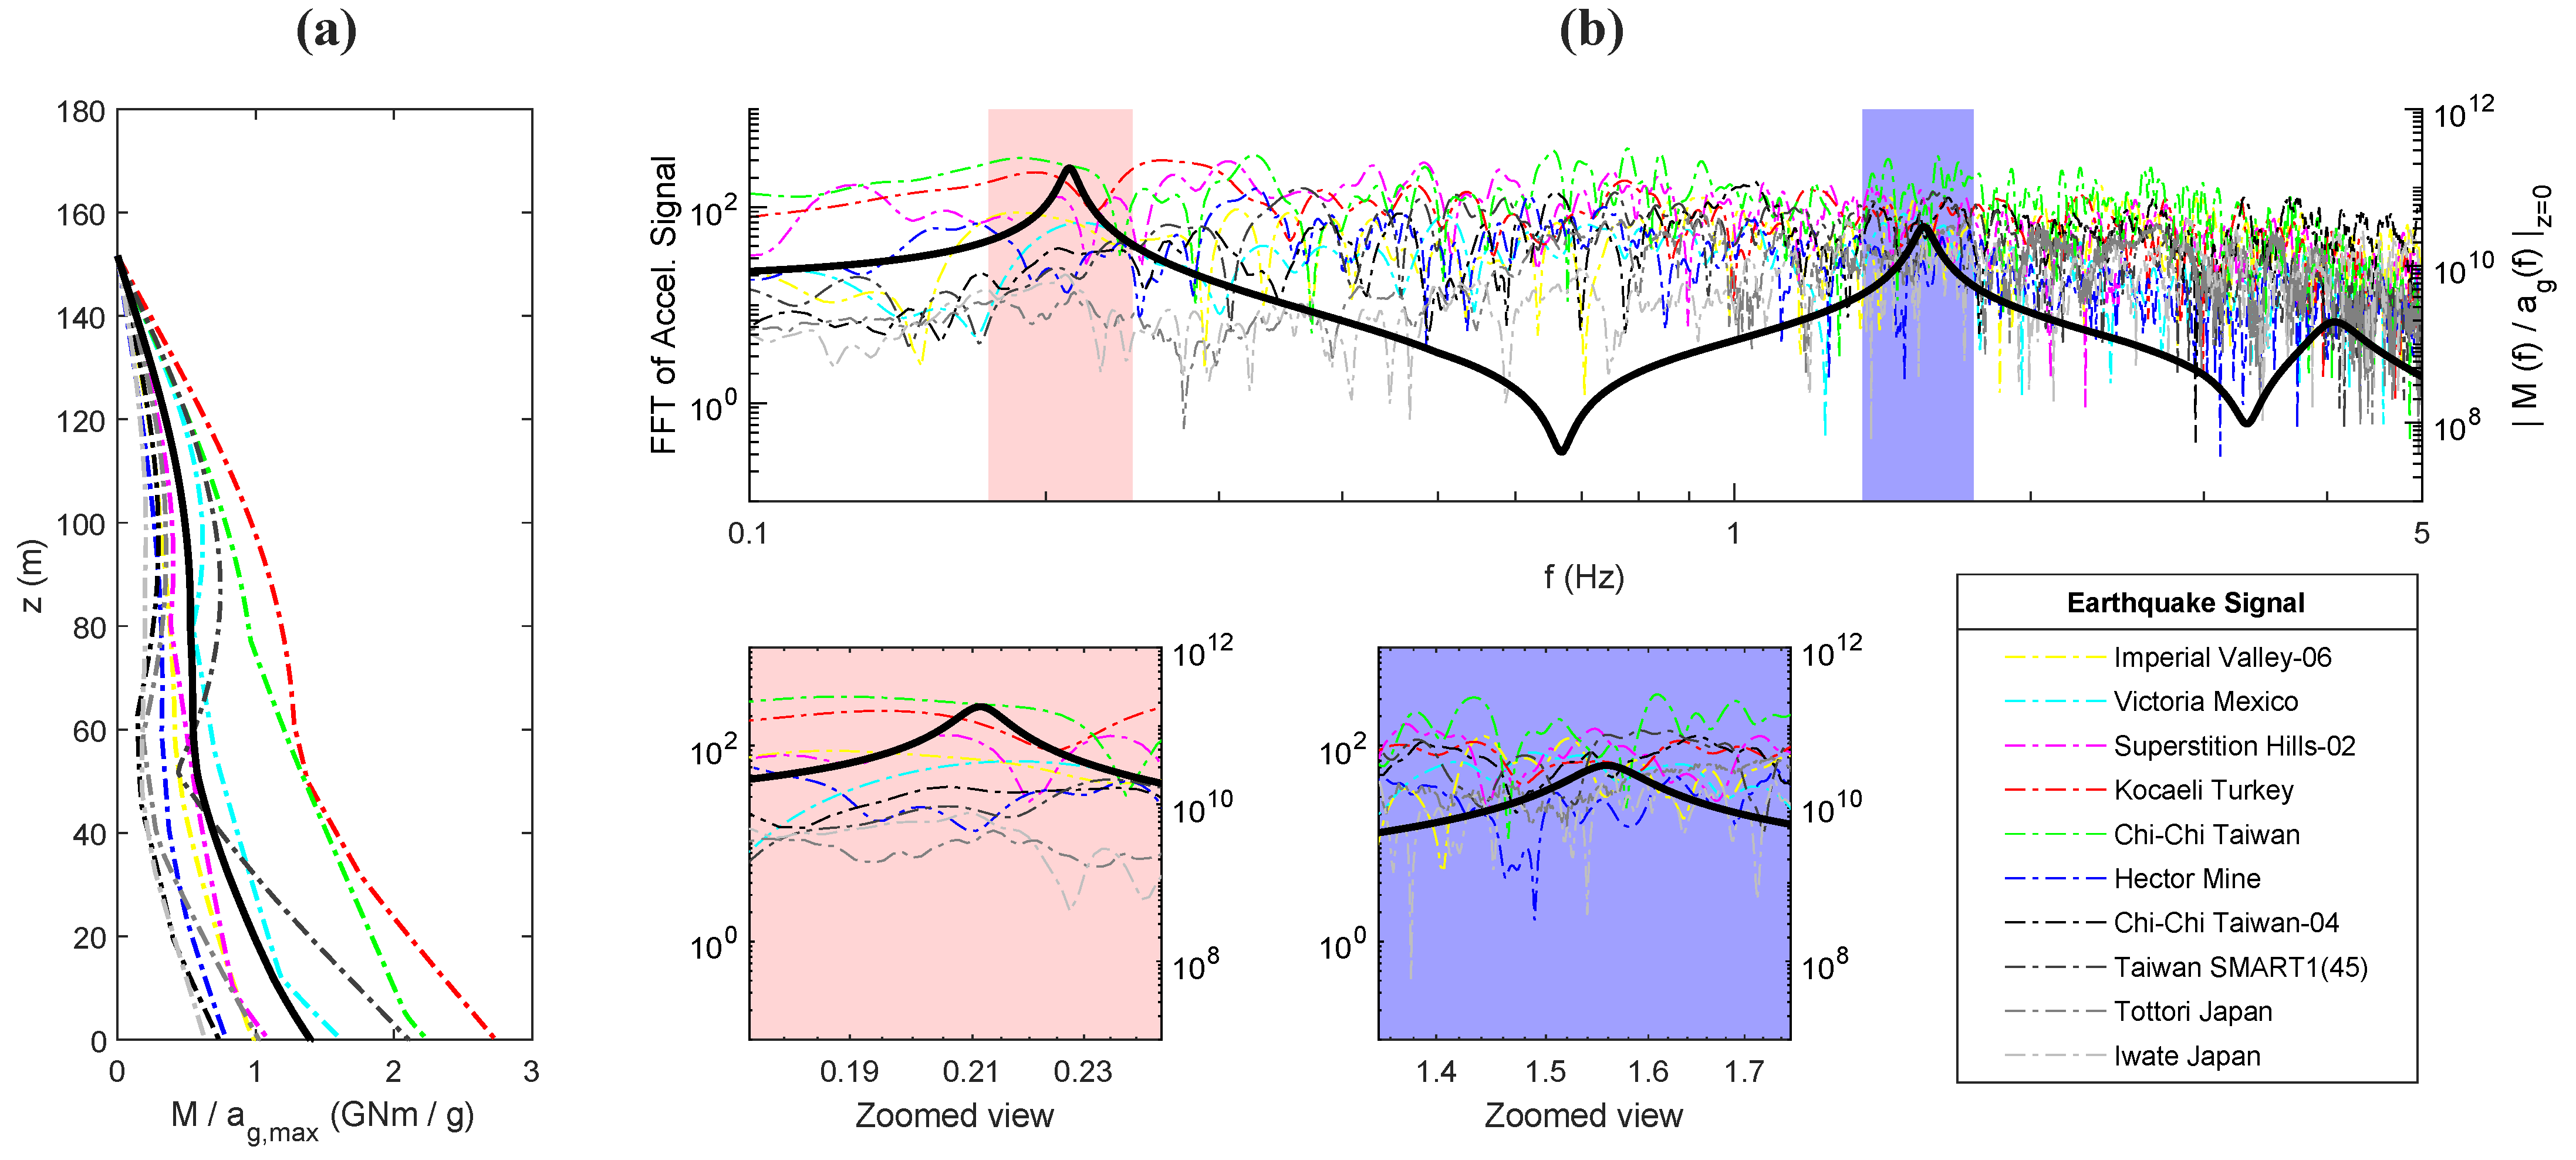
Figure 9 in which a comparison of the seismic response obtained from different accelerograms is illustrated. The presented results correspond to the 10 MW OWT supported on its monopile embedded in a soil with v s = 200 m/s.
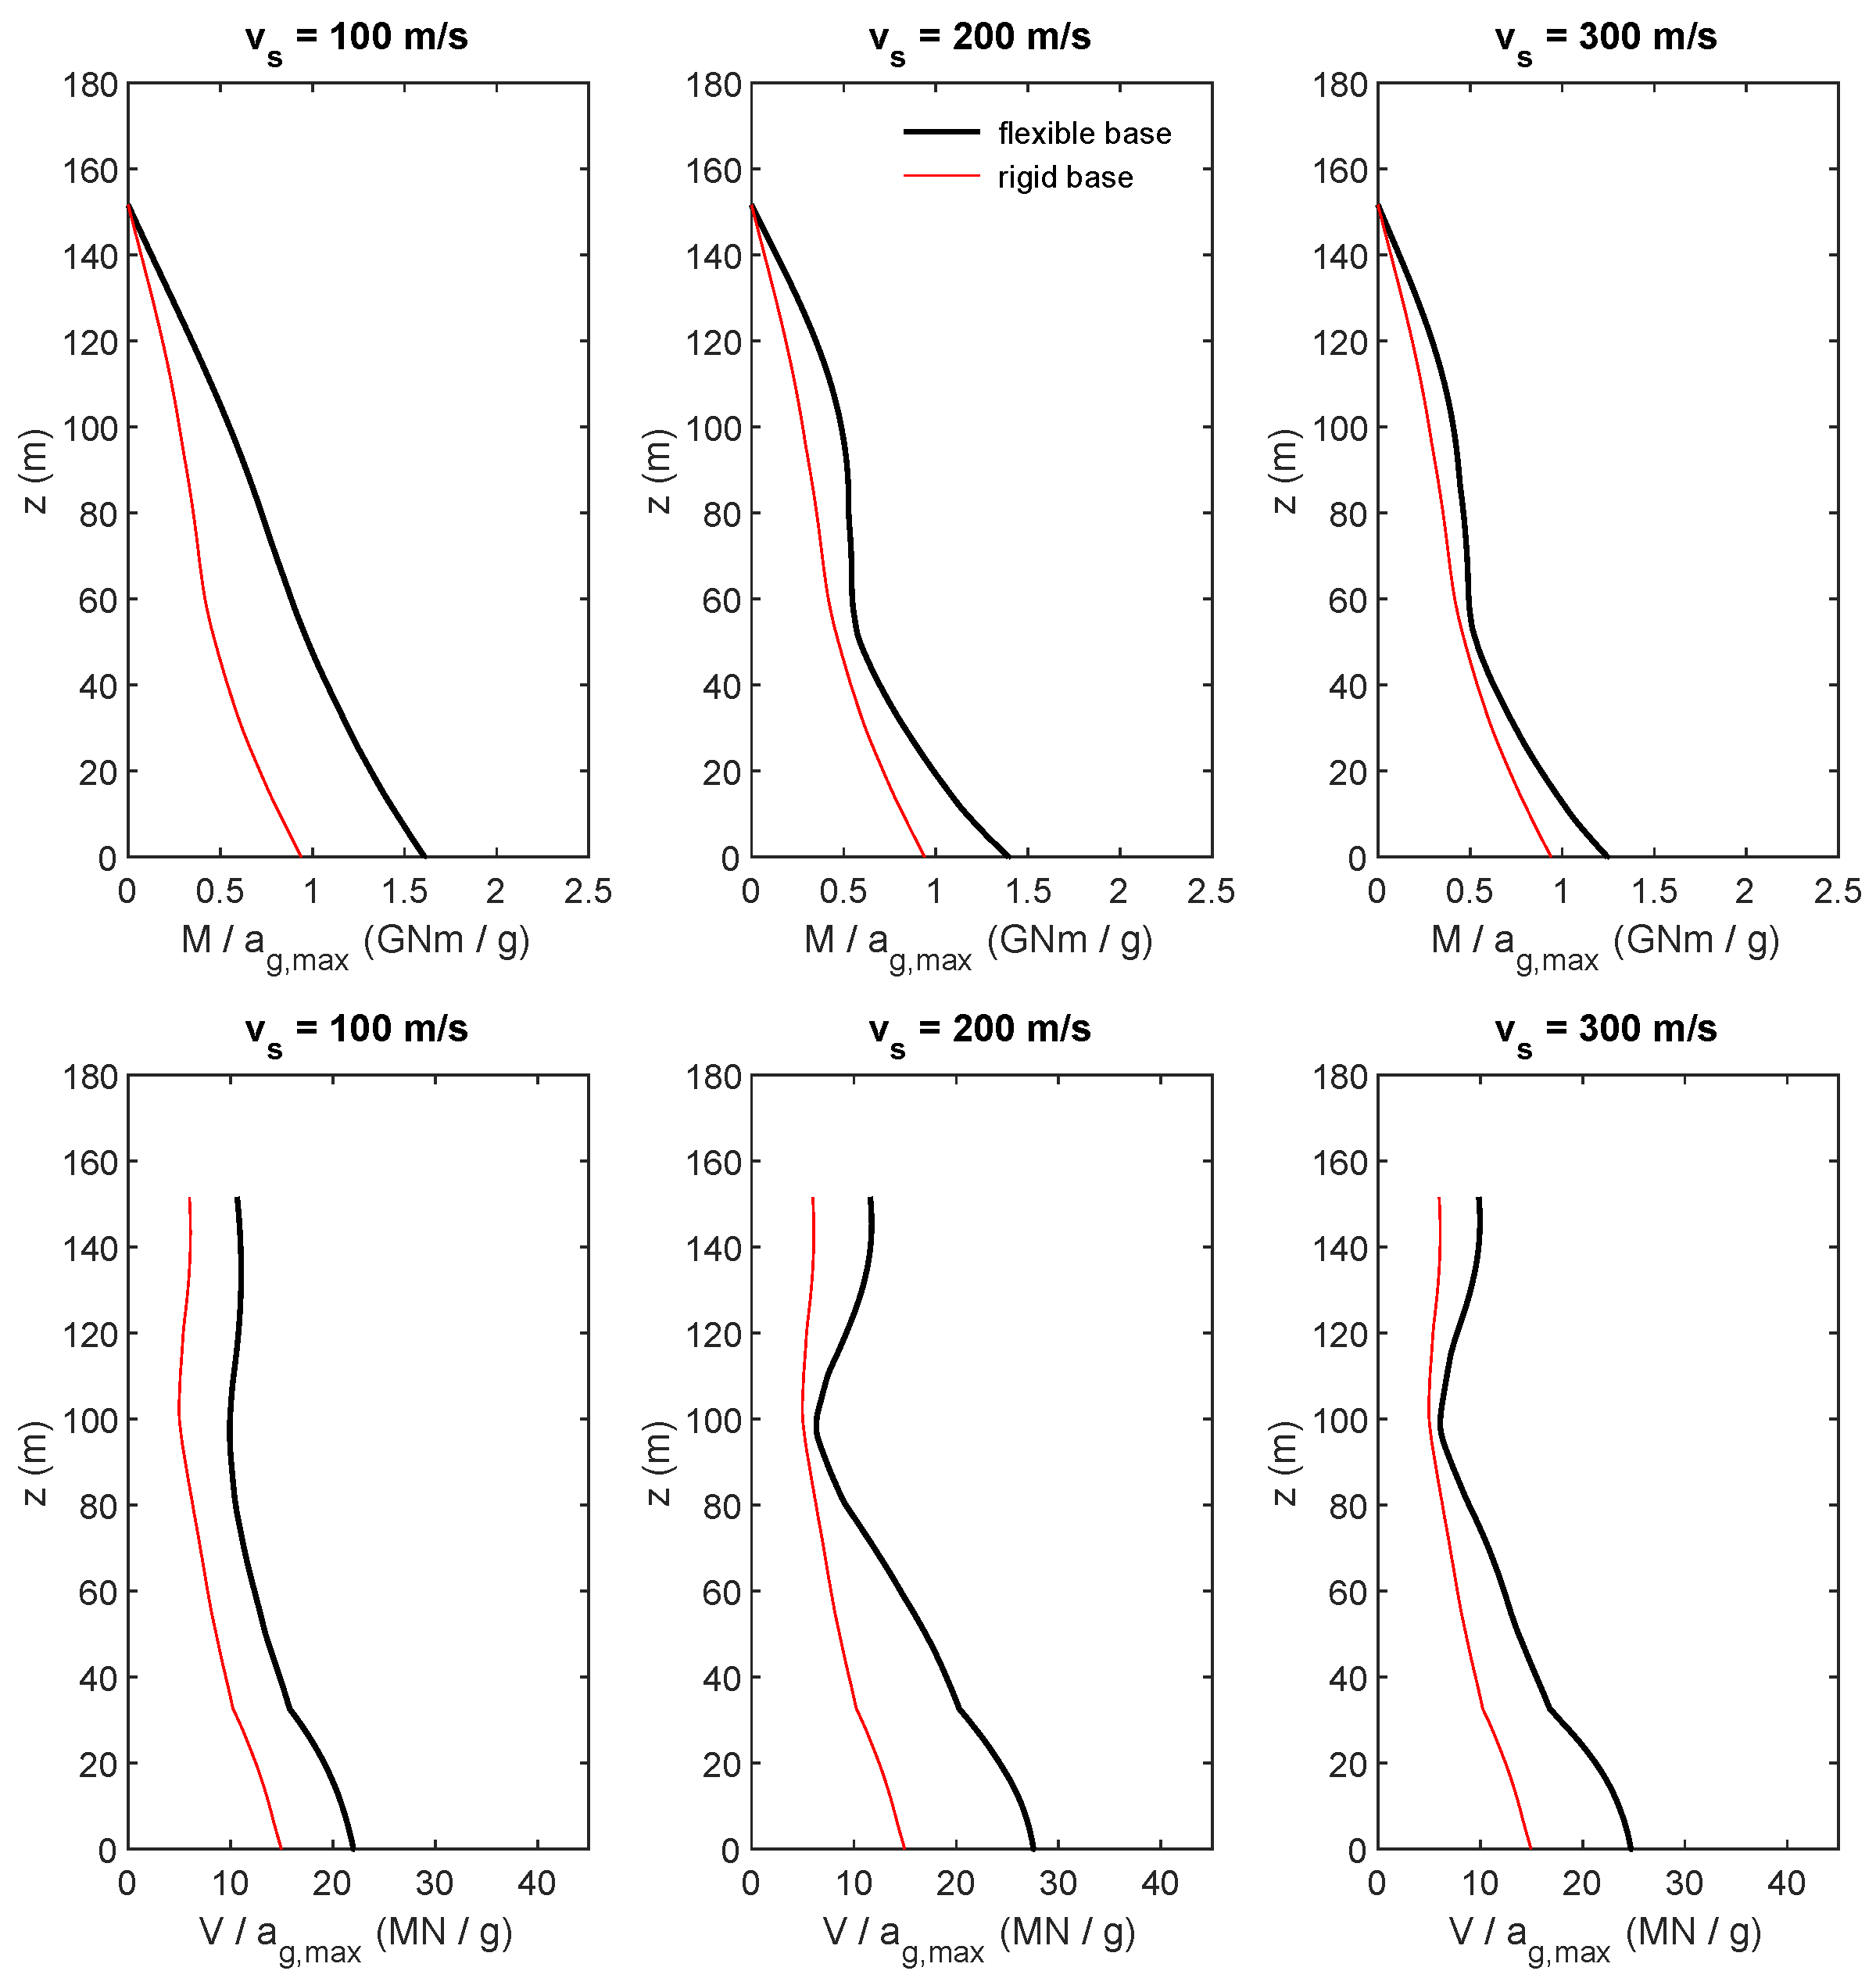
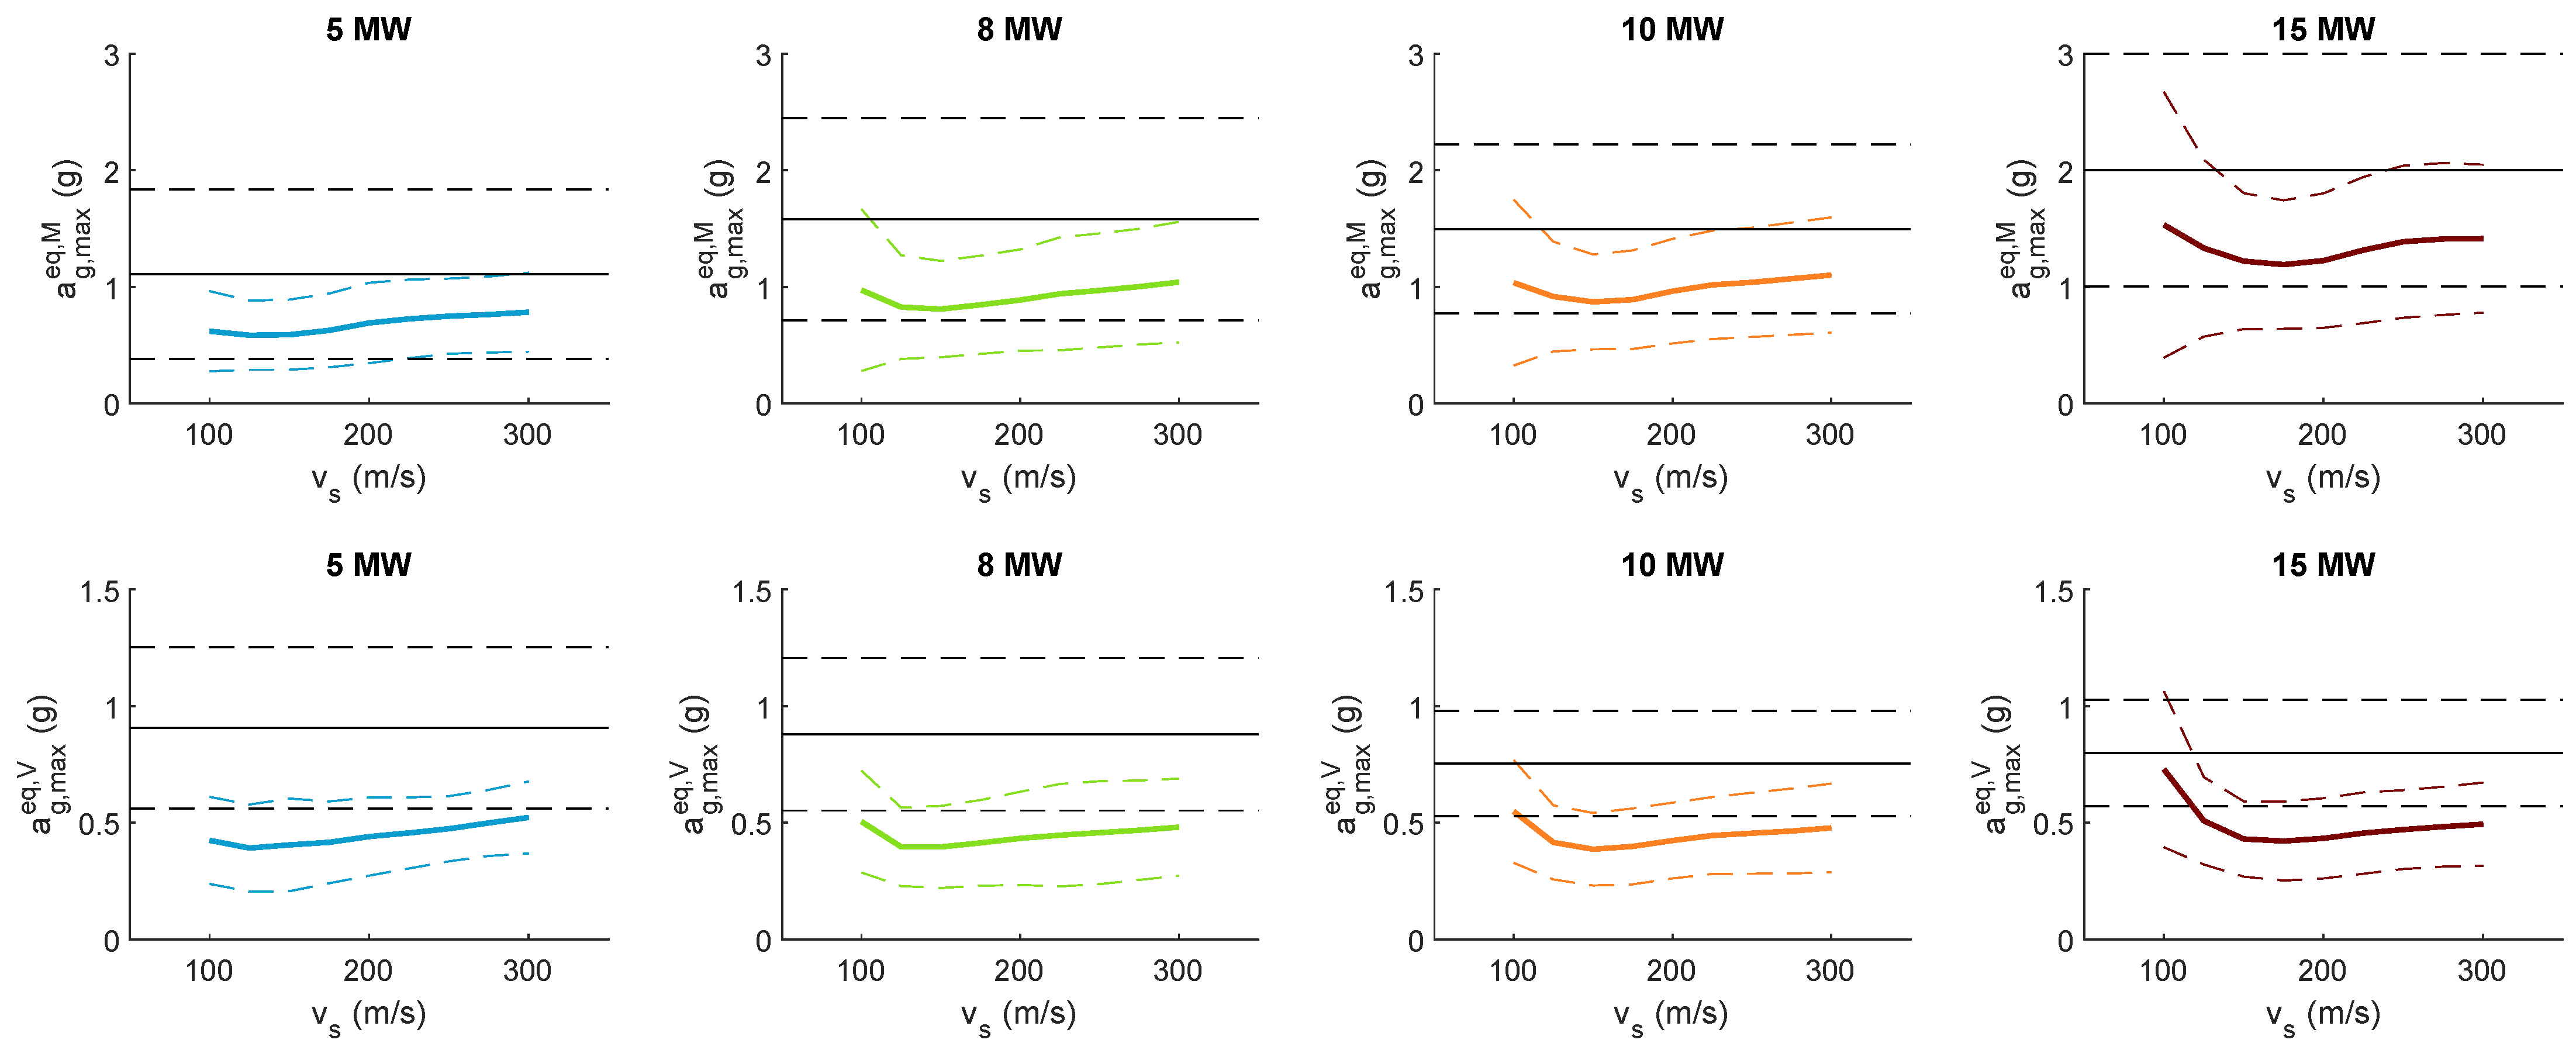
Figure 9a presents the envelopes of maximum seismic bending moment per maximum ground acceleration for each one of the earthquake signals considered in this work (dashed lines) and their mean value (solid black line). Although the evolution of the maximum bending moments along the superstructure follows nearly the same trend, their magnitude significantly differs from one seismic signal to another. This results in the relatively high dispersion obtained in Figure 5 and Figure 6.
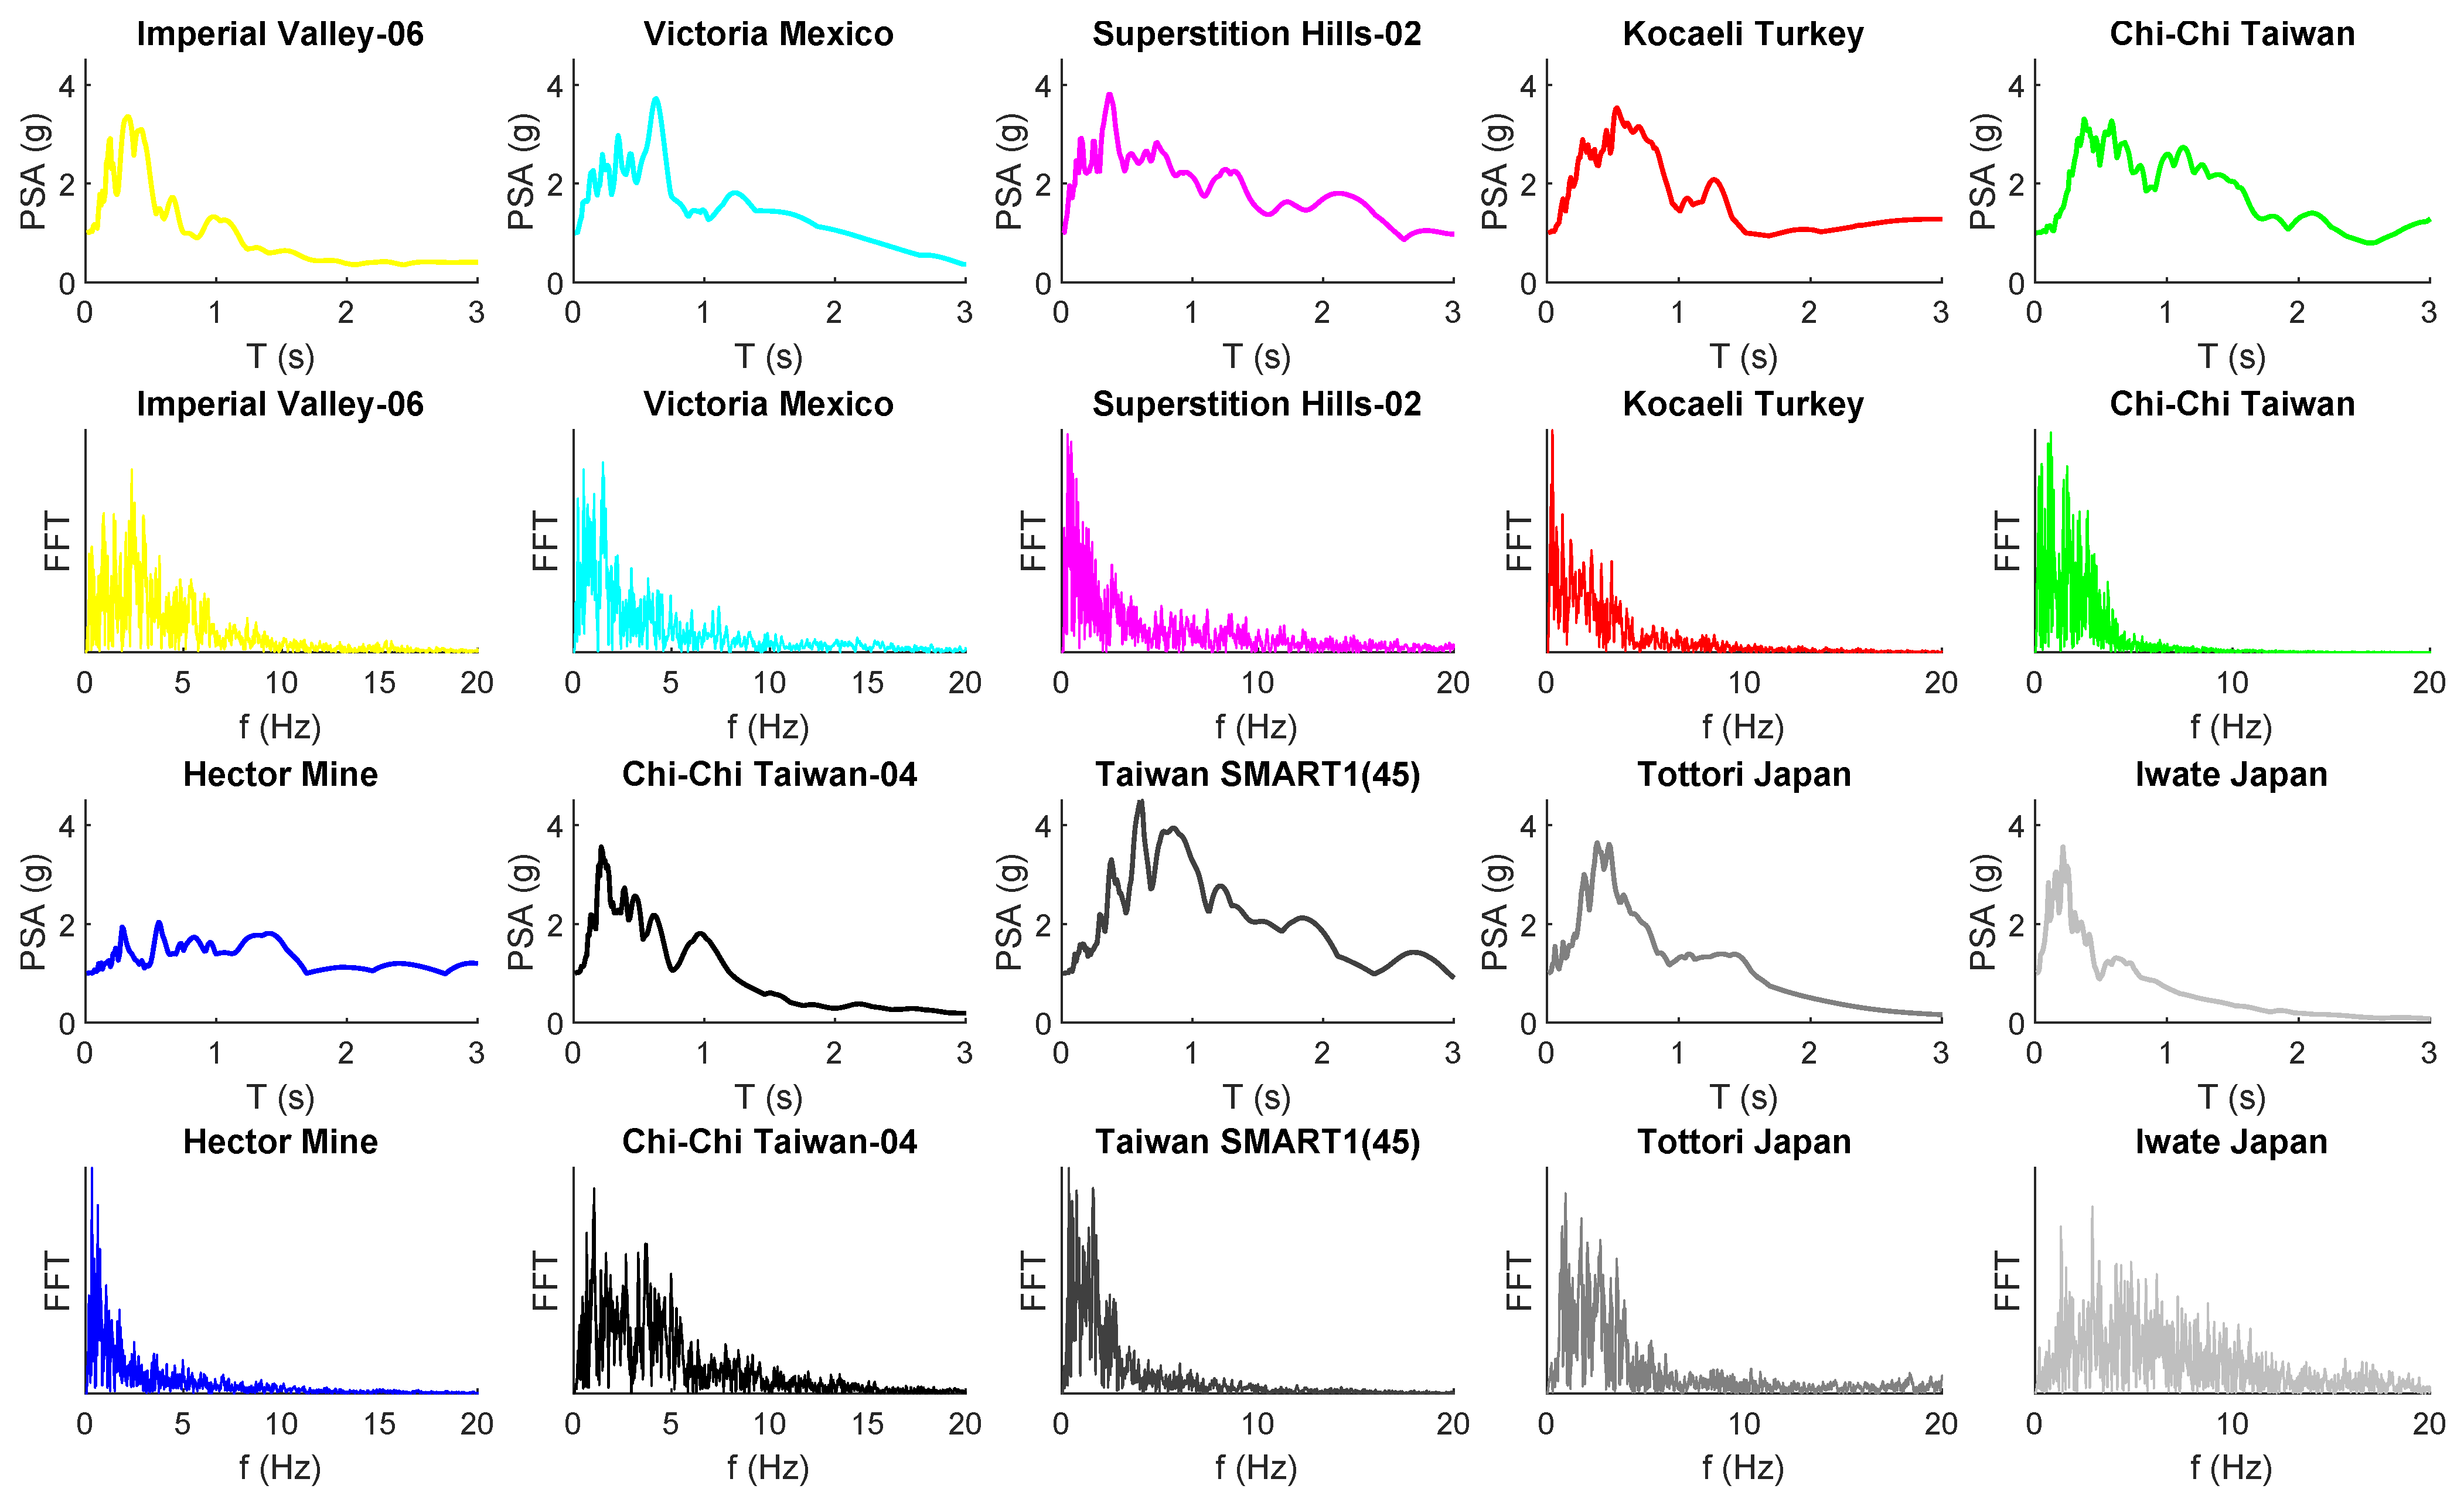
This variability on the seismic signal can be explained attending to the variable and different frequency content of each excitation signal and the sharp shape of the Frequency Response Function of the structural response variables, which are basically determined by the first two modes. This fact is illustrated in Figure 9b, in which the Fourier Transform of the seismic signals and the Frequency Response Function of the seismic bending moments at the mudline level (black line) are presented for the frequency range of interest. Please note the logarithm scale used both for the frequency and plotted variables. The frequency content of the different accelerograms in the range of the first two modes are highlighted with different colors and zoomed views are provided below. It is found that, depending on the frequency content on the seismic input, its peaks can coincide with the structural modes amplifying the system response (see, e.g., “Kocaeli Turkey” or “Chi-Chi Taiwan” signals) or not (see, e.g., “Hector Mine” or “Iwate Japan”).
This variability of the the seismic response depending on the excitation signal is a well known effect that seismic codes typically handle through the use of several input signals. In this work, following the DNV Recommended Practice DNV-RP-0585 for the seismic design of wind power plants [9], the average of the response is used to analyse the OWT superstructure seismic behaviour as more than seven earthquakes have been considered (see Guidance note 4).

5.2. Analysis of the SSI Effects on the Seismic Response

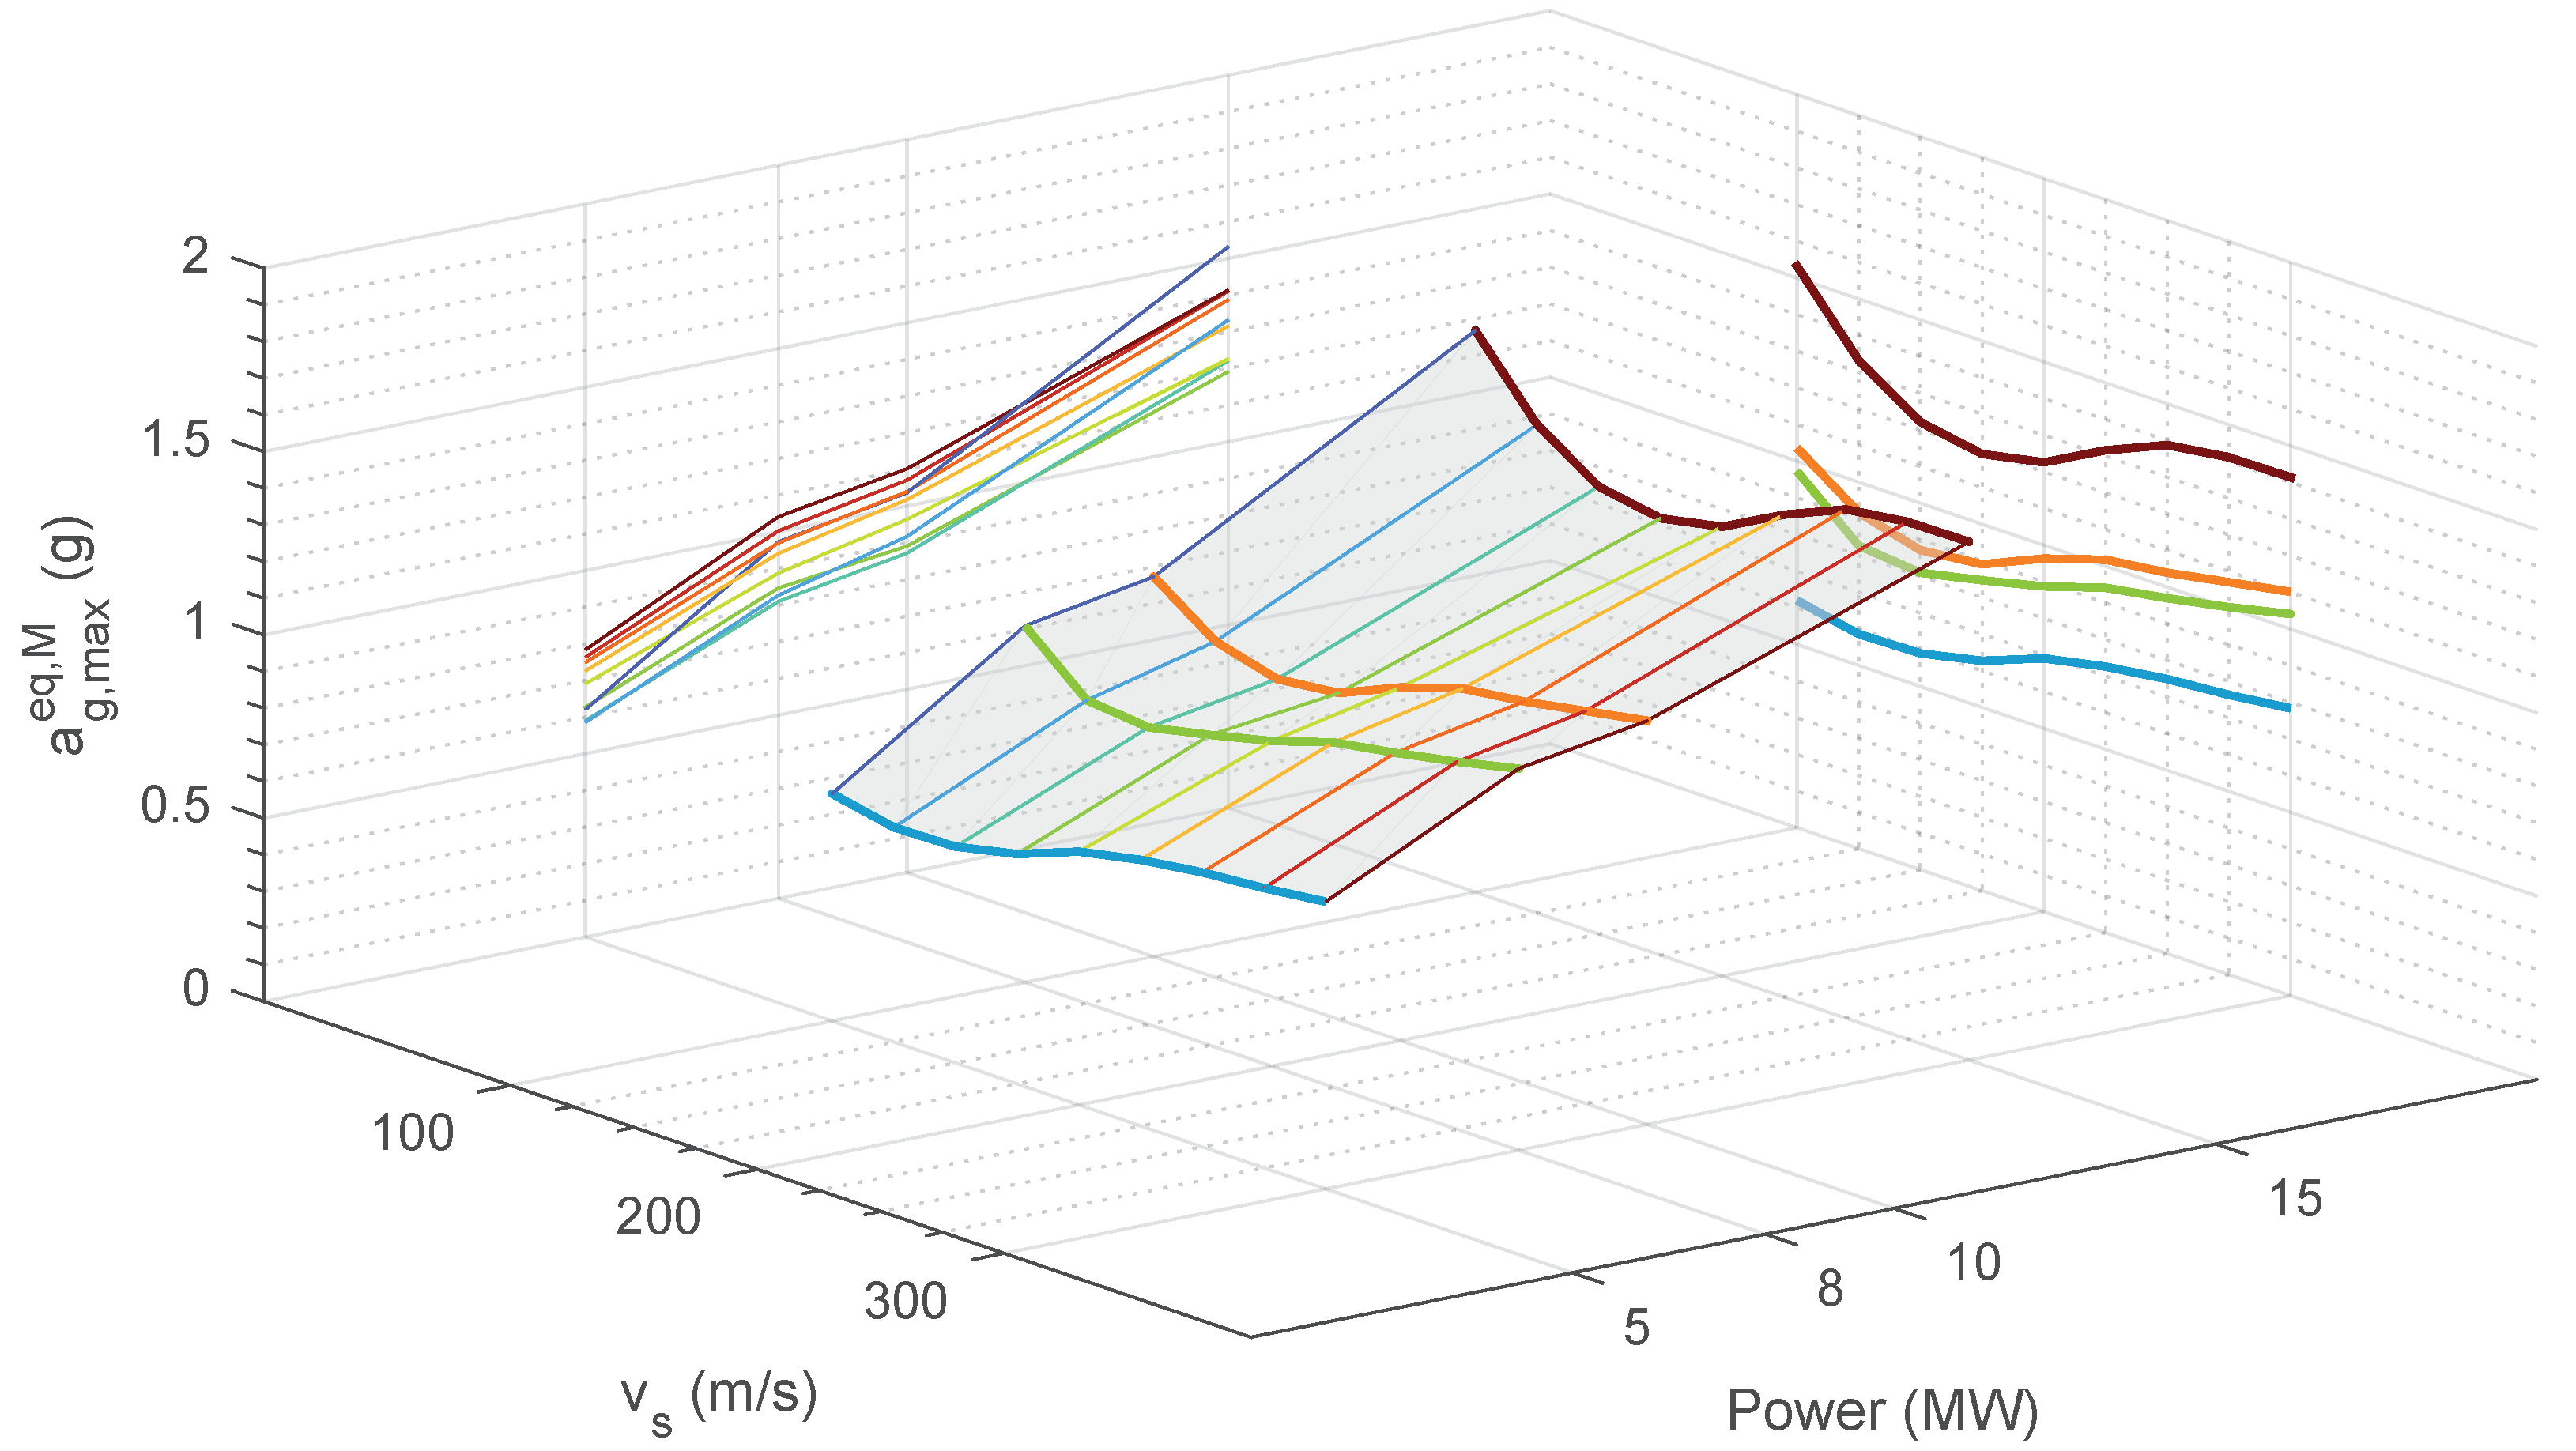
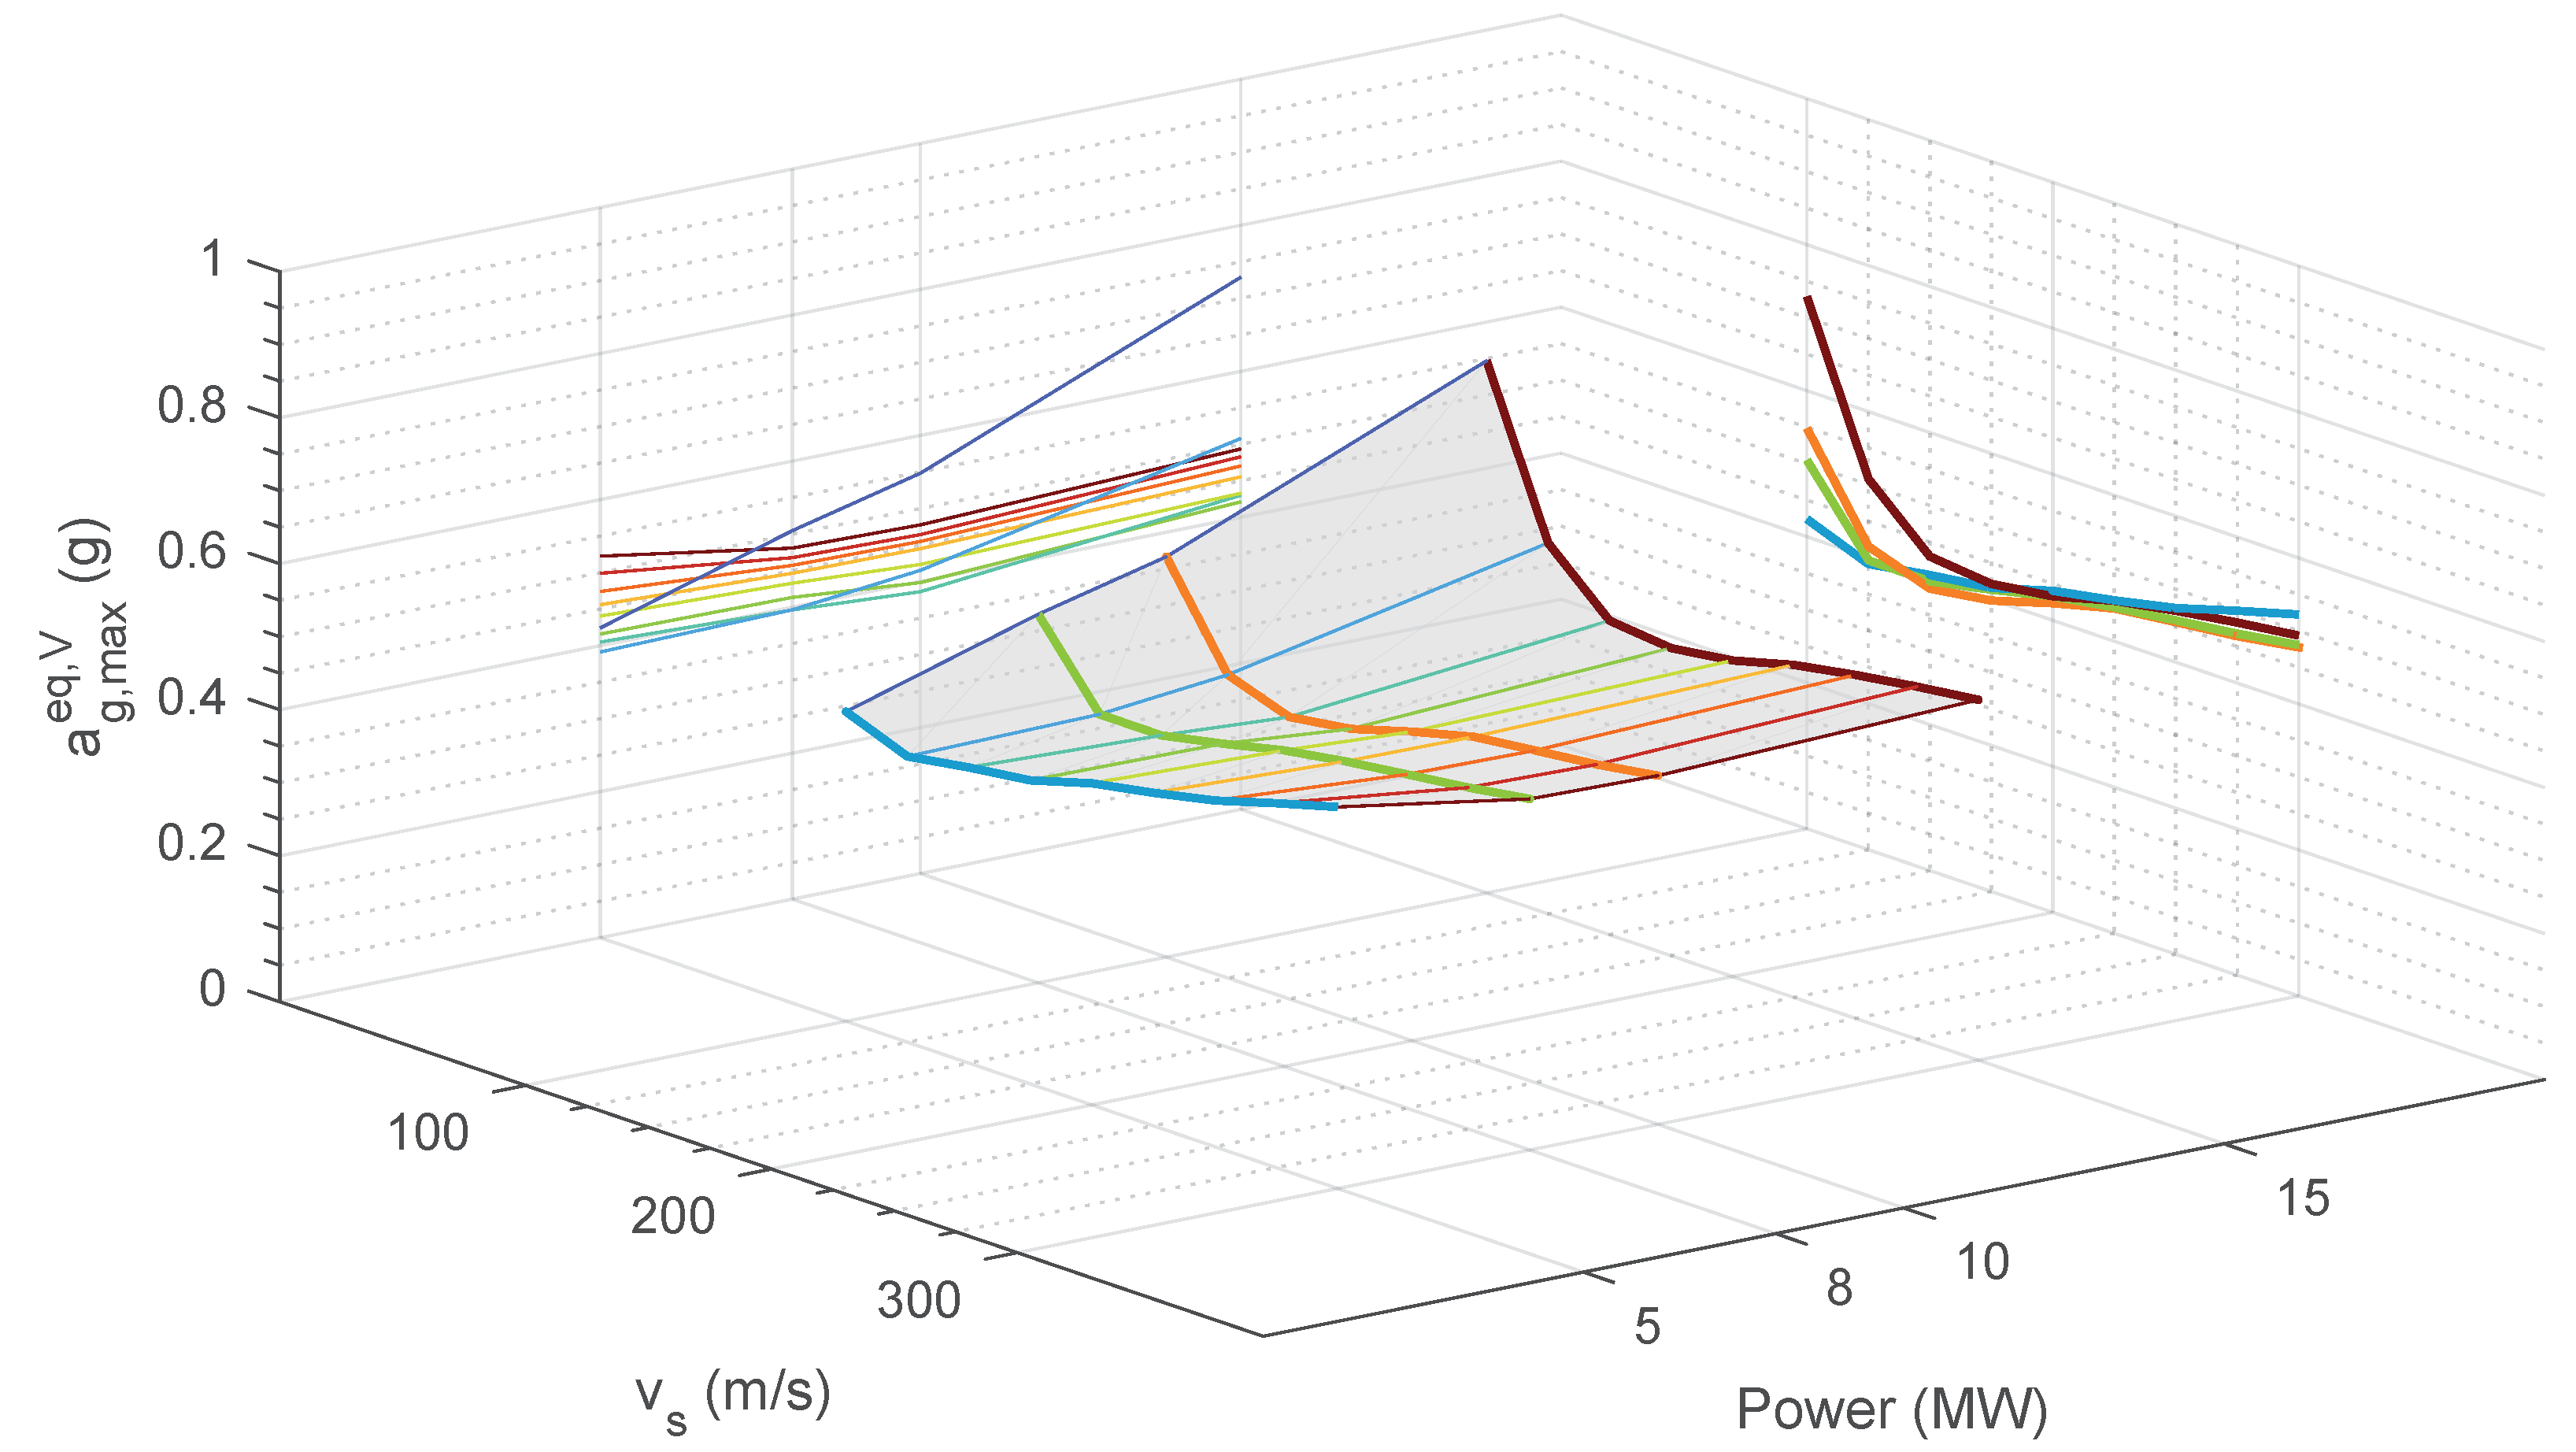
The change of trend observed in the variation of the equivalent ground maximum acceleration for the bending moment at the mudline level with the soil shear wave propagation velocity ( v s ) in Figure 7 occurs as a consequence of SSI effects associated with the kinematic interaction and the soil stiffness. In order to better explain this behaviour, 
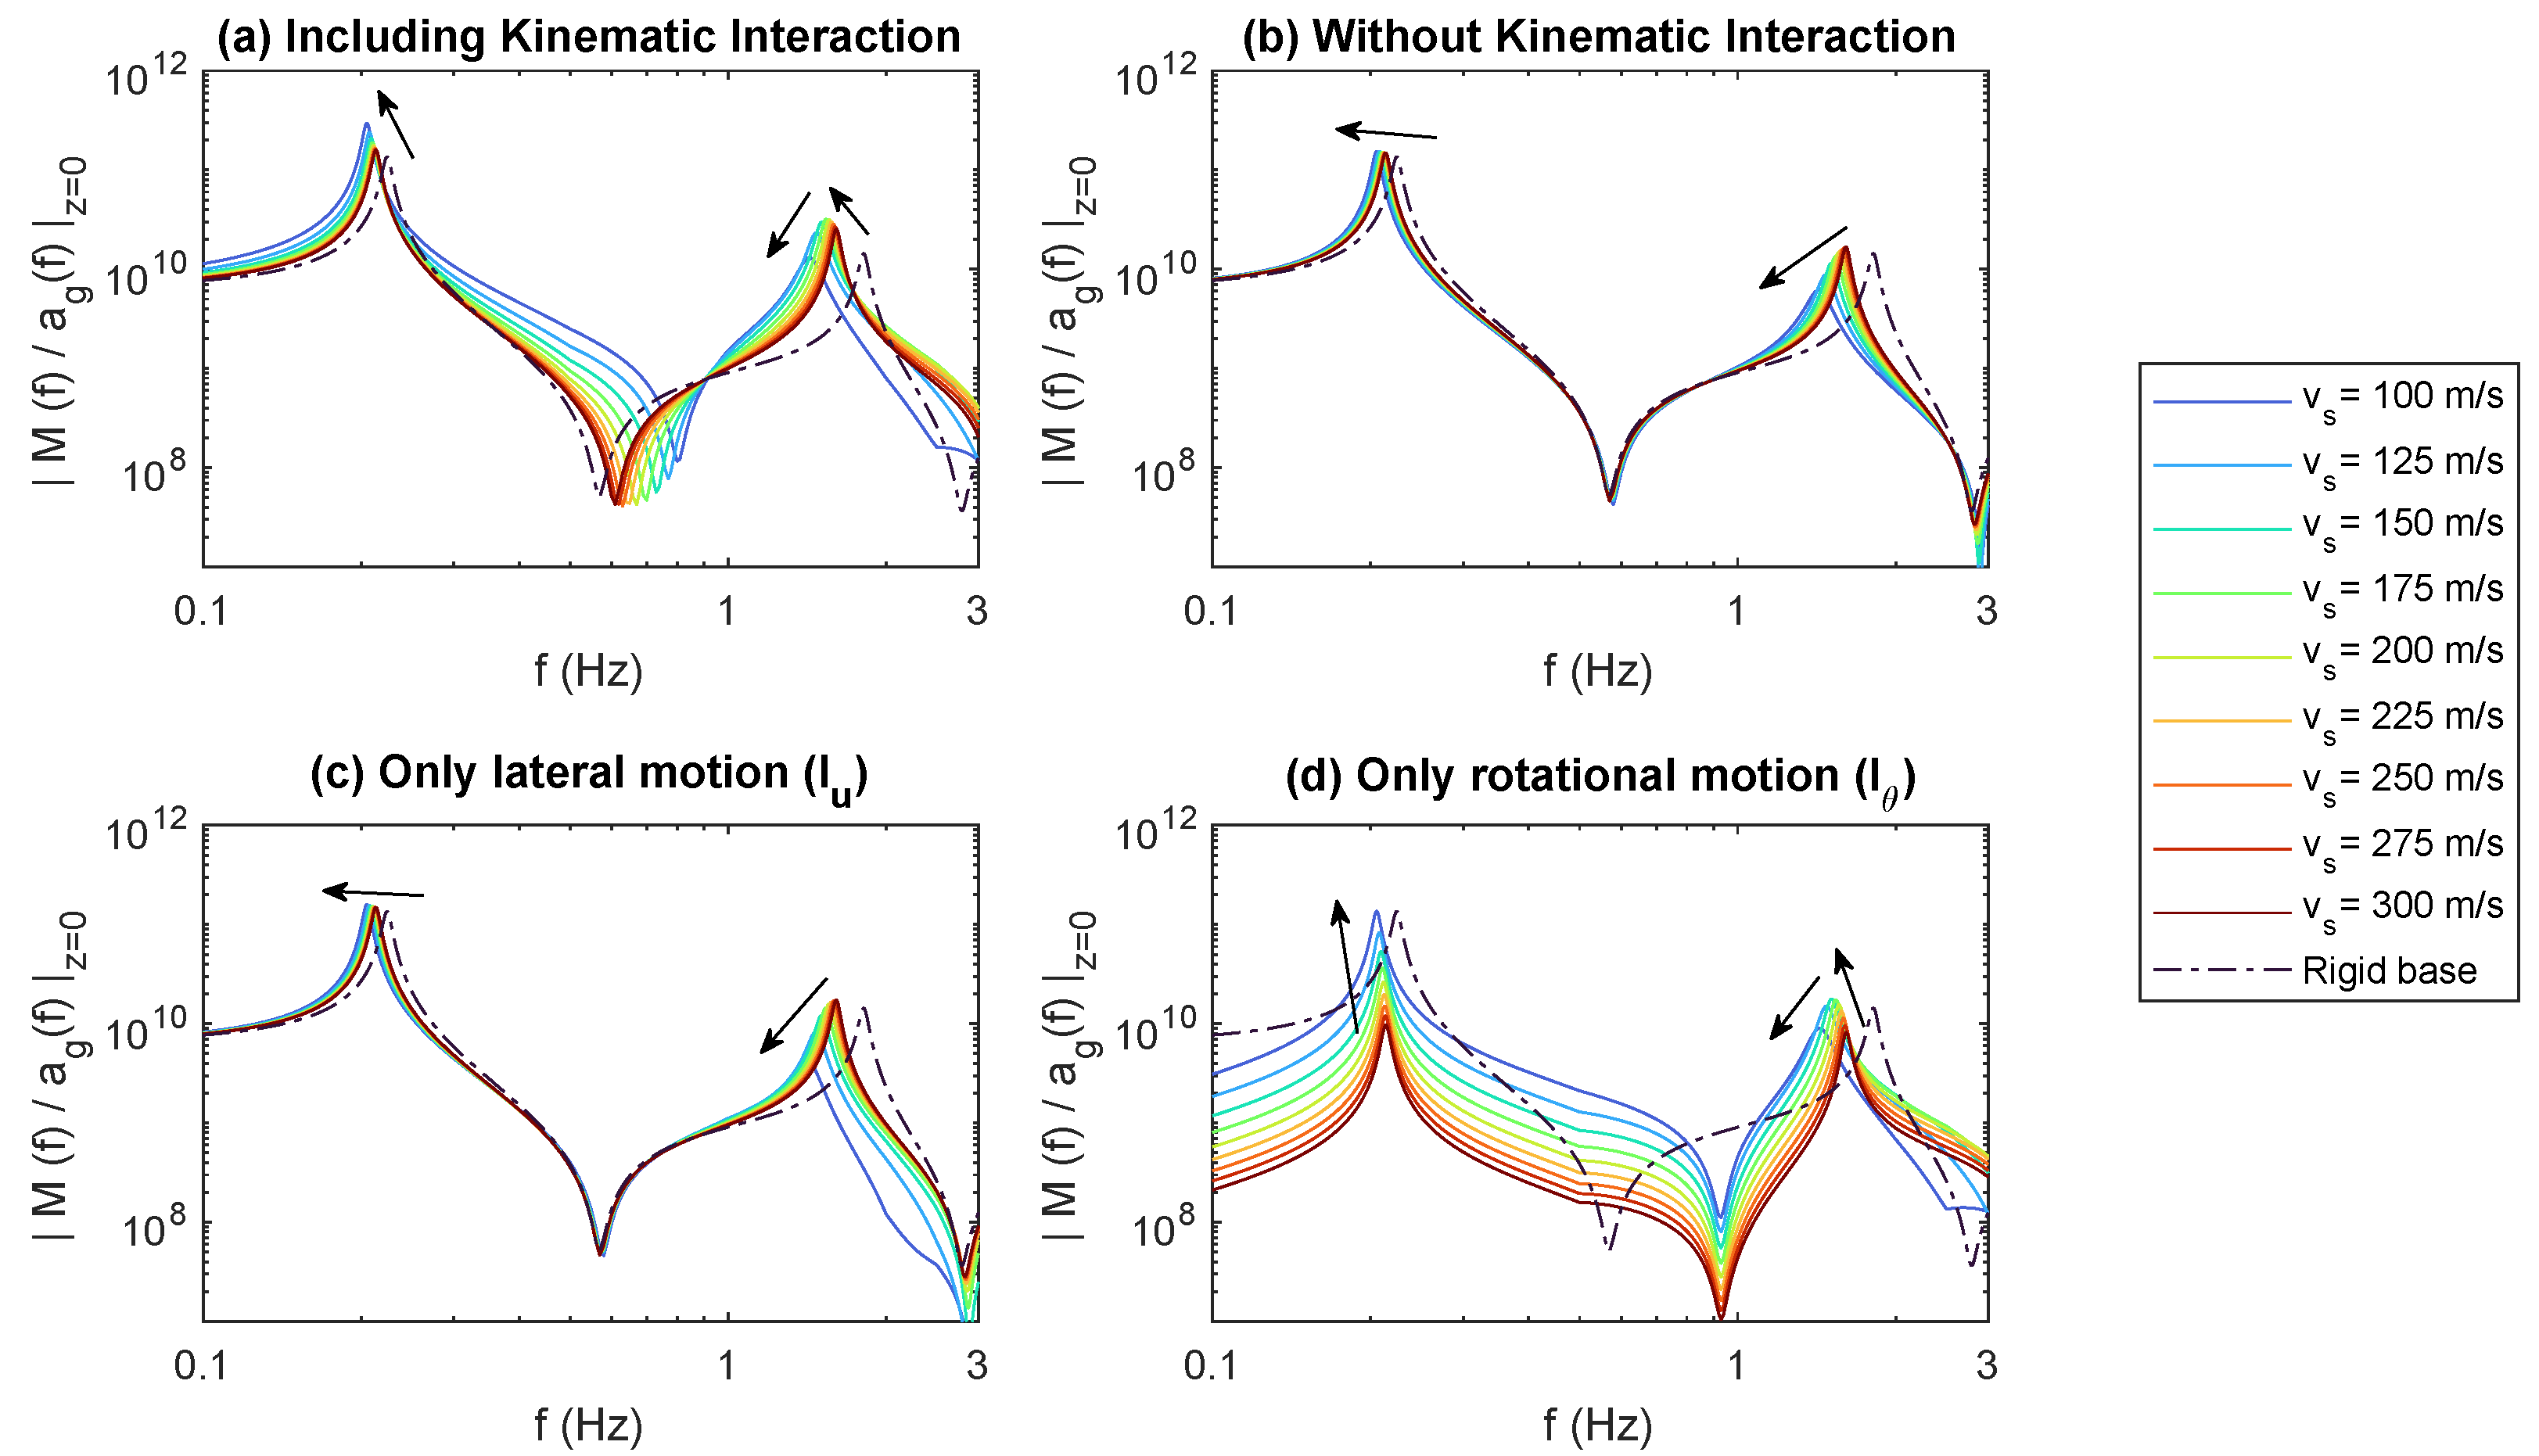
Figure 10 shows different Frequency Response Functions for the bending moment at the mudline level in the frequency range including the first two modes. In order to separate the contribution of the different variables involved in the SSI problem, four scenarios are studied. Figure 10a presents the results including kinematic interaction, i.e., the results corresponding to the SSI system. Figure 10c,d presents the contribution of each kinematic interaction term, i.e., lateral I u and rotational I θ kinematic interaction factors, to the total response. Figure 10b presents the response without including the filtering effect of the kinematic interaction, i.e., assuming I u = 1 and I θ = 0 . Results corresponding to several values of the shear wave velocity are depicted in different colors. The results obtained under the rigid base condition are also included as a common reference between graphs (black dashed line). The trend of the peak value for each mode when reducing the soil stiffness is indicated by the arrows. For illustration purposes, only the results for the 10 MW OWT system are presented.
Figure 10a shows that the peak value of the first mode increases as softer soils are considered, whereas that of the second mode shows a similar trend only within the high v s range, but then decreases with the soil softening for the lower v s values. This trend of the second mode coincides with the ones presented by the maximum temporal response, showing an important contribution of the second mode in the system seismic response.
If the kinematic interaction factors are neglected (Figure 10b), the first mode peak does not change its value with the soil stiffness, while the second mode peak uniformly decreases with the softening soil. This reveals that this trend is only produced by the changes of the soil-foundation impedance with the variation of the soil properties, being the rocking term the one that more influence has on this response. A similar trend is found if only the lateral kinematic interaction factor is considered (Figure 10c). In this case, a higher reduction of the second mode peak is found due to the filtering effect of the soil lateral motion produced by the pile stiffness.
On the contrary, analysing Figure 10d where the contribution of the rotational kinematic interaction factor is presented, it can be confirmed that the important increase in the peak value is produced by the increasing value of the pile head rotation obtained for softer soils. For the first mode, this increment is uniform. For the second mode, the rotational kinematic interaction factor and the foundation stiffness induce opposite behaviours, changing the trend of the peak depending on the shear wave velocity value. For soft soils, the influence of the foundation impedance is greater than the one of the rotational motion so the second mode peak decreases with the soil decreasing stiffness. For stiffer soils, on contrary, the influence of the rotational motion overpass the one of the foundation stiffness, so the second mode peak increases with the soil decreasing stiffness.
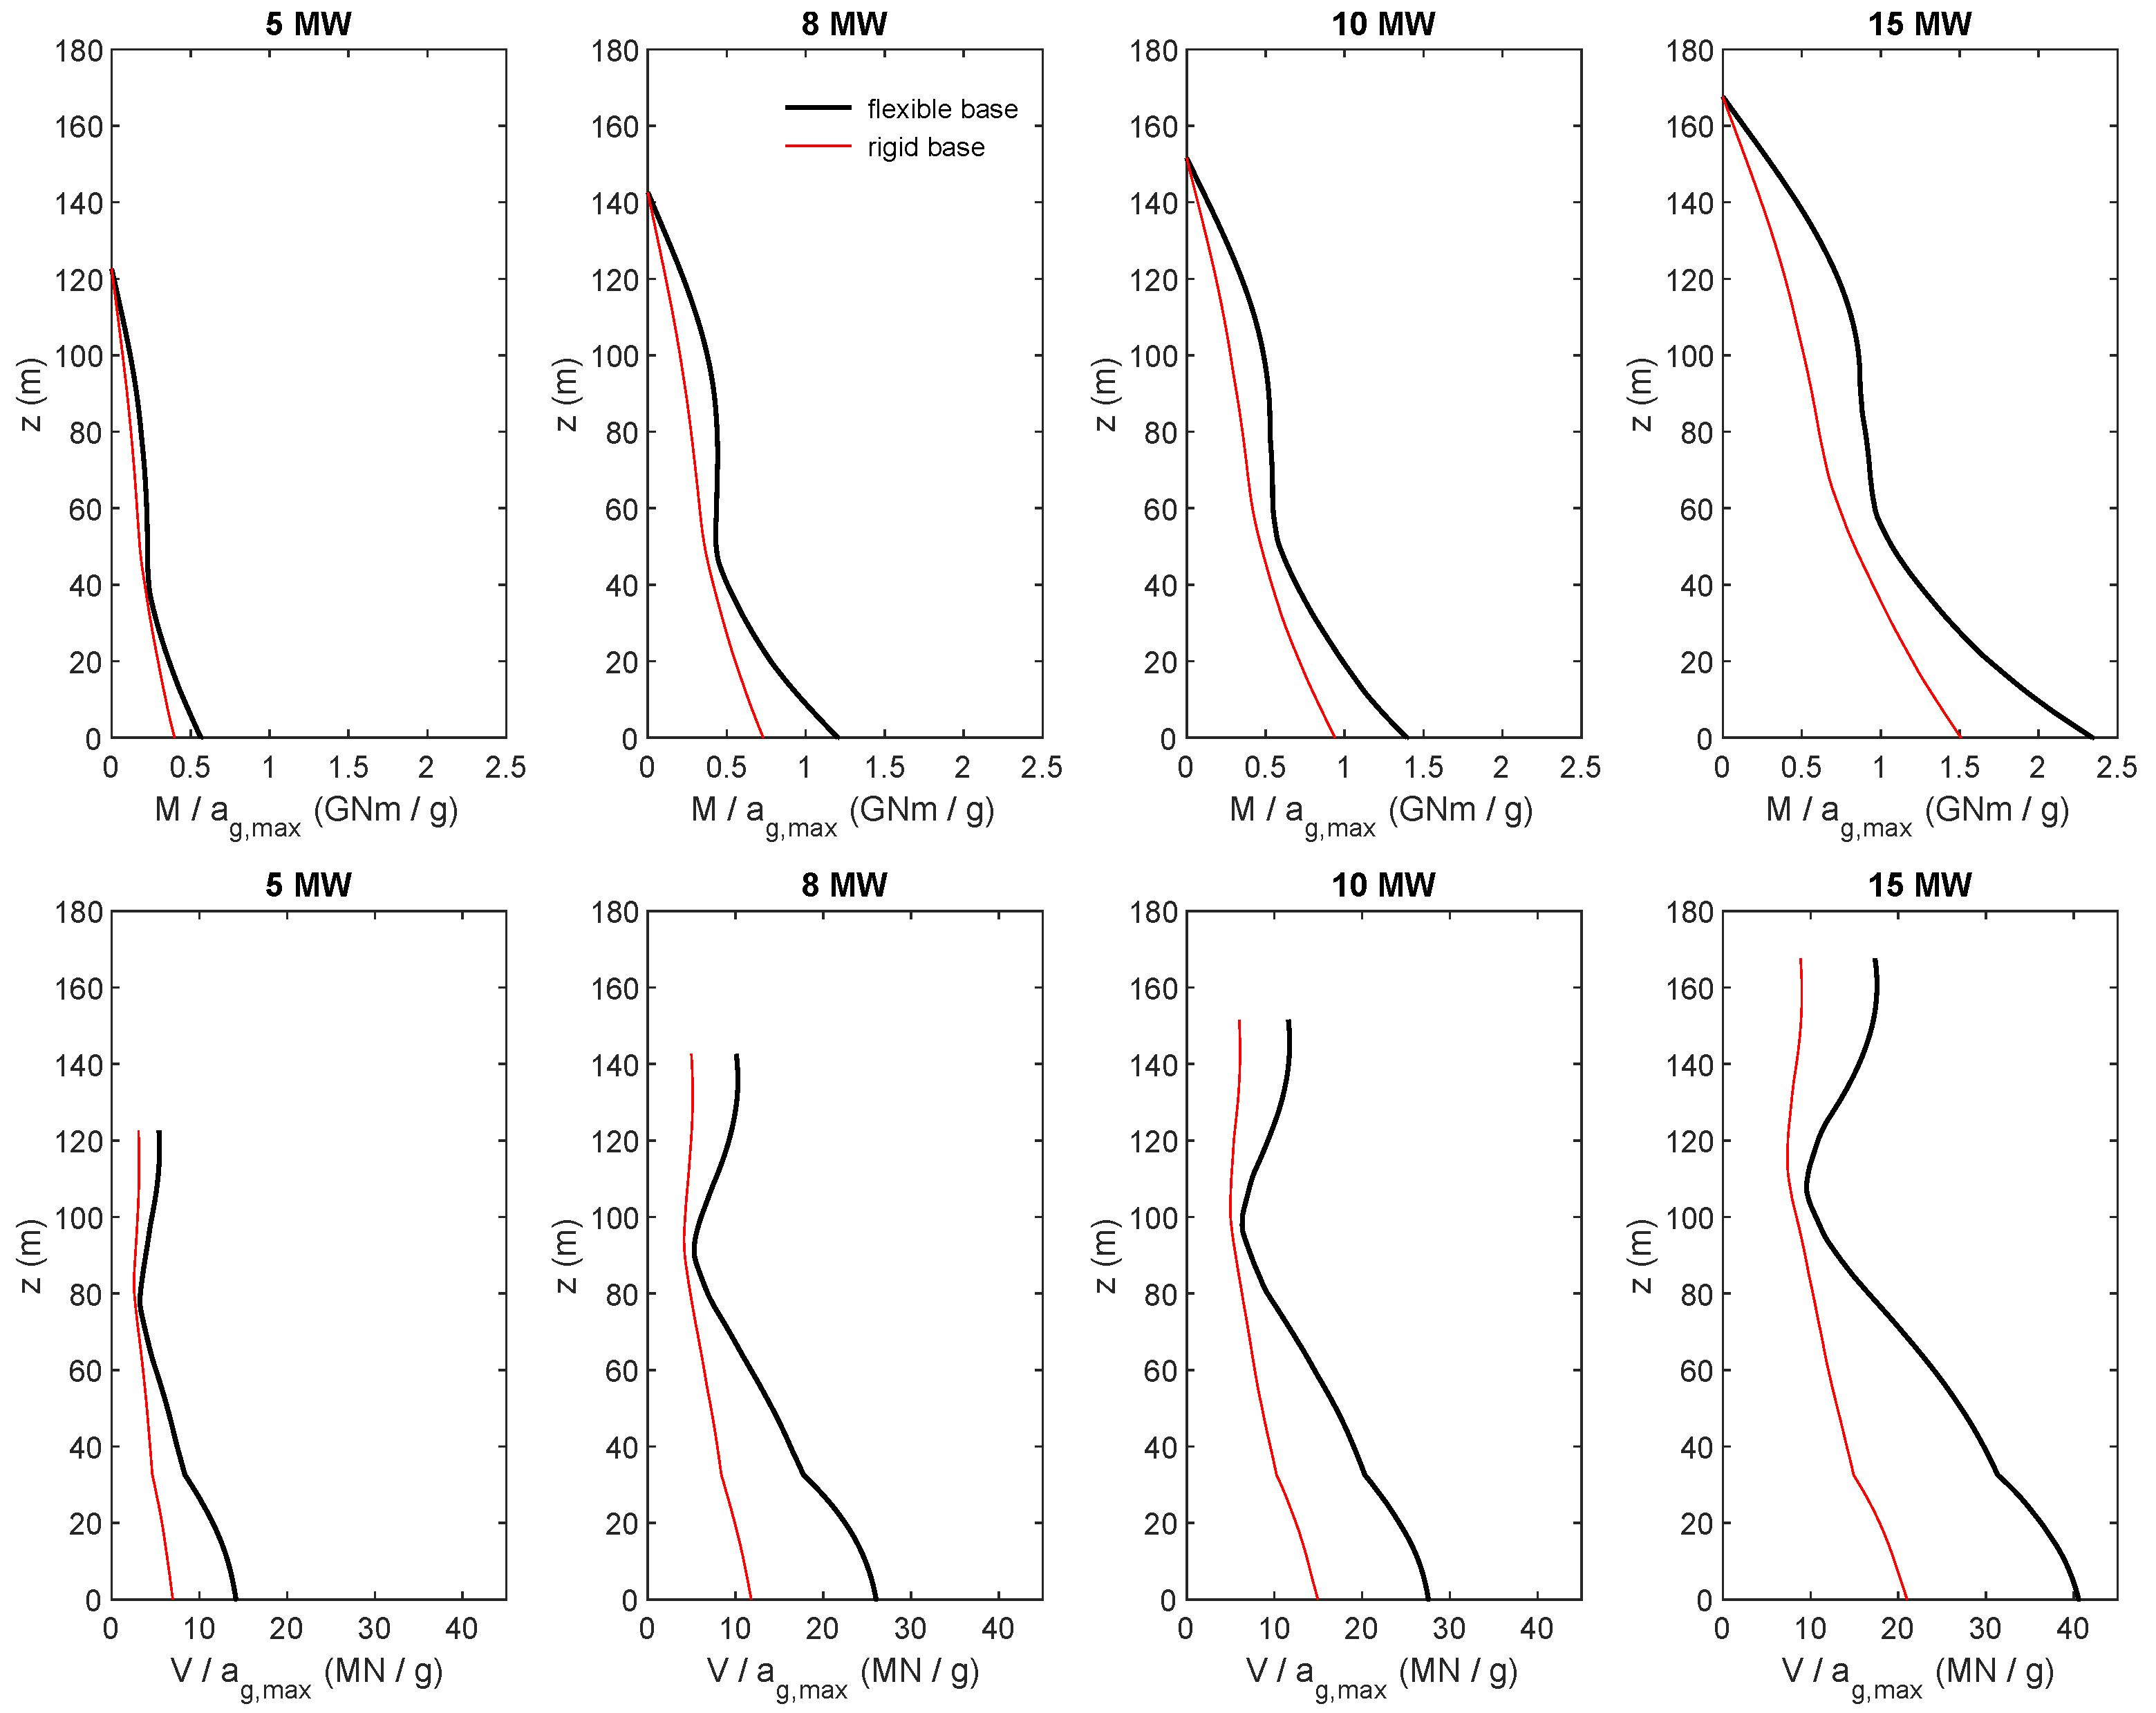
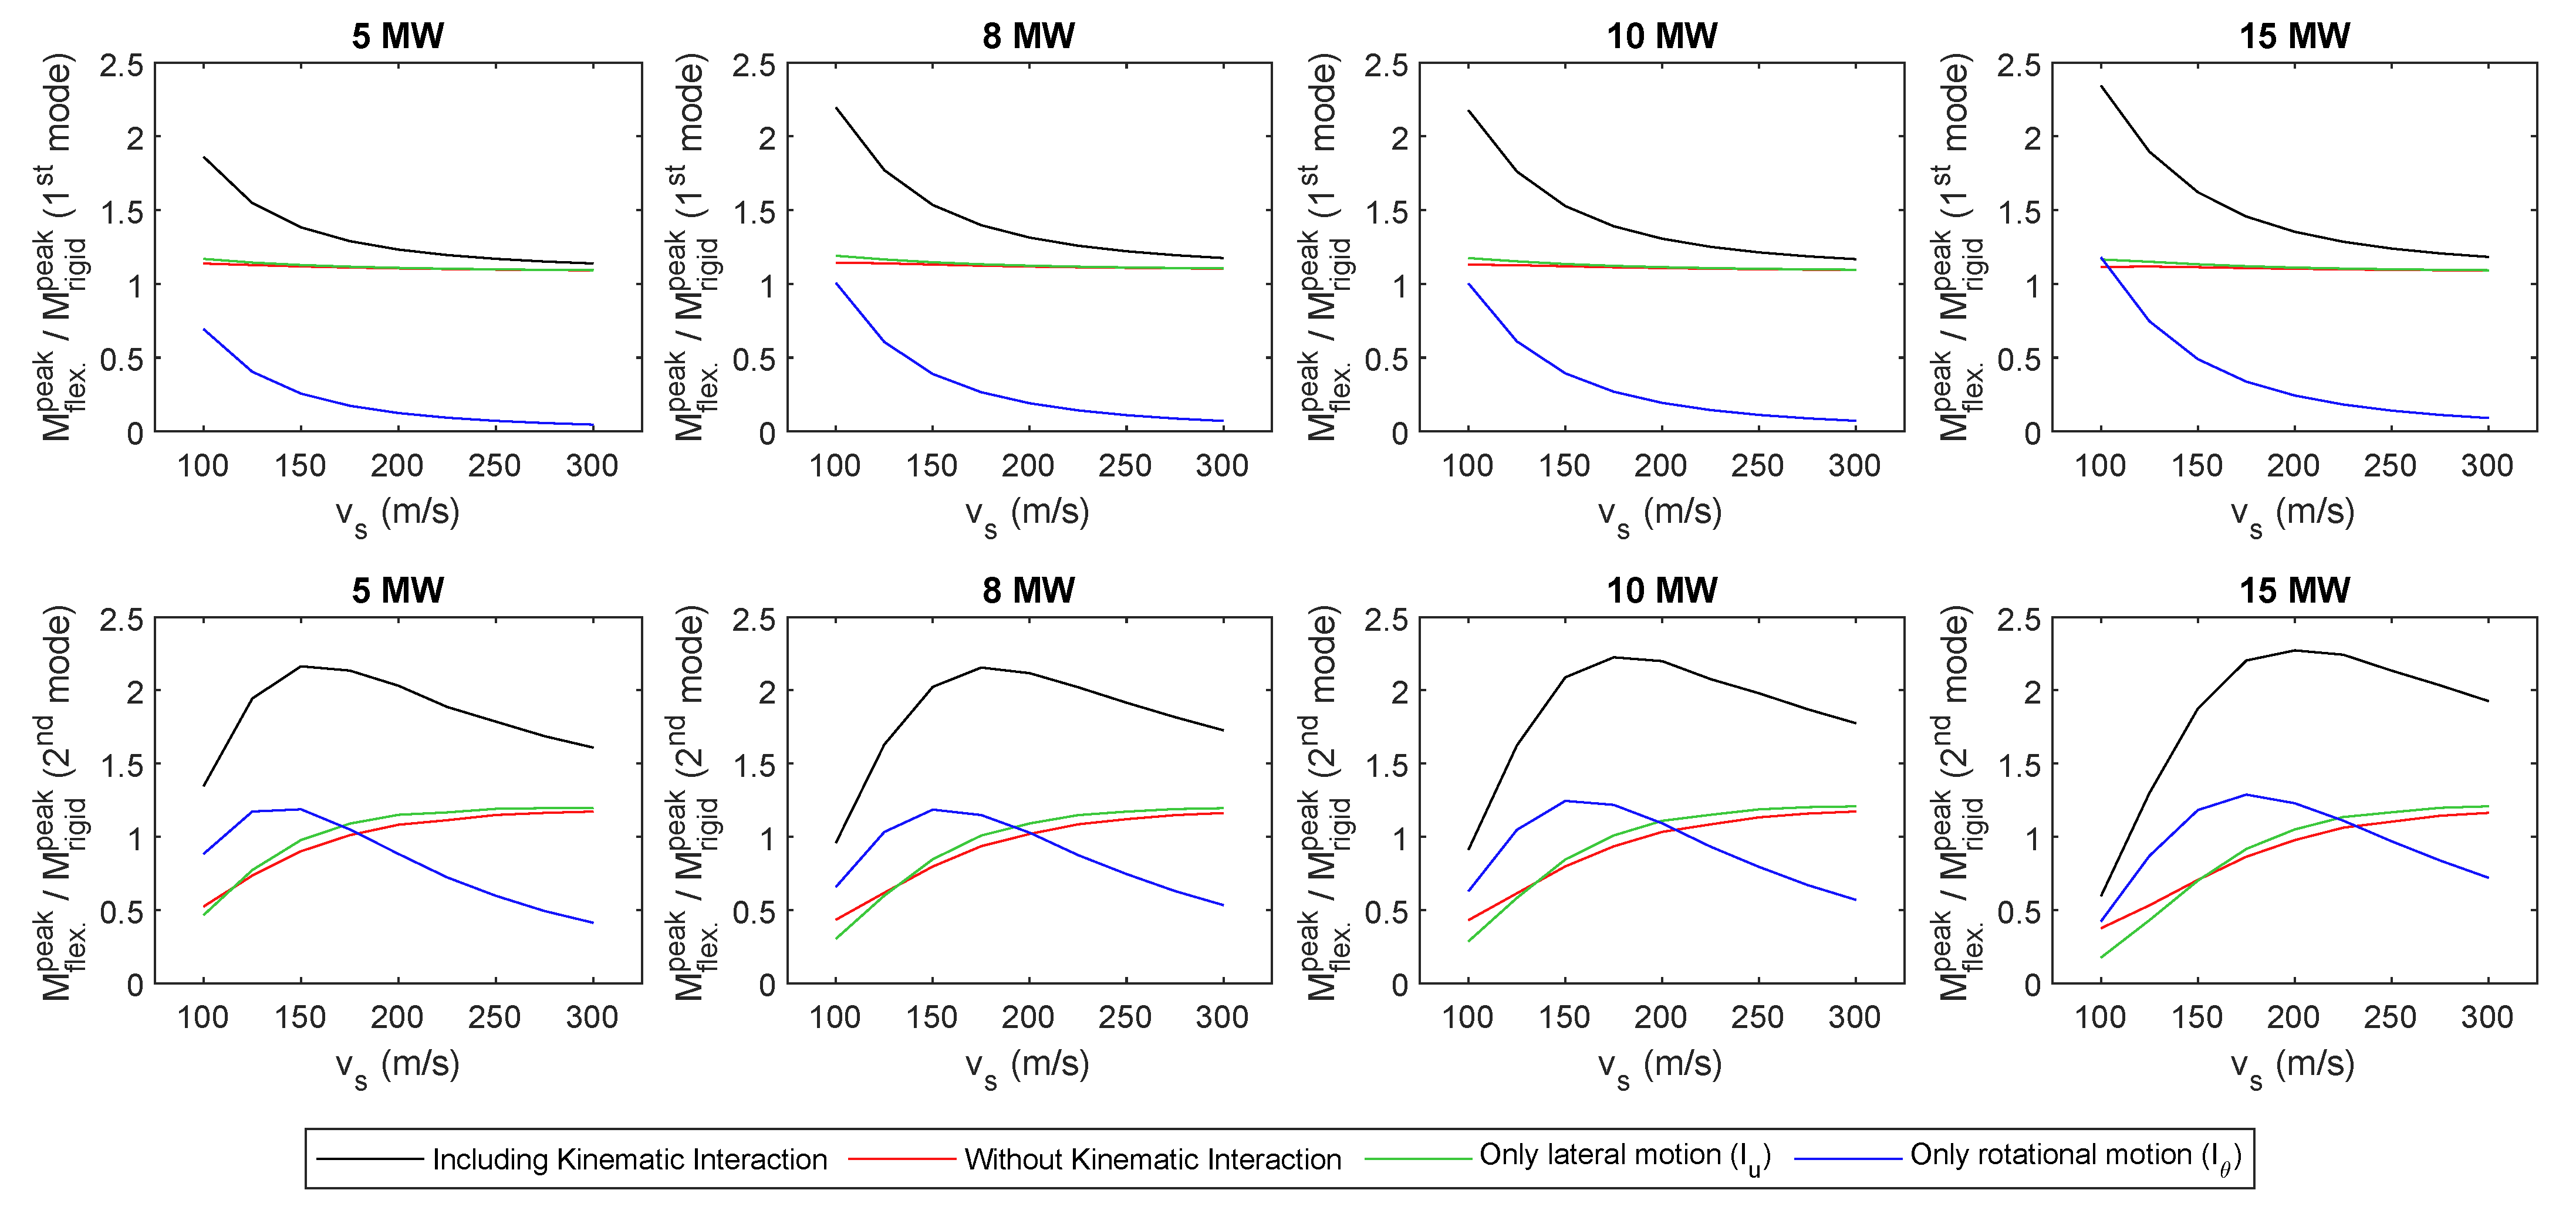
For the purpose of illustrating these effects on the seismic response of the four OWT systems analysed in this work, 
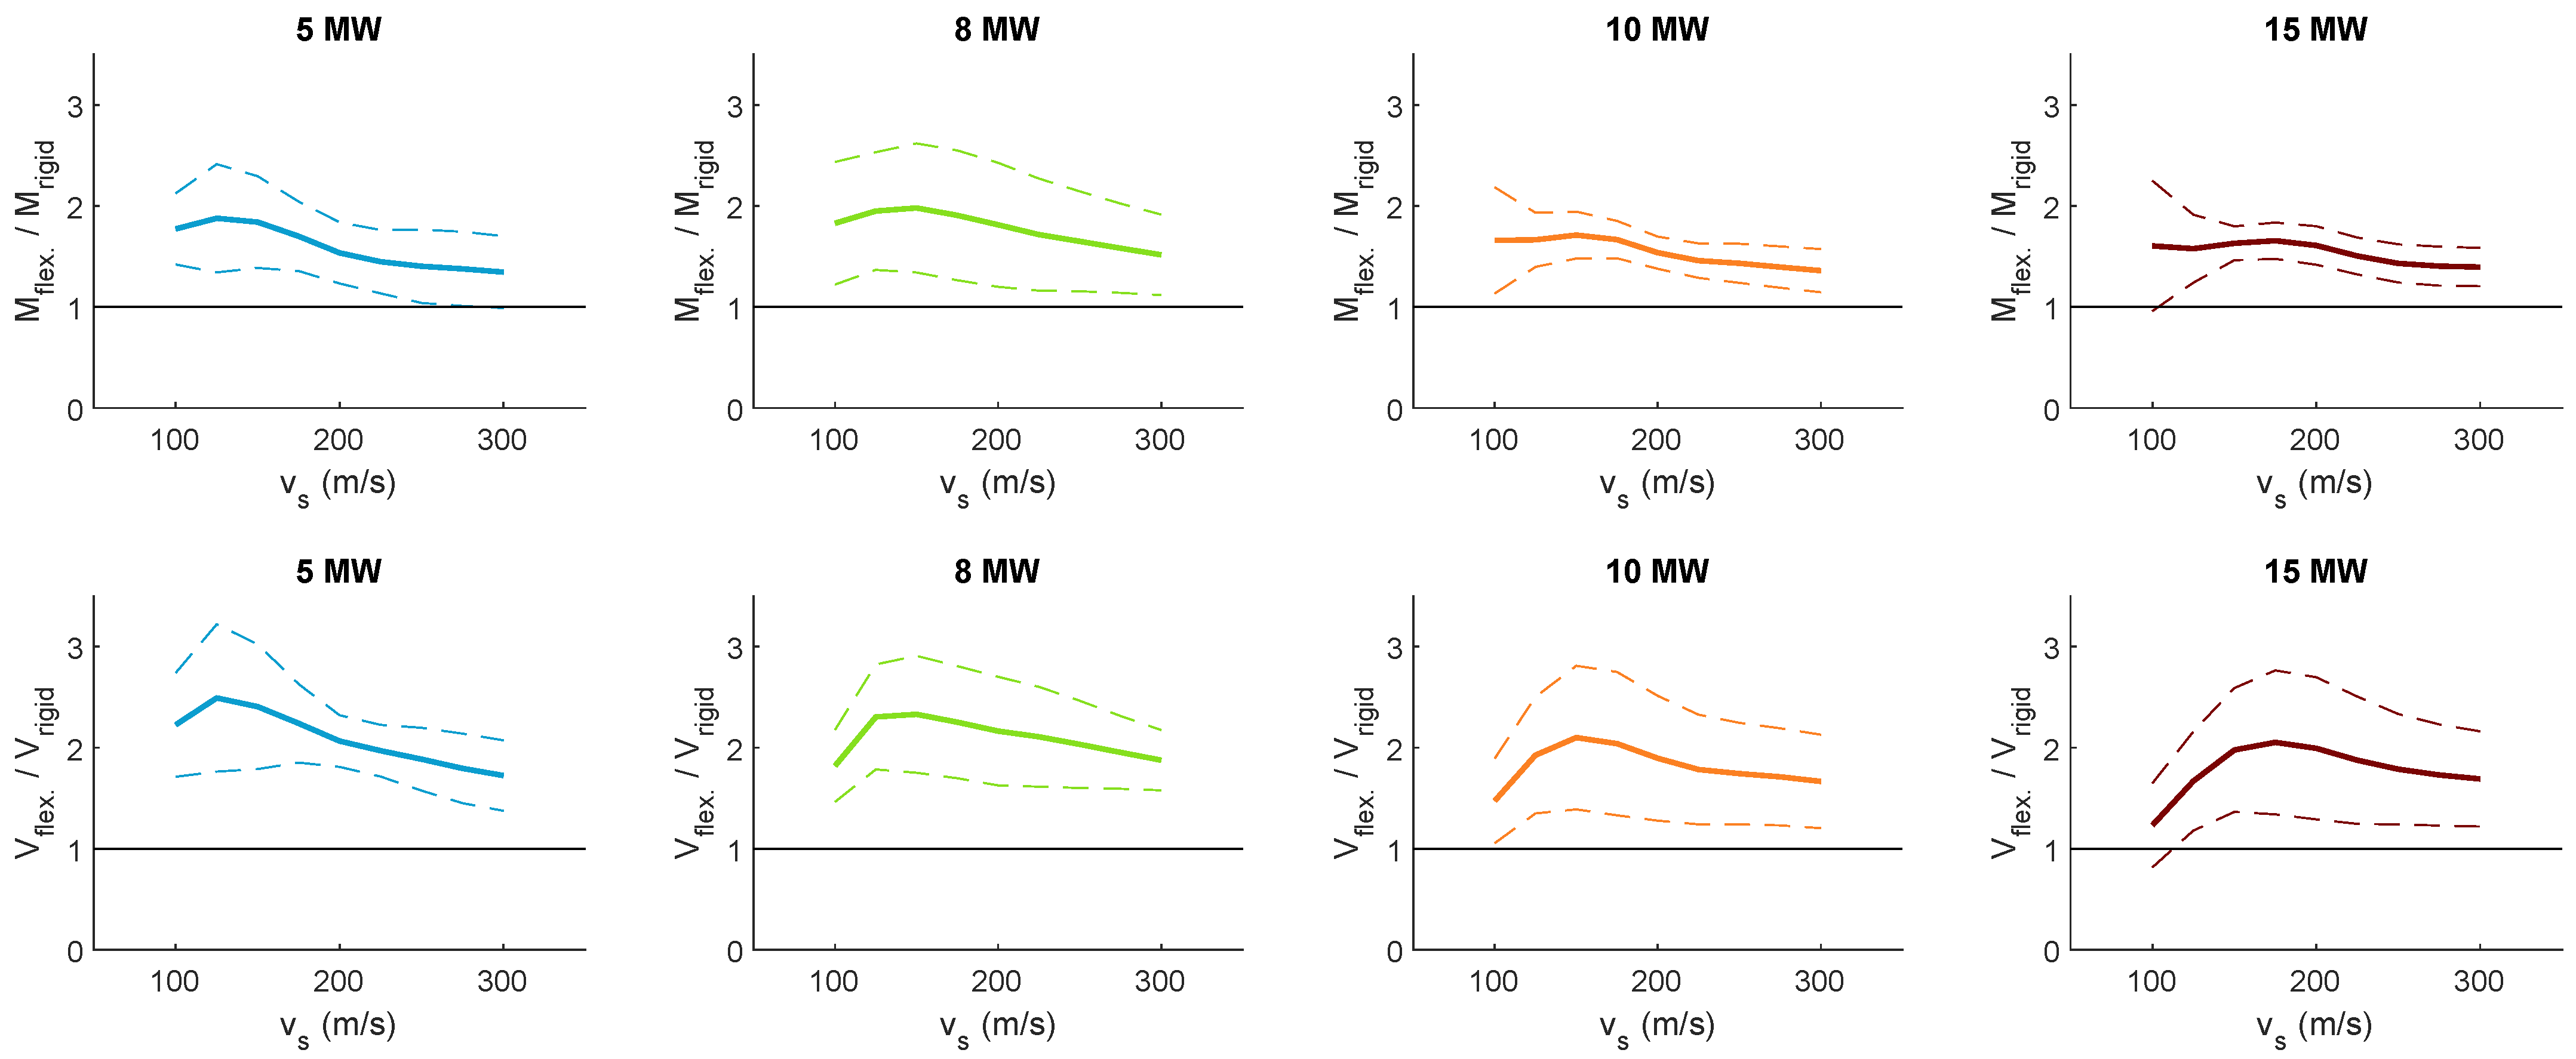
Figure 11 provides the peak values of the Frequency Response Functions for the bending moment at the mudline level corresponding to the first two modes. Results computed under flexible base assumption are normalized with those corresponding to rigid base condition in order to have a common scale and are plotted against the soil shear wave propagation velocity. In all cases, the same trend is observed.
For the first mode peak, its changes are governed by the rotational motion, lowering its value as the soil stiffness increases. At these small frequencies, the filtering effect of the lateral kinematic interaction is almost negligible.
For the second mode peak, also the rotational motion presents a high contribution to its dependence with the soil stiffness. The two aforementioned trends are clearly observed: for the softest soils, the peak bending moment is reduced as the soil stiffness decreases, while the opposite effect is found for stiffer soils. This produces a maximum value located around 150 m/s for the studied cases. The contribution of the lateral motion for this mode amplifies the reduction of the peak value for the smallest shear wave velocities. Also, for the softest media, the filtering effect of the foundation start to appear, reducing even more the response with respect to the case without kinematic interaction.
Regarding the influence of the OWT size on these effects, it should be noted that, as the size of the turbine (and, consequently, that of the monopile) grows, a larger influence of the shear wave velocity on the system seismic response is found.

6. Conclusions

This paper aims at studying the relevance of the seismic response in the design of monopiled OWT and the influence that the SSI effects and turbine size have on it. For this purpose, four reference OWTs supported on monopile foundations embedded in different soft-to-medium homogeneous sea beds are considered and excited by ten different accelerograms. Monopile sizing is carried out based on the procedure described by Arany et al. [39]. The seismic response of the OWT and supporting monopile is computed through a finite element substructuring model in the frequency domain. A previously developed continuum model [32] is used to compute the foundation behaviour, considering its interaction with the surrounding soil, in terms of impedance functions and kinematic interaction factors. The infinitely rigid base assumption is also considered in order to analyse the importance of the SSI effects.
Results are first presented in terms of envelopes of maximum seismic bending moments and shear forces, showing that the higher values are found to appear at the mudline level. As the turbine size grows, the maximum seismic internal forces also increase.
The relevance of considering SSI effects is demonstrated by studying the ratio between the maximum seismic bending moment and shear force at the mudline level under the flexible and the rigid base assumptions. The inclusion of SSI effects almost duplicates the seismic response when compared to the rigid base scenario, manifesting the importance of an adequate representation of the foundation stiffness when studying the seismic response of the OWT system.
The frequency analysis shows that the seismic response is principally governed by the first two modes of the system. The peak response of the first mode uniformly increases with the softening soil due to the increase in the foundation rotation. On the other hand, the peak response of the second mode is influenced by two opposite effects: the foundation rotation (that increases as the soil gets softer) and the foundation stiffness (that reduces the seismic load as the soil gets softer). These effects produce that the second mode peak presents a maximum value for a certain soil stiffness, reducing its value for softer and stiffer media.
Finally, the relative importance of the seismic load compared to the environmental loads used in the design stage is studied through the computation of equivalent maximum ground accelerations. These equivalent accelerations are defined as the accelerogram peak value for which seismic forces matches those computed for the most unfavourable environmental scenario considered in foundation design. Results show that, although the seismic maximum bending moments increase with the size of the OWT system, their relevance with respect to the ones produced by design loads decreases as the turbine gets bigger. The same effect is observed for the shear forces if the soil is soft enough (<150 m/s). On contrary, for stiffer soils, the relative importance of the seismic shear forces with respect to the design ones remains the same regardless the size of the system.
The obtained results confirm the need of considering the seismic load in the design of large monopile-supported offshore wind turbines when they are located in seismic prone areas. If soil-structure interaction effects are considered, strong ground motions (0.2 g) can produce internal forces that overcome the ones typically considered at the design stage.

Author Contributions

Conceptualization, G.M.Á.; methodology, G.M.Á.; software, G.M.Á. and R.Q.-R.; investigation, C.M., G.M.Á. and R.Q.-R.; writing—original draft preparation, C.M., G.M.Á. and R.Q.-R.;visualization, G.M.Á.; supervision, C.M.; project administration, C.M.; funding acquisition, C.M. and R.Q.-R. All authors have read and agreed to the published version of the manuscript.

Funding

This research was funded by Ministerio de Ciencia e Innovación and Agencia Estatal de Investigación (AEI) of Spain and FEDER through research project BIA2017-88770-R; by Consejería de Economía, Conocimiento y Empleo (Agencia Canaria de la Investigación, Innovación y Sociedad de la Información) of the Gobierno de Canarias and FEDER through research project ProID2020010025; and by Universidad de Las Palmas de Gran Canaria through research project ULPGC2018-11. Román Quevedo (FPU19/04170) is recipient of FPU research fellowship from the Ministerio de Educación, Cultura y Deporte of Spain.

Data Availability Statement

The data that support the findings of this study are available from the authors, upon reasoned request.

Conflicts of Interest

The authors declare no conflict of interest.

Abbreviations

The following abbreviations are used in this manuscript:
SSISoil-structure interaction
OWTOffshore wind turbine

References

  1. IEA. Offshore Wind Outlook 2019; IEA: Paris, France, 2019. [Google Scholar]
  2. Ghaemmaghami, A.R.; Mercan, O.; Kianoush, R. Seismic soil–structure interaction analysis of wind turbines in frequency domain. Wind Energy 2017, 20, 125–142. [Google Scholar] [CrossRef]
  3. Bhattacharya, S.; Biswal, S.; Aleem, M.; Amani, S.; Prabhakaran, A.; Prakhya, G.; Lombardi, D.; Mistry, H.K. Seismic Design of Offshore Wind Turbines: Good, Bad and Unknowns. Energies 2021, 14, 3496. [Google Scholar] [CrossRef]
  4. DNV. Guidelines for Design of Wind Turbines, 2nd ed.; Det Norske Veritas, Copenhagenand Wind Energy Department, Risø National Laboratory: Copenhagen, Denmark, 2002. [Google Scholar]
  5. DNV. Design of Offshore Wind Turbine Structures. Offshore Standard DNV-OS-J101; Det-Norske Veritas AS; 2014; Available online: https://rules.dnv.com/docs/pdf/dnvpm/codes/docs/2014-05/Os-J101.pdf (accessed on 24 September 2021).
  6. IEC. 61400-1:2005 Wind Turbines—Part 1: Design Requirements; International Electrotechnical Commission: Geneva, Switzerland, 2005. [Google Scholar]
  7. IEC. 61400-3:2009 Wind Turbines—Part 3: Design Requirements for Offshore Wind Turbines; International Electrotechnical Commission: Geneva, Switzerland, 2009. [Google Scholar]
  8. Xie, M.; Lopez-Querol, S. Numerical Simulations of the Monotonic and Cyclic Behaviour of Offshore Wind Turbine Monopile Foundations in Clayey Soils. J. Mar. Sci. Eng. 2021, 9, 1036. [Google Scholar] [CrossRef]
  9. DNV. Seismic Design of Wind Power Plants DNV-RP-0585; Det-Norske Veritas AS; 2021; Available online: https://www.dnv.com/energy/standards-guidelines/dnv-rp-0585-seismic-design-of-wind-power-plants.html (accessed on 24 September 2021).
  10. Bazeos, N.; Hatzigeorgiou, G.D.; Hondros, I.D.; Karamaneas, H.; Karabalis, D.L.; Beskos, D.E. Static, seismic and stability analyses of a prototype wind turbine steel tower. Eng. Struct. 2002, 24, 1015–1025. [Google Scholar] [CrossRef]
  11. Lavassas, I.; Nikolaidis, G.; Zervas, P.; Efthimiou, E.; Doudoumis, I.N.; Baniotopoulos, C.C. Analysis and design of the prototype of a steel 1-MW wind turbine tower. Eng. Struct. 2003, 25, 1097–1106. [Google Scholar] [CrossRef]
  12. Wang, L.; Zhang, Y. Influence of Simplified Models on Seismic Response Analysis of Wind Turbine Towers. Appl. Mech. Mater. 2011, 94–96, 369–374. [Google Scholar] [CrossRef]
  13. Kjørlaug, R.A.; Kaynia, A.M. Vertical earthquake response of megawatt-sized wind turbine with soil-structure interaction effects. Earthq. Eng. Struct. Dyn. 2015, 44, 2341–2358. [Google Scholar] [CrossRef]
  14. De Risi, R.; Bhattacharya, S.; Goda, K. Seismic performance assessment of monopile-supported offshore wind turbines using unscaled natural earthquake records. Soil Dyn. Earthq. Eng. 2018, 109, 154–172. [Google Scholar] [CrossRef]
  15. Ali, A.; De Risi, R.; Sextos, A.; Goda, K.; Chang, Z. Seismic vulnerability of offshore wind turbines to pulse and non-pulse records. Earthq. Eng. Struct. Dyn. 2020, 49, 24–50. [Google Scholar] [CrossRef]
  16. Kim, D.H.; Lee, S.G.; Lee, I.K. Seismic fragility analysis of 5 MW offshore wind turbine. Renew. Energy 2014, 65, 250–256. [Google Scholar] [CrossRef]
  17. Mardfekri, M.; Gardoni, P. Multi-hazard reliability assessment of offshore wind turbines. Wind Energy 2015, 18, 1433–1450. [Google Scholar] [CrossRef] [Green Version]
  18. Asareh, M.A.; Schonberg, W.; Volz, J. Effects of seismic and aerodynamic load interaction on structural dynamic response of multi-megawatt utility scale horizontal axis wind turbines. Renew. Energy 2016, 86, 49–58. [Google Scholar] [CrossRef]
  19. Yang, Y.; Bashir, M.; Li, C.; Wang, J. Analysis of seismic behaviour of an offshore wind turbine with a flexible foundation. Ocean Eng. 2019, 178, 215–228. [Google Scholar] [CrossRef]
  20. Patra, S.K.; Haldar, S. Seismic response of monopile supported offshore wind turbine in liquefiable soil. Structures 2021, 31, 248–265. [Google Scholar] [CrossRef]
  21. Mo, R.; Cao, R.; Liu, M.; Li, M.; Huang, Y. Seismic fragility analysis of monopile offshore wind turbines considering ground motion directionality. Ocean Eng. 2021, 235, 109414. [Google Scholar] [CrossRef]
  22. Yang, Y.; Bashir, M.; Li, C.; Michailides, C.; Wang, J. Mitigation of coupled wind-wave-earthquake responses of a 10 MW fixed-bottom offshore wind turbine. Renew. Energy 2020, 157, 1171–1184. [Google Scholar] [CrossRef]
  23. Yan, Y.; Li, C.; Li, Z. Buckling analysis of a 10 MW offshore wind turbine subjected to wind-wave-earthquake loadings. Ocean Eng. 2021, 236, 109452. [Google Scholar] [CrossRef]
  24. Álamo, G.M.; Aznárez, J.J.; Padrón, L.A.; Martínez-Castro, A.E.; Gallego, R.; Maeso, O. Dynamic soil-structure interaction in offshore wind turbines on monopiles in layered seabed based on real data. Ocean Eng. 2018, 156, 14–24. [Google Scholar] [CrossRef]
  25. Galvín, P.; Romero, A.; Solís, M.; Domínguez, J. Dynamic characterisation of wind turbine towers account for a monopile foundation and different soil conditions. Struct. Infrastruct. Eng. 2017, 13, 942–954. [Google Scholar] [CrossRef]
  26. Bisoi, S.; Haldar, S. Design of monopile supported offshore wind turbine in clay considering dynamic soil-structure-interaction. Soil Dyn. Earthq. Eng. 2015, 73, 103–117. [Google Scholar] [CrossRef]
  27. Damgaard, M.; Bayat, M.; Andersen, L.; Ibsen, L. Assessment of the dynamic behaviour of saturated soil subjected to cyclic loading from offshore monopile wind turbine foundations. Comput. Geotech. 2014, 61, 116–126. [Google Scholar] [CrossRef]
  28. Zaaijer, M. Foundation modelling to assess dynamic behaviour of offshore wind turbines. Appl. Ocean Res. 2006, 28, 45–57. [Google Scholar] [CrossRef]
  29. WindEurope. Offshore Wind in Europe: Key Trends and Statistics 2018; WindEurope: Brussels, Belgium, 2019. [Google Scholar]
  30. Sánchez, S.; López-Gutiérrez, J.S.; Negro, V.; Esteban, M.D. Foundations in Offshore Wind Farms: Evolution, Characteristics and Range of Use. Analysis of Main Dimensional Parameters in Monopile Foundations. J. Mar. Sci. Eng. 2019, 7, 441. [Google Scholar] [CrossRef] [Green Version]
  31. Lopez-Querol, S.; Spyridis, M.; Moreta, P.J.M.; Arias-Trujillo, J. Simplified Numerical Models to Simulate Hollow Monopile Wind Turbine Foundations. J. Mar. Sci. Eng. 2020, 8, 837. [Google Scholar] [CrossRef]
  32. Álamo, G.M.; Martínez-Castro, A.E.; Padrón, L.A.; Aznárez, J.J.; Gallego, R.; Maeso, O. Efficient numerical model for the computation of impedance functions of inclined pile groups in layered soils. Eng. Struct. 2016, 126, 379–390. [Google Scholar] [CrossRef]
  33. Chopra, A.K. Dynamics of Structures. Theory and Applications to Earthquake Engineering, 7th ed.; Pearson/Prentice Hall: Englewood Cliffs, NJ, USA, 2017. [Google Scholar]
  34. Álamo, G.M.; Bordón, J.D.R.; Aznárez, J.J. On the application of the beam model for linear dynamic analysis of pile and suction caisson foundations for offshore wind turbines. Comp. Geotech. 2021, 134, 104107. [Google Scholar] [CrossRef]
  35. Jonkman, J.; Butterfield, S.; Musial, W.; Scott, G. Definition of a 5-MW Reference Wind Turbine for Offshore System Development; Technical Report; National Renewable Energy Laboratory: Golden, CO, USA, 2009. Available online: https://www.nrel.gov/docs/fy09osti/38060.pdf (accessed on 24 September 2021).
  36. Desmond, C.; Murphy, J.; Blonk, L.; Haans, W. Description of an 8 MW reference wind turbine. J. Phys. Conf. Ser. 2016, 753, 092013. [Google Scholar] [CrossRef] [Green Version]
  37. Bak, C.; Zahle, F.; Bitsche, R.; Kim, T.; Yde, A.; Henriksen, L.C.; Nata-rajan, A.; Hansen, M.H. Description of the DTU 10 MW Reference Wind Turbine; Technical Report; DTU Wind Energy: Roskilde, Denmark, 2013. [Google Scholar]
  38. Gaertner, E.; Rinker, J.; Sethuraman, L.; Zahle, F.; Anderson, B.; Barter, G.; Abbas, N.; Meng, F.; Bortolotti, P.; Skrzypinski, W.; et al. Definition of the IEA Wind 15-Megawatt Offshore Reference Wind Turbine; Technical Report; National Renewable Energy Laboratory: Golden, CO, USA, 2020. [Google Scholar]
  39. Arany, L.; Bhattacharya, S.; Macdonald, J.; Hogan, S. Design of monopiles for offshore wind turbines in 10 steps. Soil Dyn. Earthq. Eng. 2017, 92, 126–152. [Google Scholar] [CrossRef] [Green Version]
  40. Pacific Earthquake Engineering Research Center (PEER). NGA-West2 Ground Motion Database. 2021. Available online: http://ngawest2.berkeley.edu/ (accessed on 24 September 2021).
Figure 1. Models used in this work. (a) Substructuring model for computing the superstructure response. (b) Foundation impedance problem definition. (c) Foundation kinematic interaction problem definition.
Jmse 09 01285 g001
Figure 2. Normalized pseudo-spectral accelerations (PSA) and frequency content (FFT) of the accelerograms used in this study.
Jmse 09 01285 g002
Figure 3. Mean envelopes of maximum seismic internal forces along the superstructure depending on soil properties. 10 MW. Comparison of the response obtained from the flexible and rigid base assumptions.
Jmse 09 01285 g003
Figure 4. Mean envelopes of maximum seismic internal forces along the superstructure depending on turbine size. v s = 200 m/s. Comparison of the response obtained from the flexible and rigid base assumptions.
Jmse 09 01285 g004
Figure 5. Ratio between the maximum seismic bending moment and shear force at mudline level under the flexible and rigid base assumption. Mean value (solid line) and dispersion (dashed lines) of the results corresponding to different accelerograms.
Jmse 09 01285 g005
Figure 6. Equivalent ground maximum acceleration for the bending moment and shear force at the mudline level. Mean value (solid line) and dispersion (dashed lines) of the results corresponding to different accelerograms. Results including SSI effects (color) and under rigid base (black).
Jmse 09 01285 g006
Figure 7. Equivalent ground maximum acceleration for the bending moment at the mudline level. Mean value of the results corresponding to different accelerograms. Influence of soil stiffness and turbine power.
Jmse 09 01285 g007
Figure 8. Equivalent ground maximum acceleration for the shear forces at the mudline level. Mean value of the results corresponding to different accelerograms. Influence of soil stiffness and turbine power.
Jmse 09 01285 g008
Figure 9. Comparison of the seismic response obtained from different accelerograms. (a) Envelopes of maximum seismic bending moments along the superstructure. (b) Frequency Response Function of the bending moment at mudline level (solid line) and Fourier Transform of the considered accelerograms (dashed lines). Case: 10 MW, v s = 200 m/s.
Jmse 09 01285 g009
Figure 10. Frequency Response Functions for the bending moment at the mudline level. Analysis of the influence of the kinematic interaction and the soil stiffness. Case: 10 MW.
Jmse 09 01285 g010
Figure 11. Peak values of the Frequency Response Functions for the bending moment at the mudline level corresponding to the first two modes. Analysis of the influence of the kinematic interaction and the soil stiffness.
Jmse 09 01285 g011
Table 1. Definition of the set of OWTs used in the present study.
OWT5 MW [35]8 MW [36]10 MW [37]15 MW [38]
Rotor-Nacelle-Assembly mass (t)3504806741017
Tower height (m)90110119135
Rotor diameter (m)126164 178.3 240
Rated wind speed (m/s) 11.4 12.5 11.4 10.59
Cut-out wind speed (m/s)25252525
Rotor operational speed range (rpm)6.9–12.16.3–10.56–9.65–7.56
Tower top diameter (m) 3.87 5 5.5 6.5
Tower bottom diameter (m)6 7.7 8.3 10
Tower top thickness (m) 0.019 0.022 0.020 0.024
Tower bottom thickness (m) 0.027 0.036 0.038 0.041
Density of material (kg/m3)7850785078507850
Table 2. Metocean data [39].
ParameterValue
Wind speed Weibull distribution shape parameter 1.8
Wind speed Weibull distribution scale parameter8 m/s
Density of air 1.225 kg/m3
Maximum water depth (50-year high water level)25 m
Significant wave height with 1-year return period 5.3 m
Maximum wave height (1-year)10 m
Significant wave height with 50-year return period 6.6 m
Maximum wave height (50-year) 12.4 m
Density of sea water1030 kg/m3
Table 3. Definition of the set of monopiles supporting each of the OWTs used in the present study.
OWT5 MW8 MW10 MW15 MW
Pile diameter (m) 6.04 7.70 8.30 10.00
Pile thickness (m) 0.067 0.084 0.090 0.107
Pile length over mudline (m) 32.6 32.6 32.6 32.6
Pile embebbed length (m) 49.7 60.1 63.8 73.8
Table 4. Natural frequencies of the tower and superstructure obtained from the foundation design.
ModeSystem5 MW8 MW10 MW15 MW
1stTower (rigid base)0.283 Hz0.289 Hz0.251 Hz0.233 Hz
Superstructure (rigid base)0.237 Hz0.249 Hz0.220 Hz0.209 Hz
Superstructure (with SSI)0.224 Hz0.235 Hz0.208 Hz0.198 Hz
2ndTower (rigid base)2.50 Hz2.36 Hz2.22 Hz2.09 Hz
Superstructure (rigid base)1.86 Hz1.80 Hz1.73 Hz1.71 Hz
Superstructure (with SSI)1.46 Hz1.44 Hz1.40 Hz1.40 Hz
Table 5. Shear forces and bending moments obtained from the foundation design.
OWT5 MW8 MW10 MW15 MW
F E 1 (MN) 2.91 4.95 5.59 8.66
M E 1 (MNm) 16.9 47.9 126.5 367.2
F max (MN) 5.49 9.03 10.18 15.34
M max (MNm) 301.6 798.9 1067.3 2268.2
Table 6. Information about the accelerograms used in this study. Source: [40].
RSNDir. (°)Event NameYearStation NameVs,30 (m/s)ag,max (g)
18690Imperial Valley-061979Niland Fire Station2120.11
266102Victoria Mexico1980Chihuahua2420.15
7290Superstition Hills-021987Imperial Valley W.L.A.1790.21
117660Kocaeli Turkey1999Yarimca2970.23
149859Chi-Chi Taiwan1999TCU0592730.16
179290Hector Mine1999Indio-Riverside C.F.G.2820.12
271547Chi-Chi Taiwan-041999CHY0471700.13
368311Taiwan SMART1(45)1986SMART1 O112950.13
39658Tottori Japan2000TTR0081390.32
56667Iwate Japan2008MYG0071670.13
Publisher’s Note: MDPI stays neutral with regard to jurisdictional claims in published maps and institutional affiliations.

