Article

Long-Term Shoreline Evolution Using DSAS Technique: A Case Study of Quang Nam Province, Vietnam

1
Faculty of Civil Engineering, Thuyloi University, 175 Tay Son, Dong Da, Hanoi 10000, Vietnam
2
International Center of Tropical Agriculture, Pham Van Dong, Hanoi 10000, Vietnam
3
Department of Civil Engineering, Tohoku University, Sendai 980-8579, Japan
*
Author to whom correspondence should be addressed.
J. Mar. Sci. Eng. 2021, 9(10), 1124; https://doi.org/10.3390/jmse9101124
Submission received: 27 August 2021 / Revised: 9 October 2021 / Accepted: 12 October 2021 / Published: 14 October 2021
(This article belongs to the Section Coastal Engineering)

Abstract

:
A Quang Nam coastline, located in the central of Vietnam, has been strongly affected by severe erosion and accretion due to climate change and human activities. Thus, understanding the causes and mechanisms of coastal morphology changes is essential to offer optimal coastal management and protection solutions. In this research, the Digital Shoreline Analysis System (DSAS) technique developed by the United States Geological Survey was adopted to calculate rate-of-change statistics from multiple historical coastline positions of Quang Nam province extracted from satellite images, i.e., Landsat and Sentinel images from 1990 to 2019. The coastal dynamic was digitized, visualized, and compared by two statistical parameters provided in DSAS, namely End Point Rate (EPR) and Linear Regression Rate (LRR). The final results reveal that the Quang Nam coast experienced remarkable phenomena of erosion and accumulation over the past three decades. The total number of erosional and accretional transects obtained from the EPR results are 401 and 414, with annual change rates of −1.7 and 0.77 m/year, respectively. The LRR parameter was also considered and illustrated a significant correlation with the EPR, as the obtained R2 value of 0.96. The lowest value of EPR over the period 1990–2019 is −42.4 m/year, highlighting the most significant erosion at the north of Cua Dai estuary, whereas coastline advance is recorded in the south segment. As a result, this study’s outcomes provide helpful information for better and sustainable coastal management in Quang Nam province of Vietnam.

1. Introduction

Approximately 60 percent of the world’s population inhabits along the coast and estuaries, and their livelihoods highly depend on the natural resources and environment [1]. Thus, coastal regions play a crucial part in economic development, i.e., the transportation and tourism industry [2]. Unfortunately, spatio-temporal variation of the coastline is highly dynamic and has become a big concern due to threats of erosion and accretion [3]. Addo et al. [4] reported that coastal erosion occurs at over 80% of the world’s beaches. These eroding mechanisms are not only the result of natural processes (e.g., winds, waves, currents, and tides) but also human activities [5].
Several studies on shoreline change have been conducted worldwide, such as Addo et al. [4], Purkis [6], Raj et al. [2], and Dereli and Tercan [3]. In order to allow quantification of any changes along the coastal areas, detecting shorelines, which are defined as the intersection between the ocean and Earth’s surface, is an important step since it is used as a proxy of coastline change [7]. Remote sensing is a synoptic technique to analyze the Earth based on its efficiency, convenience, and cost. It is considered an effective option to extract and monitor shorelines [7]. Landsat image datasets are widely used in many studies since they are freely acquired from the Earthexplorer platform of the United States Geological Survey (USGS) and provide reliable scientific information on natural resources conditions [8]. Additionally, Sentinel images are also the popular data sources for identifying water surfaces using spectral indices due to their suitable spectral bands and medium spatial resolution [9]. Specifically, Sentinel-2 has a 10 m spatial resolution and global revisit interval of a 5-day cycle (Sentinel-2A and Sentinel-2B). In addition, the global median average revisit will be only a 3-day cycle if all satellite images are combined [10]. The detection of shoreline will be conducted by the segmentation technique, using reflectance values from land and water [11].
Coastal areas in Vietnam are among the most densely populated regions in the world [12]. In addition, the country’s leading economy is principally located in coastal and estuarine areas [13]. In recent years, the coastlines in the central of Vietnam and Quang Nam province have been severely eroded [14]. Nevertheless, the coastline’s retreating trend predominantly influences a potential threat to Quang Nam province’s local income, subsistence, and socio-economic development [15]. Moreover, Quang Nam province is affected by a tropical climate with high temperature and evaporation. The natural and hydro-meteorological conditions result in 3–5 tropical cyclones and depression storms each year, causing intense rainfall and subsequent floods on the central coast [16]. The endogenous, exogenous, and human-induced factors are also factors leading to coastline change [17]. Thus, spatio-temporal analysis of coastline change in Quang Nam is crucially important.
The present study investigates the long-term spatio-temporal changes of the Quang Nam coastline by using multi-temporal satellite images and statistical parameters. Coastline dynamics at an annual scale and the change rate over three decades for Quang Nam province were obtained and presented. As a result, the future trend of shoreline evolution can be estimated, and this will provide beneficial information for achieving sustainable coastal management in Quang Nam province. In addition, this approach could easily be applied to other study areas where the beaches have similar erosion/accretion issues.

2. Case Study and Data Collection
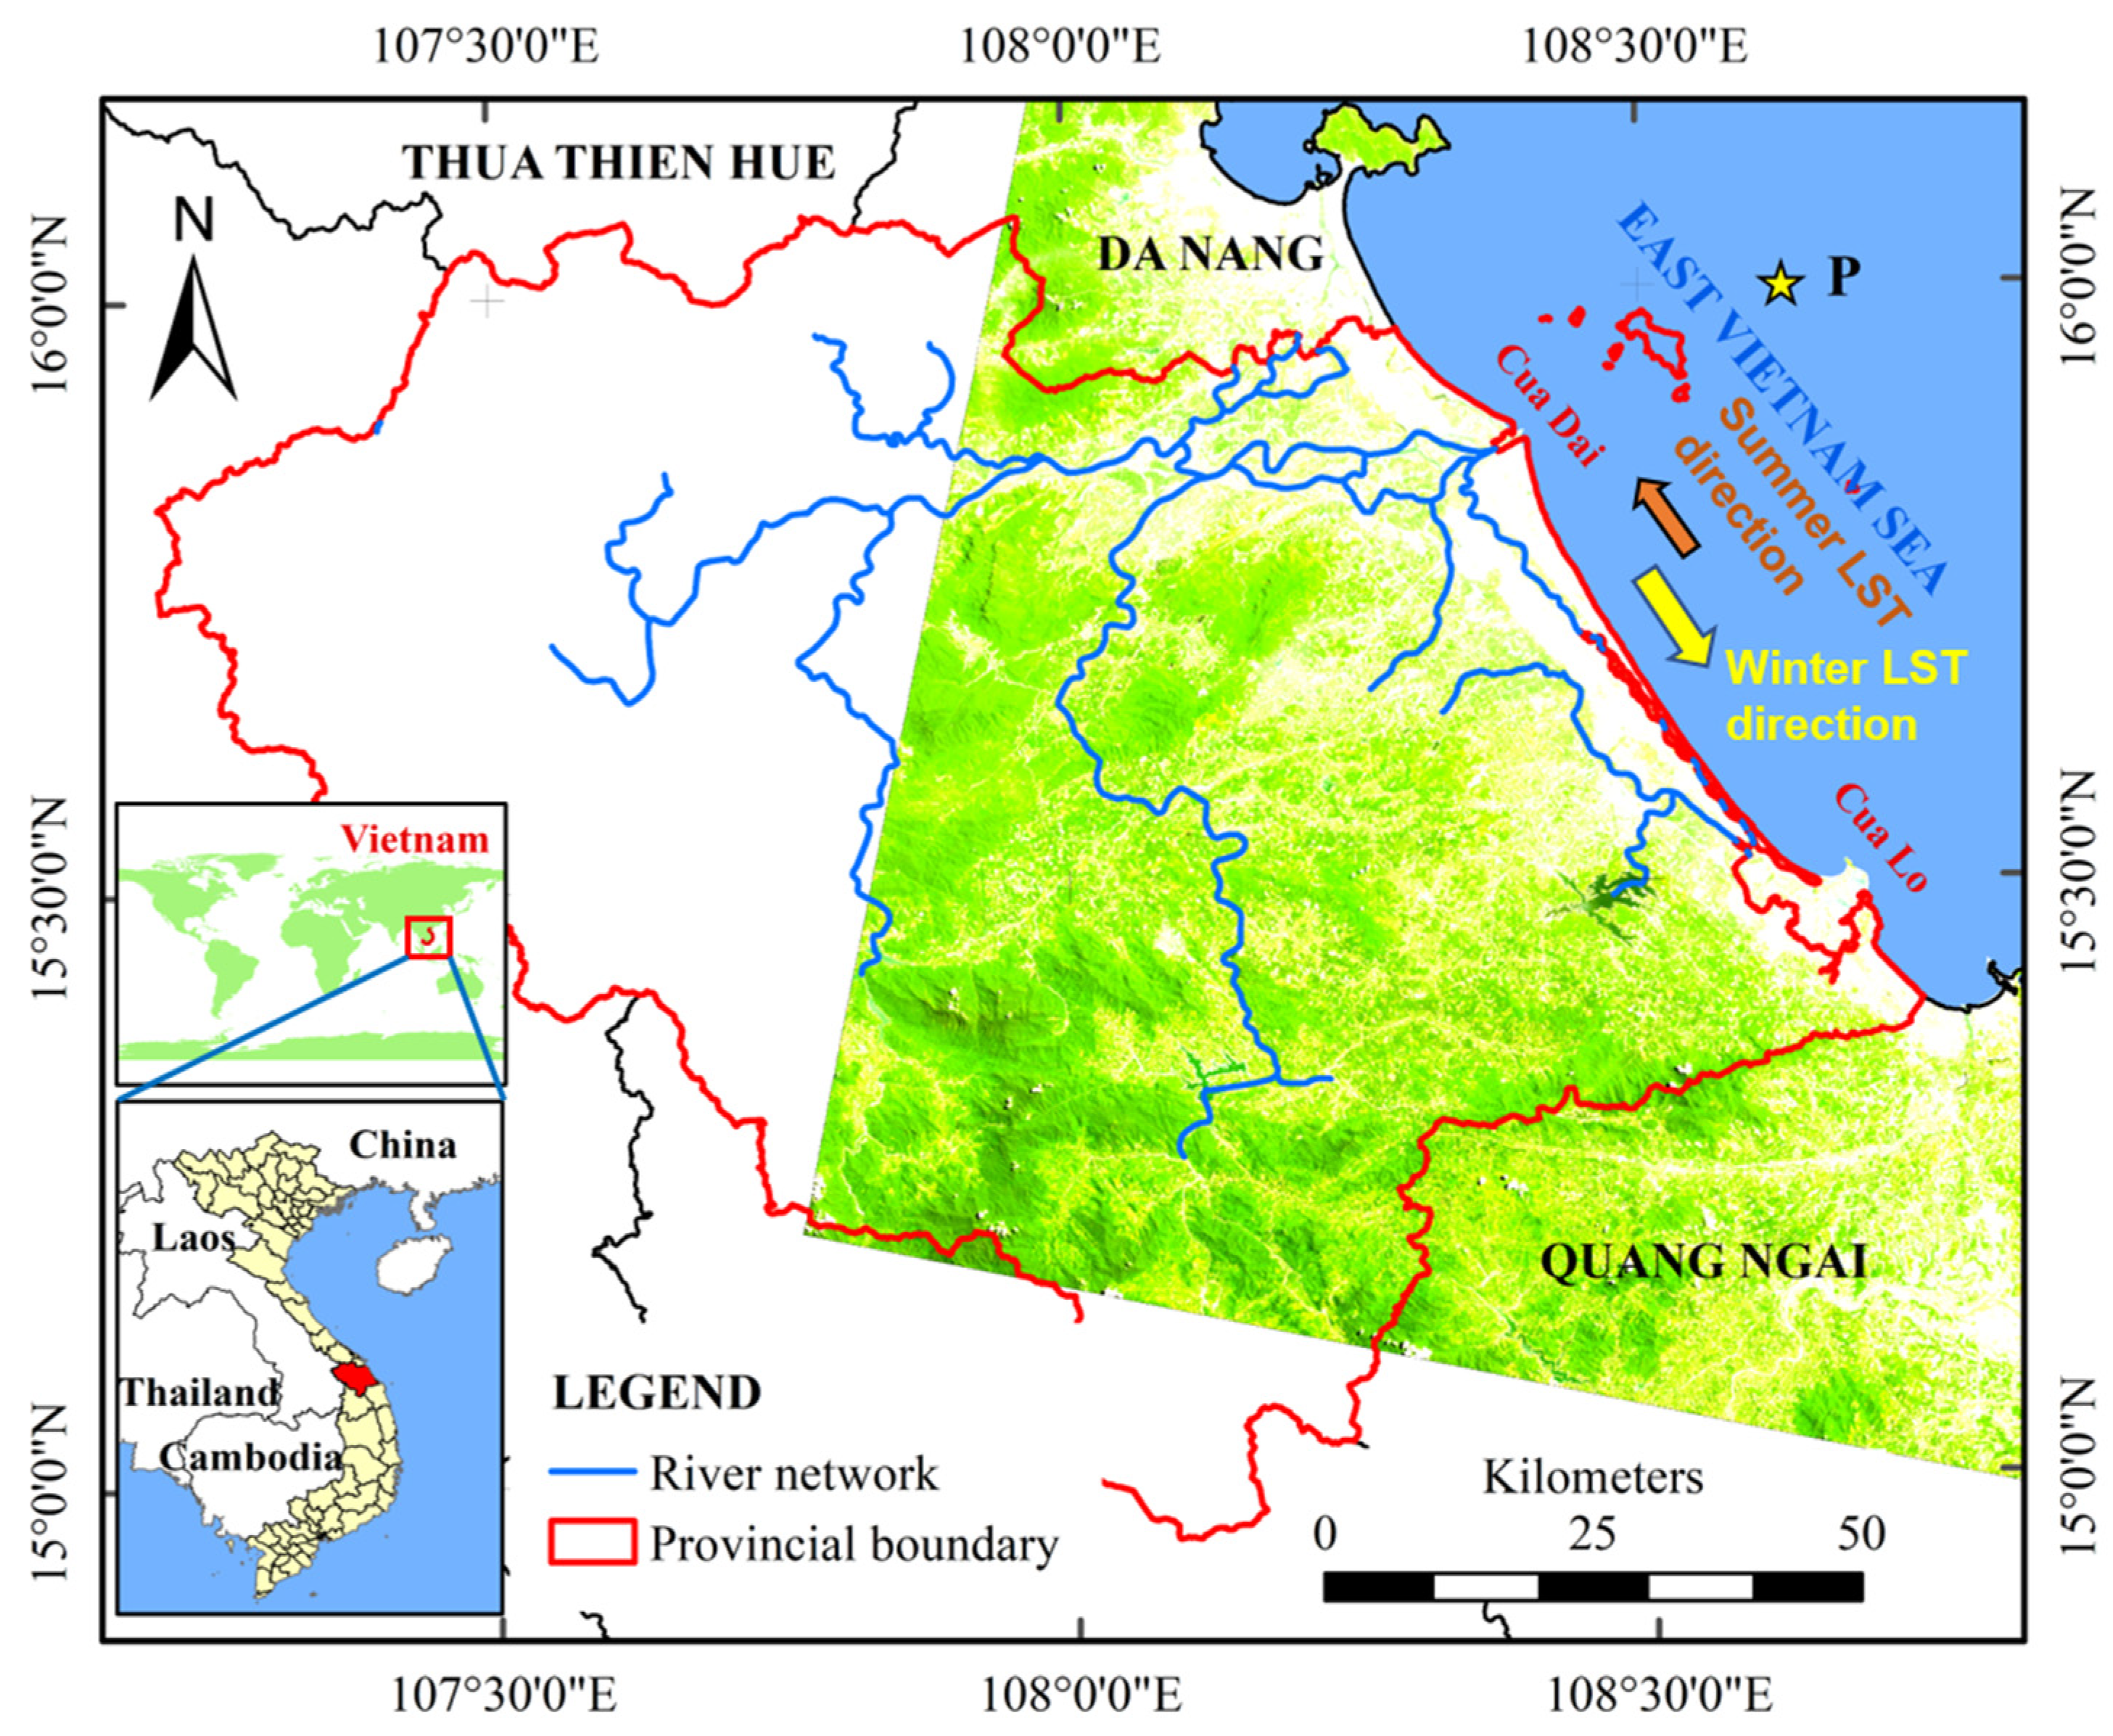
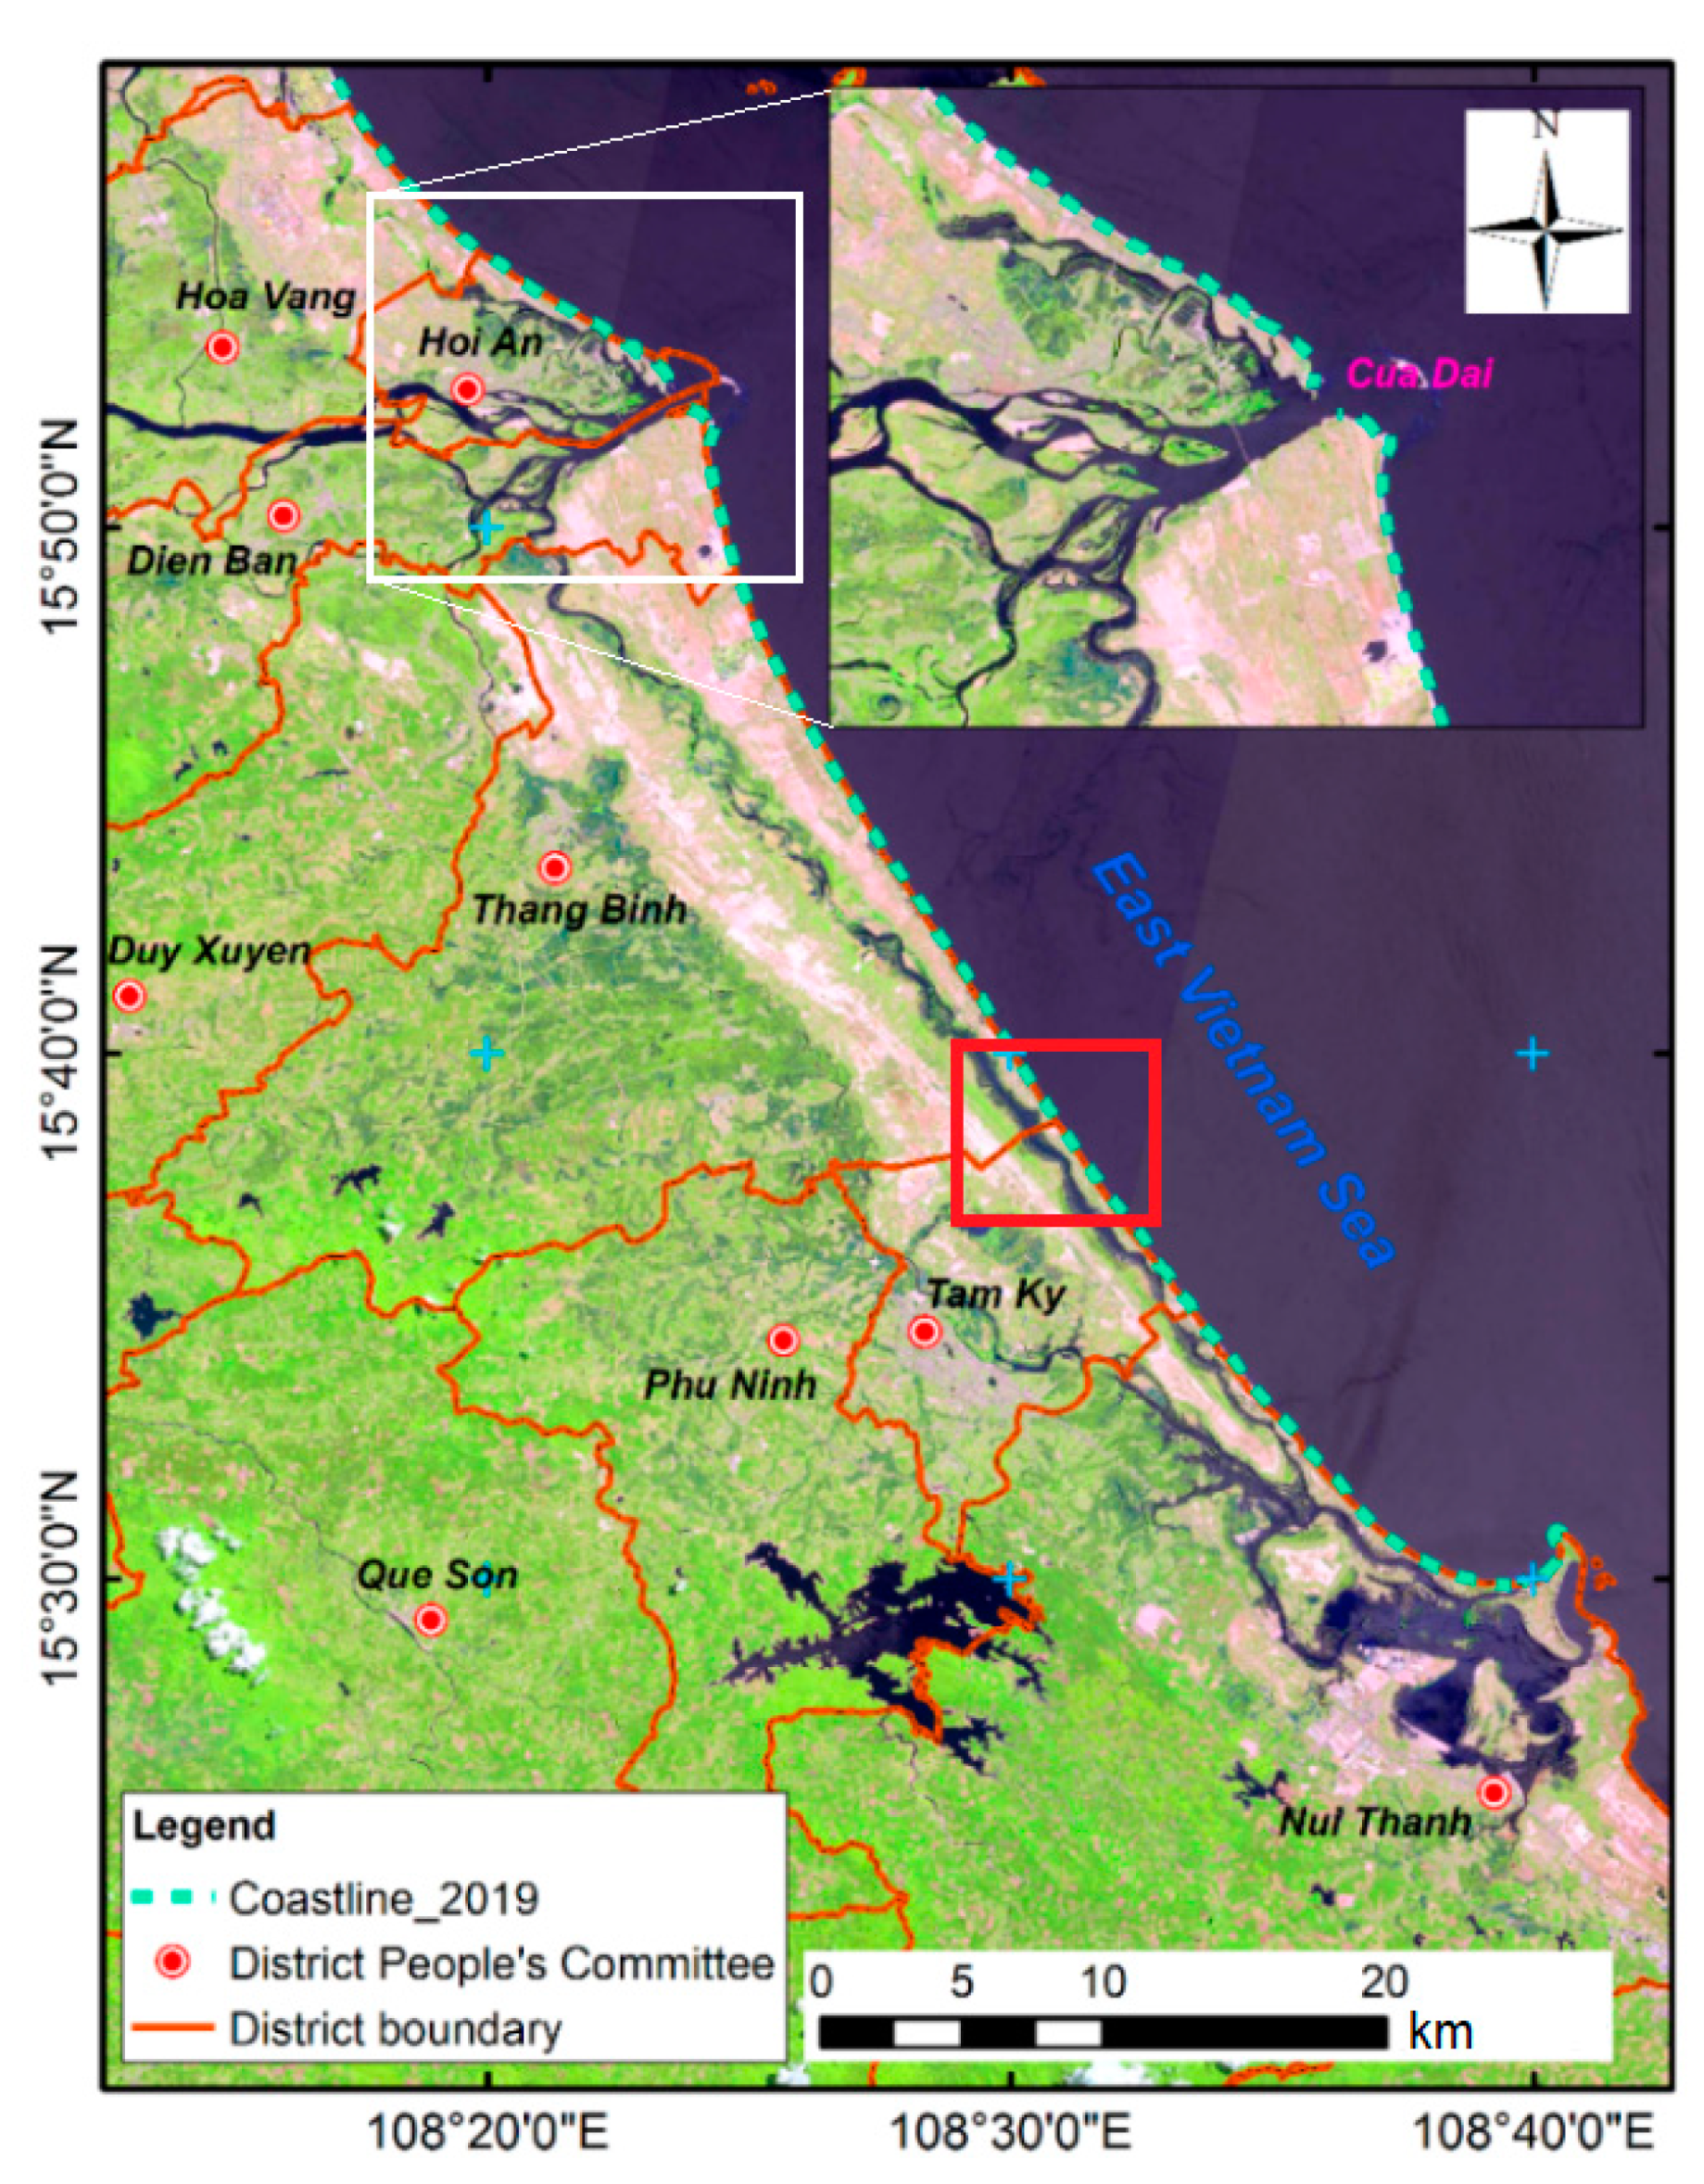
2.1. Case Study

The Quang Nam coastline is located on the central coast of Vietnam, with a length of about 125 km [16] (Figure 1). Thanks to this long coastline, local habitats can develop tourism and transportation, earning their livings predominantly by agricultural production, fishing, and aquaculture. Overall, the location of Quang Nam province is favorable for regional socio-economic development and international culture exchange. However, the Quang Nam coastline has been recently eroded either by reducing river sediment supply due to the upstream hydropower construction or due to interruption of longshore sediment transport by groins, which significantly impacted the environment in the area.
The coastal area of the Quang Nam province is covered mainly by sand with an average grain size from 0.15 to 0.2 mm [18]. Quang Nam belongs to the tropical climate zone, which is affected by the monsoon seasons each year (Northeast (NE) monsoon during winter and Southwest (SW) monsoon during summer). Figure 2 shows the re-analysis of the deep-water wave rose from the global WAVEWATCHIII model at position P in Figure 1. The results clearly show that the wave field in this area is highly characterized by the monsoon regimes. During the NE monsoon, the dominant wave direction is NE–E, with an average wave height of Hs = 2–3 m and an average wave period of T = 8–10 s. During the SW monsoon, the wave direction is S-SE, with an average wave height of Hs = 0.5–1.5 m and an average wave period of T = 6–8 s. In general, wave heights greater than 1 m are mainly from the NE direction; the SE wave direction is usually less than 1 m. Thus, there is an asymmetry in wave height between the two dominant incoming wave directions, resulting in the asymmetric magnitude of seasonal longshore sediment transport (LST), as shown in Figure 1.

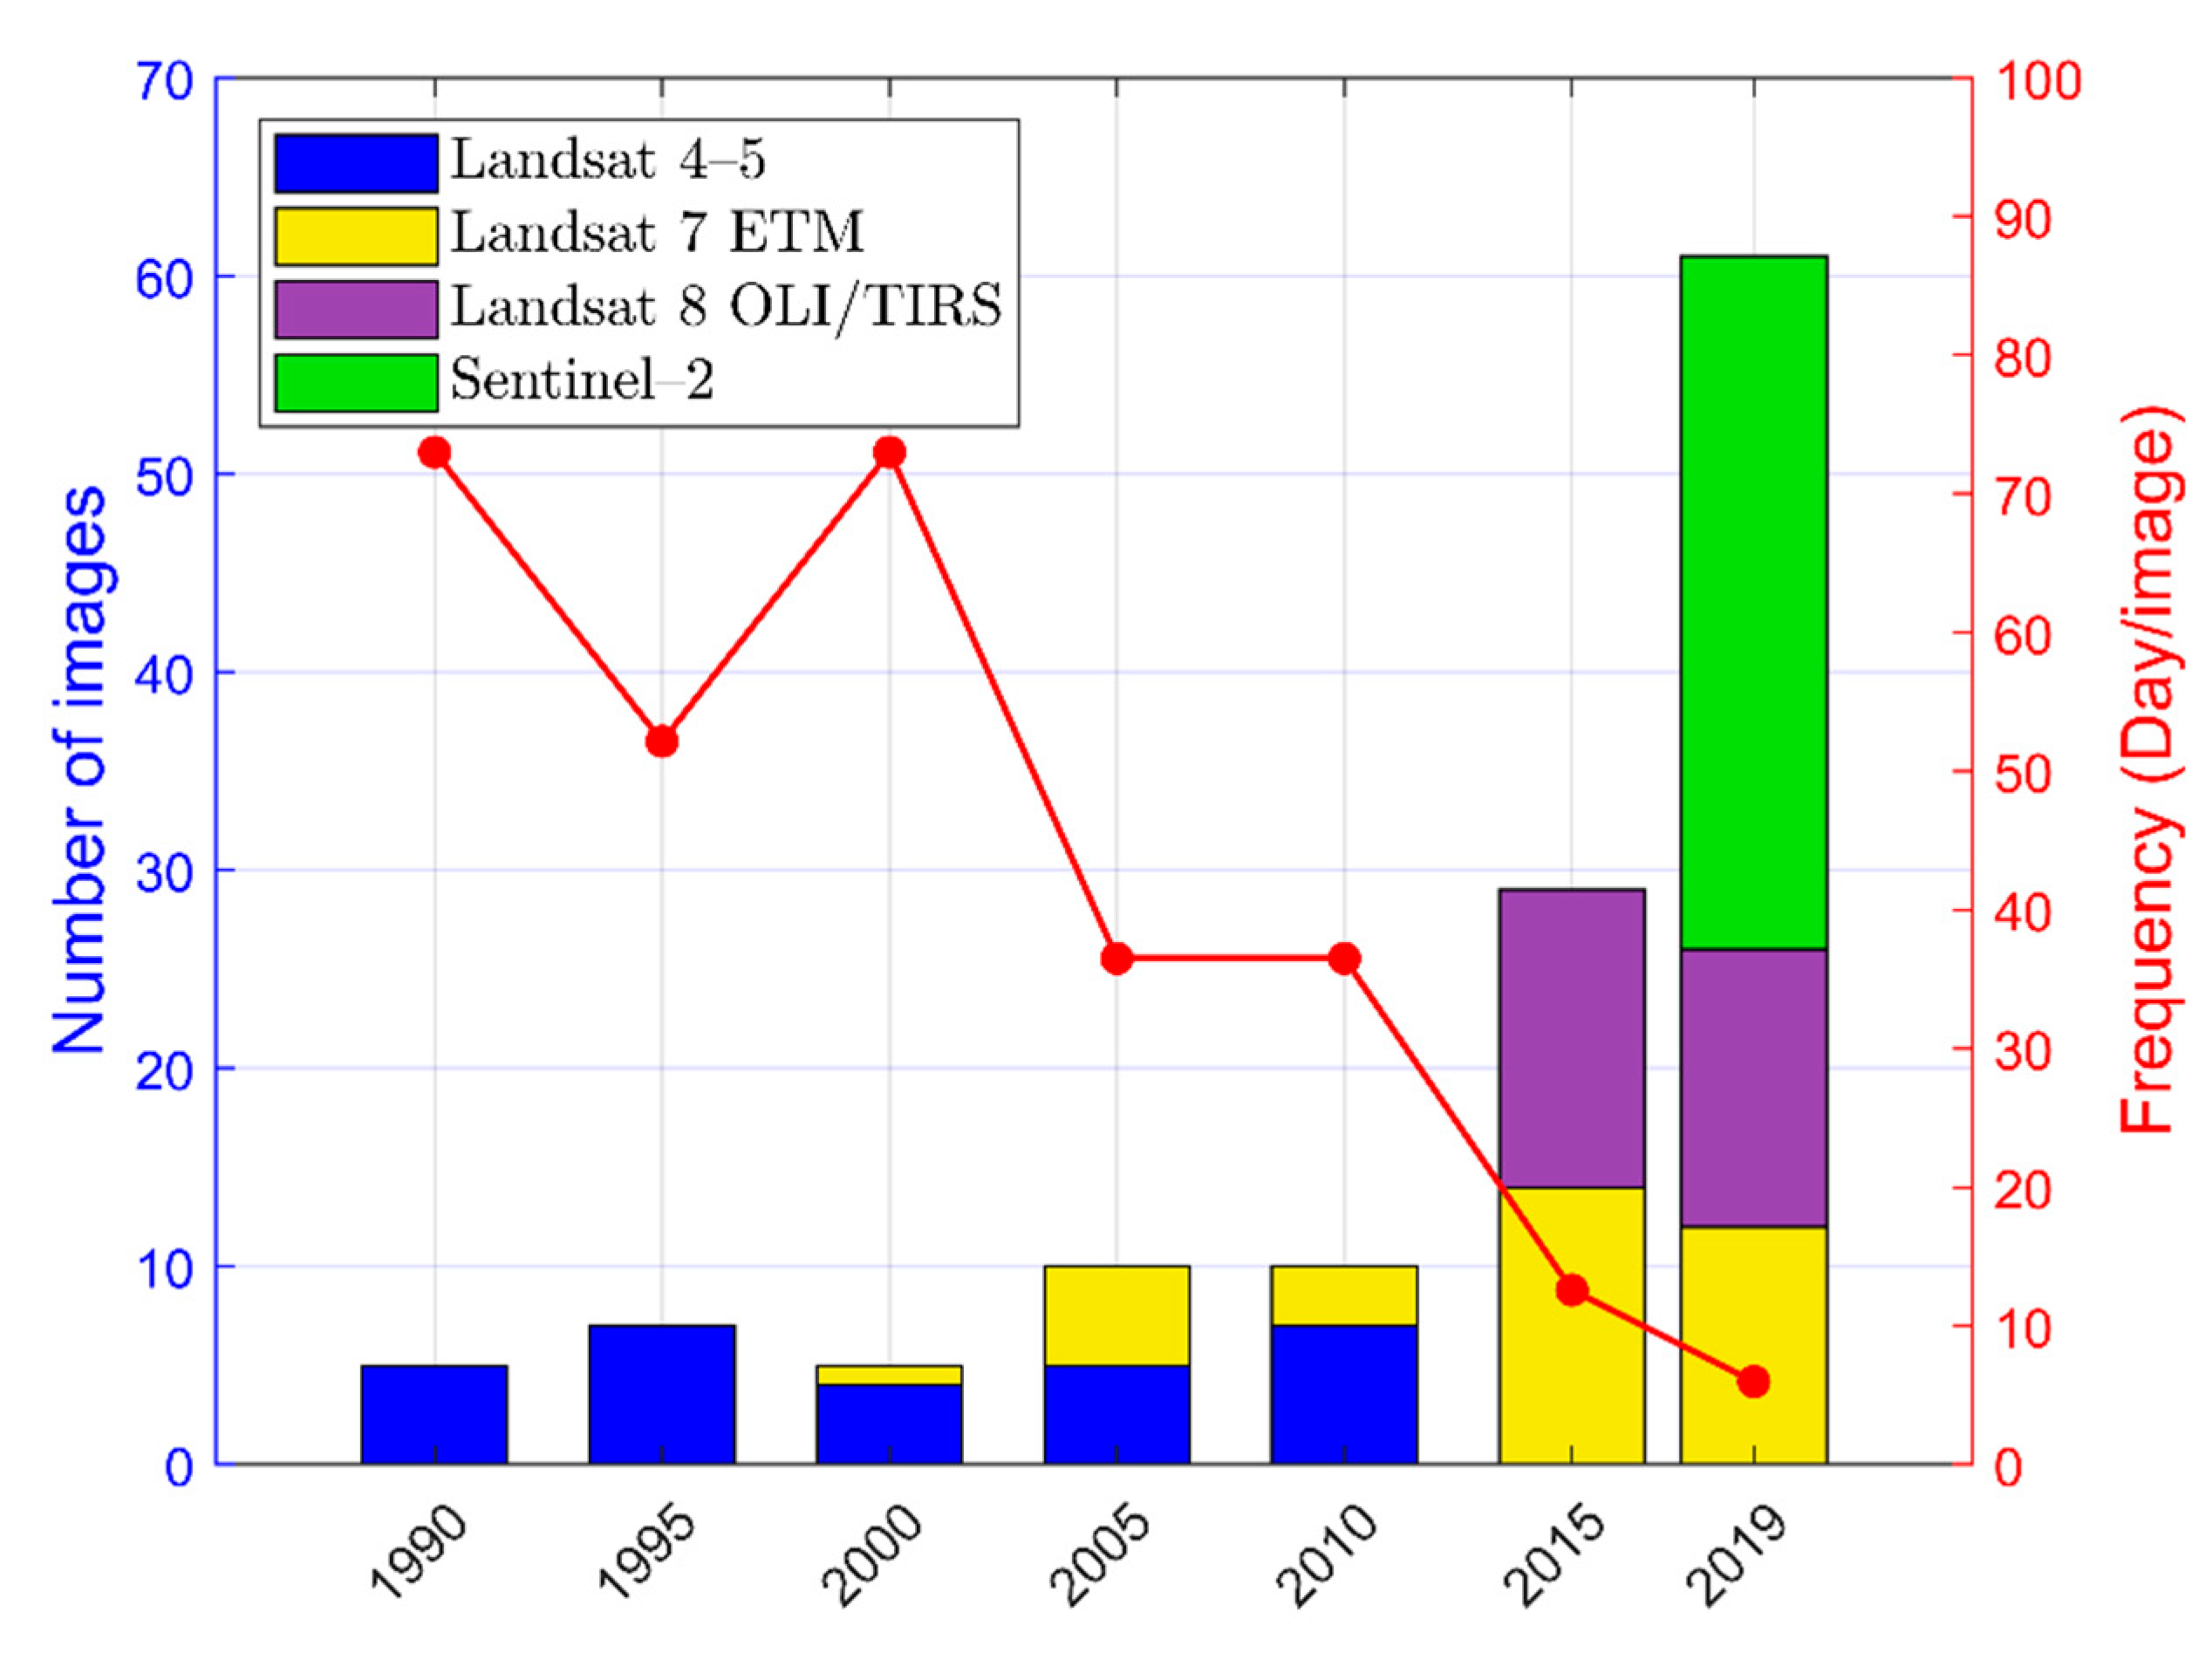
2.2. Data Collection
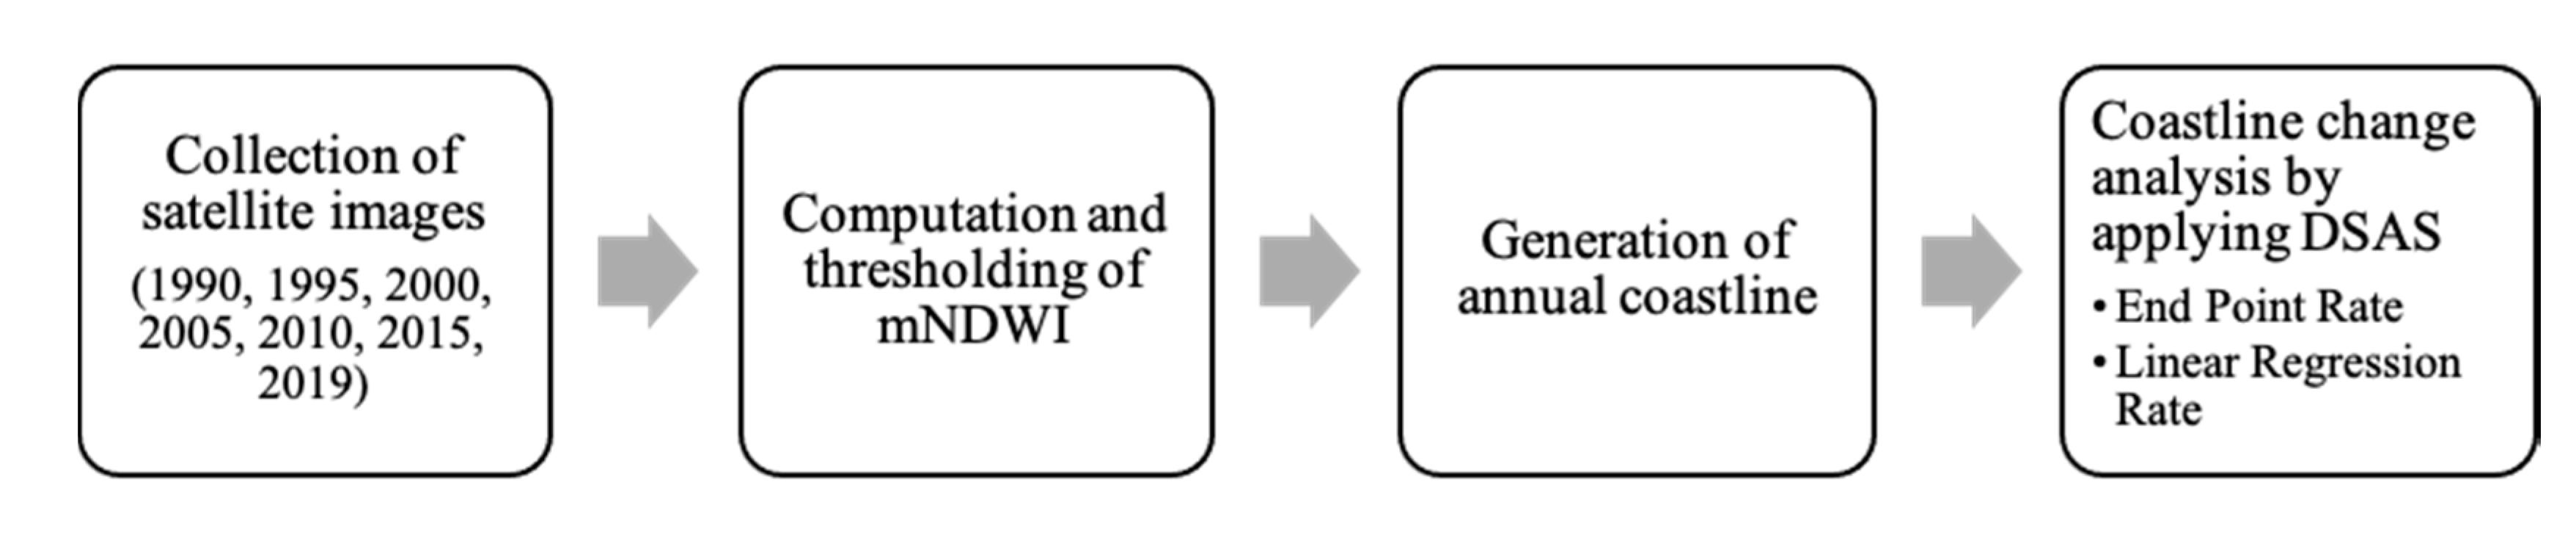
In this research, all available scenes of Sentinel-2 and Landsat satellite series, i.e., Landsat 4–5 Thematic Mapper (TM), Landsat 7 Enhanced Thematic Mapper Plus (ETM+), and Landsat 8 Operational Land Imager/Thermal Infrared Sensor (OLI/TIRS) over the period 1990–2019, were collected and utilized for detecting the coastline dynamic and estimating its change rate in Quang Nam province. It is noted that only satellite images with a percentage of land cloud cover below 20% were used for the analysis. Figure 3 shows the time series of the total number of analyzed images and their frequency. In order to validate the shoreline detection result from DSAS, we conducted a field survey of shoreline positions along the northern part of Cua Dai in 2018. Additionally, a geological map in the year 1996 was also collected from the Vietnam Geological Survey Institution to clarify one of the contributors to the erosional/accretional rate.

3. Methods

In order to achieve the shoreline change assessment purpose, the Digital Shoreline Analysis System (DSAS), an add-in to the Esri ArcGIS desktop, has been adopted to analyze coastline change because of its capability to monitor, display, and map long-term/short-term shoreline advance/retreat [5]. Moreover, DSAS can estimate the rate-of-change statistics from multiple historical coastline positions to capture the expansion and regression in coastline morphology. DSAS technique for calculating shoreline change rates is based on observed variations in coastline locations over time. The reported rates are measured in meters per year along transects. DSAS combines the separate module calculations once the user-selected rate-change calculations have completed processing, and the outcome is made available as an attribute table in ArcMap. There are various rates of change statistics given by DSAS, including Net Shoreline Movement (NSM), Shoreline Change Envelope (SCE), End Point Rate (EPR), Linear Regression Rate (LRR), Weighted Linear Regression Rate (WLR), etc. [19]. The modified Normalized Difference Water Index (mNDWI) is used for classifying land and water regions on satellite images. Hence, the shoreline position, which is the boundary between land and water areas, will be extracted based on the threshold of the mNDWI [20]. The annual coastlines are detected from the Water Frequency Index (WFI) computation. The overall methodology is summarized in Figure 4.

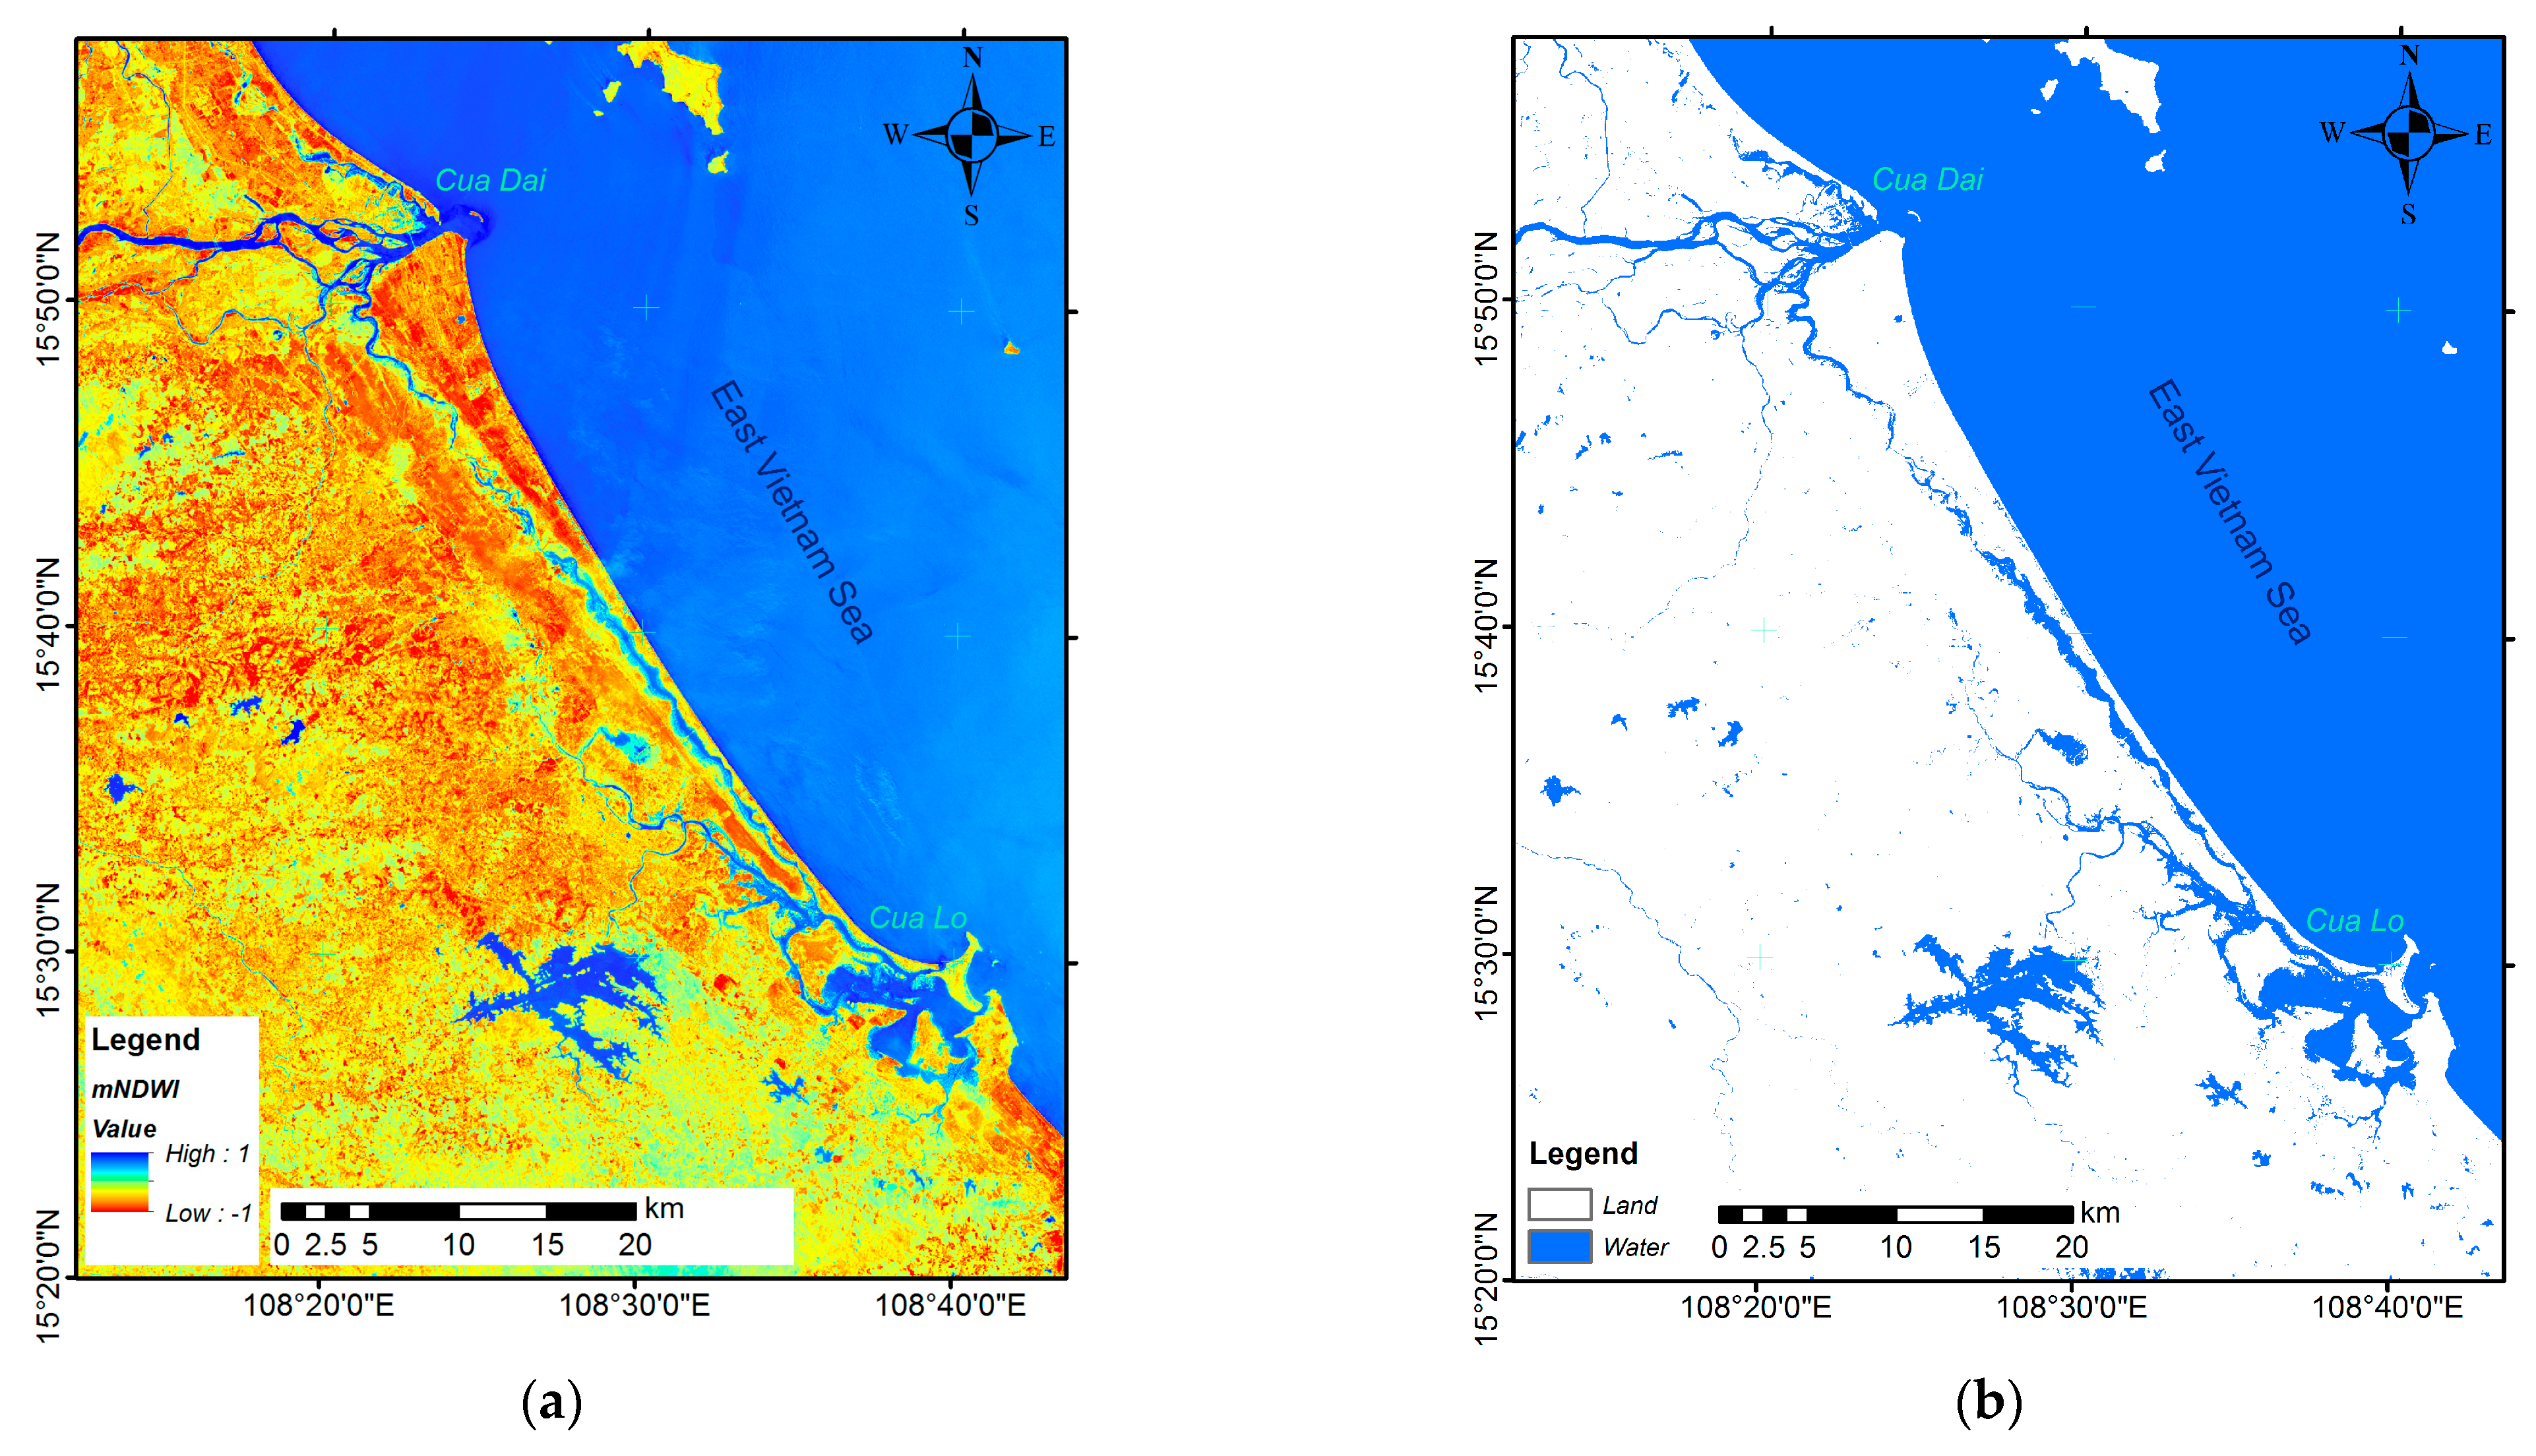
3.1. Computation and Threshold of the mNDWI

The classification technique calculates water indices from two or more spectral bands, such as Green and Middle Infrared. This technique is a useful and practical approach to extract water in general and detect coastline in particular. Although there many water indices, e.g., Normalized Difference Water Index (NDWI) [21], the modified Normalized Difference Water Index (mNDWI) [22], the Automated Water Extraction Index (AWEI) [23], and WI2015 [24] have been used to detect and extract surface water bodies from satellite images. However, this study adopted the mNDWI due to its stable performance in delineating water from land [8]. Xu [25] also indicated that mNDWI is more effective than NDWI models in surface water extraction due to the advantages of diminishing or even removing built-up land noises.
The mNDWI is calculated as follows:
mNDWI = Green MIR Green + MIR
where Green is the green band, and MIR is the Middle Infrared band. The value of the mNDWI ranges from −1 to 1. Table 1 shows detailed information of each imagery and spectral bands in applying Formula (1).
To classify the water-land boundary, water pixel values need to be determined by a suitable positive threshold [25]. According to Fisher [24] and Xu [25], the optimal threshold is zero for all land–water classifications. Therefore, this study used the zero threshold to automatically identify the boundary between land and water along the Quang Nam coast.

3.2. Annual Coastline Analysis

To achieve accessible detection of coastal changes, the authors generated the annual coastline from the Water Frequency Index (WFI) computation result, which could average the coastlines for each year. The advantage is that the impact of short-term sea/river level changes and seasonal sediment changes can be mitigated [25]. More specifically, users can create a representative water surface/coastline to avoid several potential problems related to the use of satellite images, such as (1) interruption of the data due to the image stream/stripping of Landsat 7 image while using the sensor (ETM+) and (2) residual image noise or other confounding elements are not recorded (e.g., clouds, shadows, and corner pixels).
In this study, each mNDWI computation was classified into three classes, i.e., 0 for land, 1 for water, and no-data (which represents clouds and shadow areas). Hence, the representative land–water classification map for each year was produced by applying the WFI, introduced by Xu [25]:
WFI = N water N water + N land
where Nwater and Nland are the times that the pixels were counted as water and land within each considered year, respectively.
The value of WFI has two ranges: WFI ≥ 0.5 represents the annual water surface, and WFI < 0.5 is the annual land. Hence, an annual land–water classification map is established for typical annual water-surface performance. Finally, the annual land–water classification maps were used to extract the annual coastlines of Quang Nam province by using ArcGIS software. Hence, the DSAS software used the detected shorelines for analyzing coastline variation in the following steps.

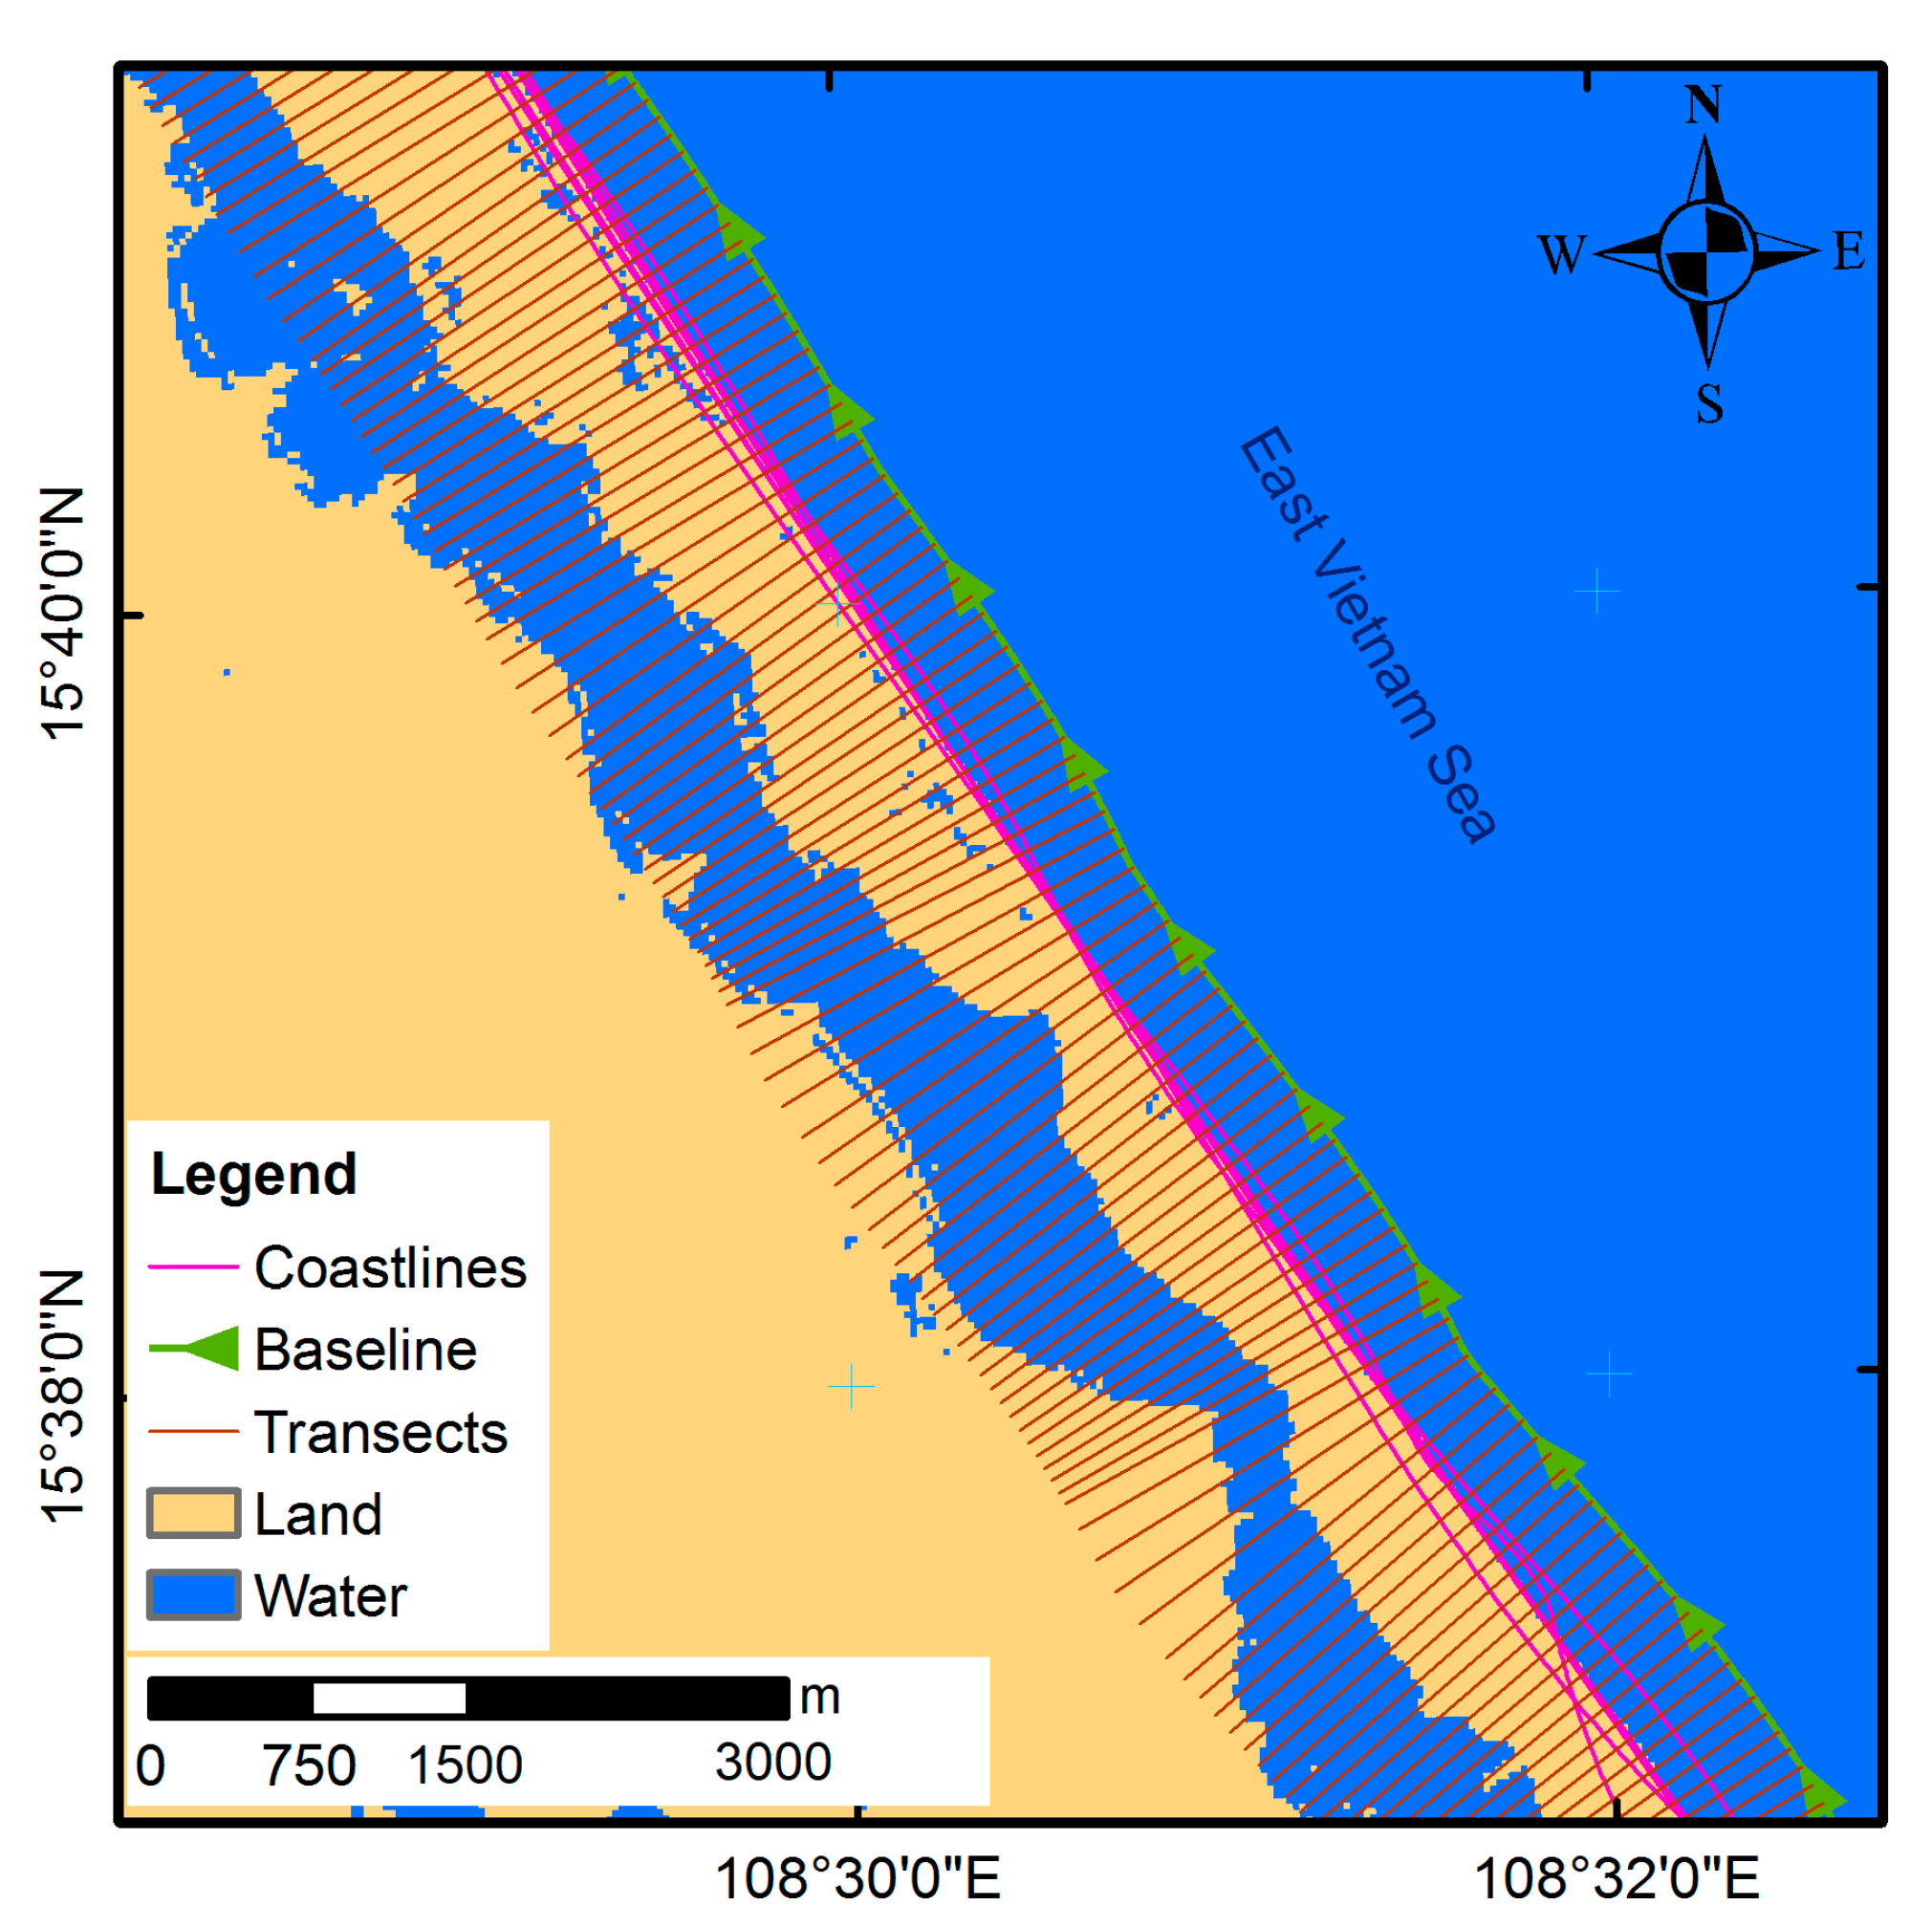
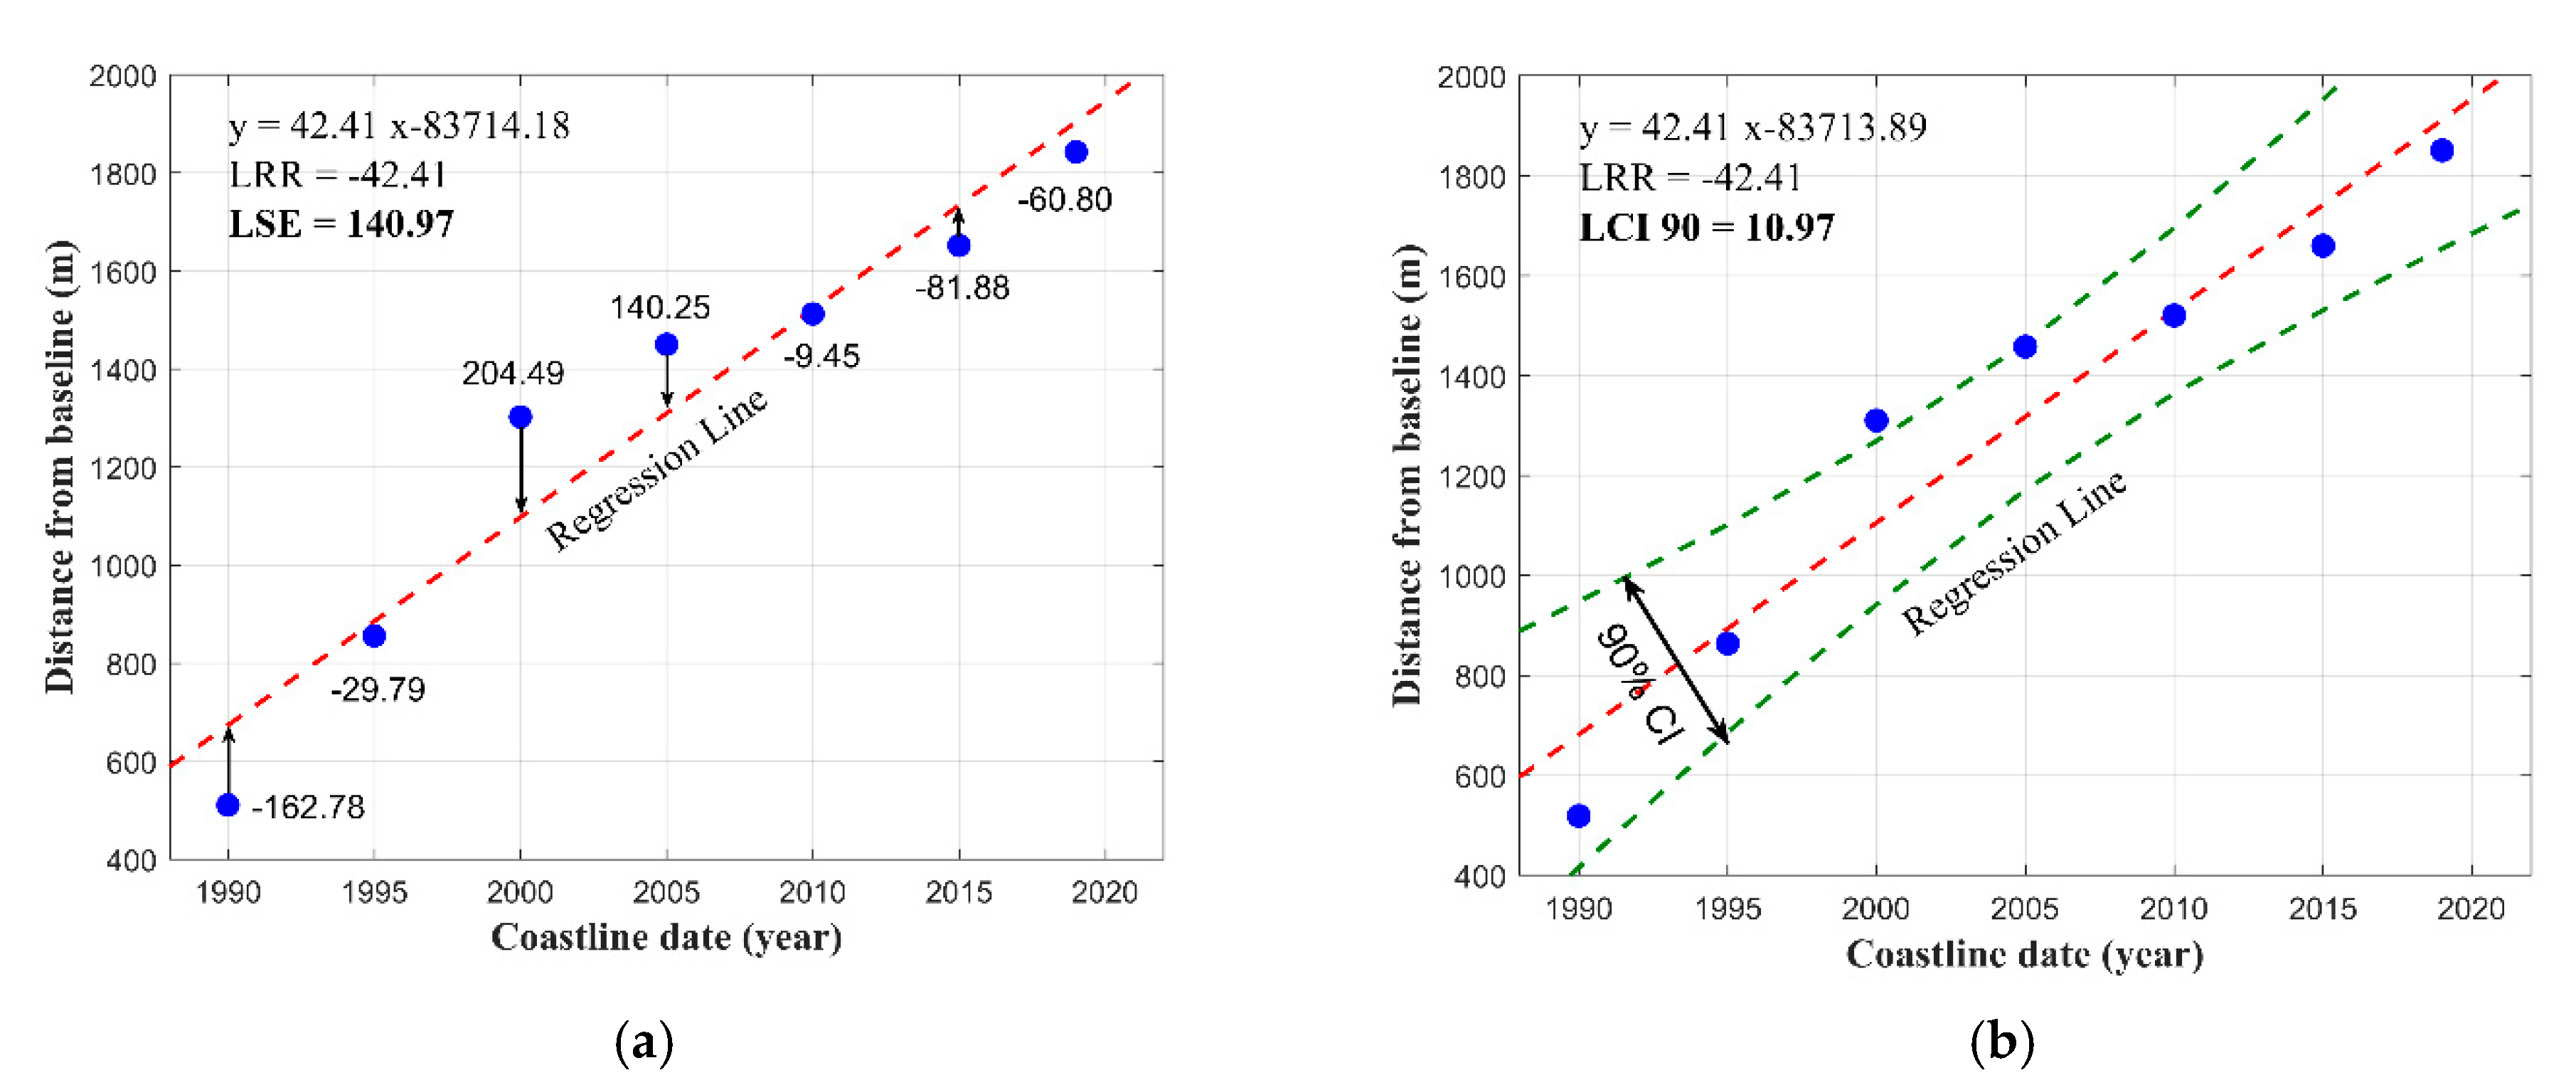
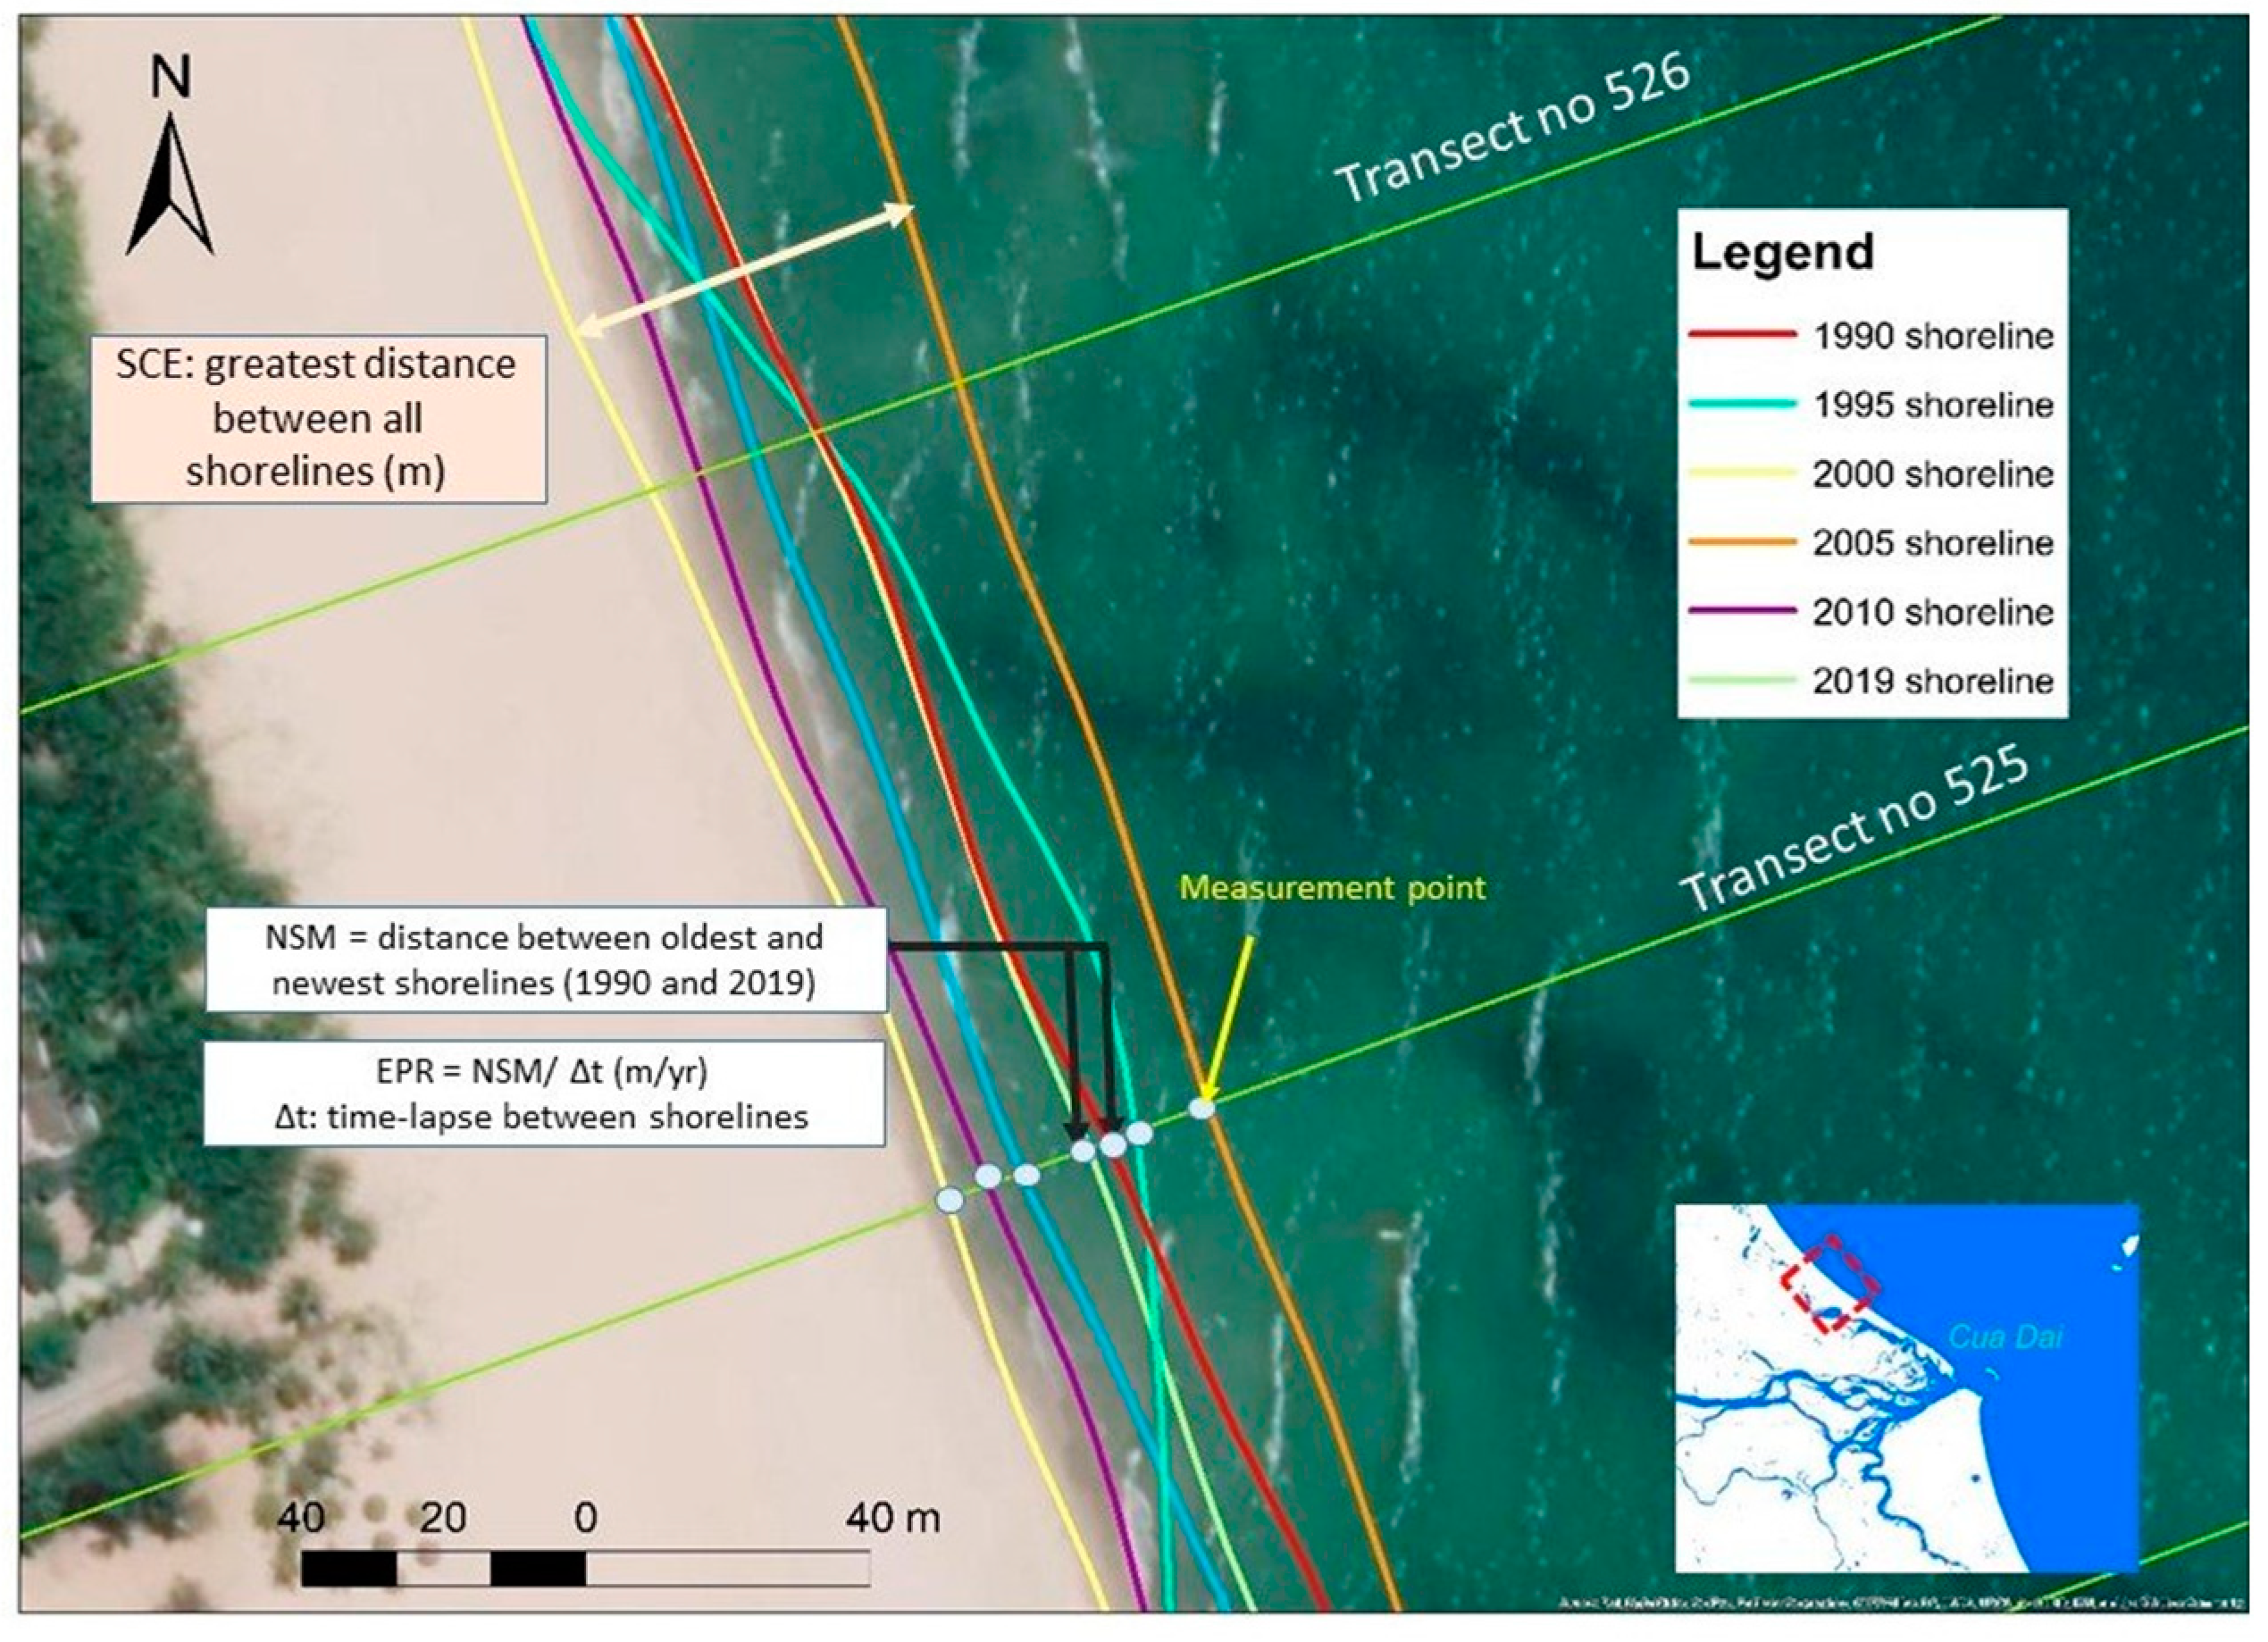
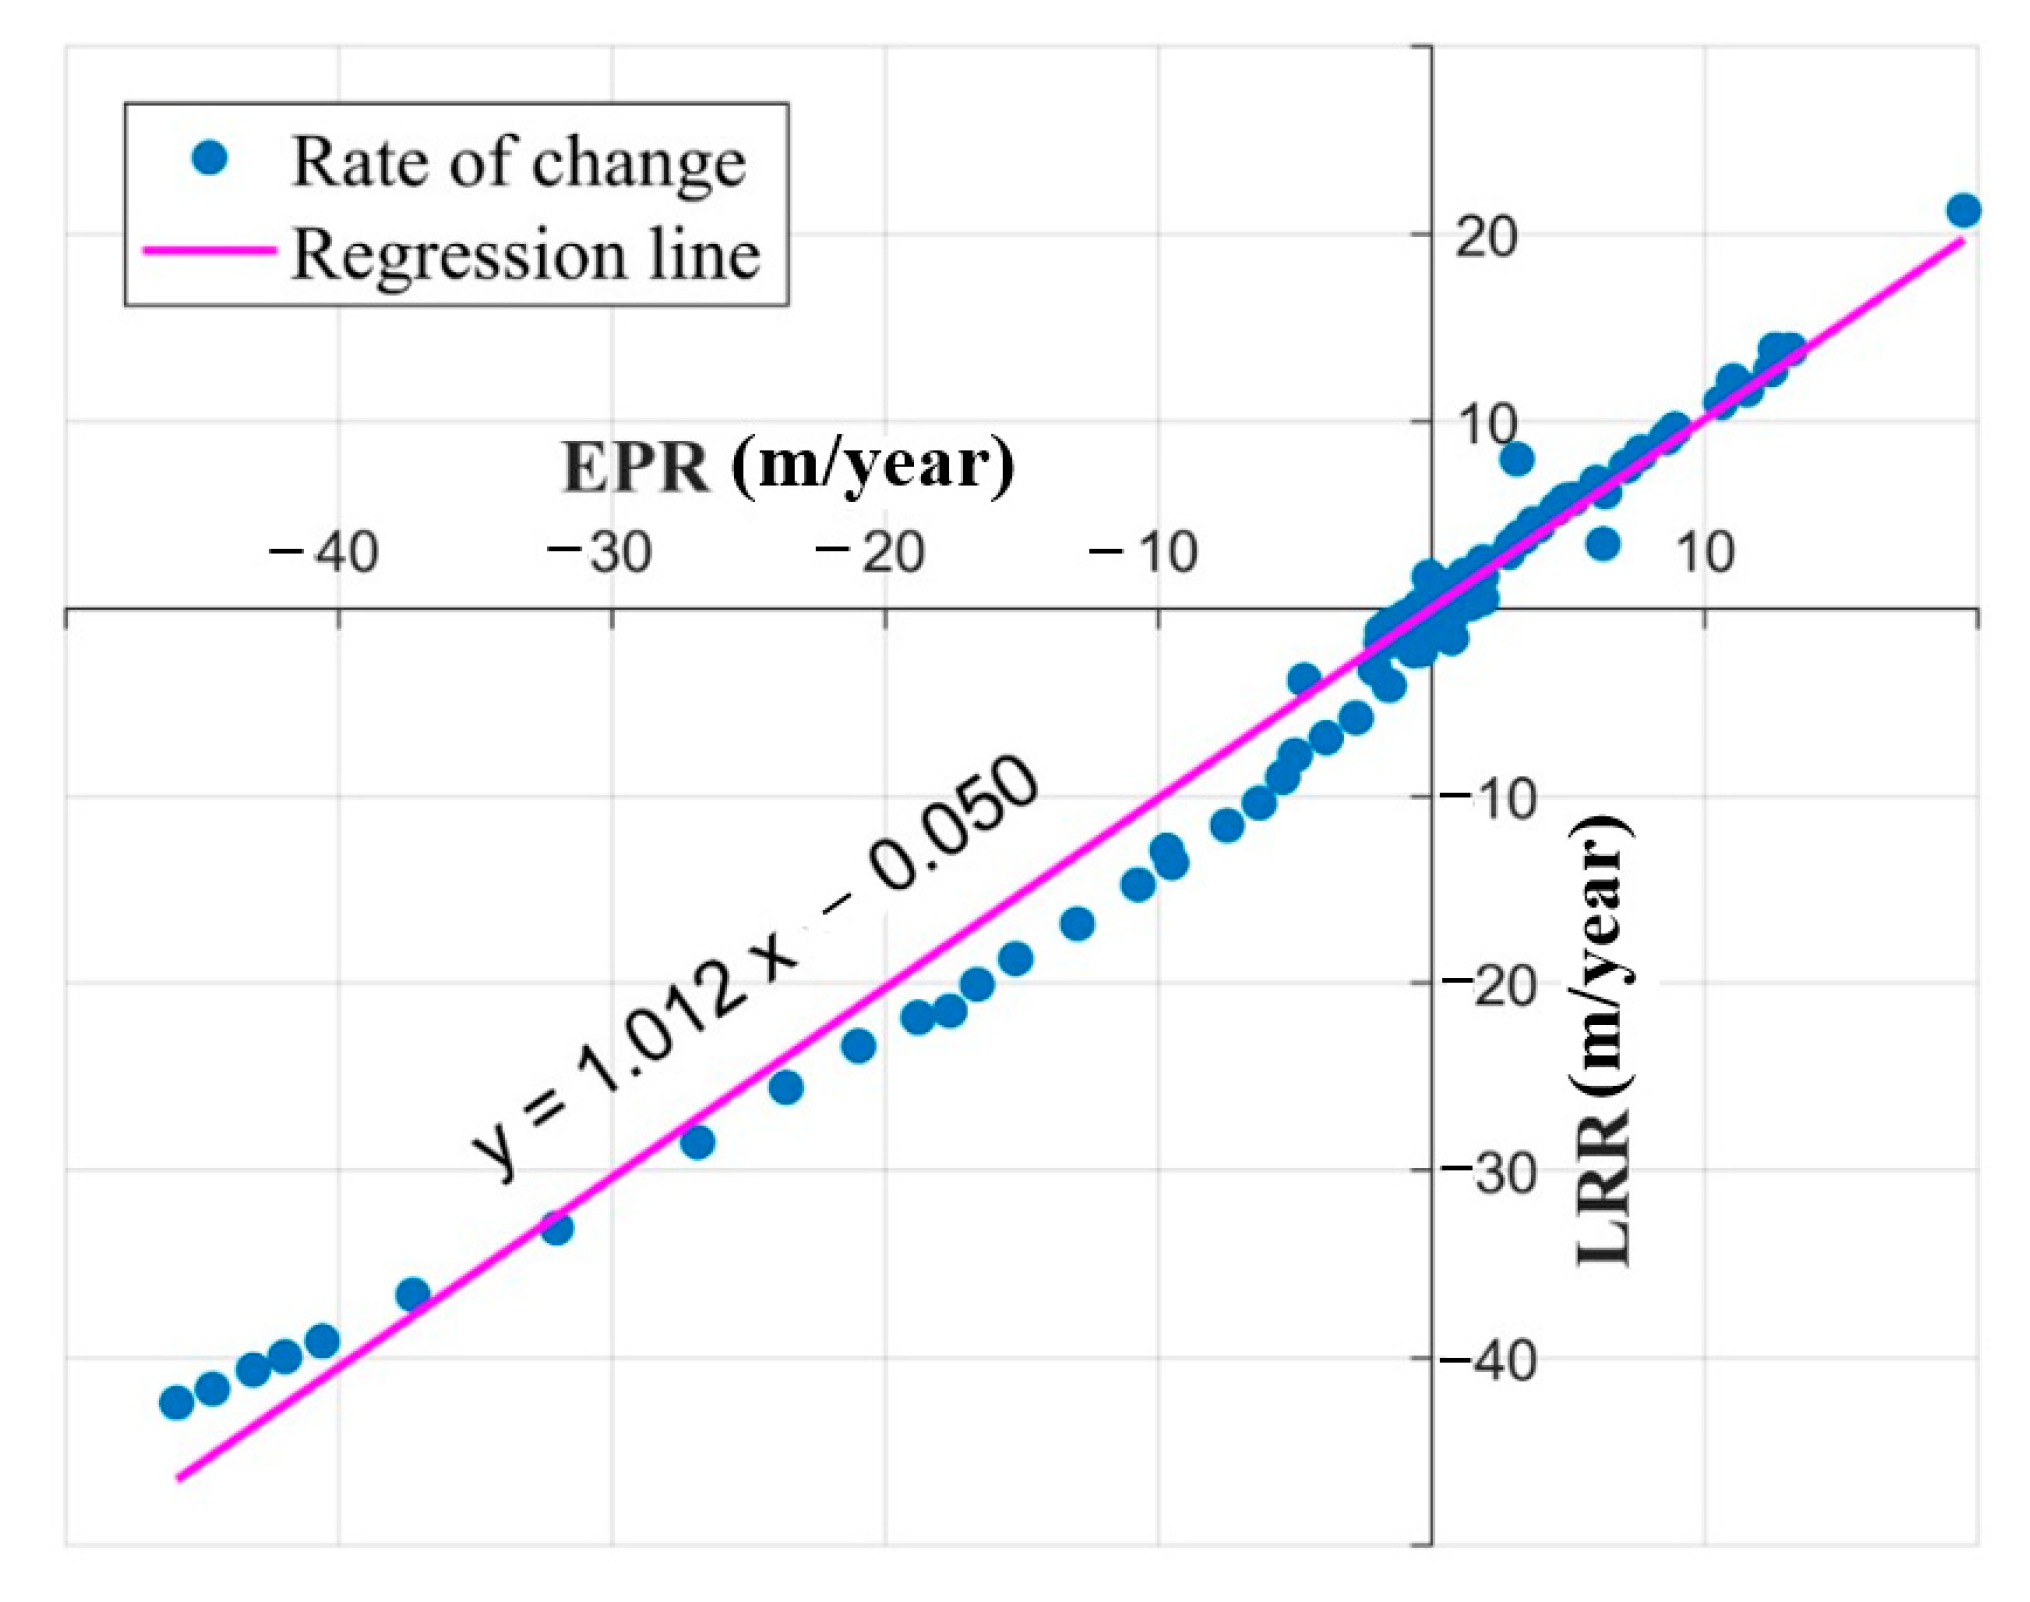
3.3. Coastline Change Analysis by Applying DSAS

DSAS is the computer software that calculates the shoreline movement for both spatial and temporal scales from extracted coastlines. The transect-based method in DSAS software was used for detecting coastline change by creating perpendicular transects between the self-defined reference baseline and multi-temporal coastlines [25]. Transects are only generated once there is a parallel construction of baseline and historical coastlines [27]. This research manually generated the baseline along the shoreline with various directions as coastline data is not continuous [28]. Transects were created after setting attributes for both coastlines and baseline. The intersection between transects and shorelines will contribute to measurement points that provide location and time information used to calculate rates of change. After running DSAS, the outputs include various estimators interpreting the values of change and attached statistical results during the studied period. In this research, two parameter functions in DSAS, i.e., End Point Rate (EPR) and Linear Regression Rate (LRR), were taken into account to calculate the coastline change rates and analyze the variation of the Quang Nam coast in terms of spatial and temporal scales.
The EPR is calculated by dividing the distance of coastlines movement, precisely between the oldest and youngest coastlines, by the number of years between their captured dates (Figure 5). It means that the EPR aims to transform Net Shore Movement (NSM) to an annual change rate (m/year) [29]. The EPR is expressed using the following Equation (3).
EPR = D 1 D 2 t 1 t 2
where D1D2 is the distance between the oldest and youngest coastlines, and t1 and t2 are the captured dates of the oldest and youngest coastlines.
The EPR parameter generally gives an overall change throughout the period since it depends on the oldest and youngest coastlines. However, it only shows the general change for the period [t1, t2] and appropriately analyzes two shorelines. In the case of more than two shorelines, the LRR is applied for more accurate and objective results. Consistent with all coastline points, the LRR is the slope of the least-squares regression line, which uses all available coastlines to estimate the average rate of change over time [30]. The negative values of EPR and LRR indicate the landward recession of coastlines, whereas the positive sequences refer to advancement [31]. In addition, DSAS also has a function for calculating the supplemental statistics of the LRR method, comprising R-squared of linear regression (LR2), standard error of linear regression (LSE), and confidence interval of linear regression (for 90%) (LCI90) [32].
Based on the obtained results of these parameters, the spatial and temporal variation of the Quang Nam coastline could be investigated.

4. Results and Discussion

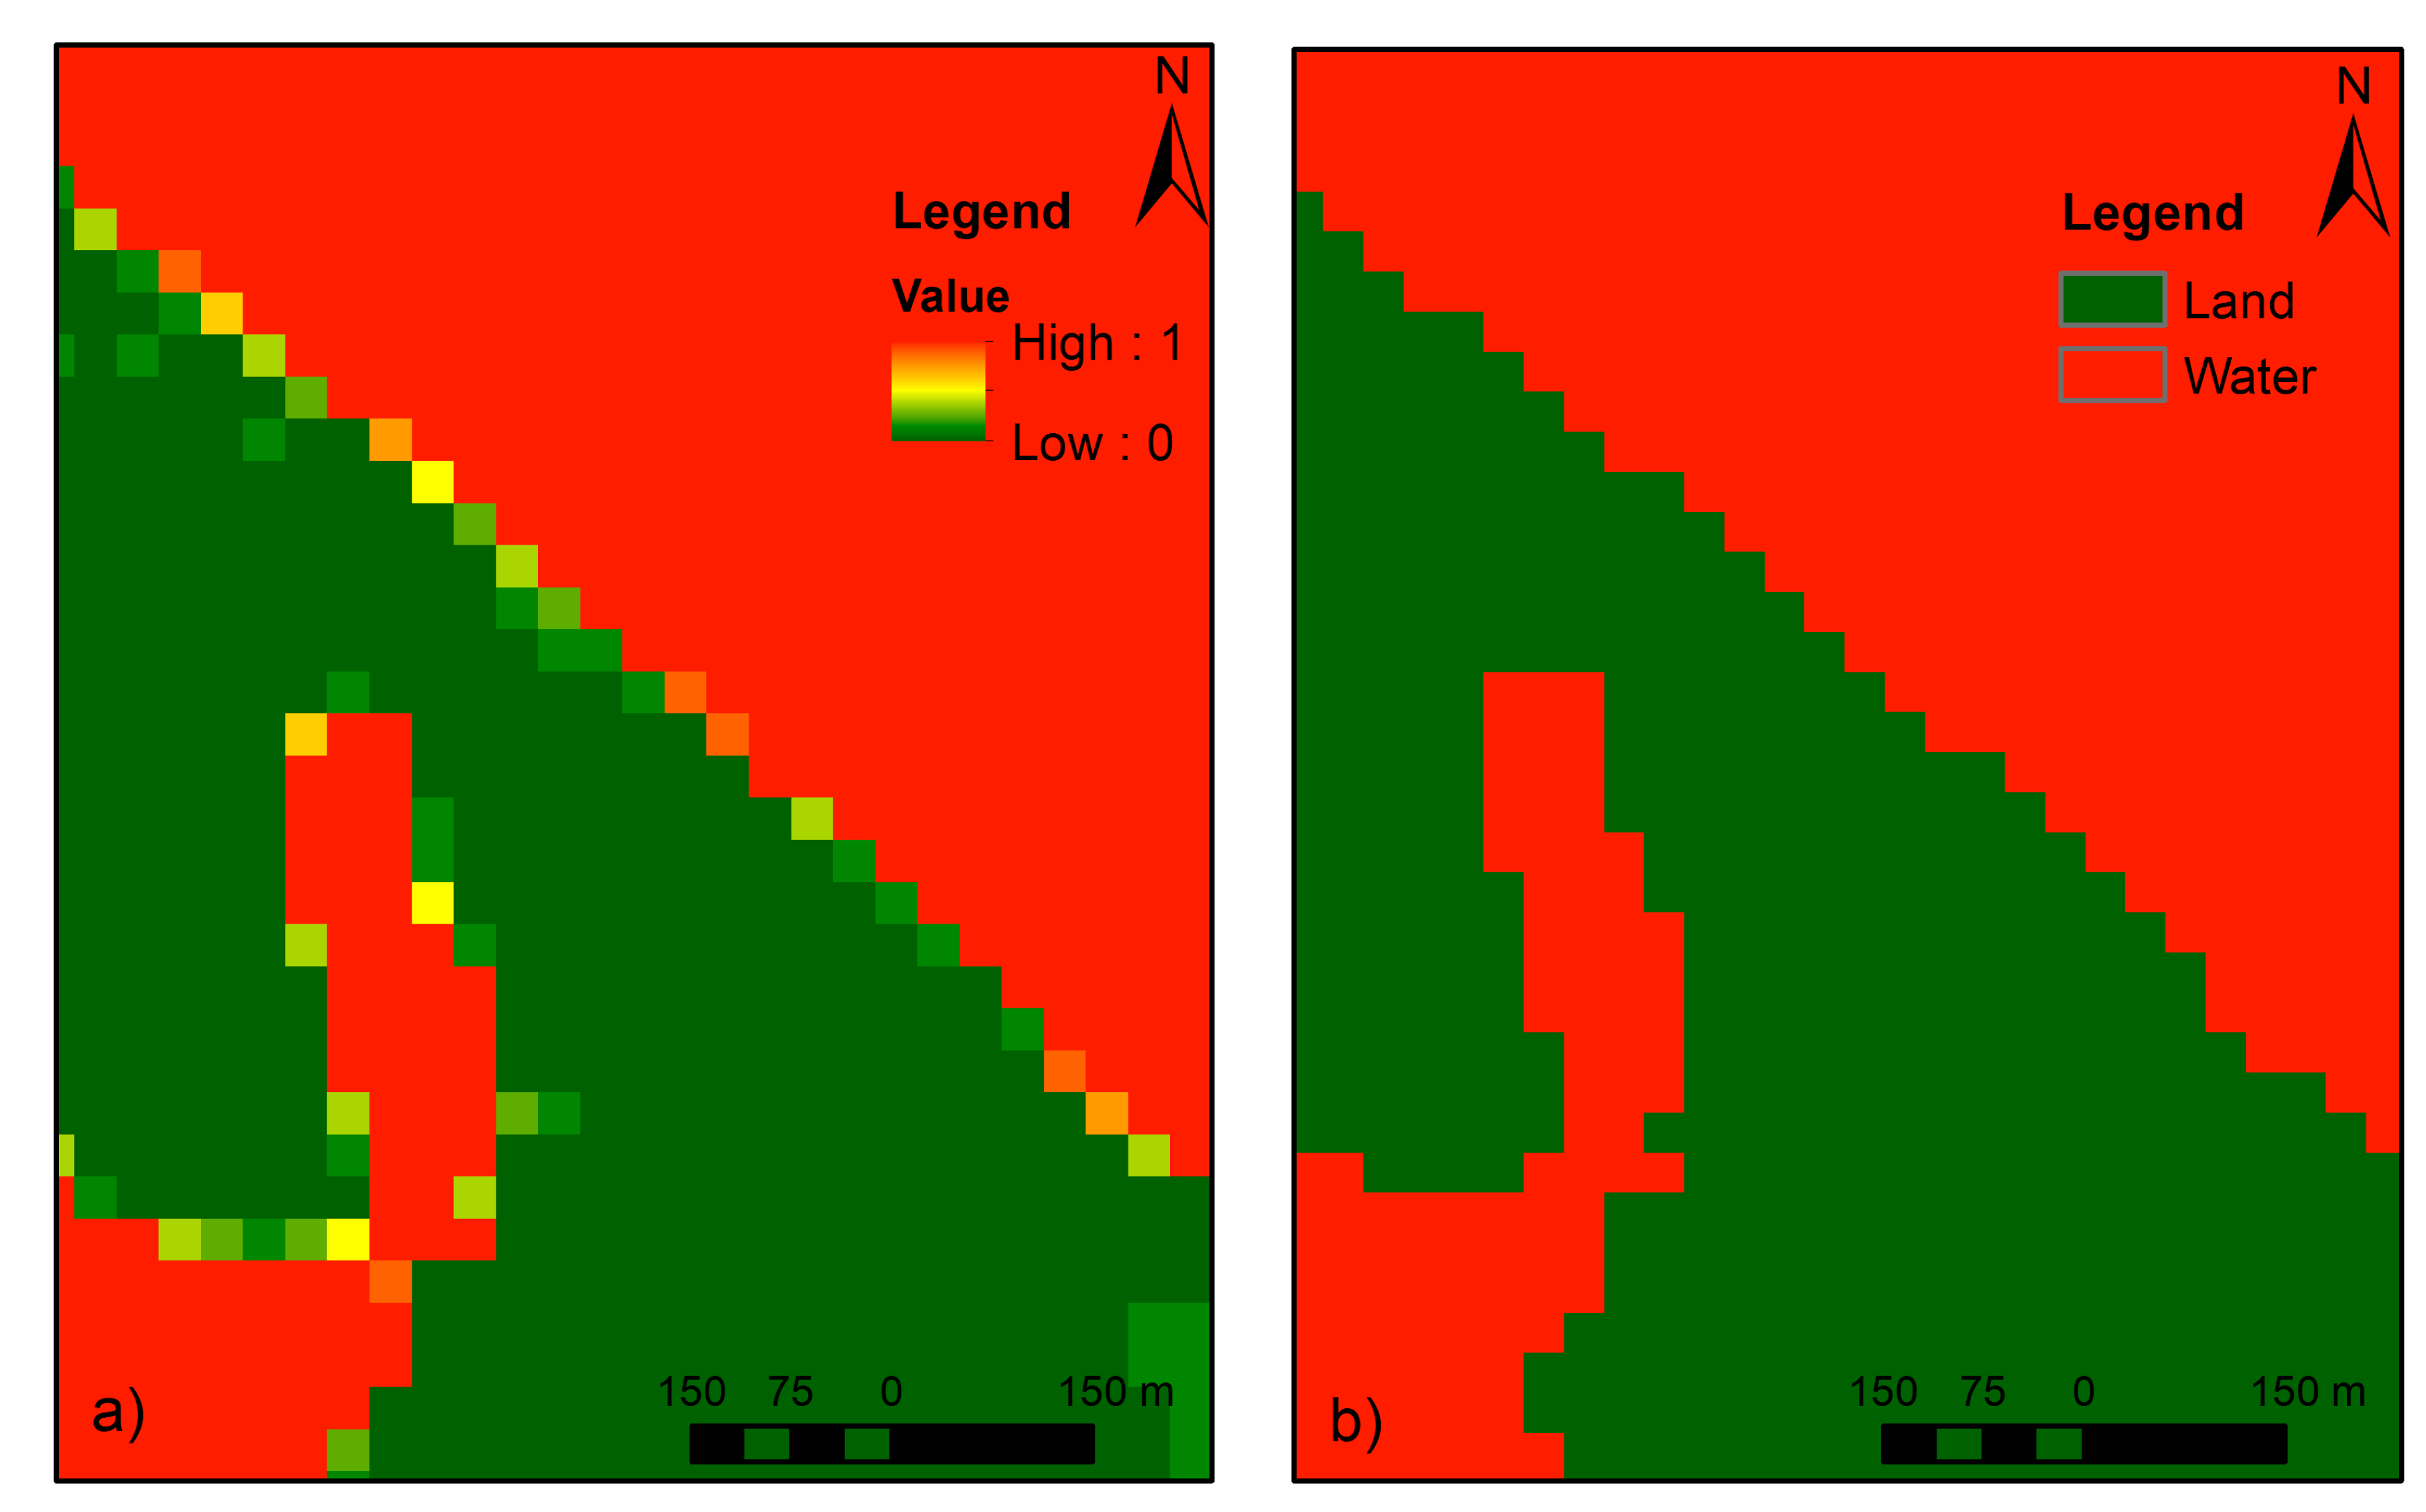
4.1. Analysis of Annual Land–Water Classification Map

The computation of the mNDWI was processed based on the satellite images in 1990, 1995, 2000, 2005, 2015, and 2019. Figure 6 is an example of the mNDWI map to detect surface water bodies in the Quang Nam province. As mentioned, the zero threshold was used to classify land and water regions.
The annual land–water classification maps for 7 years were generated using mNDWI and WFI indices. Figure 7 shows the WFI map and annual land–water classification map results in the northern part of the Cua Dai estuary. Hence, the annual coastlines (i.e., the boundary delineating land and water in the coastal region) of Quang Nam province in 1990, 1995, 2000, 2005, 2010, 2015, and 2019 were extracted using ArcGIS software (the cyan dotted line in Figure 8).

4.2. Long-Term Shoreline Evolution

The annual average coastlines (i.e., land vs. water boundary) extracted from the annual land–water classification maps were used to determine the shoreline change using DSAS. These annual maps were generated by adopting the WFI equation. It means the detected errors after were averaged and applied for sets of annual figures, which can minimize the impact of short-term coastal changes resulting from sea-level variations, wave run-up, and seasonal sedimentary changes in the beach profile. Specifically, using the median method allows us to solve a number of potential problems with the satellite images (e.g., data gaps in Landsat 7, residual noise and confounding factors not captured by pixel quality flagging, …). It is worthwhile to note that the uncertainty of coastline position is inverted to observation frequency. According to Xu [25], when the observation frequency reaches 30, the uncertainty of coastline position is only less than 1 m, while the uncertainty of coastline change rate is only less than 0.02 m/year. The numbers of satellite images used in our research in 2015 and 2019 are 29 and 61. Thus, the uncertainty of coastline position is just a few ten centimeters, although the pixel size of the satellite images is 10 m.
Once the Quang Nam province’s annual coastlines were determined, DSAS software was utilized to analyze the spatio-temporal coastline variation. Each coastline has attributes, including date, length, ID, and shape [19]. The baseline was created at a buffering distance of 500 m offshore away from the coastlines using the buffering method. This is the most reliable and accurate method for baseline demarcation [33], which is conducted by drawing around coastlines that encompass those merged coastlines. In total, 815 transects were created perpendicular to the baseline and along the coastline with 100 m transect spacing and 2500 m smoothing distance. Figure 9 shows an example of transects at the red-box area illustrated in Figure 8. The transects were numbered from 1 to 815, starting from the south (north of the Cua Lo estuary) to the north (Son Tra Island).
The mean annual rates of coastline change in Quang Nam province were spatially for the period 1990–2019 using EPR and LRR parameters (Figure 10). The results of EPR reveal that 49.2% (401 transects) of the coastline was in the erosional regime, and 50.8% (414 transects) of the coastline was under the accretional regime. The average coastline recession and accretion rates were −1.7 and 0.77 m/year, respectively. Based on the LRR results, transects 403 and 412, which accounted for 49.45% and 50.55% of all transects, were eroded and deposited, with average annual rates of −1.86 and 0.83 m/year, respectively.
Three parameters of R-squared value (LR2), the standard error of estimate (LSE), and the standard error of the slope (LCI90) are reported for each transect in order to provide information that helps assess the robustness of the computed regression rates. For example, the DSAS result for the transect ID of 509 has an EPR of −45 m/year from 1990 to 2019 (Figure 10). The linear regression was determined by plotting the shoreline positions with respect to time (in years) and the slope of the equation describing the line; the LRR is −42.41 m/year, and the LCI90 is 10.97. The band of confidence around the reported rate of change is −42.41 ± 10.97. In other words, the actual change rates are between −31.44 m/year and −53.38 m/year, with an LR2 of 0.92 and LSE of 140.97 m.
Figure 11 presents the values of EPR and LRR along the studied coast and indicates accretion (above the line of zero change) and erosion (beneath the line of zero change) areas. Throughout 30 years, the Quang Nam coast fluctuated considerably with both erosion and accretion mechanisms. The most varied coastlines concentrate limitedly at 45 to 55 km, close to the river mouth [34]. A maximum erosion rate of −42.4 m/year was observed at the north of Cua Dai estuary (at Transect 507). This result is a good agreement with the finding of Tuan et al. [35] and performs a similar tendency of retreat and advanced areas to the research of Tanaka et al. [36] and Fila et al. [37]. The causing mechanisms of the erosion processes, particularly around the Cua Dai estuary, were due to the Cham Islands’ geographic variables that affect prevailing wave climate at different locations along the coast.
It is also noted that the highest accretion was observed mainly at the northern part of Cua Lo (from Transects 1 to 16) and the south of Cua Dai (from Transects 479 to 502). Additionally, Figure 12 compares the rate of change obtained by the EPR and LRR for the Quang Nam coast. The obtained R2 = 0.96 illustrates a good correlation between EPR and LRR.

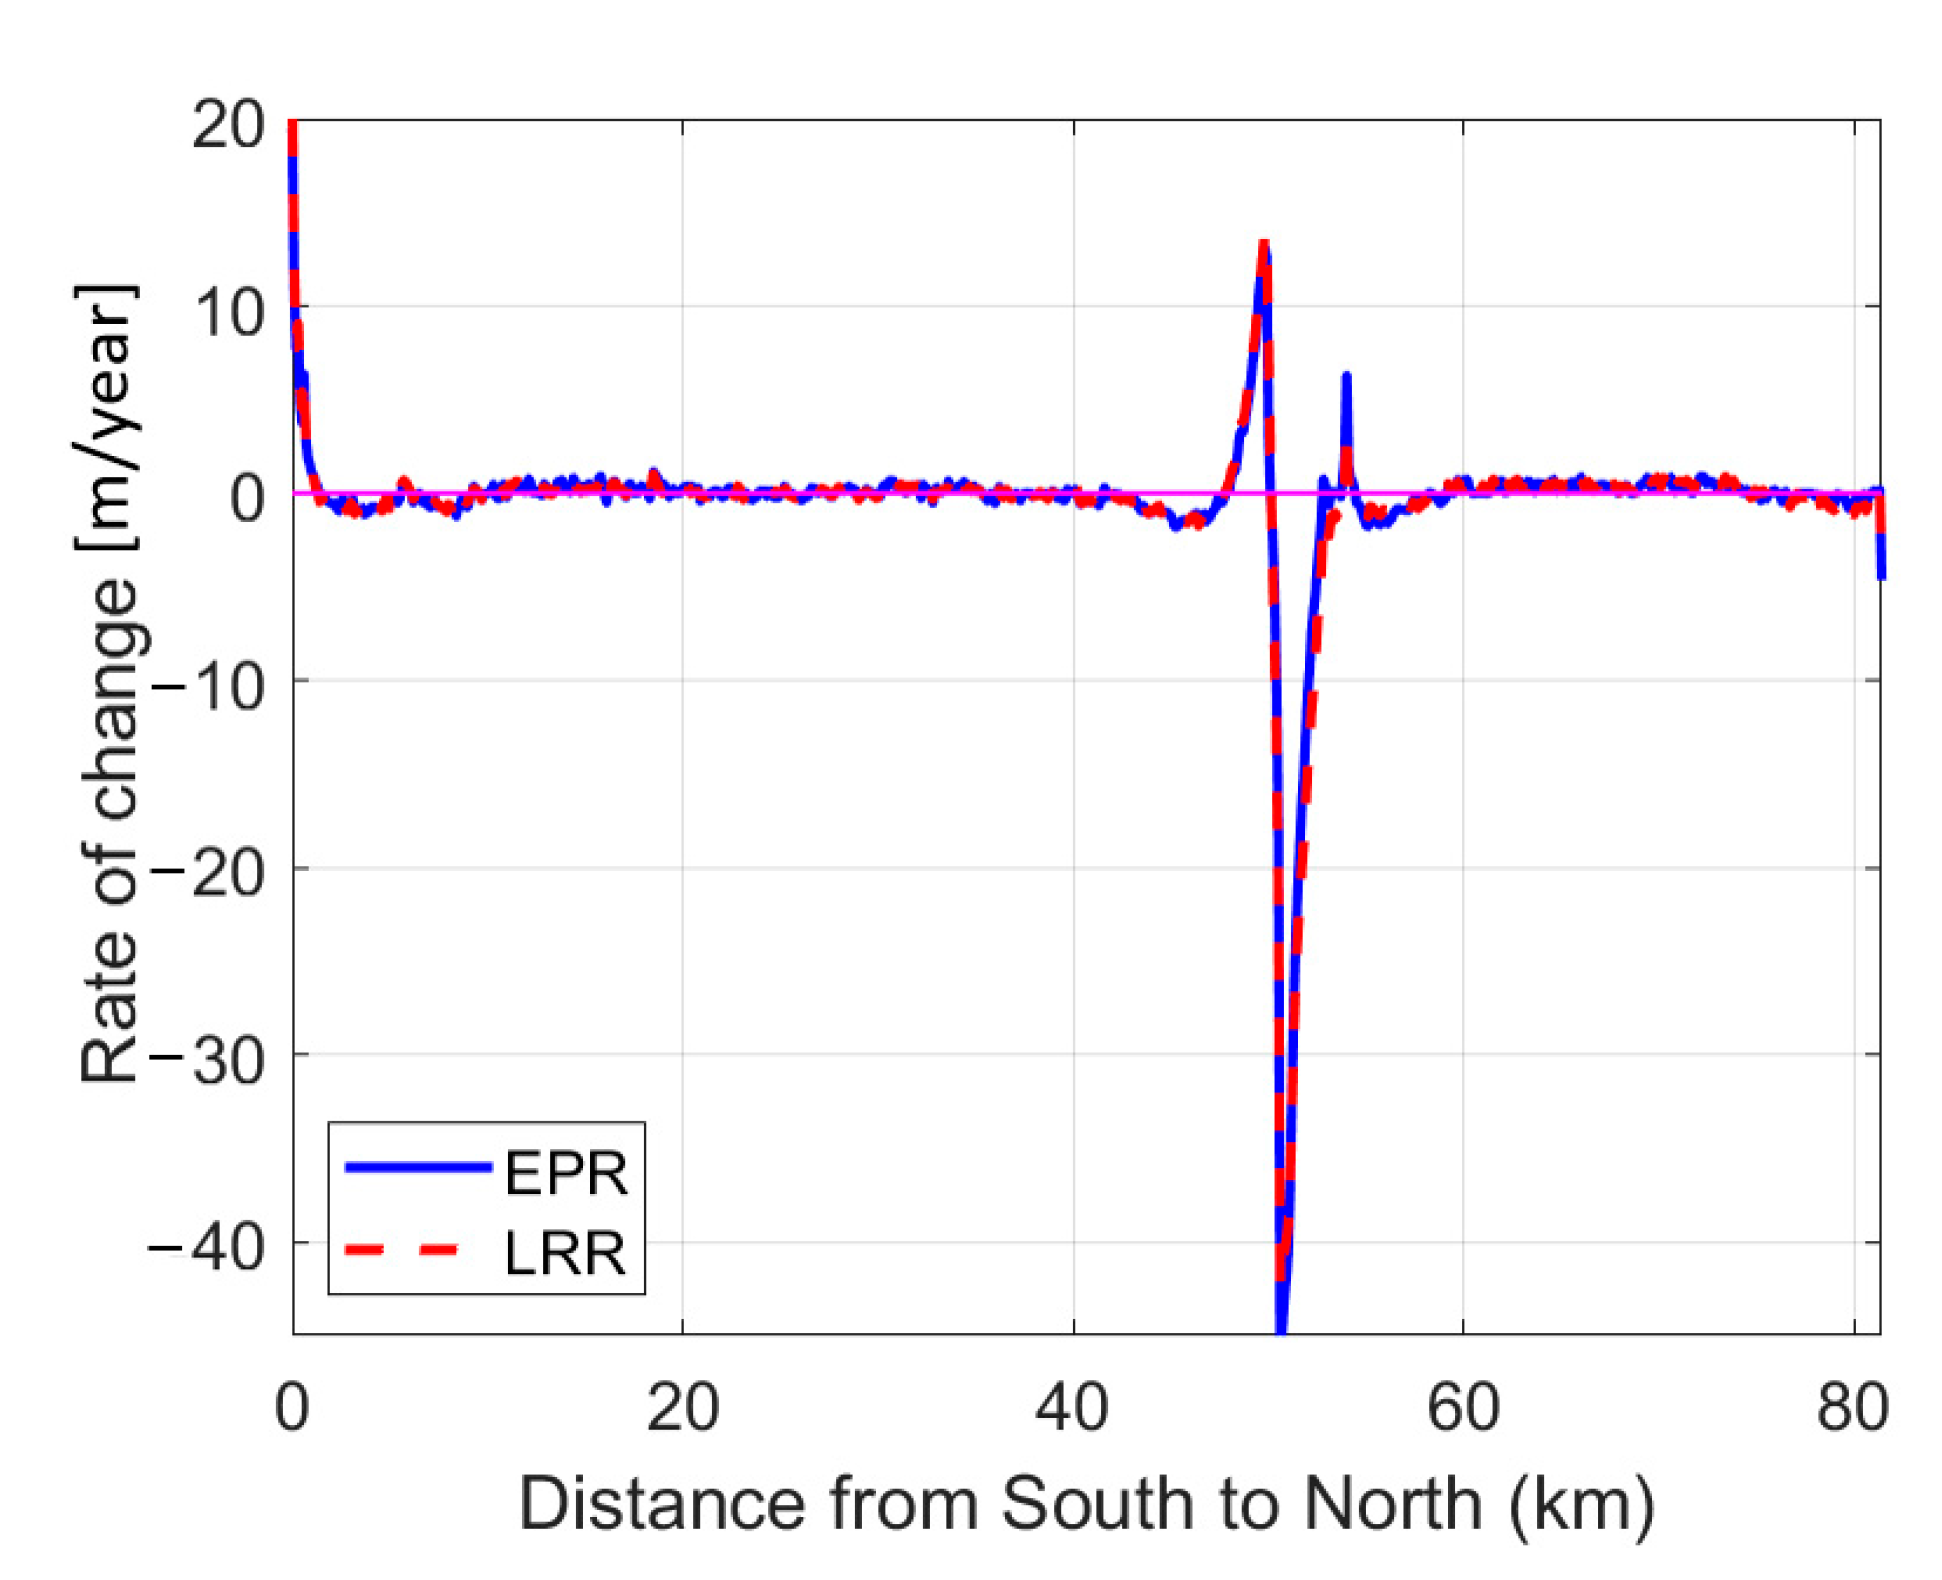
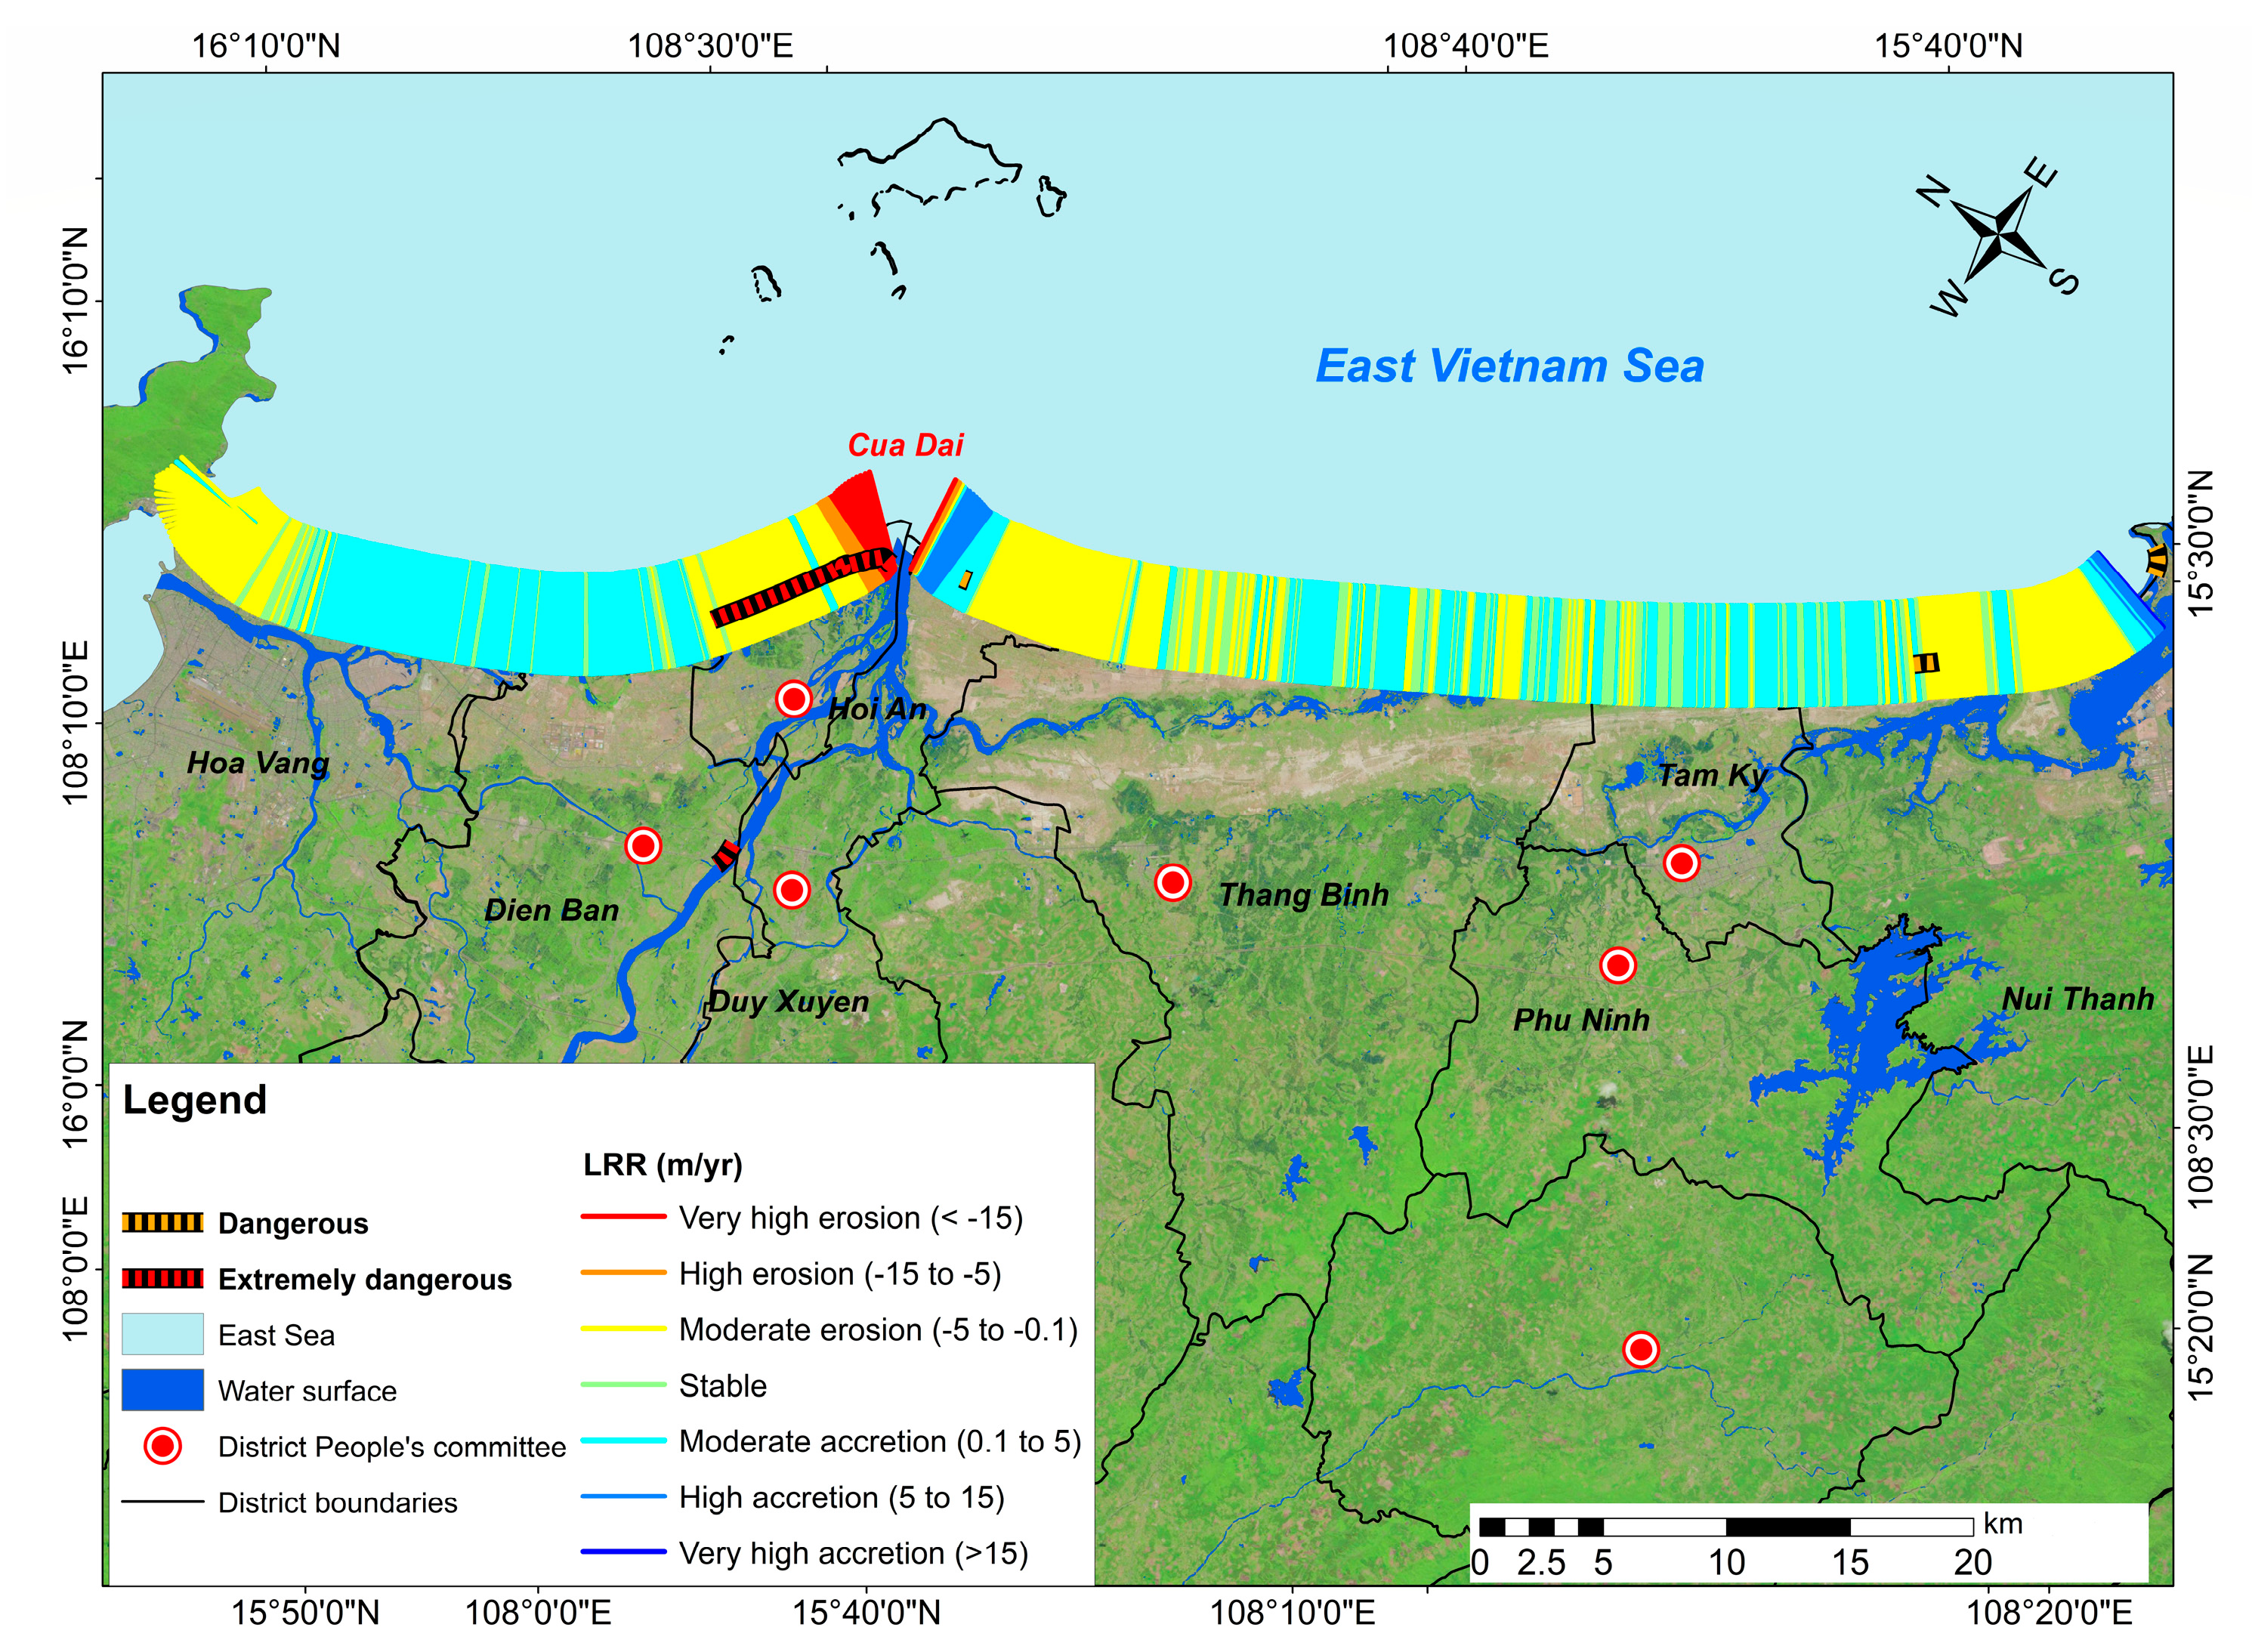
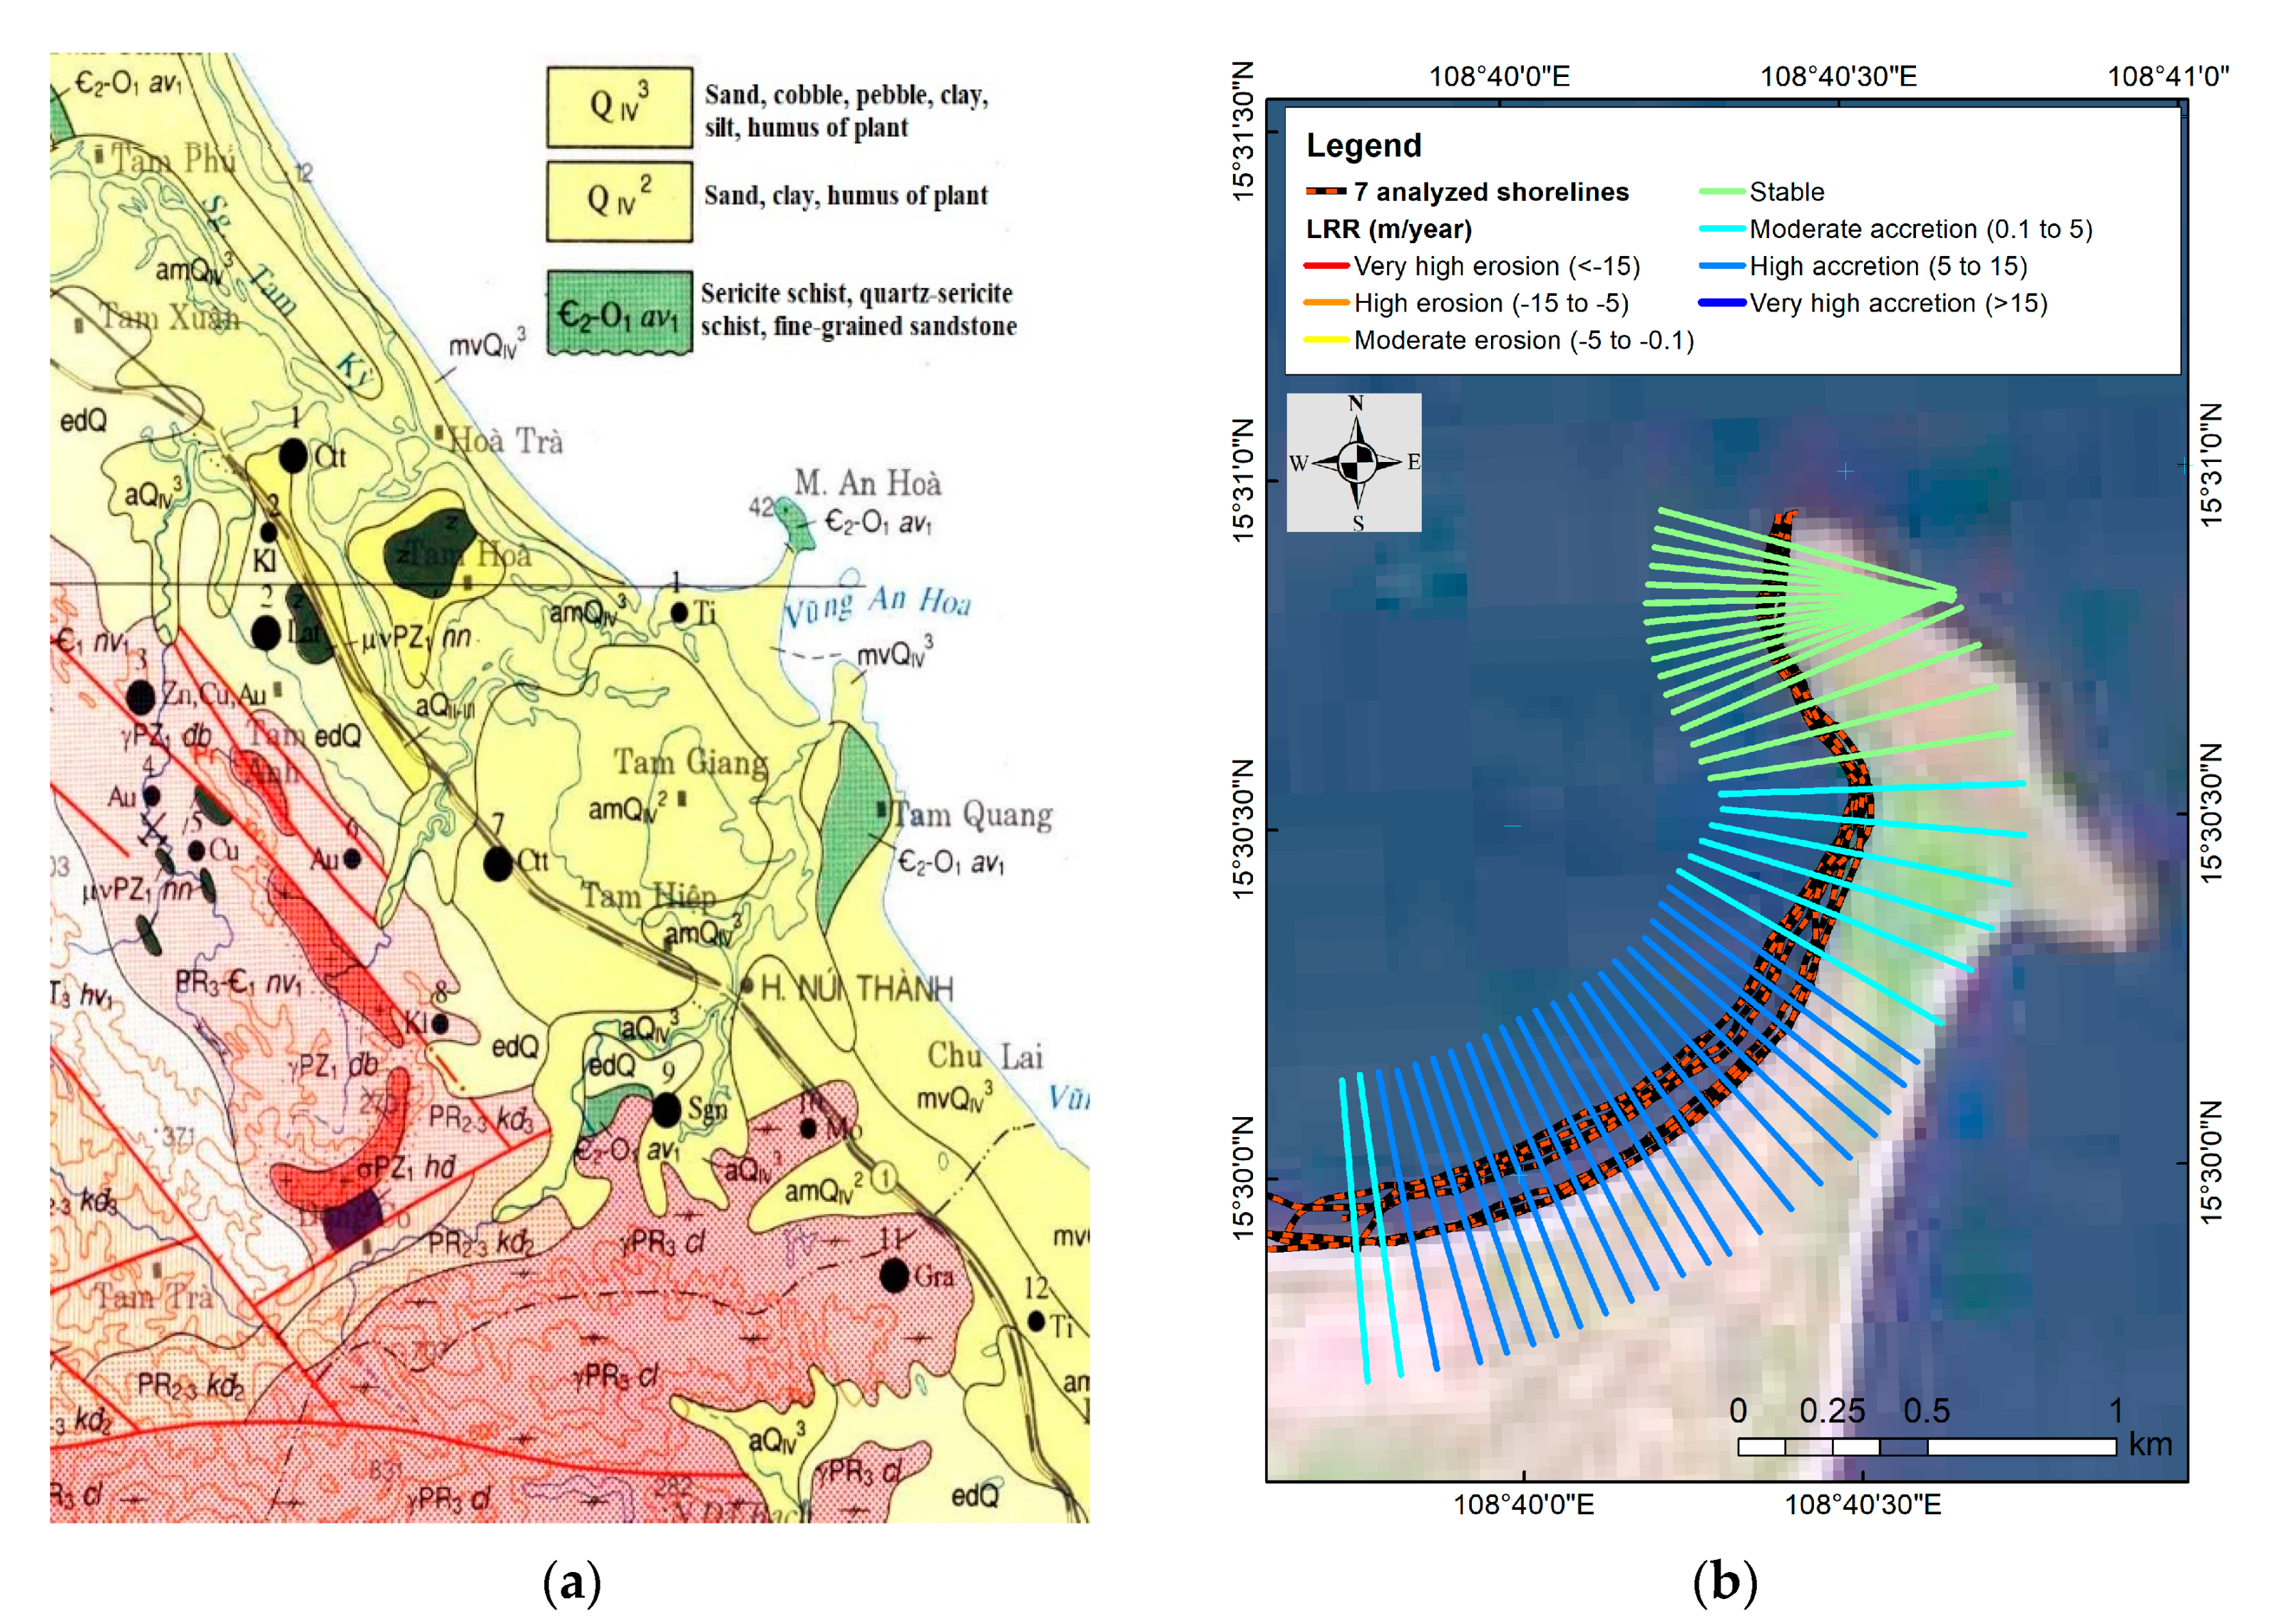
4.3. Spatial Pattern Variation Analysis of Coastline Change

Figure 13 shows the spatial variation results of the Quang Nam coastline by applying DSAS 5.0 software. Seven corresponding categories for different levels of erosion and accretion along the coast were computed, including very high erosion rate (<−15 m/year), high erosion (from −15 to −5 m/year), moderate erosion (from −5 to −0.1 m/year), stable (from −0.1 to 0.1 m/year), moderate accretion (from 0.1 to 5 m/year), high accretion (from 5 to 15 m/year), and very high accretion (>15 m/year). The result indicated both erosion and accretion phenomenon, marking severe morphological change along the studied area. Accretion is dominated mainly in the south part of the Cua Dai estuary at moderate to high accretion rates (from 0.1 to 15 m/year). Dien Ban, Tam Ky, and part of Thang Binh districts were accreted at moderate range only. The considerable land loss was observed in the northern part and a short segment in the south of the Thu Bon river mouth.
Meanwhile, locations far from the estuaries observed no significant shoreline variability. This result shows good agreement with the survey by Asplund and Malmstrom [38] and research using Google Earth images by Tanaka et al. [36]. More precisely, the survey and research results show that the eroded coastal length in the northern part of Cua Dai is nearly 8000 m (red dashed line in Figure 13), closely matching the DSAS calculation with 80 high and very high erosion transects. This result was also consistent with the landward coastal shift at the north bank of Cua Dai by JICA [39] (Figure 14).
Additionally, similar coastal erosion and accretion were alternately recorded in the Nui Thanh district. In the coastal part adjacent to Tam Ky city, the accretion process takes place, and the coastal area of Tam Tien (Nui Thanh) has a landslide with a length of about 800 m. The recorded erosion rate ranges from 1.23 to −0.27 m/year. This value is also relatively consistent with analysis focusing on the Nui Thanh coast by Huynh et al. [36].
Over the past 30 years, the world’s coastline has been dominated by sandy shores [37], and the Quang Nam coast is no exception. Quang Nam coast is accreted by a composition of sand, cobble, pebble, clay, and silt, making this area the most vulnerable to changes in the coastline. Therefore, in addition to natural processes (e.g., wind, waves, currents, and tides), the anthropogenic activities and geological features also caused shoreline evolutions in the study area. To clarify the human-impacted point, DSAS was also applied to the coastline on the southern coast of Cua Lo (see Figure 1 for its location). The result indicated that the migration of sand deposits in the Cua Lo area is similar to that of other sections of the Quang Nam coast, except for the An Hoa cape (Figure 15a), since the geological characteristic of An Hoa cape mainly consists of a rocky headland.

4.4. Temporal Pattern Variation Analysis of Coastline Change

Temporal variation of the Quang Nam shoreline was further analyzed, focusing on the coastline in the northern part of Cua Dai where a remarkable morphological change has happened. In order to show a different pattern of the coastline rate in terms of EPR indicators, more than 80 transects over 6 sub-periods along the northern part of the Cua Dai estuary were drawn to evaluate the movement as temporal analysis, in which Transect 80 is the closest position to Cua Dai estuary. Figure 16 depicts the overall analyzed results from 1990 to 2019. From Transects 0 to 40, the shoreline experienced a slightly moderate to high erosion rate ranging from 0.1 to nearly 10 m/year. However, the shoreline location near the river mouth has an erosion-dominated trend at a very high rate over a long period, as seen from Transects 40 to 80 in Figure 16.
In particular, during the very first period from 1990 to 2000, about ten transects at the north of Cua Dai estuary were severely eroded at the rate of −45 m/year. However, the orthogonal line from 10–20 at the same period was characterized by accretion at a rate of +30 m/year. According to Tuan et al. [35], a 690 m long sand spit on the northern bank of the Cua Dai appeared in 1990, then disappeared and moved toward the westside in 2000. According to Do et al. [38], the shoreline change from 1988 to 1995 was related to the development of the sand terrace and river sediment supply since there were no dam or hydropower plants at that time. In the 2000–2005 period, the accretion phenomenon was observed limitedly over 2 km from the estuary to the left with an average rate of 4.5 m/year. Then, erosion increased severely, in which Transects 0 to 10 demonstrate nearly 40 m/year coastline retreat. The erosion trend dominantly happened in the following periods; this phenomenon was observed at Transects 10 to 20 from 2005 to 2010, lower than the previous period by only 10 m/year. Transects from 20 to 40 also experienced erosion tendency, although the EPR values are not considerable. From 2010 to 2015, the shoreline was more stable; only a short segment near the river mouth showed retreat, similar to the results of Do’s research [40].
Several mechanisms could be associated with this rapid erosion, including human activities on river basins such as dam and hydropower constructions, which led to the reduction of sediment to the estuary areas [41]. Moreover, the artificial resort’s seawall and groin could also cause severe coastal erosion because it interrupted the dominant longshore sediment transport [39]. For instance, severe erosion happened at the segment where the Golden Sand resort’s groin and Sunrise resort’s seawall were constructed (Figure 17).
According to Asplund and Malmström’s findings and field survey [38], the shoreline retreat trend was stable after the resorts built a revetment of rubble, L-shaped groin, and T-shaped geo-tubes to protect their coastline. Therefore, the 2015–2019 period is considered a more stable period.
From the investigation, DSAS showed the synthetic performance to obtain speedily and precisely the rate of shoreline change in the statistical analysis.

5. Conclusions

The present study investigated the long-term spatio-temporal shoreline evolution along the Quang Nam coast using satellite images over 30 years (1990–2019) by DSAS software. There a total of 127 multi-temporal satellite images were collected for the analysis. The assessment of shoreline changes was divided into six sub-periods over 30 years. The average coastline recession/accretion rates for the Quang Nam coast obtained by EPR and LRR were −1.7/0.77 and −1.86/0.83 m/year, respectively. Additionally, DSAS is also a productive software since it provides supplemental statistics, e.g., LR2, LSE, and LCI90 parameters, that help assess the robustness of the computed regression rates. The band of confidence around the reported rate of change is −42.4 ± 10.97 m/year, with an LR2 of 0.92 and LSE of 140.97 m.
The spatio-temporal shoreline evolution results have shown that the north area of Cua Dai was eroded with a high to very high speed, while the south only recorded a very short period of erosion and then accretion. In addition, the temporal shoreline evolution results revealed that the severe shoreline changes at the Cua Dai estuary were highly associated with the first dam construction in 1997. The mechanisms of shoreline evolution in the Quang Nam province were caused by a combination of natural processes (flood, monsoon wave climate, storm wave, tides) and human activities (hydropower plants, jetties, groin, seawall). Moreover, the artificial resort’s seawall and groin could cause severe coastal erosion because it interrupted the dominant longshore sediment transport.
Quang Nam province has been planned as the center of socio-economic development and tourism for the central region of Vietnam. In particular, the development of the marine economy is one of the priority tasks. Therefore, the outcomes of this study provide important information for the local coastal authority in, for example, establishing a safety buffer zone for the construction of resorts and ensuring sustainable economic development.

Author Contributions

D.N.Q. and V.H.N. wrote the first draft of the manuscript, performed the data collection and analysis, and prepared the figures and the literature review. H.T., N.T.V., H.S.T. and N.X.T. designed, supervised, and contributed to interpreting the results. All authors have read and agreed to the published version of the manuscript.

Funding

This study received no financial support for the research.

Institutional Review Board Statement

Not applicable.

Informed Consent Statement

Not applicable.

Data Availability Statement

Not applicable.

Acknowledgments

The authors would like to express sincere gratitude to the anonymous reviewers for their valuable comments and suggestions, which have helped to improve the quality of the revised manuscript.

Conflicts of Interest

The authors declare no conflict of interest.

References

  1. Cai, F.; Su, X.; Liu, J.; Li, B.; Lei, G. Coastal erosion in China under the condition of global climate change and measures for its prevention. Prog. Nat. Sci. 2009, 19, 415–426. [Google Scholar] [CrossRef]
  2. Raj, N.; Gurugnanam, B.; Sudhakar, V.; Francis, P.G. Estuarine shoreline change analysis along The Ennore river mouth, south east coast of India, using digital shoreline analysis system. Geod. Geodyn. 2019, 10, 205–212. [Google Scholar]
  3. Dereli, M.A.; Tercan, E. Assessment of Shoreline Changes using Historical Satellite Images and Geospatial Analysis along the Lake Salda in Turkey. Earth Sci. Inform. 2020, 13, 709–718. [Google Scholar] [CrossRef]
  4. Addo, K.A.; Jayson-Quashigah, P.N.; Kufogbe, K.S. Quantitative Analysis of Shoreline Change Using Medium Resolution Satellite Imagery in Keta, Ghana. Mar. Sci. 2011, 1, 1–9. [Google Scholar] [CrossRef] [Green Version]
  5. Eludoyin, O.S.; Oduore, T.; Obafemi, A.A. Spatio-Temporal Analysis of Shoreline Changes in Bonny Island, Nigeria. Ethiop. J. Environ. Stud. Manag. 2012, 5, 123–130. [Google Scholar] [CrossRef]
  6. Purkis, S.J.; Gardiner, R.; Johnston, M.W.; Sheppard, C.R.C. A half-century of coastline change in Diego Garcia – The largest atoll island in the Chagos. Geomorphology 2016, 261, 282–298. [Google Scholar] [CrossRef]
  7. Gómez-Pazo, A.; Pérez-Alberti, A.; Otero Pérez, X.L. Recent Evolution (1956–2017) of Rodas Beach on the Cíes Islands, Galicia, NW Spain. J. Mar. Sci. Eng. 2019, 7, 125. [Google Scholar] [CrossRef] [Green Version]
  8. Huang, C.; Chen, Y.; Zhang, S.; Wu, J. Detecting, Extracting, and Monitoring Surface Water From Space Using Optical Sensors: A Review. Rev. Geophys. 2018, 56, 333–360. [Google Scholar] [CrossRef]
  9. Herndon, K.; Muench, R.; Cherrington, E.; Griffin, R. An Assessment of Surface Water Detection Methods for Water Resource Management in the Nigerien Sahel. Sensors 2020, 20, 431. [Google Scholar] [CrossRef] [Green Version]
  10. Li, J.; Roy, D.P. A Global Analysis of Sentinel-2A, Sentinel-2B and Landsat-8 Data Revisit Intervals and Implications for Terrestrial Monitoring. Remote Sens. 2017, 9, 902. [Google Scholar] [CrossRef] [Green Version]
  11. Garcia Rubio, G.; Huntley, D.; Kingston, K.; Esteves, L. Shoreline Identification Using Satellite Images. In Proceedings of the Coastal Dynamics: Impacts of Human Activities on Dynamic Coastal Processes, Tokyo, Japan, 7–11 September 2009; pp. 1–10. [Google Scholar]
  12. Bangalore, M.; Smith, A.; Veldkamp, T. Exposure to Floods, Climate Change, and Poverty in Vietnam. Econ. Disasters Clim. Change 2019, 3, 79–99. [Google Scholar] [CrossRef] [Green Version]
  13. Duong, L.H.; Dong, T.M.H. East Sea-Natural Resources in Vietnam. Eur. J. Eng. Res. Sci. 2019, 4, 65–69. [Google Scholar] [CrossRef] [Green Version]
  14. Thanh, T.D.; Tien, P.H.; Cu, N.V.; Nam, B.V. Current status of coastal erosion in Vietnam and controlling orientation. Vietnam Coast. Eros. Conf. Proc. 2018, 5–17. [Google Scholar]
  15. Trung Viet, N.; Xiping, D.; Thanh Tung, T. Identification of Erosion-Accretion Causes and Regimes Along the Quang Nam Coast, Vietnam. In Proceedings of the APAC 2019; Springer: Singapore, 2020; pp. 809–814. [Google Scholar]
  16. Luu, C.; Von Meding, J. A flood risk assessment of Quang Nam, Vietnam using spatial multicriteria decision analysis. Water 2018, 10, 461. [Google Scholar] [CrossRef]
  17. Pham, H.T.; Nguyen, V.C. Forecasting the Erosion and Sedimentation in the Coastal and River Mouth Areas and Preventive Measures; Technical Report; State Level Research Project: Hanoi, Vietnam, 2005; p. 487. [Google Scholar]
  18. Le, D.M.; Pham, B.T.; Tran, V.B. Erosion features along Cua Dai beach, Hoi An city, Quang Nam province, Viet Nam. Collect. Mar. Res. Works 2018, 23, 21–31. [Google Scholar]
  19. Himmelstoss, E.A.; Henderson, R.E.; Kratzmann, M.G.; Farris, A.S. Digital Shoreline Analysis System (DSAS) Version 5.0 User Guide; Open-File Report 2018–1179; U.S. Geological Survey: Reston, VA, USA, 2018.
  20. Boak, E.H.; Turner, I. Shoreline Definition and Detection: A Review. J. Coast. Res. 2005, 21, 688–703. [Google Scholar] [CrossRef] [Green Version]
  21. McFEETERS, S.K. The use of the Normalized Difference Water Index (NDWI) in the delineation of open water features. Int. J. Remote Sens. 1996, 17, 1425–1432. [Google Scholar] [CrossRef]
  22. Xu, H. Modification of normalised difference water index (NDWI) to enhance open water features in remotely sensed imagery. Int. J. Remote Sens. 2006, 27, 3025–3033. [Google Scholar] [CrossRef]
  23. Feyisa, G.L.; Meilby, H.; Fensholt, R.; Proud, S.R. Automated Water Extraction Index: A new technique for surface water mapping using Landsat imagery. Remote Sens. Environ. 2014, 140, 23–35. [Google Scholar] [CrossRef]
  24. Fisher, A.; Flood, N.; Danaher, T. Comparing Landsat water index methods for automated water classification in eastern Australia. Remote Sens. Environ. 2016, 175, 167–182. [Google Scholar] [CrossRef]
  25. Xu, N. Detecting Coastline Change with All Available Landsat Data over 1986–2015: A Case Study for the State of Texas, USA. Atmosphere 2018, 9, 107. [Google Scholar] [CrossRef] [Green Version]
  26. Quang, D.N.; Linh, N.K.; Tam, H.S.; Viet, N.T. Remote sensing applications for reservoir water level monitoring, sustainable water surface management, and environmental risks in Quang Nam province, Vietnam. J. Water Clim. Change 2021. [Google Scholar] [CrossRef]
  27. Jackson, C.W.; Alexander, C.R.; Bush, D.M. Application of the AMBUR R package for spatio-temporal analysis of shoreline change: Jekyll Island, Georgia, USA. Comput. Geosci. 2012, 41, 199–207. [Google Scholar] [CrossRef]
  28. Kabir, M.A.; Salauddin, M.; Hossain, K.T.; Tanim, I.A.; Saddam, M.M.H.; Ahmad, A.U. Assessing the shoreline dynamics of Hatiya Island of Meghna estuary in Bangladesh using multiband satellite imageries and hydro-meteorological data. Reg. Stud. Mar. Sci. 2020, 35, 101167. [Google Scholar] [CrossRef]
  29. Oyedotun, T. Shoreline geometry: DSAS as a tool for Historical Trend Analysis. Geomorphol. Tech. 2014, 3, 1–12. [Google Scholar]
  30. Tran Thi, V.; Tien Thi Xuan, A.; Phan Nguyen, H.; Dahdouh-Guebas, F.; Koedam, N. Application of remote sensing and GIS for detection of long-term mangrove shoreline changes in Mui Ca Mau, Vietnam. Biogeosciences 2014, 11, 3781–3795. [Google Scholar] [CrossRef] [Green Version]
  31. Nassar, K.; Mahmod, W.E.; Fath, H.; Masria, A.; Nadaoka, K.; Negm, A. Shoreline change detection using DSAS technique: Case of North Sinai coast, Egypt. Mar. Georesour. Geotechnol. 2019, 37, 81–95. [Google Scholar] [CrossRef]
  32. Yulianto, F.; Suwarsono, S.; Maulana, T.; Khomarudin, R. The dynamics of shoreline change analysis based on the integration of remote sensing and geographic information system (GIS) techniques in Pekalongan coastal area, Central Java, Indonesia. J. Degraded Min. Lands Manag. 2019, 6, 1789–1802. [Google Scholar] [CrossRef] [Green Version]
  33. Nandi, S.; Ghosh, M.; Kundu, A.; Dutta, D.; Baksi, M. Shoreline shifting and its prediction using remote sensing and GIS techniques: A case study of Sagar Island, West Bengal (India). J. Coast. Conserv. 2016, 20, 61–80. [Google Scholar] [CrossRef]
  34. Duy, D.; Tanaka, H.; Viet, N. Shoreline Changes In A Wide Area On Both Sides Of The Cua Dai River Mouth, Vietnam. J. Jpn. Soc. Civ. Eng. Ser B3 Ocean Eng. 2016, 72, I_886–I_891. [Google Scholar]
  35. Quang Tuan, N.; Cong Tin, H.; Quang Doc, L.; Anh Tuan, T. Historical Monitoring of Shoreline Changes in the Cua Dai Estuary, Central Vietnam Using Multi-Temporal Remote Sensing Data. Geosciences 2017, 7, 72. [Google Scholar] [CrossRef] [Green Version]
  36. Tanaka, H.; Duy, D.; Viet, N. Evaluation of Longshore Sediment Transport along the Cua Dai Delta Coastline. In Proceedings of the Vietnam-Japan Workshop on Estuaries, Coasts and Rivers 2017, Hoi An, Vietnam, 20–21 September 2017; pp. 7–14. [Google Scholar]
  37. Fila, J.; Kampen, M.; Knulst, K.; Marijnissen, R.; Noort, R.V. Coastal erosion Hoi An. In Multidisciplinary Project Report; Delft University of Technology: Delft, The Netherlands, 2016; p. 168. [Google Scholar]
  38. Asplund, E.; Malmström, H. Coastal Erosion in the Region of Thu Bon River Mouth, Vietnam. Master’s Thesis, Lund University, Lund, Sweden, 2018; p. 103. [Google Scholar]
  39. JICA. Data Collection Survey on Basin-based Comprehensive Sediment Management in River Systems of the Central Region in Vietnam. Technical Report: Hanoi, Vietnam, 2018; p. 137. Available online: https://openjicareport.jica.go.jp/pdf/12319042.pdf (accessed on 18 July 2021).
  40. Do, A.; Vries, S.; Stive, M. Beach Evolution Adjacent to a Seasonally Varying Tidal Inlet in Central Vietnam. J. Coast. Res. 2018, 34, 6–25. [Google Scholar] [CrossRef] [Green Version]
  41. Veettil, B.K.; Costi, J.; Marques, W.C.; Tran, X.-L.; Quang, N.X.; Van, D.D.; Hoai, P.N. Coastal environmental changes in Southeast Asia: A study from Quang Nam Province, Central Vietnam. Reg. Stud. Mar. Sci. 2020, 39, 101420. [Google Scholar] [CrossRef]
Figure 1. Location of the study area with an overlapped Landsat scene on 9 September, 2019 (source: https://earthexplorer.usgs.gov/, accessed on 8 July 2021).
Jmse 09 01124 g001
Figure 2. Re-analysis wave characteristics at point P on Figure 1 from the WAVEWATCHII data sets (source: https://polar.ncep.noaa.gov/waves/hindcasts/nopp-phase2.php, accessed on 11 April 2021) for all seasons, Winter, and Summer.
Jmse 09 01124 g002
Figure 3. Number of satellites and frequency of images used in the research.
Jmse 09 01124 g003
Figure 4. Flowchart of the research.
Jmse 09 01124 g004
Figure 5. Illustration for the EPR and NSM parameters in DSAS.
Jmse 09 01124 g005
Figure 6. (a) An example of the mNDWI map and (b) land–water classification map of Quang Nam province on 4 July, 2019.
Jmse 09 01124 g006
Figure 7. (a) An example of producing the WFI map and (b) annual land–water classification map in the northern part of Cua Dai estuary in 2019.
Jmse 09 01124 g007
Figure 8. The annual coastline of Quang Nam province in 2019.
Jmse 09 01124 g008
Figure 9. A 2019 example of the baseline and transects at the red-box in Figure 8 along the Quang Nam coast.
Jmse 09 01124 g009
Figure 10. Example of DSAS supplemental statistics for Transect ID 509, with blue dots as the measurement point in each year and their distance from the baseline to the intersection point; red dash presents the best-fit slope (regression line of transect); LRR is computed by the sum of squared residuals. The slope of the equation describing the line is the rate. (a) the LSE values and (b) LCI90 points.
Jmse 09 01124 g010
Figure 11. Quantified coastline change rates by EPR and LRR for Quang Nam coast.
Jmse 09 01124 g011
Figure 12. Comparison of rate of change obtained by the EPR and LRR for the Quang Nam coast.
Jmse 09 01124 g012
Figure 13. Spatial variation of Quang Nam coastline by using DSAS technique.
Jmse 09 01124 g013
Figure 14. Imbalance of longshore sediment supply at Cua Dai estuary [39].
Jmse 09 01124 g014
Figure 15. (a) Geological map (source: Vietnam Geological Survey Institution) and (b) spatial variation of the coastline from Cua Lo estuary to An Hoa cape.
Jmse 09 01124 g015
Figure 16. Temporal variation of north Cua Dai over six sub-periods, with Transect 0 starting from Cua Dai estuary (with the shadow of each line indicates the standard deviation error).
Jmse 09 01124 g016
Figure 17. Construction of groins and seawall in front of resorts along the northern Cua Dai.
Jmse 09 01124 g017
Table 1. Satellite image attributes [26] and spectral bands applied for computing mNDWI.
Satellite ImageNumber
of Bands
Spatial Resolution (m)Revisit Time
(Days)
Type of
Sensors
Current
Status
Green Band (Green)MIR
Landsat 4–5730–12016MSS and TMEnded on 2013Band 2Band 4
Landsat 7815–6016ETM +OperationalBand 2Band 5
Landsat 81130–10016OLI and TIRSOperationalBand 3Band 6
Sentinel-21310–6010 for individual (5 days when combines A and B sensors)MSIOperationalBand 8Band 4
Publisher’s Note: MDPI stays neutral with regard to jurisdictional claims in published maps and institutional affiliations.

