Article

Incorporating Species-Conditional Co-Occurrence When Selecting Indicator Species to Monitor Restoration after Mangrove Removal from the Siangshan Wetland, Taiwan

1
Fisheries College, Jimei University No. 185 Yinjiang Rd., Jimei District, Xiamen 361021, China
2
Fujian Provincial Key Laboratory of Marine Fishery Resources and Eco-Environment, Xiamen 361021, China
3
Taiwan Wetland Society, Hsinchu 300, Taiwan
4
Department of Leisure & Tourism Management, Shu-Te University, Kaohsiung 824, Taiwan
5
Institute of Fisheries Science, College of Life Science, National Taiwan University, Taipei 106, Taiwan
*
Author to whom correspondence should be addressed.
J. Mar. Sci. Eng. 2021, 9(10), 1044; https://doi.org/10.3390/jmse9101044
Submission received: 4 September 2021 / Revised: 17 September 2021 / Accepted: 18 September 2021 / Published: 23 September 2021
(This article belongs to the Special Issue Interannual Variation of Planktonic Species and Fish Populations)

Abstract

:
This paper presents an approach for incorporating species-conditional co-occurrence into models used for the selection of marine indicator species. Mangrove invasion within the Siangshan Wetland in Hsinchu, Taiwan, has changed the original structures and functions of habitats for benthic organisms. The Hsinchu City Government ran a large-scale mangrove removal project from October 2015 to March 2016 to restore the wetland. From October 2015 to September 2016, we investigated the biological effects of mangrove removal on benthic crabs and their adjacent habitats. Density, number of species, Shannon–Weaver index (H′) and Palou’s evenness index (J′) were calculated and compared between mangrove and non-mangrove regions. The results showed that values for these attributes in the non-mangrove regions were higher than those of the mangrove regions. After mangrove removal, species returned to their original habitats and the related density increased significantly. Using conditional co-occurrence algorithms, we identified five indicator species (Mictyris brevidactylus, Macrophthalmus banzai, Uca arcuata, Uca lacteal and Uca borealis) with high co-occurrence probabilities, whose population responses provided direct evidence of the benefits of mangrove removal for wetland restoration. The results indicate that mangrove removal is an appropriate habitat rehabilitation strategy for benthic organisms, and that the chosen indicator species may provide valuable ecological information for coastal managers seeking to control the spread of mangroves.

1. Introduction

Biological indicators are widely used to assess the effects of environmental impact or biological restoration [1,2,3,4,5,6]. Generally, indicator species (IS) are used to monitor environmental changes, assess the efficacy of management and provide warning signals for impending ecological shifts [7]. Most IS studies only use a single species as an indicator, and the rest use species groups as indicators [7]. IS, also termed umbrella [8,9,10], keystone [8,10,11,12], flagship [8,10,11] or foundation species [12], are living organisms that are easily monitored and whose status reflects or predicts the conditions of their environment [6,13,14,15,16]. In other words, the concept of IS is based on the hypothesis that the effects of environmental shifts are reflected in a change in the diversity, abundance or growth rate of species living in a given environment [15,16,17,18]. IS are usually used for monitoring wildlife conservation, habitat management and ecological restoration [8,9,19]. They may be used to indicate effects of either short- or long-term changes, thereby allowing researchers to predict environmental variation. Siddig et al. (2016) [7] suggest that IS may be used for pollution or contamination assessments, environmental or ecosystem health assessments, management-oriented activities, risk or disturbance assessments and early warnings of environmental change.
Many studies, including species, communities, and ecosystems, were identified and widely used in different fields. Such as IS, Corbula gibba and Flexopecten hyalinus, were used to characterize disturbed and undisturbed areas in terms of chlorophyll a concentration in Greece, respectively [20]. The xerophyte inland dune shrub community from Portugal was used to evaluate the relationship between the structure of the dune community, local environmental conditions, and the suitability of climatic conditions for its characteristic species [21]. While IS have rarely proven to be an effective tool for monitoring ecosystems and informing management decisions [22], the use of quantitative methods to determine IS is developing rapidly. Thus, Fleming et al., (2020) [22] extend the conceptual models of IS to include a direct relationship between an indicator species, ecosystem change drivers and latent processes and variables. It allows for latent-state models to be tested empirically, facilitating the robust evaluation and practical use of indicator species for ecosystem science and management [22]. Fifteen species out of 89 plant species were found by principal components analysis to be an IS, which should be benefited for the vegetation change status and sustainable rangeland management under semiarid rangeland conditions [23]. A context-dependent joint species distribution model (JSDM) was built to estimate the residual associations, 161 plant species were selected based on community data from 8660 vegetation plots [24].
Mangrove areas were regarded as having high diversity and good ecological value [25,26] because they provide food and shelter and form a rich ecosystem [27]. However, some reasons for this diversity include the construction of aquaculture farms, coastal developments and the purchase of firewood and other products by local residents. Mangroves in some areas were cut and removed [28]. The global decline in mangrove areas is considered a considerable issue for maintaining coastal biodiversity [29]. Therefore, conservation and restoration works were undertaken by mangrove management projects to avoid the destruction and degradation of mangrove habitats [30]. Nevertheless, mangrove conservation and restoration for the aforementioned purposes clearly differ from the goals of mangrove removal. Due to the invasion of mangroves in mudflats, the Siangshan Wetland has indicated that mangrove removal can be considered a case of positive conservation, insofar as it represents an appropriate habitat rehabilitation strategy for benthic organisms [31].
Regional and local groups are often involved in regional planning but, when making decisions, they make insufficient use of scientific knowledge regarding the given ecological system being changed [32]. The ecological basis of regional landscape changes could be improved if knowledge-based systems were tailored to the cyclic process of planning and negotiation, as well as to the expertise of planners, designers and local interest groups [32]. Ecologists or engineers select indicator species for the efficient assessment of the effects of management actions and as warning signals for ecological shifts based on their sensitivity to a particular environmental attribute. Selections may also take into account past published research, high abundance, a charismatic, endangered or invasive species character or any combination of these factors [7]. The ecoprofile method designed by Opdan et al. (2008) [32] combines the foundation of an ecosystem with the spatial conditions of a species metapopulation; the goal of this method is to integrate a suite of species as the core patterns of an ecosystem to allow the aspiration level to be modified during the planning process. This process infers a set of prerequisites for the effective use of biodiversity target setting methods, which can help multi-stakeholder decision making. Kuo et al. (2010) [6] defined indicator species as those whose presence denotes a large number of naturally co-occurring species, and they used algorithms of maximum co-occurrence probability to identify these candidates. Here, co-occurrence probability was defined based on the species that were found together in the same sites. However, it is not possible to distinguish such a relationship among species when using calculated joint probabilities.
In this study, we address this issue by using a novel quantitative method that incorporates species-conditional co-occurrence, which is based on the conditional probability of identifying an indicator species. First, we calculate the presence probability of each species as a condition against other species to appear at the same time, and then further add up the sum of the probability of other species with this species as the condition. This allows for the calculation of probabilities and expected values when only partial survey data are available. We therefore establish the co-occurrence probability of each species with other species. Second, we compare the cumulative co-occurrence probability of each species as judgments, and choose the one with the highest co-occurrence probability as the indicator species. Third, this study hopes to use the selected indicator species as a monitoring tool during the mangrove removal project in the Siangshan Wetland Conservation Area, Hsinchu, Taiwan.

2. Materials and Methods

2.1. Study Area

The study was conducted at the Siangshan Wetland, which is situated north of the Sanxing stream and to the south of the Haishan Fishing Port in Hsinchu, Taiwan (Figure 1). The wetland has a shoreline approximately 8 km in length, and an area of approximately 1600 ha. Due to its abundant ecosystem resources, the Siangshan Wetland was officially selected as a Hsinchu City Coastal Wildlife Sanctuary in 2001. The shoreline is a breeding ground for shrimp, crabs, shellfish and benthic organisms, and it attracts many bird species of conservation interest (National Important Wetland Conservation Project 2014). Two dense mangrove regions and a smaller seedling area within the reserve were selected for this study. The northern mangrove region is in the estuary of the Sanxing stream, and the other is in the northern part of the Haishan Fishing Port.
The mangroves were planted in 1969. A survey of mangroves found that there were as many as 5300 stands in 1992. Mangrove areas were estimated in 0.1-ha areas by the Taiwan Endemic Species Research Institute in 1995. According to the report, the Siangshan Wetland Mangrove Removal and Benefit Assessment Program of the Hsinchu Municipal Government in 2000, the mangrove area covered approximately 107 ha. Due to the continuous spreading of the mangrove in the coastal areas, the effects shown included habitat singularity, decline of species abundance, decline of biodiversity, infilling of estuaries, flooding, and small black mosquito breeding. And then, several small-scale mangrove-removal projects, ranging from 1 to 14 ha, were implemented from 2007 to 2014. Related projects are all entrusted to NGOs. A large-scale removal project was planned in October 2015. Therefore, two dense mangrove regions and a smaller seedling area within the reserve were selected for this study. The northern mangrove region is in the estuary of the Sanxing stream, and the other is in the northern part of the Haishan Fishing Port.
Hsinchu City’s industry is dominated by electronic component manufacturing, among which Hsinchu Science Park is an important pillar of Hsinchu’s economic development. The most serious threat to the Siangshan Wetland is pollution, its source comes from the inflow of sewage from rivers such as Keya Creek and Yanshui Creek. These pollutions mainly come from the Hsinchu Science Park. For many years, residents living by the wetlands have had a high level of environmental protection awareness. So far, the problem of mangrove forests was also reported by residents, and the government has dealt with the removal of mangroves in response to public opinion.

2.2. Mangrove Removal

A survey of mangrove stands in 1992 yielded an upper estimate of 5300 mangroves. While the Taiwan Endemic Species Research Institute in 1995 estimated the extent of the mangrove area as 0.1 ha, the “Siangshan Wetland Mangrove Removal and Benefit Assessment Program” of the Hsinchu Municipal Government reported that the mangrove area had reached approximately 107 ha by the year 2000. Repercussions of this continuous mangrove invasion include habitat singularity, a decline in species abundance and biodiversity, flooding and enhanced mosquito recruitment. According to the “2011 National Important Wetland Ecological Environment Investigation and Rehabilitation Project—Hsinchu City Wild Animal Sanctuary Habitat Rehabilitation Program”, as the mangroves continue to expand, the government will adopt mechanical methods to cut them down and transport them to an incinerator by truck. At this point, these implementations did not seem to solve the continuous expansion of mangroves.
In October 2015, a large-scale removal project was planned by the Hsinchu Municipal Government to resolve the problem of mangrove expansion. The mangrove forest was divided into three regions—two densely and one sparsely forested. A mechanical removal method was used in the densely forested regions while, in the sparsely forested region, mangroves were removed manually. Finally, in March 2016, the cumulative removed mangrove area was 348 ha, which included 48 ha from the densely forested regions and approximately 300 ha from the sparsely forested region.

2.3. Biological Survey and Experimental Design Experimental Design

In this study, crabs were sampled monthly from October 2015 to September 2016. The A, B, and C survey transects ran from north to south, and 5 sampling sites were positioned along each transect, resulting in 15 sampling sites, as shown in Figure 1. Transect A was designed to understand the occurrence of species in the mangrove area. However, transects B and C were designed to understand the occurrence of species in non-mangrove areas. Sites A1, A2, A3, and A5 were in the densely forested mangrove regions. A4 was located in the sparse mangrove seedling area. The three transects of space could help us understand how species distribute and change in space, especially in relation to changes before and after the removal of mangroves. Monthly sampling and spatial comparison could also help in clarifying the seasonal effects of species.
The semidiurnal and diurnal tides have a tidal range of 2.7 m along the Siangshan Wetland. Samples were collected on the tidal flats by excavating within a 1 m2 frame to a depth of 30 cm. Ten random frames were placed at each site. The samples were sieved through 1 mm mesh and preserved in an 8% formaldehyde–seawater solution. In the laboratory, crabs were sorted and species were identified, counted and preserved in a 70% alcohol solution. Samples were then used for species identification, quantity computation and for a before/after comparison of the effect of mangrove removal.

2.4. Statistical Analysis

Animal density was estimated as the number of individual organisms (N) per unit area, and species richness was determined as the total number of species (S). Diversity (H′, log) was estimated using the Shannon–Weaver index [33], and evenness (J′) was estimated following [34]. The community structures of the crabs were analyzed using the PRIMER 6.0 multivariate statistics program [35]. Species abundance was fourth root- transformed before communities were compared using the Bray–Curtis similarity index [36]. Individual samples were compared between sites and dates using a group-averaged cluster analysis and non-metric multidimensional scaled (n-MDS) ordination. Grouped communities at each site were compared using ANOSIM, with sample dates used as replicates within a site [35].

2.5. Model Building

Usually, the conservation of higher biodiversity is a fundamental goal of ecological restoration. When biodiversity is high, it means there are many different types of organisms and species present, meaning greater biodiversity in ecosystems, species and individuals, leading to greater stability. Therefore, indicator species are defined as those whose presence denotes the maximum number of naturally conditionally co-occurring species [6,36]. The IS should appear in habitats with high biodiversity in either a particular habitat, community or ecosystem. In addition, an umbrella species is defined as a species whose conservation is expected to confer protection to a large number of naturally co-occurring species; this concept has attracted greater attention in recent years because it provides a tool for the conservation of biodiversity [37]. When one protects the living environment of an asylum species, one also protects other species within this habitat. An umbrella species is usually widely distributed in a habitat and can show the needs of some or all species that inhabit the same locale. In other words, the habitat needs of this species are similar to those for other species living in the same community [38]. Thus, when it is ensured that these groups can survive, the survival of other species in the same habitat is also stable. With limited funds, knowledge and time constraints, the most efficient conservation plan must be adopted to maintain biodiversity. However, it is difficult to comprehensively study all species in a given ecosystem, so scientists can only focus on some specific species, and asylum species play an important role in these studies.
Therefore, we formalize the quantities that can be calculated from the species survey data to establish a quantitative method that may be used to determine an indicator species. For selecting indicator species, we use the concept of maximum conditional co-occurrence probability. First, let Si or Sj be the random variable denoting the presence or absence of species i or j. Let Si = 1 or Sj = 1 when species i or j is present, and Si = 0 or Sj = 0 when species i or j is absent. We suppose that n species are present and sampled simultaneously at the kth site, so that the co-occurrence probability of each species is calculated as the proportion 1/n. Given that species i or j is present and sampled simultaneously at the kth site, the probability of observing species i, knowing that species j is already present, defines species j as a conditional co-occurrence of species i. The conditional co-occurrence probability of each species i integrated over different species j is calculated by Formula (1).
P c o ( S i ) = j = 1 n P ( S j S i )
The co-occurrence probability of each species i integrated over different sites k is calculated by Formula (2).
P c o s i t e ( S i ) = k = 1 p P c o ( S i ) k
where k = 1, 2,…, p-th site for the ith species. In addition, a small value is given when some species are absent in the kth site, and inserted into the formula.
The co-occurrence probability of each species i integrated over different months t is calculated by formula (3).
P c o s i t e m o n t h ( S i ) = t = 1 m P c o s i t e ( S i ) t
where t = 1, 2,…, m-th site for the ith species.
For determining suitable indicator species, the maximum probability value among all species was selected.
max   P c . s . m . ( S i )

3. Results and Discussion

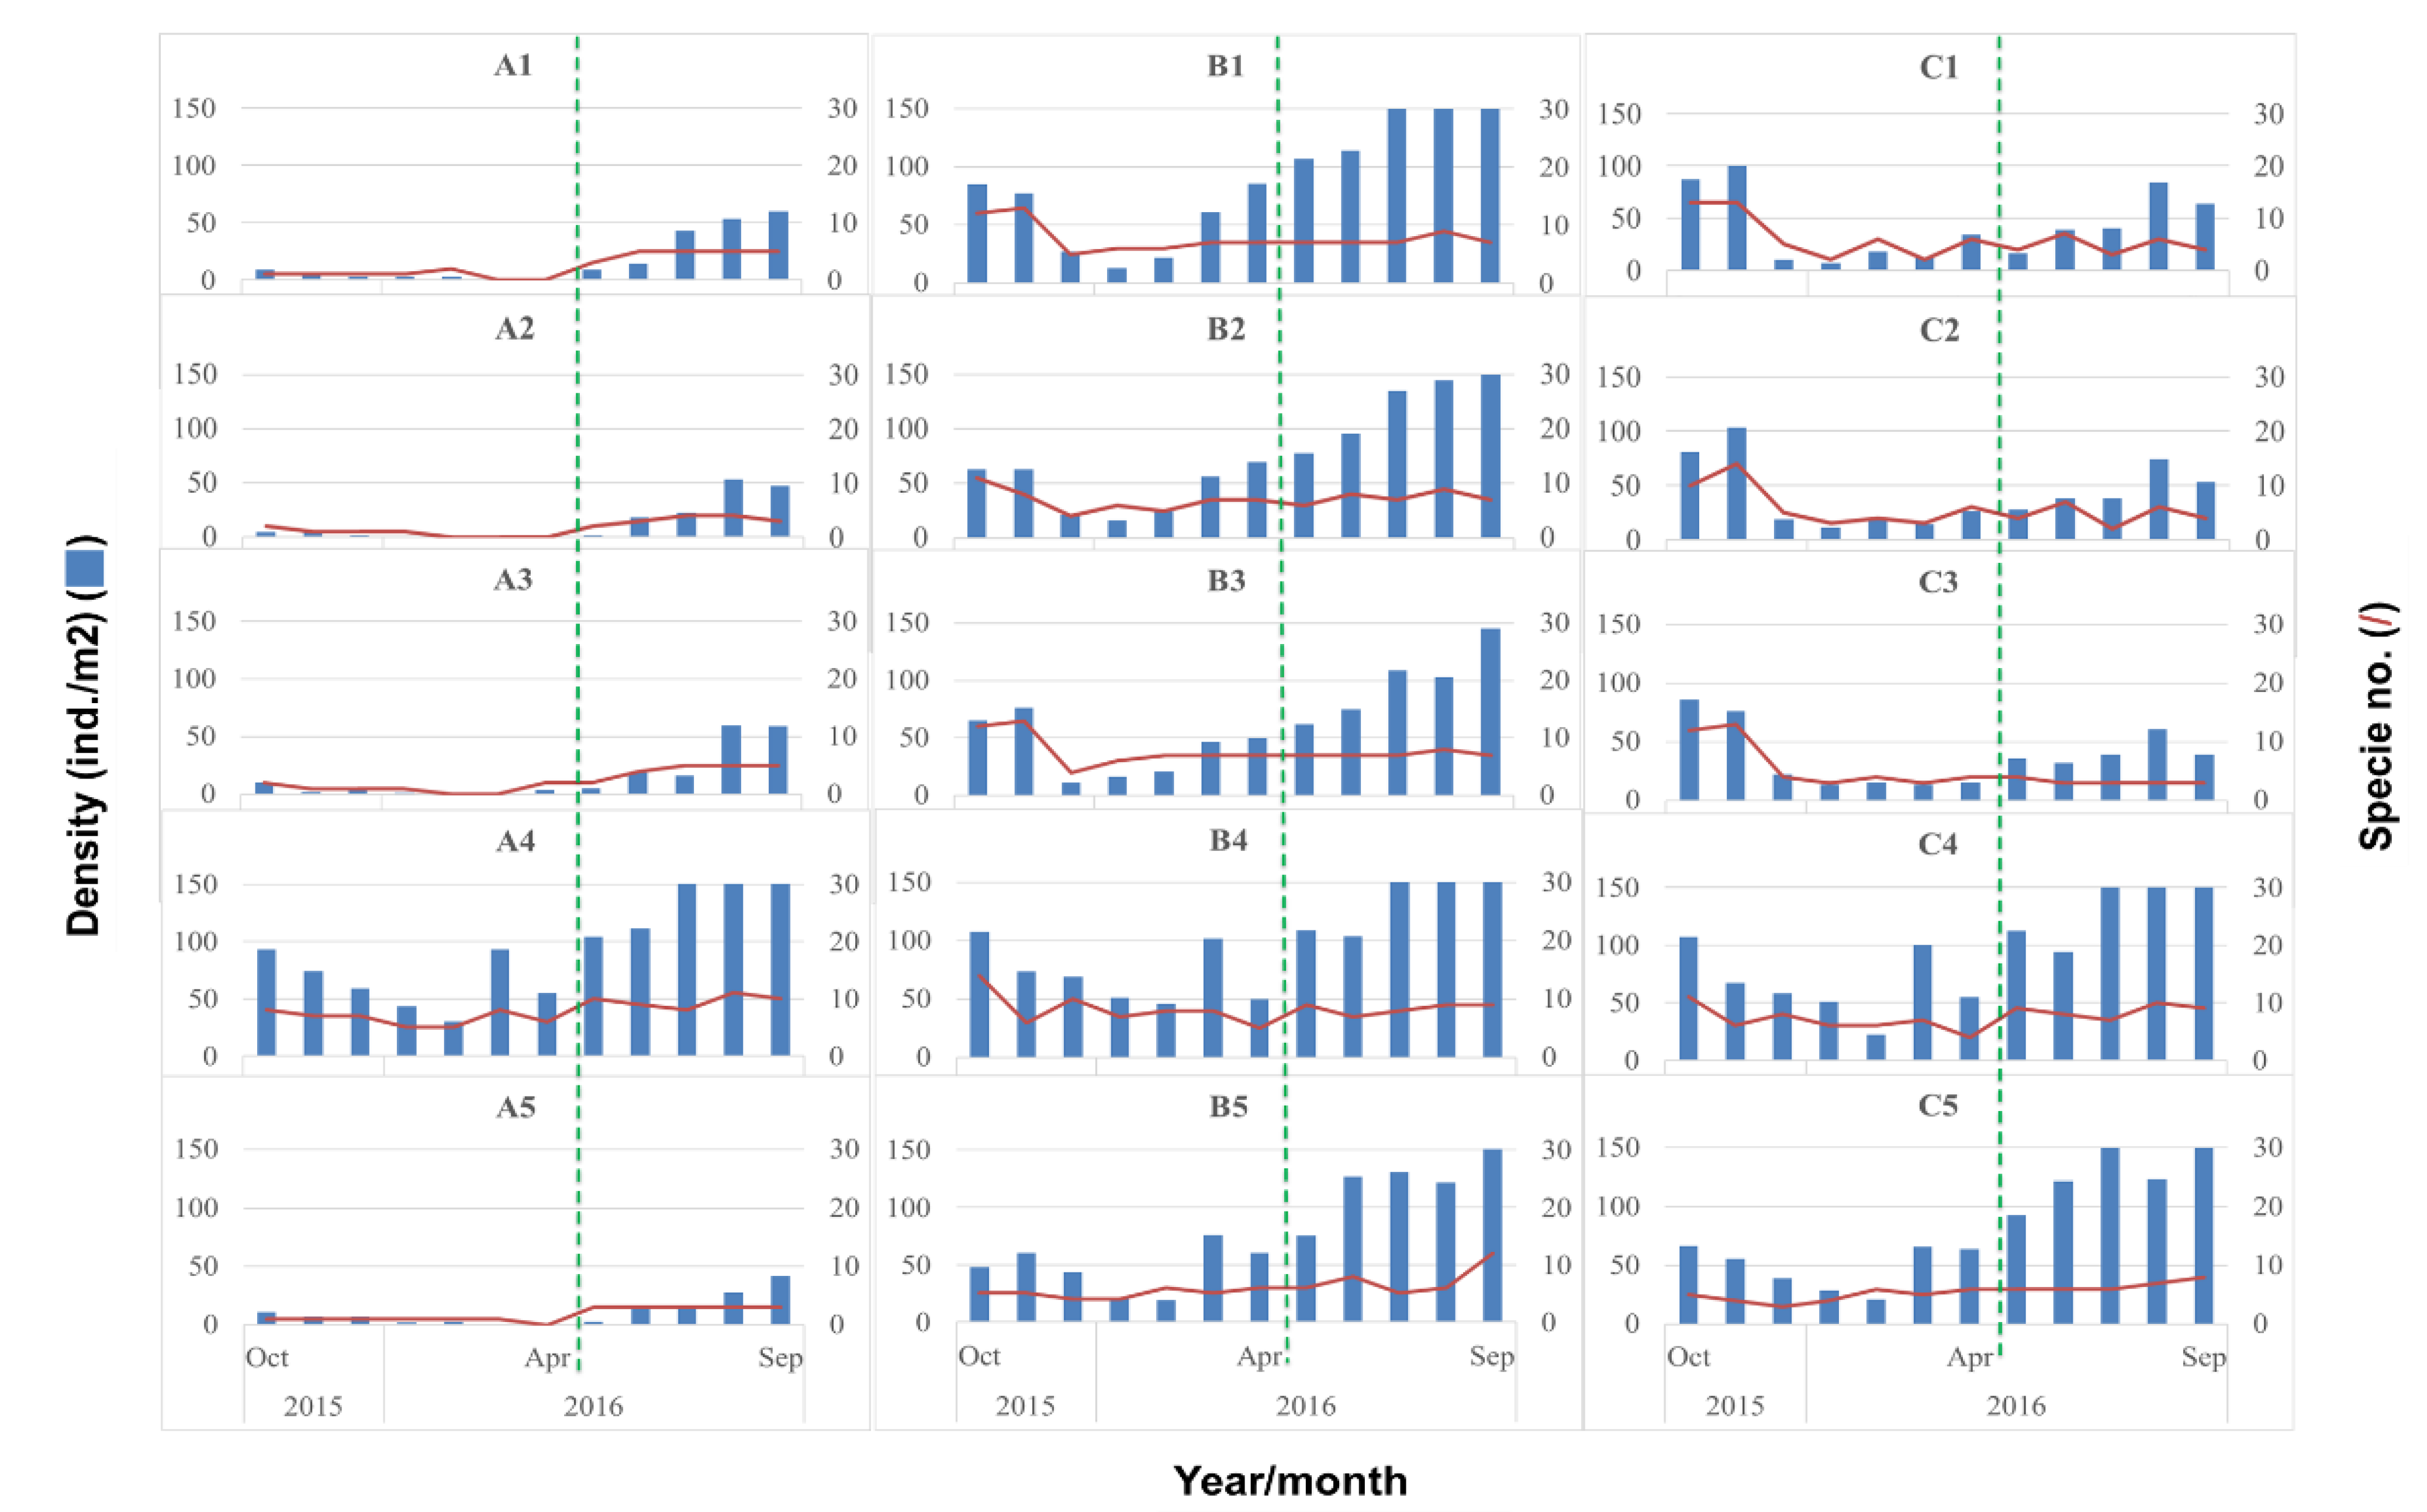
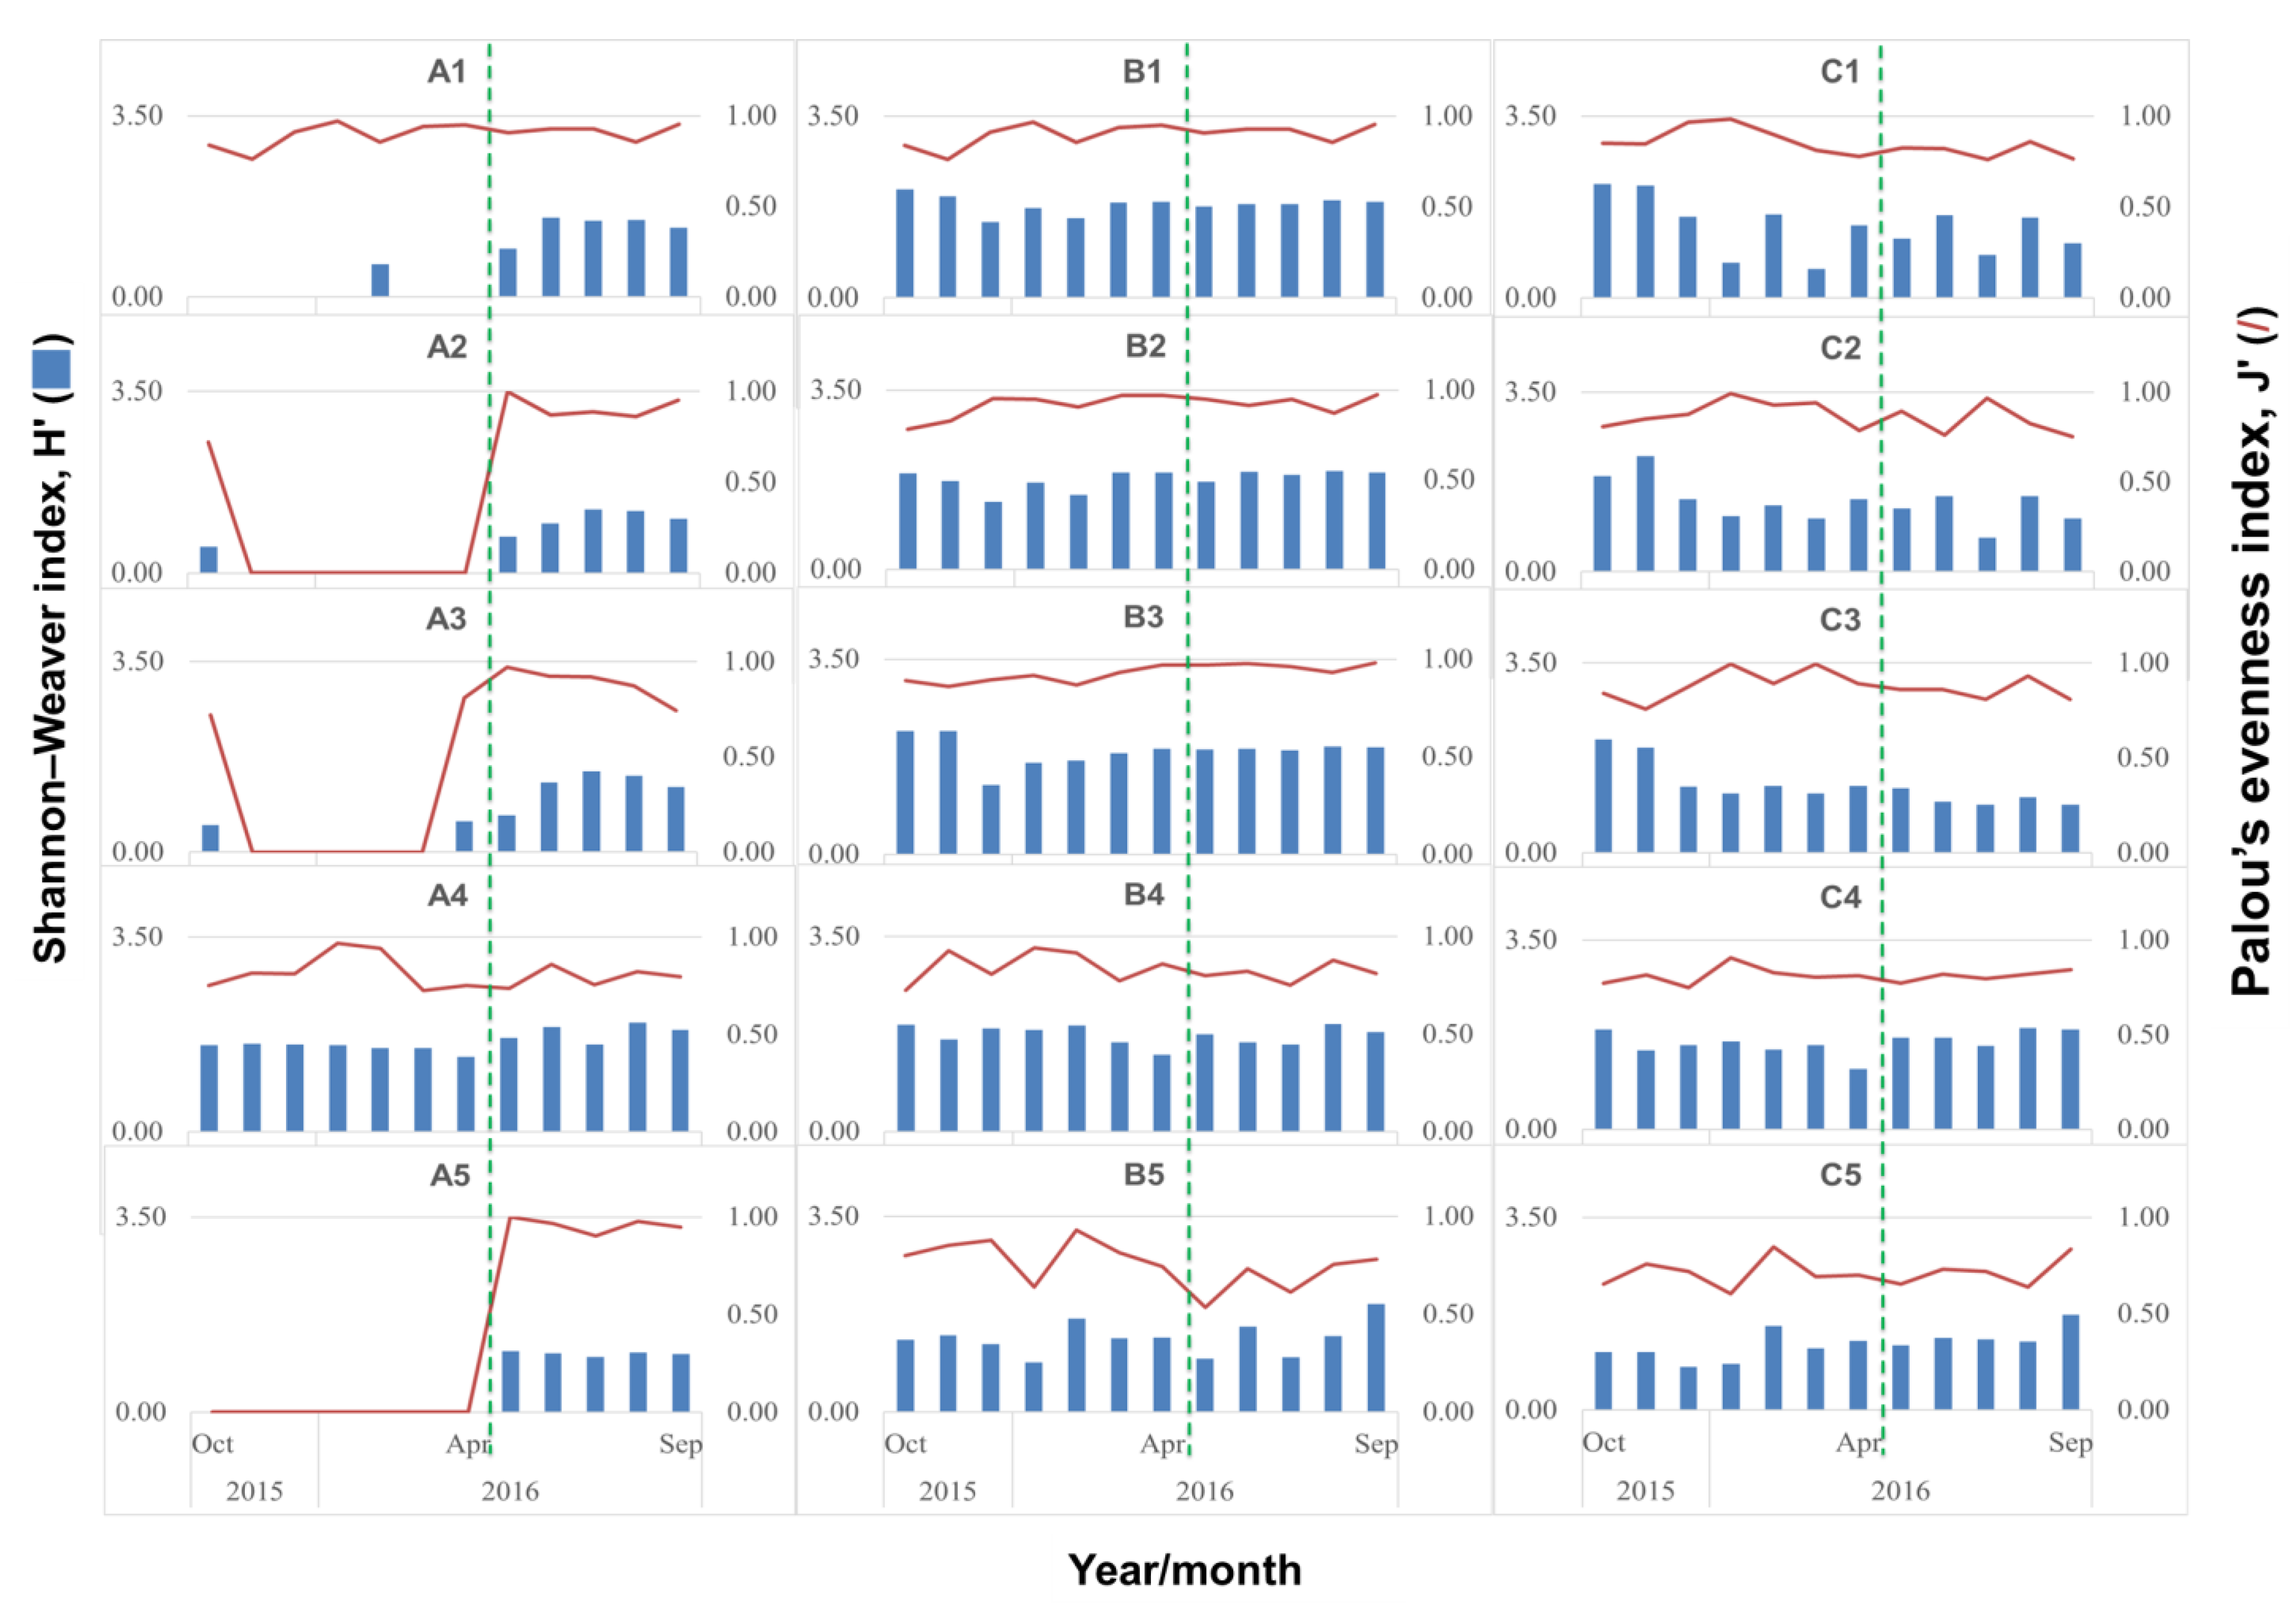
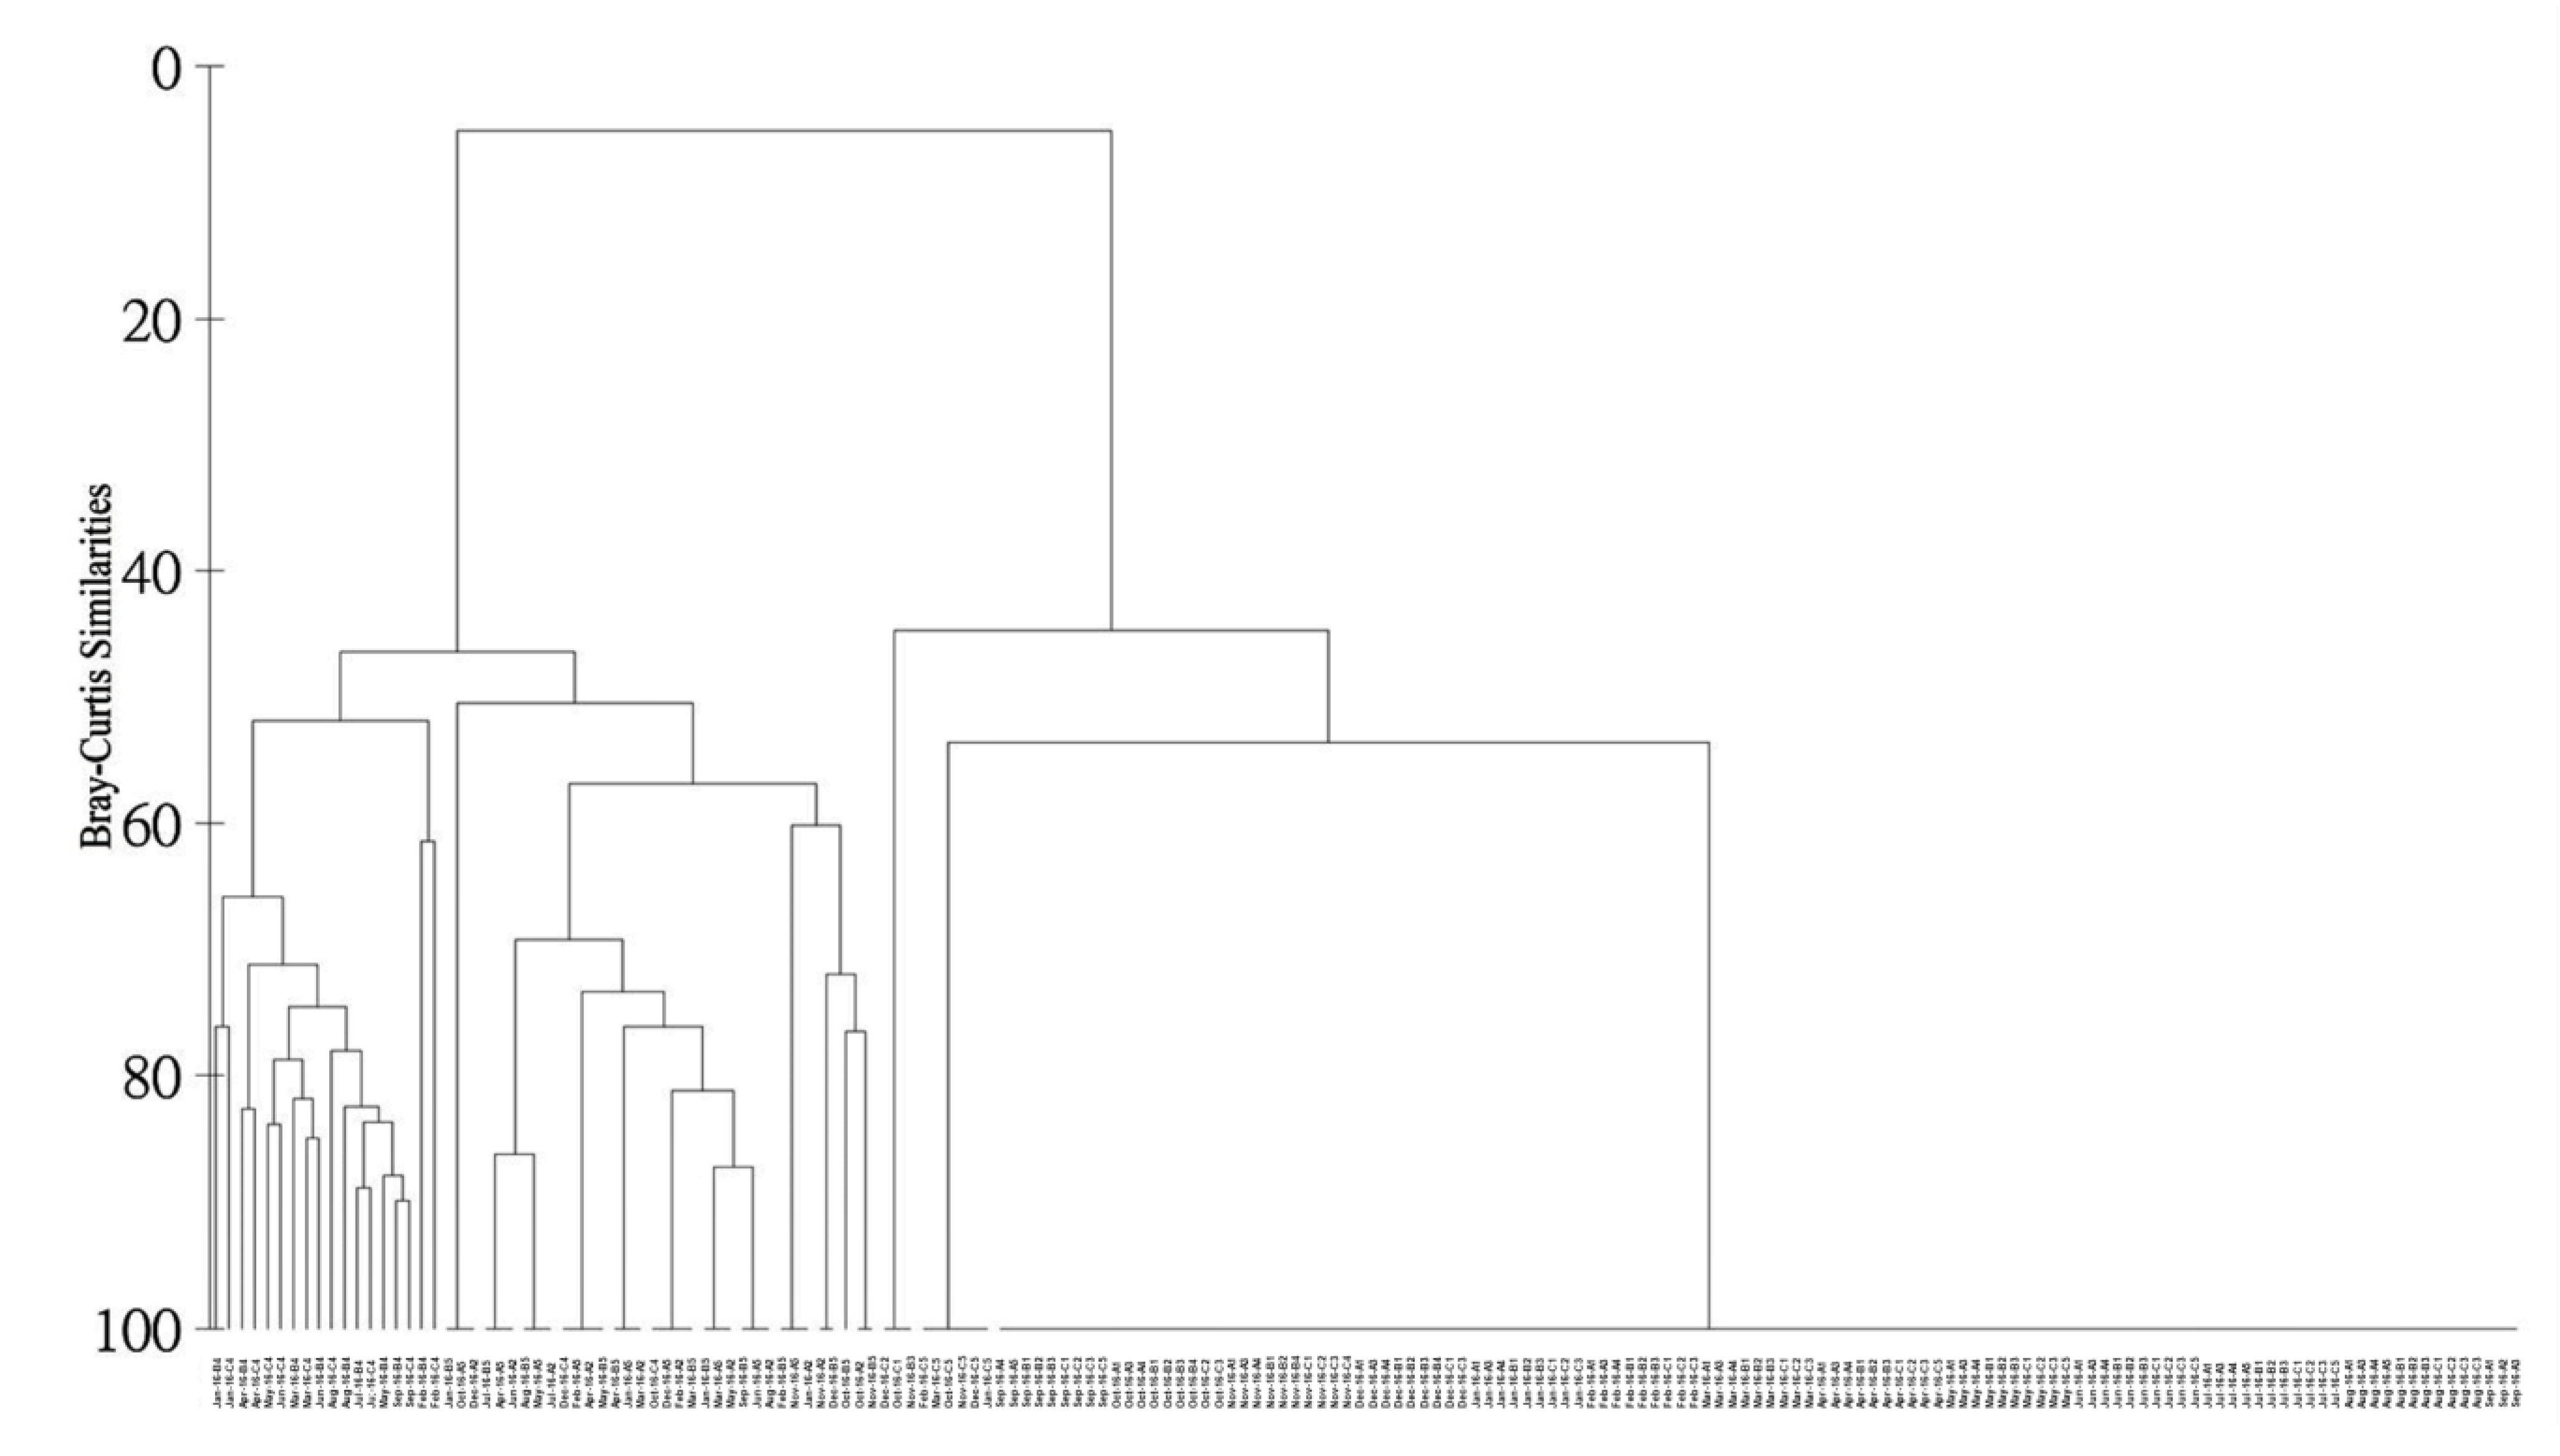
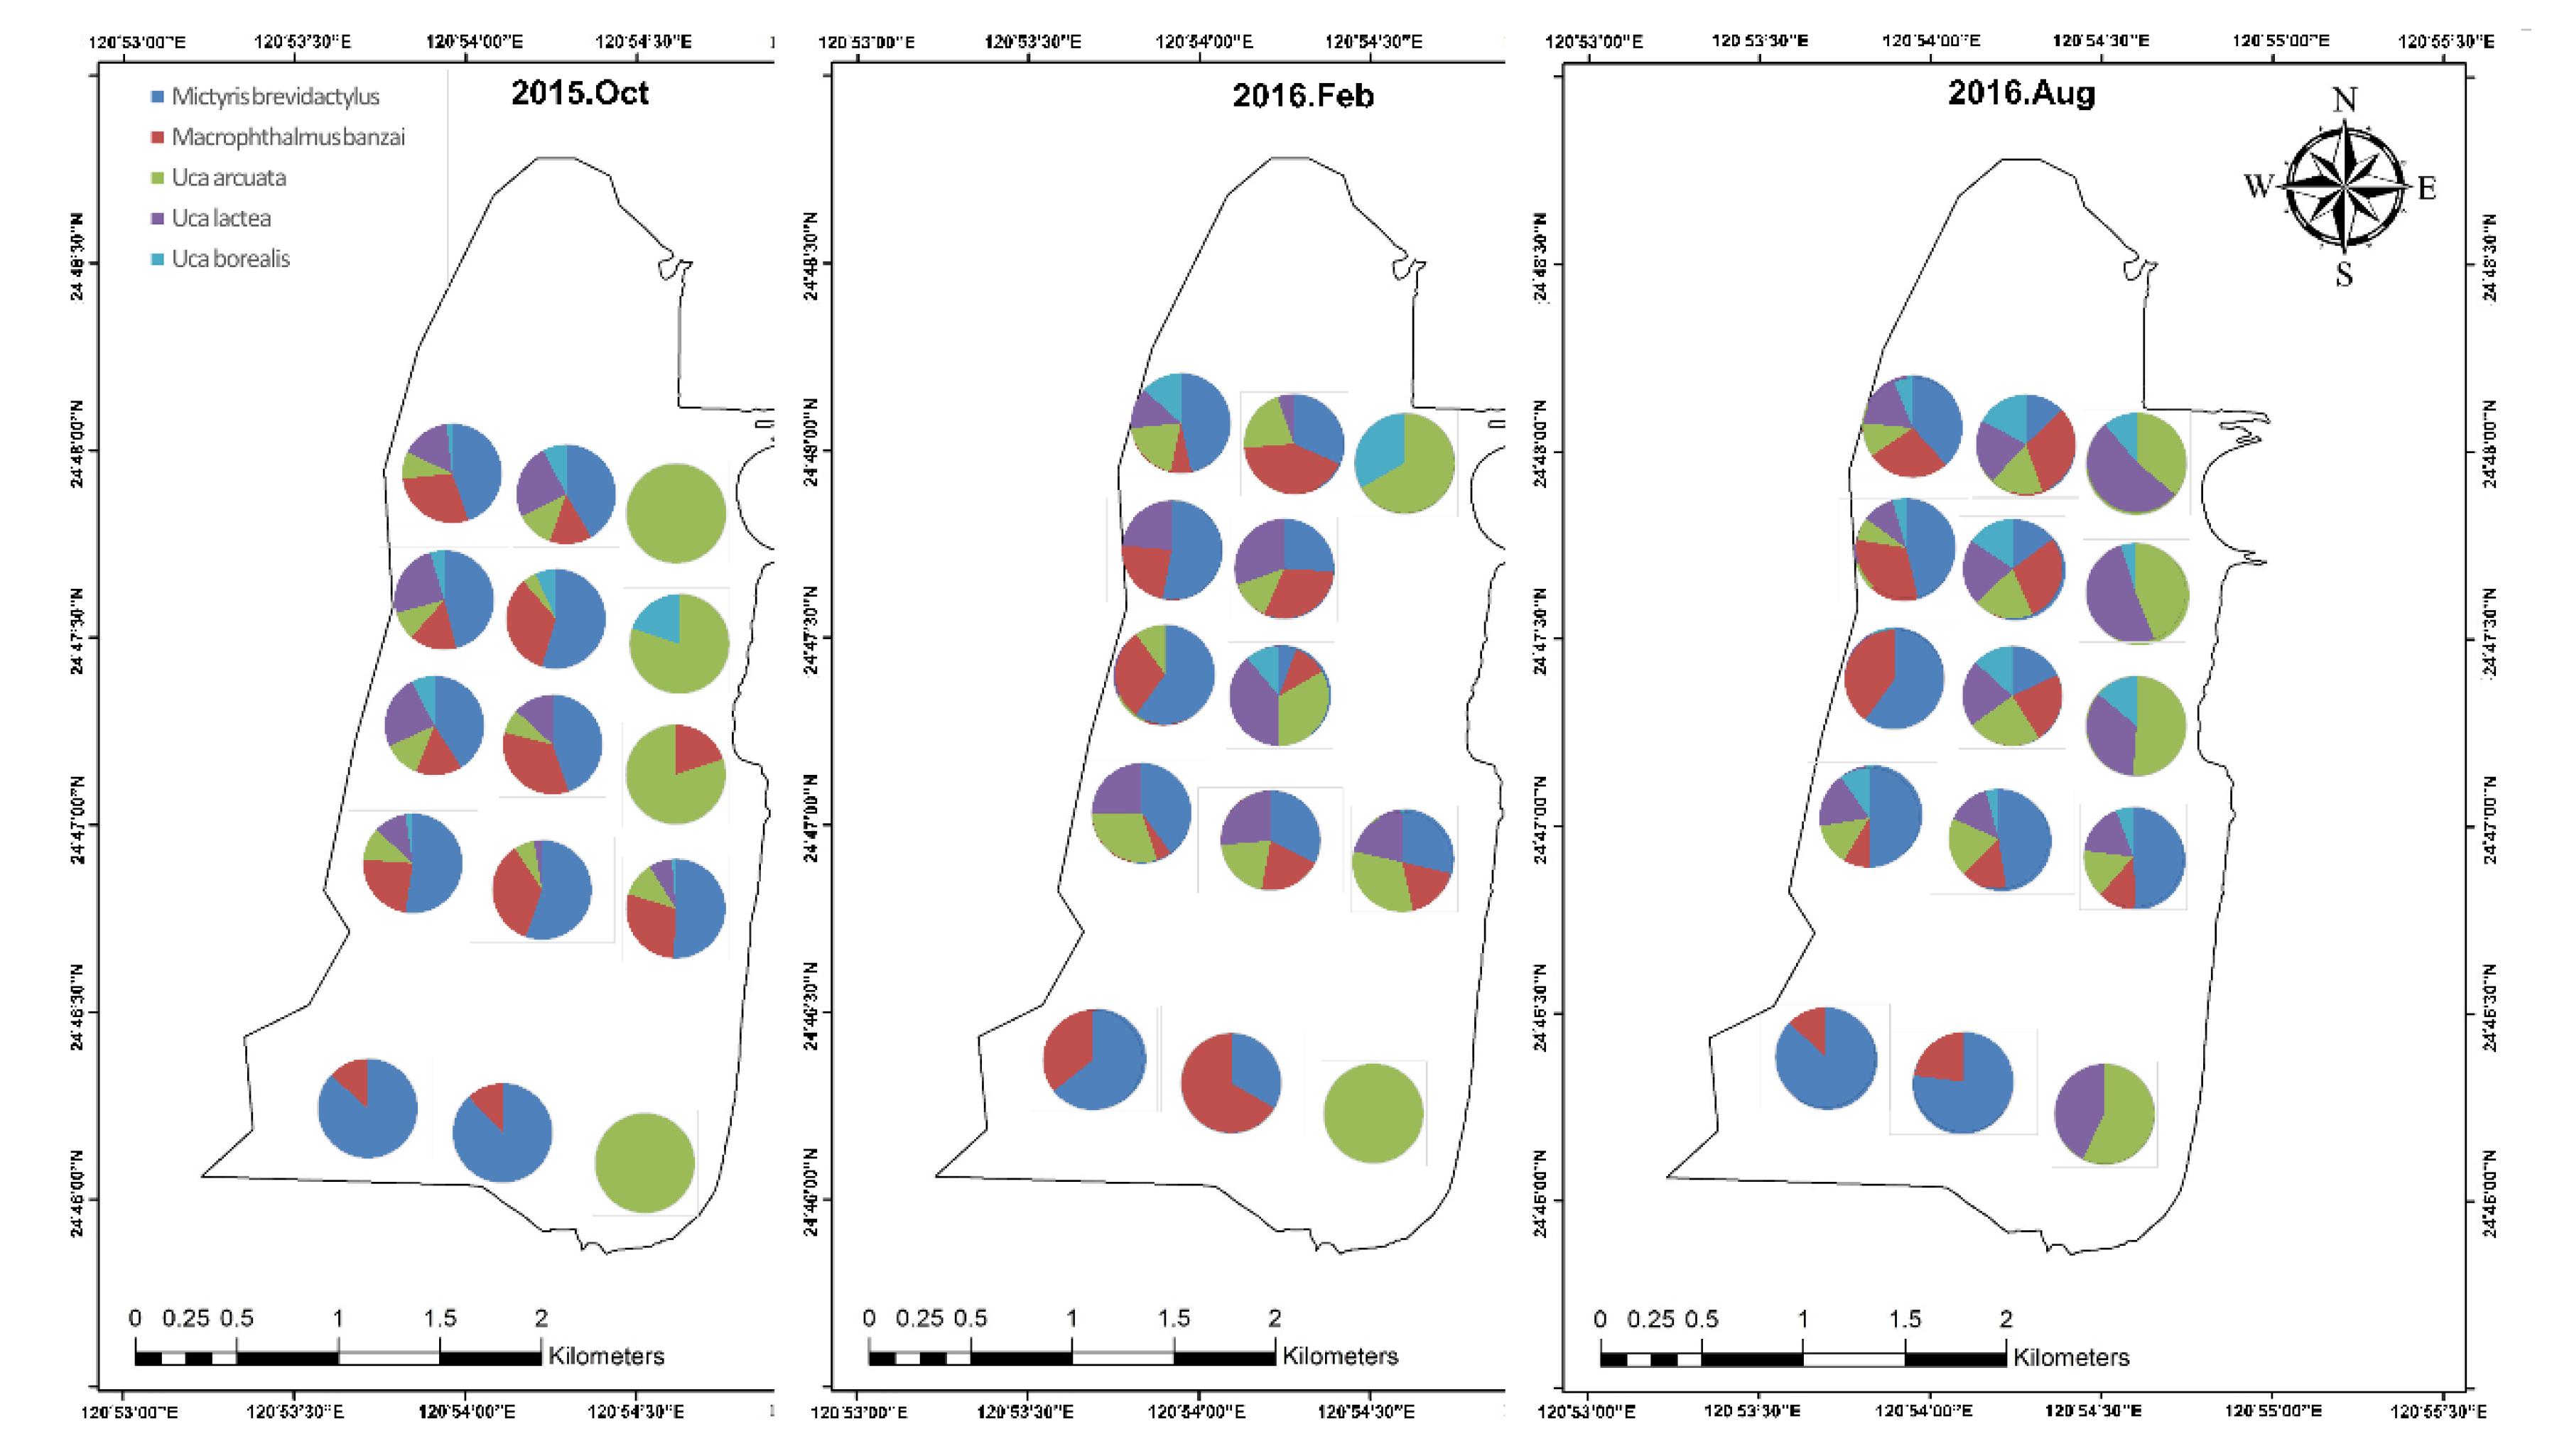
3.1. Biological Survey and Community Structure

Fluctuations in density and number of crab species across the survey period are shown in Figure 2. Before mangrove removal, density ranged from 1 to 11 individuals (ind.)/m2, and the number of crabs ranged from 0 to 2 at sampling sites A1, A2, A3, and A5. The crab species included M. banzai, U. arcuata and U. borealis. After mangrove removal, density rose to 4–60 ind./m2 and the number of crab species increased to 2–5. The additional crab species were Helice formosensis, U. formosensis and U. lactea. These results show that density and number of species increased after mangrove removal. The lowest density occurred in January 2016 and the highest in September 2016. The lowest number of species was recorded in February 2016 and the highest in August 2016.
At the sampling sites of the non-mangrove region, density ranged from 7 to 108 ind./m2, and the number of species ranged from 2 to 14 before mangrove removal. On the tidal flats in the non-mangrove region, the dominant species consisted of M. brevidactylus, M. banzai and U. arcuata. After mangrove removal, the density increased to 26–232 ind./m2, and the number of species recorded increased to 2–12. The lowest density was recorded in January 2016 and highest in September 2016. The highest diversity was recorded in October 2015 and the lowest in January 2016. These results indicate that the density and number of species change seasonally in the Siangshan Wetland, decreasing in winter and spring and increasing in summer.
Shannon–Weaver index (H′) and Palou’s evenness index (J′) are shown in Figure 3. The value of H′ ranged from 0 to 0.64, and J′ ranged from 0 to 0.92 before mangrove removal. However, after mangrove removal, H′ ranged from 0 to 1.53 and J′ ranged from 0.74 to 1.00. Lower H′ and J′ values were found in November 2015, December 2015, January 2016 and March 2016, and the highest H′ was found in July 2016. These results of transect A illustrate that both indices increased after mangrove removal, indicating an increase in biodiversity. In the non-mangrove region, H′ ranged from 0.56 to 2.25 and J′ ranged from 0.60 to 0.99 before mangrove removal. After mangrove removal, H′ ranged from 0.67 to 1.97 and J′ ranged from 0.54 to 0.98. Thus, the Shannon–Weaver index decreased in winter and increased gradually in spring and summer.
The results of the non-metric MDS ordination paralleled those produced by the classification (stress = 0.14). MDS ordination divided the sampling area into three categories: the first category (I) included most sites located in the non-mangrove region; the second category (II) included sites A1, A2, and A3, which were located in mangrove removal regions, and clustered data from the period after mangrove removal; and the third category (III), comprising sites A1, A2, A3, and A5, also contained sites located in the mangrove removal region, but clustered data from the period before mangrove removal in Figure 4. Generally, the MDS ordination revealed a clear gradual temporal continuum of change in species composition from October 2015 to June 2016 in mangrove removal regions in a counterclockwise direction (Figure 4).
Cluster analyses were used to demonstrate the grouping patterns of organism communities. The groups were primarily determined by the sample site, together with the sampling month (Figure 5). Samples were clearly separated into two major categories (I and II) at a similarity level of 0.30. The first category (I) included data from sites A1, A2, A3 and A5 in the mangrove removal region. The second category (II) comprised data from the non-mangrove region.

3.2. Identifying Indicator Species

The maximum conditional co-occurrence probability, Equations (1)–(4), was used to identify the most suitable indicator species. These species were selected to have the highest conditional co-occurrence probability (Table 1). Similarly, we also sorted and tabulated the indicator species rank according to the probability values of each month (Table 2), which clearly shows that the sorting varies monthly and seasonally. A clear monthly ranking would help us understand the seasonal changes in co-occurrence between species. Moreover, we still have to accumulate monthly rankings for the annual rankings (Table 2). Through a comprehensive analysis of the two tables, we found that M. banzai, U. arcuata and M. brevidactylus were the major indicator species in winter and spring. In summer and autumn, the major target species showed little change and consisted of U. lacteal, U. arcuata, U. borealis and H. formosensis. Finally, the most suitable indicator species were selected, including M. brevidactylus, M. banzai, U. arcuata, U. lacteal, U. borealis and H. formosensis.
Spatial variations in indicator species composition are shown in Figure 6. Two crab species, U. arcuata and U. borealis, were observed at the sampling sites within the mangrove region before mangrove removal. After mangrove removal, four species U. arcuata, U. borealis, U. lactea and H. formosensis, were observed. U. arcuate, U. lacteal and U. borealis were distributed across sites A1, A2, A3, B1, and B2. H. formosensis and M. banzai were located outside these sites. A comparison between habitat types showed that H. formosensis and M. banzai favor sandy over muddy locations. After mangrove removal, U. lactea returned to the area. Within the non-mangrove regions, species composition also varied both spatially and seasonally. The species within the mangrove regions increased after mangrove removal.
In general, U. arcuate, U. lacteal, and U. borealis were commonly found in mangroves, salt marshes and sandy or muddy areas in Siangshan Wetland. These species play a vital role in the preservation of wetland environments due to their feeding method of sifting through the sand, which aerates the substrate and prevents the development of anaerobic conditions [37]. U. arcuate tends to prefer wet habitats and thus is more likely to be found next to waterways and tidal pools in wetlands at low tide. Expanding mangroves often block waterways, while their removal re-opens them and promotes the return of these species to their original location.
Alfaro (2010) [30] explored the effect of mangrove removal on the community ecology of Mangawhai Estuary, northern New Zealand, between March 2004 and September 2006. The results showed that, after the mangroves were eradicated, sediments immediately changed from muddy to sandy, which is conducive to an overall increase in the number of crabs, snails, and bivalves. Alfaro’s study (2010) [30] provides direct evidence of the impact of mangroves on sediment and benthic characteristics, as well as the importance of imports from catchment areas to estuarine ecosystems [6,30].
The temporal density changes in the five indicator species in the two different regions (mangrove: A1, A5, and non-mangrove: B1, B5) are compared in Figure 7. Densities varied monthly and were significantly lower in the mangrove region than in the non-mangrove region. Our results indicate that these benthic organisms were forced to migrate from their original habitat to nearby areas when the mangroves invaded, and returned to their original habitat shortly after mangrove removal.
In order to analyze the influence of seasonal change, we compare the result from Ecological Restoration in Kaya Water Recycling Center, Hsinchu City -Habitat Improvement Restoration (Sub-project 2-1: Research on U. formosensis and its habitat) [39]. The seasonal fluctuations in number of crab species, U. formosensis, was shown from December 2006 to November 2008 (Figure 8). Two peaks are shown here in two years, which means that crabs appear less in winter and peaks in summer. As shown in Figure 2 above, comparing the density and number of crab species during the two survey periods, it shows consistent fluctuations. Similarly, the increase in species number indicated at A1 and A2 in Figure 6, it is due to the migration after mangroves removal. Coupled with the increase in the number of individuals due to seasonal factors (Figure 7). Therefore, in this paper, the temporal density of five indicator species change in two different regions (mangrove region in transect A and non-mangrove region in transect B) which can help clarify the influence of seasonal factors or removal.
These results suggest that these five species may be considered for use as indicator species, which will allow for the identification of environmental changes, indicating habitat restoration as a result of mangrove removal. All species co-occurring with well-chosen indicator species are supposed to benefit from measures that improve habitat quality [40,41,42]. Our results clearly support the notion that these indicator species should occur in the mangrove region, as well as in the non-mangrove region and, in turn, represent excellent proxies for higher conditional co-occurrence probabilities in those species assemblages. The biodiversity indices calculated for the sites further indicate a strong relationship between biodiversity and these selected indicator species.
Some studies have proved that it is possible to express environmental categories or changes. For example, Moraitis et al., (2018) [20] advocate the use of C. gibba as a proxy for eutrophication and the incorporation of this species in monitoring studies through SDM methods. For the Mediterranean Sea, they suggest the use of F. hyalinus in SDM as an indicator of environmental stability and a possible forecasting tool for salinity fluctuations [20]. It is possible to screen out some meaningful IS from a variety of plants through multivariate statistical methods and principal component analysis. These results are conducive to grasping the state of vegetation change and sustainable management under semi-arid rangeland conditions [23]. Cazelles et al. (2016) [36] mention that species co-occurrences are central in community ecology since the foundation of the discipline [36]. They think that a theory of species co-occurrence in ecological networks is needed to better inform interpretation of co-occurrence data. The procedure will analyze the relationship between biotic and abiotic factors for different community mechanisms. When a clear community mechanism is analyzed, it is conducive to policy formulation at the current stage and future maintenance and management. Melinda et al. (2021) [24] found that the interaction between species is increasingly recognized as an important driving factor for the distribution of species, but it is not clear whether changes in the interaction caused by pressure will affect the distribution of species [23].
While the status of well-chosen indicator organisms can frequently be treated as reflecting the fundamental conditions and range in conditions required by all species in an ecosystem [6,42], some authors have suggested that such species may not respond uniformly to restoration measures and thus may fail to predict similar responses at an ecosystem level. Pander and Geist (2013) [43] proposed that the evaluation of conservation measures or restoration might require a holistic approach integrating several endpoints at different scales (e.g., target species, indicator groups and ecosystem scale) [43]. In the present paper, indicator species were specifically selected to assess environmental changes after mangrove removal. For further investigation of the use of indicator species in understanding the structure and function of marine environments, it is necessary to merge various approaches into more holistic perspectives.

4. Conclusions

The concept of indicator species is widely applied in wildlife conservation, habitat management, and ecosystem restoration. The identification of appropriate indicator species possesses an undeniable appeal for conservationists, managers, and government officials who desire a clear means and target to assess impacts on environments or ecosystems. However, minimal attempts have been made to develop quantitative methods to select an indicator species from species assemblage data. Here, we develop a novel approach by incorporating species conditional co-occurrence probability into a selection model. A case study was conducted to explore and monitor wetland restoration at Siangshan Wetland, Hsinchu, Taiwan, focusing on crab species. The five indicator species with the highest conditional co-occurrence probabilities were M. brevidactylus, M. banzai, U. arcuata, U. lacteal and U. borealis. Population dynamics of the selected species can be used to explain how species assemblage composition is affected by the environmental shifts engendered by mangrove removal. The proposed method provides an innovative approach for monitoring habitat quality, determining effects of restoration and managing conservation areas. The continually increasing complexity of maintaining wetland ecosystems is widely acknowledged, and better understanding this complexity will assist in further improving the evaluation models used to select indicator species.
We believe that this research still has limitations, such as the inability to clearly ex-plain the ecological meanings of species-conditional co-occurrence, how to prove that IS is an effective tool for monitoring ecosystems and informing management decisions and how to integrate biodiversity-oriented policies. Especially, it must justify the selection of IS and be able to assess that IS can accurately reflect or predict environmental conditions. At the same time, it shows the quality of the species as a surrogate for its environment, and the relationship between species and ecological variation. Therefore, more research is needed in further.

Author Contributions

Conceptualization, T.-J.C. and C.-H.S.; methodology, T.-J.C. and C.-H.S.; software, T.-J.C. and C.-H.S.; validation, T.-J.C., C.-H.S., Y.-M.L., Y.-J.S., J.-Q.W. and L.-M.H.; formal analysis, T.-J.C. and C.-H.S.; investigation, T.-J.C., C.-H.S. and Y.-J.S.; resources, T.-J.C. and C.-H.S.; data curation, T.-J.C. and C.-H.S.; writing—original draft preparation, T.-J.C. and C.-H.S.; writing—review and editing, T.-J.C., C.-H.S., Y.-J.S., J.-Q.W. and L.-M.H.; visualization, T.-J.C., C.-H.S., Y.-M.L., Y.-J.S., J.-Q.W. and L.-M.H.; supervision, T.-J.C. and C.-H.S.; project administration, T.-J.C. and C.-H.S.; funding acquisition, T.-J.C. and C.-H.S. All authors have read and agreed to the published version of the manuscript.

Funding

This work was supported by the Taiwan Wetland Society grant number TWS 107-2221-A-002. and Jimei University grant number C619061. The funders had no role in study design, data collection and analysis, decision to publish, or preparation of the manuscript.

Acknowledgments

We thank Kuo Yi-Yu for his contributions to the suggested revision comments to manuscript. Useful suggestions from anonymous reviewers were incorporated into the manuscript.

Conflicts of Interest

The authors declare no conflict of interest.

References

  1. Lee, H.Y.; Shih, S.S. Impacts of vegetation changes on the hydraulic and sediment transport characteristics in Guandu mangrove wetland. Ecol. Eng. 2004, 23, 85–94. [Google Scholar] [CrossRef]
  2. Lee, T.M.; Yeh, H.C. Applying remote sensing techniques to monitor shifting wetland vegetation: A case study of Danshui River estuary mangrove communities, Taiwan. Ecol. Eng. 2009, 35, 487–496. [Google Scholar] [CrossRef]
  3. Shih, S.S.; Yang, S.C.; Lee, H.Y.; Hwang, G.W.; Hsu, Y.M. Development of a salinity-secondary flow-approach model to predict mangrove spreading. Ecol. Eng. 2011, 37, 1174–1183. [Google Scholar] [CrossRef]
  4. Yang, S.C.; Shih, S.S.; Hwang, G.W.; Adams, J.B.; Lee, H.Y.; Chen, C.P. The salinity gradient influences on the inundation tolerance thresholds of mangrove forests. Ecol. Eng. 2013, 51, 59–65. [Google Scholar] [CrossRef]
  5. Silva Lima, J.S.; Atalah, J.; Sanchez-Jerez, P.; Zalmon, I.R. Evaluating the performance and management of artificial reefs using artificial reef multimetric index (ARMI). Ocean Coast. Manag. 2020, 198, 105350. [Google Scholar] [CrossRef]
  6. Kuo, Y.Y.; Shih, C.H.; Lee, Y.C.; Chang, W.T.; Chu, T.J. Identifying Indicator Species in Habitats Created by Coastal Structures. China Ocean Eng. 2010, 24, 117–134. [Google Scholar]
  7. Siddig, A.A.H.; Ellison, A.M.; Ochs, A.; Leeman, C.V.; Lau, M.K. How do ecologists select and use indicator species to monitor ecological change? Insights from 14 years of publication in Ecological Indicators. Ecol. Indic. 2016, 60, 223–230. [Google Scholar] [CrossRef] [Green Version]
  8. Simberloff, D. Flagships, umbrellas, and keystones: Is single-species management passé in the landscape era? Conserv. Biol. 1998, 83, 247–257. [Google Scholar] [CrossRef]
  9. Caro, T.M. Umbrella species: Critique and lessons from East Africa. Anim. Conserv. 2003, 6, 171–181. [Google Scholar] [CrossRef]
  10. Morrison, M.L. Restoring Wildlife: Ecological Concepts and Practical Applications; Society for Ecological Restoration International: Island, WA, USA, 2009. [Google Scholar]
  11. Caro, T. Conservation by Proxy: Indicator, Umbrella, Keystone, Flagship, and Other Surrogate Species; Island Press: Washington, DC, USA, 2010. [Google Scholar]
  12. Ellison, A.M.; Bank, M.S.; Clinton, B.D.; Colburn, E.A.; Elliott, K.; Ford, C.R.; Foster, D.R.; Kloeppel, B.D.; Knoepp, J.D.; Lovett, G.M.; et al. Loss of foundation species: Consequences for the structure and dynamics of forested ecosystems. Front. Ecol. Environ. 2005, 9, 479–486. [Google Scholar] [CrossRef]
  13. Landres, P.B.; Verner, J.; Thomas, J.W. Ecological uses of vertebrate indicator species: A critique. Conserv. Biol. 1988, 2, 316–328. [Google Scholar] [CrossRef]
  14. Cairns, J., Jr.; Pratt, J.R. A history of biological monitoring using benthic macroinvertebrates. In Freshwater Biomonitoring and Benthic Macroinvertebrates; Rosenberg, D.M., Resh, V.H., Eds.; Chapman & Hall: New York, NY, USA, 1993. [Google Scholar]
  15. Bartell, S.M. Biomarkers, bioindicators, and ecological risk assessment—A brief review and evaluation. Environ. Bioindic. 2006, 1, 39–52. [Google Scholar] [CrossRef]
  16. Burger, J. Bioindicators: Types, development, and use in ecological assessment and research. Environ. Bioindic. 2006, 1, 22–39. [Google Scholar] [CrossRef]
  17. Shih, C.H.; Kuo, Y.Y.; Chu, T.J.; Chou, W.C.; Chang, W.T.; Lee, Y.C. Eco-environmental Impact Assessment of Artificial Beach Nourishment on Benthic Invertebrate Community at Anping Coast, Taiwan. China Ocean Eng. 2011, 25, 215–236. [Google Scholar] [CrossRef]
  18. Lee, Y.C.; Chang, P.H.; Shih, C.H.; Shiao, J.C.; Tzeng, T.D.; Chang, W.C. The impact of religious release fish on conservation. Glob. Ecol. Biogeogr. 2021, 27, e01556. [Google Scholar]
  19. Primack, R.B. Essentials of Conservation Biology, 5th ed.; Sinauer Associates, Inc. Press: Palgrave Macmillan, MA, USA, 2010. [Google Scholar]
  20. Moraitis, M.L.; Tsikopoulou, I.; Geropoulos, A.; Dimitriou, P.D.; Papageorgiou, N.; Giannoulaki, M.; Valavanis, V.D.; Karakassis, I. Molluscan indicator species and their potential use in ecological status assessment using species distribution modeling. Mar. Environ. Res. 2018, 140, 10–17. [Google Scholar] [CrossRef]
  21. Chefaoui, R.M.; Chozas, S.; Correia, O.; Santos, A.M.C.; Hortal, J. Using niche models of indicator species to predict the distribution of xerophytic shrub dune communities. Web Ecol. 2016, 16, 47–49. [Google Scholar] [CrossRef] [Green Version]
  22. Fleming, J.E.; Sutherland, C.; Sterrett, S.C.; Grant, E.H.C. A latent process model approach to improve the utility of indicator species. Oikos 2020, 129, 1753–1762. [Google Scholar] [CrossRef]
  23. Ünal, S.; Şahin, B.; Urla, Ö.; Efe, B. The Use of Indicator Species and Ecological Degradation Model for Rangeland Condition Assessment in Turkey. Tarla Bitk. Merk. Araşt. Enst. Derg. 2017, 26, 190–202. [Google Scholar]
  24. De Jonge, M.M.; Benítez-López, A.; Hennekens, S.; Santini, L.; Huijbregts, M.A.; Schipper, A.M. Conditional love? Co-occurrence patterns of drought-sensitive species in European grasslands are consistent with the stress-gradient hypothesis. Glob. Ecol. Biogeogr. 2021, 30, 1609–1620. [Google Scholar] [CrossRef]
  25. Ashton, E.C.; Macintosh, D.J. Preliminary assessment of the plant diversity and community ecology of the Sematan mangrove forest, Sarawak, Malaysia. For. Ecol. Manag. 2002, 166, 111–129. [Google Scholar] [CrossRef]
  26. Macintosh, D.J.; Ashton, E.C.; Havanon, S. Mangrove rehabilitation and intertidal biodiversity: A study in the Ranong Mangrove Ecosystem, Thailand. Estuar. Coast. Shelf Sci. 2002, 55, 331–345. [Google Scholar] [CrossRef] [Green Version]
  27. Duke, N.C.; Meynecke, J.O.; Dittmann, S.; Ellison, A.M.; Anger, K.; Berger, U.; Cannicci, S.; Diele, K.; Ewel, K.C.; Field, C.D.; et al. A world without mangroves? Science 2007, 317, 1–42. [Google Scholar] [CrossRef] [PubMed] [Green Version]
  28. Diop, S. Vulnerability assessment of mangroves to environmental change. Estuar. Coast. Shelf Sci. 2003, 58, 1–2. [Google Scholar] [CrossRef]
  29. Goldberg, L.; Lagomasino, D.; Thomas, N.; Fatoyinbo, T. Global declines in human-driven mangrove loss. Glob. Chang. Biol. 2020, 26, 5844–5855. [Google Scholar] [CrossRef] [PubMed]
  30. Alfaro, A.C. Effects of mangrove removal on benthic communities and sedi-ment characteristics at Mangawhai Harbour, northern New Zealand. ICES J. Mar. Sci. 2010, 67, 1087–1104. [Google Scholar] [CrossRef] [Green Version]
  31. Chen, Y.C.; Shih, C.H. Sustainable management of coastal wetlands in Taiwan: A review for invasion, conservation, and removal of mangroves. Sustainability 2019, 11, 4305. [Google Scholar] [CrossRef] [Green Version]
  32. Opdam, P.; Pouwels, R.; Van Rooij, S.; Steingröver, E.; Vos, C. Setting Biodiversity Targets in Participatory Regional Planning: Introducing Ecoprofiles. Ecol. Soc. 2008, 13, 2021. Available online: http://www.jstor.org/stable/26267947 (accessed on 12 October 2020). [CrossRef] [Green Version]
  33. Shannon, E.; Weaver, W. The Mathematical Theory of Communication; University of Illinois: Urbana, IL, USA; Chicago, IL, USA, 1963. [Google Scholar]
  34. Pielou, E.C. The measurement of diversity in different types of biological collections. J. Theor. Biol. 1966, 13, 131–144. [Google Scholar] [CrossRef]
  35. Clarke, K.R.; Warwick, R.M. A further biodiversity index applicable to species lists: Variation in taxonomic distinctness. Mar. Ecol. Prog. Ser. 2001, 216, 265–278. [Google Scholar] [CrossRef]
  36. Cazelles, K.; Araújo, M.B.; Mouquet, N.; Gravel, D. A theory for species co-occurrence in interaction networks. Theor. Ecol. 2016, 9, 39–48. [Google Scholar] [CrossRef]
  37. Bray, J.R.; Curtis, J.T. An ordination of the upland forest communities of Southern Wisconsin. Ecol. Monogr. 1957, 27, 325–349. [Google Scholar] [CrossRef]
  38. Branton, M.; Richardson, J.S. Assessing the value of the umbrella-species concept for conservation planning with meta-analysis. Conserv. Biol. 2011, 25, 9–20. [Google Scholar] [CrossRef] [PubMed]
  39. Roberge, J.M.; Angelstam, P. Usefulness of the umbrella species concept as a conservation tool. Conserv. Biol. 2004, 18, 76–85. [Google Scholar] [CrossRef]
  40. Chu, T.J. Ecological restoration in Kaya Water Recycling Center, Hsinchu City—Habitat Improvement Restoration (Sub-Project 2-1: Research on U. formosensis and Its Habitat), 2006–2008. Available online: https://ecologicallabs.com/ecosystem-restoration/ (accessed on 15 October 2020). (In Chinese).
  41. Levinton, J.S.; Judge, M.L.; Kurdziel, J.P. Functional differences between the major and minor claws of fiddler crabs (Uca, family Ocypodidae, order Decapoda, Subphylum Crustacea): A result of selection or developmental constraint? J. Exp. Mar. Biol. Ecol. 1995, 193, 147–160. [Google Scholar] [CrossRef]
  42. Kuo, Y.Y.; Lee, L.C. Construct the Coastal Landscape and Ecology Environment; Chansbook: Hsinchu, Taiwan, 2006. (In Chinese) [Google Scholar]
  43. Pander, J.; Geist, J. Ecological indicators for measuring stream restoration success. Ecol. Indic. 2013, 30, 106–118. [Google Scholar] [CrossRef]
Figure 1. Sampling sites and satellite image of the Siangshan Wetland, Hsinchu, Taiwan.
Jmse 09 01044 g001
Figure 2. Fluctuations in density and number of crab species over the survey period.
Jmse 09 01044 g002
Figure 3. Shannon–Weaver index (H′) and Palou’s evenness index (J′) over the survey period.
Jmse 09 01044 g003
Figure 4. Non-metric MDS ordination of abundance data for crab communities sampled monthly in the study area.
Jmse 09 01044 g004
Figure 5. Dendrogram of hierarchical clustering of monthly crab communities, using group-average linking of Bray–Curtis similarities calculated from fourth root transformed abundance data.
Jmse 09 01044 g005
Figure 6. The spatial variation in indicator species with their quantities.
Jmse 09 01044 g006
Figure 7. Densities of five indicator species at four sites, A1, B1, A5, and B5, in October 2015 and February, June, and August 2016.
Jmse 09 01044 g007
Figure 8. Fluctuations in number of crab species, Uca formosensis, from December 2006 to November 2008 [39]. Note: This figure cites from Ecological Restoration in Kaya Water Recycling Center, Hsinchu City Habitat Improvement Restoration (Sub-project 2-1: Research on Uca formosensis and Its Habitat).
Jmse 09 01044 g008
Table 1. The conditional co-occurrence probabilities of crab species in different months.
SpeciesTime P c . s . m . ( S i )
20152016
OctNovDecJanFebMarArpMayJuneJulyAugSep
Helicana doerjesi0.0020.0040.0000.0000.0010.0010.0000.0010.0020.0010.0010.0029.2 × 10−4
Helice formosensis0.0000.0010.0000.0000.0000.0020.0010.0070.0070.0740.0750.0742.7 × 10−3
Mictyris brevidactylus0.0790.0770.0720.0690.0740.0710.0740.0750.0760.0710.0760.0757.4 × 10−2
Macrophthalmus banzai0.1390.0770.0720.0390.0740.0400.0740.0410.0760.0710.0760.0756.7 × 10−2
Macrophthalmusab reviatus0.0010.0070.0010.0010.0010.0010.0000.0010.0010.0010.0010.0017.1 × 10−4
Ocypode ceratophthalmus0.0020.0070.0010.0000.0010.0000.0000.0020.0010.0000.0000.0017.1 × 10−4
Ocypode stimpsoni0.0000.0020.0010.0010.0010.0010.0020.0010.0010.0010.0010.0028.5 × 10−4
Ocypode sinensis0.0070.0010.0000.0000.0000.0000.0000.0000.0000.0000.0000.0002.0 × 10−4
Uca arcuata0.1350.0230.0120.0070.0390.0040.0390.0390.2460.0740.2500.0744.1 × 10−2
Uca formosensis0.0000.0000.0000.0010.0000.0010.0010.0040.0010.0120.0130.0131.1 × 10−3
Uca lactea0.0130.0130.0020.0040.0120.0040.0120.0690.2460.0740.2500.0742.2 × 10−2
Uca perplexa0.0010.0010.0000.0000.0000.0000.0000.0000.0000.0000.0000.0001.5 × 10−4
Uca borealis0.0120.0130.0020.0010.0010.0020.0040.0040.0410.0040.0760.0135.2 × 10−3
Scopimera longidactyla0.0010.0010.0000.0000.0000.0000.0000.0000.0000.0000.0000.0001.4 × 10−4
Scopimera globosa0.0130.0000.0000.0000.0000.0000.0000.0000.0000.0000.0000.0001.5 × 10−4
Scopimera bitympana0.0130.0000.0000.0000.0000.0000.0000.0000.0000.0000.0000.0003.3 × 10−4
Scylla serrata0.0020.0010.0000.0000.0000.0000.0000.0000.0000.0000.0000.0001.5 × 10−4
Pagurus dubius0.0010.0000.0000.0000.0000.0000.0000.0000.0000.0000.0000.0001.4 × 10−4
Diogenes penicillatus0.0130.0000.0000.0000.0000.0000.0000.0000.0000.0000.0000.0001.5 × 10−4
Parapagurus diogenes0.0000.0000.0000.0000.0000.0000.0000.0000.0010.0000.0010.0001.9 × 10−4
Parapagurus obtusifrons0.0040.0040.0020.0000.0000.0000.0000.0000.0000.0000.0070.0015.0 × 10−4
Total species(S)181914111413121414121414
Species richness index(D)0.190.190.230.200.170.220.200.210.170.220.170.16
Pielu’s evenness index(J’)2.162.121.831.862.021.951.961.972.111.892.062.13
Shannon index(H’)0.750.720.690.770.770.760.790.750.800.760.780.81
Simpson index(SI)2.492.672.171.782.331.861.731.931.881.531.771.74
Table 2. The monthly rank of conditional co-occurrence probabilities of crab species in different months.
SpeciesTime
20152016
OctNovDecJanFebMarArpMayJuneJulyAugSepRank
Helicana doerjesi1281011579979987
Helice formosensis18111091067561636
Mictyris brevidactylus3111111134411
Macrophthalmus banzai1112121334412
Macrophthalmusab reviatus1767888121111811129
Ocypode ceratophthalmus1379107129891113119
Ocypode stimpsoni19108561061012101098
Ocypode sinensis9111212131413141513151514
Uca arcuata2333333411133
Uca formosensis1919146109861067711
Uca lactea6464434211134
Uca perplexa15131212141413151513151516
Uca borealis8446955757365
Scopimera longidactyla15131512151413151513151520
Scopimera globosa4201512151413151513151516
Scopimera bitympana716151212129131411131313
Scylla serrata11131512151413151513151516
Pagurus dubius14161512151413151513151521
Diogenes penicillatus4201512151413151513151516
Parapagurus diogenes1916151215111315813121315
Parapagurus obtusifrons10851215141312131381012
Publisher’s Note: MDPI stays neutral with regard to jurisdictional claims in published maps and institutional affiliations.

