Article

On Power-Absorption Degrees of Freedom for Point Absorber Wave Energy Converters

School of Mechanical Engineering, Southeast University, Nanjing 211189, China
J. Mar. Sci. Eng. 2020, 8(9), 711; https://doi.org/10.3390/jmse8090711
Submission received: 22 August 2020 / Revised: 8 September 2020 / Accepted: 11 September 2020 / Published: 14 September 2020
(This article belongs to the Section Ocean Engineering)

Abstract

:
Point absorbers are extensively employed in wave energy conversion. In this work, we studied the point absorber with the buoy of a vertical cylindrical shape. Wave power absorption is obtained through the relative motion between the buoy and an internal mass. Three power-absorption degrees of freedom are investigated, i.e., surge, heave, and pitch, together with the influence of wave compliance of the buoy. Results show that, to absorb more power, the internal mass should be as large as possible for power absorption in translational degrees of freedom, i.e., surge and heave. The total rotational inertia should be as large as possible and the center of mass should be as low as possible for power absorption in pitch. Wave compliance of the buoy slightly enhances the power absorption in surge, but significantly weakens the power absorption in pitch. Surge is the best degree of freedom for power absorption owing to the highest efficiency, indicated by the largest capture width ratio. The simple resistive control is found to be adequate for wave power absorption of the self-reacting point absorber.

1. Introduction

Wave energy is a promising alternative renewable energy resource [1,2]. The European Marine Energy Centre (EMEC) [3] classified wave energy converters (WECs) into nine types: point absorber, terminator, attenuator, overtopping, oscillating water column, etc. A point absorber is characterized by its small dimension compared to the wavelength and the relatively large motion response to incident waves, and is by far the most investigated type. Statistical results from EMEC revealed that point absorber developers account for 30% of total wave developers, implying its advantage over other WECs. A point absorber consists of a buoy, which is normally axisymmetric, that oscillates with waves while it reacts against a reference, and power absorption is obtained through the relative motion between the buoy and the reference via a power take-off (PTO) system. The reference can be either a fixed type, e.g., the seabed [4,5], or a moving type, e.g., a resistive plate [6,7]. When point absorbers are deployed nearshore, a fixed reference is a natural choice. However, in offshore areas, where point absorbers are more likely to be deployed due to higher incident power intensity, the cost of implementing a fixed reference is too high to be impractical. As a result, a moving reference is a better option for offshore applications. A moving reference can either be a submerged resistive plate [8], which oscillates with only small amplitude due to large added mass and small excitation force, or an internal mass inside the buoy [7]. The point absorber that employs an internal mass as the reference has the advantage of avoiding external moving parts and resulting in a simplified system requiring little maintenance [9]. French et al. [10] found that the large structural element in the cost of wave energy conversion can be cut down by using point-absorbers reacting against an internal moving mass. Budar et al. [11] proposed to design the power absorption machinery inside the wave energy converter (WEC) hull, so that, except for a mooring wire and anchor, no installation is then necessary on the bottom of the sea.
A unidirectional wave is able to excite a buoy to oscillate in three degrees of freedom: surge, heave, and pitch [12]. For the point absorber with an axisymmetric buoy reacting against a fixed reference, the theoretical maximum absorbed power in heave is J/k, where J is the incident energy flux per unit wave crest and k is the wave number, while in both surge and pitch is 2J/k [13,14,15]. The point absorber with a buoy reacting against an internal mass is essentially a two-body system. By using the “equivalent single-body model” proposed by Falnes [16], the theoretical maximum absorbed power of this point absorber is found to be identical to that with a fixed reference. However, the above conclusion is based on the idealized assumption that only one degree of freedom is employed to absorb wave power with others manually fixed. In practical applications, since point absorbers are normally moored at a single point [17,18,19,20], wave compliance of the buoy will make the above assumption unsatisfiable. For example, if surge is employed to absorb power, the buoy will inevitably oscillate in pitch. Pizer [21] found that wave compliance of the buoy does not necessarily weaken, but may also enhance, the power absorption of a solo duck WEC. Therefore, although the maximum absorbed power in surge and pitch are twice as much as in heave under the idealized assumption, the power absorption ability in each degree of freedom may be different in practical applications. In this paper, we take into consideration wave compliance of the buoy to find its influence on power absorption of a point absorber, which reacts against an internal mass, in each degree of freedom, and identify which degree of freedom is the best to be employed for wave power absorption. To enable results applicable in real seas, the investigation is performed in irregular waves.

2. Methods

Since vertical cylinders are most frequently used for point absorbers [9,17,19,22,23], and spheres do not couple with waves in pitch, we only consider vertical cylinders as the shape of the buoy of point absorbers. A schematic diagram of the point absorber is shown in Figure 1. A slack single-point mooring system is employed to keep the buoy in position. In a unidirectional wave, the incident wave will excite the surge, heave, and pitch motion of the buoy. Therefore, these three modes of motion can be adopted to extract energy from waves. Investigation on the power absorption process employs the linear wave theory, which assumes the fluid to be inviscid, incompressible, and limits motion amplitudes of both the wave and the buoy to be small and the flow to be irrotational.
Figure 2 shows the working principle of power absorption systems in the three degrees of freedom, i.e., surge, heave, and pitch, which are respectively numbered 1, 3 and 5 in later parts of this paper. For power absorption in each degree of freedom, the buoy oscillates with waves while reacting against an internal mass. Relative motion between the buoy and the internal mass drives the PTO system to produce useful power. When wave compliance of the buoy is taken into consideration, hydrodynamic coupling between different degrees of freedom should be considered. It has been widely recognized that heave response of an axisymmetric buoy in waves is decoupled from other degrees of freedom. Therefore, analysis of the power absorption in heave can be separated from others. Tarrant [24] found that parametric resonance may happen because heave may change hydrostatic restoring forces in other degrees of freedom, e.g., pitch, resulting in a resonance. However, since the motion amplitude in each degree of freedom is assumed small in this paper according to the linear wave theory, heave motion will not cause significant changes of hydrostatic restoring forces in other degrees of freedom, thus parametric resonance may be avoided. Other than heave, Young et al. [25] found that surge and pitch are fully coupled, which means that, when analyzing power absorption in either mode, the influence of the other degree of freedom should also be considered. Here, we first study power absorption in surge and pitch, and then in heave.

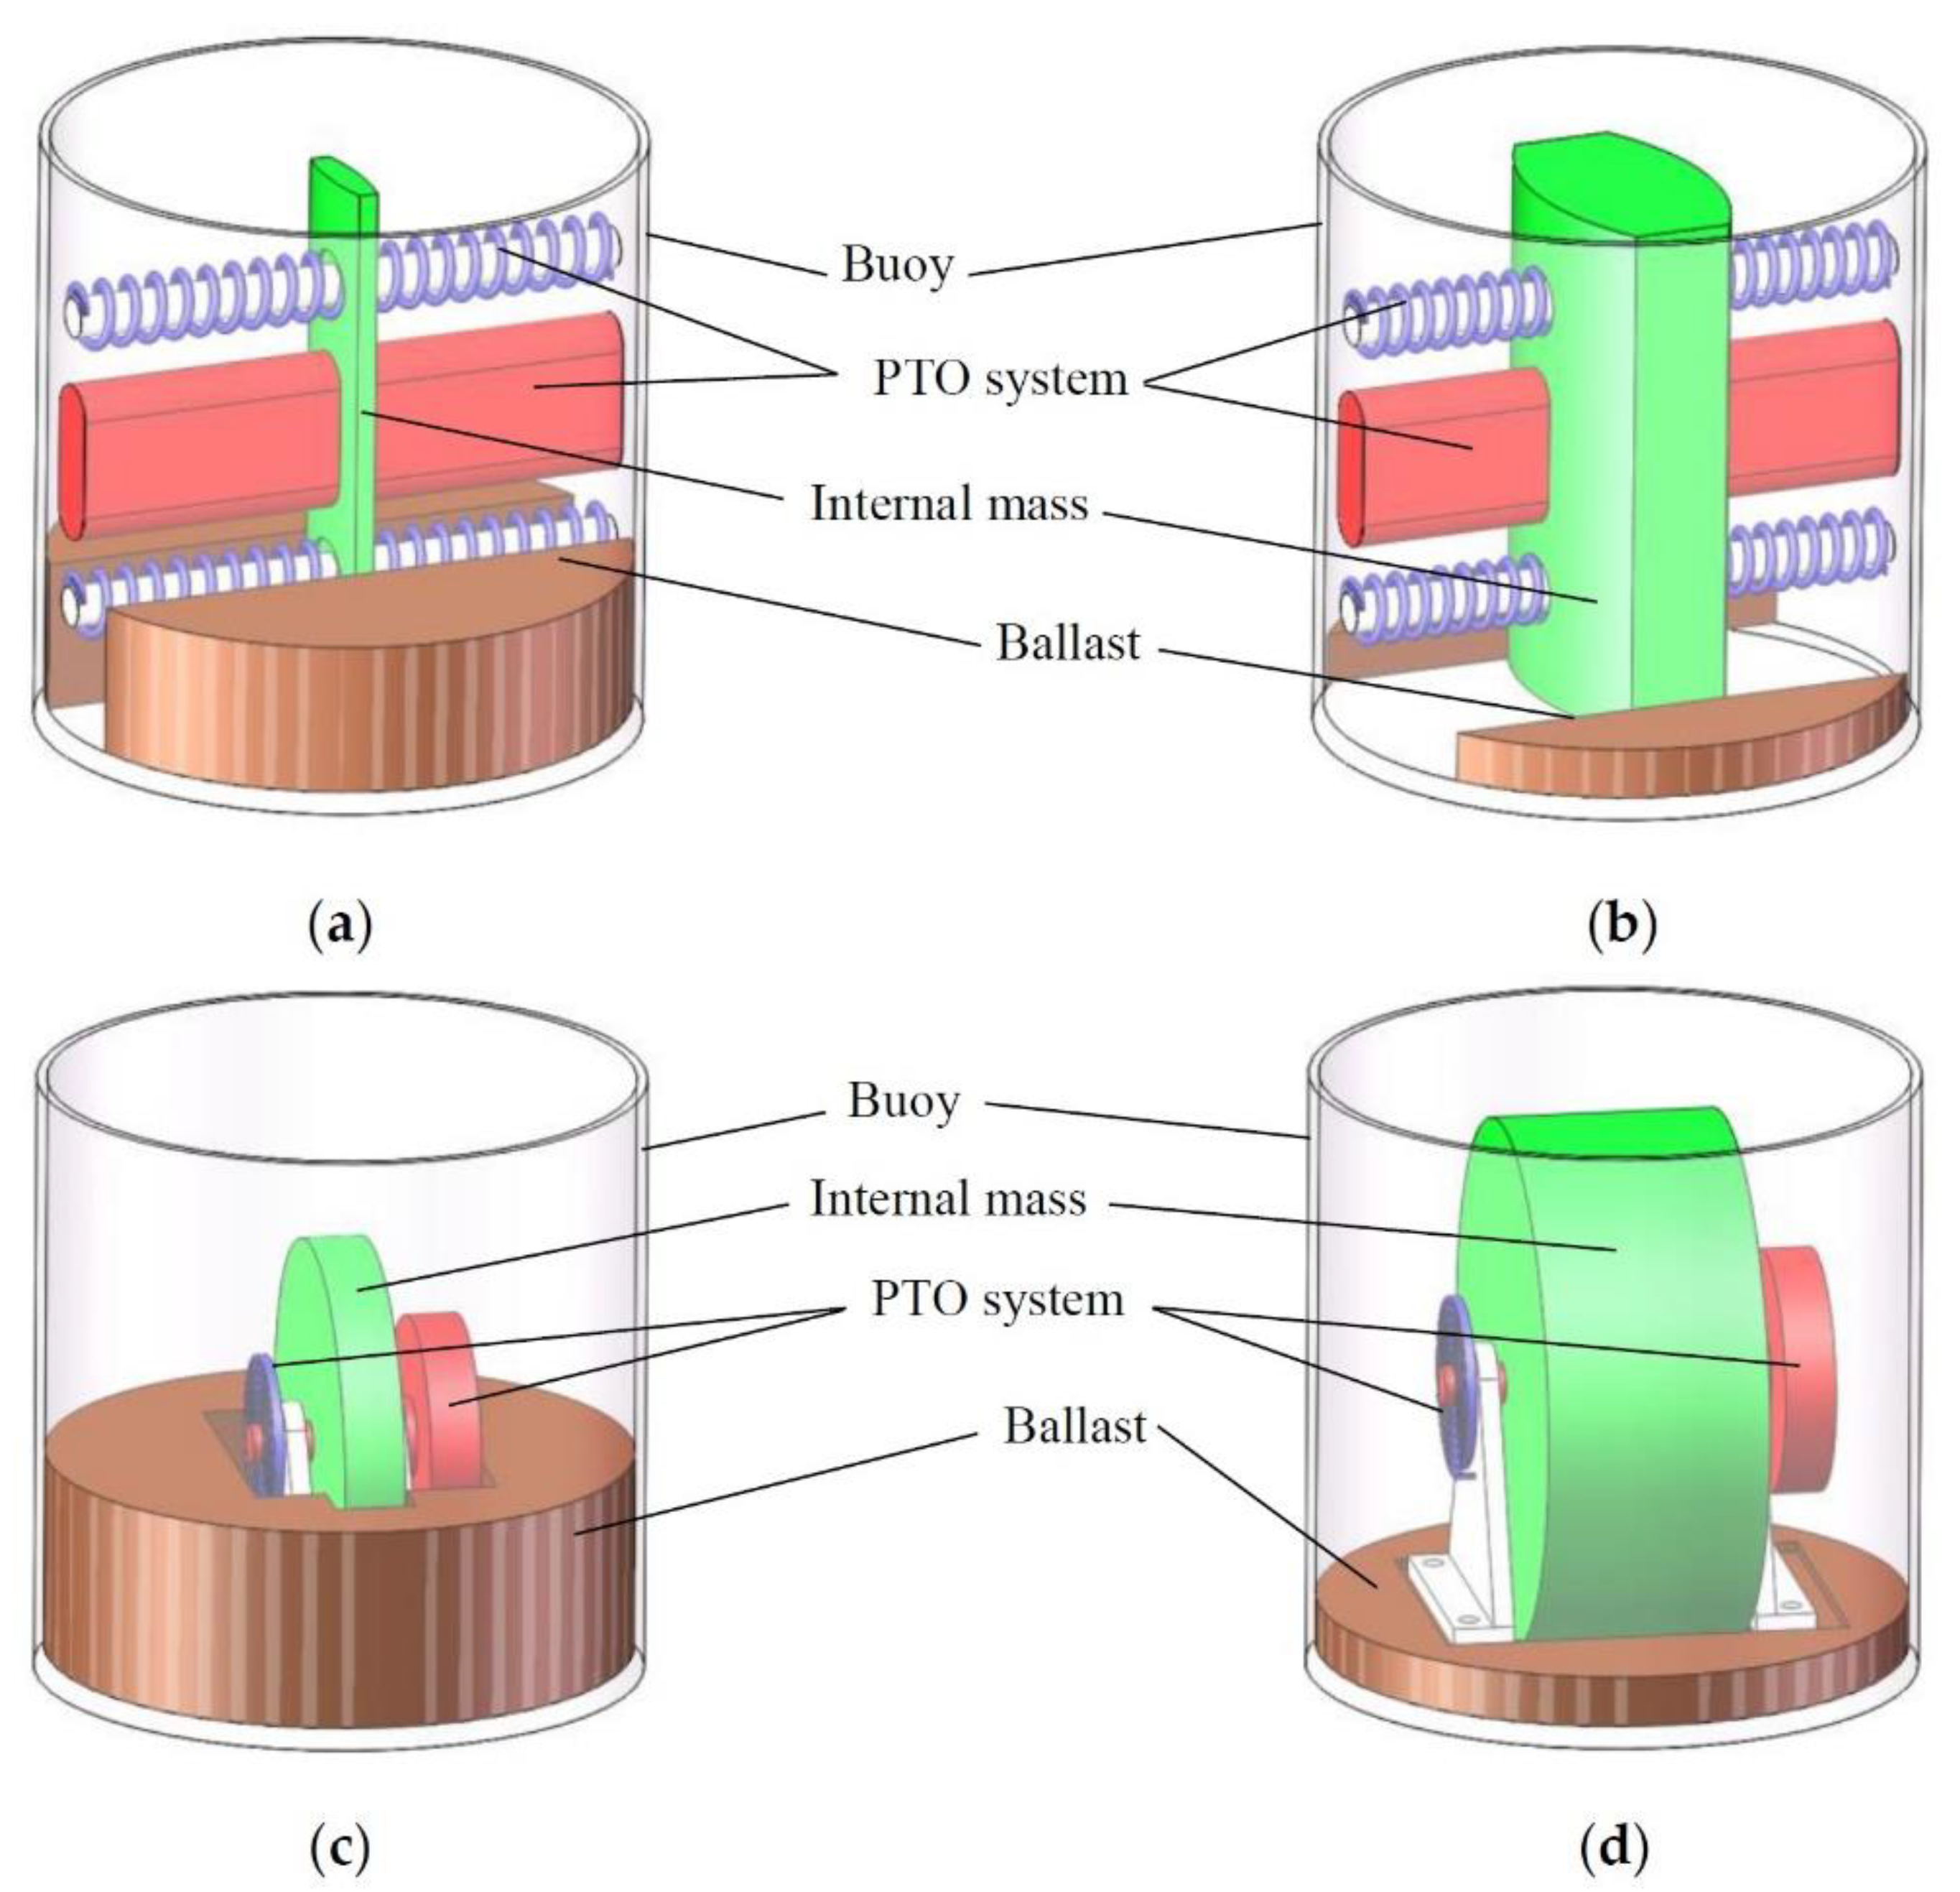
2.1. Power Absorption in Surge

Since surge and pitch are coupled, power absorption in surge should take into consideration the pitch response. The schematic diagram of the power absorption mechanism is shown in Figure 2a. Due to wave compliance, the buoy oscillates in both surge and pitch. Useful power is produced in surge by the buoy reacting against an internal mass via the PTO system. Meanwhile, the buoy oscillates freely in pitch. In monochromatic waves, equations of motion of the point absorber are
m x ¨ 1 = F e 1 + F r 1 + F u   , m i 1 x ¨ i 1 = F u   , I t 5 θ ¨ 5 = M e 5 + M r 5 + M s 5 .
Here, xj (j = 1, 3) and θ5 denotes the displacement and angular displacement of the buoy in surge, heave, and pitch, respectively, xij (j = 1, 3) and θi5 for the displacement and angular displacement of the internal mass, Fej (j = 1, 3) and Me5 for the excitation force and moment, Frj (j = 1, 3) and Mr5 for the radiation force and moment, and mij (j = 1, 3) and Ii5 for the mass and rotational inertia of the internal mass. m is the mass of the buoy. It5 is the total rotational inertia of the buoy and the internal mass since they oscillate together in pitch when wave power is absorbed in surge. Fu is the control force applied on the buoy by the PTO system. The radiation force and moment may be written as
F r 1 = c r 11 x ˙ 1 m r 11 x ¨ 1 c r 15 θ ˙ 5 m r 15 θ ¨ 5   , M r 5 = c r 55 θ ˙ 5 m r 55 θ ¨ 5 c r 51 x ˙ 1 m r 51 x ¨ 1   ,
where crij and mrij (i, j = 1, 3, 5) denote the radiation damping coefficient and added mass, respectively.
The hydrostatic restoring moment in pitch Ms5 is obtained as follows. Coordinates systems of the buoy are shown in Figure 3, including a global fixed coordinate system G-xyz and a body-fitted coordinates system G-xiyizi. Then, the hydrostatic restoring moment of the buoy in pitch is
M s 5 = ρ g V x c b ,
where ρ is the water density, g is the gravitational acceleration, V is the displaced volume, and xcb is the x coordinate of the center of buoyancy in the fixed coordinate system G-xyz. The displaced volume is
V = π r 2 [ d d g + d g cos ( θ 5 ) ]   ,
where d and dg are respectively the draft and the depth of center of mass of the buoy in still water; r denotes the radius of the buoy. We write the center of buoyancy in the body-fitted coordinate system G-xiyizi as (xicb, yicb, zicb). By integration, we have
x i c b = r 2 tan ( θ 5 ) 4 ( d d g + d g cos ( θ 5 ) ) ,
and
z i c b = 4 [ d g 2 cos 2 ( θ 5 ) ( d d g ) 2 ] + r 2 tan 2 ( θ 5 ) 8 ( d d g + d g cos ( θ 5 ) ) .
Then, by a transformation of coordinates, xcb can be written as
x c b = r 2 sin ( θ 5 ) 4 ( d d g + d g cos ( θ 5 ) ) + 4 ( d g 2 cos 2 ( θ 5 ) ( d d g ) 2 ) + r 2 tan 2 ( θ 5 ) 8 ( d d g + d g cos ( θ 5 ) ) sin ( θ 5 ) .
Inserting Equations (4) and (7) to Equation (3) gives
M s 5 = ρ g π r 2 sin ( θ 5 ) { r 2 8 [ 2 + tan 2 ( θ 5 ) ] + 1 2 [ d g 2 cos 2 ( θ 5 ) ( d d g ) 2 ] } .
Differentiate Ms5 with respect to θ5 around zero and neglect non-significant second order terms, the hydrostatic restoring stiffness is
τ s 5 = d M s 5 d θ 5 = ρ g π r 2 4 ( r 2 + 4 d d g 2 d 2 ) .
According to the small-motion-amplitude assumption of the linear wave theory, the hydrostatic restoring moment can be linearized around zero pitch angular displacement as
M s 5 = τ s 5 θ 5 .
Then, we come to define the control force Fu. To date, many control methods have been proposed in the wave energy conversion field. Advanced control methods, such as model predictive control [26], pseudo spectral control [27], latching control [28], etc., significantly improves power absorption of a WEC. Normally, for a given WEC, the more absorbed power resulted from a highly efficient control is accompanied by a larger motion amplitude. For point absorbers that absorb wave energy by reacting against an internal mass, the volume inside the buoy where the internal mass oscillates is quite limited. Therefore, the displacement amplitude of the relative motion between the buoy and the internal mass should not be too large, resulting in the fact that advanced control methods may lose their advantages. Resistive control, though less efficient than others, may be a good alternative due to its simplicity, robustness, and unidirectional energy flow, and has been widely used for point absorbers [8,20]. In this paper, resistive control is employed in the power absorption of point absorbers, and the PTO system is modeled as a spring-damper system with the control force defined by
F u = c u ( x ˙ 1 x ˙ i 1 ) k u ( x 1 x i 1 )   ,
where cu and ku are the damping coefficient and spring stiffness of the PTO system, respectively.
Inserting Equations (2), (10), and (11) into Equation (1) gives
m x ¨ 1 + c r 11 x ˙ 1 + m r 11 x ¨ 1 + c r 15 θ ˙ 5 + m r 15 θ ¨ 5 + k c ( x 1 x i 1 ) + k u ( x 1 x i 1 ) + c u ( x ˙ 1 x ˙ i 1 ) = F e 1   , m i 1 x ¨ i 1 k c ( x 1 x i 1 ) k u ( x 1 x i 1 ) c u ( x ˙ 1 x ˙ i 1 ) = 0   , I 5 θ ¨ 5 + c r 55 θ ˙ 5 + m r 55 θ ¨ 5 + c r 51 x ˙ 1 + m r 51 x ¨ 1 + k 5 θ 5 = M e 5   .
We define
x = [ x 1 x i 1 θ 5 ] T   ,   F = [ F e 1 0 M e 5 ] T   ,
where T denotes the transposition operation. Then, Equation (12) can be written in the matrix form
M x ¨ + C x ˙ + K x = F   ,
where
M = [ m + m r 11 0 m r 15 0 m i 1 0 m r 51 0 I t 5 + m r 55 ]   ,   C = [ c r 11 + c u c u c r 15 c u c u 0 c r 51 0 c r 55 ]   ,   K = [ k u k u 0 k u k u 0 0 0 τ s 5 ]   .

2.2. Power Absorption in Pitch

Deducing the equation of motion for this power absorption process is more or less the same as in Section 2.1. Here, we define
x = [ x 1 θ 5 θ i 5 ] T   ,   F = [ F e 1 M e 5 0 ] T   .
Then, we obtain the same equation of motion as Equation (14) with corresponding coefficients directly given as
M = [ m t + m r 11 m r 15 0 m r 51 I 5 + m r 55 0 0 0 I i 5 ]   ,   C = [ c r 11 c r 15 0 c r 51 c r 55 + c u c u 0 c u c u ]   ,   K = [ 0 0 0 0 τ s 5 + k u k u 0 k u k u ]   ,
where mt is the total mass of the buoy and the internal mass since they move together in surge when wave power is absorbed in pitch and equals the displaced mass.

2.3. Power Absorption in Heave
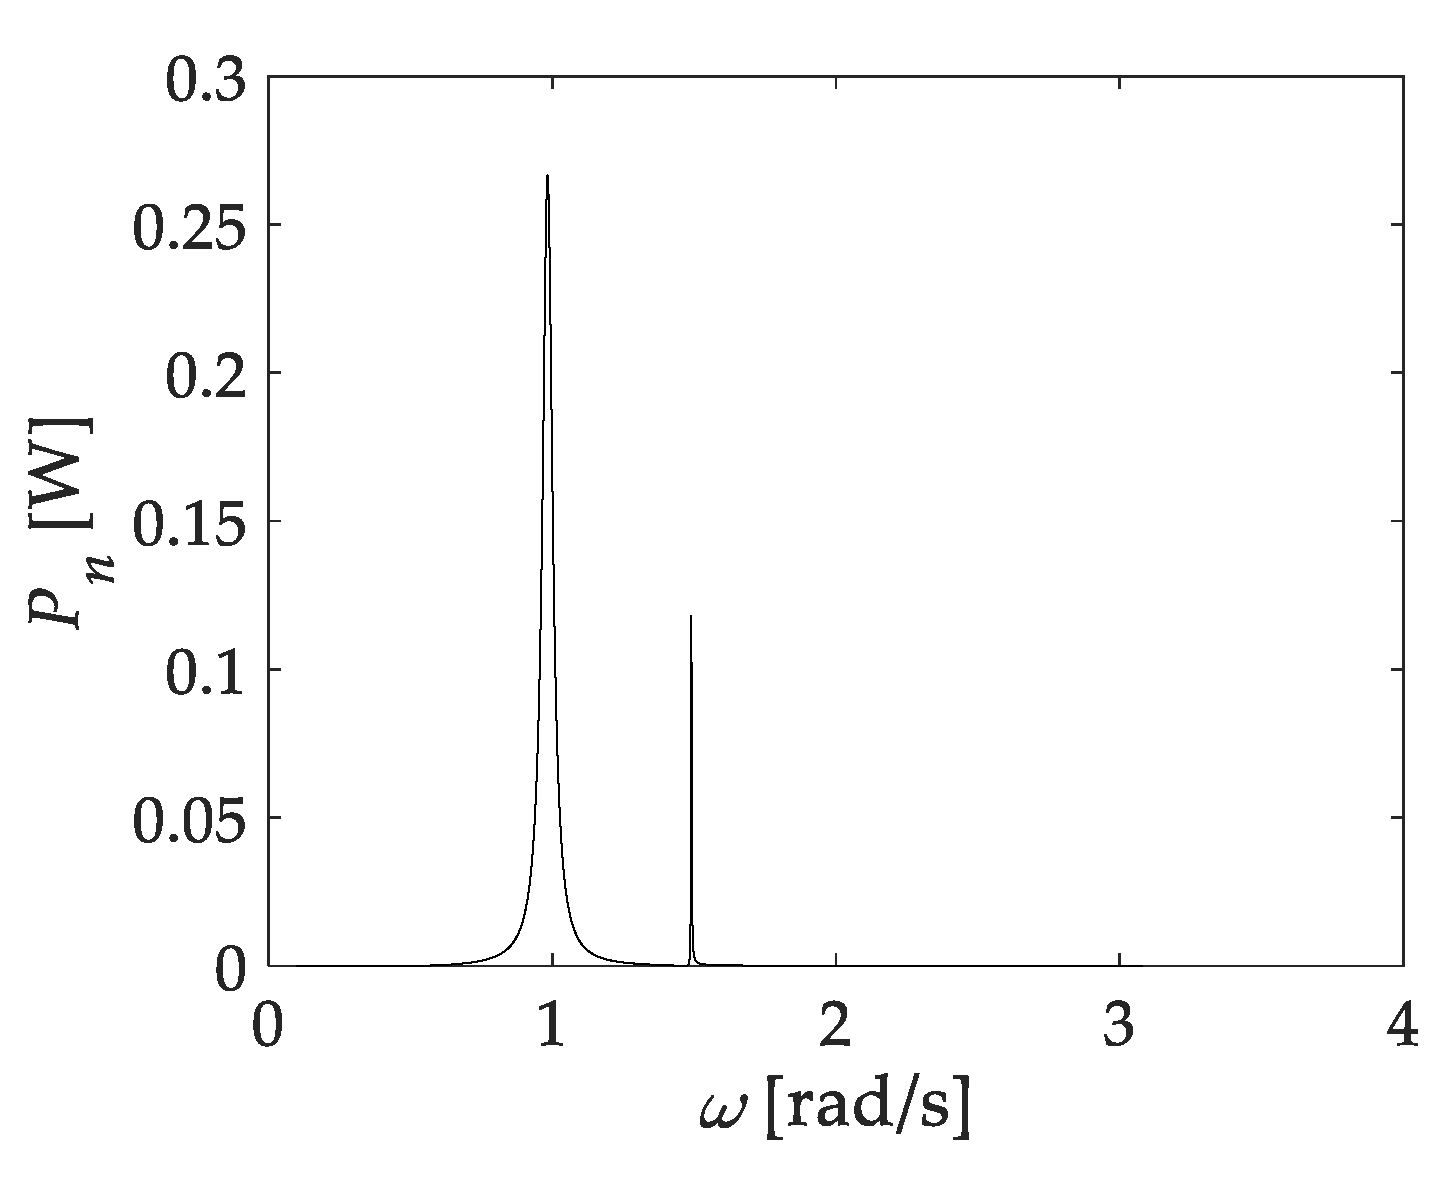
Since heave is decoupled from other degrees of freedom, power absorption in heave can be separated from others. Here, we define
x = [ x 3 x i 3 ] T   ,   F = [ F e 3 0 ] T   .
Again, we obtain the same motion of equation as Equation (14) with corresponding coefficients defined as
M = [ m + m r 33 0 0 m i 3 ]   ,   C = [ c r 33 + c u c u c u c u ]   ,   K = [ k s 3 + k u k u k u k u ]   ,
where ks3 is the hydrostatic restoring stiffness in heave.

2.4. Absorbed Power

In a monochromatic wave with frequency ω, by employing the form of complex amplitude as introduced in [29], Equation (14) can be written as
x ˙ ^ = [ C + i ( M ω K ω ) ] 1 F ^   .
Time-averaged absorbed power through the relative motion between the buoy and the internal mass is
P = 1 2 c u | x ˙ ^ b j x ˙ ^ i j | 2   j = 1 , 3   or   P = 1 2 c u | θ ˙ ^ b 5 θ ˙ ^ i 5 | 2   .
In real seas, waves are usually irregular. A common treatment of irregular waves is to decompose them into regular-wave components, whose amplitude are determined by a discretized wave spectrum. The Pierson–Moskowitz spectrum is one of the most commonly used wave spectra and is defined by
S h ( ω ) = 262.9 H s 2 ω 5 T e 4 exp ( 1054 ω 4 T e 4 )   ,
where Hs is the significant wave height and Te the energy period. For the n-th discretized regular-wave component with the frequency ωn, the wave amplitude is
A n = 2 S h ( ω n ) Δ ω   ,
where Δω is the sampling interval of the discretized frequency. Then, the velocity column may be written by
x ˙ ^ ( ω n ) = { C ( ω n ) + i [ M ( ω n ) ω n K ( ω n ) / ω n ] } 1 A n F ^ 0 ( ω n )   ,
where F ^ 0 is the excitation force column per unit wave amplitude. It is revealed in [30] that time-averaged absorbed power in irregular waves equals the summation of absorbed power at each discretized wave frequency, i.e.,
P = n P n   ,
where
P n = 1 2 c u | x ˙ ^ j ( ω n ) x ˙ ^ i j ( ω n ) | 2   j = 1 , 3   or   P n = 1 2 c u | θ ˙ ^ 5 ( ω n ) θ ˙ ^ i 5 ( ω n ) | 2   .
Due to the irregular feature, amplitude of the displacement of the point absorber varies wave-to-wave. However, this motion amplitude complies with the same statistic characteristic as the wave amplitude. Here, by imitating the definition of significant wave height, we employ the concept of significant motion amplitude, which is defined in [31] as the averaged highest one third motion amplitude, to quantitatively reflect the motion amplitude of the point absorber in irregular waves. To find the significant motion amplitude, we should first find the complex amplitude of the displacement of the buoy in each discretized wave frequency
x ^ ( ω n ) = [ K ( ω n ) M ( ω n ) ω n 2 + i C ( ω n ) ω n ] 1 A n F ^ 0 ( ω n )   .
Then, the motion-amplitude spectrum is
S m = | x ^ ( ω n ) | 2 2 Δ ω   .
Finally, we obtain the significant motion amplitude as
x s = 2 m 0   ,
where m0 is the zero-order moment of the motion-amplitude spectrum
m 0 = 0 S m d ω   .

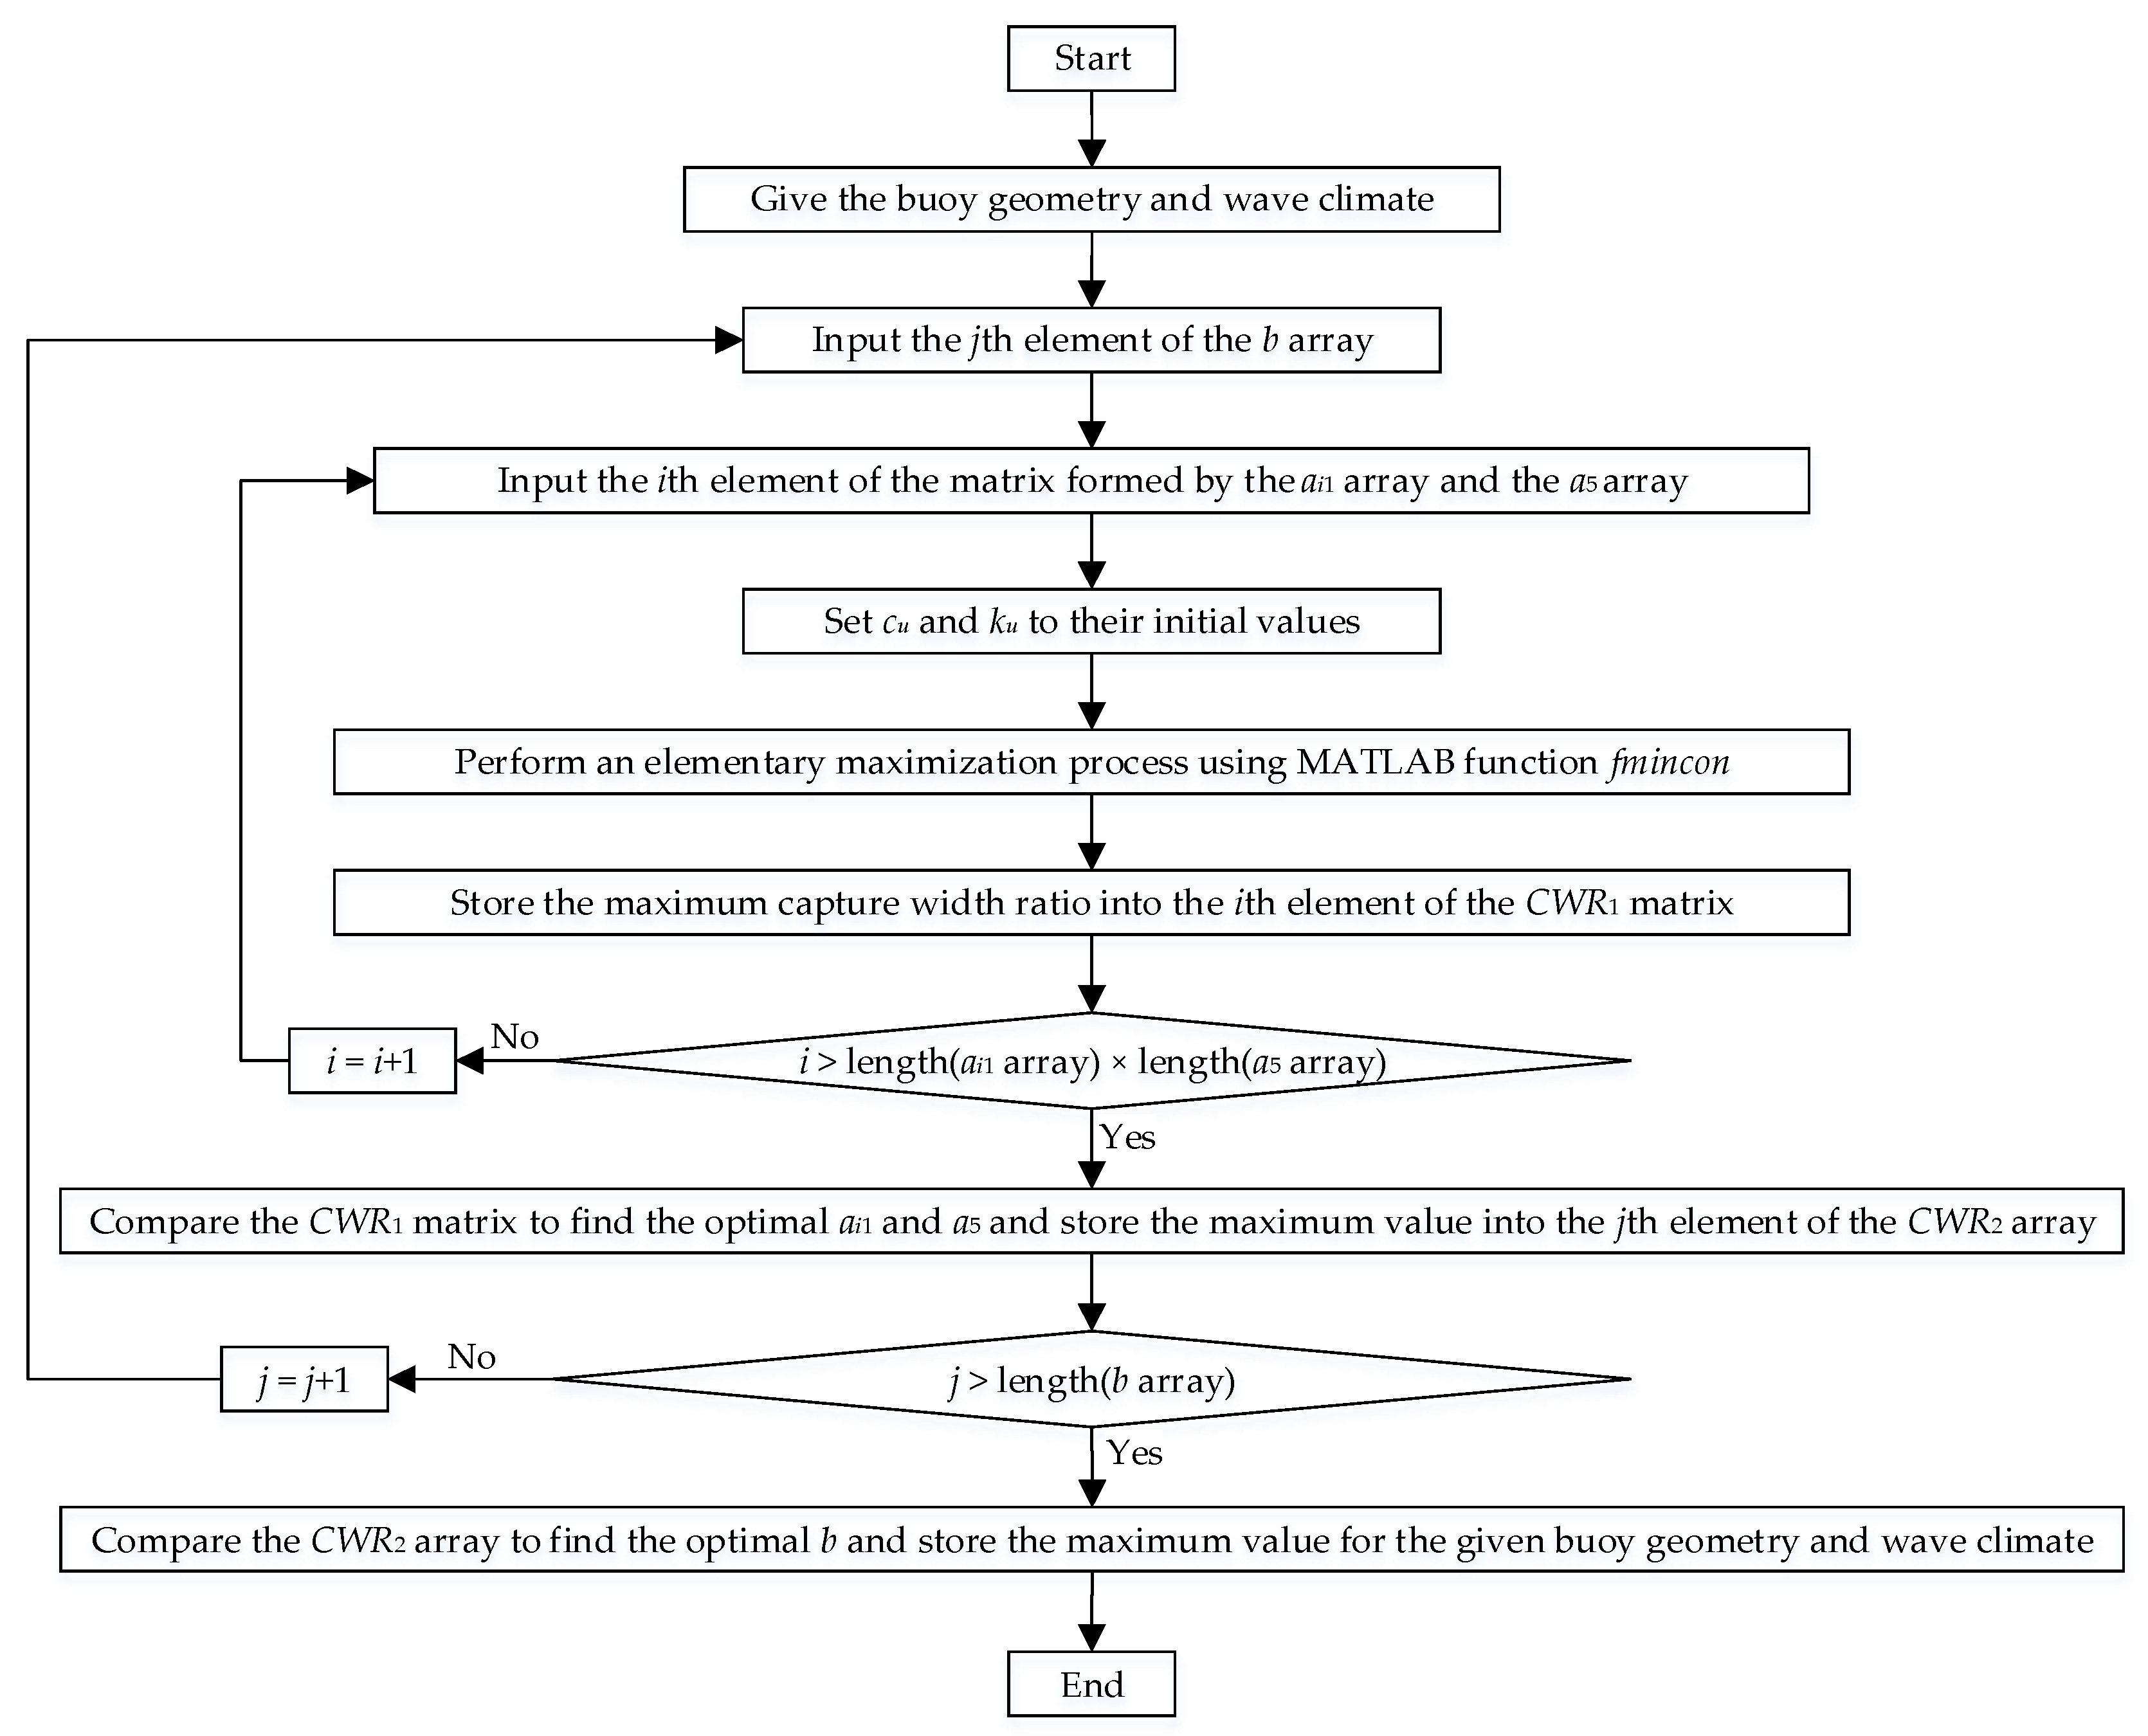
2.5. Setting of the Analysis Process

In order to provide a general guidance, non-dimensionalization of the results are preferred. To measure the power absorption ability of the point absorber, the concept of capture width ratio (CWR) is adopted defined as the absorbed power divided by the incident wave power within the width of the buoy
C W R = P W P i n   ,
where W is the width of buoy and Pin is the energy flux per unit wave crest and in irregular waves is
P i n = 1 64 π ρ g 2 T e H s 2   .
In order to broaden the application of the results in this paper, parameters that defines the point absorber are non-dimensionalized. The mass of the internal mass in surge and heave is mi1 = ai1mt, mi3 = ai3mt, and the rotational inertia of the internal mass in pitch is Ii5 = ai5I5t. The depth of the center of mass is dg = bd.
For a vertical cylinder, the minimum rotational inertia in pitch is zero when all masses are concentrated at the center of mass, while the maximum value be obtained as follows. The rotational inertia of a structure will be the maximum when its masses are distributed as far as possible from the center of mass. Here, we assume that all masses are concentrated at extreme side edges of the buoy in the xz plane, and are represented by a series of concentrated mass points, as shown in Figure 4. When the number of mass points in each sidewall is sufficiently large, the mass distribution can be deemed as continuous. In Figure 4, mlp and mrq (p = 1, 2, …, e, q = 1, 2, …, f) denote the concentrated mass of the p-th point on the leftmost edge and the q-th point on the rightmost edge, respectively; zlp and zrq denotes their z coordinates. The mass distribution should satisfy that the center of mass is located at point G, hence
p = 1 e m l p + q = 1 f m r q = m   , p = 1 e m l p r + q = 1 f m r q r = 0   , p = 1 e m l p z l p + q = 1 f m r q z r q = 0   .
Therefore, we have
p = 1 e m l p = q = 1 f m r q = 1 2 m   , p = 1 e m l p z l p = 1 2 m z l   , q = 1 f m r q z r q = 1 2 m z r   .
where zl and zr are z coordinates of the center of mass containing all mass points in the leftmost and rightmost edges, respectively, and zl + zr = 0. The rotational inertia of the buoy in pitch is
I 5 = p = 1 e m l p ( z l p 2 + r 2 ) + q = 1 f m r q ( z r q 2 + r 2 ) = p = 1 e m l p z l p 2 + q = 1 f m r q z r q 2 + m r 2   .
From Equation (33), we can express the mass of the leftmost top and bottom points with respect to the mass of other points
m l 1 = 1 2 m z l z l e z l 1 z l e p = 2 e 1 m l p z l p z l e z l 1 z l e   , m l e = 1 2 m z l z l 1 z l e z l 1 p = 2 e 1 m l p z l p z l 1 z l e z l 1   .
Then, we can find the first term of the rightmost expression in Equation (35).
p = 1 e m l p z l p 2 = m l 1 y l 1 2 + m l e y l e 2 + p = 2 e 1 m l p y l p 2 = 1 2 m [ z l ( z l 1 + z l e ) z l 1 z l e ] + p = 2 e 1 m l p ( z l p z l 1 ) ( z l p z l e )   .
Similarly, the second term can be written as
q = 1 f m r q z r q 2 = 1 2 m [ z r ( z r 1 + z r f ) z r 1 z r f ] + q = 2 f 1 m r q ( z r q z r 1 ) ( z r q z r f )   .
From Figure 4, we found that, z coordinates of top mass points in both the leftmost and rightmost edges are the same, i.e., zl1 = zr1, and this is also suitable for bottom mass points, i.e., zle = zrf. Inserting Equations (37) and (38) into Equation (35) gives
I 5 = m z l 1 z l e + p = 2 e 1 m l p ( z l p z l 1 ) ( z l p z l e ) + q = 2 f 1 m r q ( z r q z r 1 ) ( z r q z r f ) + m r 2   .
Since middle points has the z coordinate between that of top and bottom points in both the leftmost and rightmost edges, we have
{ ( z l p z l 1 ) ( z l p z l e ) < 0   for   p   =   2 ,   3 ,   ,   e 1   , ( z r q z r 1 ) ( z r q z r f ) < 0   for   q   =   2 ,   3 ,   ,   f 1   .
Therefore, from Equation (39), we found that the maximum rotational inertia in pitch happens when the mass of middle points are zero, implying that masses are only concentrated at the top and bottom points, and the maximum rotational inertia is
I 5 max = m z l 1 z l e + m r 2   .
Rotational inertia of the buoy reaches maximum only when masses are concentrated at corner points in the xz plane, which is impractical. Therefore, rotational inertia of the buoy should be smaller than this maximum value, and is defined as I5 = a5I5max with a5 be within the range of 0.1 ≤ a5 ≤ 0.9 to avoid extreme conditions. Likewise, we constrain other non-dimensional coefficients within the same range as well, i.e., 0.1 ≤ ai1, ai3, ai5, b ≤ 0.9.
Figure 5 shows the structural configuration of the point absorber at different values of above non-dimensional parameters, with subfigures (a) and (b) for the case when wave power is absorbed in surge and subfigures (c) and (d) for pitch. Relative motion between the buoy and the internal mass drives a linear spring-damper PTO system to produce electricity. The damper can either be a linear generator as demonstrated in subfigures (a) and (b) or a rotary generator as demonstrated in subfigures (c) and (d). The internal mass as shown in subfigures (a) and (c), where ai1, ai5 = 0.1, looks obviously lighter than that as shown in subfigures (b) and (d), where ai1, ai5 = 0.9. Correspondingly, since a light internal mass implies a heavy buoy mass, the ballast in subfigures (a) and (c) looks much heavier than that in subfigures (b) and (d).
It has been revealed in [8,32] that a point absorber that reacts against an internal mass has a narrower bandwidth of the wave frequency for power absorption when compared to a point absorber reacting against an external submerged resistive plate. This suggests that, when discretizing the wave spectrum, the sampling interval of the wave frequency should be as small as possible. Figure 6 shows an example of the component power as a function of the sampling frequency when wave power is absorbed in surge. It is found that the absorbed power is concentrated at two narrow frequency ranges, i.e., around 0.98 and 1.49 rad/s, resulting from being close to the two natural frequencies of the WEC. Due to the narrow power absorption bandwidth, a highly accurate value of the absorbed power, which in irregular waves is the summation of the component power, requires that the sampling interval of the frequency is sufficiently small, which is chosen to be 2 × 10⁻⁵ rad/s in this work.

3. Results

To find the potential of power absorption in each degree of freedom, the maximum absorbed power should be obtained for the point absorber. In this section, we first find the maximum absorbed power and corresponding response in different degrees of freedom, then their differences are compared. The investigation is based on typical wave climates with energy periods that range from 4 s to 10 s [6] and a diameter of buoys from 2 m to 12 m [9].

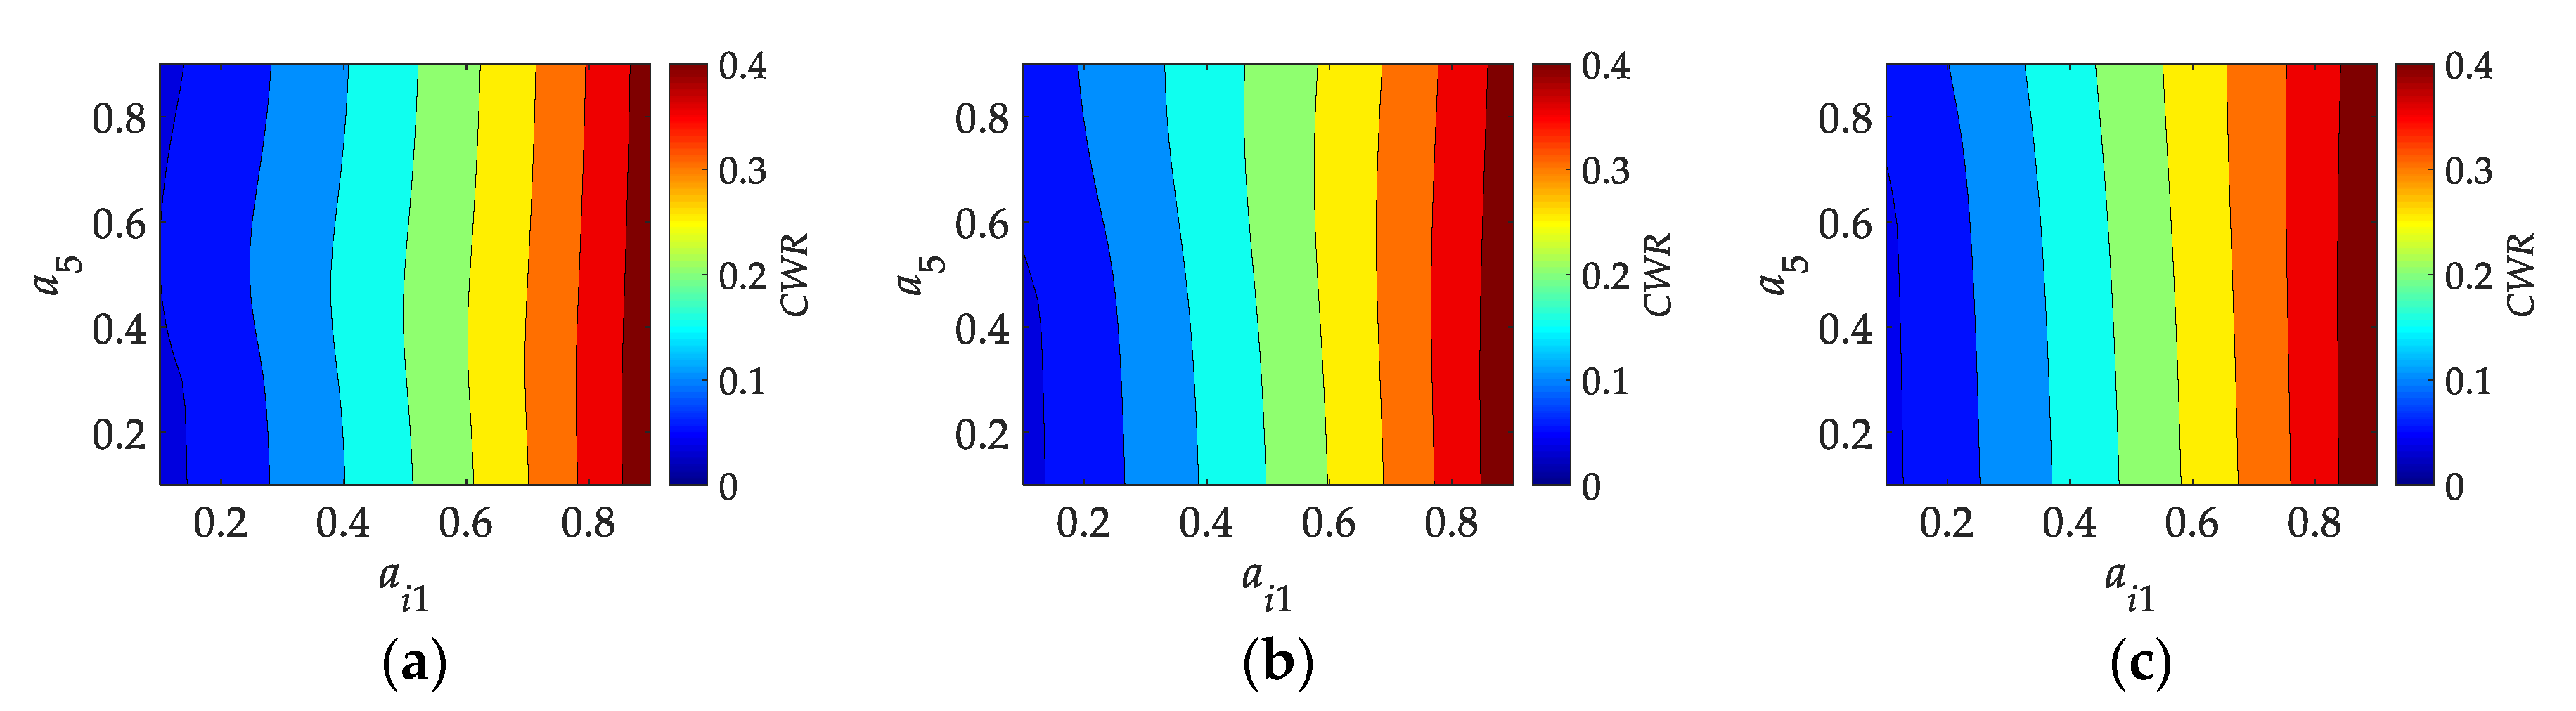
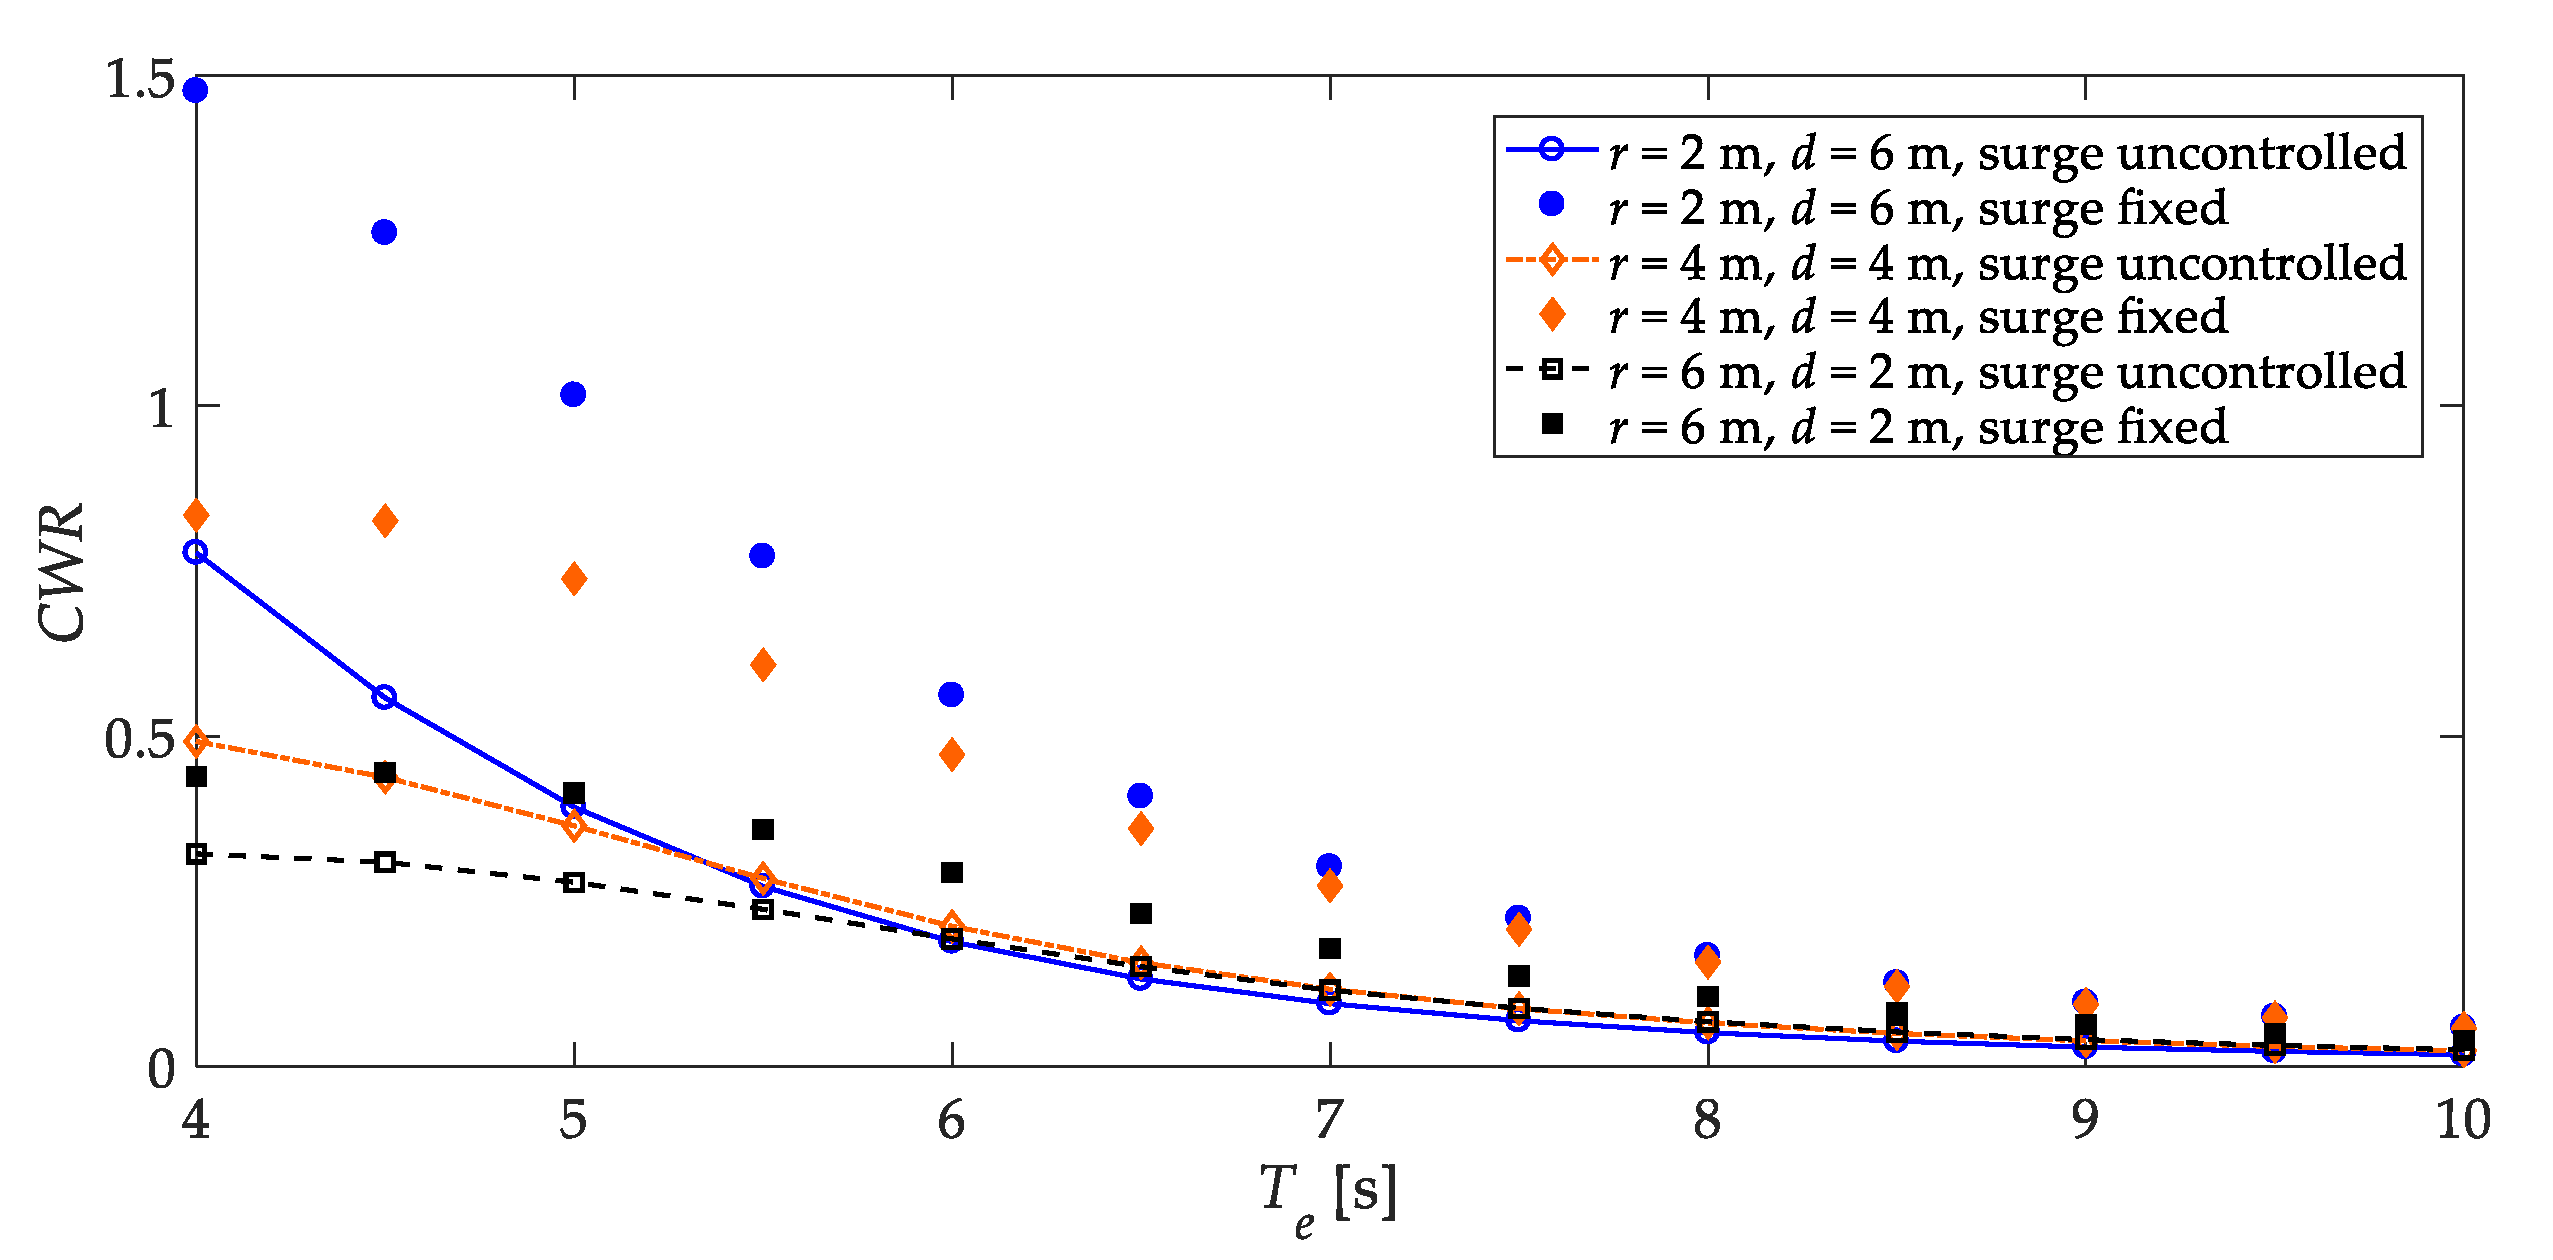
3.1. Maximum Power Absorption in Surge

The maximum power absorption can be found when parameters of the point absorber are optimized, whose flowchart is shown in Figure 7. For a given buoy geometry, wave climate, depth ratio of the center of mass b, internal mass ratio ai1 and rotational inertia ratio in pitch a5, we can find the maximum absorbed power of the buoy through an elementary maximization process with the objective function defined by Equation (26). To perform this elementary maximization, the MATLAB function fmincon, which employs the interior point algorithm, is adopted. In this process, initial values of cu and ku should be set as an initial guess of the optimal solution. Based on this maximization process, the maximum absorbed power can be found as a function of the internal mass ratio ai1 and rotational inertia ratio in pitch a5. Then, the maximum absorbed power and the optimal value of ai1 and a5 can be determined for the given buoy geometry, wave climate and depth ratio of the center of mass b. Repeating the above steps for different b, we can find the maximum absorbed power as a function of the depth ratio of the center of mass. Finally, by analyzing the changing trend of the absorbed power with respect to b, the maximum absorbed power and the corresponding optimal b can be determined for this particular buoy geometry and wave climate. Since the elementary maximization process is in the innermost loop of the optimization procedure, in each scenario of the non-dimensional parameters, e.g., ai1, ai3, ai5 a5, and b, the maximum absorbed power is obtained with this elementary maximization process be executed, resulting in the PTO parameters being optimal.
Figure 8 shows an example of the maximum capture width ratio as a function of the internal mass ratio ai1 and rotational inertia ratio in pitch a5 at different depth ratios of the center of mass b for a given buoy geometry and wave climate. At different depth ratios of the center of mass, the absorbed power increases significantly with the increasing internal mass ratio while shows only weak dependence on the rotational inertia ratio in pitch. This finding is representative for other buoy geometries, wave climates, and depth ratios of the center of mass. Therefore, to absorb more power, the internal mass ratio should be as large as possible within the physical constraint.
Figure 9a shows an example of the maximum capture width ratio CWR as a function of the rotational inertia ratio in pitch a5 when the internal mass ratio ai1 is optimal and the depth ratio of the center of mass b = 0.9 for different buoy geometries. It shows that the rotational inertia in pitch has little effect on the absorbed power. Figure 9b shows an example of the maximum capture width CWR as a function of the depth ratio of the center of mass b when both the internal mass ratio ai1 and rotational inertial ratio a5 are optimal for different buoy geometries. It is found that the depth of the center of mass also does not significantly influence the absorbed power. In fact, the rotational inertia in pitch and the depth of the center of mass, which is defined as the pitch axis, affect pitch response more directly than surge. Therefore, as a summary of both subfigures, we conclude that the mass configuration in pitch does not significantly influence the power absorption in surge.
Due to wave compliance of the buoy, when wave power is absorbed in surge, the buoy will also oscillate freely in pitch since pitch is uncontrolled. Then, pitch is a non-absorbing degree of freedom. As a result, the power absorption will differ from that when surge is controlled while other degrees of freedom are fixed, which is commonly considered in the literature assuming only one degree of freedom to absorb power. Figure 10 shows the capture width ratio as a function of the energy period when wave power is absorbed in surge while pitch is either uncontrolled or fixed for different buoy geometries. We found that the buoy captures more power when the pitch motion is set free. This agrees with the finding of Pizer [21], who investigated the solo Duck wave energy converter reacting against a fixed reference and found that the uncontrolled pitch help enhance power absorption in the controlled surge. From Figure 10, we found that the enhancement is more obvious at small energy periods and gradually vanishes in large wave periods. Overall, the enhancement is quite limited.

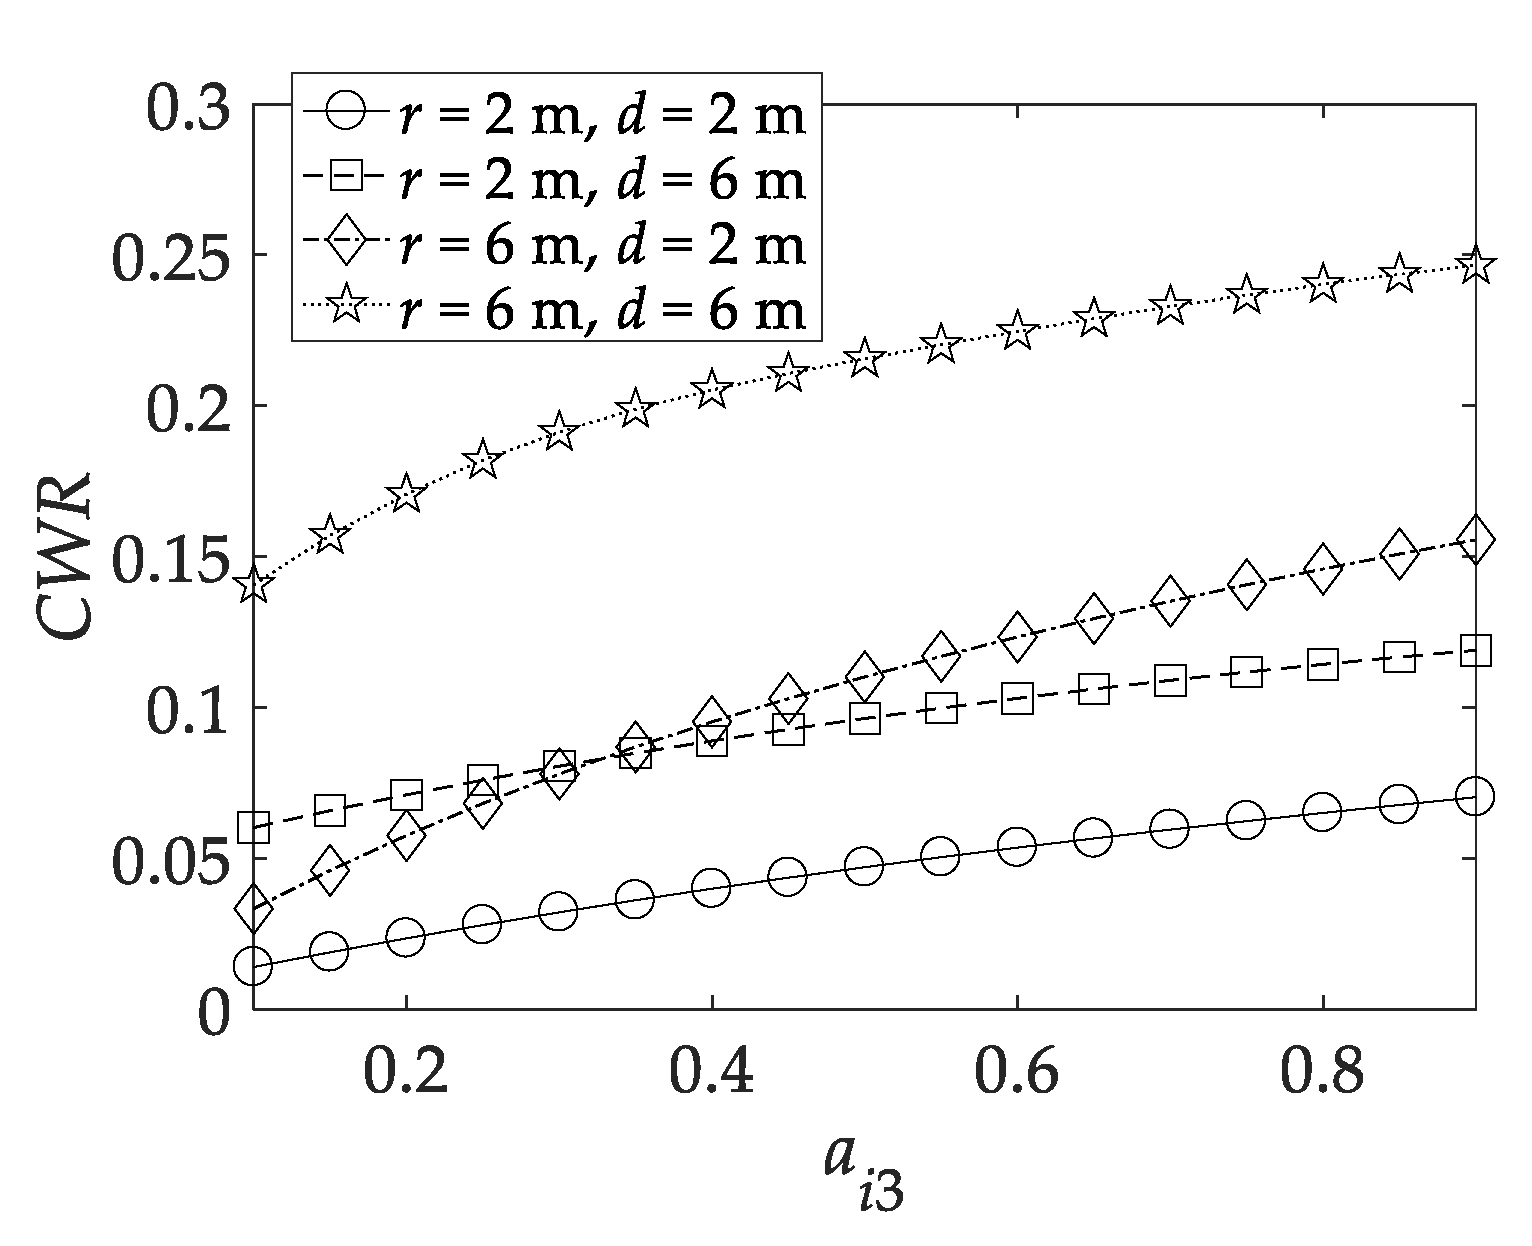
3.2. Maximum Power Absorption in Pitch

When wave power is absorbed in pitch, the optimization procedure is more or less the same as in surge, and the only alteration is to replace the internal mass ratio ai1 in Figure 7 by the internal rotational inertia ratio in pitch ai5. Figure 11 shows an example of the maximum capture width ratio as a function of the internal and total rotational inertia ratios in pitch at different depth ratios of the center of mass. It can be seen that the deeper the center of mass locates, the more sensitive to the total rotational inertia ratio a5 than the internal rotational inertia ratio ai5 the absorbed power is. Based on these results, an investigation is made on the effect of the depth of the center of mass on the absorbed power as shown in Figure 12. We found that, for all depths of the center of mass, the optimal rotational inertia ratios reside on their physical boundaries, and the maximum absorbed power increases with the depth of the center of mass. For buoy geometries and wave periods investigated in this paper, it is found that the optimal total rotational inertia ratio is always fixed at 0.9 while the optimal internal rotational inertia ratio varies at different cases. This indicates that the total rotational inertia should be as large as possible. Meanwhile, the optimal depth ratio of the center of mass is also found to be 0.9 for all cases, implying that the center of mass should be as low as possible. The above finding suggests that facilities inside the point absorber should gather at the bottom of the buoy and locates as far as possible from the pitch axis.
When wave power is absorbed in pitch, the buoy will also oscillate freely in surge since surge is uncontrolled. In this case, surge is a non-absorbing degree of freedom. As a result, the power absorption will differ from that when pitch is controlled while other degrees of freedom are fixed. Figure 13 shows the capture width ratio as a function of the energy period when wave power is absorbed in pitch while surge is either uncontrolled or fixed for different buoy geometries. We found that the buoy captures less power when the surge motion is set free. Pizer [21] also found this phenomenon for a solo duck WEC that for power absorption in pitch releasing a degree of freedom weakens the power absorption. Again, the difference of absorbed power between the cases when surge is uncontrolled and fixed is more obvious at small energy periods and gradually decreases with the increasing energy period. Compared to the slight enhancement of the absorbed power when wave power is absorbed in surge, a significant reduction of absorbed power is observed when wave power is absorbed in pitch with surge uncontrolled. This suggests that power absorption in pitch is more sensitive to wave compliance of the buoy than in surge.

3.3. Maximum Power Absorption in Heave

Since heave is decoupled from other degrees of freedom, both the total rotational inertia in pitch and the depth of the center of mass will not affect the absorbed power in heave. Therefore, the parameters that need optimization reduces. The optimization procedure is also similar to that in surge, but removing the outer loop in Figure 7 and input only one parameter, i.e., the internal mass ratio in heave ai3, in the inner loop. Figure 14 shows the maximum capture width ratio as a function of the internal mass ratio in heave at different buoy geometries for the wave climate of Te = 8 s. For each buoy geometry, the absorbed power increases with the internal mass, indicating that the heavier the internal mass is, the more wave power can be absorbed. For all buoy geometries and wave periods investigated in this paper, the optimal internal mass ratio is always fixed at 0.9, which suggests the internal mass should be as large as possible within physical boundaries.

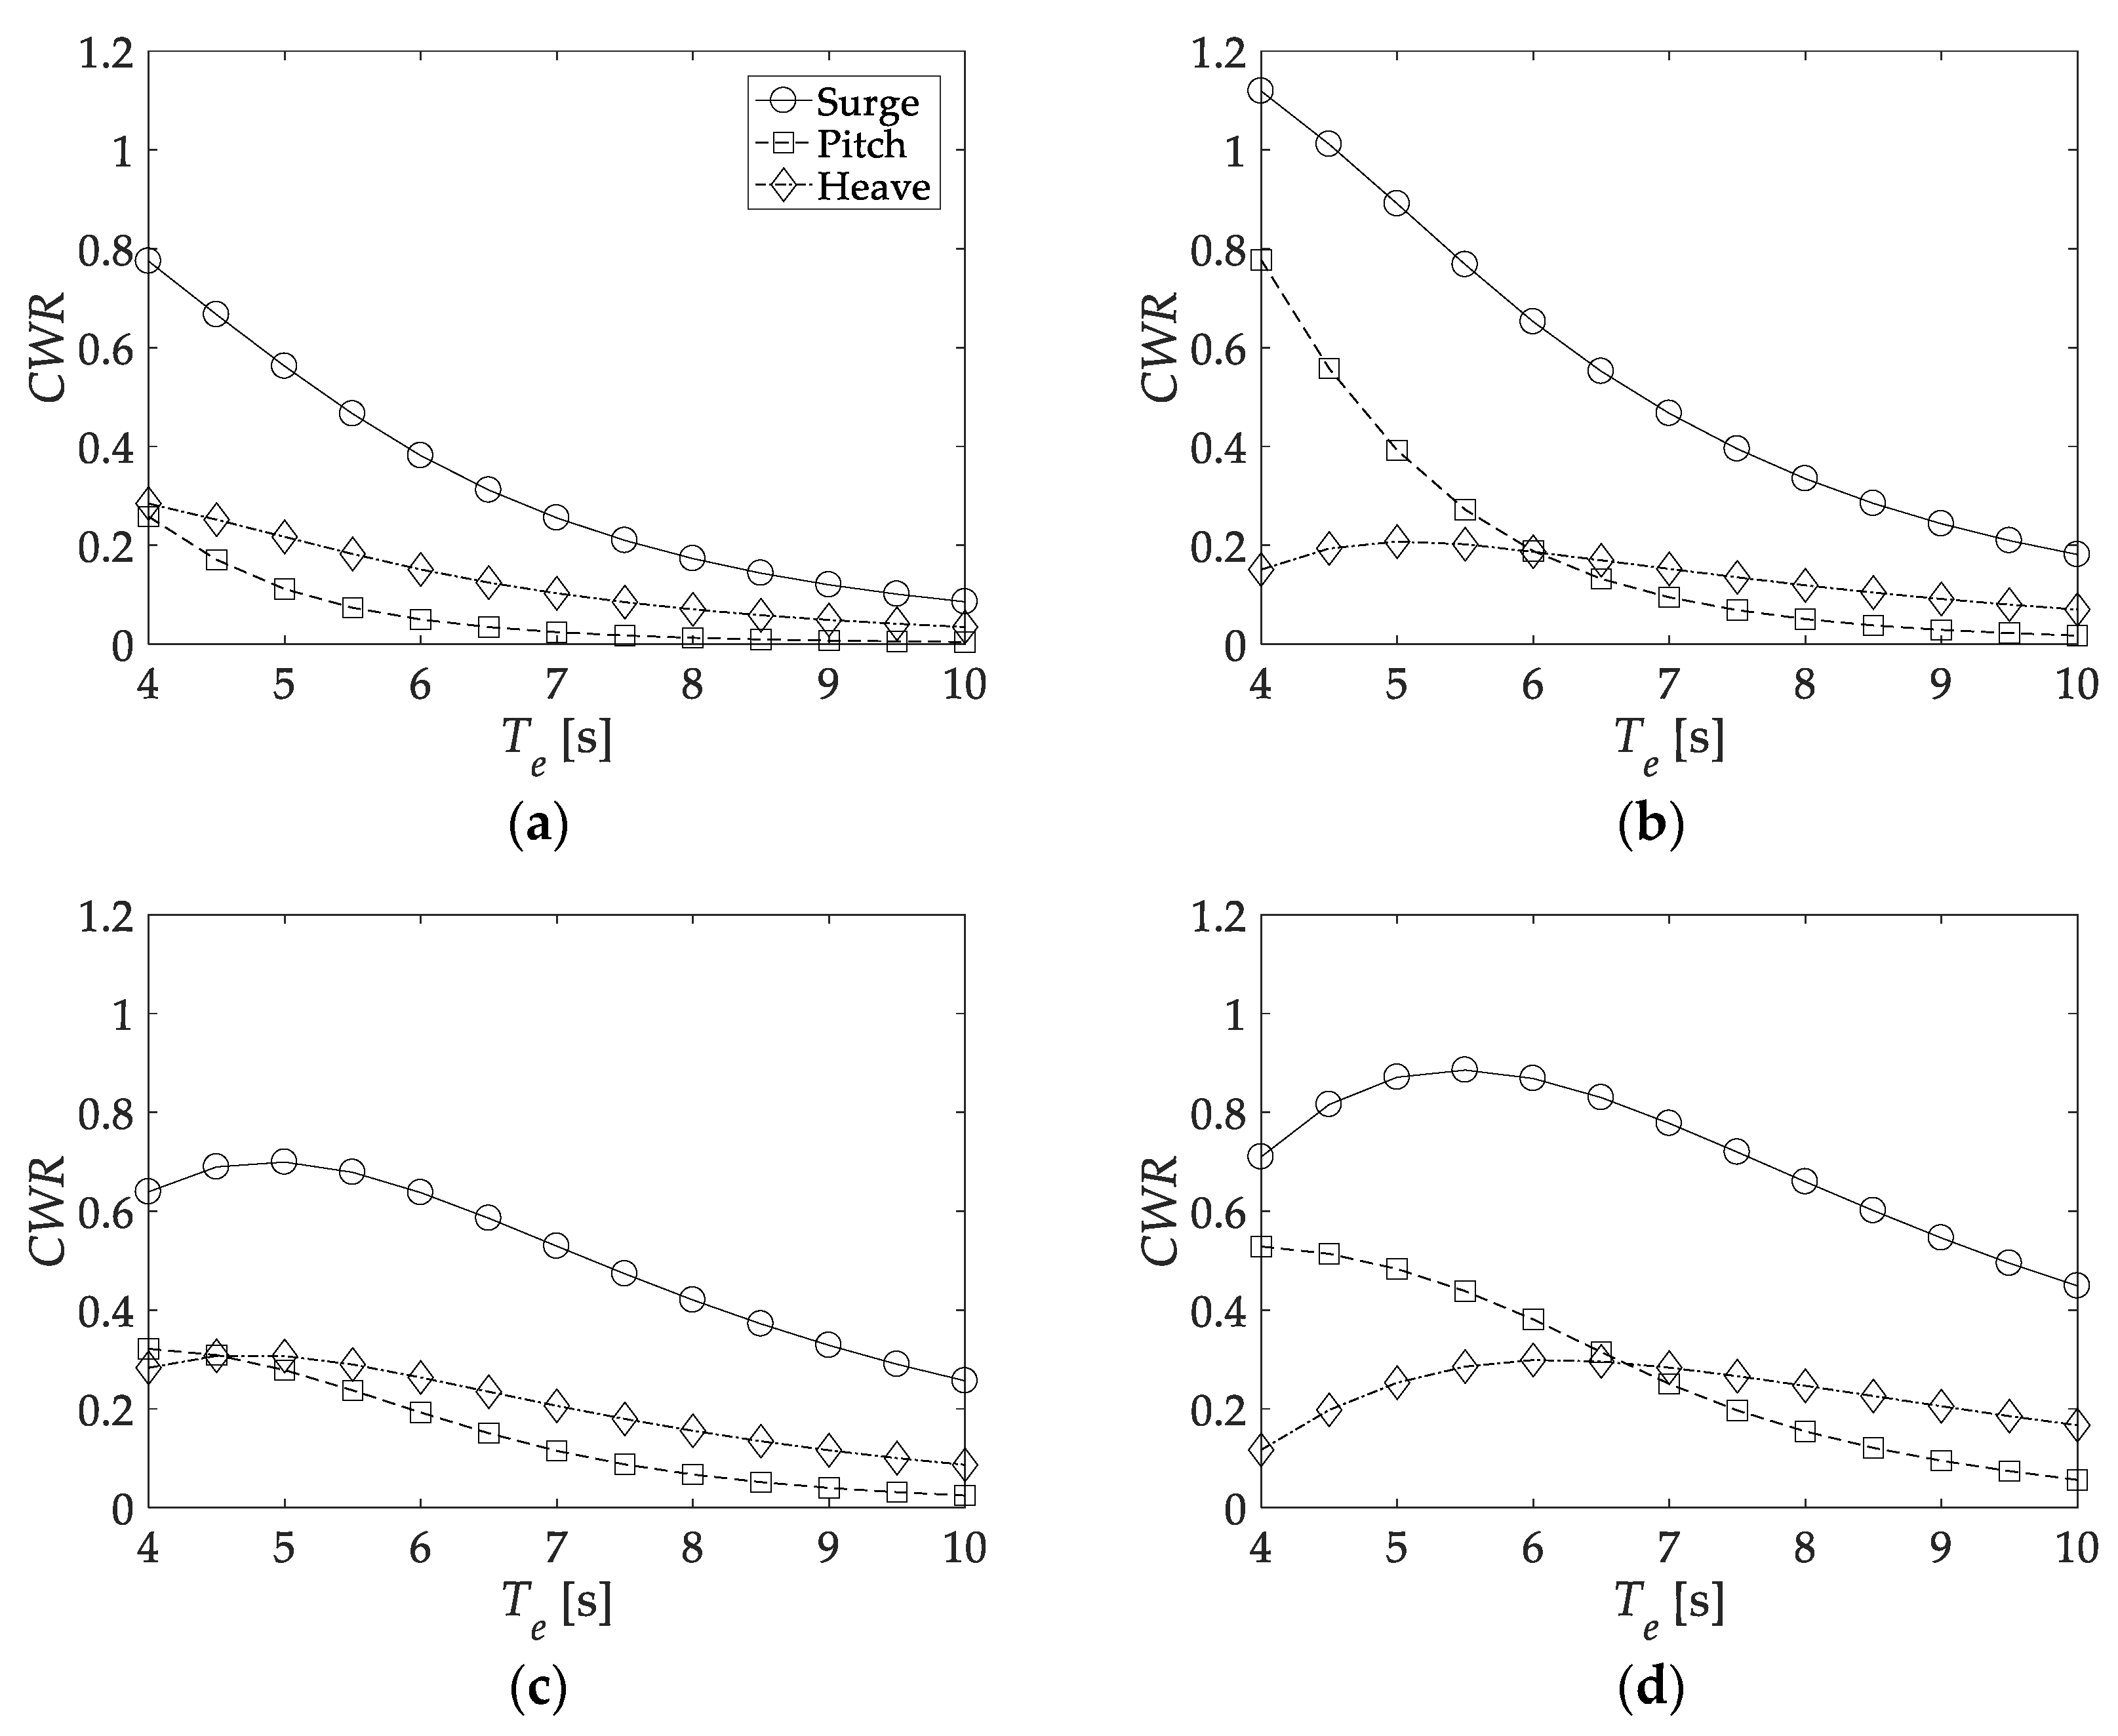
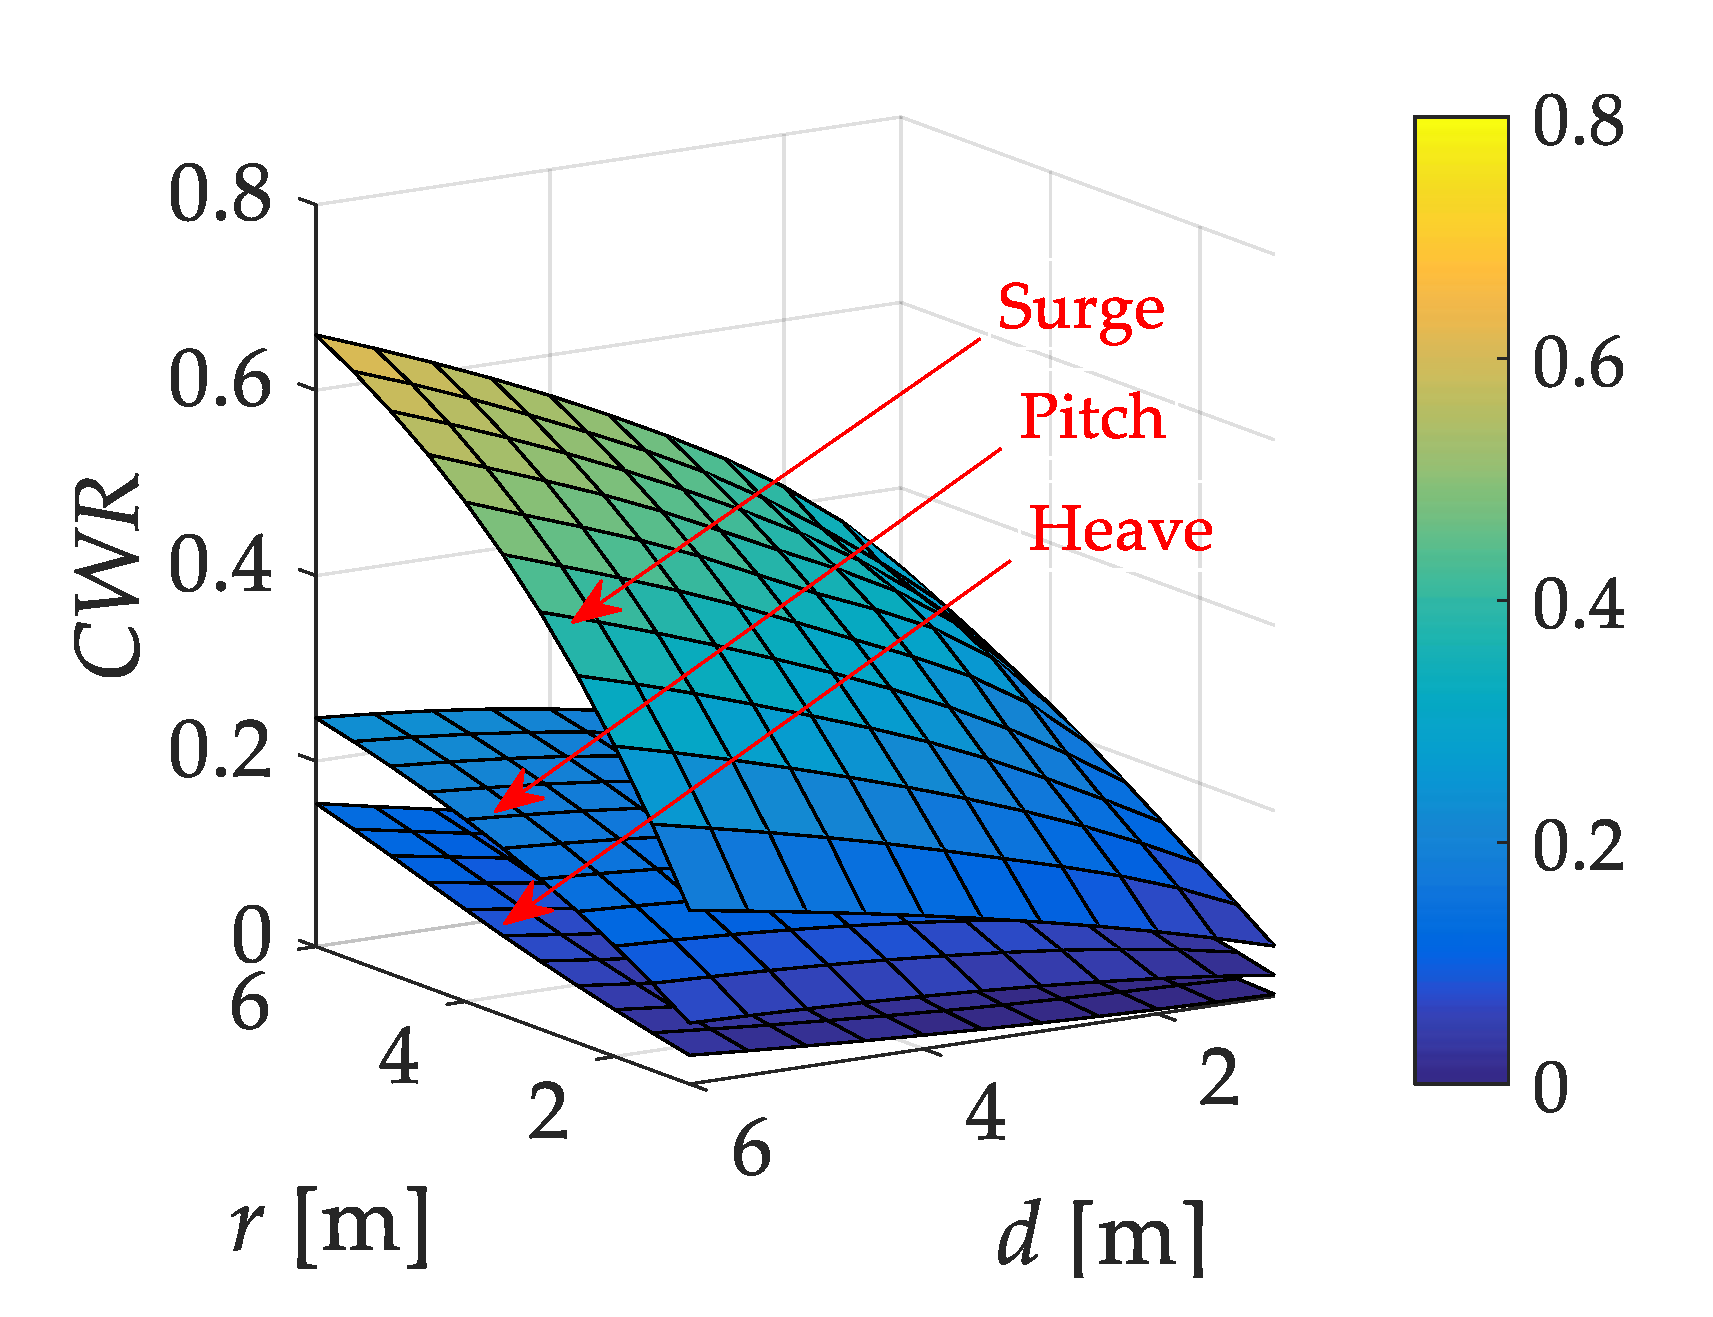
3.4. Comparison of Power Absorption between Different Power-Absorption Degrees of Freedom

Figure 15 shows the maximum capture width ratio as a function of the energy period at different buoy geometries and power-absorption degrees of freedom. It has been revealed by Falnes [33] that, for an axisymmetric buoy in regular waves, the maximum absorbed power in both surge and pitch is twice as much as in heave when other degrees of freedom are fixed. From Figure 15, we found that, when other degrees of freedom are set free, power absorption in surge always results in more absorbed power than the other two. The low absorbed power in heave is as expected. Meanwhile, the low absorbed power in pitch seems to result from the wave compliance of the buoy that significantly weakens the power absorption ability. Although the concept of resonance seems to be less clear in irregular waves due to the non-harmonic wave excitation, resonance at dominant wave periods plays an important role in improving the power absorption efficiency. For the buoy with a larger radius or draft, its nature period increases as well [33], resulting in the maximum power absorption efficiency appears at a larger wave period. This is obvious from the curves as shown in Figure 15. We take the power absorption in heave for example. When the draft d is fixed at 6 m, peak capture width ratio appears at the energy period of 5 s for the radius r = 2 m and 6 s for r = 6 m. When the radius is fixed at 6 m, the peak capture width ratio appears at 4.5 s for d = 2 m and 6 s for d = 6 m.
Figure 16 shows an example of the capture width ratio as a function of the buoy geometry at different power-absorption degrees of freedom and the energy period of 8 s. It can be seen that, within the buoy-geometry range of interest, power absorption in surge always captures more power than both pitch and heave. Combined with the observation above, we found that surge may be the best degree of freedom for a vertical cylindrical buoy that extracts wave power by reacting against an internal mass.
From Figure 3, we see that, when wave power is absorbed through a buoy reacting against an internal mass, the buoy should have sufficient volume to accommodate the internal mass. Since the internal mass oscillates inside the buoy, motion excursion of the relative displacement between the buoy and the internal mass should be smaller than the outmost dimension of the buoy to avoid physical interference. Of course, this is a quite rough derivation since we neglected the dimension of the internal mass itself and the structural configuration of inside the buoy. The above derivation means that, when wave power is absorbed in surge the significant relative displacement amplitude between the buoy and the internal mass should be smaller than the radius of the buoy and in heave be smaller than the draft of the buoy. When wave power is absorbed in pitch, the internal mass can be designed as a circular structure centered at the pitch axis, thus there will not be physical interference between the internal mass and the buoy at any pitch angular displacement. Therefore, pitch is not considered here. Figure 17 shows the relative displacement amplitude between the internal mass and the buoy non-dimensionalized by the radius, draft of the buoy when wave power is absorbed in respectively surge and heave as a function of the energy period at the significant wave height of 2 m. Both the relative surge and heave motion amplitude increase with the increasing energy period at different buoy geometries. The non-dimensionalized relative surge motion amplitude is larger than heave, which is in accordance with the absorbed power. According to the linear wave theory, the motion amplitude should be proportional to the wave height. When the wave height changes, vertical coordinates of the curves scales up and down accordingly. In energy periods when the non-dimensional relative motion amplitude exceeds 1.0, the internal mass physically interferes with the buoy, hence the maximum absorbed power should be obtained taking into consideration the motion constraint. As a result, the capture width ratio will be lower than displayed in Figure 15 and Figure 16. It should be mentioned that, for advanced control methods, the more absorbed power is accompanied by a larger motion amplitude. This seems to be unfriendly to the wave power absorption of the point absorber reacting against an internal mass, since the volume inside the buoy where the internal mass can oscillate is quite limited. Therefore, the simple resistive control employed in this paper may be a better option.

4. Conclusions

In this work, we studied the point absorber with the buoy of a vertical cylindrical shape. Wave power absorption is obtained through the relative motion between the buoy and an internal mass. Three power-absorption degrees of freedom are investigated, i.e., surge, heave, and pitch, together with the influence of wave compliance of the buoy. It is found that the mass configuration in pitch does not significantly influence the power absorption in surge. To absorb more power, the internal mass should be as large as possible for power absorption in translational degrees of freedom, i.e., surge and heave. The total rotational inertia should be as large as possible and the center of mass should be as low as possible for power absorption in pitch. Wave compliance of the buoy slightly enhances the power absorption in surge, but significantly weakens the power absorption in pitch. Surge is the best degree of freedom for power absorption owing to the highest efficiency, indicated by the largest capture width ratio. Even under the less efficient resistive control employed in this paper, the relative motion amplitude between the buoy and the internal mass easily physically interfere with the buoy at a low wave height, indicating that resistive control is adequate for wave power absorption of the self-reacting point absorber.

Funding

This research was funded by the NSFC of China, grant number 51905096, and the Basic Research Plan of Jiangsu Province, grant number BK20190373, the Innovative and Entrepreneurial Talents (Doctor) of Jiangsu Province and was also supported by “the Fundamental Research Funds for the Central Universities”.

Conflicts of Interest

The authors declare no conflict of interest.

Nomenclature

a5Non-dimensional rotational inertia of the buoy in pitch.
aij (j = 1, 3, 5)Non-dimensional mass of the internal mass.
bNon-dimensional depth of the center of mass.
CDamping coefficient matrix.
criRadiation damping coefficient.
cu, kuDamping coefficient and spring stiffness of the PTO system.
CWRCapture width ratio.
dgDepth of center of mass of the buoy.
FExcitation force column.
F0Excitation force column per unit wave amplitude.
Fej (j = 1, 3)Excitation force in surge and heave, respectively.
Frj (j = 1, 3)Radiation force in surge and heave, respectively.
FuControl force applied on the buoy by the PTO system.
gGravitational acceleration.
HsSignificant wave height.
I5maxMaximum rotational inertia in pitch.
Ii5Rotational inertia of the internal mass in pitch.
It5Total rotational inertia of the buoy and the internal mass.
KStiffness matrix.
ks3, τs5Hydrostatic restoring stiffness in heave and pitch.
mMass of the buoy.
MMass matrix.
m0Zero-order moment of the motion-amplitude spectrum.
mij (j = 1, 3)Mass the internal mass in surge and heave, respectively.
Me5, Mr5Excitation and radiation moment in pitch.
mlp, zlpConcentrated mass and z coordinate of the p-th point on the leftmost edge.
mrijAdded mass.
mrq, zrqConcentrated mass and z coordinate of the q-th point on the rightmost edge.
mtTotal mass of the buoy and the internal mass.
PTime-averaged absorbed power.
PinEnergy flux per unit wave crest.
PnTime averaged absorbed power at the n-th discretized wave frequency.
r, dRadius and draft of the buoy.
ShWave spectrum.
SmMotion-amplitude spectrum.
TeEnergy period.
VDisplaced volume.
WWidth of buoy.
xDisplacement column.
xcbx coordinate of the center of buoyancy in the fixed coordinate system G-xyz.
xicb, yicb, zicbCoordinate of the center of buoyancy in the body-fitted coordinate system G-xiyizi.
xij (j = 1, 3)Displacement of the internal mass in surge and heave, respectively.
xj (j = 1, 3)Displacement of the buoy in surge and heave, respectively.
xr1, xr3Relative displacement amplitude between the internal mass and the buoy.
xsSignificant motion amplitude.
zl, zrz coordinate of the center of mass containing all mass points in the leftmost and rightmost edges.
ΔωSampling interval of the discretized frequency.
θ5, θi5Angular displacement of the buoy and the internal mass in pitch.
ρWater density.
ωWave frequency.
ωn, AnFrequency and amplitude of the n-th discretized regular-wave component.

References

  1. Miquel, A.M.; Lamberti, A.; Antonini, A.; Archetti, R. The MoonWEC, a new technology for wave energy conversion in the Mediterranean sea. Ocean Eng. 2020, 217, 107958. [Google Scholar] [CrossRef]
  2. Davidson, J.; Genest, R.; Ringwood, J.V. Adaptive Control of a Wave Energy Converter. IEEE Trans. Sustain. Energy 2018, 9, 1588–1595. [Google Scholar] [CrossRef] [Green Version]
  3. Available online: http://www.emec.org.uk/marine-energy/wave-developers/ (accessed on 8 September 2020).
  4. López, M.; Ramos, V.; Rosa-Santos, P.; Taveira-Pinto, F. Effects of the PTO inclination on the performance of the CECO wave energy converter. Mar. Struct. 2018, 61, 452–466. [Google Scholar] [CrossRef]
  5. Lejerskog, E.; Boström, C.; Hai, L.; Waters, R.; Leijon, M. Experimental results on power absorption from a wave energy converter at the Lysekil wave energy research site. Renew. Energy 2015, 77, 9–14. [Google Scholar] [CrossRef]
  6. Liang, C.; Zuo, L. On the dynamics and design of a two-body wave energy converter. Renew. Energy 2017, 101, 265–274. [Google Scholar] [CrossRef]
  7. Cordonnier, J.; Gorintin, F.; De Cagny, A.; Clément, A.H.; Babarit, A. SEAREV: Case study of the development of a wave energy converter. Renew. Energy 2015, 80, 40–52. [Google Scholar] [CrossRef]
  8. Korde, U.A. Systems of reactively loaded coupled oscillating bodies in wave energy conversion. Appl. Ocean Res. 2003, 25, 79–91. [Google Scholar] [CrossRef]
  9. Brekken, T.K.A.; Hapke, H.M.; Stillinger, C.; Zrudell, J. Machines and drives comparison for low-power renewable energy and oscillating applications. IEEE Trans. Energy Conver. 2010, 25, 1162–1170. [Google Scholar] [CrossRef]
  10. French, M.J.; Bracewell, R. The reduction of structural costs in obtaining energy from sea-waves. In Proceedings of the Fourth International Offshore Mechanics & Arctic Engineering Symposium Conference, ASME, Dallas, TX, USA, 17 February 1985. [Google Scholar]
  11. Budar, K.; Falnes, J. A resonant point absorber of ocean-wave power. Nature 1975, 256, 478–479. [Google Scholar] [CrossRef]
  12. Abdelkhalik, O.; Zou, S.; Robinett, R.D.; Bacelli, G.; Wilson, D.G.; Coe, R.; Korde, U. Multiresonant feedback control of a three-degree-of-freedom wave energy converter. IEEE Trans. Sustain. Energy 2017, 8, 1518–1527. [Google Scholar] [CrossRef]
  13. Newman, J.N. The interaction of stationary vessels with regular waves. In Proceedings of the 11th Symposium on Naval Hydrodynamics, London, UK, 28 March–2 April 1976; pp. 491–501. [Google Scholar]
  14. Evans, D.V. A theory for wave-power absorption by oscillating bodies. J. Fluid Mech. 1976, 77, 1–25. [Google Scholar] [CrossRef]
  15. Mei, C.C. Power extraction from water waves. J. Ship Res. 1976, 20, 63–66. [Google Scholar]
  16. Falnes, J. Wave-energy conversion through relative motion between two single-mode oscillating bodies. J. Offshore Mech. Arct. 1999, 121, 32–38. [Google Scholar] [CrossRef]
  17. Grilli, A.R.; Merrill, J.; Grilli, S.T.; Spaulding, M.L.; Cheung, J.T. Experimental and numerical study of spar buoy-magnet/spring oscillators used as wave energy. In Proceedings of the Seventeenth International Offshore and Polar Engineering Conference, Lisbon, Portugal, 1–6 July 2007. [Google Scholar]
  18. Davis, E.; Ertekin, R.C.; Riggs, H. Buoy Based WEC Device to provide low power to sensors. In Proceedings of the ASME 28th International Conference on Ocean, Offshore, and Artic Engineering, Honolulu, HI, USA, 31 May–5 June 2009. [Google Scholar]
  19. Ocean Power Technologies. PowerBuoy. Available online: http://www.oceanpowertechnologies.com (accessed on 9 August 2020).
  20. Symonds, D.; Davis, E.; Ertekin, R.C. Low-power autonomous wave energy capture device for remote sensing and communications applications. In Proceedings of the IEEE Energy Conversion Congress and Exposition, Atlanta, GA, USA, 12–16 September 2010. [Google Scholar]
  21. Pizer, D. Numerical Modeling of Wave Energy Absorbers; University of Edinburgh: Edinburgh, UK, 1994. [Google Scholar]
  22. Gemme, D.A.; Greene, H.R.; Tucker, T.A.; Sepe, R.B.; Bastien, S.P. Hybrid Resonant Wave Energy Harvesting Buoy for Sensor Applications. In 2013 OCEANS-San Diego; IEEE: Piscataway, NJ, USA, 2013; pp. 1–6. [Google Scholar]
  23. Chai, H.; Guan, W.; Wan, X.; Li, X.; Zhao, Q.; Liu, S. A wave power device with pendulum based on ocean monitoring buoy. IOP Conf. Ser. Earth Environ. Sci. 2018, 108, 052013. [Google Scholar] [CrossRef]
  24. Tarrant, K.R. Numerical Modelling of Parametric Resonance of a Heaving Point Absorber Wave Energy Converter. Ph.D. Thesis, Department of Mechanical and Manufacturing Engineering, Trinity College, Dublin, Ireland, 2015. [Google Scholar]
  25. Yavuz, H. On control of a pitching and surging wave energy converter. Int. J. Green Energy 2011, 8, 555–584. [Google Scholar] [CrossRef]
  26. Oetinger, D.; Magaña, M.E.; Sawodny, O. Centralised model predictive controller design for wave energy converter arrays. IET Renew. Power Gen. 2015, 9, 142–153. [Google Scholar] [CrossRef]
  27. Genest, R.; Ringwood, J.V. A critical comparison of model-predictive and pseudospectral control for wave energy devices. J. Ocean Eng. Mar. Energy 2016, 2, 485–499. [Google Scholar] [CrossRef] [Green Version]
  28. Henriques, J.C.C.; Lopes, M.F.P.; Gomes, R.P.F.; Gato, L.M.C.; Falcão, A.F.O. On the annual wave energy absorption by two-body heaving WECs with latching control. Renew. Energy 2012, 45, 31–40. [Google Scholar] [CrossRef]
  29. Falnes, J. Ocean. Waves and Oscillating Systems: Linear Interaction Including Wave-Energy Extraction; Cambridge University Press: Cambridge, UK, 2002. [Google Scholar]
  30. Wu, J.; Yao, Y.; Zhou, L.; Göteman, M. Real-time latching control strategies for the solo Duck wave energy converter in irregular waves. Appl. Energy 2018, 222, 717–728. [Google Scholar] [CrossRef]
  31. Wu, J.; Ni, Z. On the design of an integrated system for wave energy conversion purpose with the reaction mass on board. Sustainability 2020, 12, 2865. [Google Scholar] [CrossRef] [Green Version]
  32. Parks, P.C. Wedges, Plates and Waves—Some Simple Mathematical Models of Wave Power Machines. In Power from Waves; Academic Press: Cambridge, MA, USA, 1980; pp. 251–285. [Google Scholar]
  33. Falnes, J.; Hals, J. Heaving buoys, point absorbers and arrays. Philos. Trans. R. Soc. A Math. Phys. Eng. Sci. 2012, 370, 246–277. [Google Scholar] [CrossRef] [PubMed] [Green Version]
Figure 1. Schematic diagram of the point absorber.
Jmse 08 00711 g001
Figure 2. Working principle of power absorption systems in the three degrees of freedom: (a) surge; (b) pitch; (c) heave.
Jmse 08 00711 g002
Figure 3. Coordinate systems of the buoy.
Jmse 08 00711 g003
Figure 4. Schematic diagram of the mass distribution.
Jmse 08 00711 g004
Figure 5. Structural configuration of the point absorber at different values of the non-dimensional parameter: (a) a1i = 0.1 and (b) a1i = 0.9 for the case when wave power is absorbed in surge; (c) a5i = 0.1 and (d) a5i = 0.9 for the case when wave power is absorbed in pitch.
Jmse 08 00711 g005
Figure 6. An example of the component power as a function of the sampling frequency when wave power is absorbed in surge for a buoy geometry of r = 4 m, d = 4 m, b = 0.9, ai1 = 0.8, a5 = 0.8 and the PTO system of cu = 1 × 10² N.s/m, ku = 1 × 10⁵ N/m at the wave climate of Te = 8 s, Hs = 2 m.
Jmse 08 00711 g006
Figure 7. Flowchart of the optimization procedure for power absorption in surge.
Jmse 08 00711 g007
Figure 8. An example of the maximum capture width ratio CWR as a function of the internal mass ratio ai1 and the rotational inertia ratio in pitch a5 at different depth ratios of the center of mass b for the buoy geometry of r = 4 m, d = 4 m and the wave climate of Te = 8 s: (a) b = 0.5; (b) b = 0.75; (c) b = 0.9.
Jmse 08 00711 g008
Figure 9. (a) An example of the maximum capture width ratio CWR as a function of the rotational inertia ratio in pitch a5 when the internal mass ratio ai1 is optimal and the depth ratio of the center of mass b = 0.9 for different buoy geometries; (b) an example of the maximum capture width CWR as a function of the depth ratio of the center of mass b when both the internal mass ratio ai1 and rotational inertial ratio a5 are optimal for different buoy geometries. The energy period of the wave climate for both subfigures is 8 s.
Jmse 08 00711 g009
Figure 10. The capture width ratio as a function of the energy period when wave power is absorbed in surge while pitch is either uncontrolled or fixed for different buoy geometries.
Jmse 08 00711 g010
Figure 11. The maximum capture width ratio CWR as a function of the internal and total rotational inertia ratio in pitch, ai5 and a5, at different depths of the center of mass b for the buoy geometry of r = 4 m, d = 4 m and wave climate of Te = 8 s: (a) b = 0.5; (b) b = 0.75; (c) b = 0.9.
Jmse 08 00711 g011
Figure 12. Optimal internal and total rotational inertia in pitch, ai5 and a5, and the maximum capture width ratio CWR as a function of the depth of the center of mass b for the buoy geometry of r = 4 m, d = 4 m and the wave climate of Te = 8 s: (a) optimal internal and total rotational inertia in pitch; (b) the maximum capture width ratio.
Jmse 08 00711 g012
Figure 13. The capture width ratio CWR as a function of the energy period when wave power is absorbed in pitch while surge is either uncontrolled or fixed for different buoy geometries.
Jmse 08 00711 g013
Figure 14. The maximum captured width ratio CWR as a function of the internal mass ratio in heave ai3 at different buoy geometries for the wave climate of Te = 8 s.
Jmse 08 00711 g014
Figure 15. Capture width ratio CWR as a function of the energy period Te at different buoy geometries: (a) r = 2 m, d = 2 m; (b) r = 2 m, d = 6 m; (c) r = 6 m, d = 2 m; (d) r = 6 m, d = 6 m.
Jmse 08 00711 g015
Figure 16. An example of the capture width ratio CWR as a function of the buoy geometry at different power-absorption degrees of freedom and the energy period of 8 s.
Jmse 08 00711 g016
Figure 17. Relative displacement amplitude between the internal mass and the buoy, xr1 and xr3, non-dimensionalized by the radius r and draft d of the buoy when wave power is absorbed in respectively surge (a) and heave (b) as a function of the energy period at the significant wave height of 2 m.
Jmse 08 00711 g017

