1. Introduction
Oil spills can cause hazardous contamination of the ocean environment with potentially fatal consequences for marine wildlife. They may also result in considerable socio-economic losses for coastal industries. In general, subsurface plumes are tracked by chemical oceanography, using the fluorometric measurement of polyaromatic, refined, and crude hydrocarbons [
1]. The detection of oil spilled in seawater is not always straight forward. Firstly, the coalescent and clustering characteristics of oil often result in a discontinuous plume composed of countless undissolved droplets [
2,
3]. Secondly, ambient currents and the mixing energy by surface waves not only transfer the oil from the original spilled location but also accelerate the physical degradation of the oil compounds [
4]. Finally, it is preferable that any detection methodology exerts as little influence on an oil plume as possible in the survey stage. This requires non-contact remote sensing adjacent to the plume, rather than active interaction within the plume, to take measurements.
The principal objective of this project was to establish an adaptive sampling system for an autonomous underwater vehicle (AUV) that would swiftly delineate subsurface oil plumes. We first conducted an extensive literature review of existing adaptive sampling methods [
5]. To date, most plume-tracking adaptive sampling methods adopt gradient-following techniques [
6]. However, when dealing with oil mixed into seawater, the merits of such approaches are minimized by the cloud-based nature of the micro-sized droplets in the plume. The essence of an adaptive mission is optimizing the response of the platform to target parameters that are unknown prior to deployment, such as where the target is or where the target is headed. This could be achieved by utilizing in-situ data for real-time analysis with an additional onboard computer called a Backseat Driver. In this work, we developed a new approach for an adaptive sampling system using a scanning sonar to search for and detect a discontinuous and patchy plume resembling a real oil plume made up of droplets of oil. The advantage of this approach is that the AUV is able to sense the plume and its density at a distance. By using a biomimetic search strategy in conjunction with the sonar, the method is not restricted to the detection of continuous plumes with a smooth gradient. Coupling a minimum number of waypoints with a biomimetic search enabled maximized coverage for the detection of oil in the water column.
We have developed an adaptive sampling system for the Memorial University of Newfoundland (MUN) Explorer AUV to autonomously delineate an oil plume. The Memorial University Explorer AUV has been described in previous work (e.g., [
7,
8]). The algorithm simulated the following tasks: waypoint assignment, AUV trajectory generation, and robot model establishment. A virtual oil plume model generated for plume recognition simulation is detailed in the methodology section. Plume search and detection, as the first phase of the adaptive architecture, are specified. Simulation results are presented, and the performance of the proposed method discussed.
2. Methods
2.1. Adaptive Mission Design
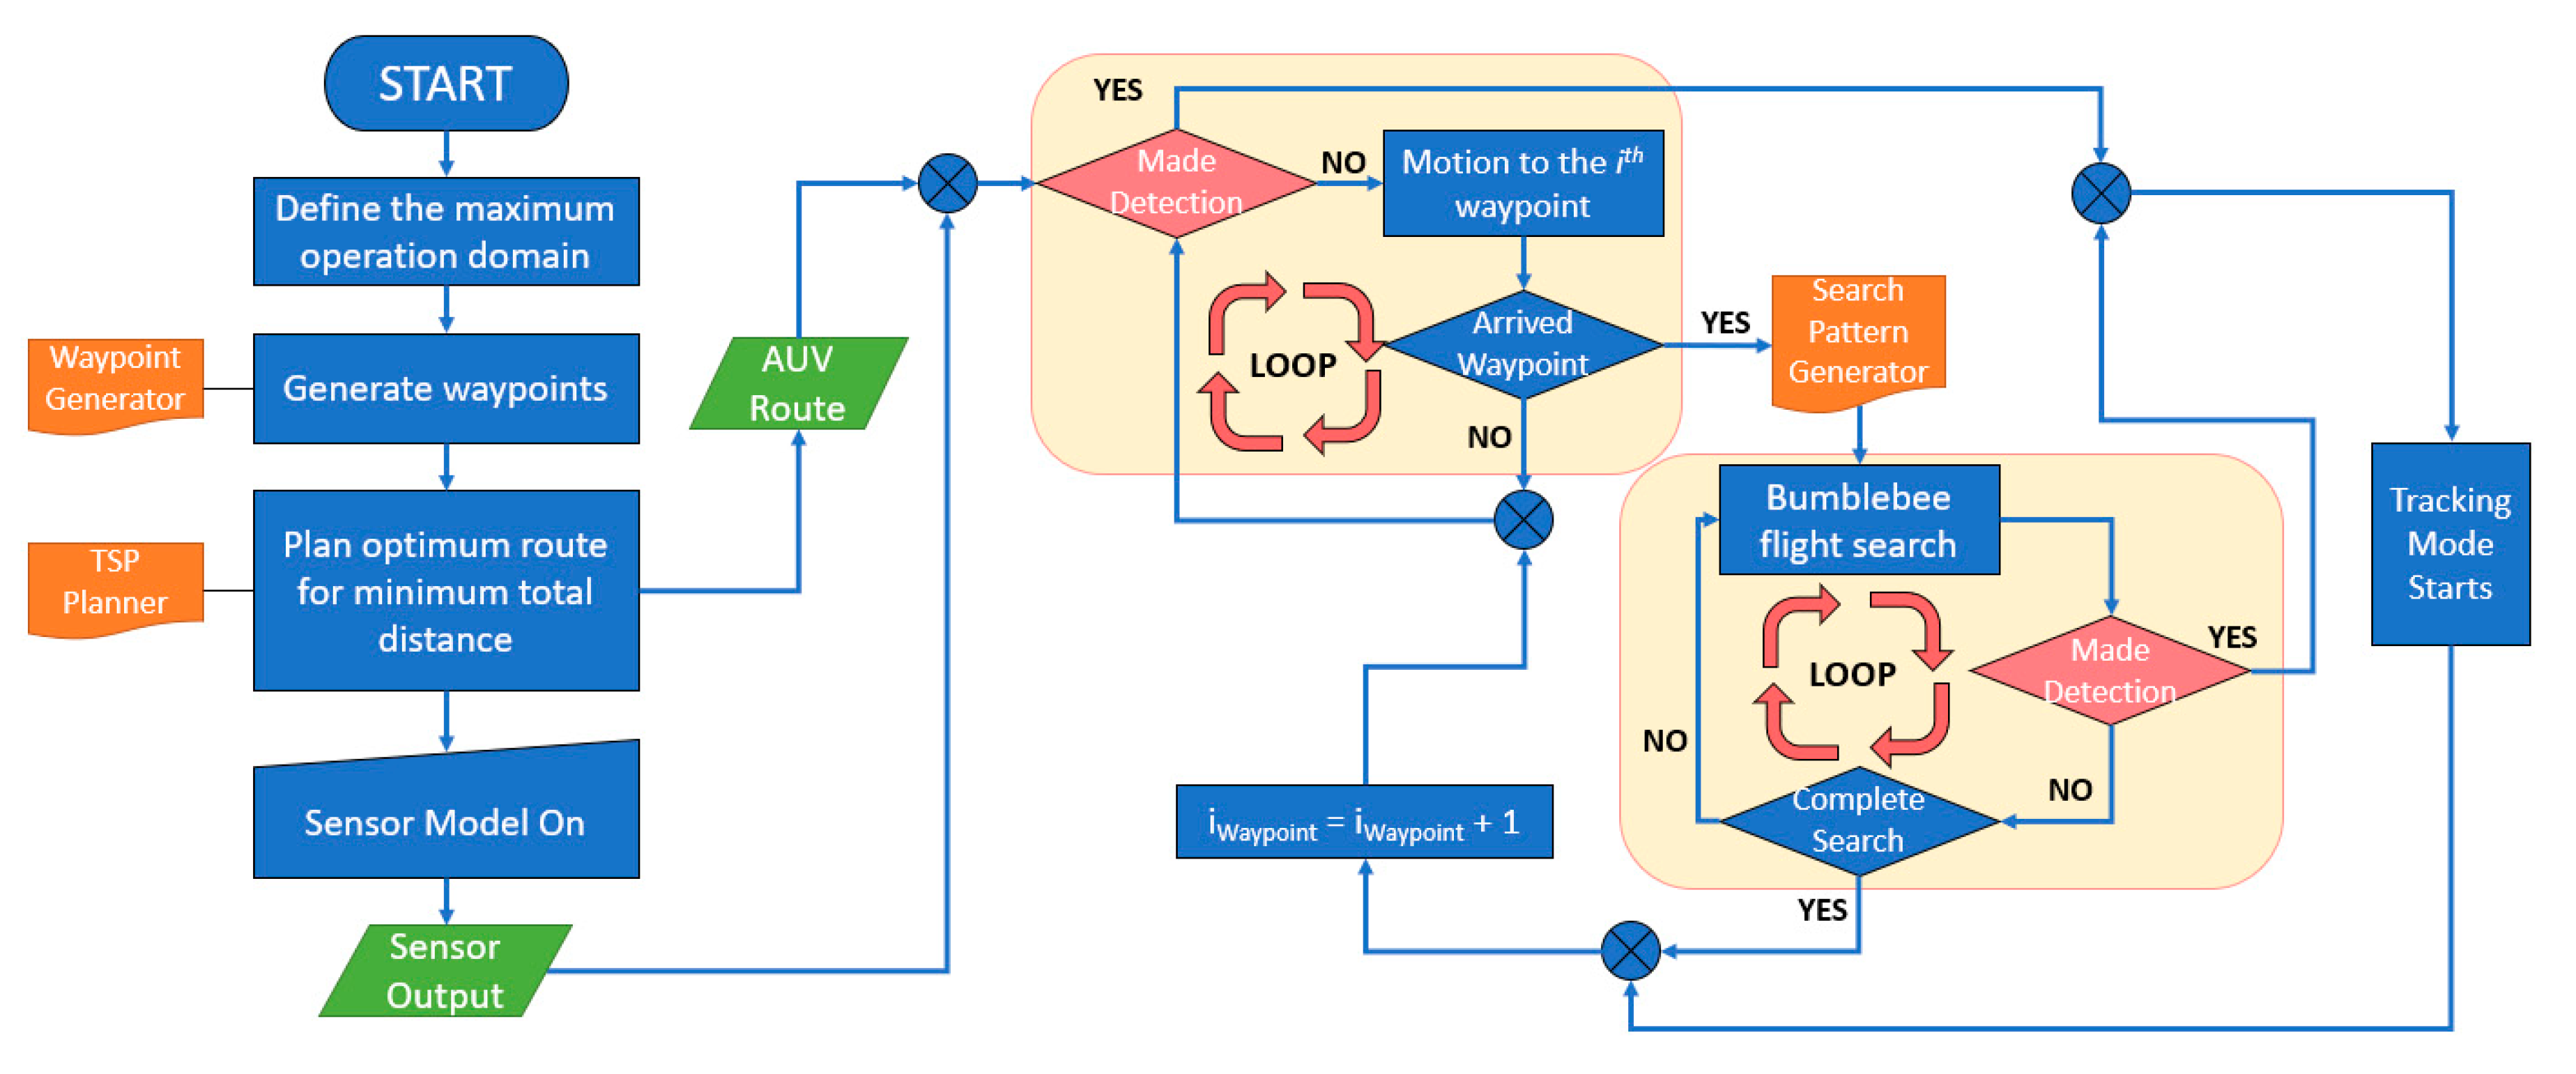
The developed adaptive sampling procedure includes two phases—A Searching phase and a Tracking phase. Each phase consists of two iterative modes, and each mode is automatically triggered when certain conditions are met (
Figure 1). This paper primarily focuses on our searching strategy to efficiently detect an oil plume at an unknown location.
Upon an AUV being deployed, random waypoints are assigned within the designated two-dimensional operational area by the waypoint-generator function during Mode 1 (Waypoint-visiting mode). Then the trajectory-planner function generates an optimum path based on a genetic solution for the Traveling Salesperson Problem [
9]. Mode 2 (Bumblebee-flight-search mode), is triggered to expand the search area around each waypoint by following a bumblebee flight path. Sensor signals are continuously observed during both modes to seek any sign of the oil plume, alternating between Mode 1 and Mode 2 until the oil detection is made and confirmed.
2.2. Virtual Hydrocarbon Plume Model
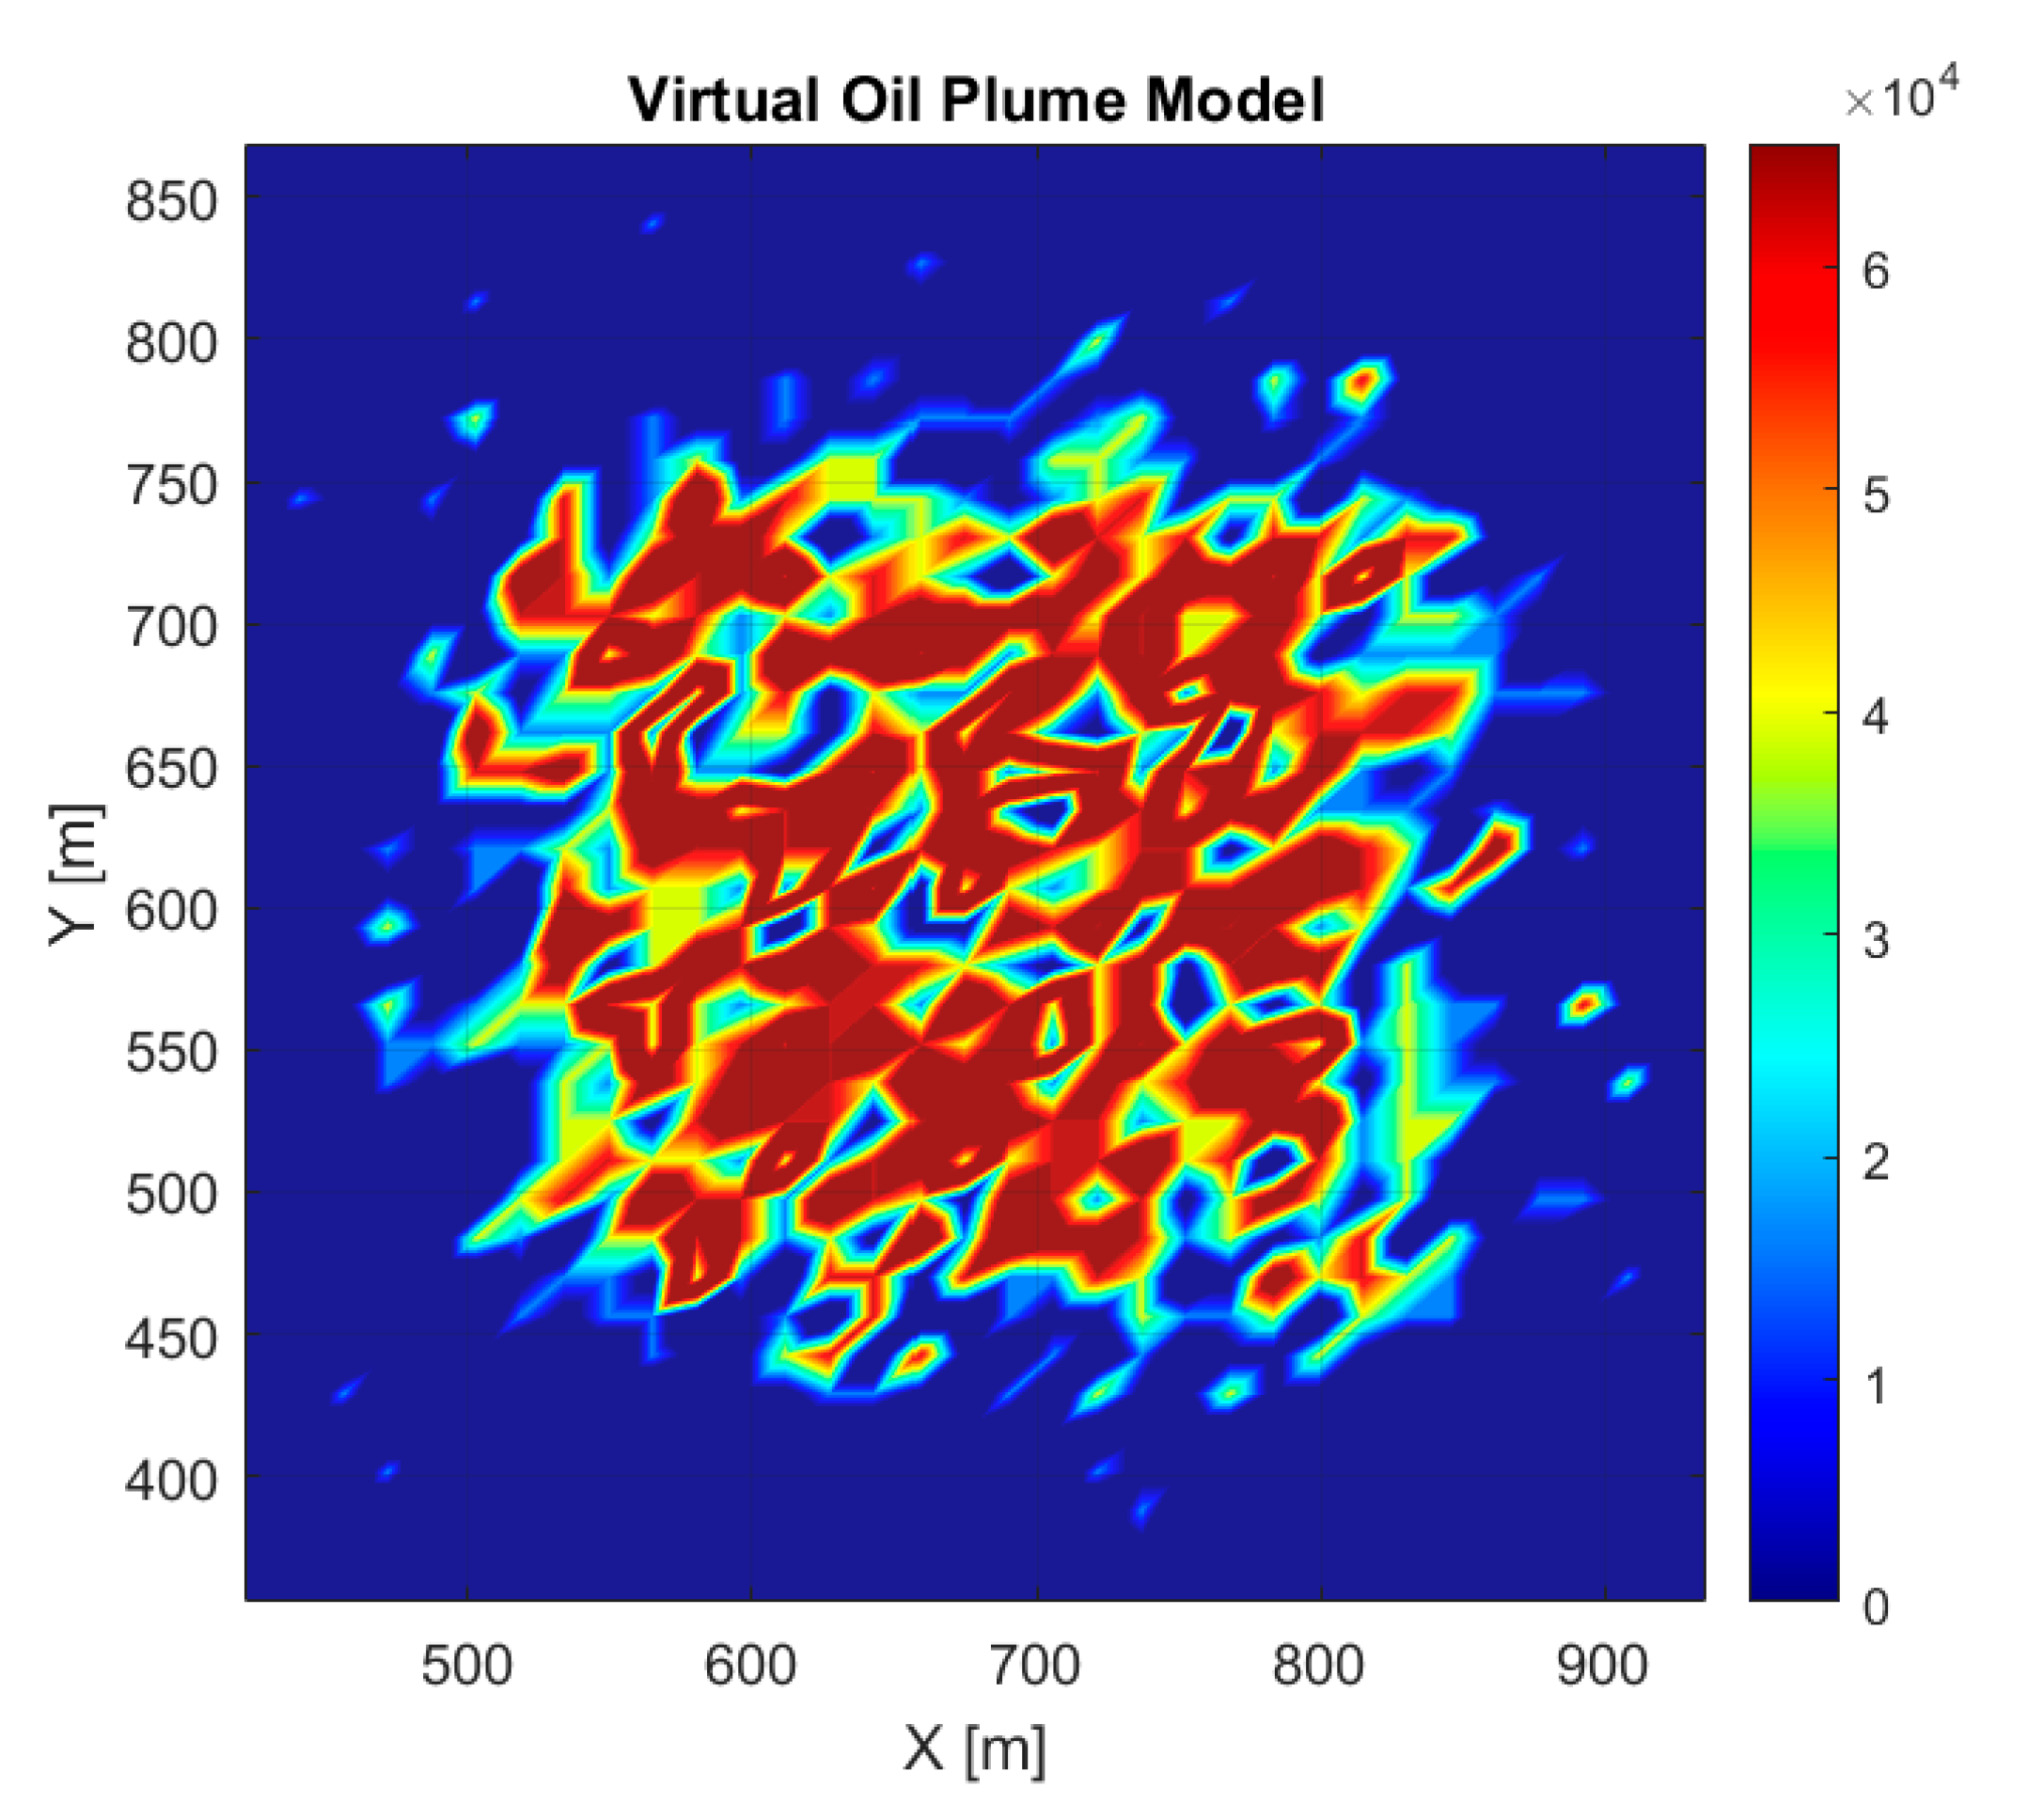
A virtual oil plume model was designed to emulate a realistic oil plume in a simulation domain. The plume represents a static two-dimensional discrete oil plume, consisting of small oil droplets. It was generated based on the results and knowledge acquired from two preceding sensor tests. The first test was conducted in the wave tank at the Bedford Institute of Oceanography (BIO) and the second in Port au Port Bay [
2]. During the experiments, that included waves, we observed that oil in seawater formed patches and clouds of droplets of various sizes and hydrocarbon concentrations. This outcome meant that our AUV mission algorithm needed to account for the discontinuous form of a real oil plume.
The generated plume model is shown in
Figure 2. The plot was distributed over an area of 0.16 km
2 (400 m by 400 m) on an equally spaced 1 m × 1 m mesh grid. It was placed randomly inside a designated operation area of 1000 m by 1000 m. The generated plume appears as a patchy feature with random density variations. The density corresponds to sonar intensity, ranging between 0 and 65,535. These intensity values were derived from the sonar echo strength data (16-bit) from a preliminary small-scale sensor test with a Ping360 scanning imaging sonar.
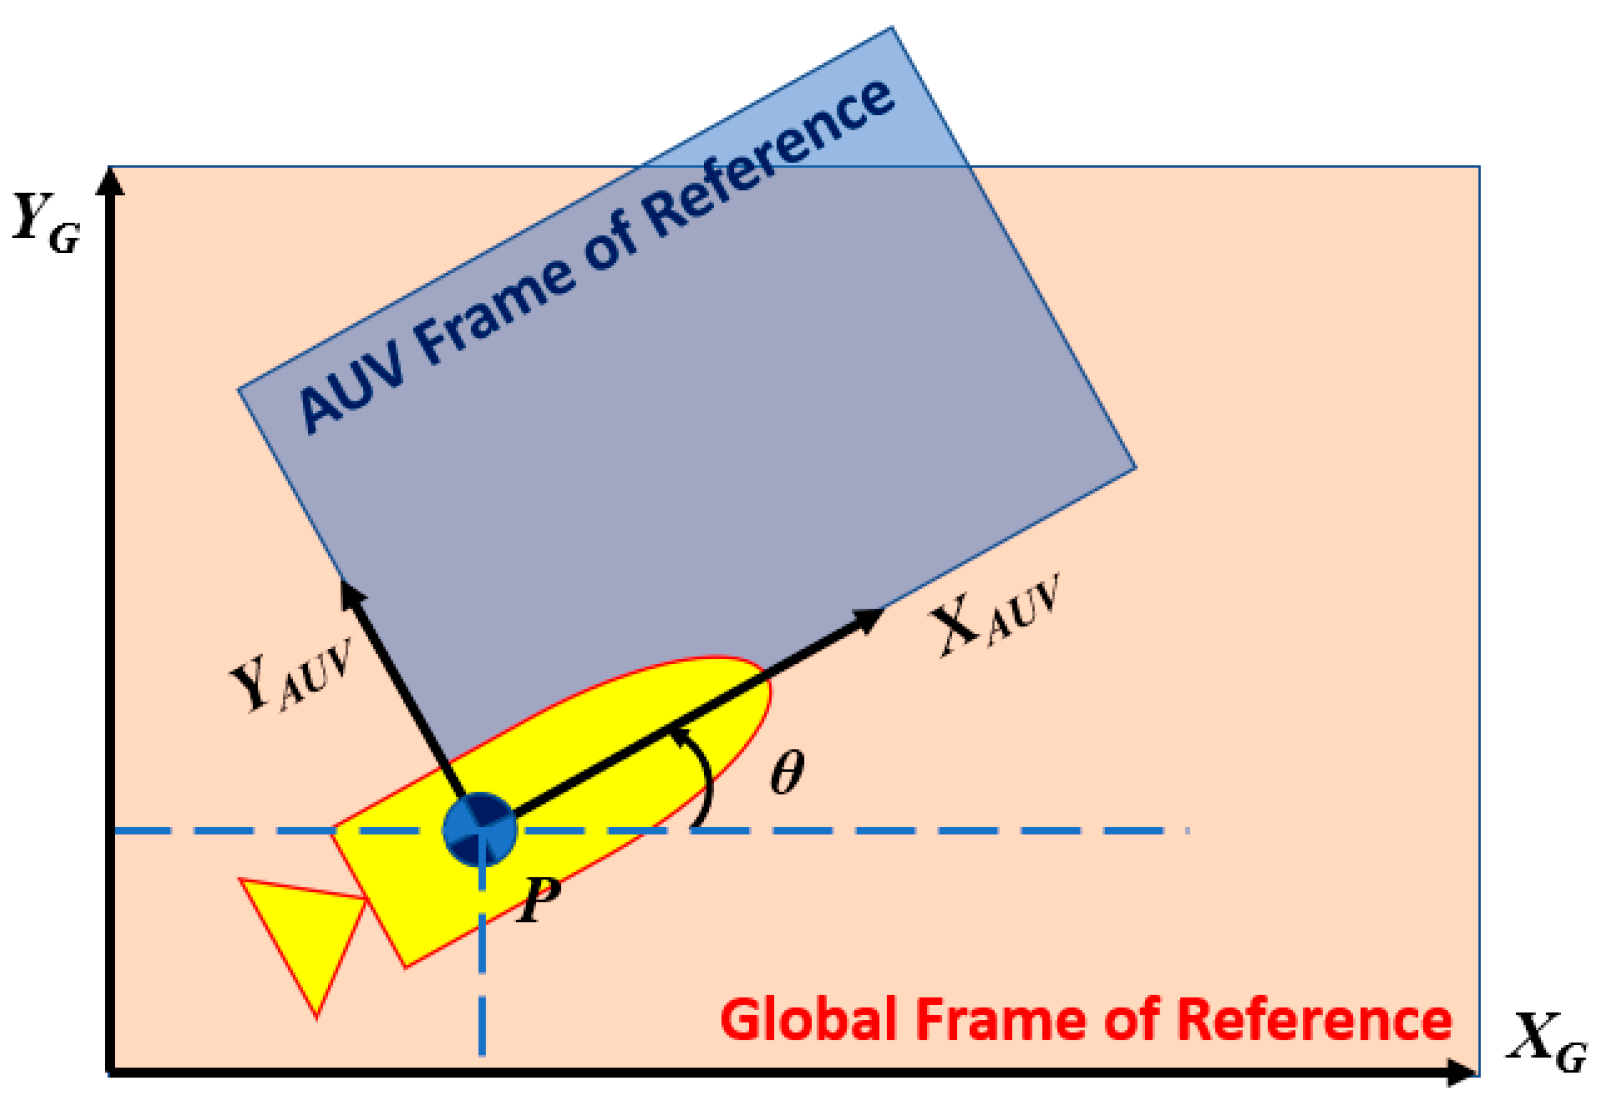
2.3. AUV Mathematical Model
In order to specify the AUV position on the plane, we established a relationship between the global and local reference frame of the AUV (
Figure 3). A kinematic model of the AUV was defined for the AUV pose in the global reference frame,
ξGlobal, and the local reference frame,
ξLocal [
10]. The inverse transformation matrix
R(
θ)
−1, as shown in Equations (1)–(3), was used to transform the AUV’s motion from the global reference frame to the local reference. The coordinates are interchangeable [
11]. The global coordinates and headings were used for plume mapping, which is a function of the AUV’s current pose, while local coordinates and headings were used in the decision-making environment.
2.4. Sonar Imaging Sensor Model
The primary limitation of fluorometers in measuring hydrocarbon contamination in the ocean is their lack of the areal extent, as fluorometers only sample point measurements [
12]. Our oil release experiment in the wave tank facility at the BIO also revealed some limitations and potential issues in using fluorometers as the primary oil sensor in oil detection missions [
2]. Motivated by the findings from that former experiment, we decided to trial a non-contact method for oil detection by utilizing a forward scanning sonar on the AUV. Acoustic detection is based on the propagation of waves between the detector and the target. A proof-of-concept test was conducted with two selected sonar heads for the plume detection—the BV5000 3D scanning sonar (high frequency) and the M450 2D sonar (low frequency). The specifications of these sonars are given in
Table 1 and are described in detail on the manufacturers’ website.
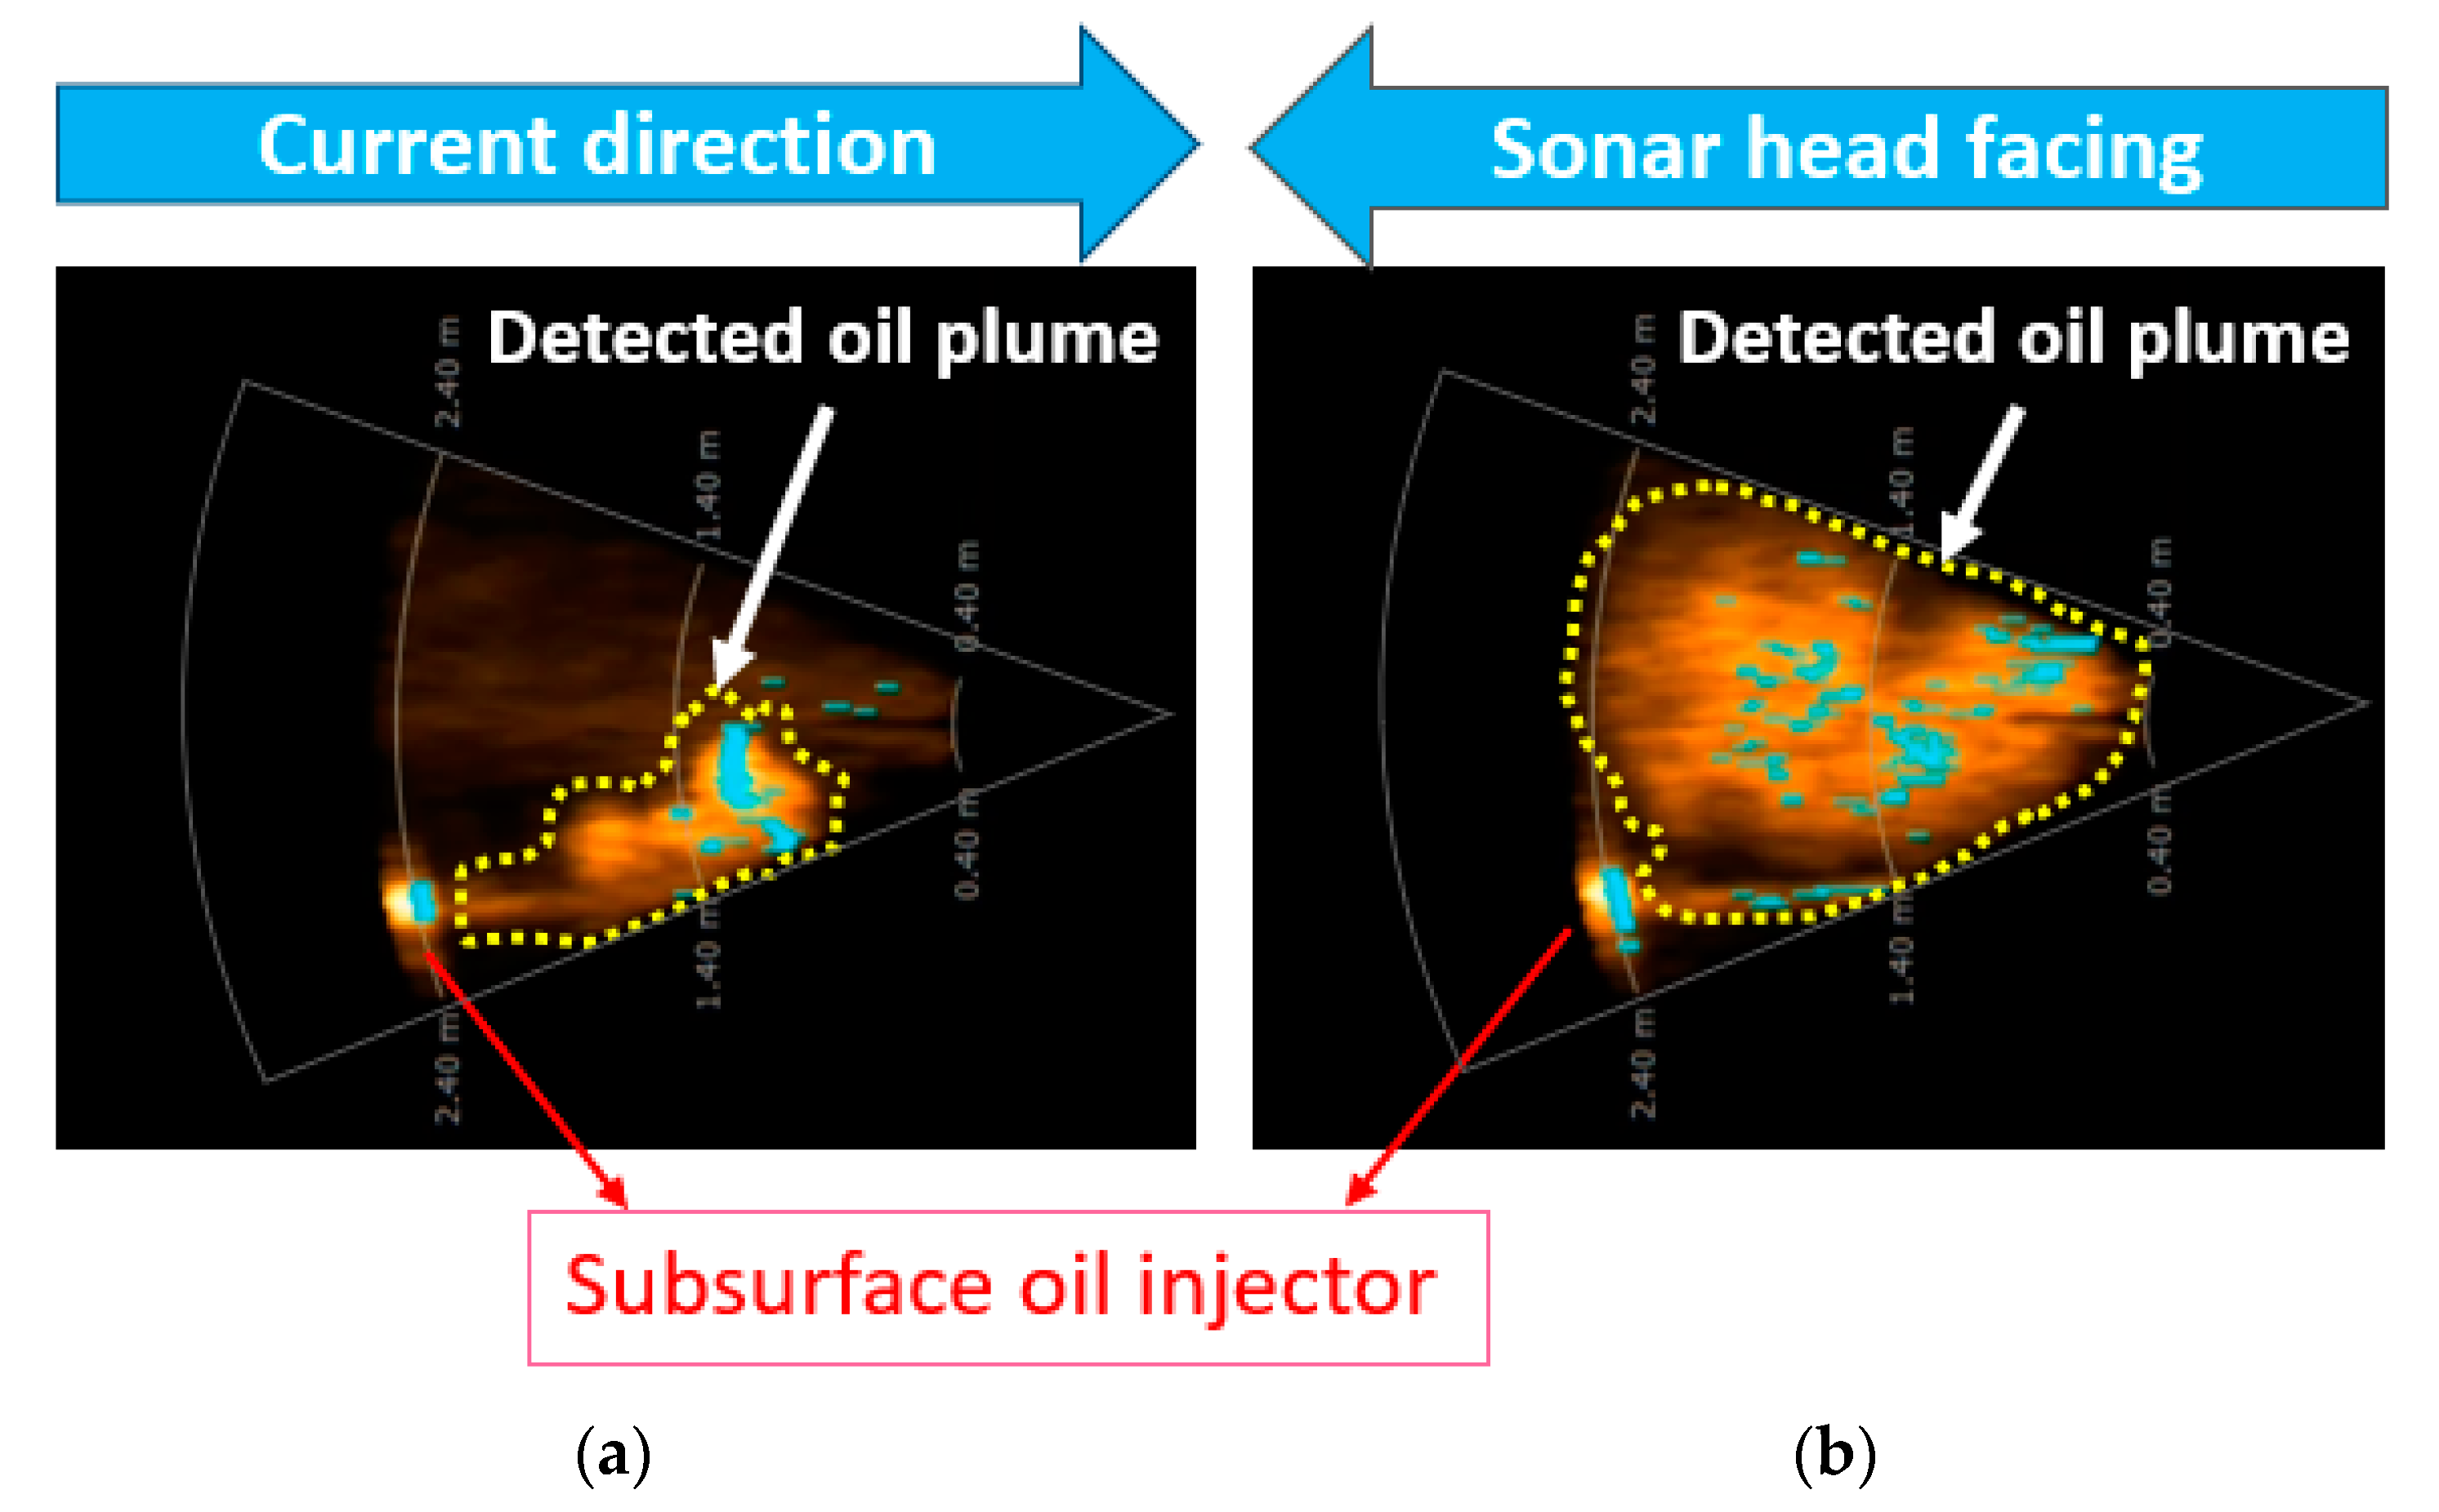
In the test, the relatively high frequency (1.35 MHz) BV5000 successfully captured the oil plume motion, as shown in
Figure 4. It was proven capable of detecting oil at a distance from the AUV, unlike other in-situ oil sensors.
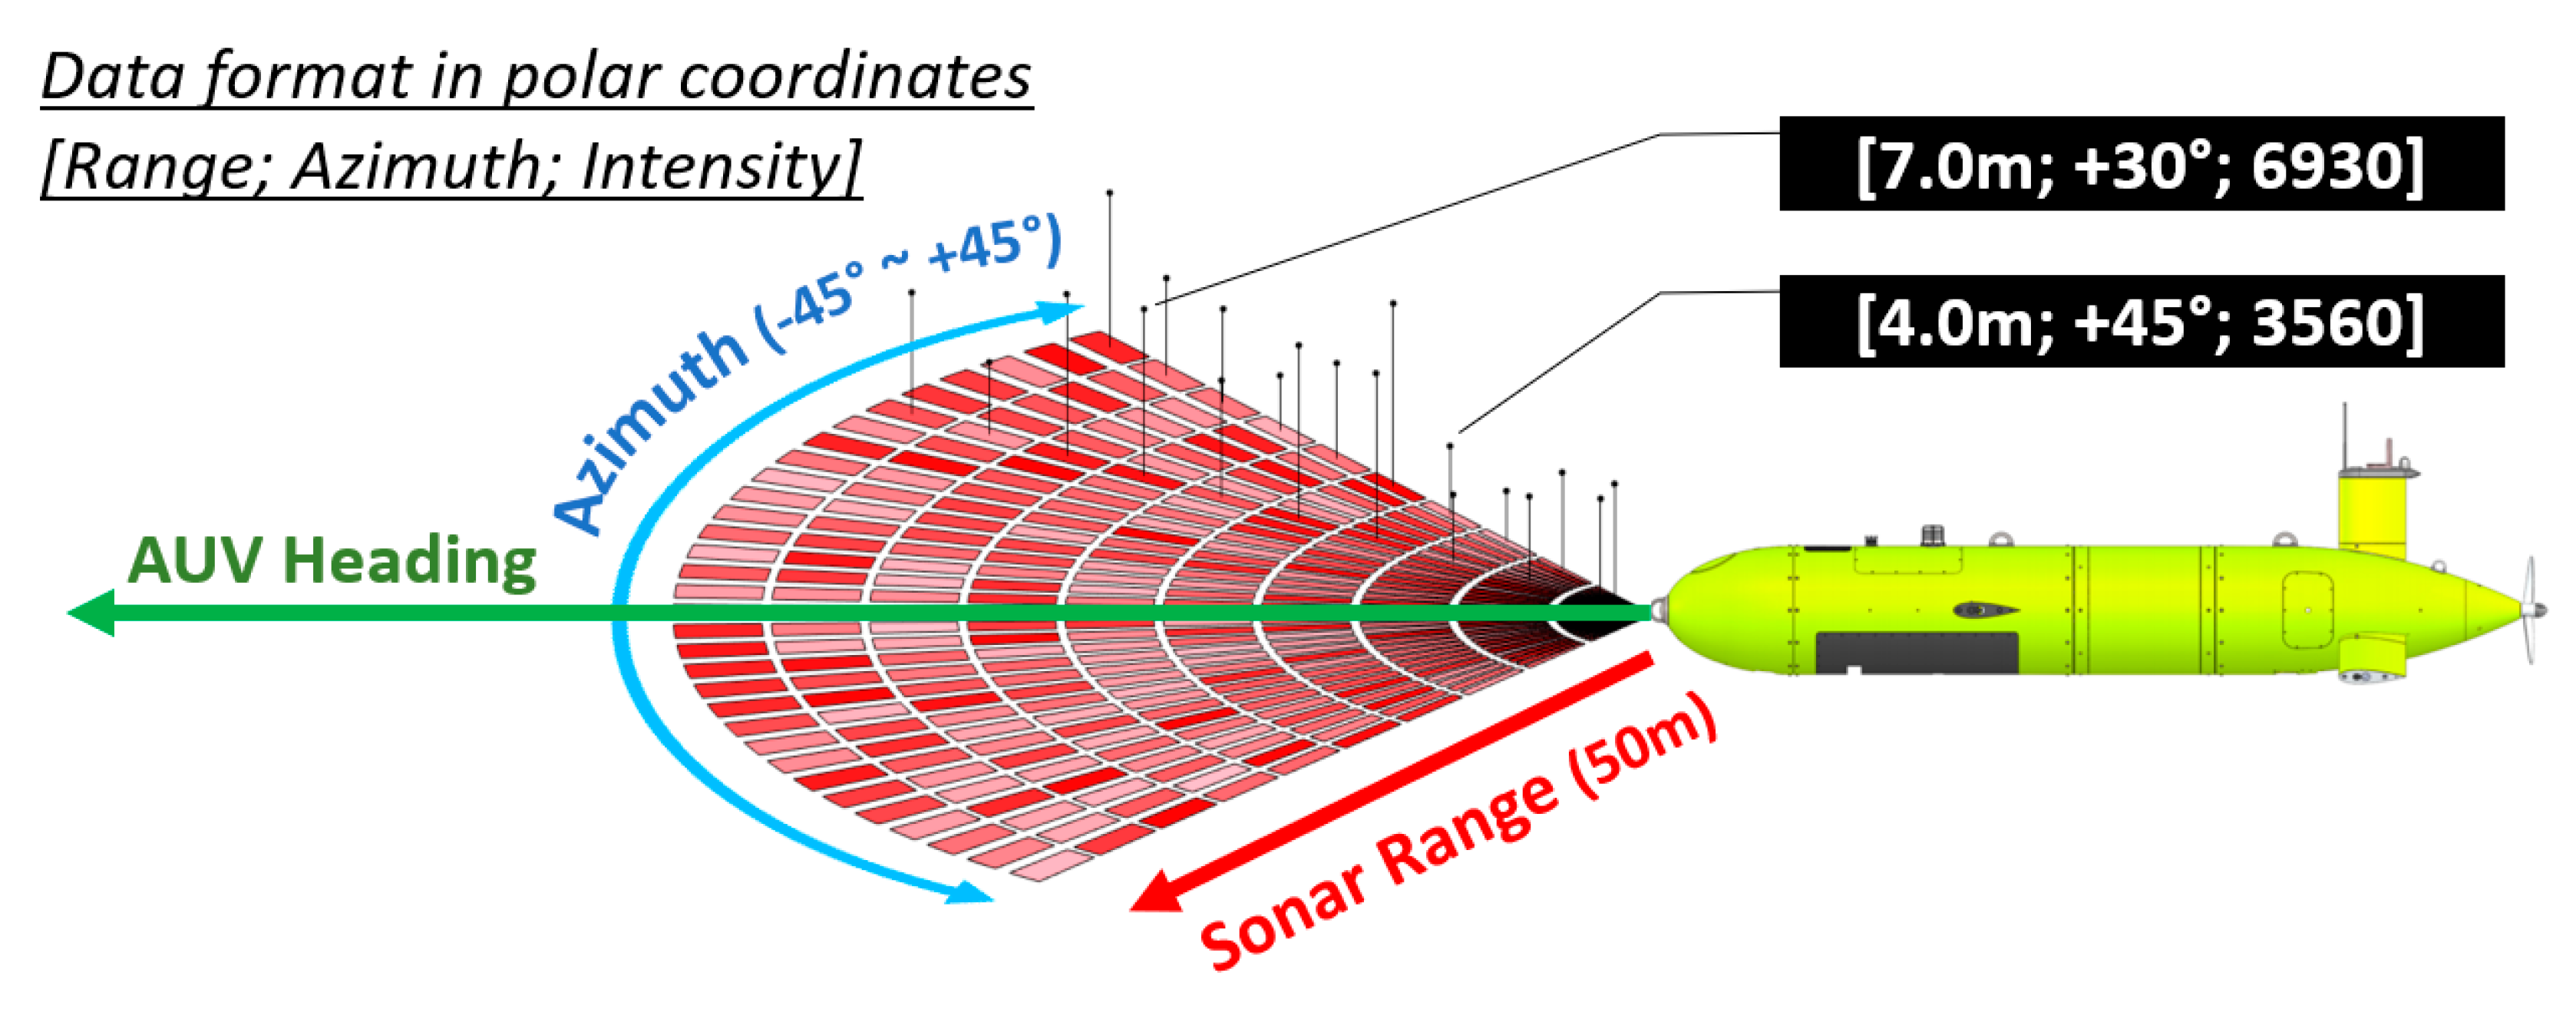
A sonar sensor model was built based on the scanning sonar that is being integrated on the Explorer AUV. The model was constructed with a 90° range of azimuth angles (±45° either side of the AUV heading) and a 50 m range. We proposed a detection strategy based on a two-dimensional swath survey with a total sum data value. Unlike the conventional gradient methods with a point-based survey, our method uses a combined sum of oil intensity to prevent confusion induced by the patchy distribution of micro-sized oil droplets in the ocean. The sensor model tessellates the obtained sonar screen into smaller pieces, and each resulting polar grid cell contains the sonar intensity value (
Figure 5). This set of information includes the position of the measurements in polar coordinates (range and azimuth angle) relative to the AUV, and their values (intensity).
The
aggregate, the total sum of intensities calculated using the sum Equation (4), indicates whether the vehicle has come close to an oil plume in comparison to the
ThresholdENTRE.
As the maximum intensity value that one grid cell can contain is 65.5 × 10
3, the maximum of the
aggregate is approximately 393.2 × 10
6. Four thresholds were set to identify the proximity status of the AUV to the plume, as shown in
Table 2. Finally, The
aggregate and the thresholds were compared to determine the AUV status in terms of plume detection, as shown in Equations (5)–(7). These threshold values are subject to the AUV mission objectives and minimum plume proximity requirements.
2.5. Waypoints Generator and TSP Solver
Upon starting a mission, the waypoint-generator function generated randomly spaced waypoints. The number of waypoints was automatically adjusted to the size of the operational area using Equation (8). With a given operational area of 1 km
2 and an assumed plume size of 0.16 km
2, five waypoints were assigned.
When the waypoints for a robotic agent to visit are distributed in a large search space, an efficient search procedure is required, regardless of robustness [
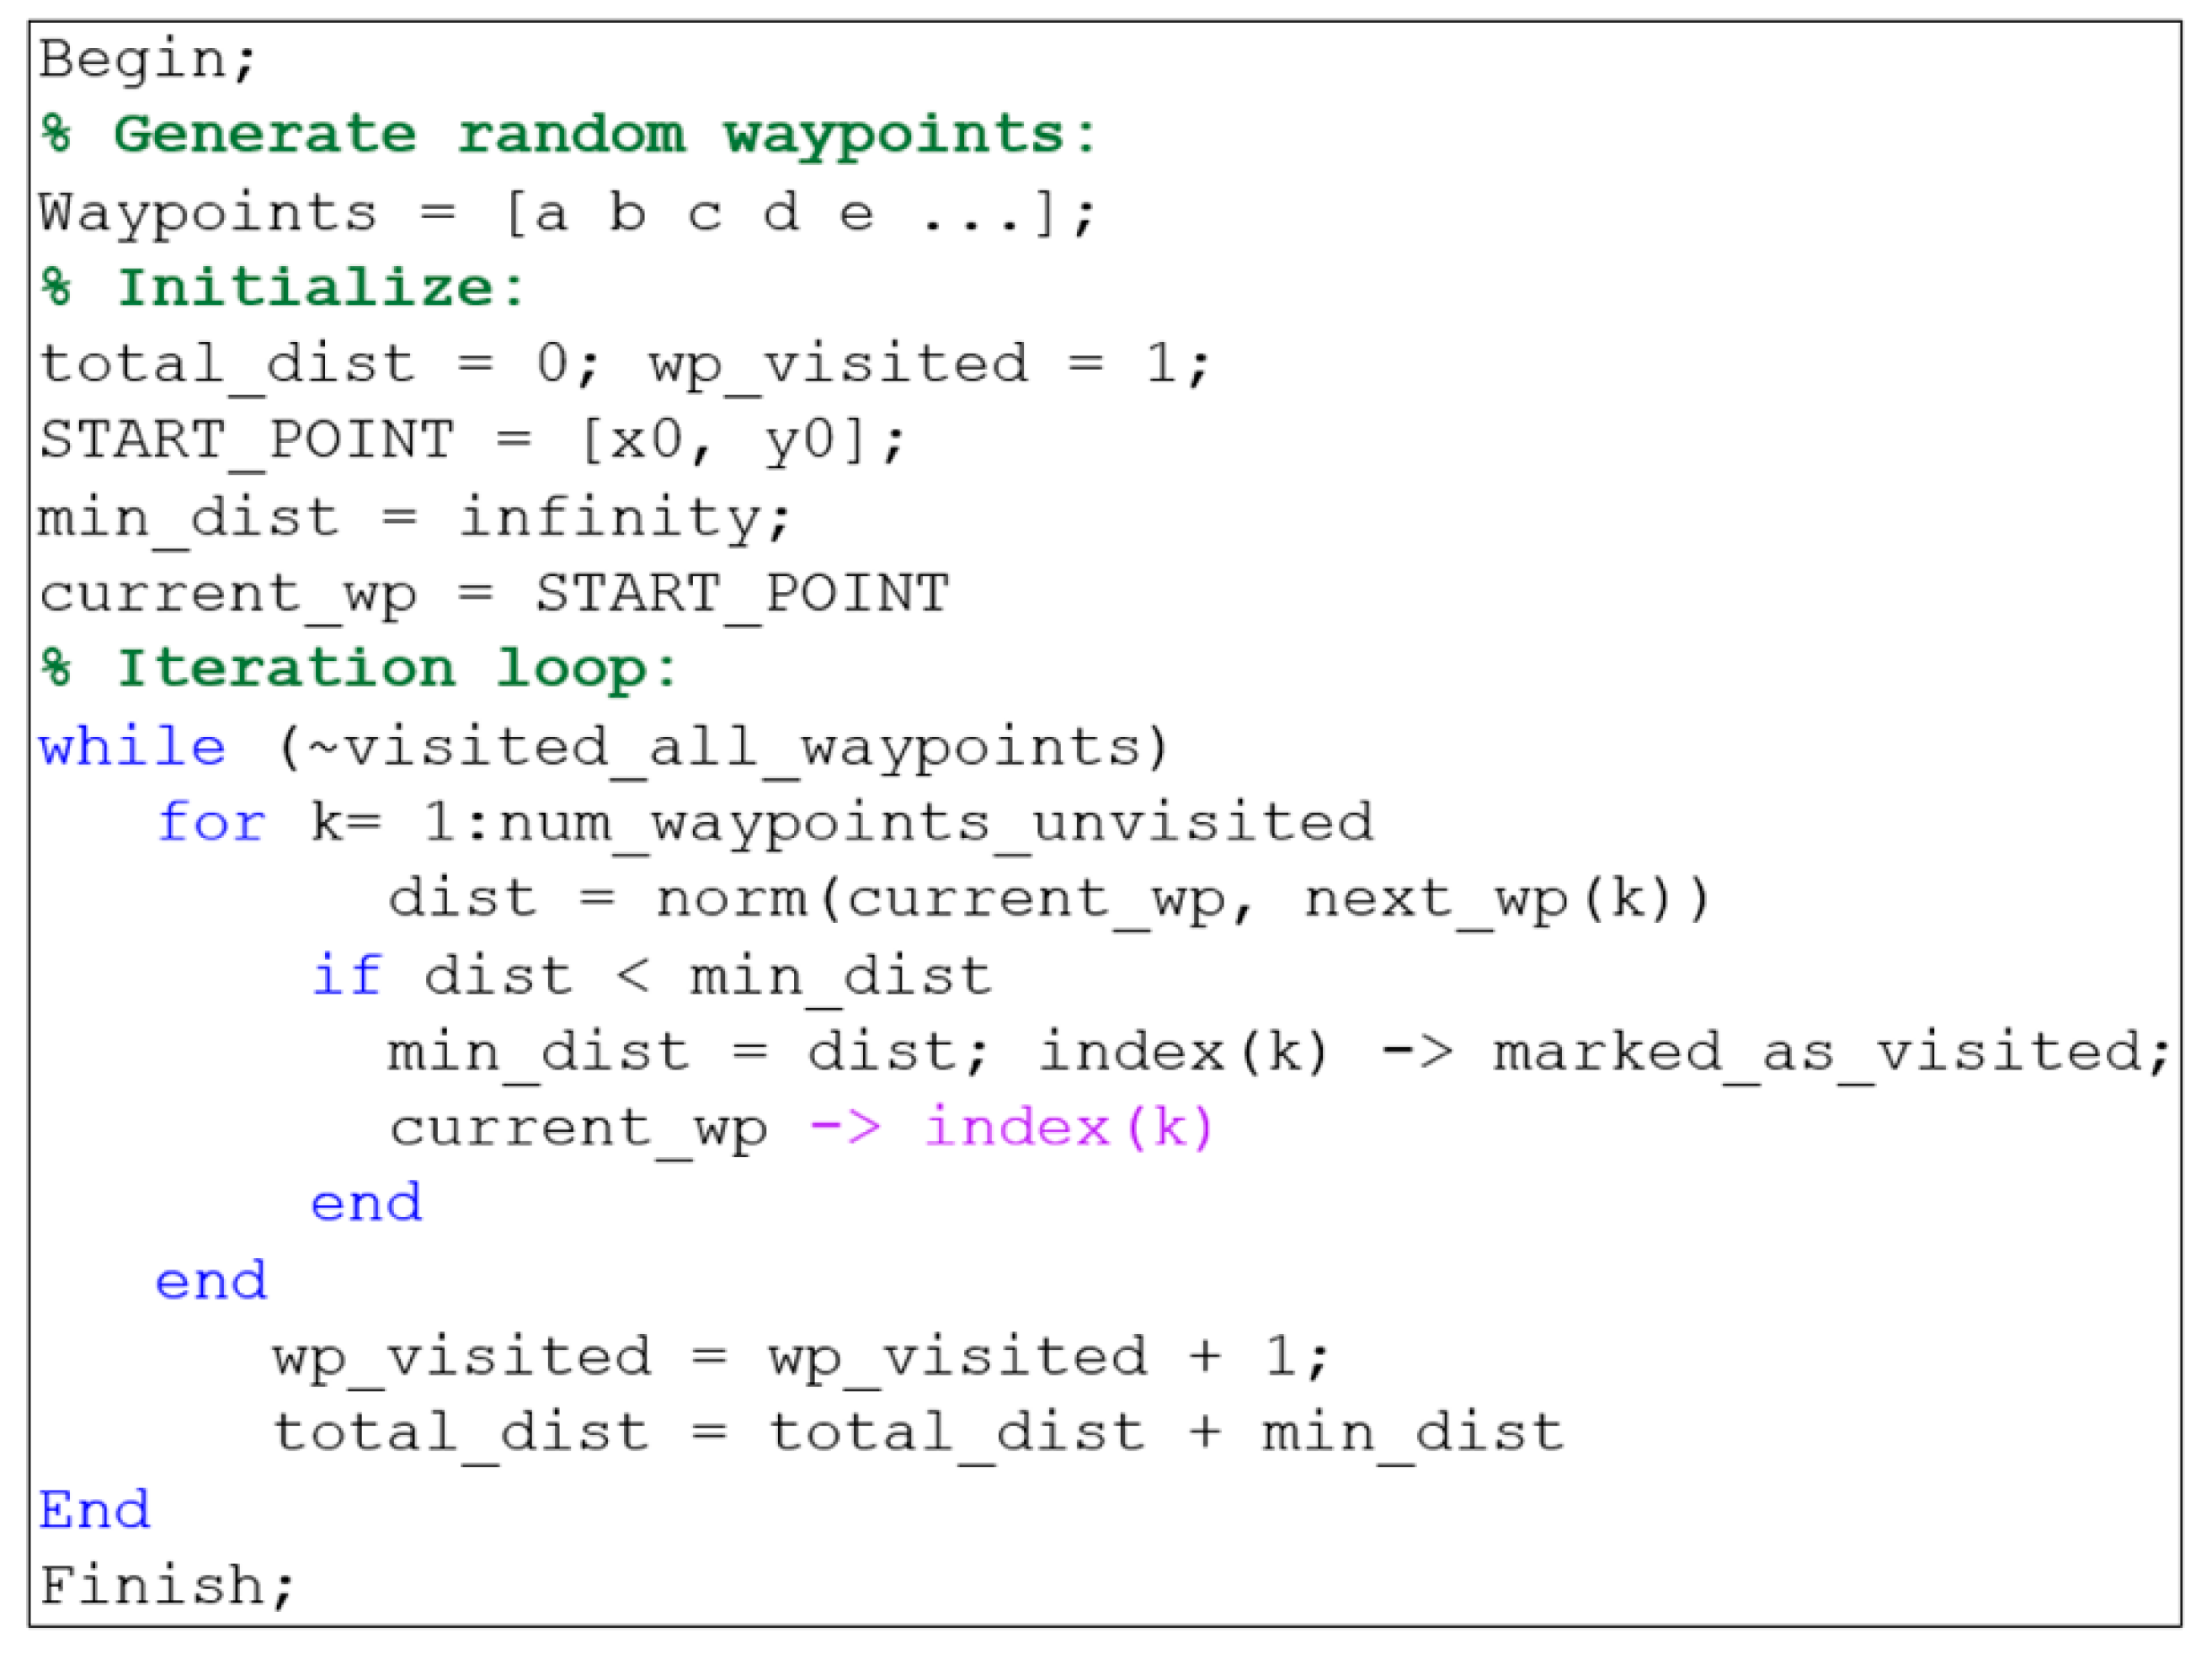
13]. The optimum path in this context means the calculated route that requires the minimum total travel distance within the given area. We used a Genetic Algorithm (GA) to solve the Traveling Salesperson Problem (TSP). When the optimum path is automatically selected through multiple iterations, the order of the waypoints to visit is rearranged.
Figure 6 shows the pseudo-code for the GA of the traveling TSP procedure.
2.6. Bumblebee Flight Search Pattern
Engineering strategies often get inspired by biochemical processes or animal behavior and researchers apply these ideas to robotic operations in what is termed as a biomimetic approach. It has been suggested [
14] that nectar-gathering bees can integrate optical and olfactory information to respond to the patchy distribution of nectar in air. Bumblebee flight paths have been shown to consist of a series of loops and zigzags [
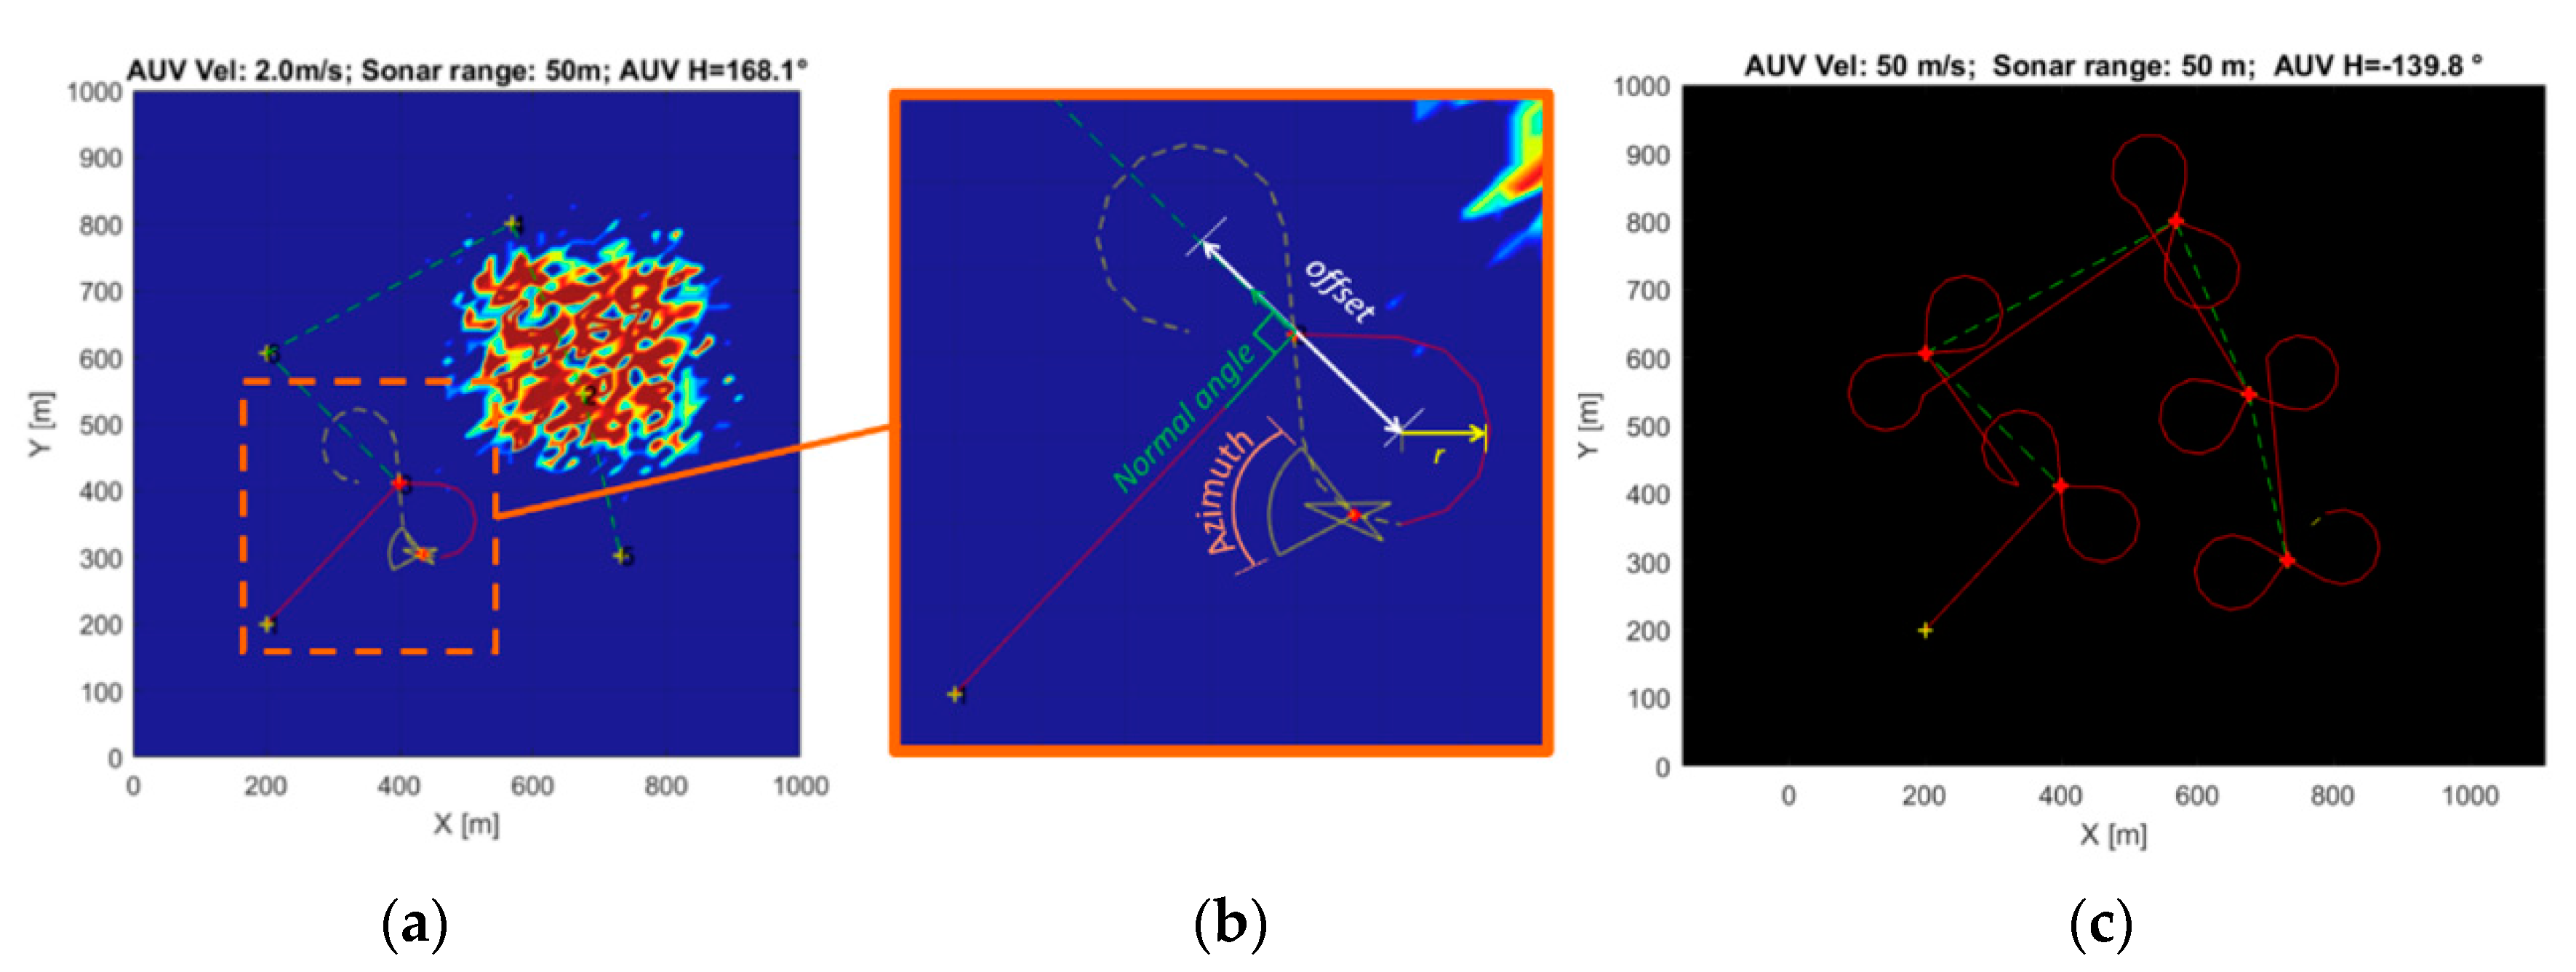
15]. Inspired by the bumblebee loop flight path, we designed a new biomimetic search pattern. Upon arriving at each waypoint, a bow-tie shaped trajectory with two circular loops was generated normal to the direction of the instantaneous AUV heading (
Figure 7). The radius of the loop was set as 〖radius〗_loop = 10 × 〖length〗_AUV to take into account the minimum turning radius of the vehicle. The offset distance between the centers of the circles was set as
offset =
1.5 ×
radiusLoop.
3. Simulation Results
Different searching patterns were tested to evaluate the proposed search capability, and a threshold study achieved robust detection of the oil plume.
3.1. Search Pattern Comparison
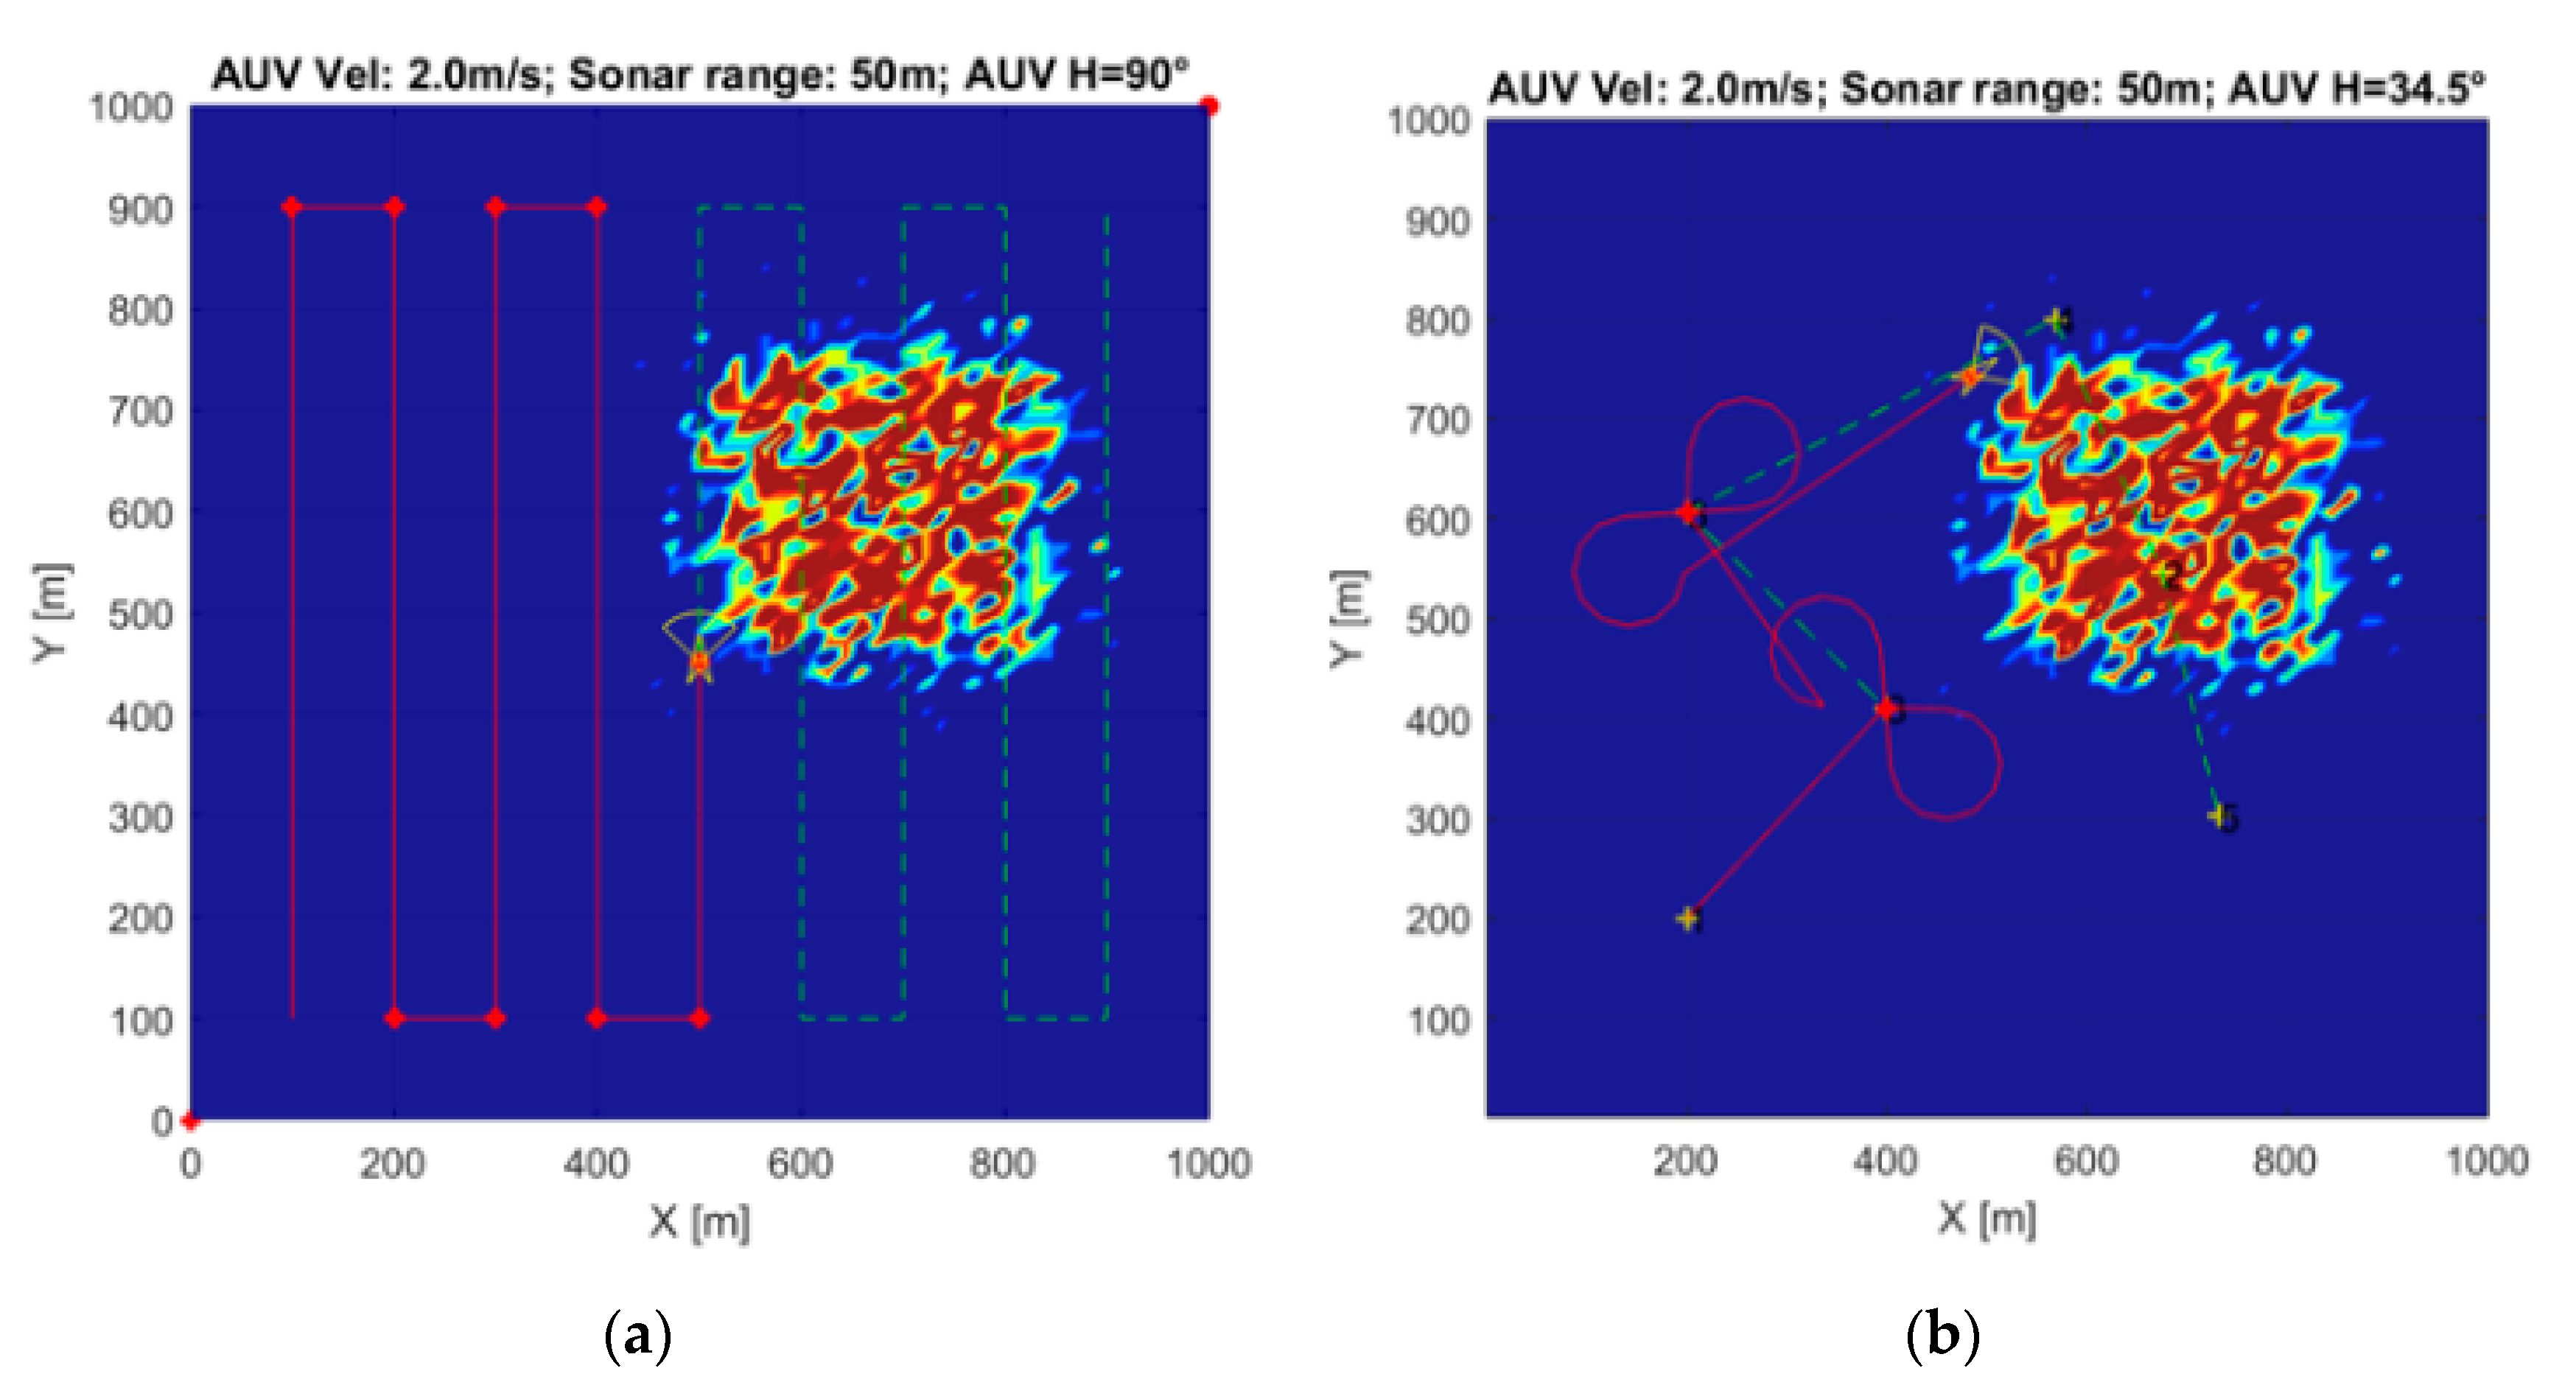
Both the conventional lawnmower AUV search pattern and the designed bumblebee path with random waypoints were simulated repeatedly to optimize the paths. The average total distance traveled to find an oil plume at an unknown location was assessed (
Table 3). The transect spacing for the lawnmower pattern was set to 100 m based on the 50 m/90° sonar range. For the bumblebee path, five waypoints were generated based on Equation (1). With this repeated five-waypoint generation, the bumblebee strategy, on average, reduced the search distance by 75.3%. Given the TSP algorithm generates the optimum path randomly, the required travel distance is mainly dependent on the relative location of the plume to the start location. In a sensitivity test, increasing the number of waypoints to 17 effectively doubled the travel distance but maintained approximately ~50% reduction relative to the lawnmower survey. The radii of the loops in the bumblebee search pattern were varied in a manner to achieve appropriate coverage of the search area. Therefore, even with a more thorough search requirement, the bumblebee method would continue to track down the plume faster.
Figure 8 compares the search results.
3.2. Robustness Study for Detection
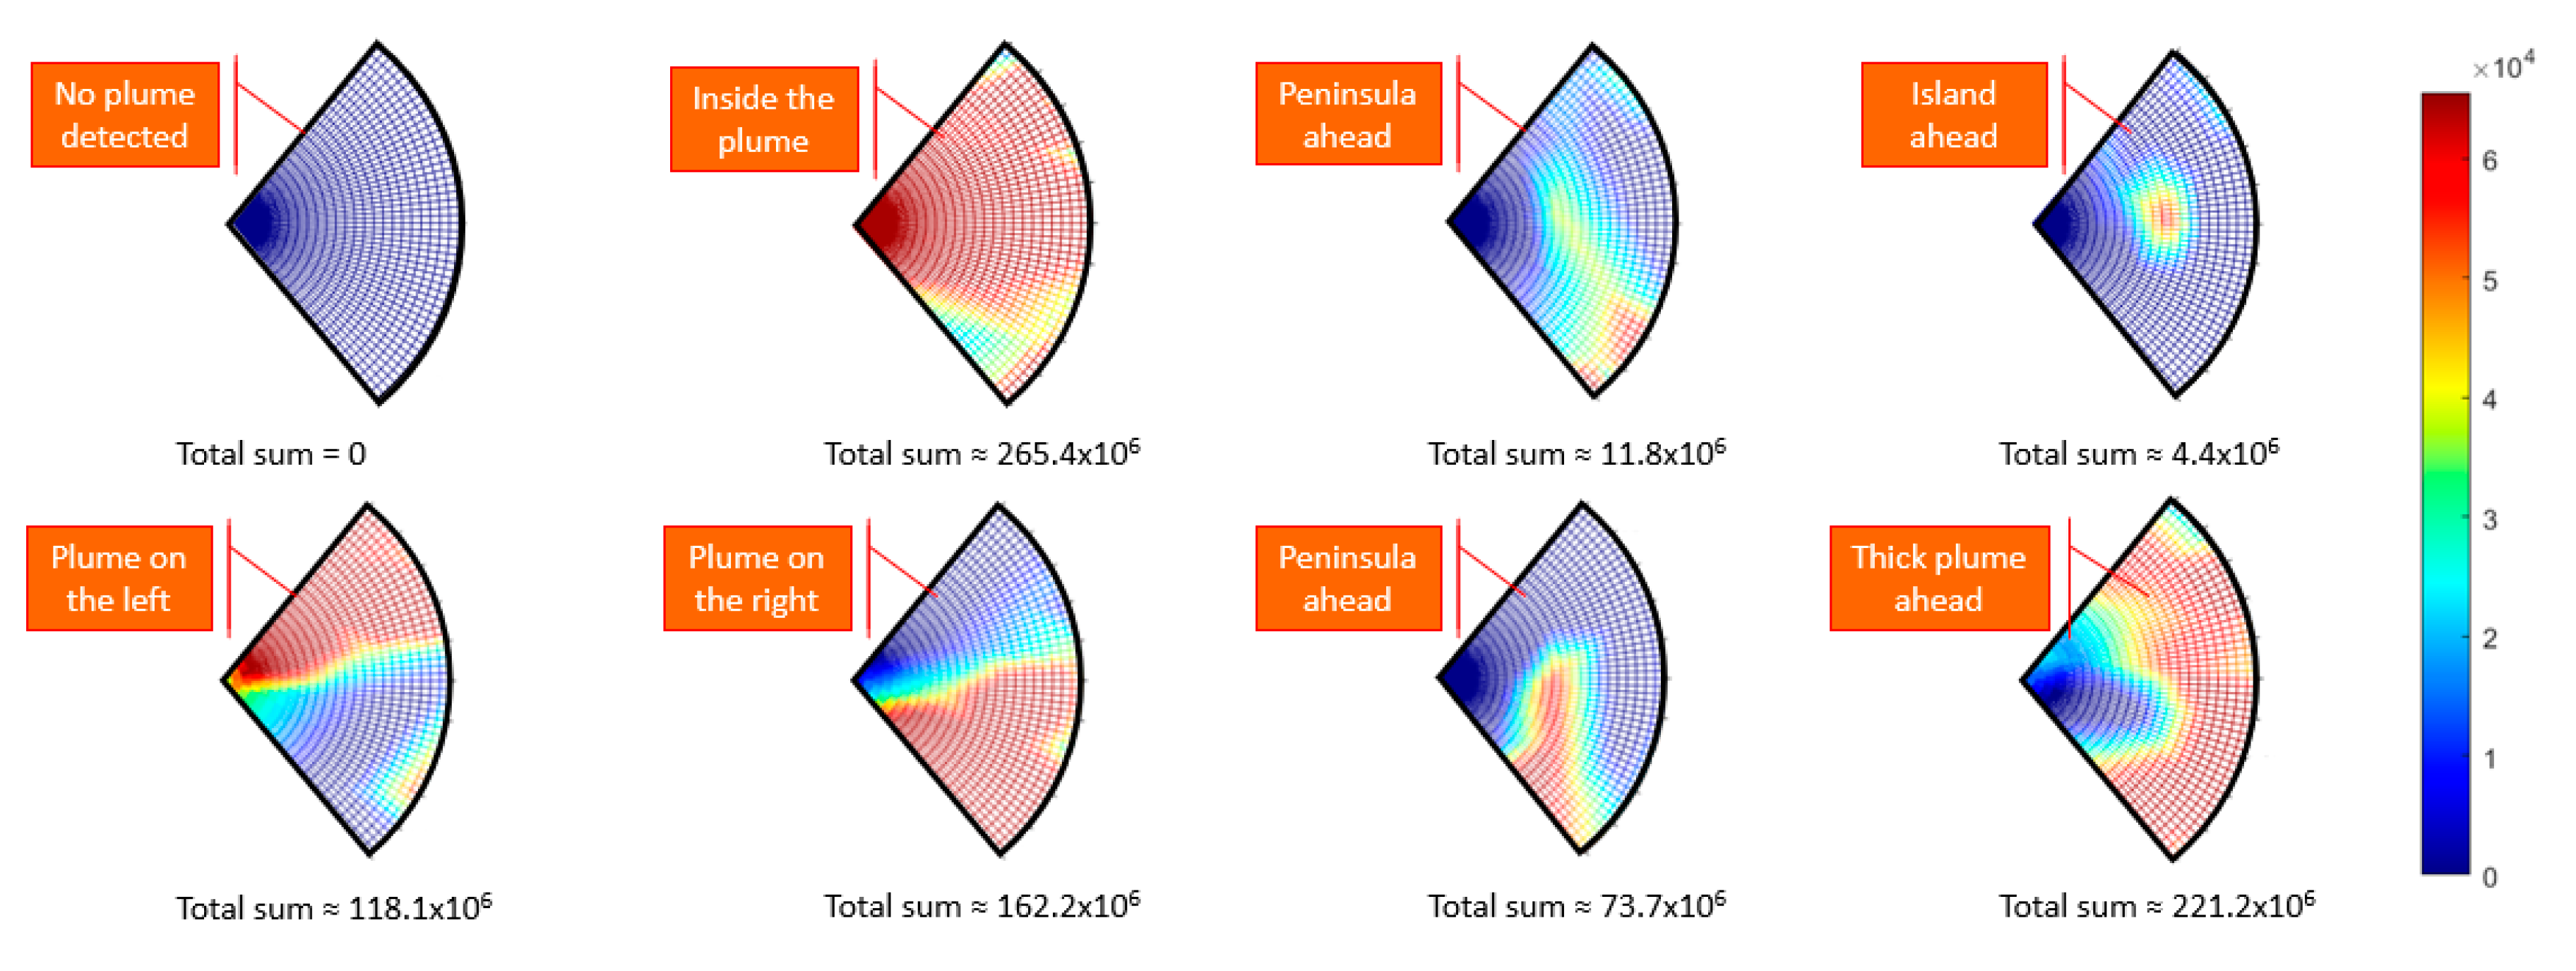
We carried out a further robustness study for a partial plume captured by the sensor model, using the many partial plume shapes sensed during the simulation.
While our search and detection approach relied on the total sum, the distribution of the sensed patch (captured shape) may vary, as shown in
Figure 9. They include, namely—Empty (no sign of plume), Full (full of plume signature), Thin-peninsula (a long edge of the plume with low oil concentration), Thick-peninsula (a long edge of the plume with high oil concentration), Island (a separate whole patch), Left-side (plume is on the left), Right-side (plume is on the right), and Plume-ahead (plume is distributed and fills in the frontal area of the AUV).
These variations could be useful in deciding which direction is more preferable for the AUV to take in the plume tracking phase (this will be described in a future paper). For example, left-side and right-side shapes may produce a similar value of total sum, and hence, indicate analogous proximity. However, the vehicle must adaptively decide whether to make a detour or to push through the plume segment. Also, the algorithm should decide which side of the plume the vehicle follows. Our algorithm adopted an approach to follow the left-edge or left-hand edge. The tracking phase allowed the vehicle to follow and handle the bumpy corners of the plume.
4. Discussion
In the process of developing this search and detection algorithm, we have discovered several crucial characteristics of the method that need to be highlighted for potential future users.
The number of waypoints contributes to the efficiency of the search phase. This number is a function of both the operational area and the approximate size of the plume if it could be predicted. The effectiveness of the Bumblebee flight path we designed relies on the radius of the loops and offset distance, which are proportional to vehicle length and the density of the distributed waypoints. If the radius is too large when the distance between waypoints is set to be relatively short, the search effectiveness decreases because the search path becomes overlapped. If the radius is too small and waypoints are too widely scattered, the proposed search path is less effective when compared to the conventional rectilinear lawnmower path. Therefore, it is crucial to set the most appropriate size of loop depending on the nature and objectives of the mission.
The plume model we developed contains a number of separate patches (called islands) and a “bumpy” boundary (islands and peninsulas), which represent a realistic plume. The key factors for reliable detection are the thresholds. Sum thresholds determine the desired proximity the vehicle maintains to the plume in spite of the challenge induced by the irregular plume boundary. Our strategy for plume detection was based on an assumed two-dimensional horizontal swath of the plume by the acoustic measurements from the sonar. The vertical beam-width of the sonar we modeled leads to a measurement of the average of the oil plume density over a range of depth. This approach enhanced the reliability in detecting a patchy plume by obtaining the sum values and capturing the shapes of the plume edge. These are useful to indicate the overall proximity to the plume as well as to indicate the direction it lies. These integrated detection results are valuable in the plume tracking phase.
5. Conclusions
We have presented a new approach for an adaptive sampling system using a scanning sonar to search for and detect a discontinuous and patchy plume resembling a real oil plume made up of droplets of oil. A mathematical model was designed to emulate the sensing of oil from a 90-degree forward-looking sonar. The algorithm used this data to direct the AUV to identify an oil plume. The validity and feasibility of the algorithm were verified by simulations that targeted a virtual two-dimensional oil plume. The advantage of this approach is that the AUV is able to sense the plume and its density at a distance, and by using a biomimetic search strategy in conjunction with the sonar, the method is not restricted to the detection of continuous plumes with a smooth gradient. Our approach assigns a number of randomly generated waypoints inside a survey area. In doing this, it is important to define the nature of the mission to apply our bumblebee flight search pattern: for example, to indicate whether the mission is to seek a single target as quickly as possible or to seek as many different plume bodies as possible. Tuning the appropriate threshold sum values in accordance with the desired objectives of each mission is crucial for a successful outcome because the desired vehicle behavior will vary depending on the mission objectives.
Overall, our new bumblebee flight method, combined with a genetic solution for the traveling salesperson problem (TSP), outperformed a conventional lawnmower survey in a simulated oil plume search, reducing the AUV travel distance by up to 75.3%. Our plume detection strategy, using acoustic sensing, provided data of plume location, distribution, and density, over a sector in contrast with traditional chemical oil sensors that only provide readings at a point.
In future work, we will combine this detection strategy with a tracking module so that a complete set of adaptive sampling algorithms can be implemented. It is intended that the strategy will be developed to enable tracking of a 3D oil plume over varied depths. It may be necessary for the sonar modeling to include realistic noise from the sensor, and consideration could be given to sonars with different beam-widths. Tests are planned in the real ocean environment to test the operation and robustness of the algorithm.
Author Contributions
Conceptualization, J.H. and N.B.; methodology, J.H.; software, J.H.; validation, J.H. and N.B.; formal analysis, J.H.; investigation, J.H. and N.B.; resources, J.H. and N.B.; writing—original draft preparation, J.H.; writing—review and editing, N.B., H.D.N. and G.W.; visualization, J.H. and N.B.; supervision, N.B., H.D.N. and G.W.; project administration, N.B., H.D.N. and G.W.; funding acquisition, N.B. All authors have read and agreed to the published version of the manuscript.
Funding
Funding was received from Fisheries and Oceans Canada through the Multi-partner Oil Spill Research Initiative (MPRI) 1.03: Oil Spill Reconnaissance and Delineation through Robotic Autonomous Underwater Vehicle Technology in Open and Iced Waters. This research was also supported by the Australian Research Council’s Special Research Initiative under the Antarctic Gateway Partnership (Project ID SR140300001) and through an Australian Government Research Training Program Scholarship to the first author.
Conflicts of Interest
The authors declare no known conflict of interest. The funders had no role in the design of the study; in the collection, analyses, or interpretation of data; in the writing of the manuscript, or in the decision to publish the results.
References
- Conmy, R.N.; King, T.; Robinson, B.; Ryan, S.; Lu, Y.; Abercrombie, M.; Boufadel, M.; Niu, H. Dispersant Effectiveness, In-Situ Droplet Size Distribution and Numerical Modeling to Assess Subsurface Dispersant Injection as a Deepwater Blowout Oil Spill Response Option and Evaluation of Oil Fluorescence Characteristics to Improve Forensic Response Tools; EPA/600/R-16/152; Environmental Protection Agency: Washington, DC, USA, 2016.
- Hwang, J.; Bose, N.; Fan, S.; Robinson, B.; Tenekedjiev, K. Complications of robotic delineation of oil spills at sea. In Proceedings of the International Association of Maritime Universities (IAMU) Conference, Tasmania, Australia, 17 October 2017; pp. 26–33. [Google Scholar]
- Weaver, J.W. Characteristics of Spilled Oils, Fuels, and Petroleum Products: 3a. Simulation of Oil Spills and Dispersants under Conditions of Uncertainty; Environmental Protection Agency: Washington, DC, USA, 2004.
- Council, N.R. Oil in the Sea III: Inputs, Fates, and Effects; National Academies Press: Washington, DC, USA, 2003. [Google Scholar]
- Hwang, J.; Bose, N.; Fan, S. AUV Adaptive Sampling Methods: A Review. Appl. Sci. 2019, 9, 3145. [Google Scholar] [CrossRef] [Green Version]
- Farrell, J.A.; Pang, S.; Li, W. Chemical plume tracing via an autonomous underwater vehicle. IEEE J. Ocean. Eng. 2005, 30, 428–442. [Google Scholar] [CrossRef]
- Issac, M.T.; Adams, S.; He, M.; Bose, N.; Williams, C.D.; Bachmayer, R.; Crees, T. Manoeuvring experiments using the MUN Explorer AUV. In Proceedings of the Underwater Technology and Workshop on Scientific Use of Submarine Cables and Related Technologies, Tokyo, Japan, 17–20 April 2007; pp. 256–262. [Google Scholar]
- Lewis, R.; Bose, N.; Lewis, S.; King, P.; Walker, D.; Devillers, R.; Ridgley, N.; Husain, T.; Munroe, J.; Vardy, A. MERLIN-A decade of large AUV experience at Memorial University of Newfoundland. In Proceedings of the 2016 IEEE/OES Autonomous Underwater Vehicles (AUV), Tokyo, Japan, 6–9 November 2016; pp. 222–229. [Google Scholar]
- Kashino, Z.; Nejat, G.; Benhabib, B. A multi-robot sensor-delivery planning strategy for static-sensor networks. In Proceedings of the 2017 IEEE/RSJ International Conference on Intelligent Robots and Systems (IROS), Vancouver, BC, Canada, 24–28 September 2017; pp. 6640–6647. [Google Scholar]
- Siegwart, R.; Nourbakhsh, I.R.; Scaramuzza, D. Introduction to Autonomous Mobile Robots; A Bradford Book; MIT Press: Cambridge, MA, USA, 2011. [Google Scholar]
- Hwang, J.; Fan, S.; King, P.; Forrest, A. Development of error reduction model using Bayesian filter for AUV navigating under moving ice. In Proceedings of the 2018 IEEE/OES Autonomous Underwater Vehicle Workshop (AUV), Porto, Portugal, 6–9 November 2018; pp. 1–6. [Google Scholar]
- Balsley, A.; Hansen, K.; Fitzpatrick, M. Detection of oil within the water column. Int. Oil Spill Conf. Proc. 2014, 2206–2217. [Google Scholar] [CrossRef]
- Davidor, Y. Genetic Algorithms and Robotics: A Heuristic Strategy for Optimization; World Scientific: Singapore, 1991; Volume 1. [Google Scholar]
- Dukas, R.; Real, L.A. Effects of recent experience on foraging decisions by bumble bees. Oecologia 1993, 94, 244–246. [Google Scholar] [CrossRef] [PubMed]
- Philippides, A.; de Ibarra, N.H.; Riabinina, O.; Collett, T.S. Bumblebee calligraphy: The design and control of flight motifs in the learning and return flights of Bombus terrestris. J. Exp. Biol. 2013, 216, 1093–1104. [Google Scholar] [CrossRef] [PubMed] [Green Version]
Figure 1.
Flowchart describing the designed adaptive sampling procedure. Four independent iteration modes are highlighted in the yellow boxes.
Figure 1.
Flowchart describing the designed adaptive sampling procedure. Four independent iteration modes are highlighted in the yellow boxes.
Figure 2.
A virtual oil plume model, of approximately 400 m by 400 m, generated in the simulation domain within a 1000 m by 1000 m space, presented as a density plot over an equally spaced mesh grid.
Figure 2.
A virtual oil plume model, of approximately 400 m by 400 m, generated in the simulation domain within a 1000 m by 1000 m space, presented as a density plot over an equally spaced mesh grid.
Figure 3.
Autonomous underwater vehicle in the global reference frame and the local reference frame.
Figure 3.
Autonomous underwater vehicle in the global reference frame and the local reference frame.
Figure 4.
The BV5000 (Teledyne Blueview) sonar images captured in seawater wave tank tests: five seconds (a); and ninety seconds after oil release (b).
Figure 4.
The BV5000 (Teledyne Blueview) sonar images captured in seawater wave tank tests: five seconds (a); and ninety seconds after oil release (b).
Figure 5.
A descriptive sensor model of the sonar signal detection. The measurements include the acoustic intensity values for each tessellated polar grid cell.
Figure 5.
A descriptive sensor model of the sonar signal detection. The measurements include the acoustic intensity values for each tessellated polar grid cell.
Figure 6.
The Genetic Algorithm pseudo code.
Figure 6.
The Genetic Algorithm pseudo code.
Figure 7.
The proposed bumblebee flight survey was executed on arrival at a waypoint (a,b). A full AUV trajectory is shown where no oil plume is detected (c). The green dotted line indicates the planned AUV trajectory. The red line corresponds to the actual AUV trajectory on performing the bumblebee flight.
Figure 8.
Simulation result using a conventional lawnmower search path with a 100 m distance interval between rectilinear legs (a) and an example of the bumblebee flight search path with five waypoints (b).
Figure 8.
Simulation result using a conventional lawnmower search path with a 100 m distance interval between rectilinear legs (a) and an example of the bumblebee flight search path with five waypoints (b).
Figure 9.
Detection results of the plume edge. They varied in total sum and in the shapes, which define the relation of the AUV to the plume. They are useful for making decisions on the next AUV heading. Sensed plume shapes are named as Empty, Full, Thin-peninsula, Island, Left-side, Right-side, Thick-peninsula, Plume-ahead (from left to right).
Table 1.
The specifications of two sonar instruments.
Table 1.
The specifications of two sonar instruments.
| Model | M450-130 | BV5000 |
|---|
| Manufacturer | Teledyne | Teledyne |
| Operating frequency | 450 kHz | 1.35 MHz |
| Software | ProScan | ProViewer |
| Field of view | 130° | 45° |
| Maximum range | 300 m | 30 m |
| Optimum range | 2~150 m | 1~20 m |
| Beam width | 10° | 1° |
| Beam spacing | 0.18° | 0.18° |
| Number of beams | 768 | 256 |
| Range resolution | 2.7 cm | 1.5 cm |
| Update rate | Up to 25 Hz | Up to 40 Hz |
| Supply voltage | 12~48 V DC | 20~29 V DC |
| Power consumption | <24 W | <45 W |
| Connectivity | Ethernet | Ethernet/RS 485 |
| Depth rating | 1000 m | 300 m |
| Dimensions | (22.9 × 19.6 × 10.2) cm | (26.7 × 23.4 × 39.1) cm |
Table 2.
Descriptions of thresholds set for detection state.
Table 2.
Descriptions of thresholds set for detection state.
| Threshold | Value | AUV Status |
|---|
| ThresholdENTRE | 2.18% AggregateMAX = 6.43 × 10⁶ | Detection is made |
| ThresholdEXIT | 0.02% AggregateMAX = 4.43 × 10⁴ | AUV has lost the plume |
| ThresholdMAX | 60% AggregateMAX = 176.94 × 10⁶ | Too close to the plume |
| ThresholdMIN | 20% AggregateMAX = 58.98 × 10⁶ | Too far from the plume |
Table 3.
The total distance required for detection.
Table 3.
The total distance required for detection.
| Sampling Pattern | The Number of Waypoints | Distance (m) |
|---|
| Lawnmower | 17 | 4.01 |
| Bumblebee | 5 | 0.99 |
| Bumblebee | 10 | 1.50 |
| Bumblebee | 17 | 2.01 |
© 2020 by the authors. Licensee MDPI, Basel, Switzerland. This article is an open access article distributed under the terms and conditions of the Creative Commons Attribution (CC BY) license (http://creativecommons.org/licenses/by/4.0/).


