Ultimate Compressive Strength of Stiffened Panel: An Empirical Formulation for Flat-Bar Type


Abstract
1. Introduction
2. Brief Review of the Existing Formulations
3. Ultimate Strength Calculations by the Non-Linear Finite Element Method (NLFEM)
3.1. Selection of Scenarios of Flat-Bar Stiffened Panel
3.2. Structural Modelling
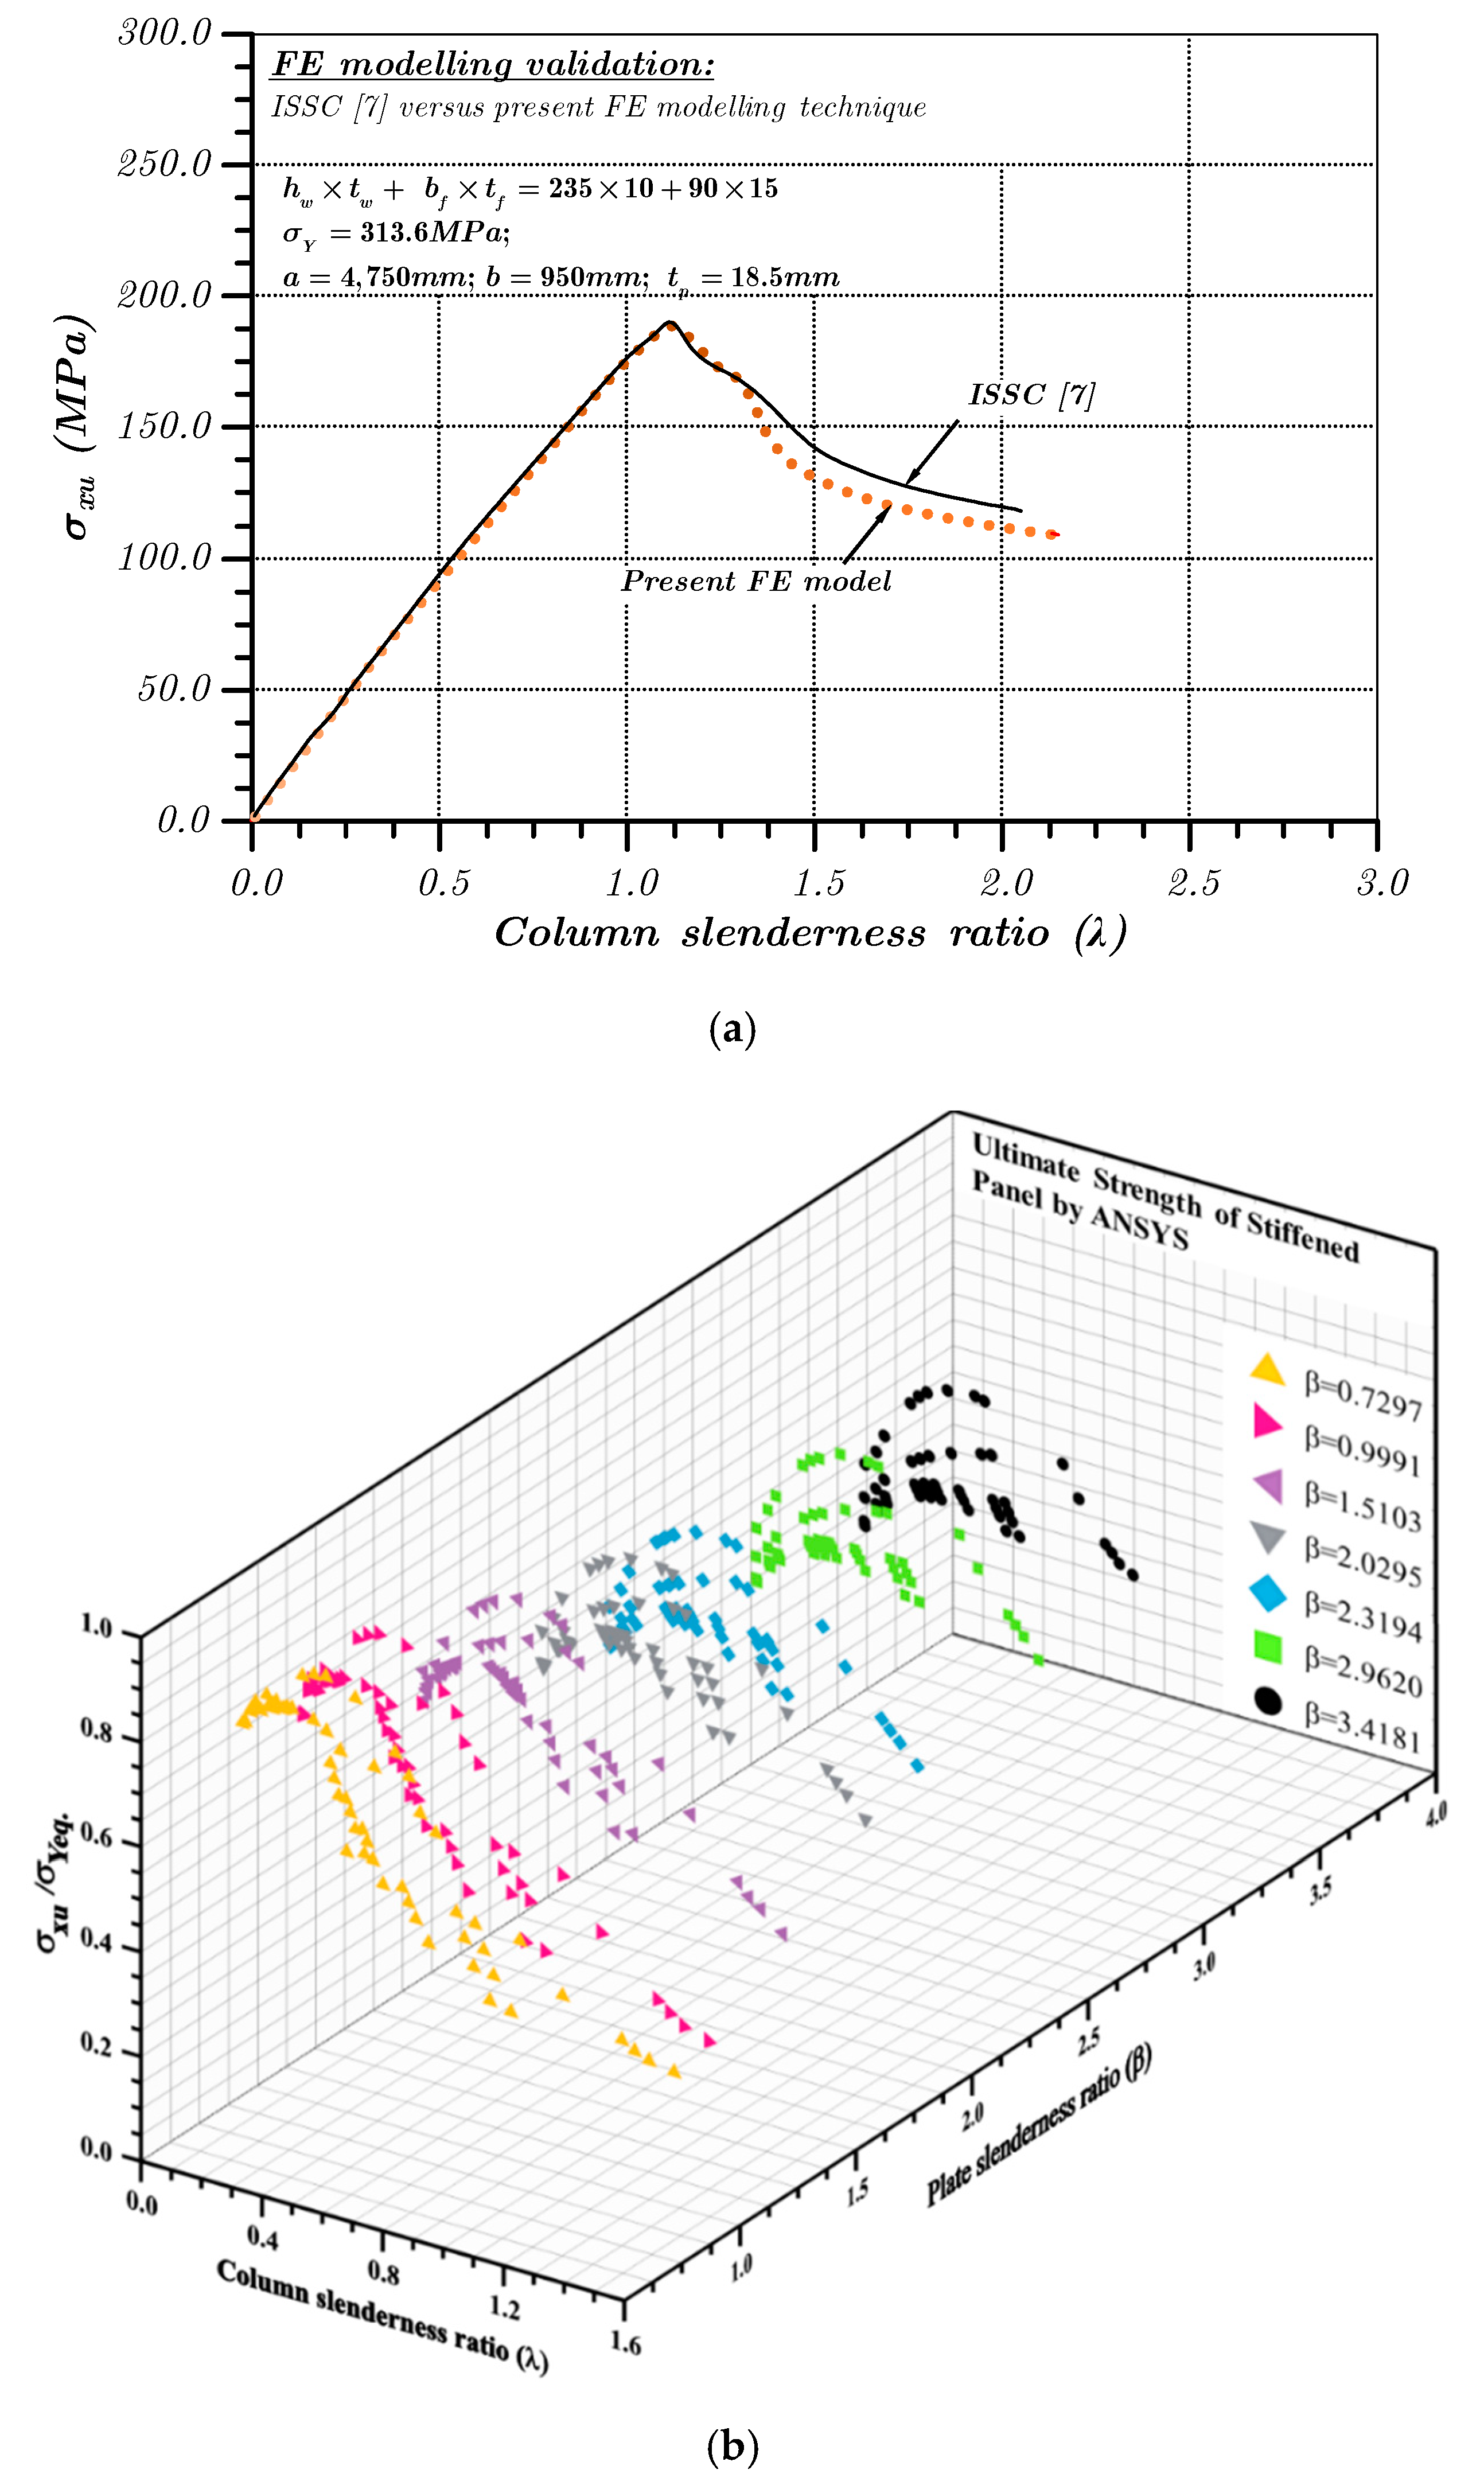
3.3. Structural Analysis and Results
4. Development of Empirical Formulation and Verification of its Applicability
4.1. Empirical Formulation for Flat-Bar Stiffened Panel
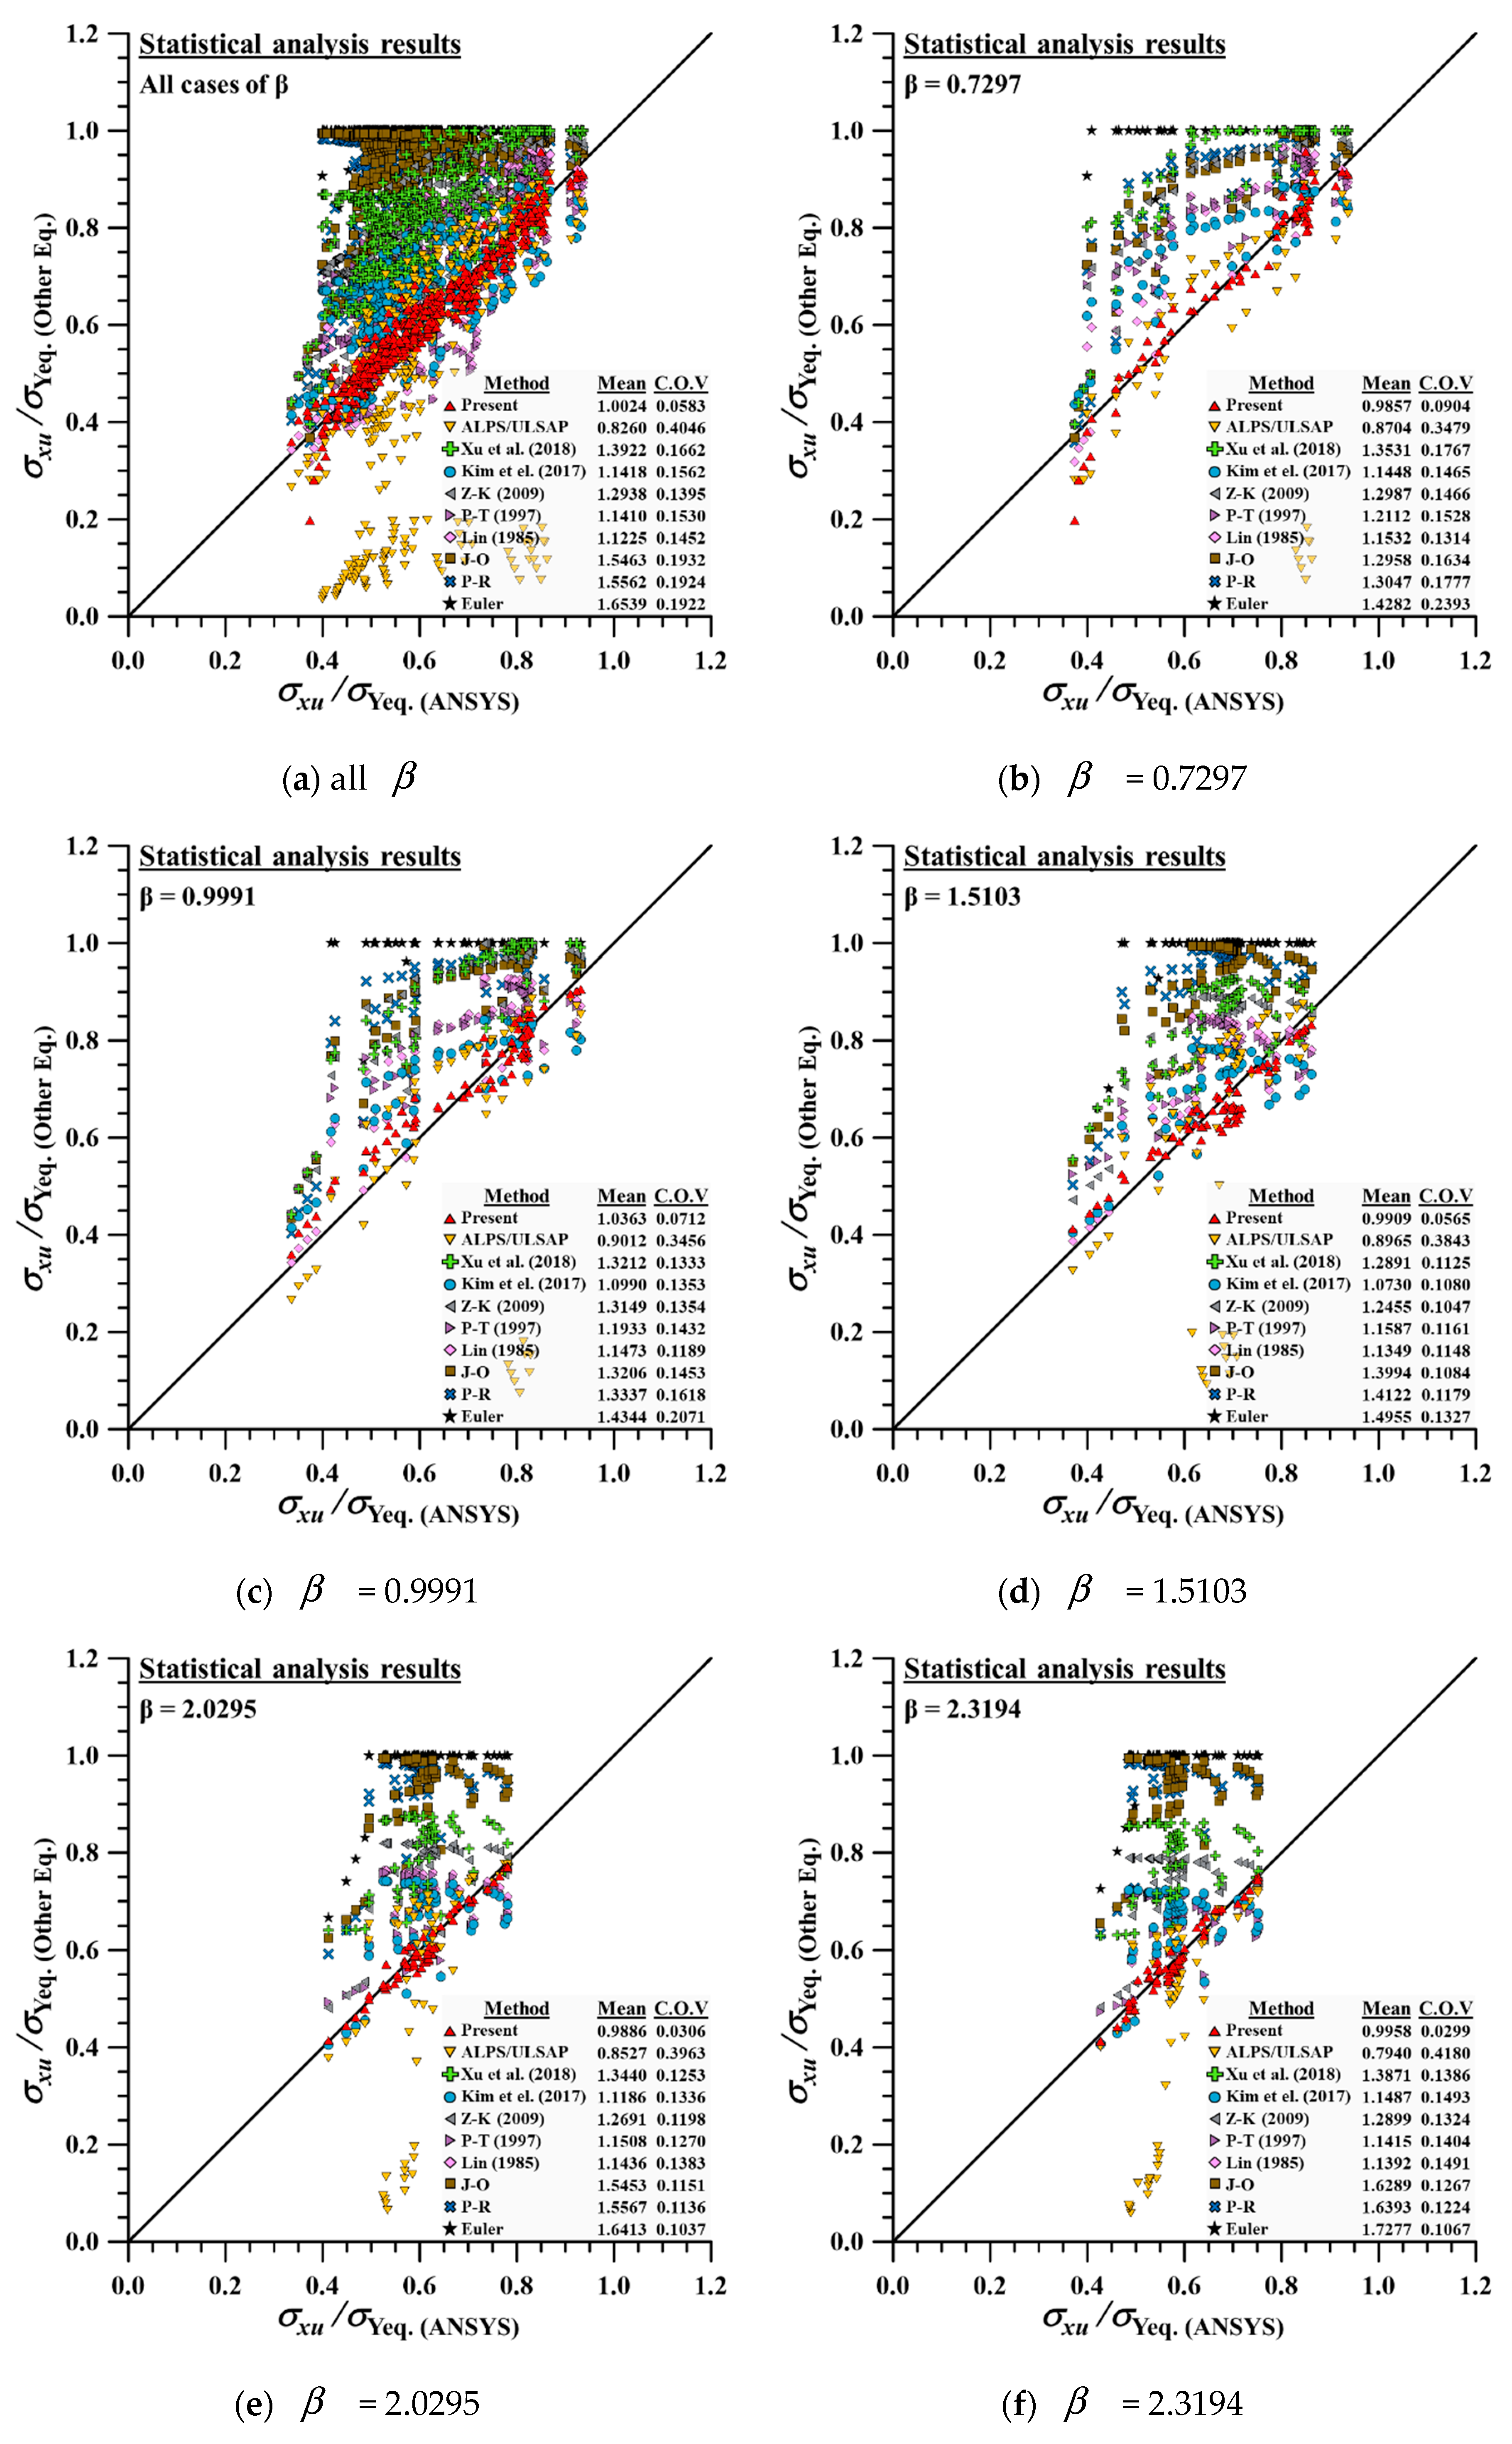
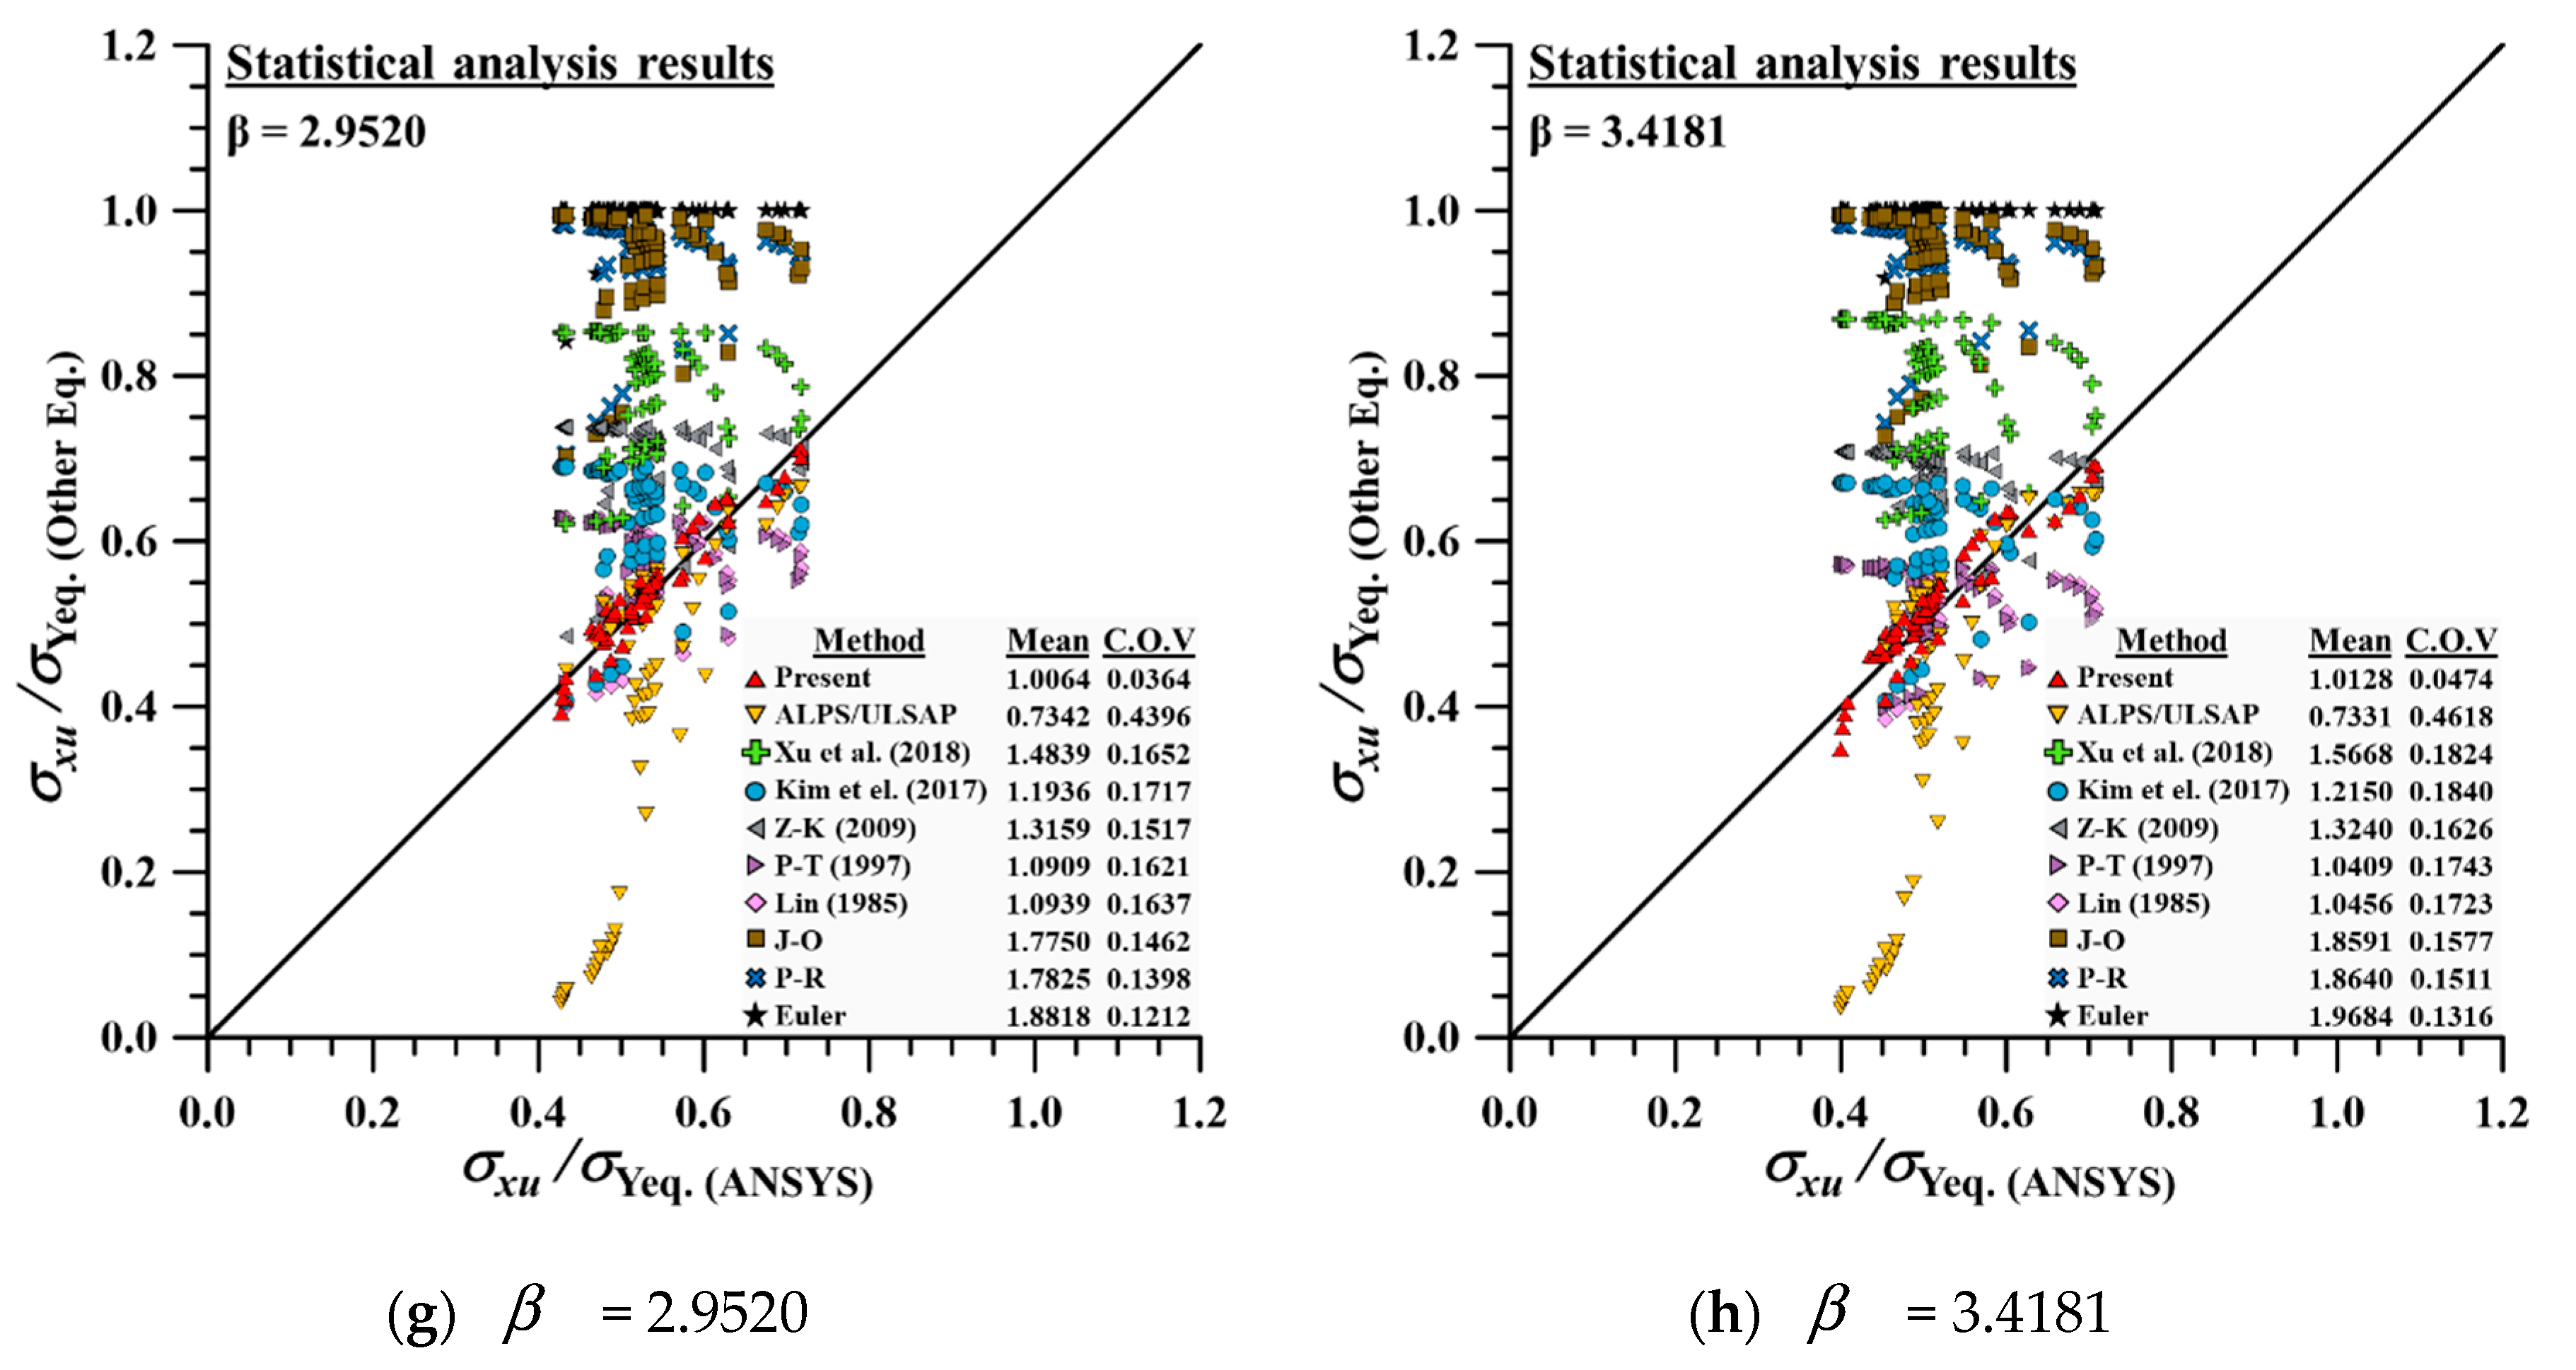
4.2. Statistical Analysis for Verification of Developed Empirical Formulation
4.3. Additional Considerations
5. Conclusions
5.1. Findings
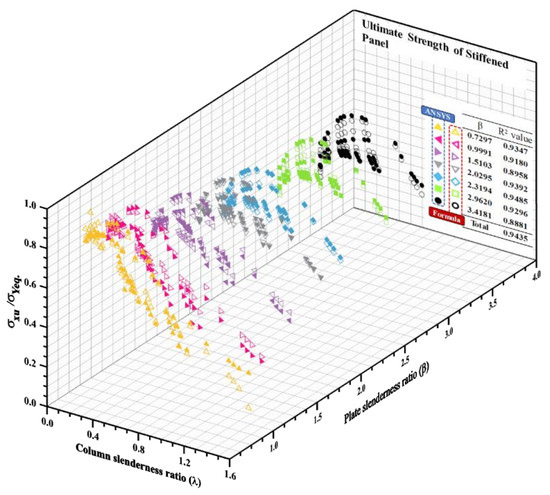
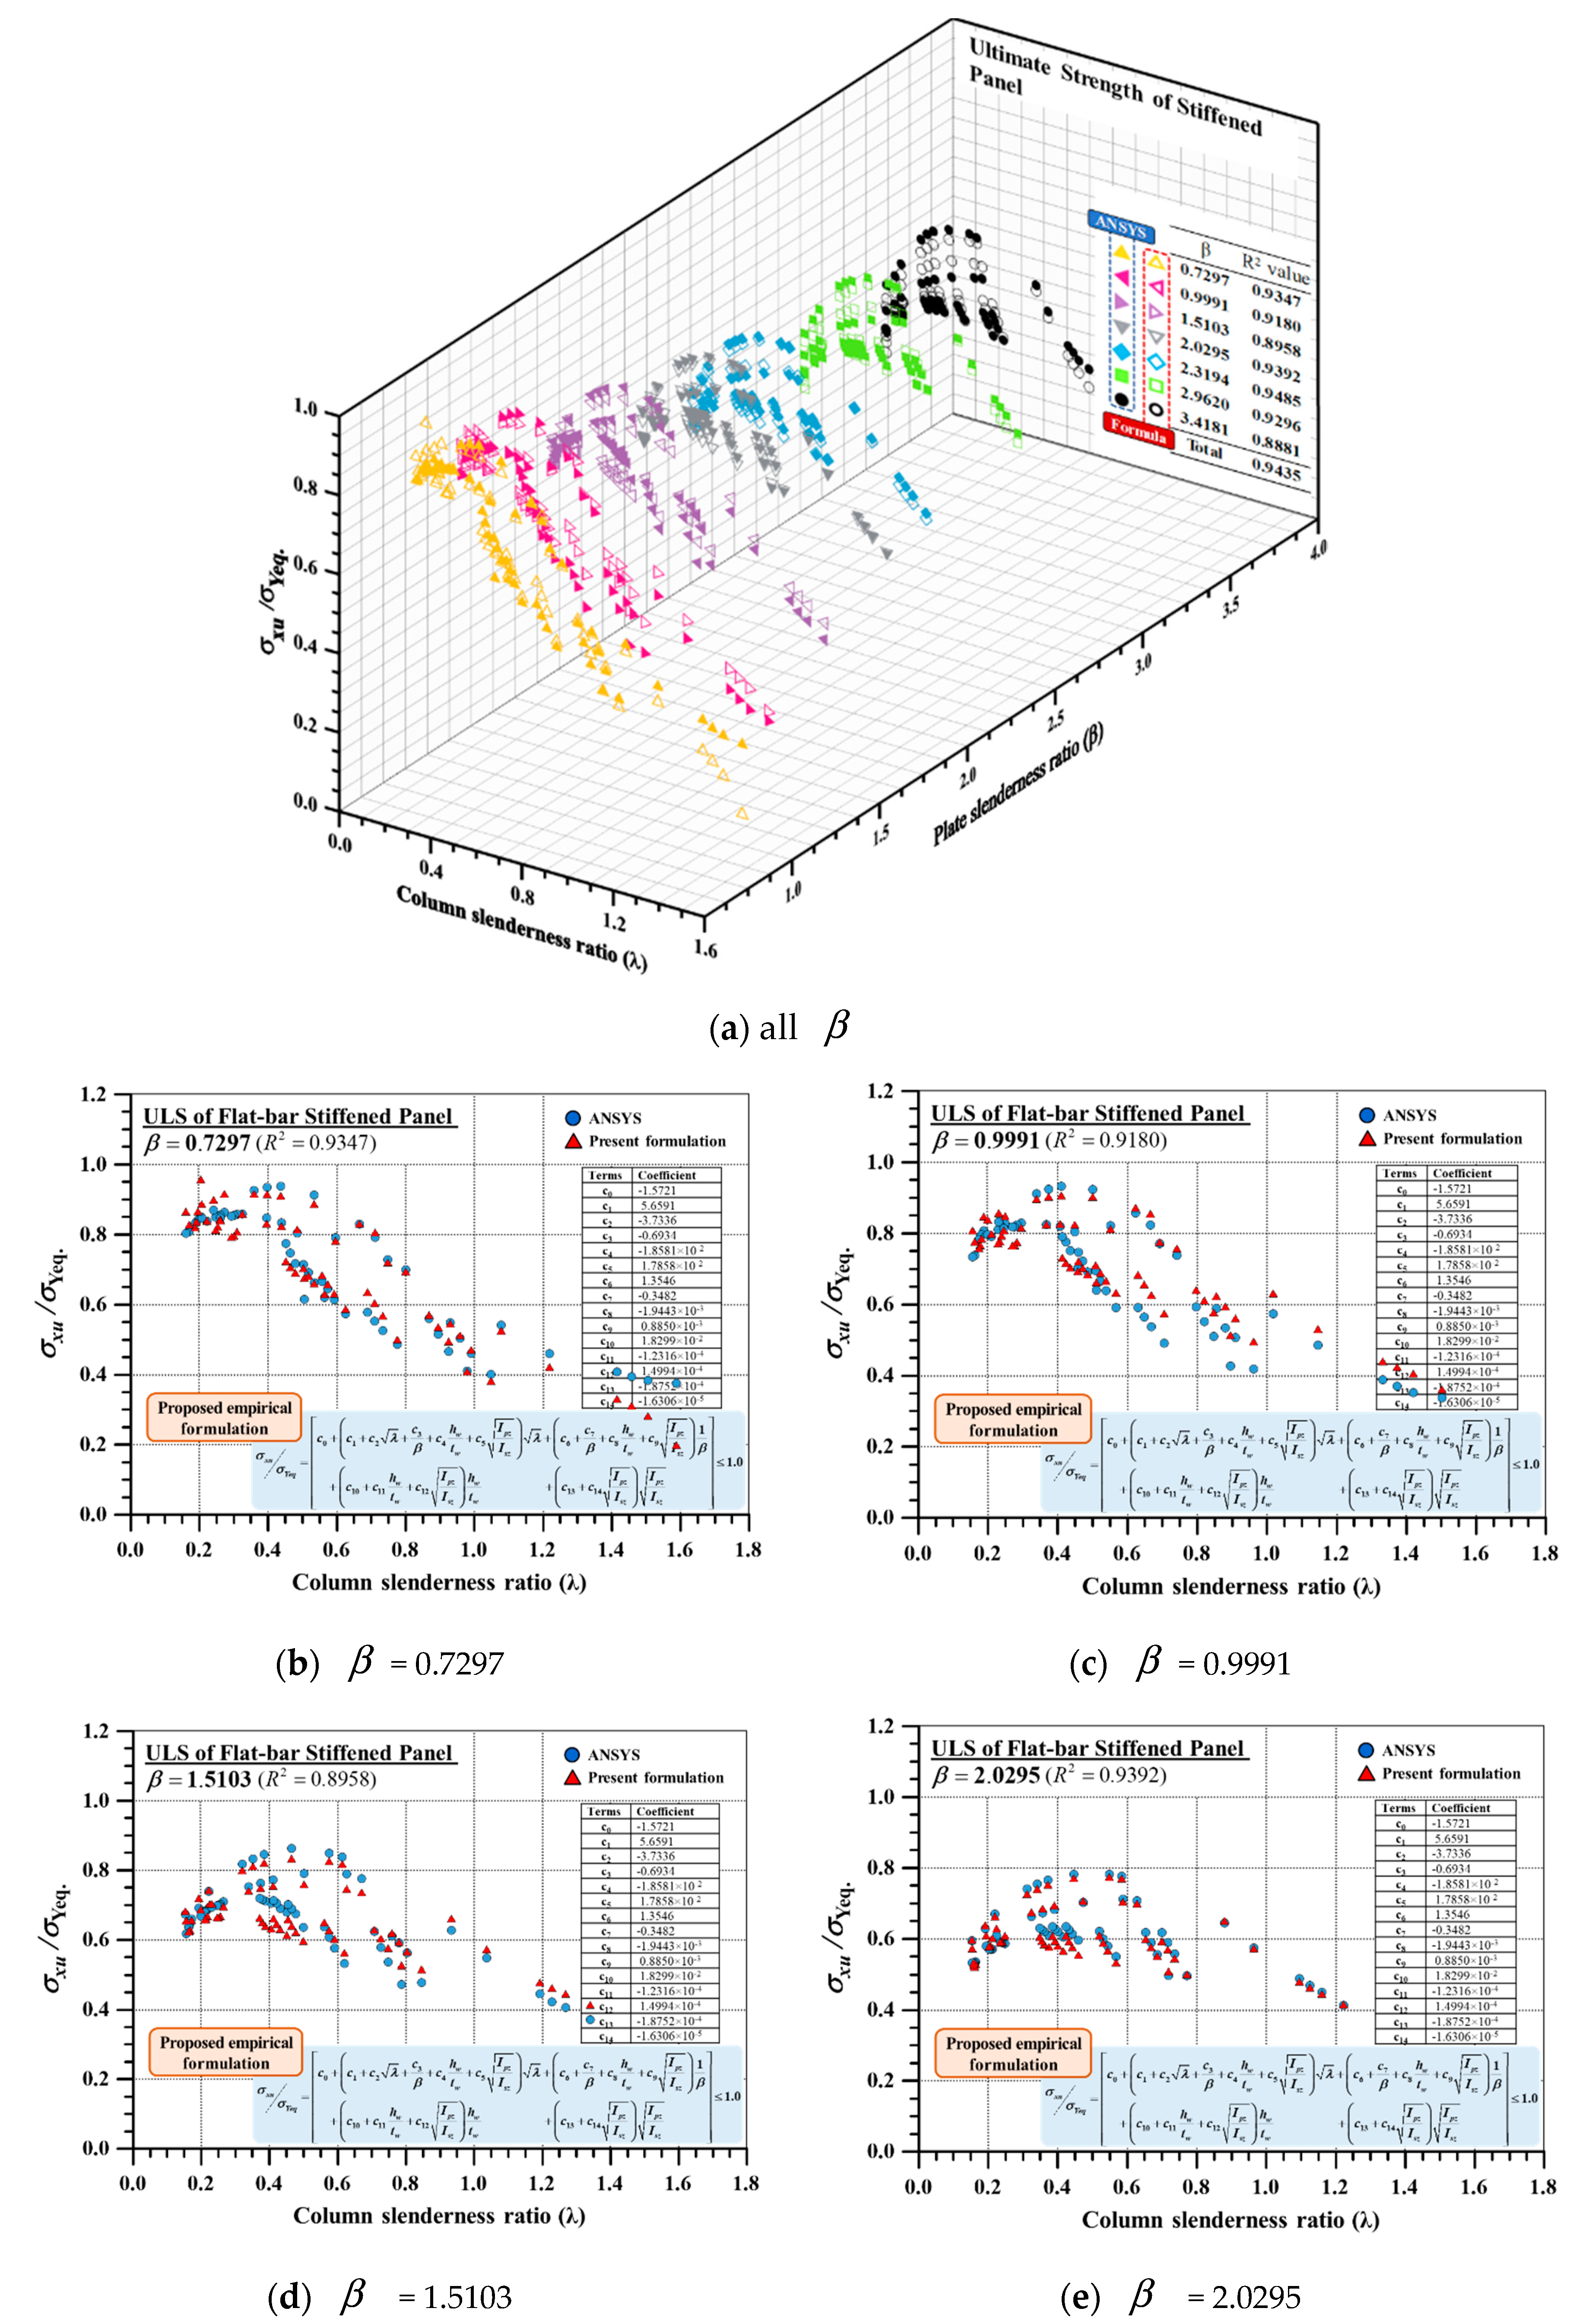
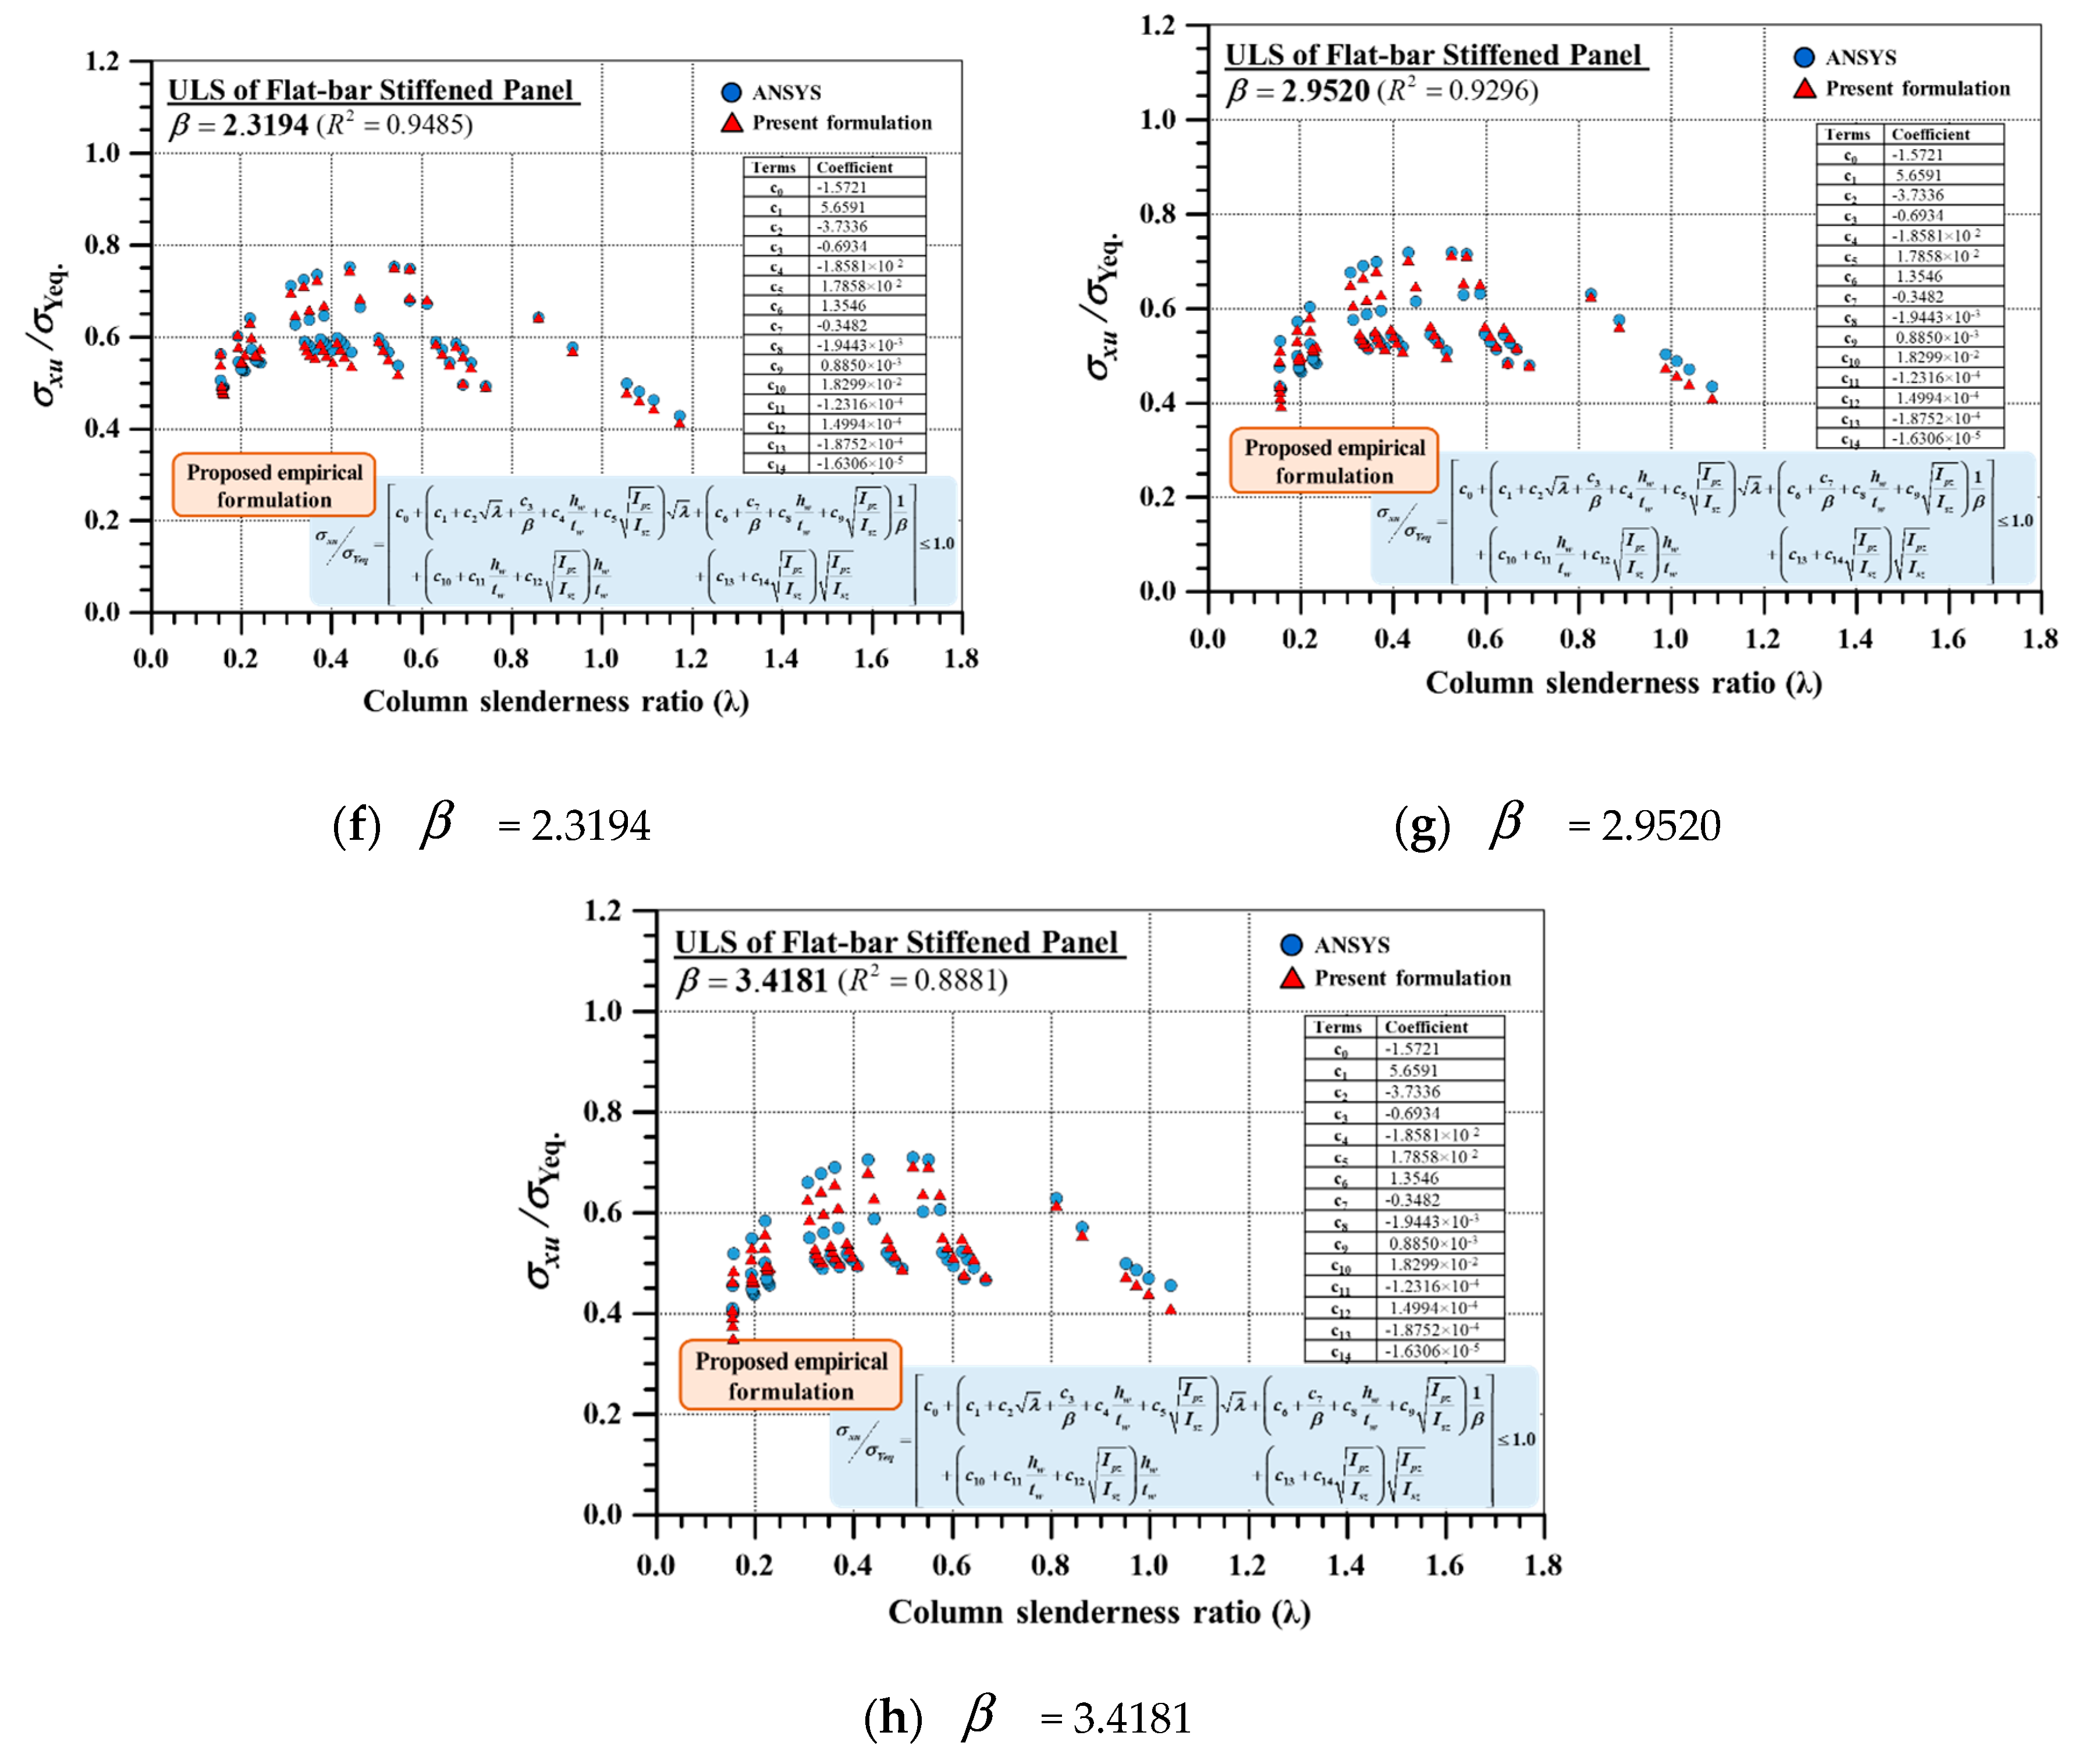
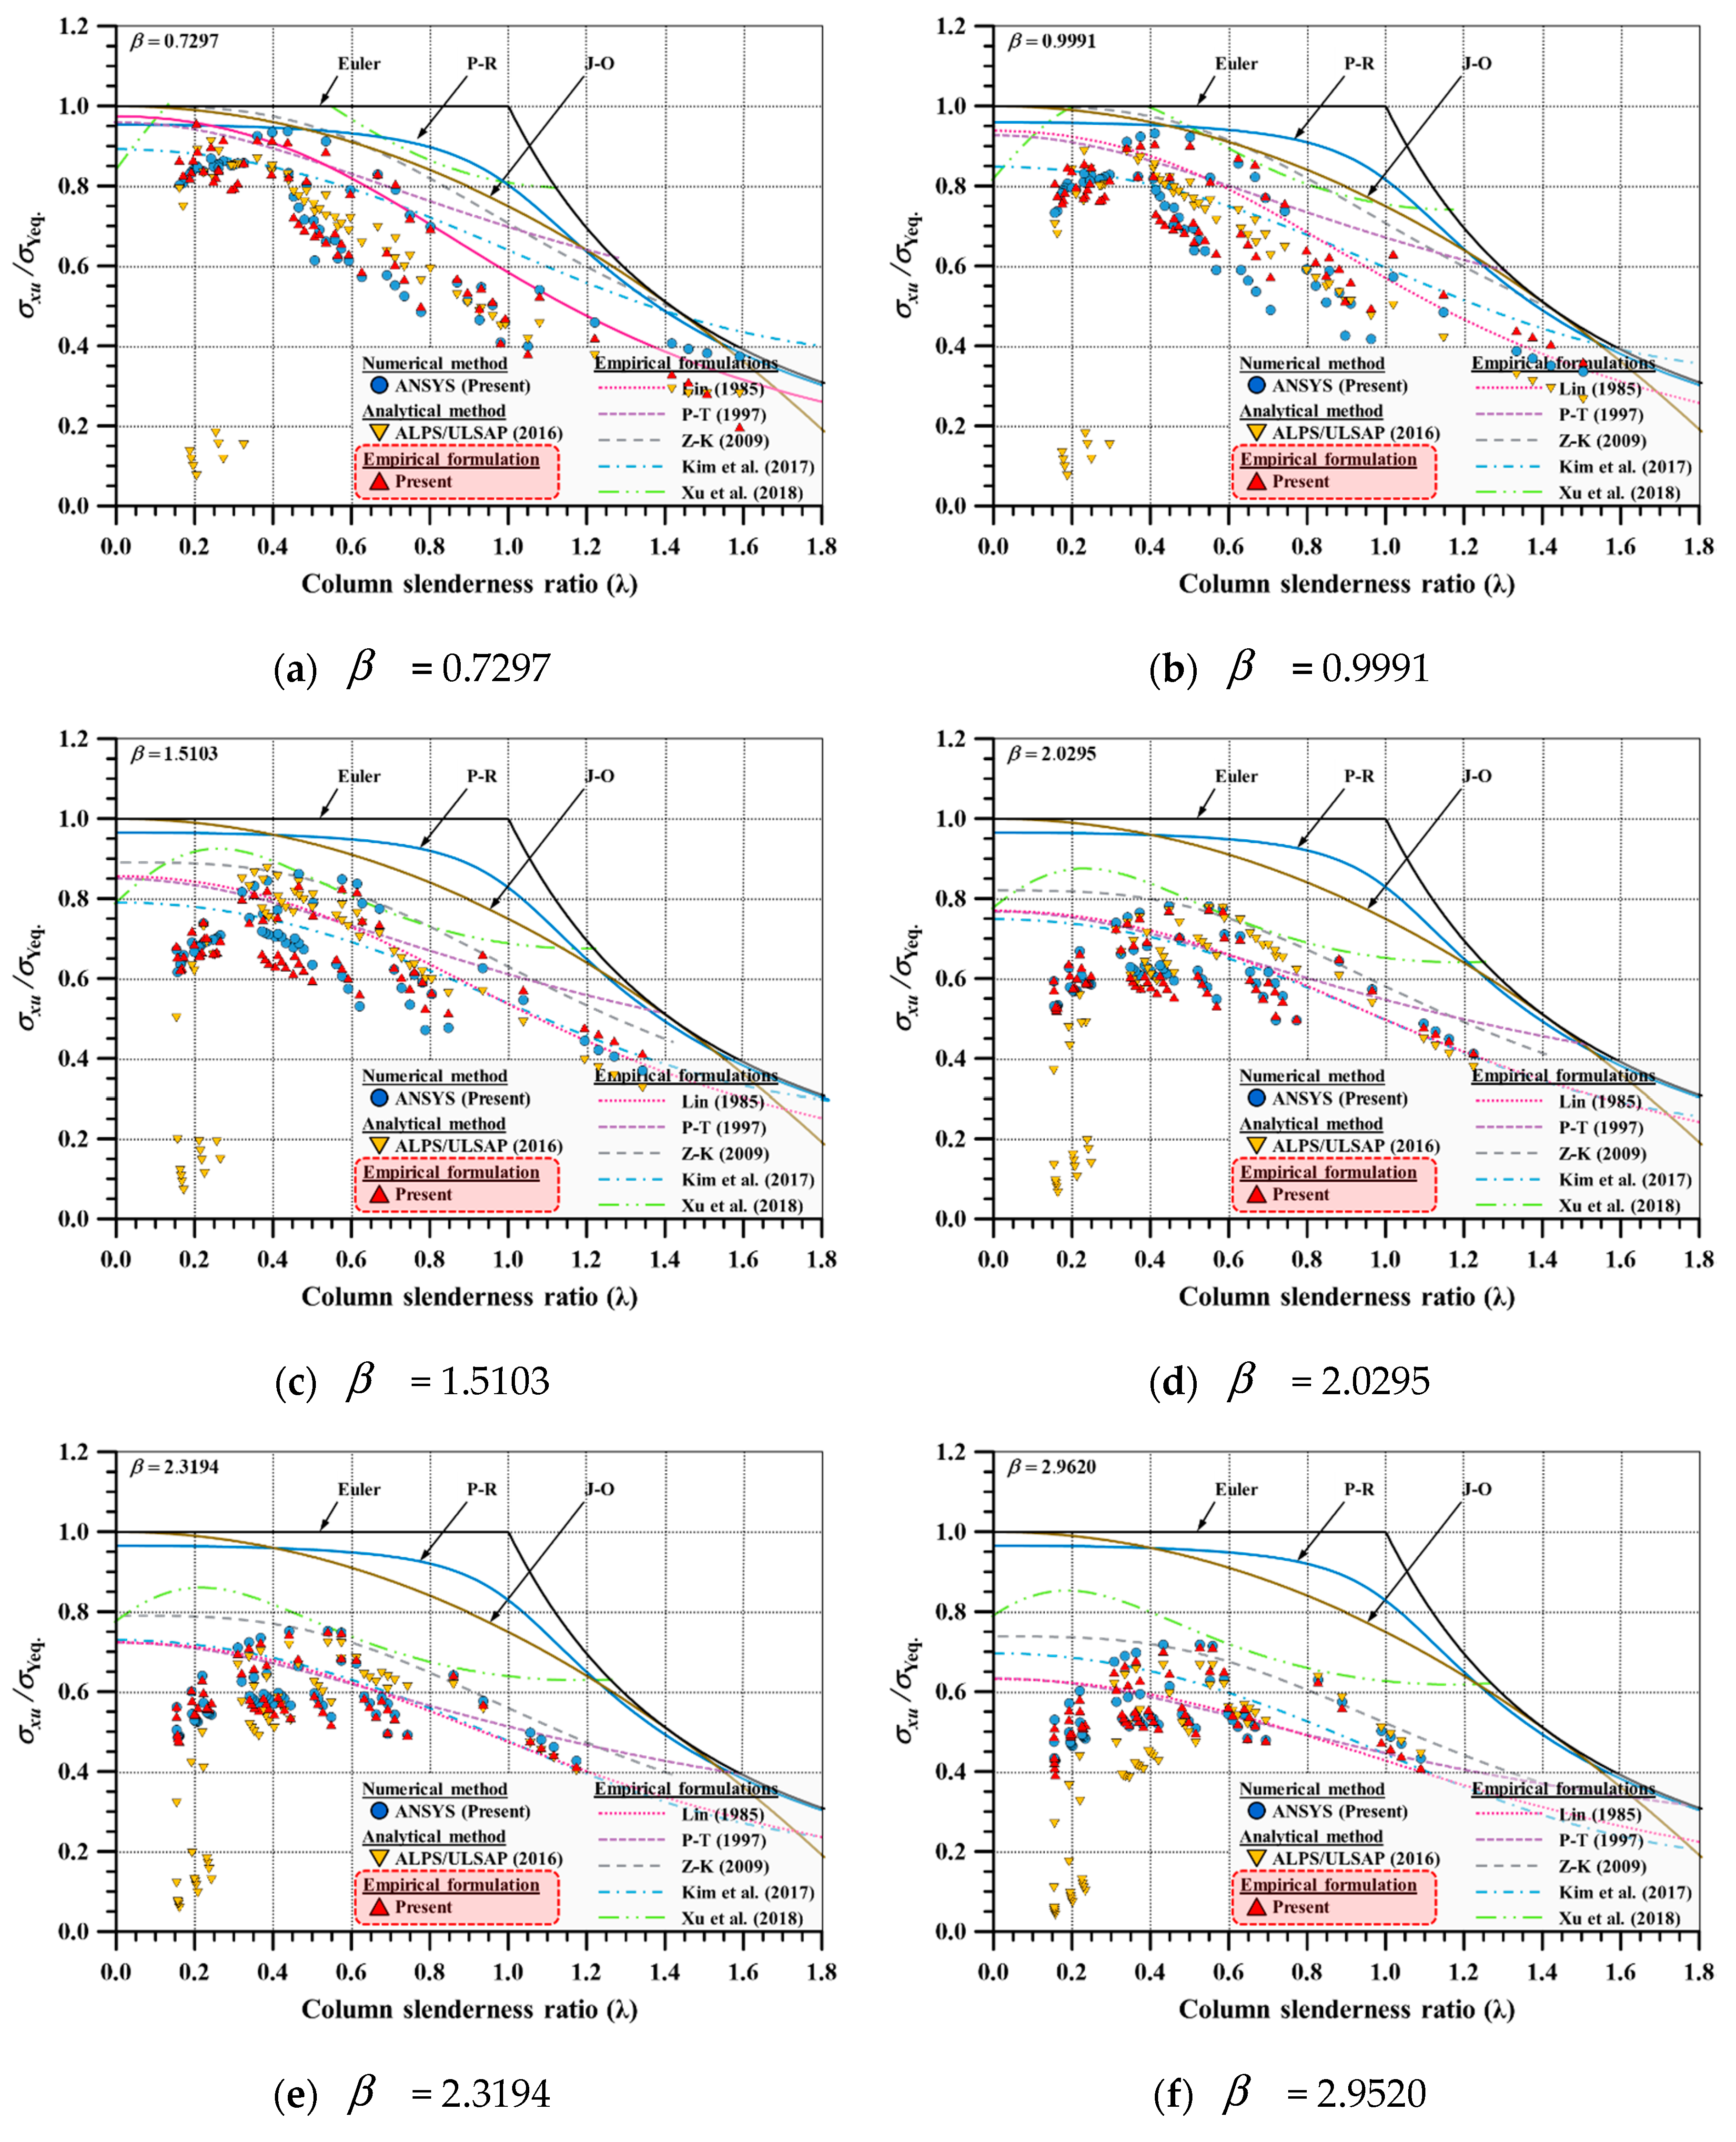
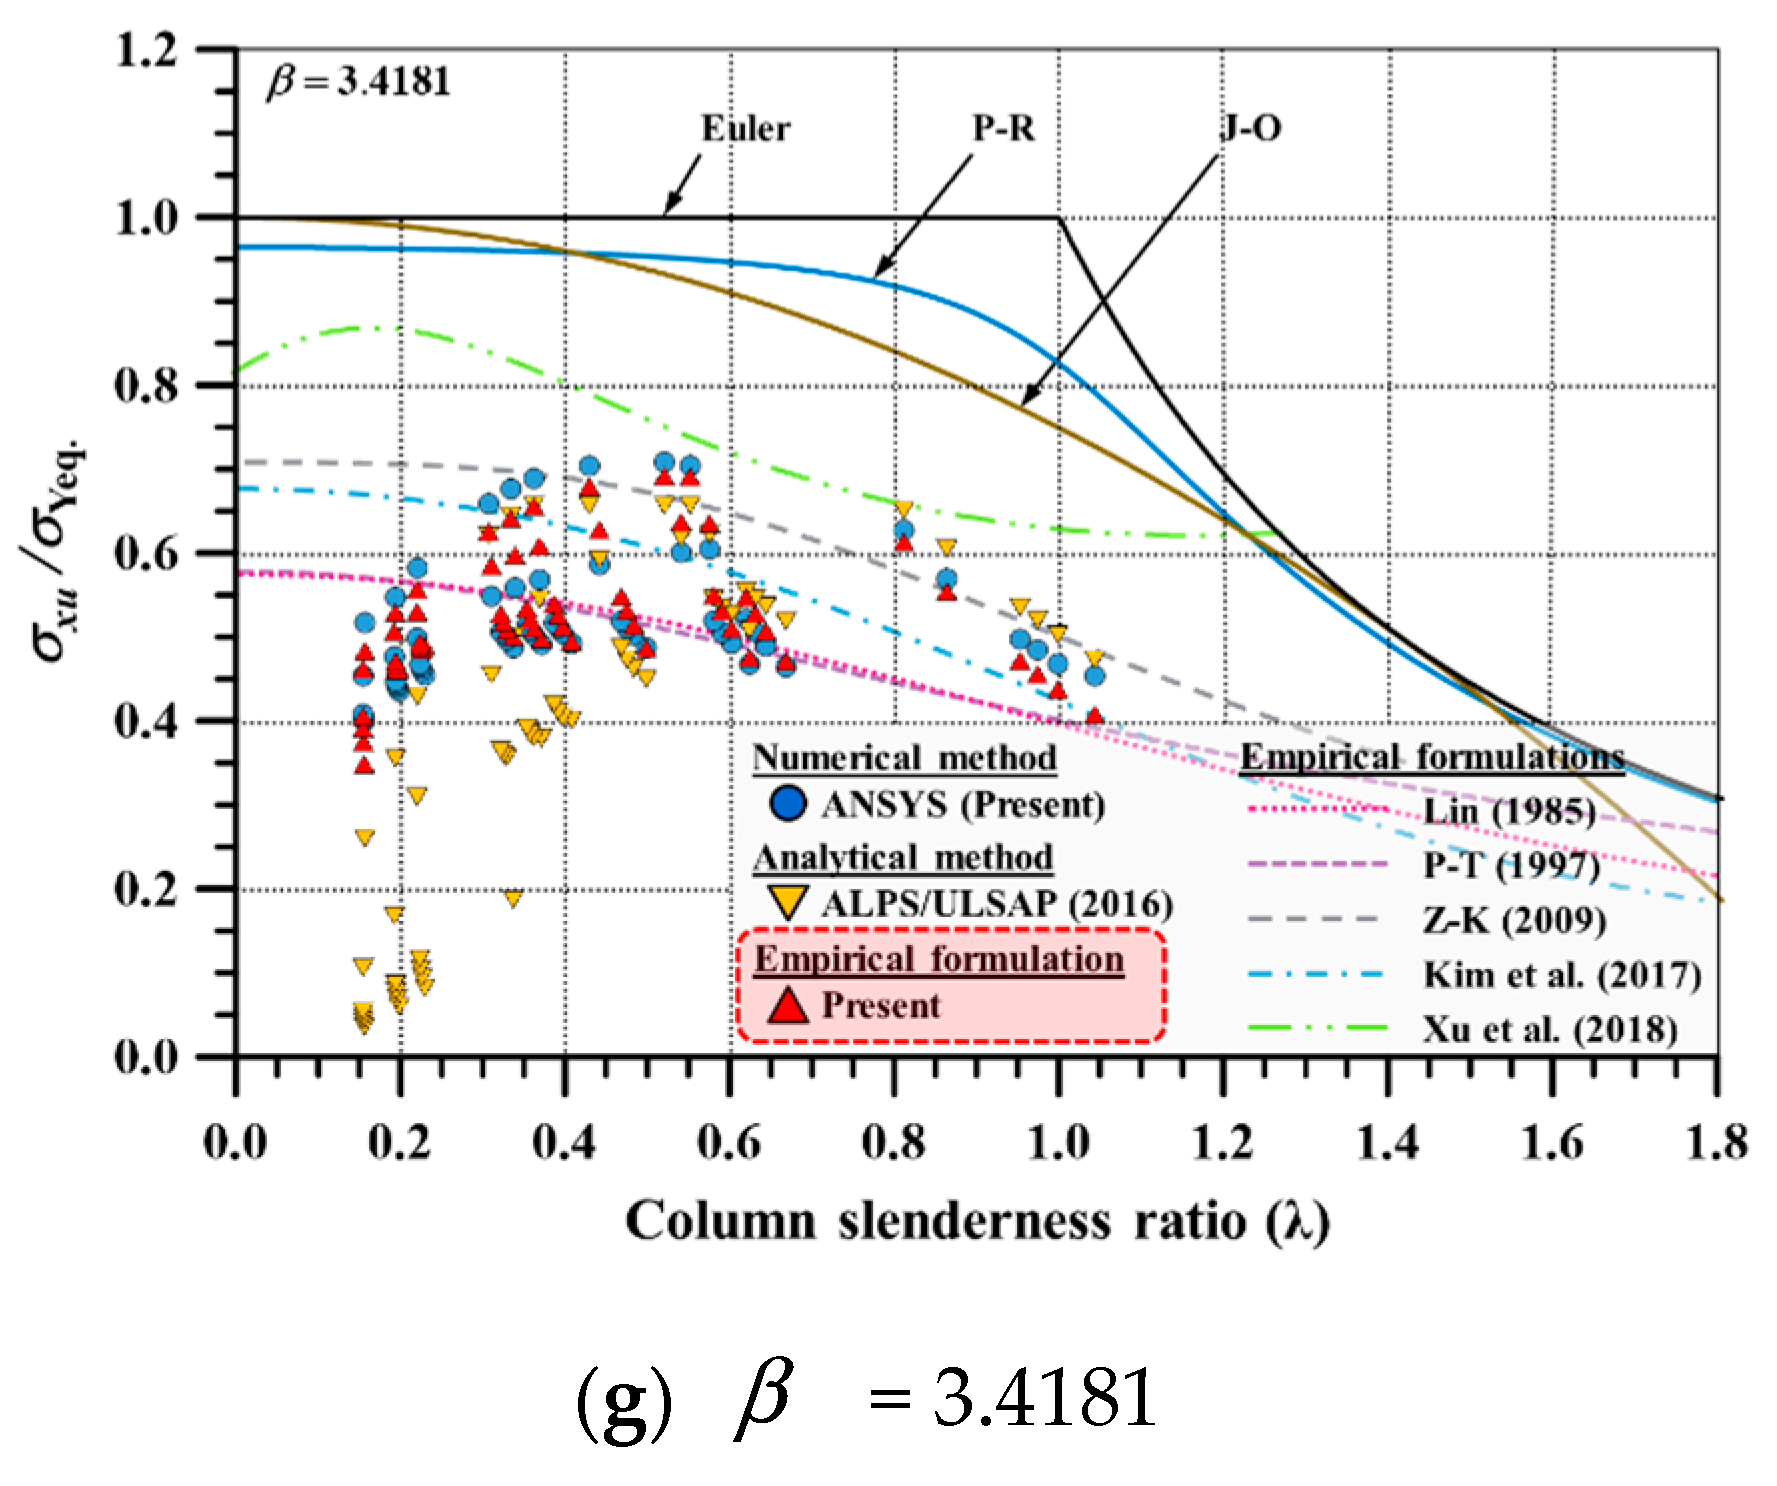
- When the plate slenderness ratio () increased, the ULS tended to be a generalised shape, which represented a tendency to regularly decrease diagonally, as shown in Figure 6e–h. This may have been caused by the buckling of the plate element, which affected the overall collapse behaviour of the stiffened panel. In addition, this trend was observed when the plate was considered thin ()
- As represented in Figure 6b–d, when the plate got thick, the ultimate limit state (ULS or ultimate strength) tended to fluctuate greatly depending on the variation of the stiffener size.
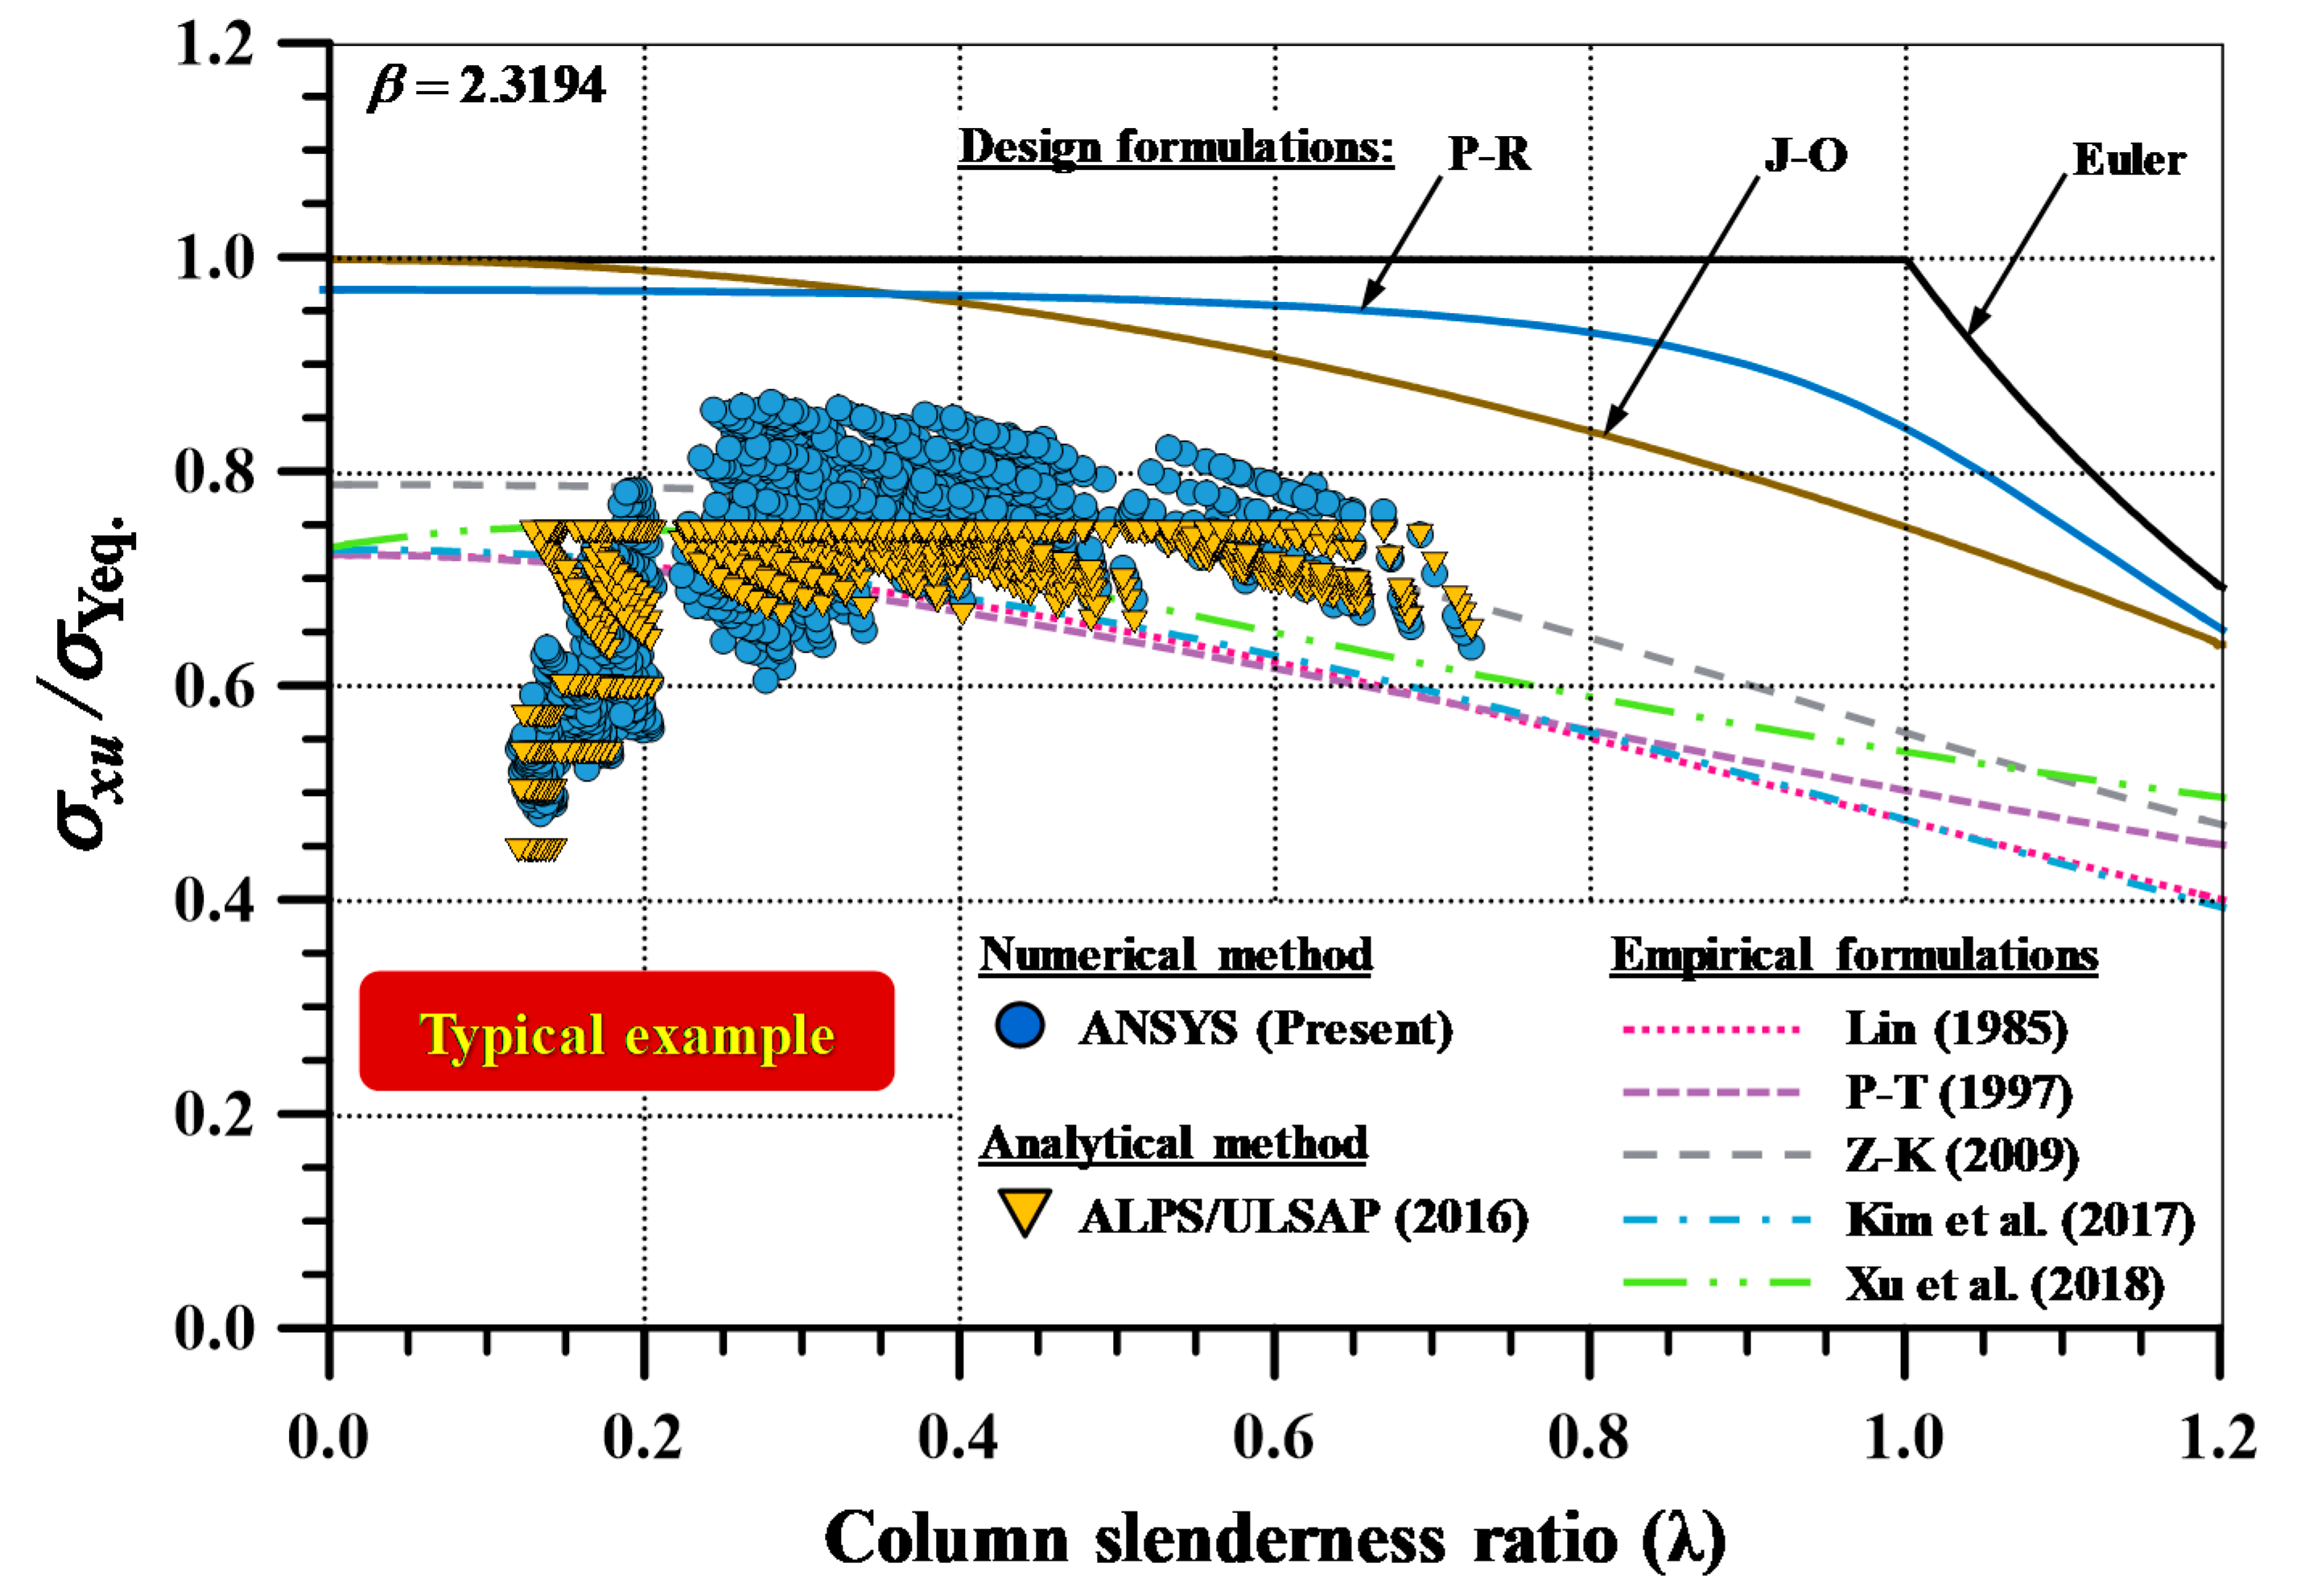
- Two parameters, i.e., column slenderness ratio () and plate slenderness ratio (), were considered as the main parameters of the existing empirical formulations. As indicated by Kim et al. [21,24], single line-shaped existing empirical formulations may not be able to implement the fluctuation behaviour of ULS. This means that the additional parameters should be considered in predicting the accurate ULS in the region of fluctuation.
- The applicability of the refined empirical formulation proposed by Kim et al. [6] was tested by statistical analysis. It was confirmed that proposed empirical formulation can be applied to flat-type stiffened panel with 14 modified coefficients.
5.2. Limitations
- The empirical formulation proposed by this study was based on the ANSYS numerical simulation results with assumed scenarios in Table 2 and boundary conditions in Table 3b. It is well recognised that data processing depends on the input data. This means that other types of input data, e.g., ULS values obtained by an experimental or analytical method, would provide slightly different final outcomes. Nevertheless, the numerical simulation results assumed by a simply supported boundary condition with average level initial deflection may help designers in the robust design of ships and offshore structures by maintaining the additional structural safety margin.
- This study only considers the prediction of ULS of steel stiffened panel, i.e., a ship’s deck or upper side shell stiffened panel under longitudinal compression. Other types of applied loadings, such as biaxial compression and lateral pressure, should also be taken into consideration in future.
- With regard to initial imperfection, initial deflection of plate and initial distortion of stiffener are only considered in this study, while welding-induced residual stress was not considered.
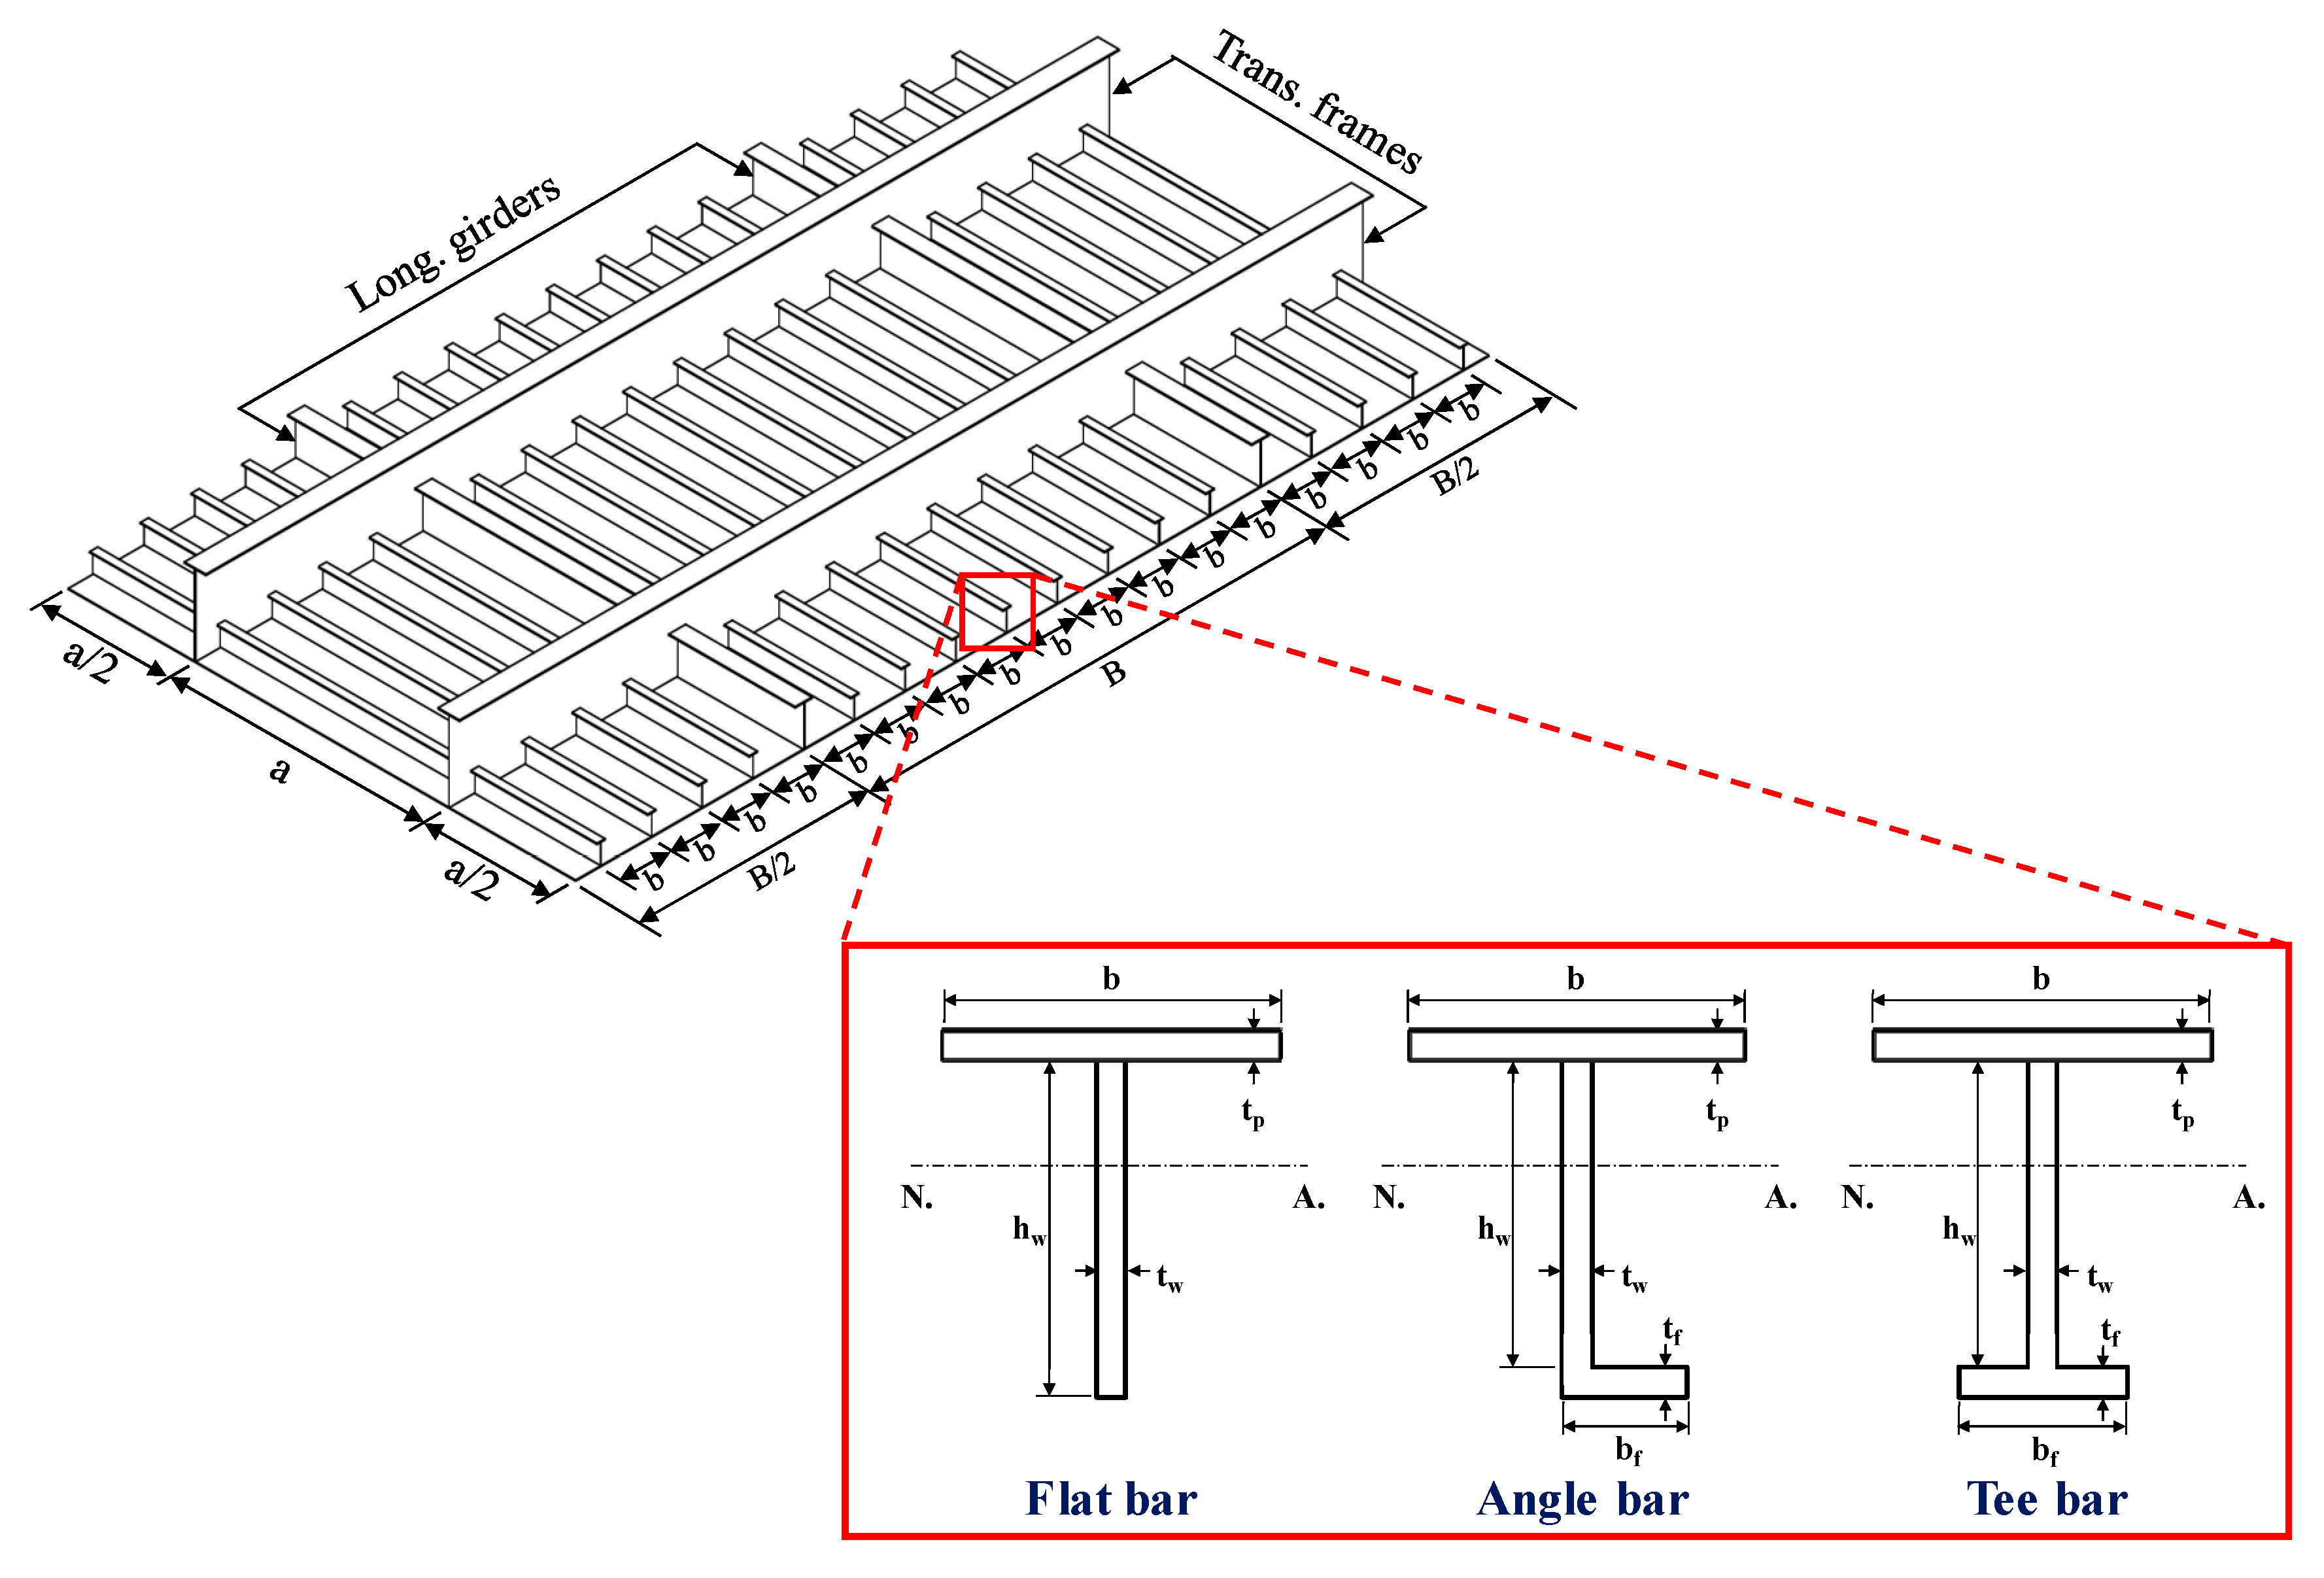
- In addition, other types of stiffener (angle-bar type) should also be studied to develop the empirical formulation.
Author Contributions
Funding
Acknowledgments
Conflicts of Interest
Appendix A. Initial Imperfections
- Buckling mode initial deflection of plate:= for plate;
- Column type distortion of stiffener:= for stiffener (Column-type);
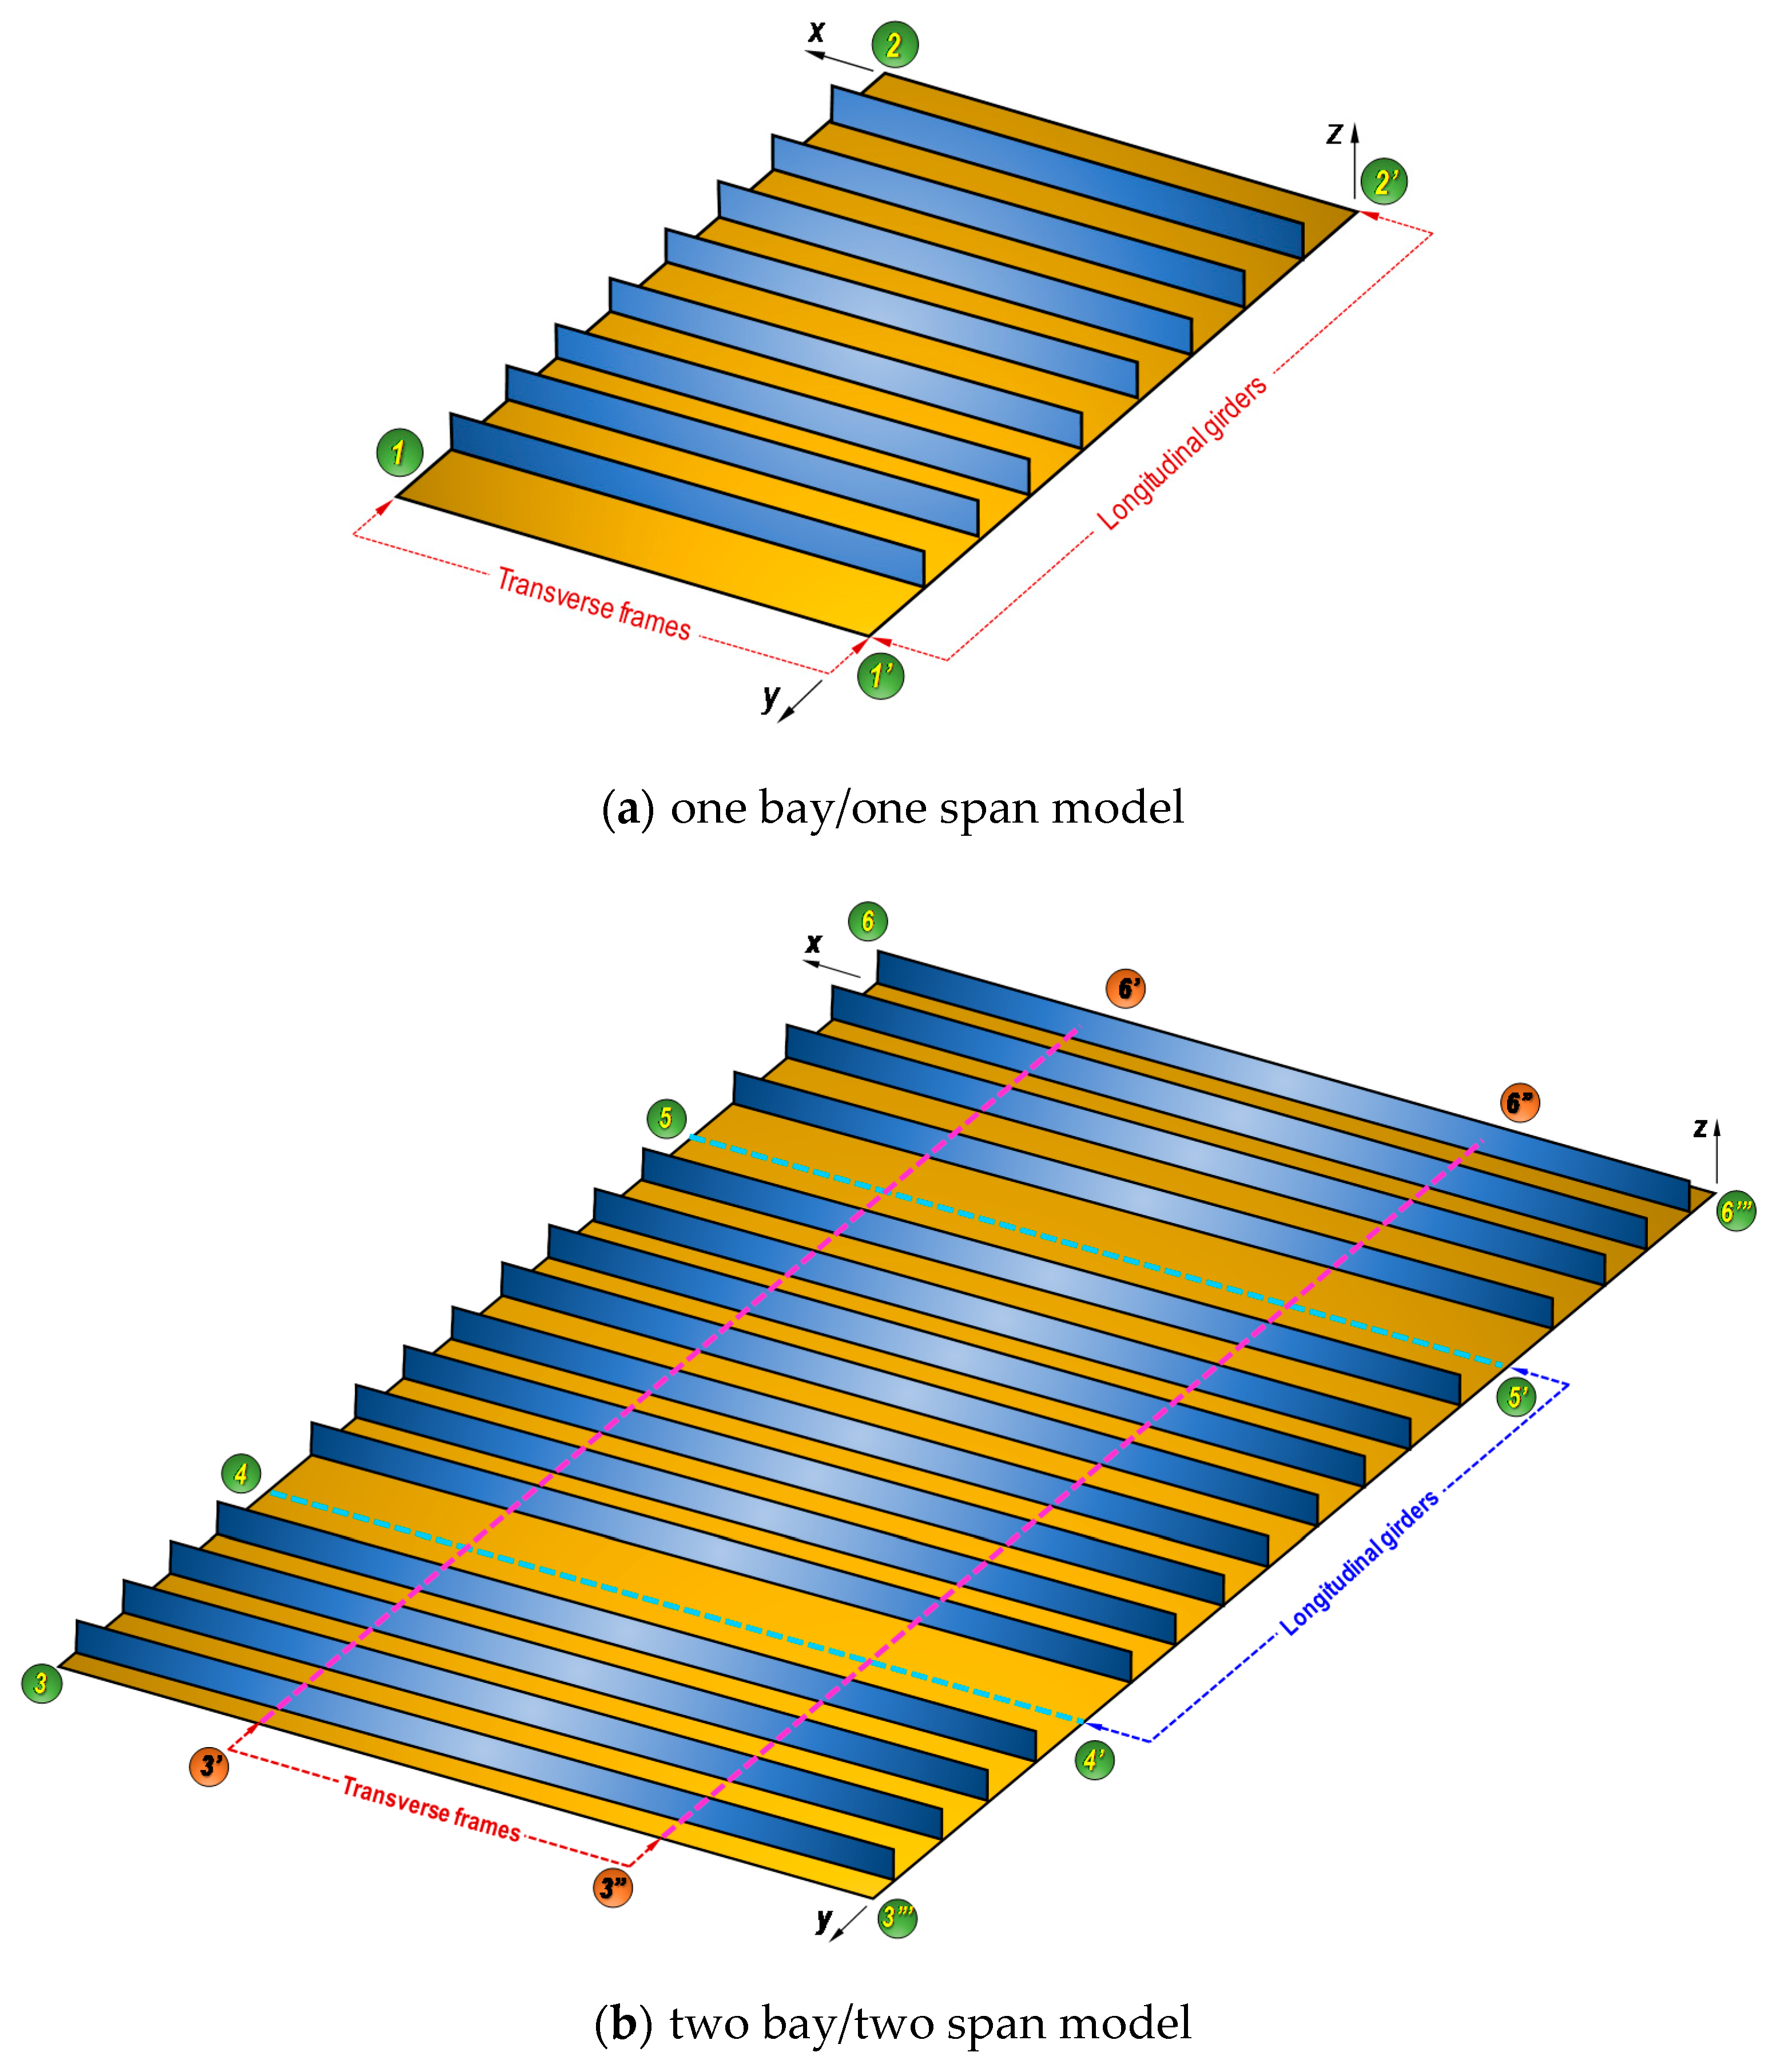
- Sideways initial distortion of stiffener:= for stiffener (Sideways).where, Ao, Bo, and Co = coefficients of the initial distortion (, 0.0015a, and 0.0015 respectively), m = buckling mode of the plate which provides minimum integer satisfying , a = plate length, b = plate breadth, B = breadth of stiffened panel (1 bay—1 span), hw = web height.
Appendix B. Comparison of ULS Results with Existing Methods


Appendix C. ALPS/ULSAP Program

References
- Park, D.K.; Paik, J.K.; Kim, B.J.; Seo, J.K.; Li, C.G.; Kim, D.K. Ultimate strength performance of Northern Sea going non-ice class commercial ships. Struct. Eng. Mech. 2014, 52, 613–632. [Google Scholar] [CrossRef]
- Park, D.K.; Kim, D.K.; Park, C.H.; Park, D.H.; Jang, B.S.; Kim, B.J.; Paik, J.K. On the crashworthiness of steel-plated structures in an arctic environment: An experimental and numerical study. J. Offshore Mech. Arct. Eng. 2015, 137, 051501. [Google Scholar] [CrossRef]
- Park, D.K.; Kim, D.K.; Seo, J.K.; Kim, B.J.; Ha, Y.C.; Paik, J.K. Operability of non-ice class aged ships in the Arctic Ocean—Part II: Accidental limit state approach. Ocean Eng. 2015, 102, 206–215. [Google Scholar] [CrossRef]
- Topa, A.; Kim, D.K.; Kim, Y.T. 3D Numerical simulation of seamless pipe piercing process by fluid-structure interaction method. MATEC Web Conf. 2018, 203, 06016. [Google Scholar] [CrossRef]
- Paik, J.K. Advanced Structural Safety Studies with Extreme Conditions and Accidents; Springer: Singapore, 2020. [Google Scholar] [CrossRef]
- Kim, D.K.; Lim, H.L.; Yu, S.Y. Ultimate strength prediction of T-bar stiffened panel under longitudinal compression by data processing: A refined empirical formulation. Ocean Eng. 2019, 192, 106522. [Google Scholar] [CrossRef]
- ISSC. Ultimate Strength (Committee III.1). In Proceedings of the 18th International Ship and Offshore Structures Congress (ISSC 2012), Rostock, Germany, 9–13 September 2012. [Google Scholar]
- Paik, J.K.; Kim, D.K.; Park, D.H.; Kim, H.B.; Mansour, A.E.; Caldwell, J.B. Modified Paik-Mansour formula for ultimate strength calculations of ship hulls. Ships Offshore Struct. 2013, 8, 245–260. [Google Scholar] [CrossRef]
- Paik, J.K.; Kim, D.K.; Park, D.H.; Kim, H.B.; Kim, M.S. A new method for assessing the safety of ships damaged by grounding. Int. J. Marit. Eng. 2012, 154, T2012-1. [Google Scholar]
- Kim, D.K.; Pedersen, P.T.; Paik, J.K.; Kim, H.B.; Zhang, X.M.; Kim, M.S. Safety guidelines of ultimate hull girder strength for grounded container ships. Saf. Sci. 2013, 59, 46–54. [Google Scholar] [CrossRef]
- Kim, D.K.; Kim, H.B.; Mohd, M.H.; Paik, J.K. Comparison of residual strength—Grounding damage index diagrams for tankers produced by the ALPS/HULL ISFEM and design formula method. Int. J. Nav. Archit. Ocean Eng. 2013, 5, 47–61. [Google Scholar] [CrossRef]
- Kim, D.K.; Kim, B.J.; Seo, J.K.; Kim, H.B.; Zhang, X.M.; Paik, J.K. Time-dependent corrosion damage on the development of residual strength—Grounding damage index diagram. Ocean Eng. 2014, 76, 163–171. [Google Scholar] [CrossRef]
- Zhang, S.; Pedersen, P.T.; Villavicencio, R. Probability and Mechanics of Ship Collision and Grounding; Elsevier Inc.: Oxford, UK, 2019. [Google Scholar] [CrossRef]
- Kim, D.K.; Kim, H.B.; Park, D.H.; Mohd, M.H.; Paik, J.K. A practical diagram to determine the residual longitudinal strength of grounded ship in Northern Sea Route. Ships Offshore Struct. 2020, 15, 683–700. [Google Scholar] [CrossRef]
- Paik, J.K.; Kim, B.J.; Seo, J.K. Methods for ultimate limit state assessment of ships and ship-shaped offshore structures: Part I Unstiffened plates. Ocean Eng. 2008, 35, 261–270. [Google Scholar] [CrossRef]
- Paik, J.K. Ultimate Limit State Analysis and Design of Plated Structures, 2nd ed.; John Wiley & Sons: Chichester, UK, 2018. [Google Scholar]
- Kim, D.K.; Poh, B.Y.; Lee, J.R.; Paik, J.K. Ultimate strength of initially deflected plate under longitudinal compression: Part I = An advanced empirical formulation. Struct. Eng. Mech. 2018, 68, 247–259. [Google Scholar]
- Tanaka, Y.; Endo, H. Ultimate strength of stiffened plates with their stiffeners locally buckled in compression. J. Soc. Nav. Archit. Jpn. 1988, 164, 456–467. [Google Scholar] [CrossRef]
- Tanaka, S.; Yanagihara, D.; Yasuoka, A.; Harada, M.; Okazawa, S.; Fujikubo, M.; Yao, T. Evaluation of ultimate strength of stiffened panels under longitudinal thrust. Mar. Struct. 2014, 36, 21–50. [Google Scholar] [CrossRef]
- Liew, A.; Gardner, L. Ultimate capacity of structural steel cross-sections under compression, bending and combined loading. Structures 2015, 1, 2–11. [Google Scholar] [CrossRef]
- Kim, D.K.; Lim, H.L.; Kim, M.S.; Hwang, O.J.; Park, K.S. An empirical formulation for predicting the ultimate strength of stiffened panels subjected to longitudinal compression. Ocean Eng. 2017, 140, 270–280. [Google Scholar] [CrossRef]
- Ozdemir, M.; Ergin, A.; Yanagihara, D.; Tanaka, S.; Yao, T. A new method to estimate ultimate strength of stiffened panels under longitudinal thrust based on analytical formulas. Mar. Struct. 2018, 59, 510–535. [Google Scholar] [CrossRef]
- Zhang, S.M. A review and study on ultimate strength of steel plates and stiffened panels in axial compression. Ships Offshore Struct. 2016, 11, 81–91. [Google Scholar] [CrossRef]
- Kim, D.K.; Lim, H.L.; Yu, S.Y. A technical review on ultimate strength prediction of stiffened panels in axial compression. Ocean Eng. 2018, 170, 392–406. [Google Scholar] [CrossRef]
- Lin, Y.T. Structural Longitudinal Strength Modelling. Ph.D. Dissertation, University of Glasgow, Glasgow, UK, 1985. [Google Scholar]
- Paik, J.K.; Thayamballi, A.K. An Empirical Formulation for Predicting the Ultimate Compressive Strength of Stiffened Panels. In Proceedings of the 7th International Offshore and Polar Engineering Conference (ISOPE 1997), Honolulu, HI, USA, 25–30 May 1997. ISOPE-I-97-444. [Google Scholar]
- Paik, J.K. Empirical formulations for predicting the ultimate compressive strength of welded aluminum stiffened panels. Thin Walled Struct. 2007, 45, 171–184. [Google Scholar] [CrossRef]
- Zhang, S.M.; Khan, I. Buckling and ultimate capability of plates and stiffened panels in axial compression. Mar. Struct. 2009, 22, 791–808. [Google Scholar] [CrossRef]
- Xu, M.C.; Song, Z.J.; Zhang, B.W.; Pan, J. Empirical formula for predicting ultimate strength of stiffened panel of ship structure under combined longitudinal compression and lateral loads. Ocean Eng. 2018, 162, 161–175. [Google Scholar] [CrossRef]
- Khedmati, M.R.; Zareei, M.R.; Rigo, P. Empirical formulations for estimation of ultimate strength of continuous stiffened aluminium plates under combined in-plane compression and lateral pressure. Thin Walled Struct. 2010, 48, 274–289. [Google Scholar] [CrossRef]
- Mei, H.; Wang, D. An Empirical Formula for Predicting Elastic Ultimate Buckling Strength of Flat-Bar Stiffened Panels with Initial Imperfections. In Proceedings of the 38th International Conference on Ocean, Offshore and Arctic Engineering (OMAE 2019), Glasgow, UK, 9–14 June 2019. [Google Scholar]
- IACS. Common Structural Rules for Bulk Carriers and Oil Tankers; International Association of Classification Societies: London, UK, 2017; Available online: www.iacs.org.uk/media/3922/csr-h-01-jan-2017.pdf (accessed on 1 January 2019).
- IACS. Common Structural Rules for Double Hull Oil Tankers; International Association of Classification Societies: London, UK, 2006. [Google Scholar]
- IACS. Common Structural Rules for Bulk Carriers; International Association of Classification Societies: London, UK, 2006. [Google Scholar]
- Jiameng, W.; Gang, W.; Shijian, C. Ramification Study on IACS Harmonized Common Structural Rules: Impact on Structural Design and Scantlings; SNAME Maritime Convention (SMC): Houston, TX, USA, 20–25 October 2014. [Google Scholar]
- Anyfantis, K.N. Ultimate strength of stiffened panels subjected to non-uniform thrust. Int. J. Nav. Archit. Ocean Eng. 2020, 12, 325–342. [Google Scholar] [CrossRef]
- Silva, H.M.; Wojewoda, J. Determination of the product of inertia of stiffened plates based on Finite Element Method results. Eng. Struct. 2020, 207, 110201. [Google Scholar] [CrossRef]
- Shi, G.J.; Gao, D.W. Transverse ultimate capacity of U-type stiffened panels for hatch covers used in ship cargo holds. Ships Offshore Struct. in press. [CrossRef]
- Kong, X.; Yang, Y.; Gan, J.; Yuan, Y.; Ao, L.; Wu, W. Experimental and numerical investigation on the detailed buckling process of similar stiffened panels subjected to in-plane compressive load. Thin Walled Struct. 2020, 148, 106620. [Google Scholar] [CrossRef]
- Wang, Q.; Wang, D. Scaling characteristics of hull girder’s ultimate strength and failure behaviors: An empirically modified scaling criterion. Ocean Eng. 2020, 212, 107595. [Google Scholar] [CrossRef]
- Song, Z.J.; Xu, M.C.; Moan, T.; Pan, J. Dimensional and similitude analysis of stiffened panels under longitudinal compression considering buckling behaviours. Ocean Eng. 2019, 187, 106188. [Google Scholar] [CrossRef]
- Liu, B.; Garbatov, Y.; Wu, W.; Soares, C.G. Strength assessment of aluminium and steel stiffened panels with openings on longitudinal girders. Ocean Eng. 2020, 200, 107047. [Google Scholar]
- Jagite, G.; Bigot, F.; Derbanne, Q.; Malenica, Š.; Le Sourne, H.; Cartraud, P. A parametric study on the dynamic ultimate strength of a stiffened panel subjected to wave- and whipping-induced stresses. Ships Offshore Struct. in press. [CrossRef]
- Ahmadi, F.; Ranji, A.R.; Nowruzi, H. Ultimate strength prediction of corroded plates with center-longitudinal crack using FEM and ANN. Ocean Eng. 2020, 206, 107281. [Google Scholar] [CrossRef]
- Wong, E.W.C.; Kim, D.K. A simplified method to predict fatigue damage of TTR subjected to short-term VIV using Artificial Neural Network. Adv. Eng. Softw. 2018, 126, 100–109. [Google Scholar] [CrossRef]
- Kim, D.K.; Incecik, A.; Choi, H.S.; Wong, E.W.C.; Yu, S.Y.; Park, K.S. A simplified method to predict fatigue damage of offshore riser subjected to vortex-induced vibration by adopting current index concept. Ocean Eng. 2018, 157, 401–411. [Google Scholar] [CrossRef]
- Park, D.K.; Kim, D.K.; Seo, J.K.; Kim, B.J.; Ha, Y.C.; Paik, J.K. Operability of non-ice class aged ships in the Arctic Ocean-Part I: Ultimate limit state approach. Ocean Eng. 2015, 102, 197–205. [Google Scholar] [CrossRef]
- Choi, H.S.; Seo, D.W.; Kim, K.H.; Shin, G.; Choung, J.M.; Kim, K.S.; Wong, E.W.C.; Topa, A.; Kim, D.K. Applicability of high manganese steel to FLNG storage tank considering collision event. J. Mar. Sci. Eng. under review.
- Choi, H.S.; Shin, G.; Choung, J.M.; Kim, K.H.; Seo, D.W.; Kim, K.S.; Wong, E.W.C.; Kim, D.K. Numerical Simulation of High Manganese Steel FLNG Storage Tank Damaged by Collision. In Proceedings of the 3rd International Conference on Ocean, Mechanical and Aerospace for Scientist and Engineer (OMAse 2016), Kuala Terengganu, Malaysia, 7–8 November 2016. [Google Scholar]
- Paik, J.K.; Kim, D.K.; Lee, H.; Shim, Y.L. A method for analyzing elastic large deflection behavior of perfect and imperfect plates with partially rotation-restrained edges. J. Offshore Mech. Arct. Eng. 2012, 134, 021603. [Google Scholar] [CrossRef]
- Ahmer Wadee, M.; Farsi, M. Imperfection sensitivity and geometric effects in stiffened plates susceptible to cellular buckling. Structures 2015, 3, 172–186. [Google Scholar] [CrossRef]
- Khan, I.; Zhang, S. Effects of welding-induced residual stress on ultimate strength of plates and stiffened panels. Ships Offshore Struct. 2011, 6, 297–309. [Google Scholar] [CrossRef]
- De Queiroz, J.P.T.; Cunha, M.L.; Pavlovic, A.; Rocha, L.A.O.; dos Santos, E.D.; Troina, G.D.S.; Isoldi, L.A. Geometric evaluation of stiffened steel plates subjected to transverse loading for naval and offshore applications. J. Mar. Sci. Eng. 2019, 7, 7. [Google Scholar] [CrossRef]
- ISSC. Ultimate Strength (Committee III.1). In Proceedings of the 17th International Ship and Offshore Structures Congress (ISSC 2009), Seoul, Korea, 16–21 August 2009. [Google Scholar]
- ANSYS. User’s Manual Version 13.0; ANSYS Inc.: Canonsburg, PA, USA, 2014. [Google Scholar]
- ALPS/ULSAP. A Computer Program for Ultimate Limit State Assessment of Stiffened Panels; Advanced Technology Center, DRS C3 Systems: Parsippany, NJ, USA, 2016; Available online: www.maestromarine.com (accessed on 1 January 2019).
- Li, C.; Dong, S.; Wang, T.; Xu, W.; Zhou, X. Numerical investigation on ultimate compressive strength of welded stiffened plates built by steel grades of S235–S390. Appl. Sci. 2019, 9, 2088. [Google Scholar] [CrossRef]
- ISSC. Ultimate Hull Girder Strength (Special Committee VI.2). In Proceedings of the 14th International Ship and Offshore Structures Congress (ISSC 2015), Nagasaki, Japan, 2–6 October 2000. [Google Scholar]
- ISSC. Ultimate Strength (Committee III.1). In Proceedings of the 19th International Ship and Offshore Structures Congress (ISSC 2015), Cascais, Portugal, 7–10 September 2015. [Google Scholar]
- Paik, J.K.; Thayamballi, A.K. Ultimate Limit State Design of Steel-Plated Structures; John Wiley & Sons: Chichester, UK, 2003. [Google Scholar]
- Kim, D.K.; Park, D.K.; Kim, J.H.; Kim, S.J.; Kim, B.J.; Seo, J.K.; Paik, J.K. Effect of corrosion on the ultimate strength of double hull oil tankers—Part I: Stiffened panels. Struct. Eng. Mech. 2012, 42, 507–530. [Google Scholar] [CrossRef]
- Hughes, O.F.; Paik, J.K. Ship Structural Analysis and Design; The Society of Naval Architects and Marine Engineers: Jersey City, NJ, USA, 2010. [Google Scholar]
- MAESTRO. FEA for the Naval Architect. Available online: https://www.maestromarine.com (accessed on 1 January 2019).
- Paik, J.K. Ultimate Strength of Plates and Stiffened Panels; The LRET Research Collegium, University of Southampton: Southampton, UK, 11 July–2 September 2011; Available online: https://cdn.southampton.ac.uk/assets/imported/transforms/content-block/UsefulDownloads_Download/FC5BD932BC234B728195E4FE96F0D831/alecture14%20paik2.pdf (accessed on 1 January 2019).


| Coefficient | Lin [26] | P–T* [26] |
|---|---|---|
| C1 | 0.960 | 0.995 |
| C2 | 0.765 | 0.936 |
| C3 | 0.176 | 0.170 |
| C4 | 0.131 | 0.188 |
| C5 | 1.046 | −0.067 |
| (a) | |||||
| Material Properties | |||||
| Yield Strength | Elastic Modulus | Poisson’s Ratio | |||
| Plate and Stiffener | 315 MPa | 205.8 GPa | 0.3 | ||
| Geometric Properties (Unit = mm) | |||||
| Plate | Length | 4150 | |||
| breadth | 830 | ||||
| Thickness | 9.5, 11, 14, 16, 21.5, 32.5, and 44.5 | ||||
| Stiffener | Web height | 200, 284, 300, 360, 425, 460, 500, 700, 800, and 1,000 | |||
| Web thickness | 10, 11.5, 12.5, 13.5, 20, and 28 | ||||
| Summary | |||||
| Plate slenderness ratio | 3.4181, 2.9620, 2.3194, 2.0295, 1.5103, 0.9991, and 0.7297 | ||||
| Column slenderness ratio (PSC * model) | 420 cases | ||||
| (b) | |||||
| Geometrical Variable | No. of Scenarios | Selected Scenarios | |||
| Plate length (a) | 1 | 4150 mm | |||
| Plate width (b) | 1 | 830 mm | |||
| Plate thickness (tp) | 7 | 44.5, 32.5, 21.5, 16, 14, 11, 9.5 mm | |||
| Web height (hw) | 10 | 200, 284, 300, 360, 425, 460, 500, 700, 800, 1000 mm | |||
| Web thickness (tw) | 6 | 10, 11.5, 12.5, 13.5, 20, 28 mm | |||
 | |||||
| (a) One Bay/One Span Model Found in Figure 3a | |
| 1-1′ and 2-2′ |
|
| 1-2 and 1′-2′ |
|
| (b) Two Bay/Two Span Model Found in Figure 3b | |
| 3-3‴ and 6-6‴ |
|
| 3-6 and 3‴-6‴ |
|
| 3′-6′, 3″-6″, 4-4′, and 5-5′ |
|
| Terms | Coefficients | |
|---|---|---|
| T-Bar [6] | Flat-Bar (Present) | |
| C0 | −0.1449 | −1.5721 |
| C1 | 2.9787 | 5.6591 |
| C2 | −2.6098 | −3.7336 |
| C3 | −0.2418 | −0.6934 |
| C4 | 1.2374 × 10⁻³ | −1.8581 × 10⁻² |
| C5 | 1.3470 × 10⁻² | 1.7858 × 10⁻² |
| C6 | 0.8841 | 1.3546 |
| C7 | −0.3361 | −0.3482 |
| C8 | 1.5975 × 10⁻³ | −1.9443 × 10⁻³ |
| C9 | 2.7745 × 10⁻³ | 0.8850 × 10⁻³ |
| C10 | −7.5919 × 10⁻³ | 1.8299 × 10⁻² |
| C11 | 3.2442 × 10⁻⁵ | −1.2316 × 10⁻⁴ |
| C12 | 4.9670 × 10⁻⁵ | 1.4994 × 10⁻⁴ |
| C13 | 1.3267 × 10⁻² | −1.8752 × 10⁻⁴ |
| C14 | −5.4149 × 10⁻⁵ | −1.6306 × 10⁻⁵ |
| Existing Methods | Plate Slenderness Ratio (β) | ||||||||||||||||
|---|---|---|---|---|---|---|---|---|---|---|---|---|---|---|---|---|---|
| 0.7297 | 0.9991 | 1.5103 | 2.0295 | 2.3194 | 2.9520 | 3.4181 | ALL | ||||||||||
| Mean | COV | Mean | COV | Mean | COV | Mean | COV | Mean | COV | Mean | COV | Mean | COV | Mean | COV | ||
| Design Formulations | J-O | 1.2958 | 0.1634 | 1.3206 | 0.1453 | 1.3994 | 0.1084 | 1.5453 | 0.1151 | 1.6289 | 0.1267 | 1.7750 | 0.1462 | 1.8591 | 0.1577 | 1.5463 | 0.1932 |
| P-R | 1.3047 | 0.1777 | 1.3337 | 0.1618 | 1.4122 | 0.1179 | 1.5567 | 0.1136 | 1.6393 | 0.1224 | 1.7825 | 0.1398 | 1.8640 | 0.1511 | 1.5562 | 0.1924 | |
| Euler | 1.4282 | 0.2393 | 1.4344 | 0.2071 | 1.4955 | 0.1327 | 1.6413 | 0.1037 | 1.7277 | 0.1067 | 1.8818 | 0.1212 | 1.9684 | 0.1316 | 1.6539 | 0.1922 | |
| Empirical Formulations | Lin | 1.1532 | 0.1314 | 1.1473 | 0.1189 | 1.1349 | 0.1148 | 1.1436 | 0.1383 | 1.1392 | 0.1491 | 1.0939 | 0.1637 | 1.0456 | 0.1723 | 1.1225 | 0.1452 |
| P-T | 1.2112 | 0.1528 | 1.1933 | 0.1432 | 1.1587 | 0.1161 | 1.1508 | 0.1270 | 1.1415 | 0.1404 | 1.0909 | 0.1621 | 1.0409 | 0.1743 | 1.1410 | 0.1530 | |
| Z-K | 1.2987 | 0.1466 | 1.3149 | 0.1354 | 1.2455 | 0.1047 | 1.2691 | 0.1198 | 1.2899 | 0.1324 | 1.3159 | 0.1517 | 1.3240 | 0.1626 | 1.2938 | 0.1395 | |
| Kim | 1.1448 | 0.1465 | 1.0990 | 0.1353 | 1.0730 | 0.1080 | 1.1186 | 0.1336 | 1.1487 | 0.1493 | 1.1936 | 0.1717 | 1.2150 | 0.1840 | 1.1418 | 0.1562 | |
| Xu | 1.3531 | 0.1767 | 1.3212 | 0.1333 | 1.2891 | 0.1125 | 1.3440 | 0.1253 | 1.3871 | 0.1386 | 1.4839 | 0.1652 | 1.5668 | 0.1824 | 1.3922 | 0.1662 | |
| Present | 0.9857 | 0.0904 | 1.0363 | 0.0712 | 0.9909 | 0.0565 | 0.9886 | 0.0306 | 0.9958 | 0.0299 | 1.0064 | 0.0364 | 1.0128 | 0.0474 | 1.0024 | 0.0583 | |
| Analytical Solution | ALPS/ULSAP | 0.8704 | 0.3479 | 0.9012 | 0.3456 | 0.8965 | 0.3843 | 0.8527 | 0.3963 | 0.7940 | 0.4180 | 0.7342 | 0.4396 | 0.7331 | 0.4618 | 0.8260 | 0.4046 |
| Plate Slenderness Ratio (β) | R2 |
|---|---|
| 0.7297 | 0.9347 |
| 0.9991 | 0.9180 |
| 1.5103 | 0.8958 |
| 2.0295 | 0.9392 |
| 2.3194 | 0.9485 |
| 2.9620 | 0.9296 |
| 3.4181 | 0.8881 |
| Total | 0.9435 |
© 2020 by the authors. Licensee MDPI, Basel, Switzerland. This article is an open access article distributed under the terms and conditions of the Creative Commons Attribution (CC BY) license (http://creativecommons.org/licenses/by/4.0/).
Share and Cite
Kim, D.K.; Yu, S.Y.; Lim, H.L.; Cho, N.-K. Ultimate Compressive Strength of Stiffened Panel: An Empirical Formulation for Flat-Bar Type. J. Mar. Sci. Eng. 2020, 8, 605. https://doi.org/10.3390/jmse8080605
Kim DK, Yu SY, Lim HL, Cho N-K. Ultimate Compressive Strength of Stiffened Panel: An Empirical Formulation for Flat-Bar Type. Journal of Marine Science and Engineering. 2020; 8(8):605. https://doi.org/10.3390/jmse8080605
Chicago/Turabian StyleKim, Do Kyun, Su Young Yu, Hui Ling Lim, and Nak-Kyun Cho. 2020. "Ultimate Compressive Strength of Stiffened Panel: An Empirical Formulation for Flat-Bar Type" Journal of Marine Science and Engineering 8, no. 8: 605. https://doi.org/10.3390/jmse8080605
APA StyleKim, D. K., Yu, S. Y., Lim, H. L., & Cho, N.-K. (2020). Ultimate Compressive Strength of Stiffened Panel: An Empirical Formulation for Flat-Bar Type. Journal of Marine Science and Engineering, 8(8), 605. https://doi.org/10.3390/jmse8080605