Analysis of Wind-Induced Vibration of a Spoke-Wise Cable–Membrane Structure


Abstract
1. Introduction
2. Analytical Derivation
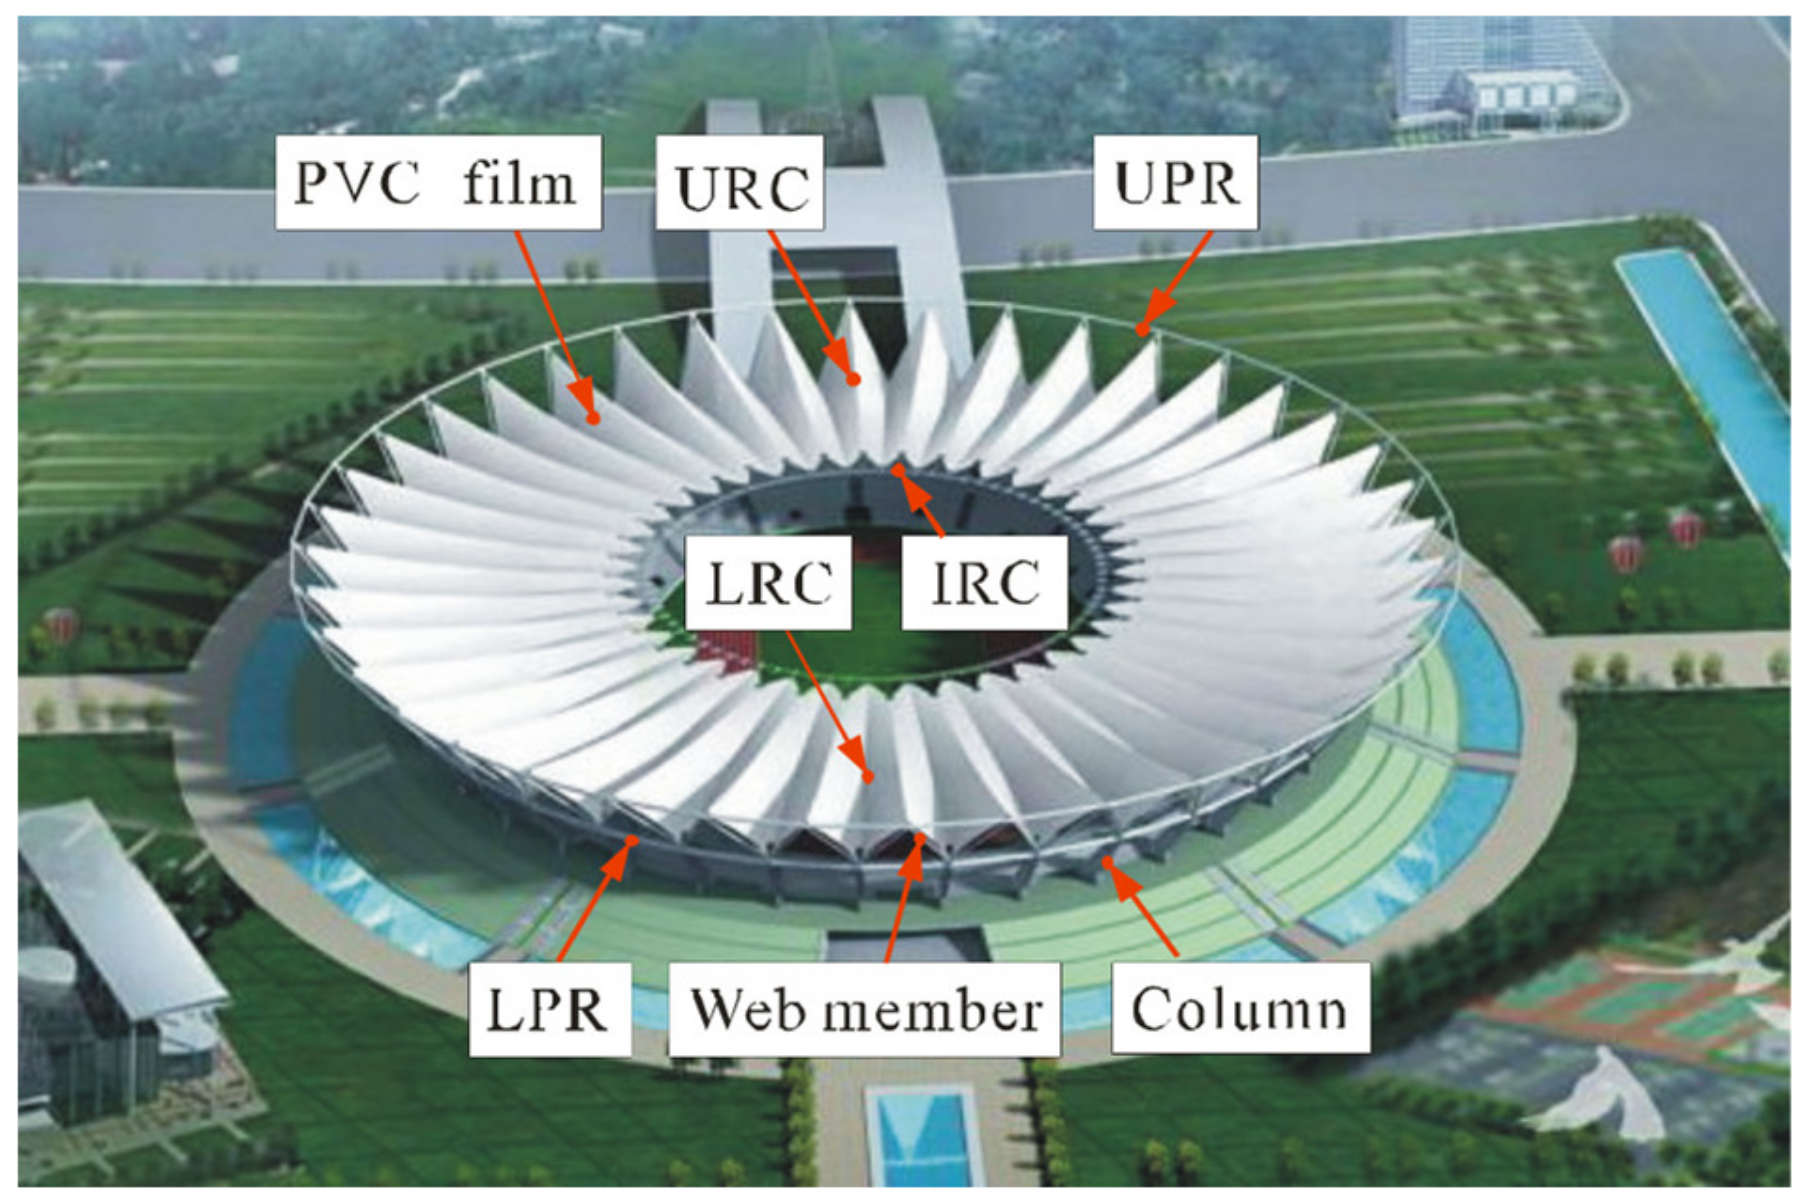
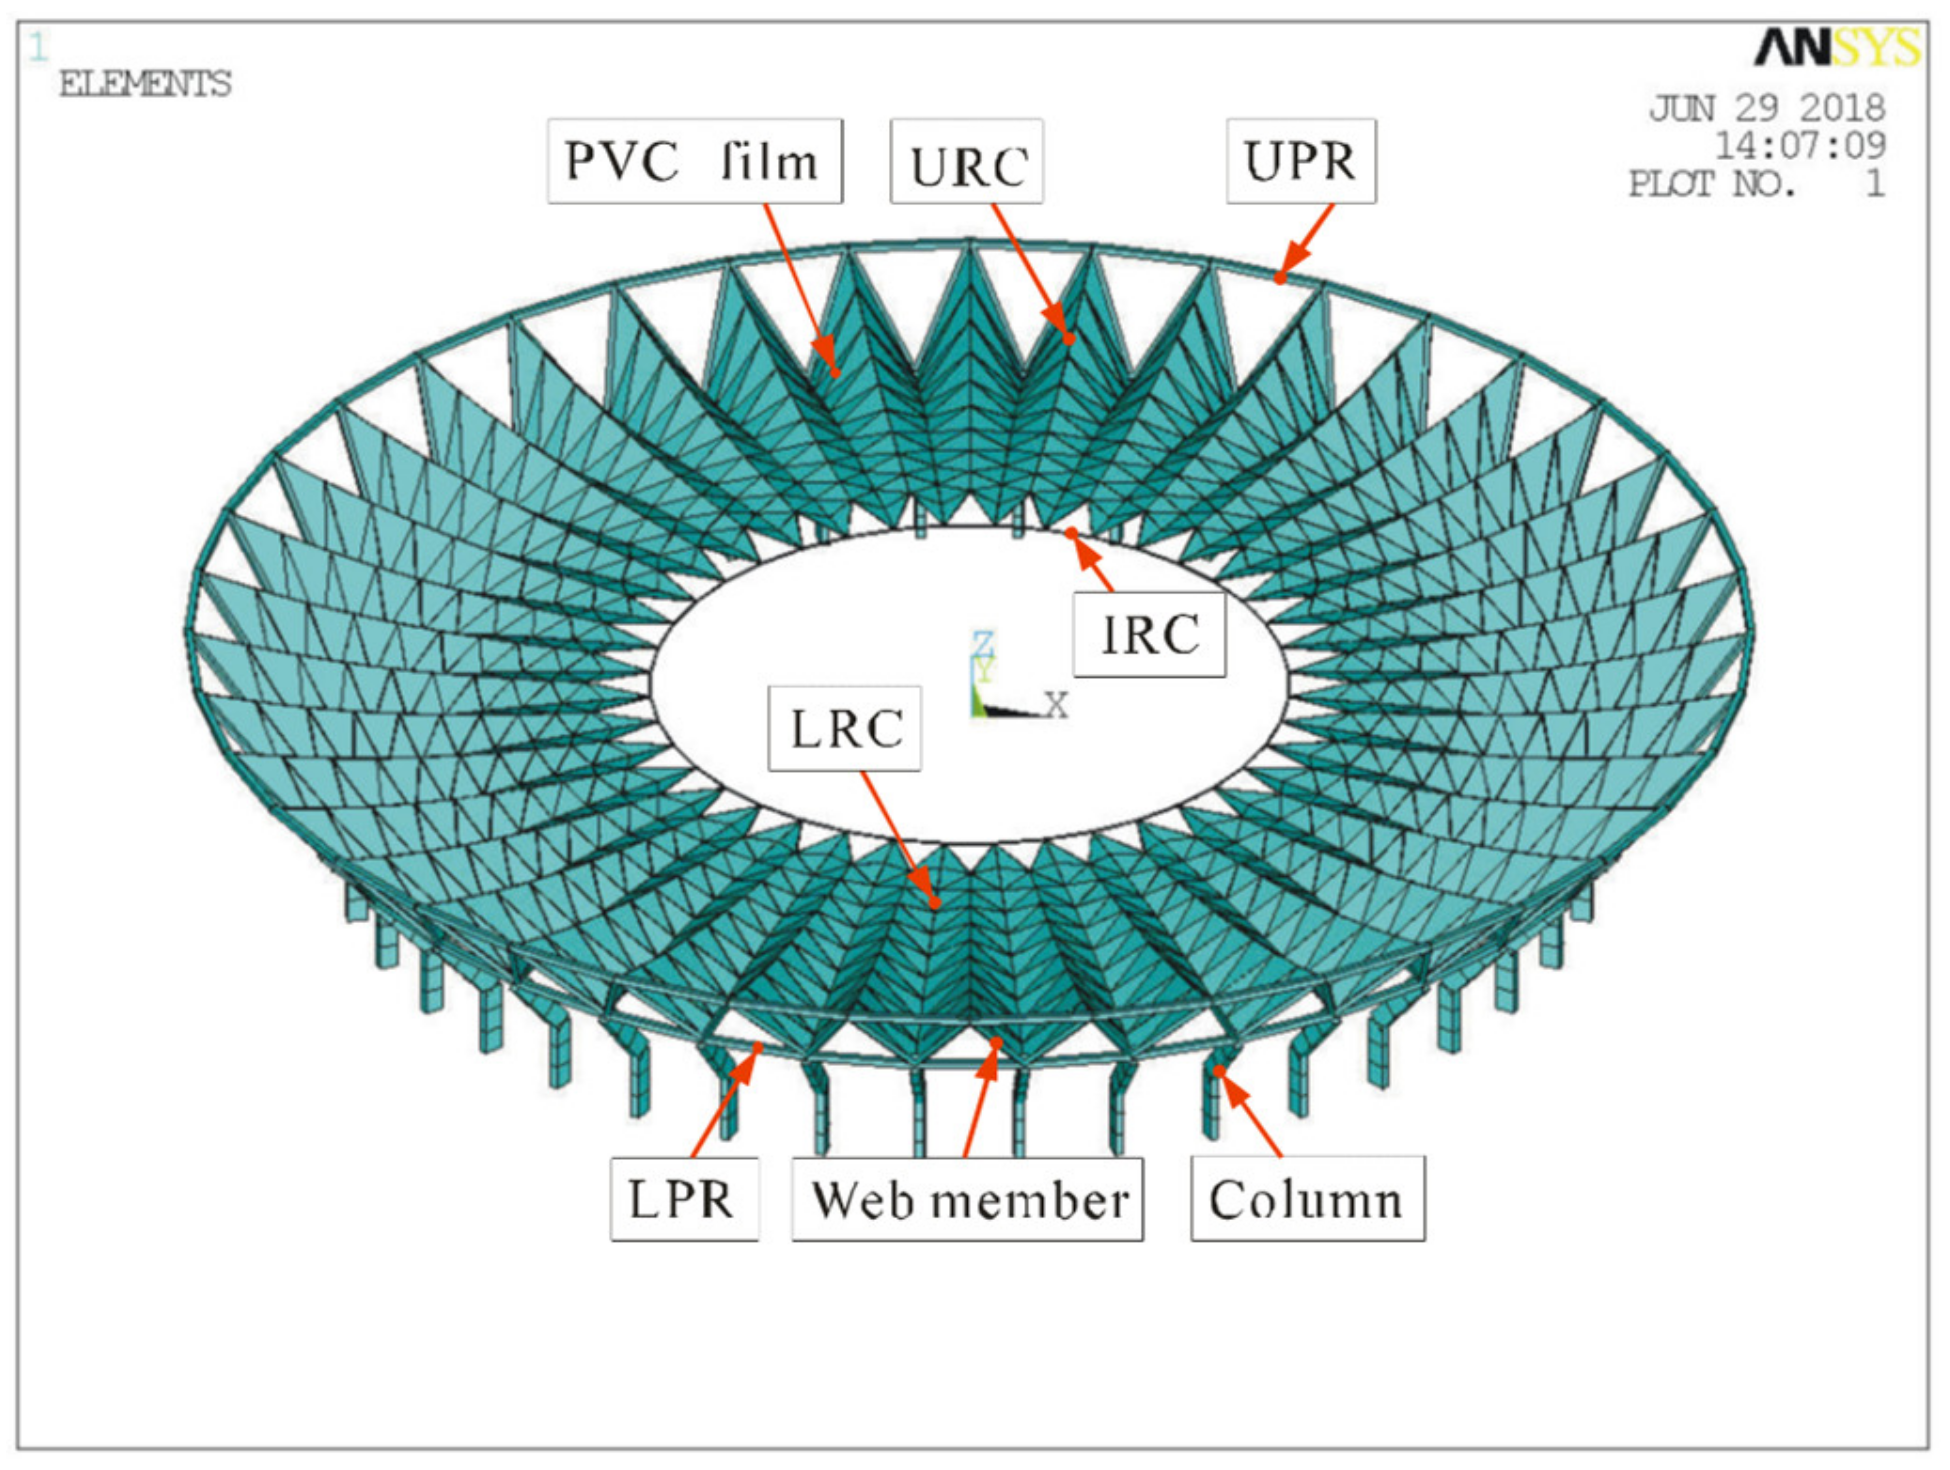
2.1. Profile of the Spoke-Wise Cable–Membrane Structure (SCMS)
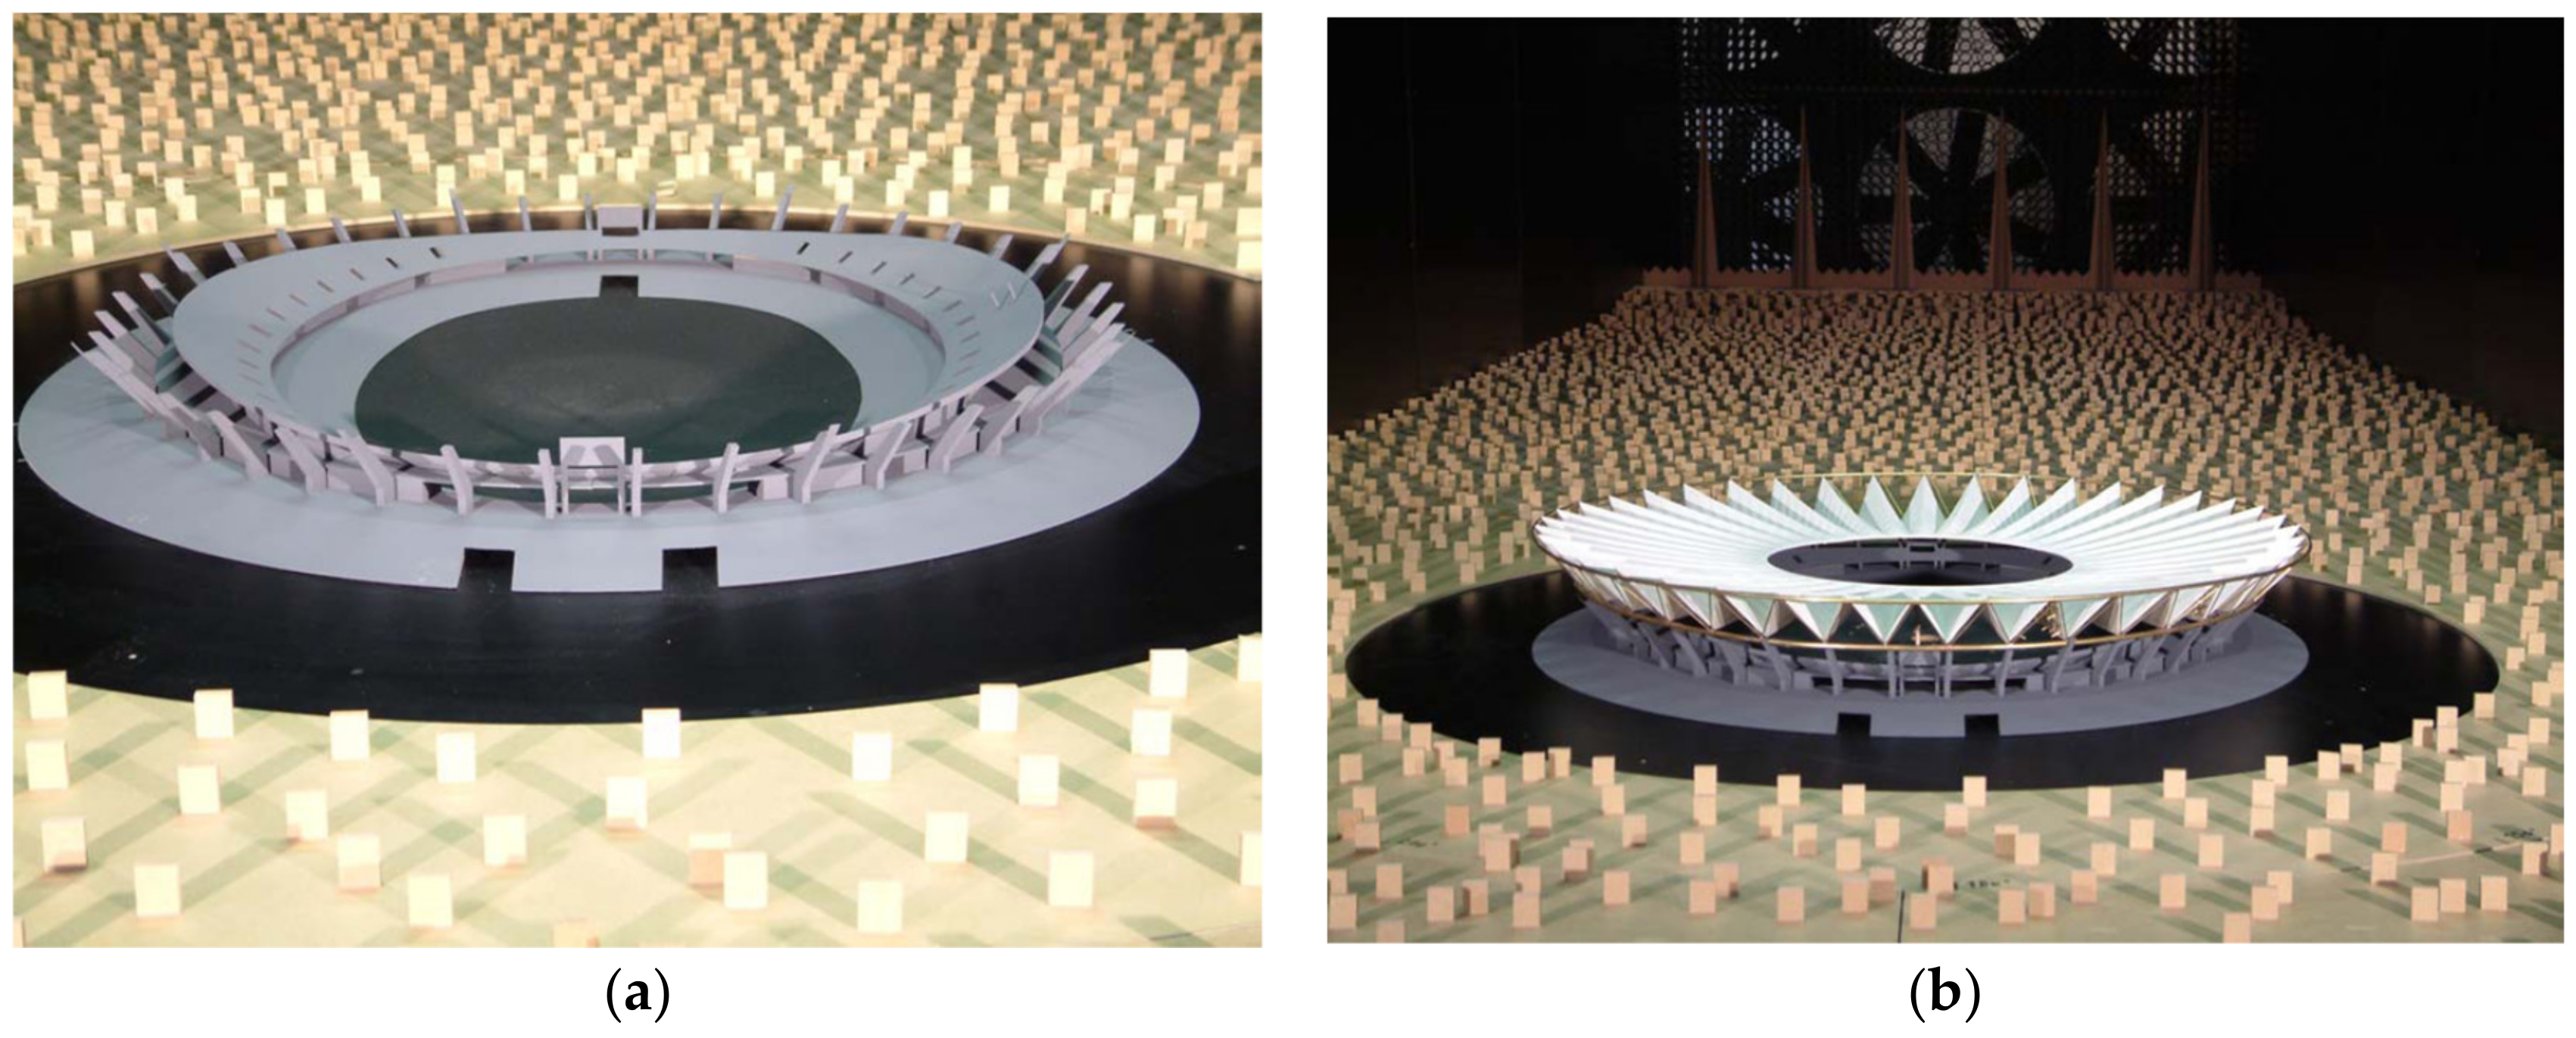
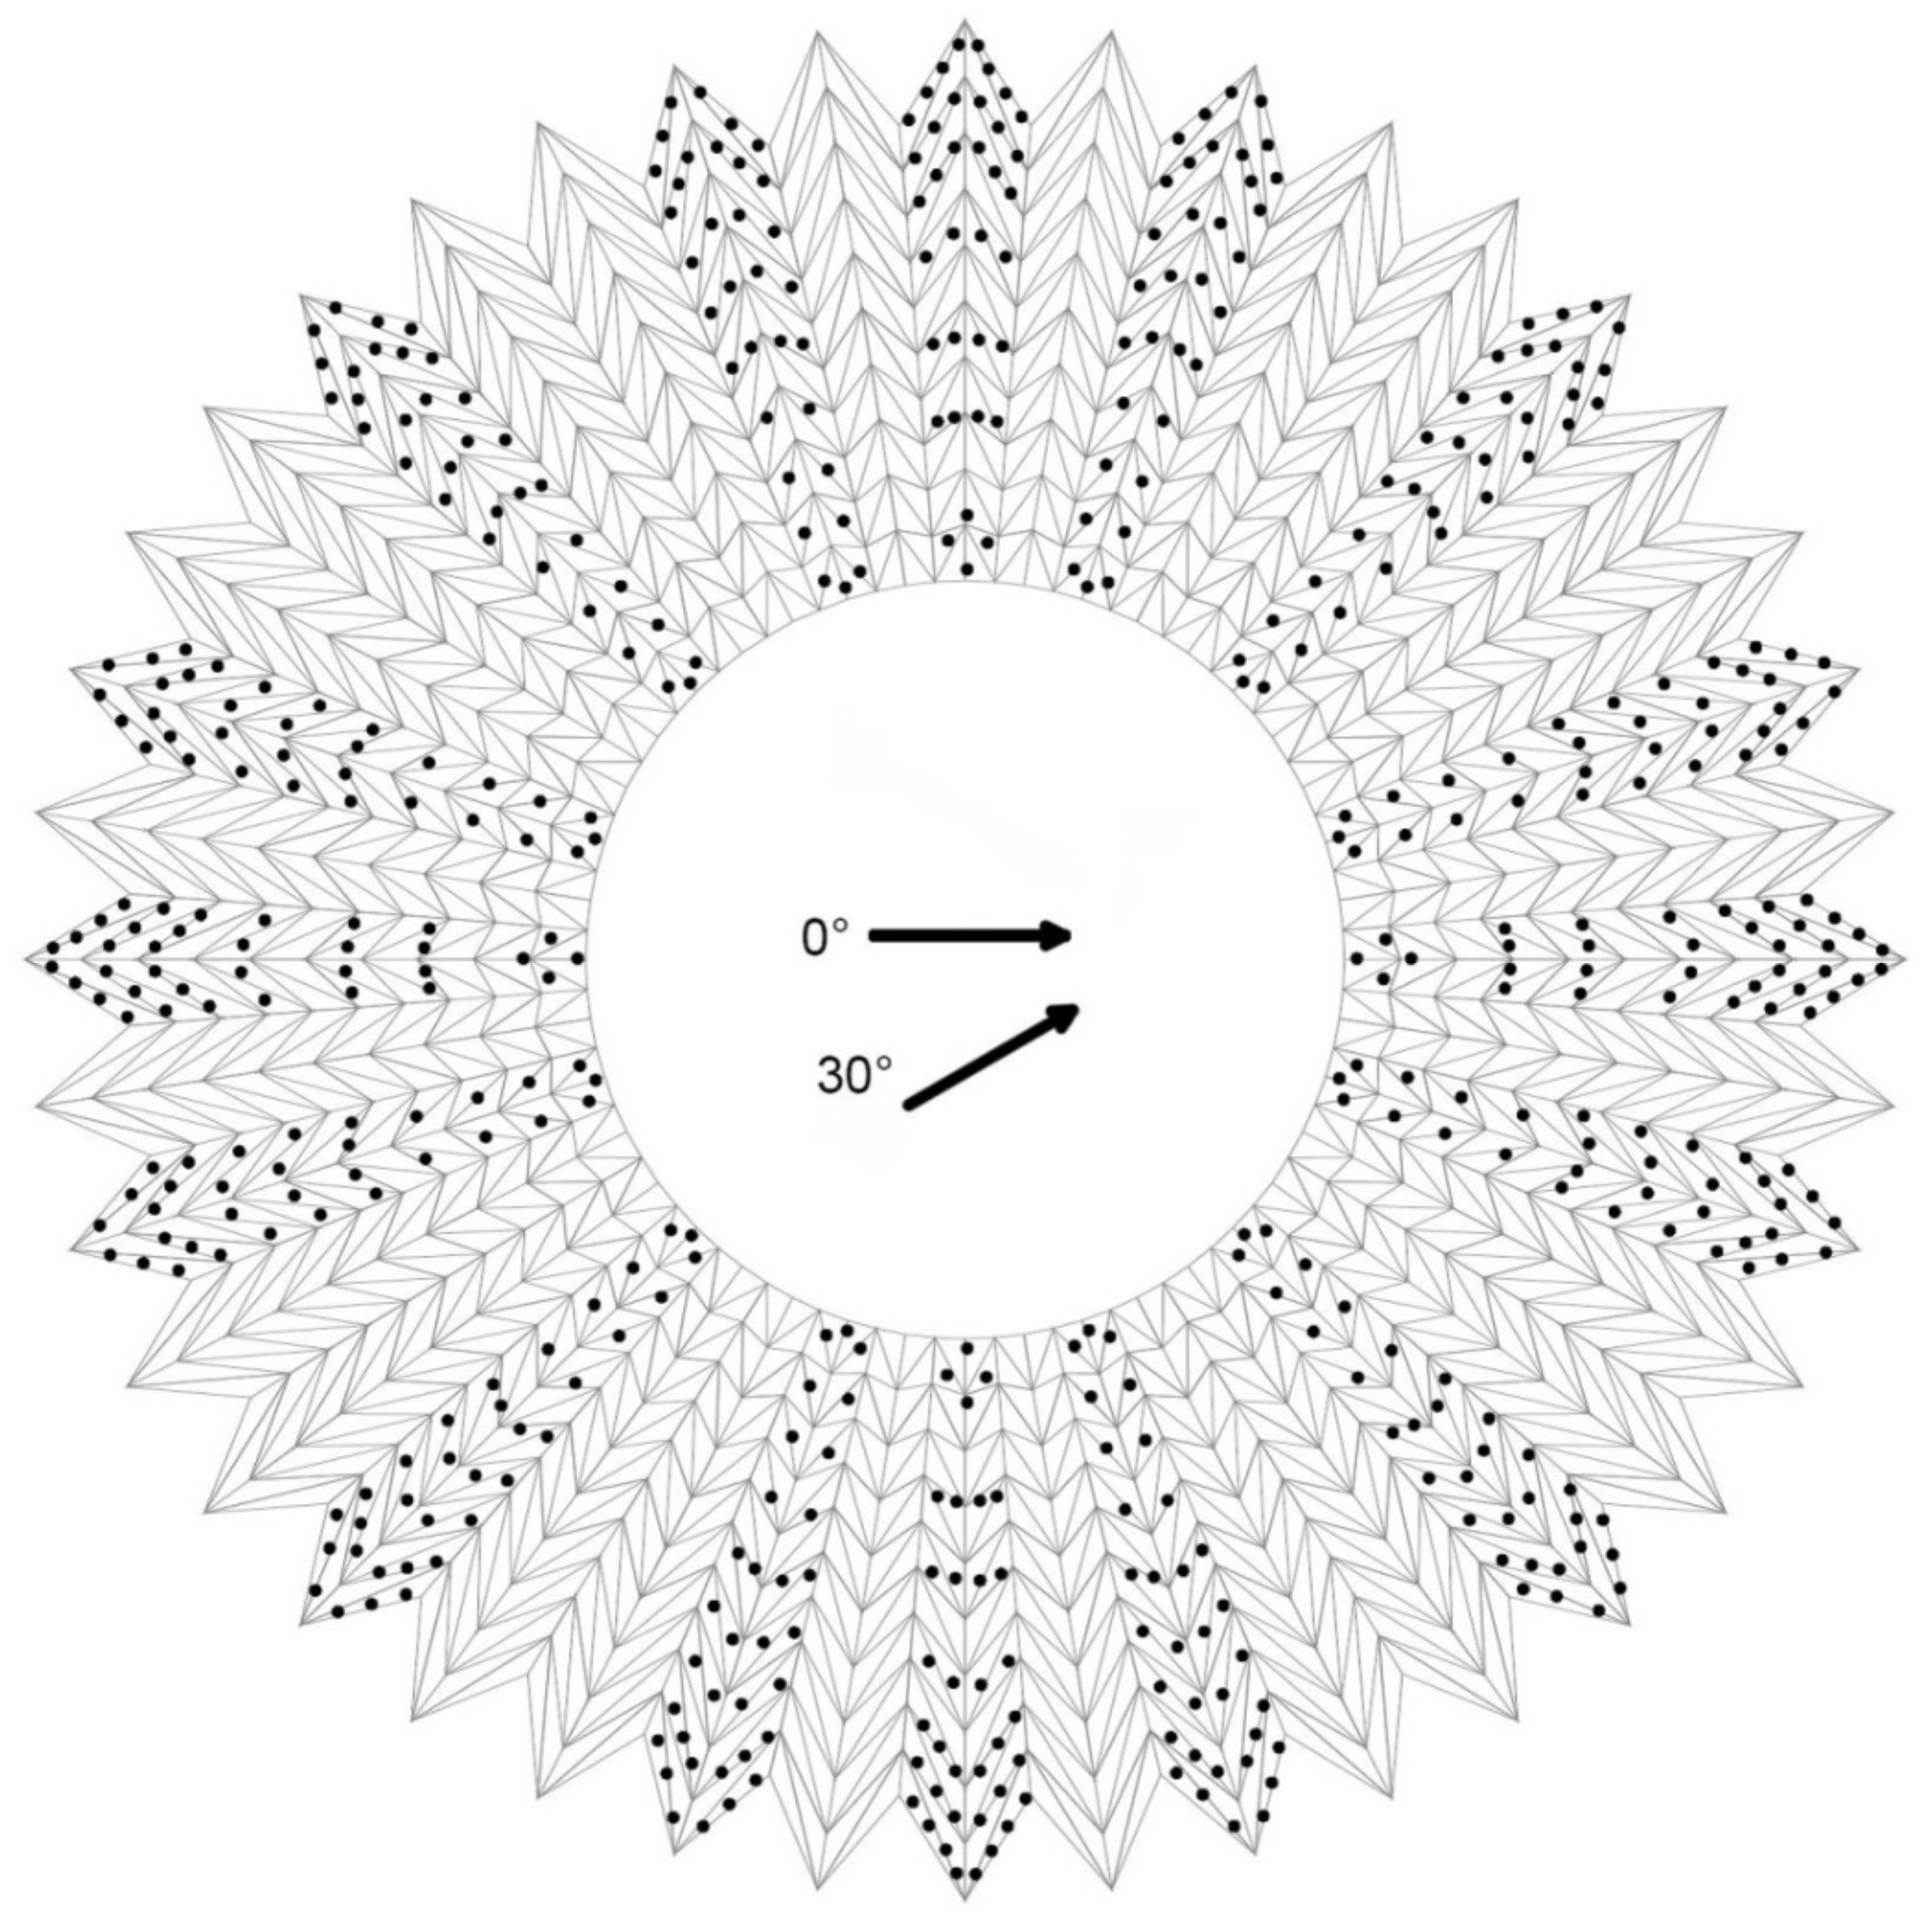
2.2. Wind Tunnel Test of Foshan Century Lotus Sports Center (FCLSC)
- a certain height above the ground.
- the standard reference height.
- the mean wind speed at height z.
- the mean wind speed at the standard reference height.
- Cpijk the k th wind pressure coefficient transient value of the jth sample at ith pressure point on the model;
- Pijk the kth wind pressure transient value of the j sample at ith pressure point on the model;
- P∞ the static pressure value of the reference point; ρ is the air density;
- V∞ the reference point wind speed. According to the wind tunnel experiment report [16], the average wind velocity of the upper part of the model is about 7 m/s at the height of approximately 14.6 m in the wind tunnel (equivalent to 47 m in the natural state).
- u the peak factor;
- q the wind pressure.
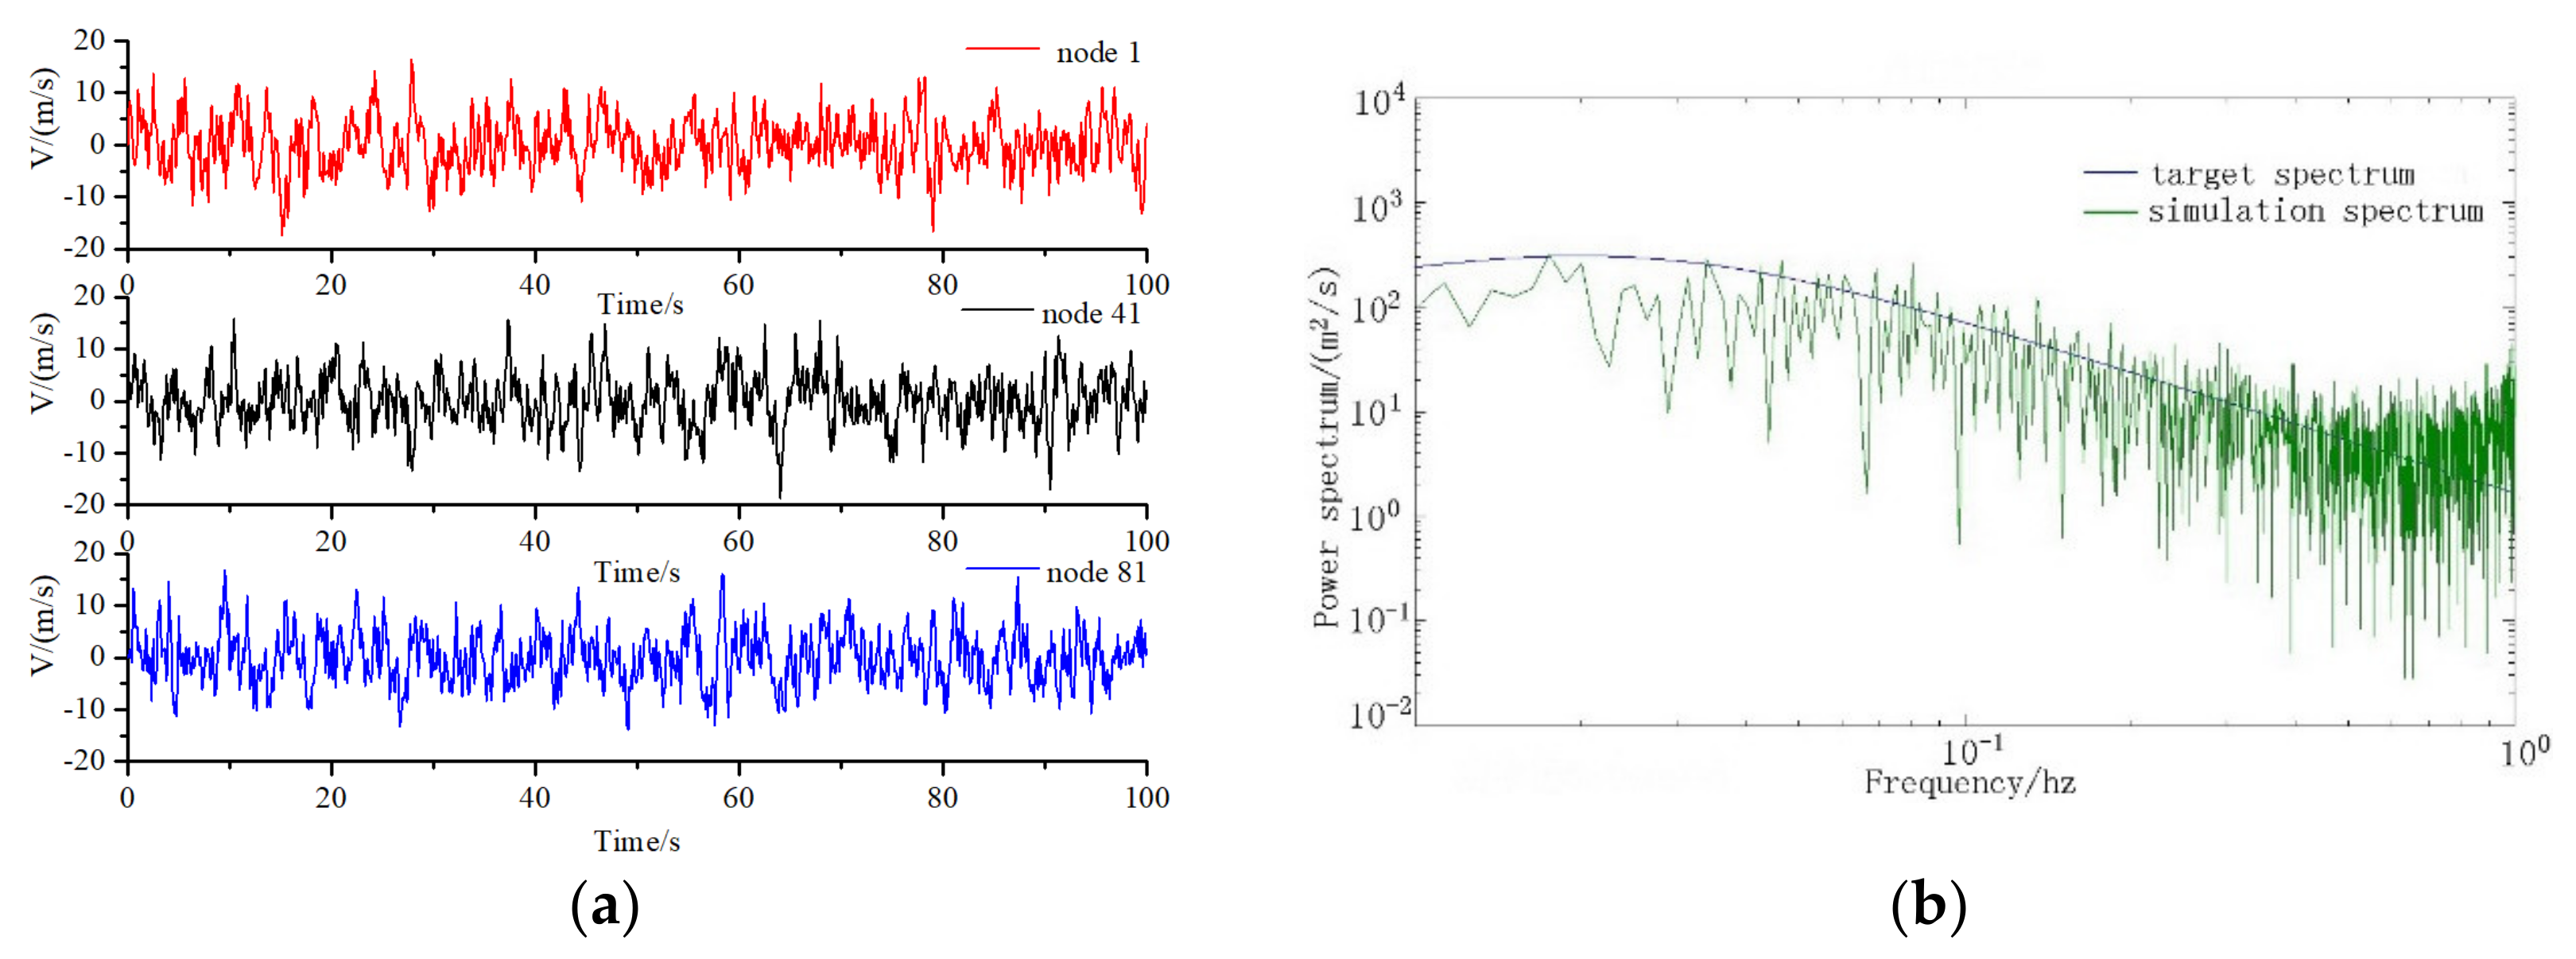
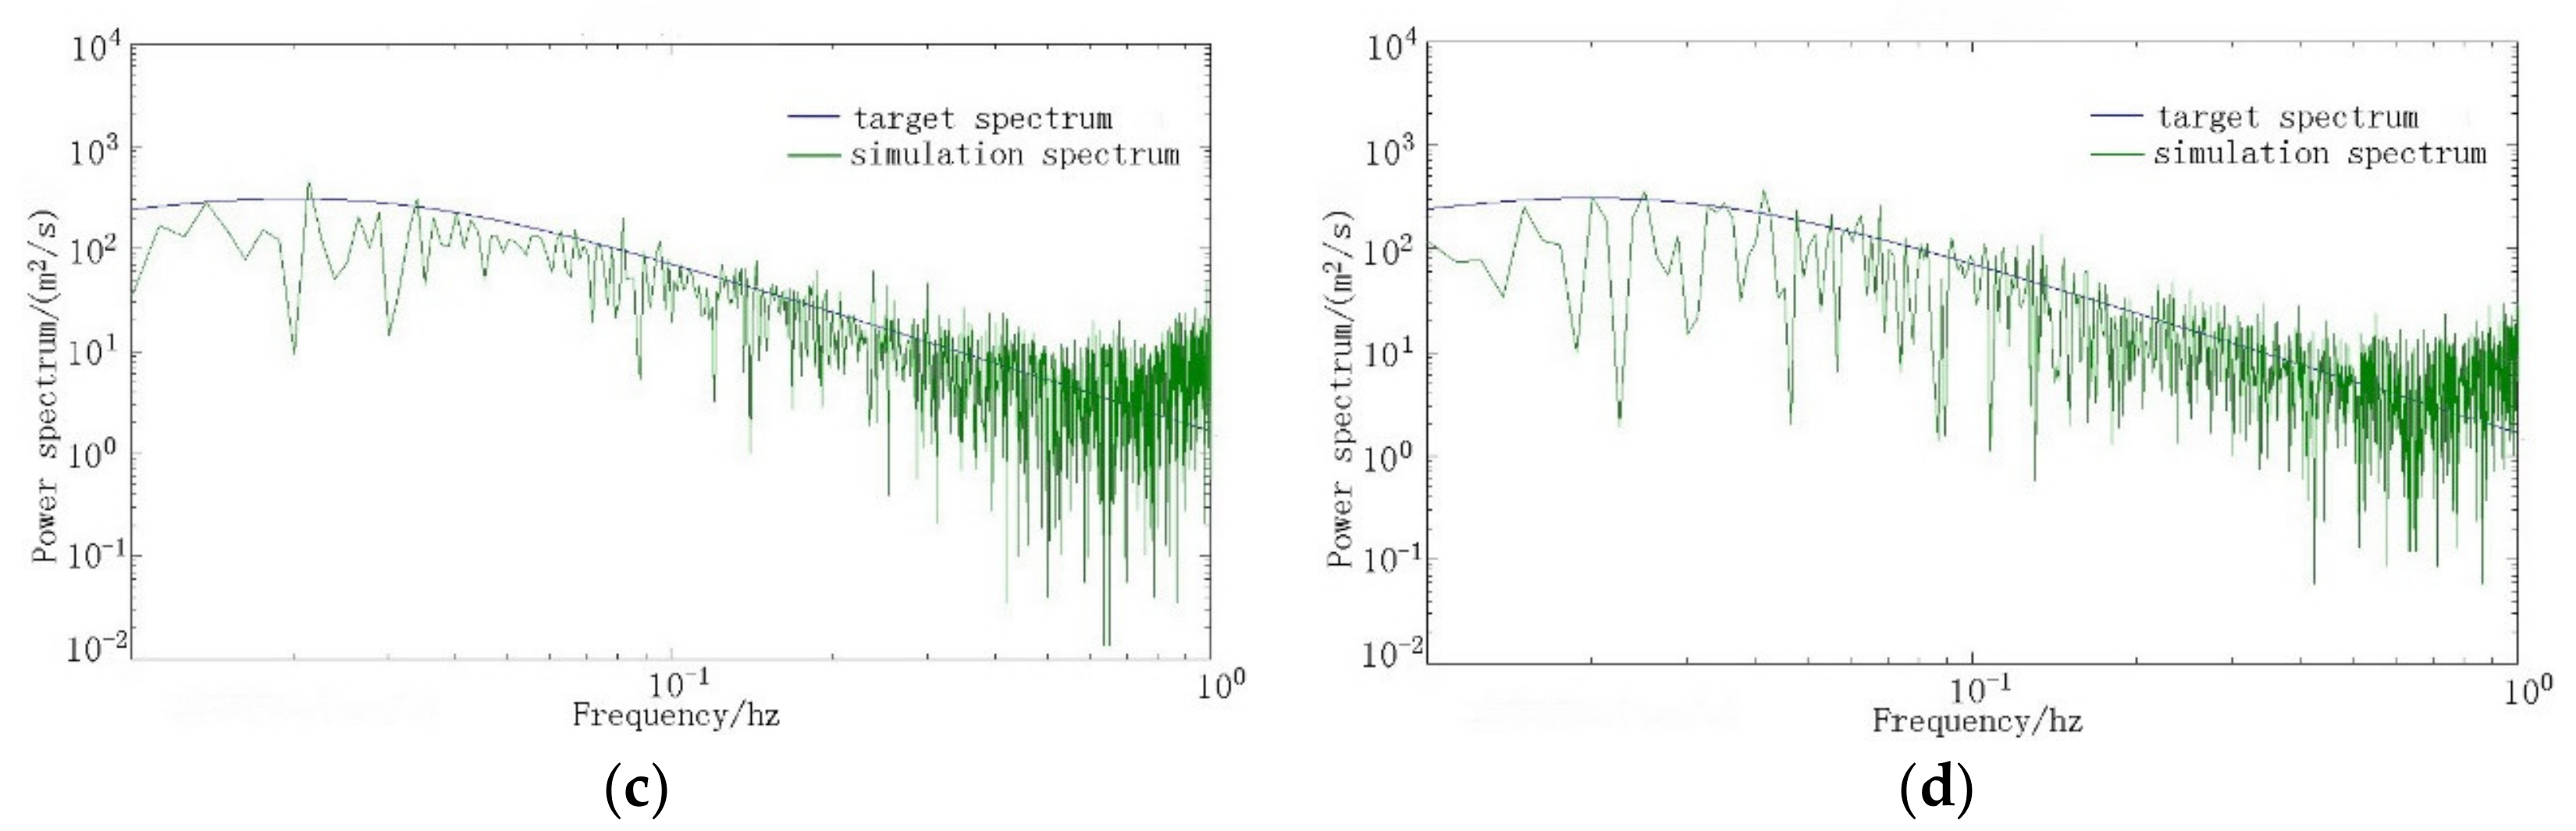
2.3. Fluctuating Wind Load
- the air mass density (1.23 kg/m3);
- the affected area;
- the time history of wind speed, which is equal to the sum of the average wind speed and fluctuating wind speed;
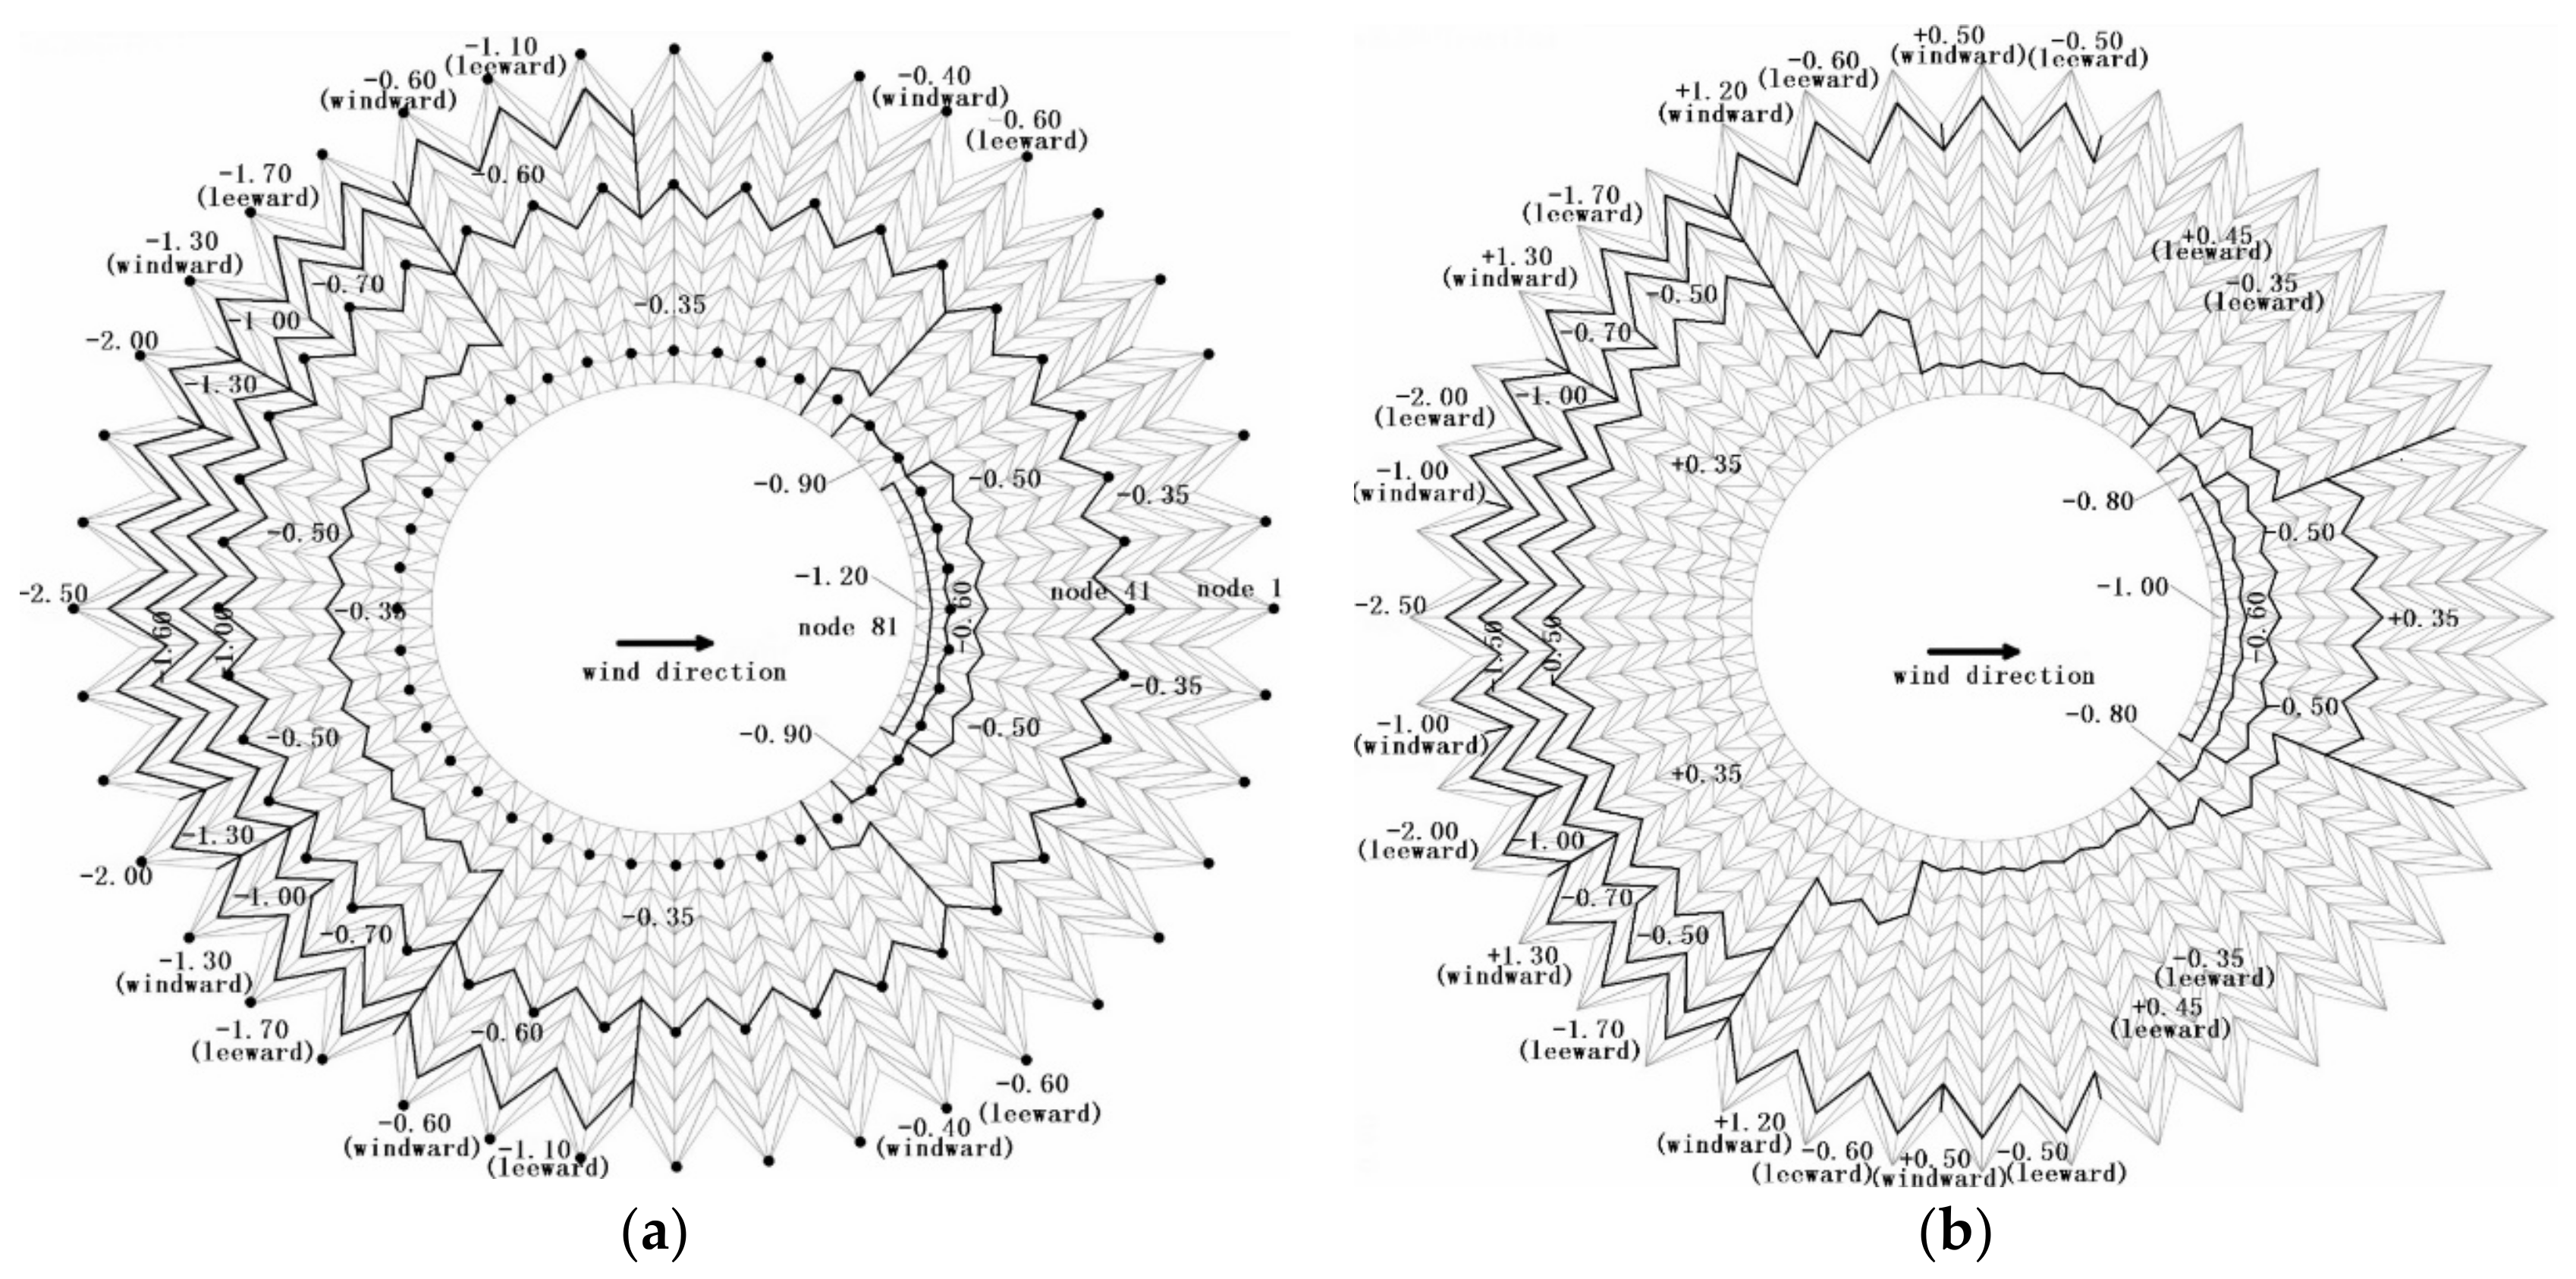
- the coefficient of wind pressure distribution. By the Equations (11) and (12), the wind load time history of 120 nodes shown in Figure 5a can be calculated.
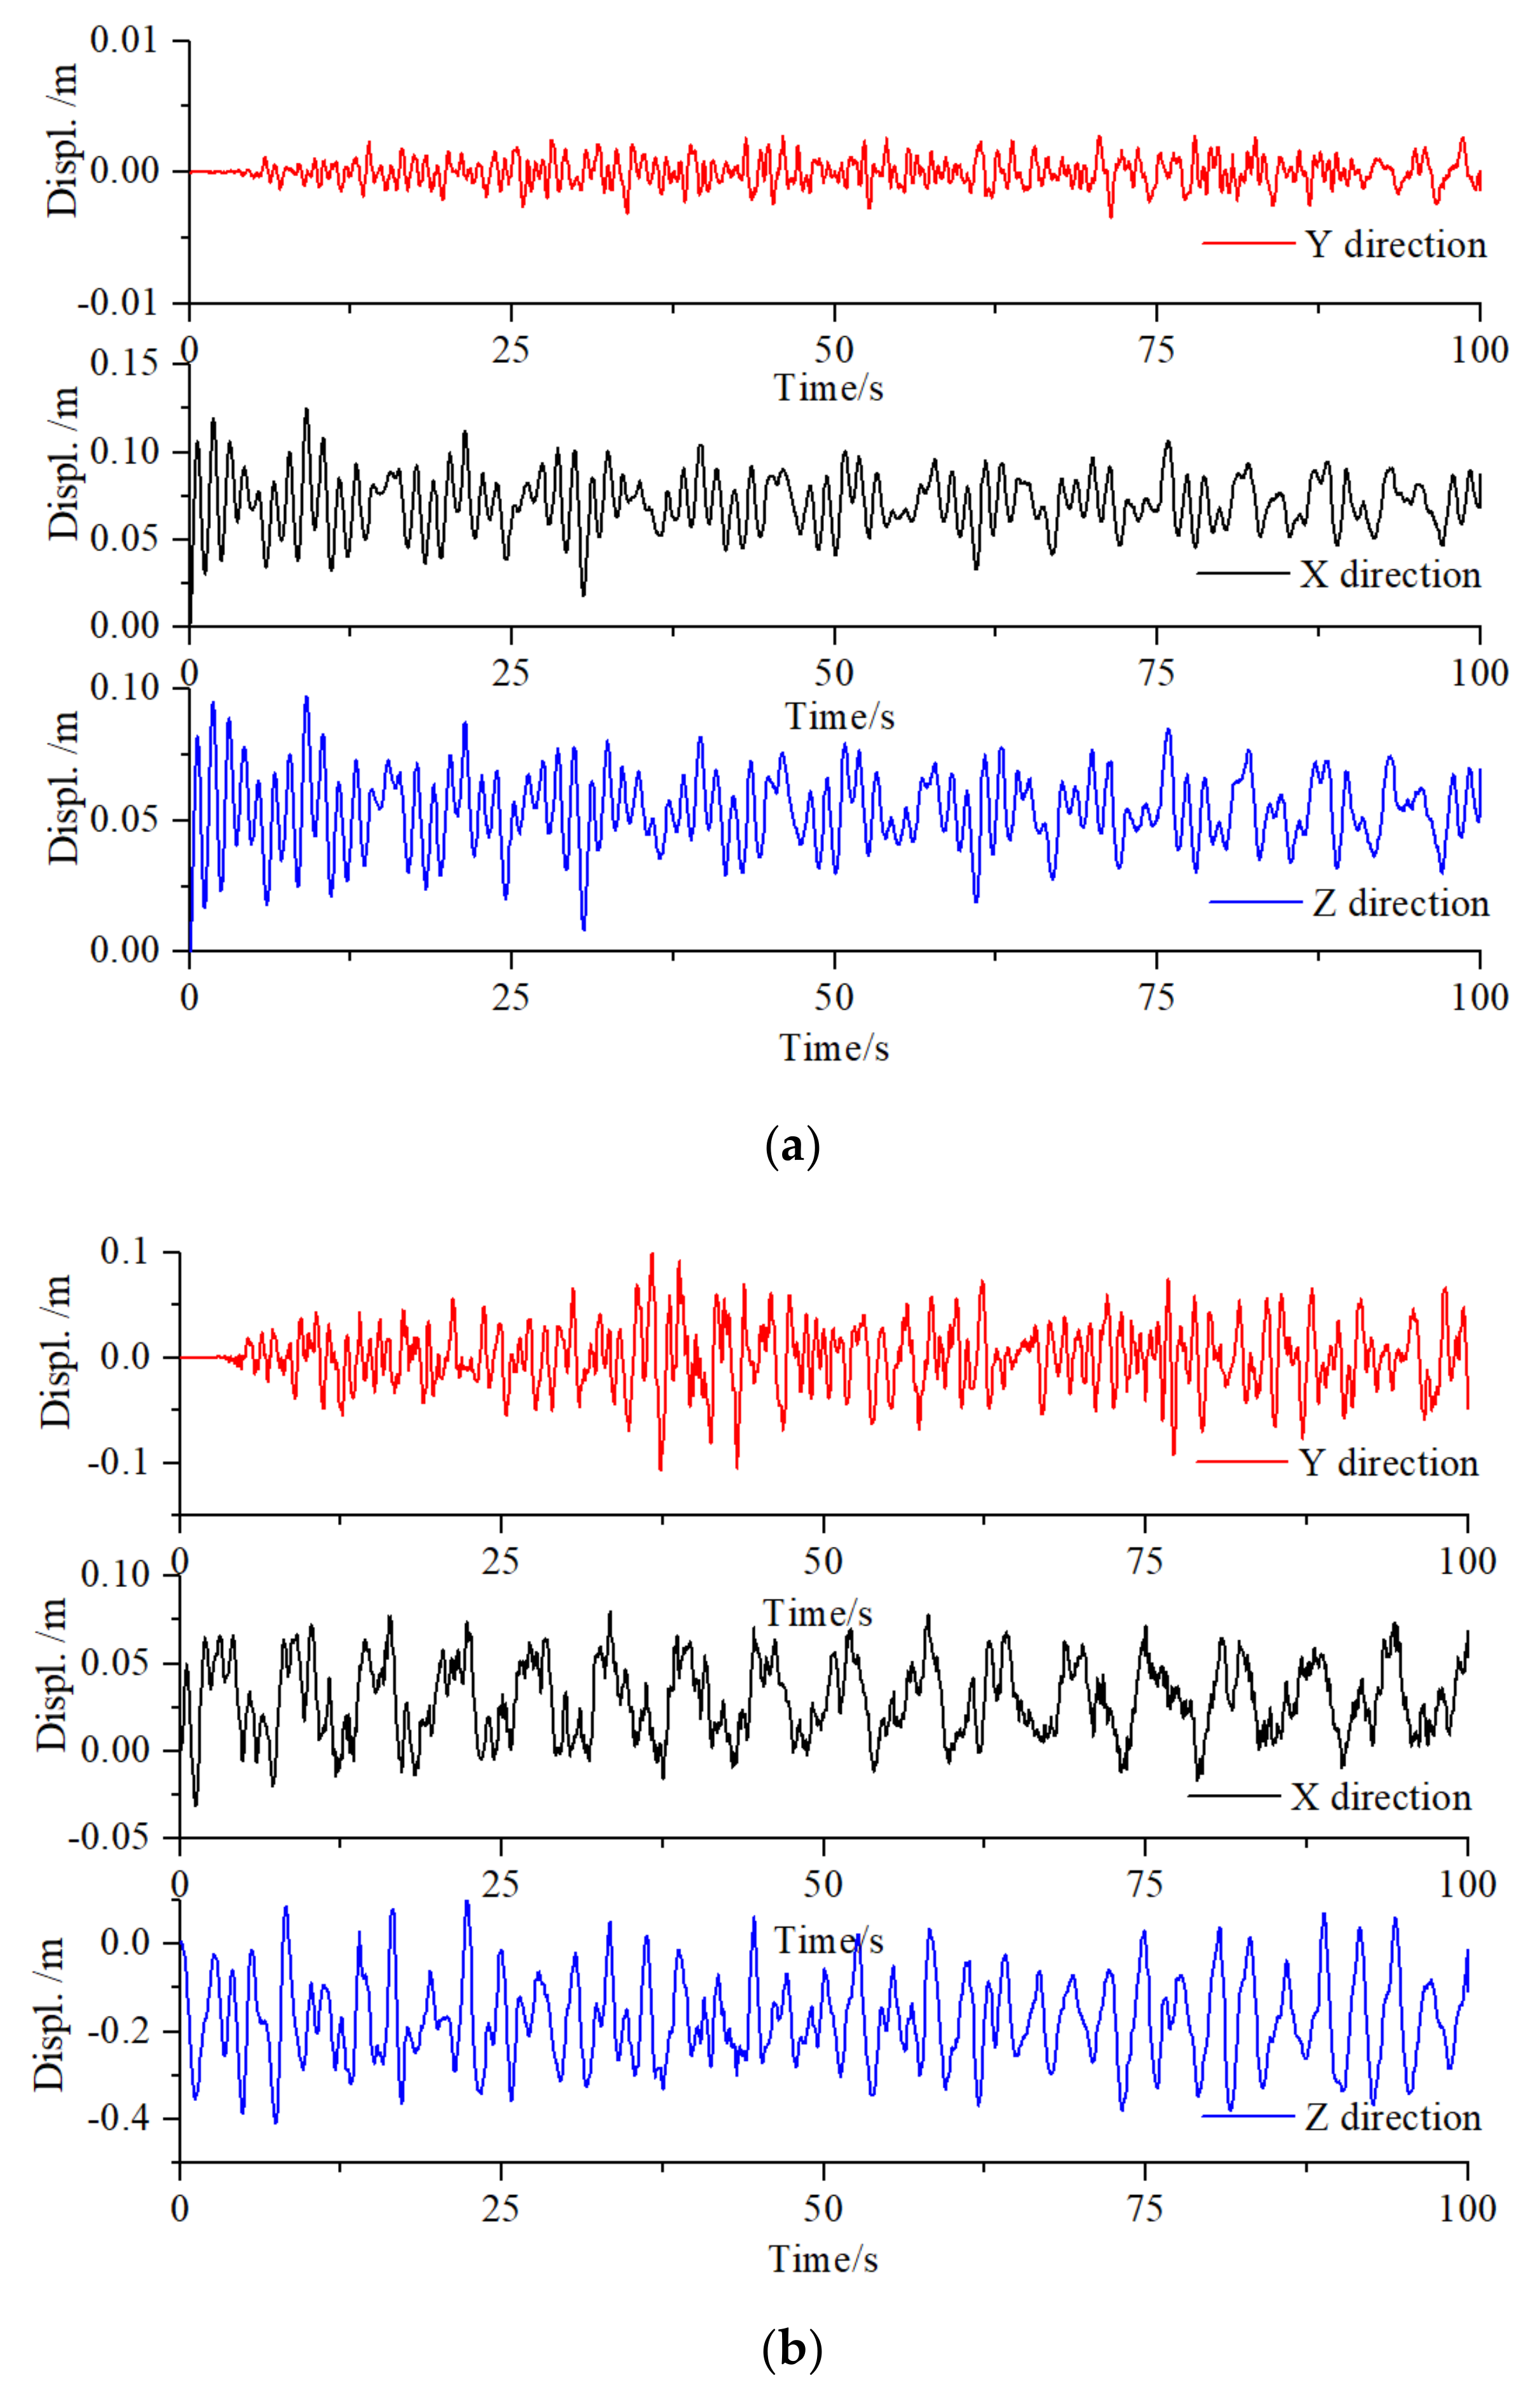
2.4. Analysis of Wind Vibration for Uniform Distribution
- the lumped mass matrix;
- the Rayleigh damping matrix;
- the stiffness matrix;
- the coefficient of dynamic magnification for the i-th member, ;
- the average value of the time history of dynamic response for his member, including the internal force and displacement of the components;
- the maximum displacement that corresponds to βi;
- the root-mean-square of the dynamic response time history of the structure;
- the peak factor when u = 2.2 with an assurance rate of 98.61%.
2.5. Wind Vibration Analysis of the Relaxed Cable Force
3. Structure Response
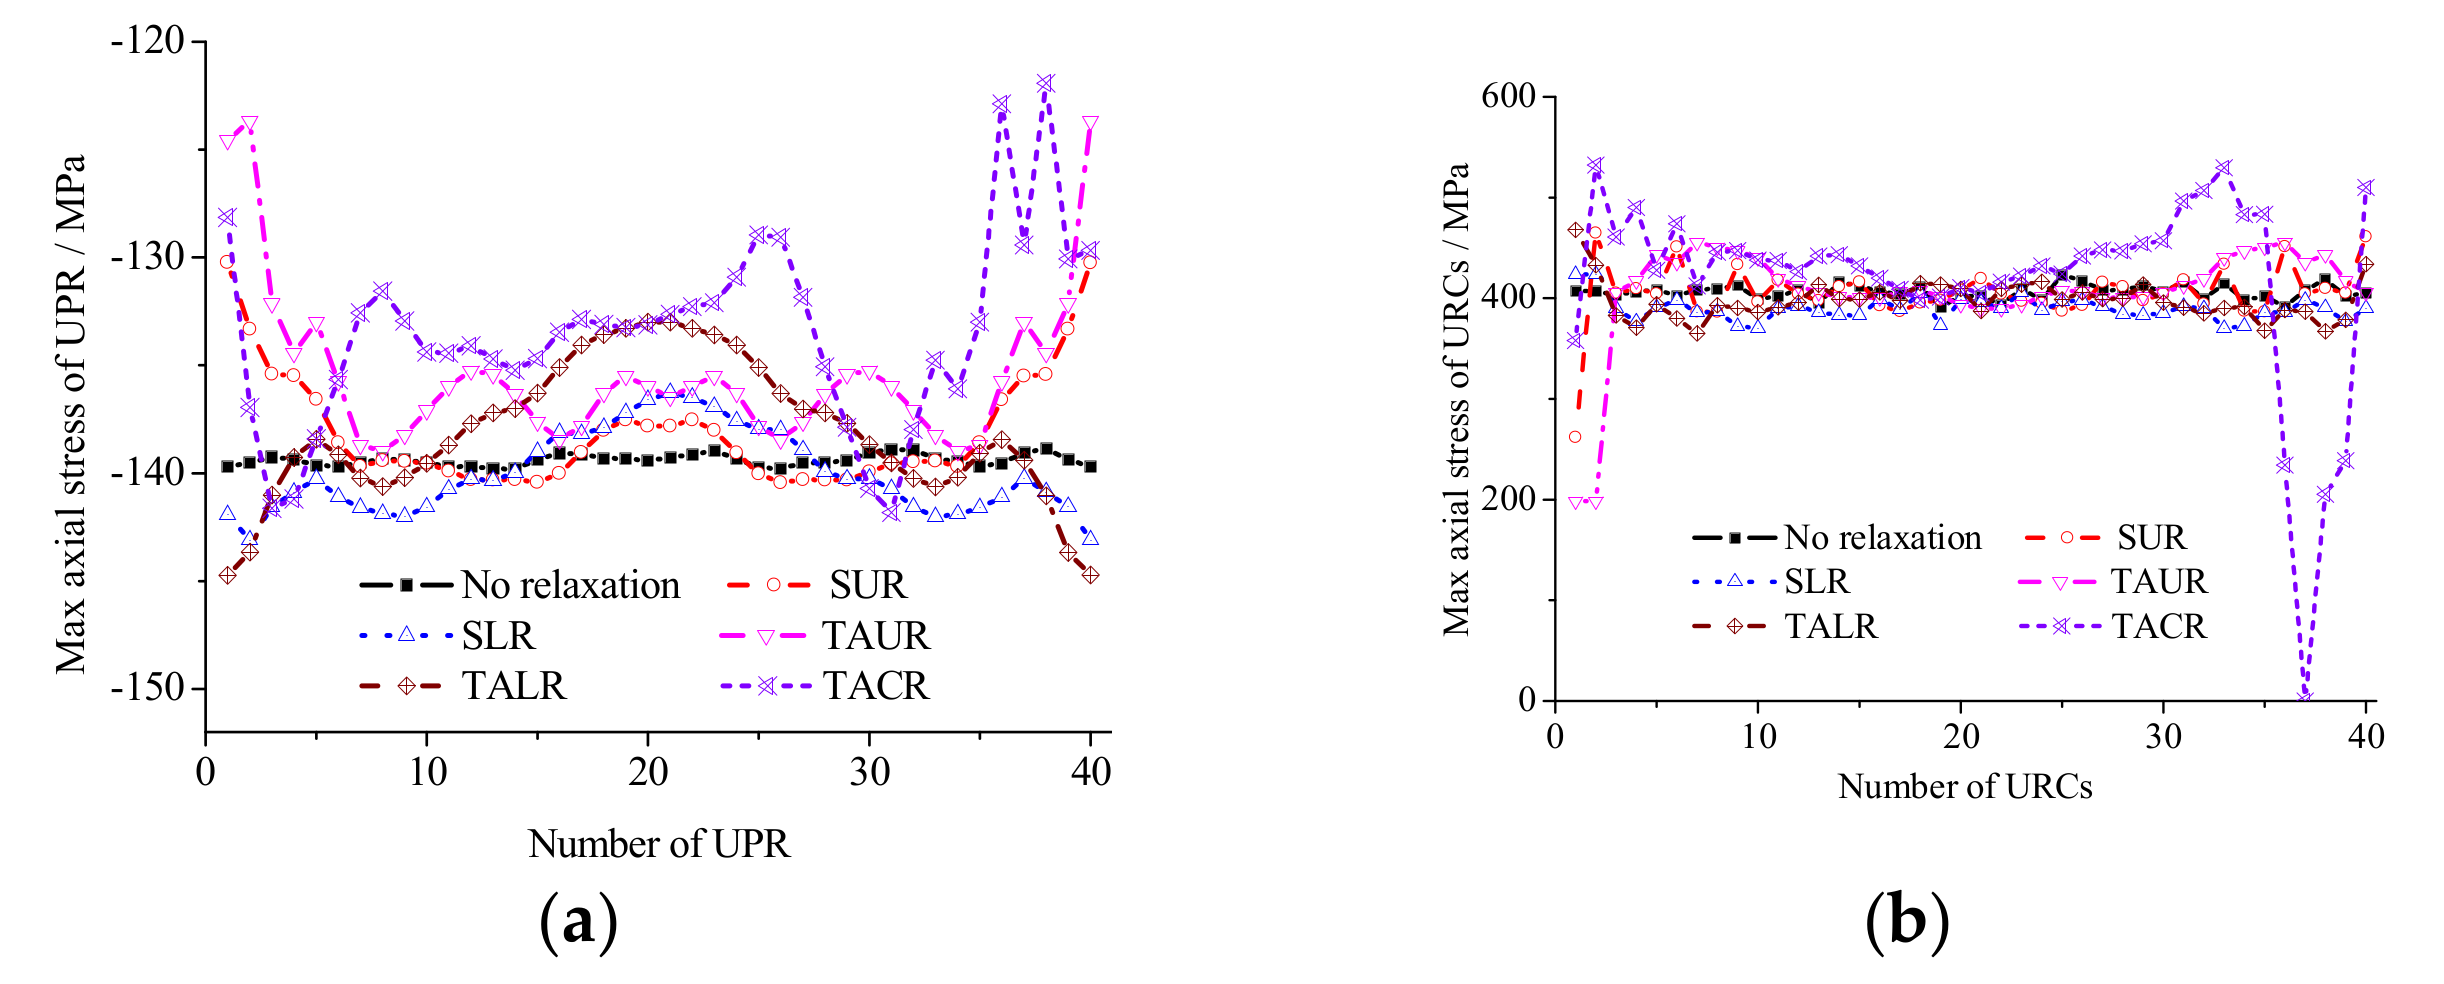
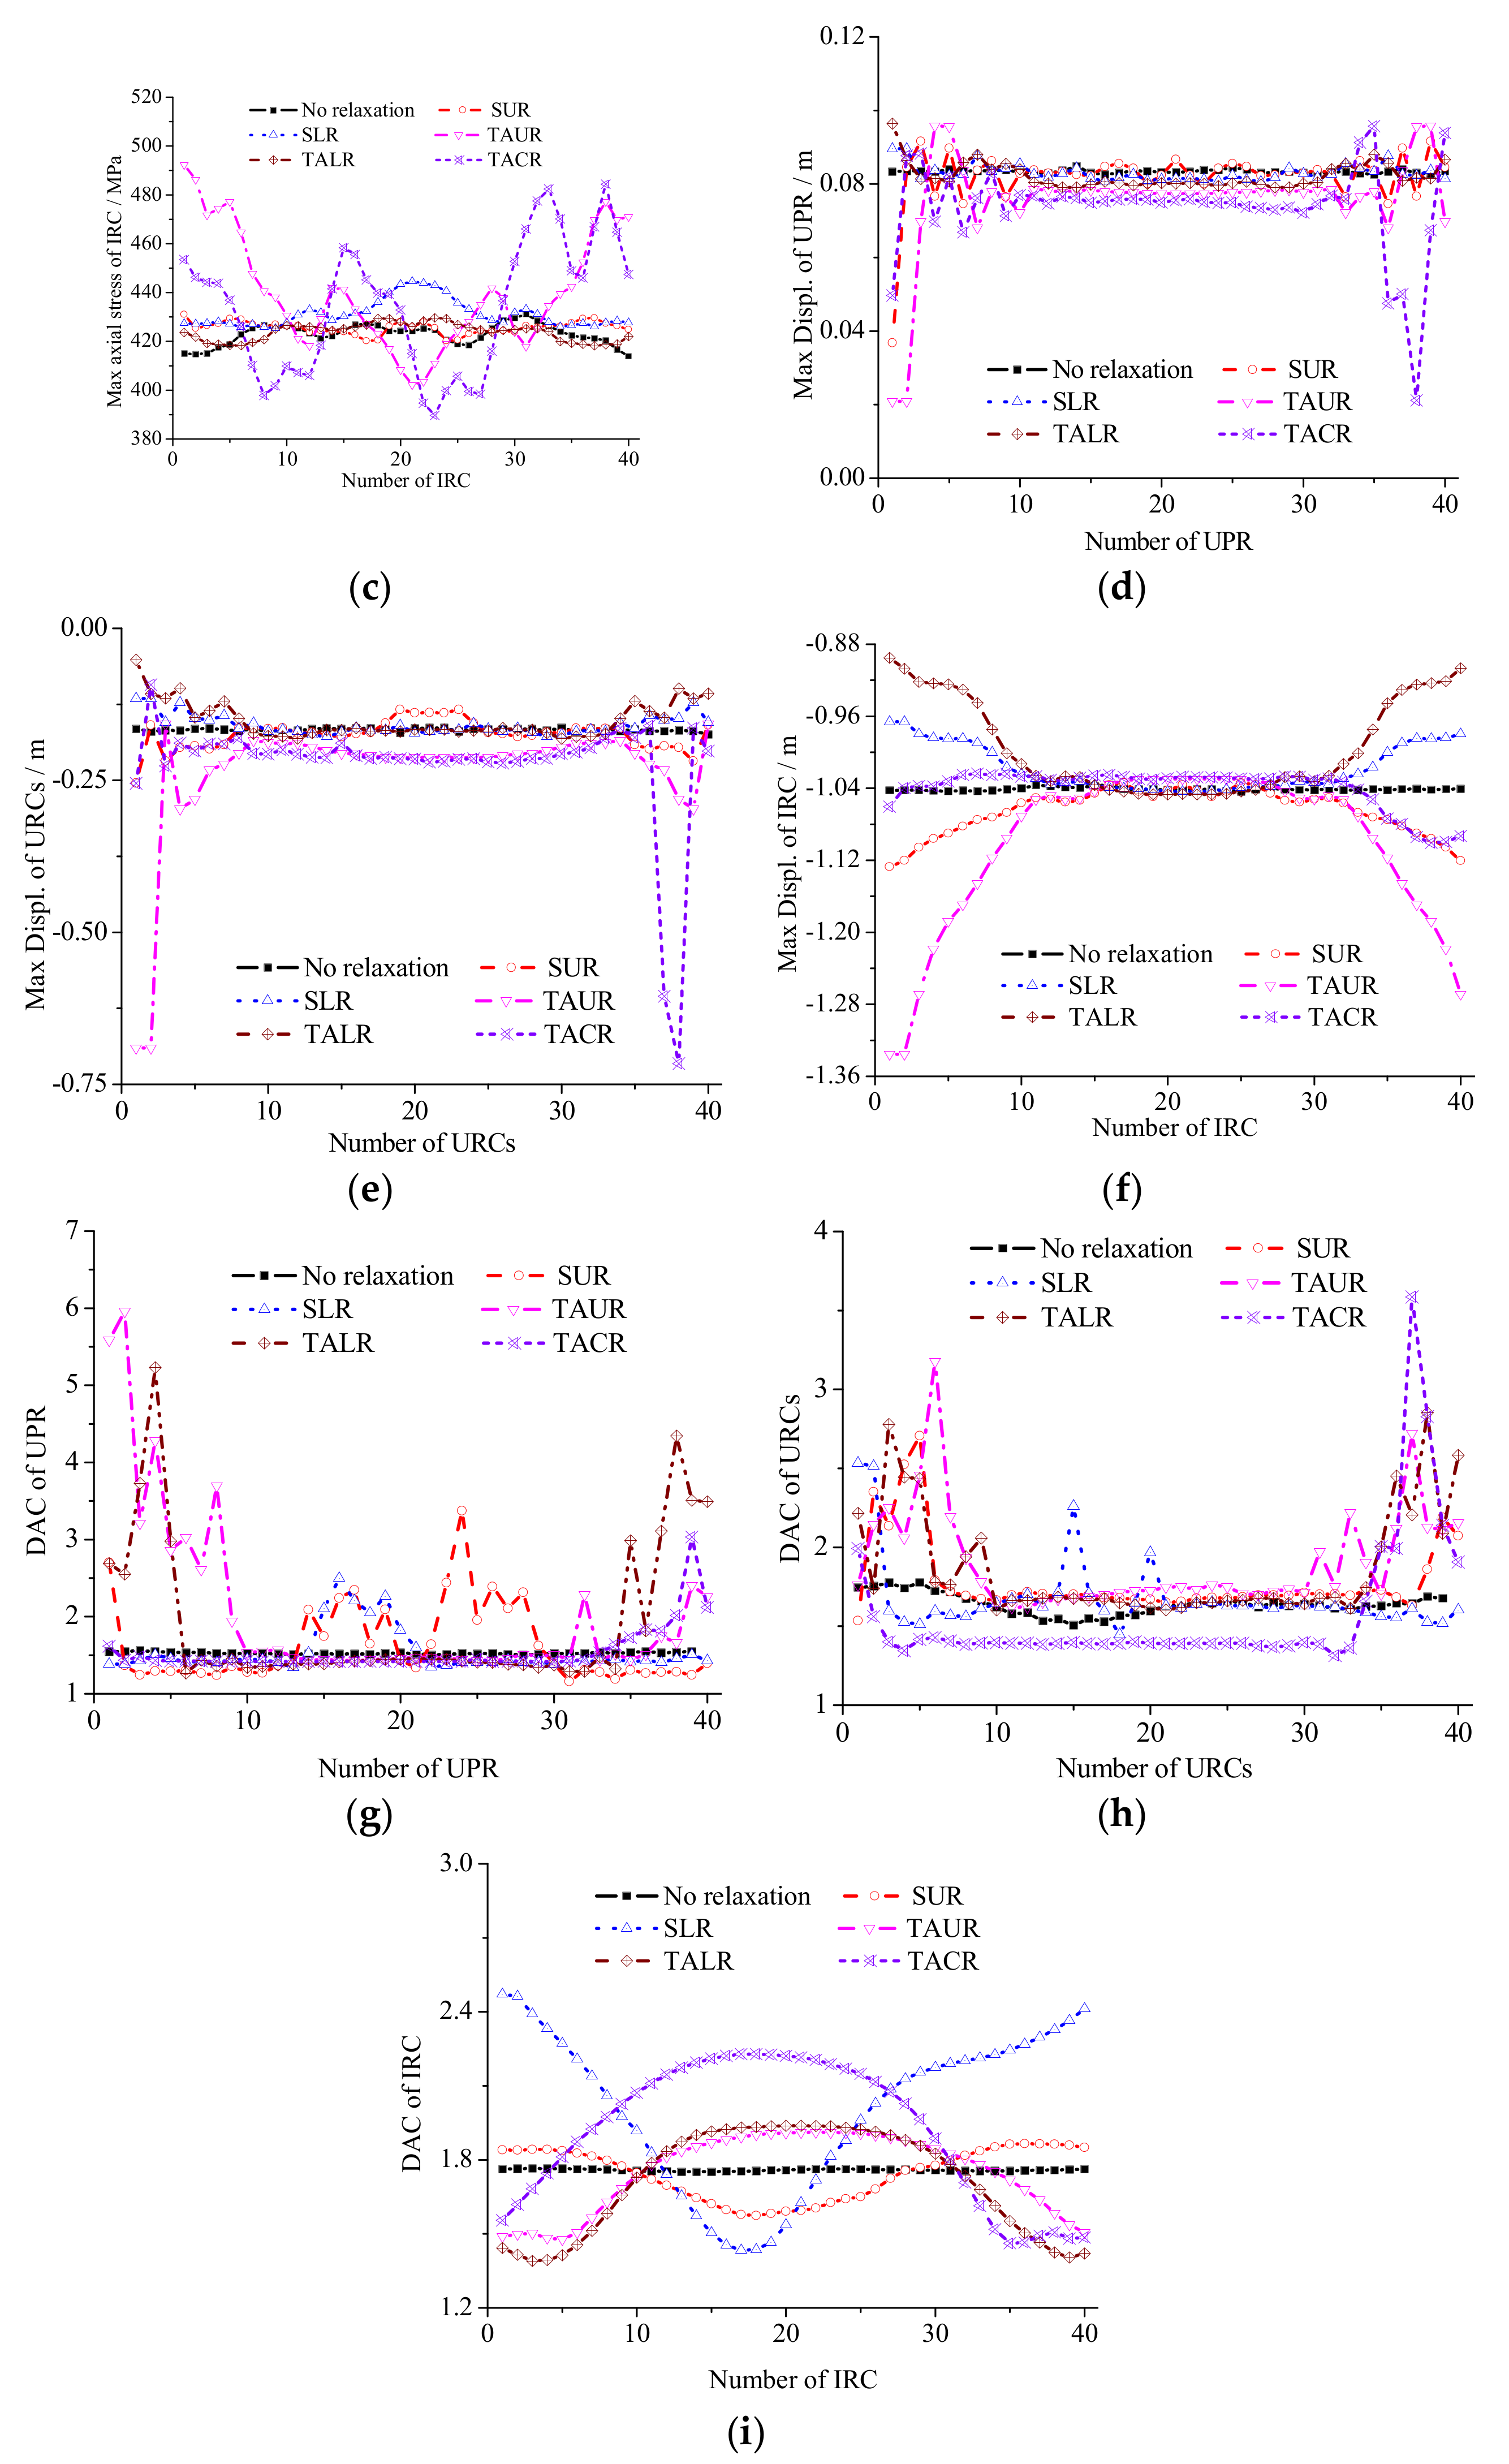
3.1. Structure Response at Different Kinds of Cable Relaxations
3.2. Structure Response to Different Relaxation Degrees
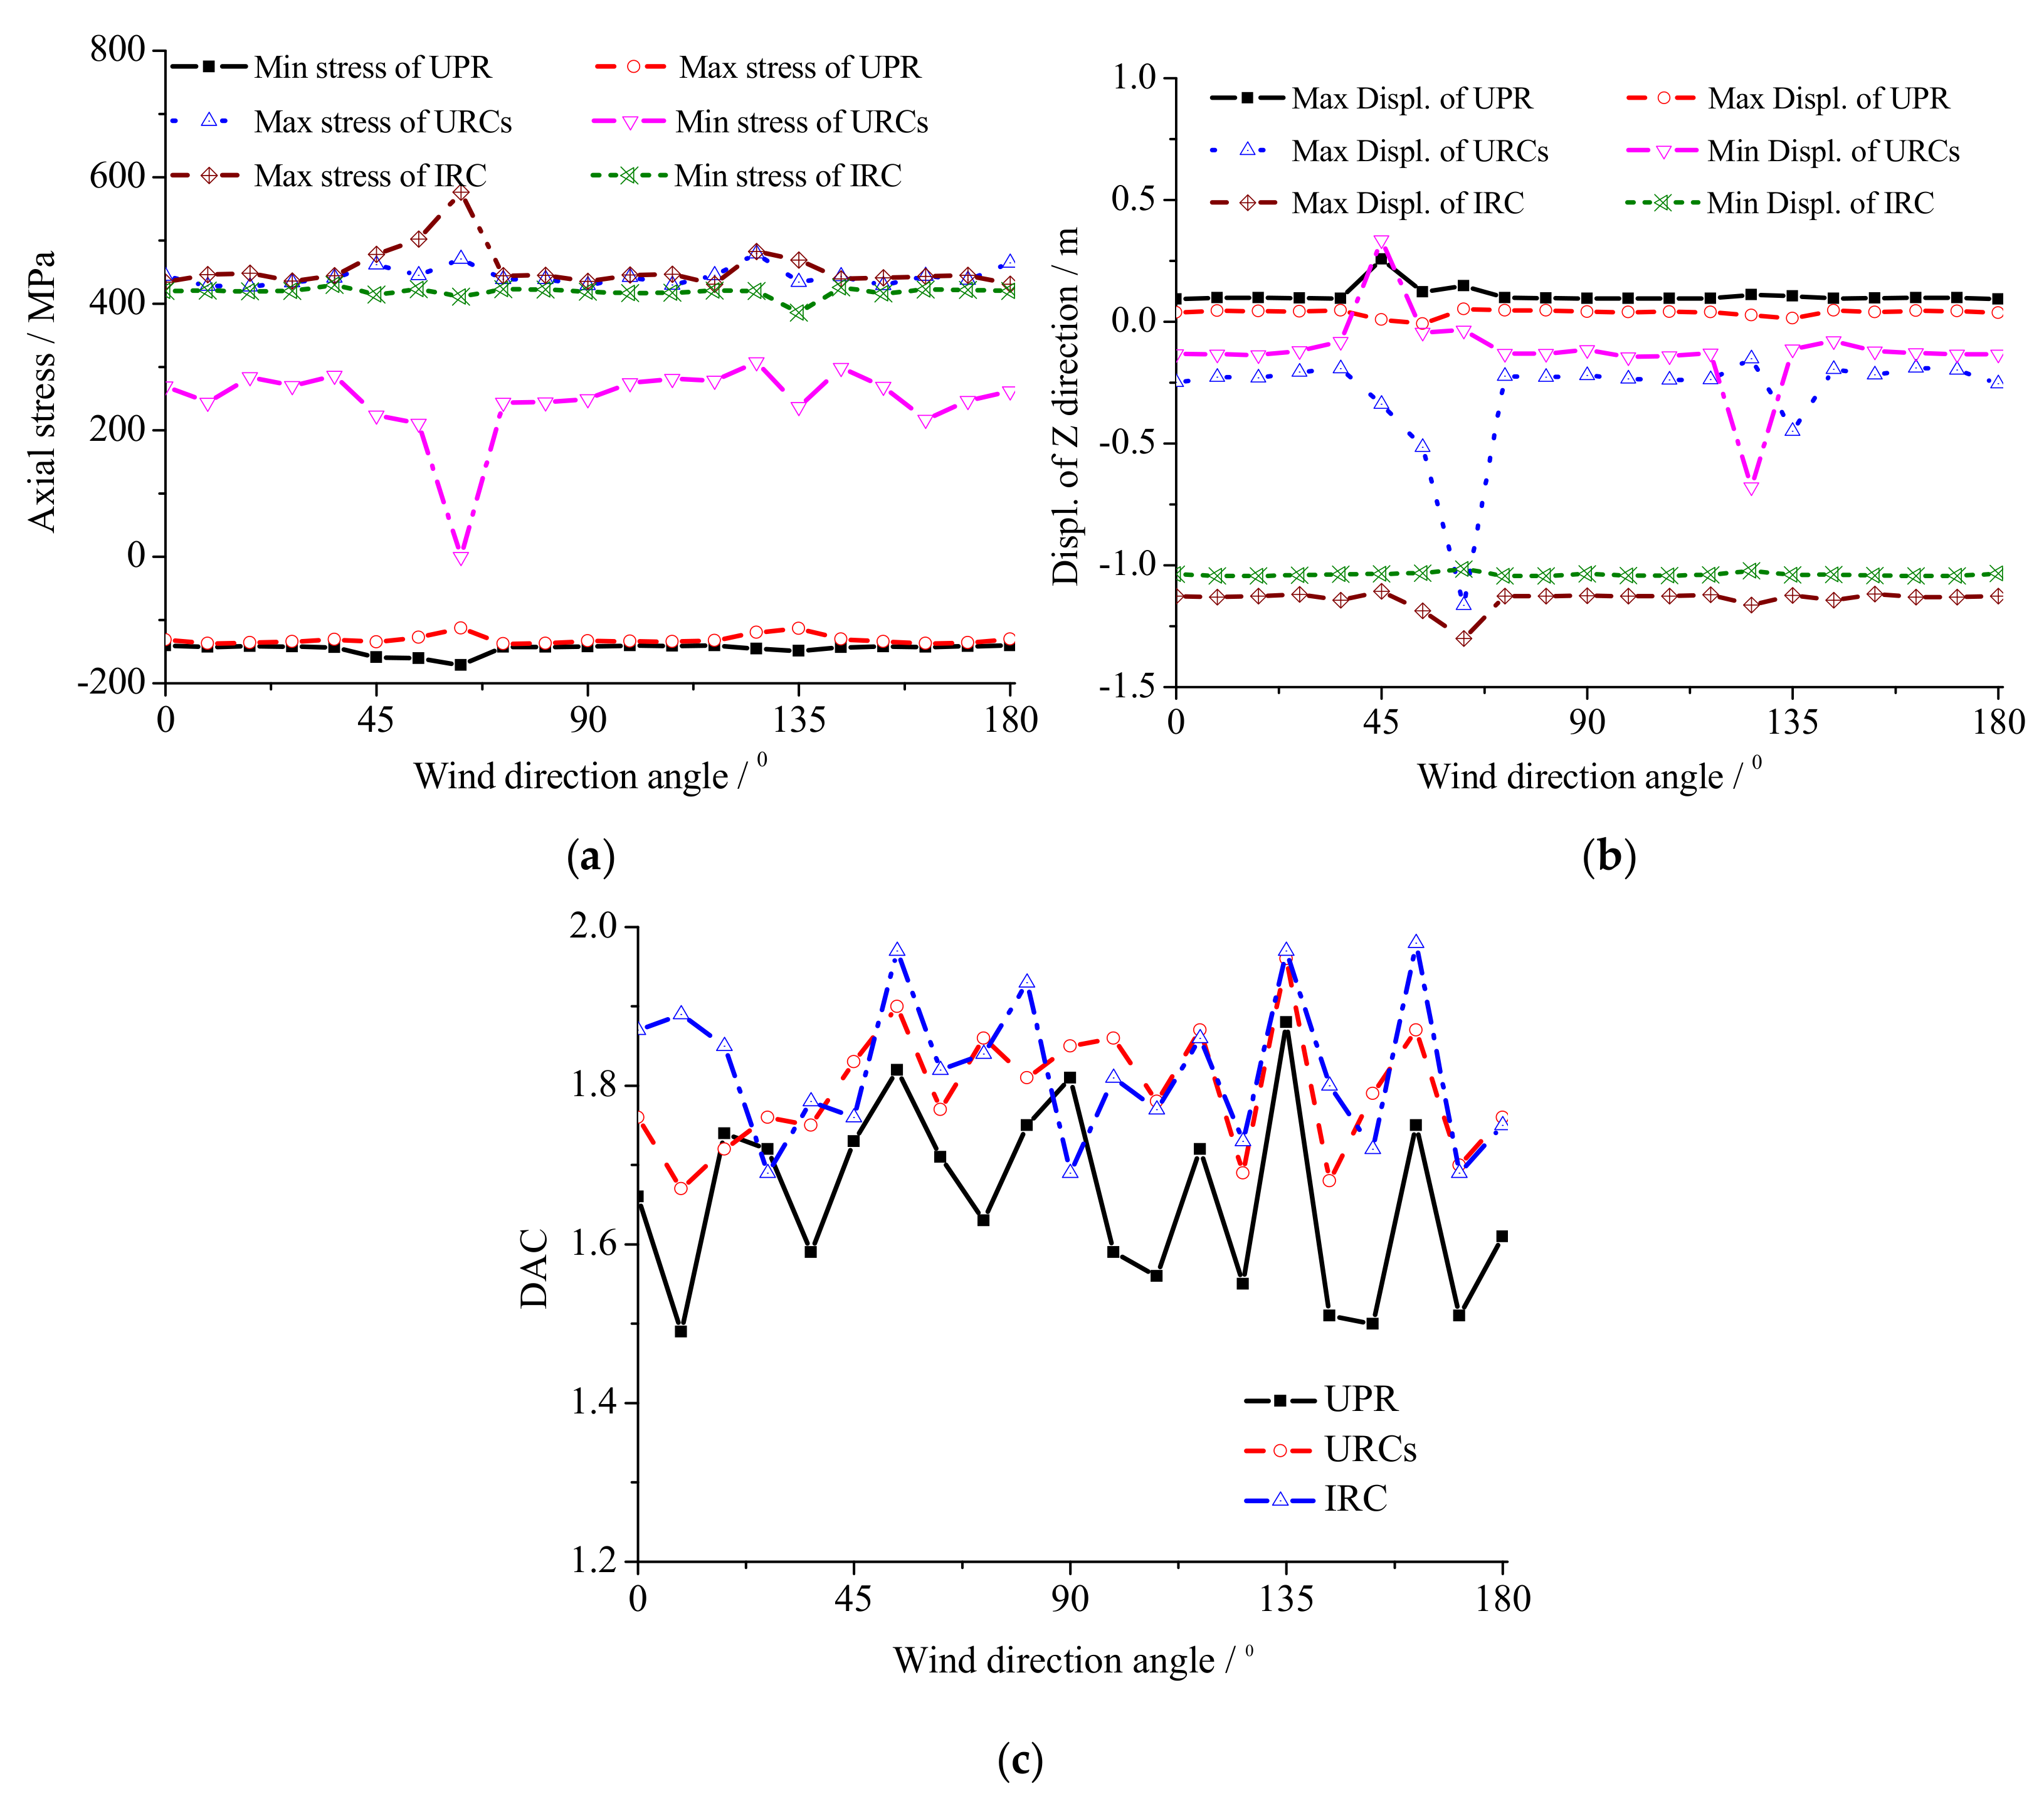
3.3. Structure Response to Different Relaxation Locations
4. Analysis of Structure Amplification Factor
5. Conclusions
- (1)
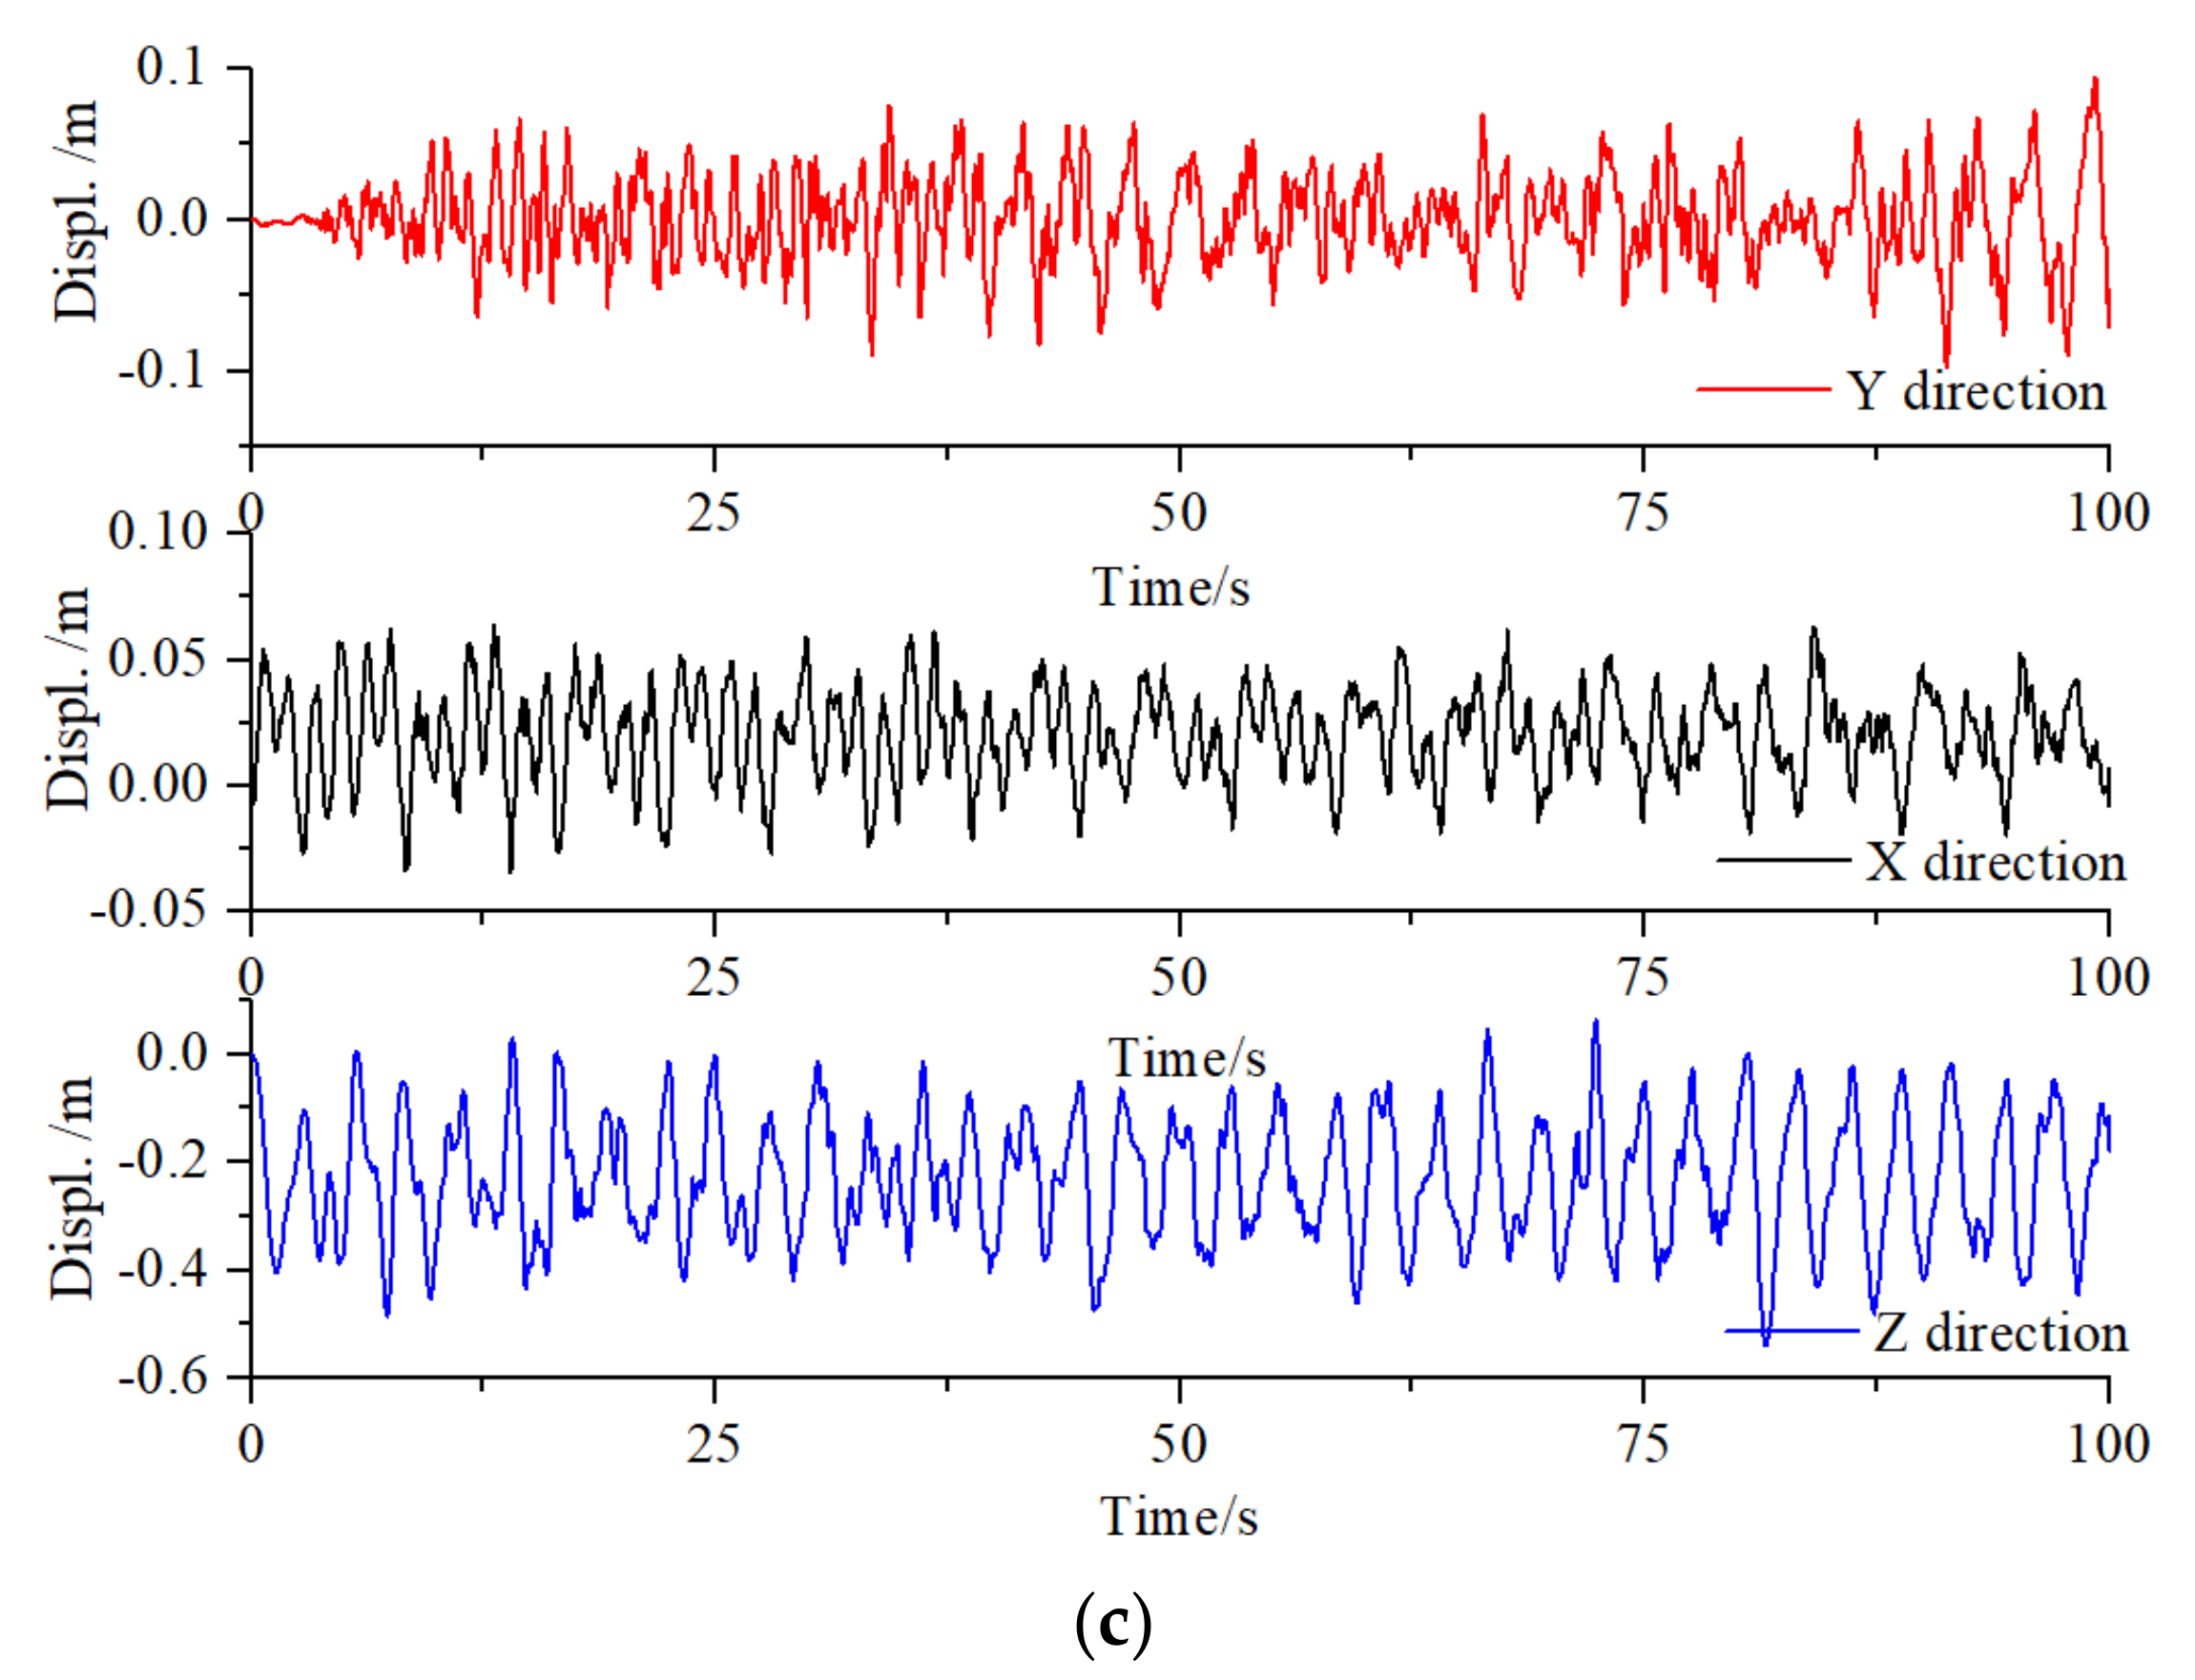
- Pulsating wind speed time series of 120 nodes are created by computer based on the harmonic synthesis method and the inverse Fourier transform method. This approach establishes the foundation for analyzing the dynamic response of the damaged structure under wind load.
- (2)
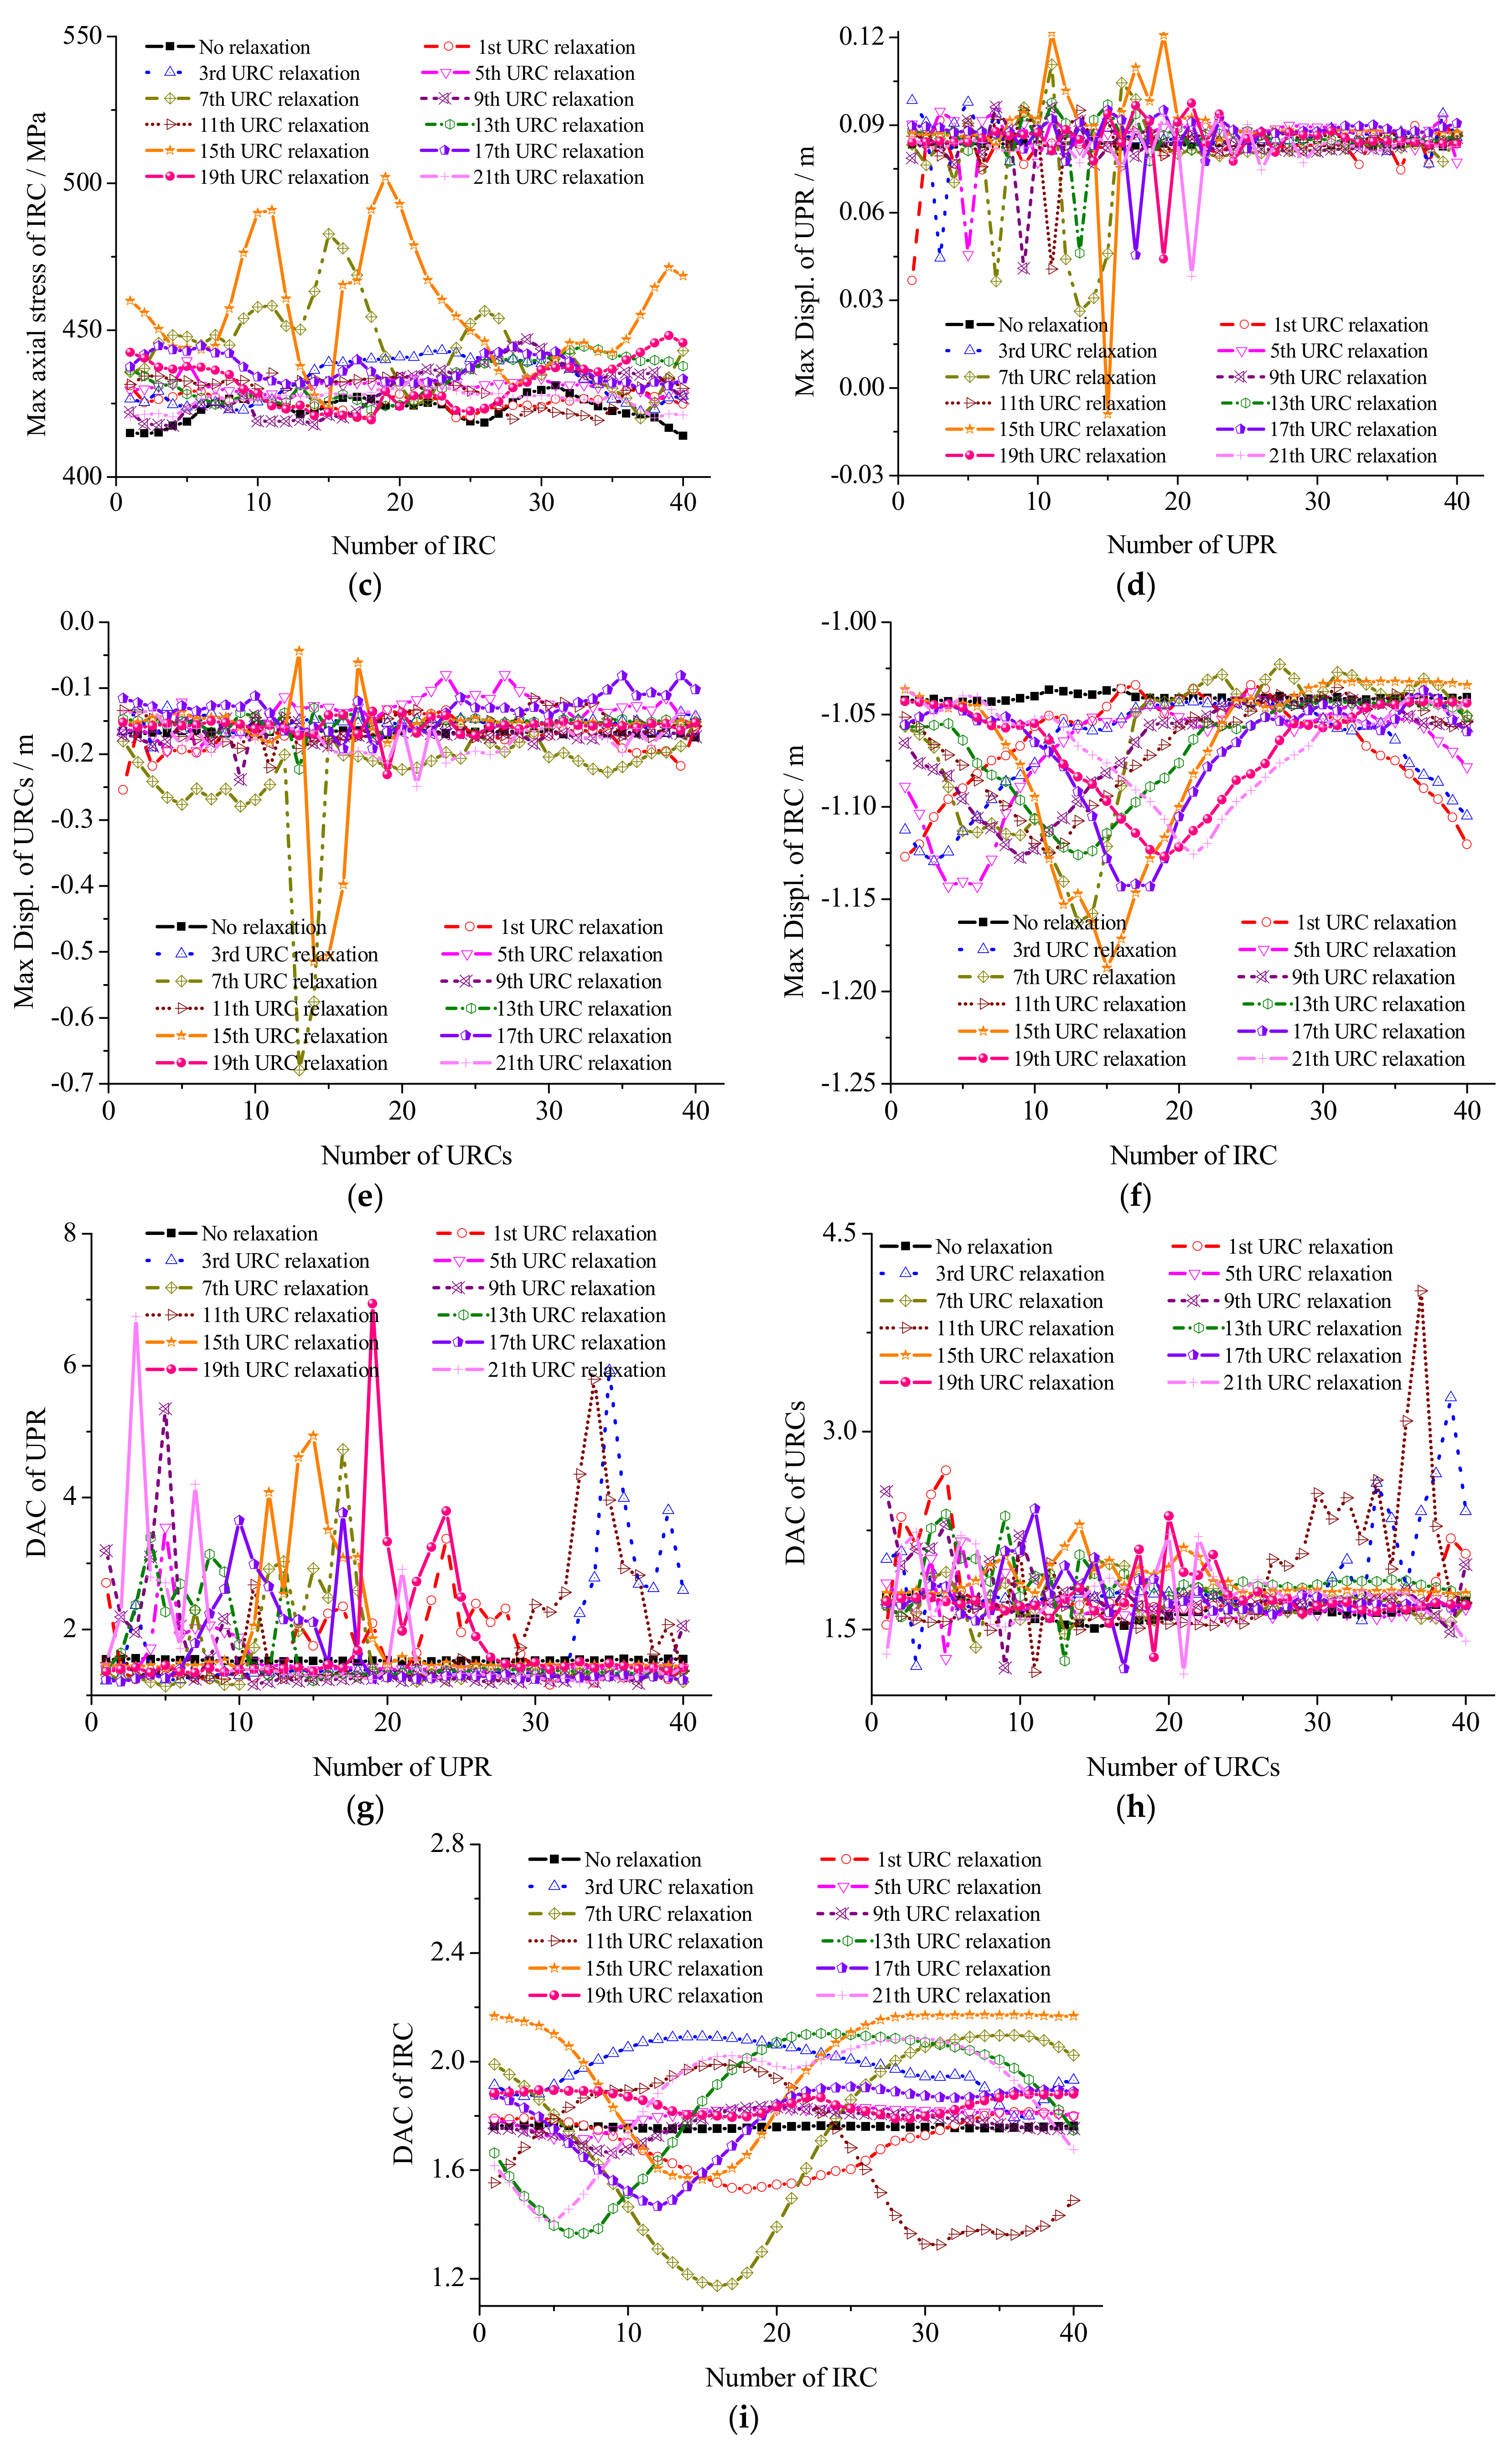
- The structural dynamic response caused by the wind and under different cable relaxations presents an axially symmetrical distribution that links the relaxation cable and the circle center. The bar connected to the relaxation cable has the greatest response. The response of the remaining bars gradually declines from the relaxation cables to both sides.
- (3)
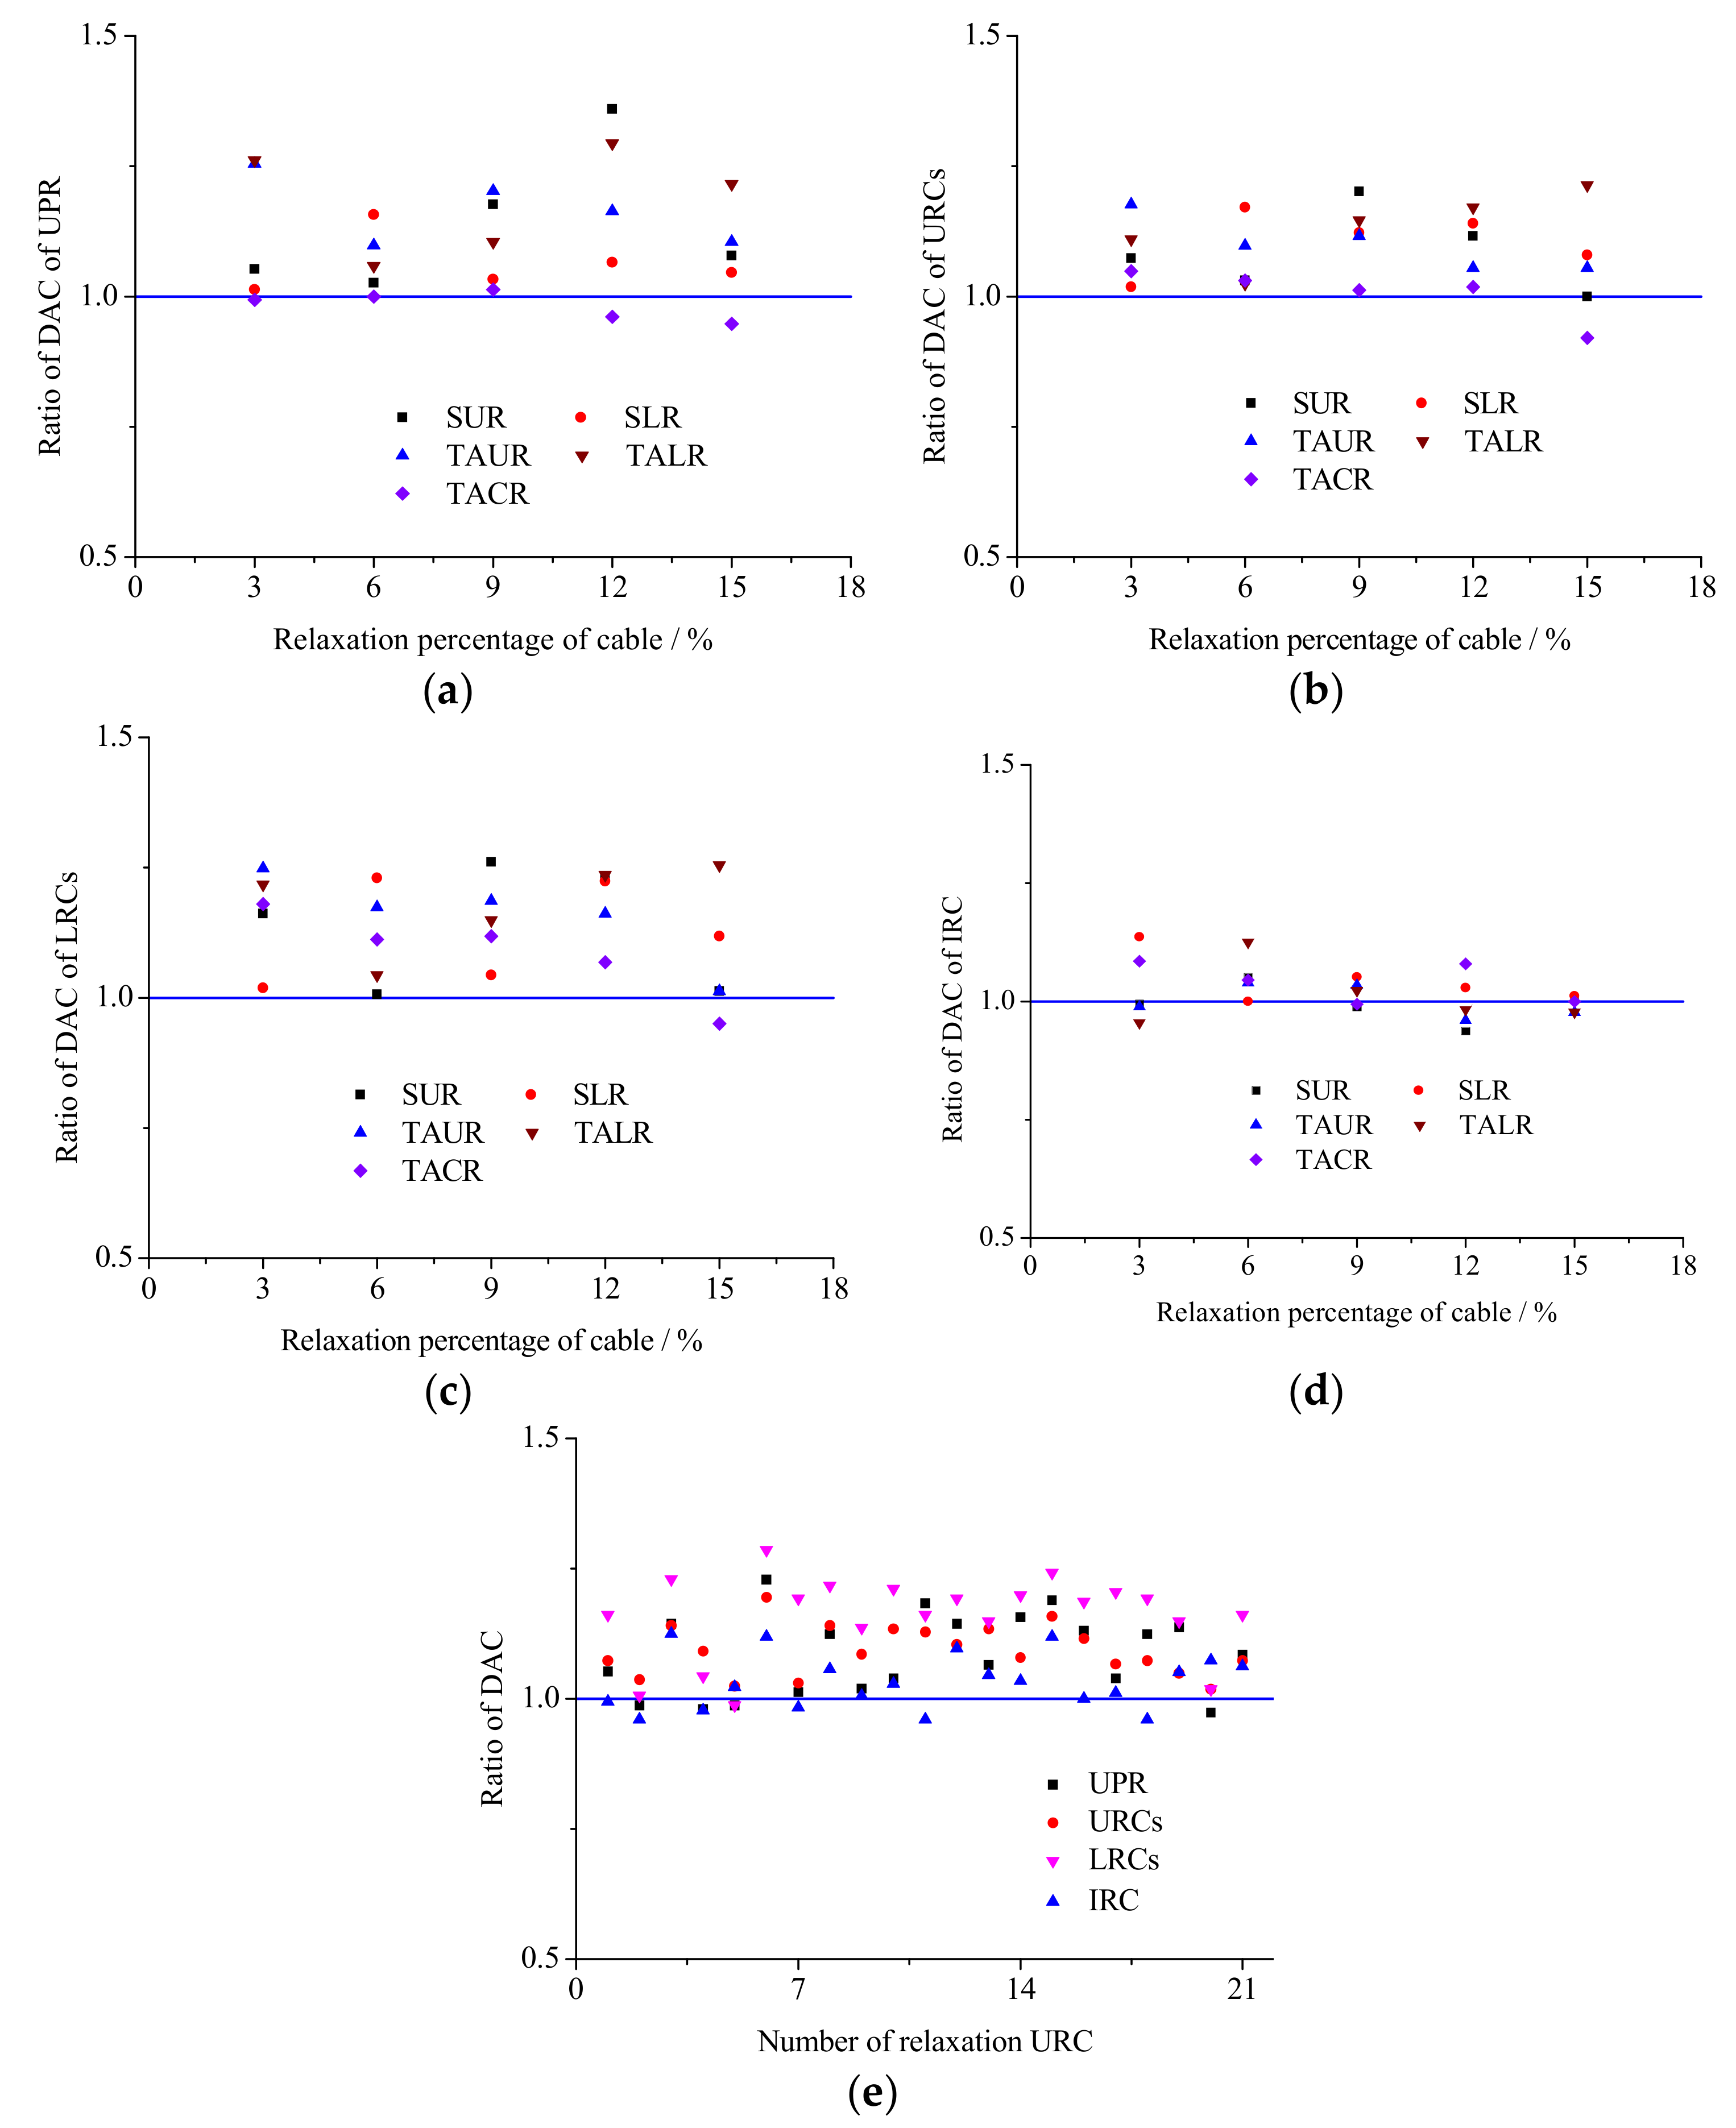
- Based on the influence on the structure, the slack cable can be divided into two adjacent cables, two adjacent URCs, two adjacent LRCs, single URC, and single LRC. The structural response is close to the different relaxation degrees, but the structure’s response is the greatest when the relaxation reaches 6%.
- (4)
- Structural vibration amplitudes are the largest, at wind direction angles of 54° and 135°. The structure is sensitive to wind load in these two areas.
- (5)
- The dynamic magnification coefficient of the structure will not increase with the increase of the cable system relaxation degree. The pressure distribution coefficient and the wind vibration coefficient determined by wind tunnel test should be multiplied by the s stress relaxation adjustment coefficient η to prevent the dynamic effect of amplification on the structure. The prestressed relaxation causes such an effect on the uneven prestress distribution due to construction.
- (6)
- The internal force and the displacement of different components inside of the structure change significantly because of the slack cables. Such components have obvious differences with the internal force and the displacement distribution without relaxation. Thus, the damage to the structural damage can be determined by monitoring the change in the internal force and the displacement.
Author Contributions
Funding
Conflicts of Interest
References
- Gu, M.; Lu, H.F. Wind loads and wind-induced vibration of membrane structures: State of the art. J. Vib. Shock 2006, 25, 10003835. [Google Scholar]
- Gluck, M.; Breuer, M.; Durst, F.; Halfmann, A.; Rank, E. Computation of wind-induced vibrations of flexible shells and membranous structures. J. Fluids Struct. 2003, 17, 739–765. [Google Scholar] [CrossRef]
- Zhang, Z.H.; Tamura, Y. Wind Tunnel Test on Cable Dome of Geiger Type. J. Comput. Nonlin. Dyn. 2007, 2, 218–224. [Google Scholar] [CrossRef]
- Wei, D.M.; Shui, Y. Nonlinear wind-induced vibration response of cable-membrane structures. J. South China Univ. Technol. (Nat. Sci. Ed.) 2008, 36, 1–6. [Google Scholar]
- Yang, Q.S.; Wu, Y.; Zhu, W.L. Experimental study on the interaction between membrane structures and wind environment. Earthq. Eng. Eng. Vib. 2010, 9, 523–532. [Google Scholar] [CrossRef]
- Rojratsirikul, P.; Wang, Z.; Gursul, I. Effect of pre-strain and excess length on unsteady fluid-structure interactions of membrane airfoils. J. Fluid Struct. 2010, 26, 359–376. [Google Scholar] [CrossRef]
- Kim, J.Y.; Yu, E.; Kim, D.Y.; Tamura, Y. Long-term monitoring of wind-induced responses of a large-span roof structure. J. Wind Eng. Ind. Aerodyn. 2011, 99, 955–963. [Google Scholar] [CrossRef]
- Michalski, A.; Kermel, P.D.; Haug, E.; Löhner, R.; Wüchner, R.; Bletzinger, K.-U. Validation of the computational fluid–structure interaction simulation at real-scale tests of a flexible 29 m umbrella in natural wind flow. J. Wind Eng. Ind. Aerodyn. 2011, 99, 400–413. [Google Scholar] [CrossRef]
- Zhou, Y.; Li, Y.Q.; Shen, Z.Y.; Wang, L.; Tamura, Y. Numerical analysis of added mass for open flat membrane vibrating in still air using the boundary element method. J. Wind Eng. Ind. Aerodyn. 2014, 131, 100–111. [Google Scholar] [CrossRef]
- Zhao, C.; Zhang, X.G.; Lv, W.P. Computer modeling on wind histories with spatial correlativity. Spat. Struct. (Chin.) 1996, 2, 21–25. [Google Scholar]
- Frey, G.; Carmichael, B.; Kavanaugh, J.; Mahmoodi, S.N. Dynamic Model and Simulation of Flag Vibrations Modeled as a Membrane. In Proceedings of the 7th Annual Dynamic Systems and Control Conference, San Antonio, TX, USA, 22–24 October 2014; Volume 46209, p. V003T53A001. [Google Scholar] [CrossRef]
- Wu, Y.; Chen, Z.Q.; Sun, X.Y. Research on the wind-induced aero-elastic response of closed-type saddle-shaped tensioned membrane models. J. Zhejiang Univ. Sci. A 2015, 16, 656–668. [Google Scholar] [CrossRef]
- Wood, J.N.; Breuer, M.; De Nayer, G. Experimental studies on the instantaneous fluid-structure interaction of an air-inflated flexible membrane in a turbulent flow. J. Fluids Struct. 2018, 80, 405–440. [Google Scholar] [CrossRef]
- Dutta, S.; Ghosh, S.; Inamdar, M. Optimisation of tensile membrane structures under uncertain wind loads using PCE and kriging based metamodels. Struct. Multidiscip. Optim. 2018, 57, 1149–1161. [Google Scholar] [CrossRef]
- Hao, C.X.; Liu, X.D.; Qian, J.H.; Tang, R.W.; Hu, Q.W. Cable Stress testing of the cable-membrane of the main stadium of Foshan Century Lotus Stadium during construction. In Proceedings of the 7th National Academic Conference on Modern Engineering Structures, Hangzhou, China, 20 July 2007; pp. 441–446. [Google Scholar]
- Firm, W.E. Wind Tunnel Test of China Foshan Stadium under Quasi-Static and Dynamic Design Load (Chinese); Guangdong Industrial Press: Foshan, China, 2004. [Google Scholar]
- Ministry of Housing and Urban-Rural Development (MOHURD). Load Code for the Design of Building Structures (Chinese): GB 50009-2012; China Architecture & Building Press: Beijing, China, 2012.
- Han, D.J.; Zeng, X.W. Report of the form-finding, static analysis and wind-induced vibration of the tensioned cable-membrane structure of the century lotus sports center in Foshan. In Proceedings of the Sixth World Congress on Computational Mechanics in conjunction with the Second Asian-Pacific Congress on Computational Mechanics, Guangzhou, China, 22 July 2005; pp. 347–351. [Google Scholar]
- Simiu, E.; Scanlan, R.H. Wind Effects on Structures; John Wiley & Sons: New York, NY, USA, 1986. [Google Scholar]
- Deodatis, G. Simulation of ergodic multivariate stochastic processes. J. Eng. Mech. 1996, 122, 778–787. [Google Scholar] [CrossRef]
- Cao, Z.; Xue, S.D.; Wang, X.S.; Liu, Y.C. Selection of earthquake waves and values of damping ratio for space structures in the aseismic analysis. Spat. Struct. 2008, 14, 3–8. [Google Scholar]
- Luo, J.J.; Han, D.J. Wind-induced response analysis of a large–span cable-membrane roof. China Civ. Eng. J. (Chin.) 2009, 42, 15–21. [Google Scholar]
- Wang, J.W.; Sun, W.B.; Chen, H.X. Wind-induced dynamic analysis of ring–shape tensile cable membrane structure. Spat. Struct. (Chin.) 2010, 16, 67–71. [Google Scholar]
- Uematsu, Y.; Watanabe, K.; Sasaki, A.; Yamada, M.; Hongo, T. Wind-induced dynamic response and resultant load estimation of a circular flat roof. J. Wind Eng. Ind. Aerodyn. 1999, 83, 251–261. [Google Scholar] [CrossRef]
- Uematsu, Y.; Yamada, M.; Sasaki, A. Wind-induced dynamic response and resultant load estimation for a flat long-span roof. J. Wind Eng. Ind. Aerodyn. 1996, 65, 155–166. [Google Scholar] [CrossRef]
- Lu, F.; Lou, W.J.; Sun, B.N. Wind-induced dynamic response and wind load factor for long-span flat roof structures. Eng. Mech. (Chin. Ed.) 2002, 19, 52–57. [Google Scholar]
- Wu, Y.; Yang, Q.S.; Shen, S.Z. Wind tunnel tests on the aeroelastic effect of wind-induced vibration of tension structures. Eng. Mech. (Chin. Ed.) 2008, 25, 8–15. [Google Scholar]
- Yang, Q.S.; Liu, R.X. On aerodynamic stability of membrane structures. Int. J. Space Struct. 2005, 20, 181–188. [Google Scholar] [CrossRef]


| Response of Bars | Load Condition | ||
|---|---|---|---|
| Symmetrical Wind | Asymmetrical Wind | ||
| Coefficient of dynamic amplification | Axial stress of URC | 1.42 | 1.49 |
| Displ. of URC | 1.64 | 1.60 | |
| Axial stress of LRCs | 1.51 | 1.68 | |
| Displ. of URC | 1.61 | 1.59 | |
| Axial stress of IRC | 1.49 | 1.64 | |
| Displ. of IRC | 1.76 | 1.97 | |
| Axial stress of UPR | 1.47 | 1.37 | |
| Displ. of UPR | 1.53 | 1.44 | |
| Axial stress of LPR | 1.42 | 1.39 | |
| Displ. of LPR | 1.46 | 1.37 | |
| Relaxation Conditions | Axial Stress of UPR [MPa] | Axial Stress of URCs [MPa] | Axial Stress of IRC [MPa] | Displ. of UPR [m] | Displ. of URC [m] | Displ. of IRC [m] | DAC of UPR | DAC of URC | DAC of IRC | ||||||
|---|---|---|---|---|---|---|---|---|---|---|---|---|---|---|---|
| Min | Max | Max | Min | Max | Min | Max | Min | Max | Min | Max | Min | ||||
| No relaxation | −139.82 | −138.87 | 423.22 | 391.07 | 431.14 | 413.96 | 0.085 | 0.083 | −0.175 | −0.164 | −1.044 | −1.036 | 1.53 | 1.64 | 1.76 |
| SUR | −140.44 | −130.23 | 464.82 | 262.01 | 431.03 | 420.17 | 0.092 | 0.037 | −0.254 | −0.134 | −1.127 | −1.034 | 1.61 | 1.76 | 1.75 |
| SLR | −143.11 | −136.27 | 423.79 | 369.98 | 444.55 | 425.33 | 0.090 | 0.081 | −0.178 | −0.116 | −1.044 | −0.967 | 1.55 | 1.67 | 2.00 |
| TAUR | −138.98 | −123.67 | 455.25 | 198.43 | 492.28 | 402.18 | 0.096 | 0.021 | −0.690 | −0.158 | −1.335 | −1.030 | 1.92 | 1.93 | 1.74 |
| TALR | −144.73 | −133.00 | 467.78 | 365.13 | 429.60 | 418.26 | 0.096 | 0.079 | −0.181 | −0.052 | −1.047 | −0.895 | 1.93 | 1.82 | 1.68 |
| TACR | −141.82 | −121.93 | 532.28 | 0.00 | 484.36 | 389.67 | 0.096 | 0.021 | −0.716 | −0.093 | −1.100 | −1.024 | 1.52 | 1.72 | 1.91 |
| Relaxation Degrees | Axial Stress of UPR [MPa] | Axial Stress of URCs [MPa] | Axial Stress of IRC [MPa] | Displ. of UPR [m] | Displ. of URCs [m] | Displ. of IRC [m] | DAC of UPR | DAC of URCs | DAC of IRC | ||||||
|---|---|---|---|---|---|---|---|---|---|---|---|---|---|---|---|
| Min | Max | Max | Min | Max | Min | Max | Min | Max | Min | Max | Min | ||||
| No relaxation | −139.82 | −138.87 | 423.22 | 391.07 | 431.14 | 413.96 | 0.085 | 0.083 | −0.175 | −0.164 | −1.044 | −1.036 | 1.53 | 1.64 | 1.76 |
| 3% | −141.82 | −121.93 | 532.28 | 0.000 | 484.36 | 389.67 | 0.096 | 0.021 | −0.716 | −0.093 | −1.100 | −1.024 | 1.52 | 1.72 | 1.91 |
| 6% | −129.45 | −118.32 | 460.32 | 80.42 | 512.88 | 397.85 | 0.093 | 0.043 | −0.851 | −0.150 | −1.191 | −1.010 | 1.53 | 1.69 | 1.84 |
| 9% | −123.91 | −78.78 | 978.26 | 169.64 | 465.18 | 380.22 | 0.087 | −0.051 | −0.787 | −0.210 | −1.101 | −1.002 | 1.55 | 1.66 | 1.75 |
| 12% | −147.04 | −117.99 | 530.67 | 0.000 | 474.52 | 378.53 | 0.099 | 0.007 | −0.503 | −0.149 | −1.100 | −1.027 | 1.47 | 1.67 | 1.90 |
| 15% | −141.43 | −132.69 | 464.93 | 342.83 | 430.81 | 414.09 | 0.092 | 0.045 | −0.214 | −0.078 | −1.053 | −1.034 | 1.45 | 1.51 | 1.76 |
| Number of Relaxation Cable | Axial Stress of UPR [MPa] | Axial Stress of URC [MPa] | Axial Stress of IRC [MPa] | Displ. of UPR [m] | Displ. of URC [m] | Displ. of IRC [m] | DAC of UPR | DAC of URC | DAC of IRC | ||||||
|---|---|---|---|---|---|---|---|---|---|---|---|---|---|---|---|
| Min | Max | Max | Min | Max | Min | Max | Min | Max | Min | Max | Min | ||||
| No relaxation | −139.82 | −138.87 | 423.22 | 391.07 | 431.14 | 413.96 | 0.085 | 0.083 | −0.175 | −0.164 | −1.044 | −1.036 | 1.53 | 1.64 | 1.76 |
| 1 | −140.44 | −130.23 | 464.82 | 262.01 | 431.03 | 420.17 | 0.092 | 0.037 | −0.254 | −0.134 | −1.127 | −1.034 | 1.61 | 1.76 | 1.75 |
| 2 | −141.56 | −135.90 | 437.68 | 246.57 | 445.14 | 421.95 | 0.098 | 0.044 | −0.198 | −0.133 | −1.130 | −1.043 | 1.51 | 1.70 | 1.69 |
| 3 | −142.70 | −137.15 | 443.92 | 217.11 | 443.02 | 422.29 | 0.098 | 0.045 | −0.190 | −0.128 | −1.130 | −1.043 | 1.75 | 1.87 | 1.98 |
| 4 | −142.03 | −134.03 | 429.35 | 268.85 | 441.06 | 416.48 | 0.097 | 0.040 | −0.217 | −0.121 | −1.118 | −1.042 | 1.5 | 1.79 | 1.72 |
| 5 | −143.05 | −130.52 | 443.03 | 298.75 | 439.59 | 425.61 | 0.095 | 0.046 | −0.195 | −0.079 | −1.143 | −1.038 | 1.51 | 1.68 | 1.80 |
| 6 | −148.71 | −113.56 | 434.50 | 236.93 | 469.23 | 386.09 | 0.105 | 0.014 | −0.450 | −0.112 | −1.123 | −1.039 | 1.88 | 1.96 | 1.97 |
| 7 | −145.44 | −119.77 | 479.44 | 307.60 | 482.75 | 419.97 | 0.111 | 0.026 | −0.151 | −0.679 | −1.163 | −1.023 | 1.55 | 1.69 | 1.73 |
| 8 | −140.44 | −132.32 | 445.08 | 278.42 | 431.15 | 420.54 | 0.095 | 0.039 | −0.238 | −0.129 | −1.121 | −1.039 | 1.72 | 1.87 | 1.86 |
| 9 | −140.74 | −134.29 | 429.62 | 281.73 | 446.85 | 417.49 | 0.096 | 0.041 | −0.239 | −0.141 | −1.127 | −1.042 | 1.56 | 1.78 | 1.77 |
| 10 | −140.69 | −133.45 | 442.00 | 274.99 | 445.49 | 416.58 | 0.096 | 0.040 | −0.235 | −0.144 | −1.127 | −1.042 | 1.59 | 1.86 | 1.81 |
| 11 | −141.87 | −133.09 | 429.12 | 249.35 | 435.37 | 419.29 | 0.095 | 0.041 | −0.221 | −0.115 | −1.125 | −1.035 | 1.81 | 1.85 | 1.69 |
| 12 | −142.55 | −137.34 | 438.87 | 244.13 | 444.81 | 422.46 | 0.097 | 0.046 | −0.227 | −0.130 | −1.127 | −1.043 | 1.75 | 1.81 | 1.93 |
| 13 | −142.69 | −137.42 | 438.61 | 244.01 | 444.45 | 422.82 | 0.098 | 0.046 | −0.223 | −0.130 | −1.126 | −1.043 | 1.63 | 1.86 | 1.84 |
| 14 | −171.53 | −112.67 | 471.00 | 0.00 | 576.38 | 410.98 | 0.148 | 0.052 | −1.165 | −0.035 | −1.301 | −1.015 | 1.71 | 1.77 | 1.82 |
| 15 | −160.92 | −127.32 | 445.09 | 210.46 | 502.13 | 423.29 | 0.122 | −0.009 | −0.515 | −0.044 | −1.187 | −1.032 | 1.82 | 1.90 | 1.97 |
| 16 | −159.00 | −134.92 | 461.59 | 223.41 | 477.94 | 414.56 | 0.257 | 0.009 | −0.338 | 0.336 | −1.107 | −1.035 | 1.73 | 1.83 | 1.76 |
| 17 | −143.10 | −131.07 | 440.86 | 286.25 | 444.66 | 429.95 | 0.095 | 0.046 | −0.192 | −0.081 | −1.143 | −1.037 | 1.59 | 1.75 | 1.78 |
| 18 | −142.07 | −134.16 | 433.47 | 269.95 | 435.98 | 420.46 | 0.097 | 0.042 | −0.206 | −0.120 | −1.120 | −1.041 | 1.72 | 1.76 | 1.69 |
| 19 | −141.58 | −136.14 | 426.96 | 284.40 | 448.15 | 419.41 | 0.098 | 0.044 | −0.231 | −0.136 | −1.127 | −1.043 | 1.74 | 1.72 | 1.85 |
| 20 | −142.49 | −136.91 | 427.86 | 243.89 | 446.08 | 420.84 | 0.098 | 0.045 | −0.228 | −0.134 | −1.131 | −1.043 | 1.49 | 1.67 | 1.89 |
| 21 | −140.36 | −131.63 | 443.63 | 269.70 | 434.24 | 420.15 | 0.093 | 0.038 | −0.249 | −0.132 | −1.126 | −1.036 | 1.66 | 1.76 | 1.87 |
| Components | Different Kinds of Cable Relaxation | Different Relaxation Location | ||
|---|---|---|---|---|
| Ratio of DAC of Bars | Ratio of DAC of Structure | Ratio of DAC of Bars | Ratio of DAC of Structure | |
| UPR | 1.107 | 1.087 | 1.086 | 1.093 |
| URC | 1.086 | 1.093 | ||
| LRC | 1.137 | 1.159 | ||
| IRC | 1.019 | 1.033 | ||
© 2020 by the authors. Licensee MDPI, Basel, Switzerland. This article is an open access article distributed under the terms and conditions of the Creative Commons Attribution (CC BY) license (http://creativecommons.org/licenses/by/4.0/).
Share and Cite
Huang, H.; Xian, Y.; Zhang, W.; Guo, M.; Yang, K.; Xi, K. Analysis of Wind-Induced Vibration of a Spoke-Wise Cable–Membrane Structure. J. Mar. Sci. Eng. 2020, 8, 603. https://doi.org/10.3390/jmse8080603
Huang H, Xian Y, Zhang W, Guo M, Yang K, Xi K. Analysis of Wind-Induced Vibration of a Spoke-Wise Cable–Membrane Structure. Journal of Marine Science and Engineering. 2020; 8(8):603. https://doi.org/10.3390/jmse8080603
Chicago/Turabian StyleHuang, Hua, Yaoqiang Xian, Wei Zhang, Mengxue Guo, Kun Yang, and Kailin Xi. 2020. "Analysis of Wind-Induced Vibration of a Spoke-Wise Cable–Membrane Structure" Journal of Marine Science and Engineering 8, no. 8: 603. https://doi.org/10.3390/jmse8080603
APA StyleHuang, H., Xian, Y., Zhang, W., Guo, M., Yang, K., & Xi, K. (2020). Analysis of Wind-Induced Vibration of a Spoke-Wise Cable–Membrane Structure. Journal of Marine Science and Engineering, 8(8), 603. https://doi.org/10.3390/jmse8080603