Article

Holocene Hurricane Deposits Eroded as Coastal Barriers from Andesite Sea Cliffs at Puerto Escondido (Baja California Sur, Mexico)

by
Markes E. Johnson
1,*,
Erlend M. Johnson
2,
Rigoberto Guardado-France
3 and
Jorge Ledesma-Vázquez
3
1
Geosciences Department, Williams College, Williamstown, MA 01267, USA
2
Anthropology Department, Tulane University, New Orleans, LA 70018, USA
3
Facultad de Ciencias Marinas, Universidad Autónoma de Baja California, Ensenada 22800, Baja California, Mexico
*
Author to whom correspondence should be addressed.
J. Mar. Sci. Eng. 2020, 8(2), 75; https://doi.org/10.3390/jmse8020075
Submission received: 1 November 2019 / Revised: 21 January 2020 / Accepted: 22 January 2020 / Published: 24 January 2020

Abstract

:
Previous studies on the role of hurricanes in Mexico’s Gulf of California examined coastal boulder deposits (CBDs) eroded from limestone and rhyolite sea cliffs. Sedimentary and volcanic in origin, these lithotypes are less extensively expressed as rocky shores than others in the overall distribution of gulf shores. Andesite that accumulated as serial volcanic flows during the Miocene constitutes by far the region’s most pervasive rocky shores. Here, we define a subgroup of structures called barrier boulder deposits (BBDs) that close off lagoons as a result of lateral transport from adjacent rocky shores subject to recurrent storm erosion. Hidden Harbor (Puerto Escondido) is the most famous natural harbor in all of Baja California. Accessed from a single narrow entrance, it is commodious in size (2.3 km2) and fully sheltered by outer andesite hills linked by two natural barriers. The average weight of embedded boulders in a succession of six samples tallied over a combined distance of 710 m ranges between 74 and 197 kg calculated on the basis of boulder volume and the specific gravity of andesite. A mathematical formula is utilized to estimate the wave height necessary to transport large boulders from their source. Average wave height interpreted by this method varies between 4.1 and 4.6 m. Input from fossil deposits and physical geology related to fault trends is applied to reconstruct coastal evolution from a more open coastal scenario during the Late Pleistocene 125,000 years ago to lagoon closure in Holocene time.

1. Introduction

Based on a coastal survey using satellite imagery [1], volcanic flows of Miocene age that accrued as andesite were found to account for more than 700 km of peninsular and island shores in the western Gulf of California. By far, andesite is the most common rock type, accounting for 24% of all shores including sand beaches. Given the dominant occurrence of these rocks, it is pertinent to ask how it responds to forces of physical erosion. This contribution is the third in a series to examine rocky shores in the context large-scale boulder deposits attributed to storms of hurricane intensity that impacted the peninsular inner shores of Mexico’s Baja California. The strength and behavior of recent storms, such as Hurricane Odile in 2014, follow a consistent pattern that allows predictions to be tested as to the specific vulnerability of different rock types. Previous work focused on a coastal boulder deposit (CBD) with metric-ton blocks of Pliocene limestone torn from the outer margin of a 12-m marine terrace on Isla del Carmen in the Gulf of California [2]. A subsequent study examined similar-size boulders pried from a rhyolite coast not far to the north at Ensenada Almeja [3]. Limestone rocky shores amount to only 7.5% of shores in the western Gulf of California and rhyolite is so uncommon, it was not part of our original satellite reconnaissance [1].
Here, we consider the natural setting at Puerto Escondido (Spanish for Hidden Harbor), which has a restricted entrance but opens to a large lagoon otherwise entirely surrounded by andesite foothills related to the rugged Sierra de la Giganta. The inner lagoon is large enough to accommodate a small armada and the working harbor has been modernized to accommodate anchorage for visiting yachts and sailboats as well as larger vessels that call at the main wharf just inside the entrance. Puerto Escondido is renowned for the description by Steinbeck and Ricketts [4] during their epic voyage to the Gulf of California aboard the Western Flyer in 1940. Marine biologist, Ed Ricketts, who in 1939 published a ground-breaking treatise on the intertidal relationships of marine invertebrates along the Pacific shores of the United States [5], planned the expedition to expand his observations to the biologically rich but then poorly studied Sea of Cortez. His friend, author John Steinbeck, called the Hidden Harbor a place of magic and wrote: “If one wished to design a secret personal bay, one would probably build something very like this little harbor.”
The goal of this paper is to apply geological and geomorphological insights to explain why Puerto Escondido is so extraordinary as a natural harbor. Paleontological data, as well as the location of critical fault lines, are used to show how the coast was more open to marine circulation during the last interglacial epoch in the Late Pleistocene. The emplacement of two major barriers fixed among outer hills is the primary focus of analysis looking at boulder shapes and their variation in size and calculated weight. Estimation of wave heights necessary to transport large boulders serves as a proxy to gauge recurrent storm intensity. Lastly, geomorphologic modeling provides a means to consider the degree to which rocky-shore retreat has occurred over Holocene time in a consistently subtropical setting and the scale of erosion necessary to provide the raw materials for barrier construction.

2. Geographical and Geological Setting

Situated between the Mexican mainland and the Baja California peninsula, the Gulf of California is a marginal sea with a semi-enclosed area amounting to 210,000 km2 arrayed along a NW–SE axis stretching for 1100 km (Figure 1a). Central basins within the gulf are semi-oceanic in depth, exceeding 3200 m. The southern opening to the Pacific Ocean is 180 km wide and allows for a range of oceanographic phenomena [6] that in turn stimulates seasonal upwelling and nutrient fertilization linked to a high degree of biological productivity and species diversity [7]. More than a dozen tropical storms typically form off the cost of Acapulco at approximately 15° N latitude during the annual hurricane season, but most turn outward to the northwest before reaching the southern tip of the Baja California peninsula at 23° N Latitude [8]. Major storms are known to enter the Gulf of California—most recently, Hurricane Odile in September 2015 [9] and Hurricane Lorena in September 2019.
Puerto Escondido is located 24 km south from the town of Loreto in Baja California Sur on the Gulf of California (Figure 1b, locality 1). A small outer harbor is linked to a huge inner harbor by a narrow entrance on the south side. Viewed from hills on the inland western side (Figure 2), the harbor is notable for a pair of distinct barriers that form robust sea walls anchored to an intermediate islet. At their opposite ends, the pair of barriers are linked to the bedrock on the peninsula mainland to the north and a large island to the south that also guards the entrance to the inner harbor. In concert, the combination of natural barriers and fixed bedrock effectively seals off the lagoon from outside disturbances in the open Gulf of California.
From a geological perspective, the history of faulting in western Mexico is intimately related to the origins of the Gulf of California. Tectonic separation of the Baja California peninsula from the mainland occurred due to crustal extension between 13 and 3.5 million years ago, with N–S trending faults related to Basin and Range development in western North America. Thereafter, a change in tectonic regime led to transtensional faulting with the transfer of the peninsula to the Pacific Tectonic Plate and its ongoing migration to the NW [7]. During the earlier phase, faults were oriented mainly N–S and the peninsular coast underwent major uplift west of the Loreto rift segment between 5.6 and 3.2 million years ago, amounting to 100s of meters in the Sierra de la Gigante [10]. Many of the 40 named islands in the gulf conform to fault blocks subjected to uplift as structural horsts [11]. Subsequent strike-slip faulting is oriented NW–SE perpendicular to a series of step-like spreading centers located within deep basins through the Gulf of California. A major clue as to the tectonic history of the study area around Puerto Escondido is the placement of faults registered in the landscape.

3. Materials and Methods

3.1. Data Collection

Data on topography, basin size, watershed boundaries and fault orientations are derived from a portion of the Mexican federal government map for the Juncalito quadrangle (G12C19). Drawn at a scale of 1:50,000, the greater map was issued by the Instituto Nacional de Estadistica Geografia e Informatica in 1982. Contour intervals from the government map were scanned and traced to yield a project map retaining an accuracy at 20 m intervals. The 1982 version of the map was updated to show the main details of improved harbor infrastructure since that time.
Puerto Escondido was visited on 24 and 25 April 2019, when the field data for this study were collected based foremost on a sample of 100 boulders divided equally among four transects along the upper tide line of the northern Coastal Barrier Deposit (CBD) and another 50 boulders along the southern CBD. The boundary is denoted by a prominent color due to marine algae. The definition for a boulder adapted in this exercise is that of Wentworth (1922) for an erosional clast equal or greater than 256 mm in diameter [12]. There exists no proposed upper limit in size for this category.
Collection of data on boulder size followed procedures graphically codified in Figure 3. A Brunton compass and meter tape were used to lay out transects in 50 m segments. Consistent with previous studies [1,2], the largest 25 boulders were measured manually in each transect with boulder centers spaced from 1 to 1.5 m apart. Each boulder required three measurements along principle axes (long a, intermediate b and short c). Triangular plots were employed to demonstrate variations in boulder shape, following the practice of Sneed and Folk (1958) for river pebbles [13]. Data regarding the maximum and intermediate lengths perpendicular to one another from individual boulders were plotted in bar graphs to show potential shifts in size from one transect to the next. A representative cobble of andesite was collected from the northern barrier for laboratory treatment at Williams College, where it was weighed, and its volume determined as a function of equal displacement when submerged in a beaker of water. Prior to immersion, the rock was water-proofed by spraying it with Thompson’s Water Seal TM (The Thompson’s Co, Cleveland, OH, USA).

3.2. Hydraulic Model

With determination of specific gravity based on laboratory testing for volume and weight, a hydraulic model may be applied to predict the energy needed to transport larger andesite blocks from a rocky shoreline to a barrier deposit as a function of wave impact. Andesite is a volcanic rock that forms from surface flows with variable thicknesses and a propensity to vertical fractures. These factors control the size and general shape of blocks loosened in the cliff face. Herein, the formula used to estimate the magnitude of storm waves applied to joint-bounded boulders is taken from equation 36 in the work of Nott [14]:
H s = ( P s P w / P w ) a C 1
where Hs = height of the storm wave at breaking point; Ps = density of the boulder (tons/m3 or g/cm3) Pw = density of water at 1.02 g/mL; a = length of boulder on long axis in cm; and C1 = lift coefficient (=0.178).

4. Results

4.1. Topographic Base Map

The base map adapted for use in this project treats an area of 25 km2 (Figure 4). A small outer harbor open to the south occupies an area of 0.5 km2. To one side of the outer harbor, the mouth (La Bocana) forms a 50-m wide entrance to a much larger inner harbor covering 2.3 km2. The narrow connection between outer and inner harbors admits tidal flux but resists severe weather arriving from all directions. Hills surrounding the inner harbor inland to the west exhibit lower topography with elevations ranging between 100 and 160 m above sea level. The outer eastern edge of the harbor complex is formed by a linear front stretching 4 km from NW to SE consisting of two hills (Cerro El Chino and Cerro La Enfermería) connected to an un-named islet by barriers #1 and #2 (Figure 4). The islet rises to an elevation exceeding 80 m above sea level, whereas bedrock on the neighboring hills reaches 120 and 180 m, respectively. Formed by andesite pebbles, cobbles, and boulders, the two natural breakwaters are the most vulnerable spots in the outer defense of the main harbor. The longer northern barrier extends for 250 m, whereas the shorter southern barrier is 140 m in length. On average, barrier width amounts to 30 m, with a mid-line 2.75 m above mean sea level. On close inspection, the inner west-facing edges of the barriers drop off abruptly into the enclosed lagoon. The outer east-facing margins are ramp-like in configuration extending at a low angle into the water.

4.2. Paleontological Data from the Western Hills

Described here for the first time, a key fossil deposit occurs in the western hills above the inner harbor at Puerto Escondido. Approximately one hectare in area (Figure 5a), the deposit is comparable to Pleistocene shell drapes found on 12-m marine terraces along of the peninsular gulf coast [15]. Here, the shell drape sits 45 m above present sea level covering the topographic saddle between hills separating the harbor lagoon on one side and Bahía Juncalito to the north (Figure 4). Loose shells in the deposit correlate with the last interglacial epoch 125,000 years ago, when sea level worldwide was 6 m higher than today based on comparisons with marine deposits from islands regarded as tectonically stable [16,17]. A precise radiometric date is not possible, because datable Porites corals are not found at this locality. For the most part, the Puerto Escondido drape consists of white-bleached and abundant shells from the clam Chione californiensis—all of which are disarticulated as separate valves. Rare, but easy to spot within the mix is a small oyster (Ostrea fischeri), also known to encrust rocks in an intertidal environment. In a single sample covering 16 dm2, approximately 75 valves of the dominant Chione clam litter the surface (Figure 5b). Tested laterally, the deposit is rarely more than 15 cm in thickness.
The tally features whole (unbroken) valves, although fragmented shells also are present. From the sample, there is scarcely any evidence for other species of marine mollusks. The operculum of a marine gastropod (Turbo fluctuosus) is small and easy to overlook. That particular species is diagnostic for a herbiverous gastropod typically found living in an intertidal setting, today. Another shell hidden in the array is a predatory gastropod (Murex elenensis), also found today living in the intertidal zone where it feeds on other mollusks and barnacles. The Turbo utilizes a hard mouthpiece called a radula like a file to scrape off marine algae critical to its diet, whereas the Murex uses a similar mouth device to bore a hole through the shells of its prey to gain access for feeding. Larger shells are widely scattered around the deposit but few in number. They include the turkey shell (Cardita megastrophica), bittersweet shell (Glycymeris maculate), cholate shell (Megapitaria squalida), cockle shell (Trachycardium panamense), and rock oyster (Spondylus calcifer). The overall species list requires some effort to assemble, because these larger shells represent a clear minority within the shell assemblage. All are represented by extant species living in the Gulf of California today [18]. The fossil shell drape is observed to occur off to one side of a fault that extends southward through a narrow valley from Bahía Juncalito. Considering that shell drapes of this reputed age from marine terraces elsewhere typically occur 12 m above sea level [15], tectonic uplift of the hills around Puerto Escondido represents a local anomaly some 32 m above normal. Proximity to the master Loreto fault and massive uplift of the nearby Sierra de la Gigante [10] account for this discrepancy.
The original work by Steinbeck and Ricketts [4] includes a detailed accounting of marine life both within the inner harbor and the outer harbor. These local biological data make a useful contrast with the paleontological data. The Brown Cucumber (Isostichopus fusca), a holothurian typically 15 cm in length, was found to occupy the inner harbor in a population numbering in the hundreds. Sand flats on the west side of the inner harbor appeared to be sterile. In contrast, one of the richest collecting stations of the entire expedition was reported from the outer harbor, where tidal currents were strongest at the entrance. A diverse biota was recorded to include sponges, tunicates, chitons, limpets, bivalves, snails, hermit crabs, as well as numerous species of sea cucumbers and starfish.

4.3. Sample Density Calculation

Specific gravity is a precise physical property that compares the density of an object to that of one cubic centimeter of water. One of the diagnostic characteristics of all naturally occurring minerals is defined by a known specific gravity. Because the composition of igneous rocks is variable, depending on the ratio of component minerals, the specific gravity of a particular class of igneous rocks like granite, rhyolite, or andesite will vary from region to region. The andesite sample from Puerto Escondido collected for laboratory analysis was a single cobble determined to weigh 575 g. After treatment to make the sample water-tight, the cobble was submerged in a wide-mouth, graduated beaker partially filled with distilled water. The volume of water displaced through this operation amounted to 225 mL. Dividing mass by volume yielded a density of 2.55 for the andesite sample, which means it was found to be 2.55 times as dense as water. The laboratory result was subsequently applied uniformly to all further calculations using the formula cited in the methods section, above. For comparison, the specific gravity of limestone from our earlier study at nearby Isla del Carmen (Figure 1b, locality 2) was determined to be 1.86 [2] and the banded rhyolite from our study at Ensenada Almeja (Figure 1b, locality 3) was determined to be 2.16 [3].

4.4. Placement of Transects and Analysis of Boulder Shapes

The modern inter-tidal zone is visible on the exposed outer margin of the two barriers by boulders tinted light green in color with the growth of filamentous algae. Contrast with the clean supratidal zone is clearly observed looking to the NW on barrier #1 with the sea cliffs of Cerro El Chino in the background (Figure 6a). All transects in this study were set along this boundary at the top of the intertidal zone. In the opposite direction, the view shows placement of the meter tape with the un-named islet in the distance to the SE (Figure 6b).
It is worthy of note that both Cerro El Chino and the un-named islet exhibit steep sea cliffs where erosion resulted in significant coastal retreat. The effect is apparent in the asymmetry of the outer hills and related islet as registered on the topographic map (Figure 4). A view from the middle of barrier #1 looking SW shows a characteristic mixture of pebbles, cobbles, and boulders entrained in the natural breakwater (Figure 6b). Looking eastward (Figure 6c), the meter tape is extended in front of the figure and the larger boulders in the field of view fall along the boundary between the darker upper inter-tidal zone and the normal supratidal zone. Much the same mixture of eroded cobbles and boulders is visible in the shallow water behind the figure. The larger boulders are typically 1 m in maximum diameter.
Raw data on boulder size in three dimensions collected from four consecutive transects each—50 m in length—are available in Table 1, Table 2, Table 3 and Table 4. Data points representing individual boulders grouped by transect are plotted on a set of Sneed-Folk triangular diagrams (Figure 7a–d), showing the actual variation in shapes. Those points clustered nearest to the core of the diagrams are most faithful to an average value with somewhat equidimensional axes in three directions. Only very seldom do points for these boulders appear in the upper-most triangle, which signifies a cube-shaped endpoint. The vast majority falls within the central part of the two tiers beneath the top triangle. However, the overall trend among those points grouped from different transects trace a similar pattern angled toward the lower right corner of the diagrams. No points are plotted in the lower left tier in any of the diagrams, but a few occur in the lower right tier most notably in Figure 7b,c. The repetitive pattern in these plots indicates a tendency toward boulders that are oblong in shape. Although the trends in shape are similar among the four samples from barrier #1, the plots have no bearing on variations in boulder size.
Comparable data from barrier #2 collected along two consecutive transects of 50 m each are registered in Table 5 and Table 6. Individual boulders from the upper intertidal zone of barrier #2 are shown by data points plotted in a pair of Sneed-Folk triangular diagrams. The trends expressed in Figure 8a,b are similar both to one another, as well as to those found in Figure 7a–d. That is, the overprint of a common pattern immerges in which the constituent boulders entrained in both barriers trend toward shapes that are more elongated and not at all plate-shaped.

4.5. Analysis of Boulder Sizes

Variations in boulder size as a function of maximum and intermediate length drawn from the data sets for barrier #1 (Table 1, Table 2, Table 3 and Table 4) are plotted separately for each of four transects using bar graphs. In this case, the stacked succession of graphs in Figure 9a–d show that the extreme outlier in maximum boulder size occurs in the first transect nearest the sea cliffs on Cerro El Chino. Boulders in the size class between 41 and 55 cm in diameter become more abundant and those in the size class between 56 and 70 cm in diameter are fewer in number. Otherwise, the size distributions remain fairly consistent from transect 1b through transect 1d. However, a deviation signaling a minor reversal in the size class between 71 and 85 cm appears in a comparison of Figure 9c,d. Such a reversal could imply a change in the direction of boulder source coming from the intermediate islet to the south. The numbers involved are small.
Boulder sizes along the intermediate axis from transects 1a through 1d are plotted in the stacked bar graphs from Figure 9e–h. Not surprisingly, the outlier in extreme length is found in Figure 8e representing the transect nearest the sea cliffs on Cerro El Chino. Otherwise, boulders in the size class between 26 and 40 cm are fairly consistent in number through the four transects. Data comparing the relative frequency of boulders in different size classes from barrier #2 are plotted as bar graphs in Figure 10a,b for the long axis and Figure 10c,d for the intermediate axis. Differences between the two samples are few. Most noticeable is the diminishment of boulders in the size class between 71 and 85 cm from transect 2a to 2b in regard to length across the long axis. Otherwise, apparent differences in size variation tend to be minimal. Again, a minor deviation appears in close comparison among Figure 9f–h, with particular reference to the size class between 41 and 55 cm. Moreover, a single large boulder in the size class between 56 and 70 cm is re-established.

4.6. Estimation of Wave Heights

A summary of key data is provided (Table 7), pertaining to average boulder size and maximum boulder size from the four transects in barrier #1 and two transects in barrier #2 as correlated with weight calculated on the basis of specific gravity for andesite. These data are applied to estimate the wave heights required to transport boulders from the bedrock source in sea cliffs to their resting place embedded in the natural breakwaters. The estimated wave height needed to move the largest bolder encountered in Transect 1a amounts to 7 m, although the average computed for the 25 boulders in that sample amounts to 6.3 m. Average boulder size generally declines through the four transects from barrier #1, as does the average wave height estimated to move those boulders. Regarding barrier #2, the average boulder size declines from transect 2a to 2b and so does the average wave height estimated to move those boulders. However, there is no difference between the largest boulders from the two transects with respect to maximum size and estimated wave height required to shift those boulders.

4.7. Implications of Geomorphologic Modeling

The extent of topographic asymmetry across the outer bulwark of lands fringing Puerto Escondido (Figure 4) invites geomorphologic modeling aimed at accounting for the amount of rock volume lost due to coastal recession. This exercise targets the un-named islet between barriers #1 and #2, where the object’s shape is relatively small and simple. Inherent in the model is the assumption that a body of bedrock with uniform composition starts out having more balanced proportions at the commencement of physical erosion. Three stages are depicted graphically in the model (Figure 11). First, the islet’s present-day topography is laid out on a regular grid and a diagonal line is drawn such that the asymmetry is segregated to one side (Figure 11a). The area within each successive line of topography is estimated separately and thereafter, volume may be calculated through addition in discrete topographic intervals much like adding layers in a tiered wedding cake. Following this procedure, the bulk volume of the andesite islet is found to be roughly 13.85 million cubic meters. In stage 2 (Figure 11b), those topographic lines with the closest spacing are erased. In stage 3 (Figure 11c), the size of a former islet is reconstructed by redrawing topographic lines as more evenly spaced. Thereafter, the same procedure may be followed to arrive at the bulk volume of the enlarged islet. In this way, the former islet is found to have started with a bulk volume of 19.25 million cubic meters. Subtracting present-day volume from the reconstituted volume, the original islet is argued to have lost 5.4 million cubic meters. That amount is crudely equivalent to 25% of the islet’s former volume due to an imbalance of coastal erosion on its exposed seaward flank.
It is essential to point out that the dividing line applied in the model (Figure 11a–c) is not a fault line. However, a hidden fault line now underwater is projected over a distance of 4 km along the outer coast but also notably parallel to the inland valley fault on the west side of Puerto Escondido (Figure 4). Separate calculations on the volume of unconsolidated materials in the two barriers is based on the length of each structure, its average width, and depth. The last is problematic to appraise but, using an assumed value of 5.5 m, can be no greater than the maximum depth of the lagoon behind. Hence, the contents entrained in the longer barrier #1 may amount to 42.5 million cubic meters. The shorter barrier #2 holds no less than 23 million cubic meters of transported pebbles, cobbles, and boulders. In effect, the barriers that insure the sheltered inner harbor at Puerto Escondido might be removed and restored many times over based on the volume of solid bedrock deleted by coastal erosion along an original fault scarp now significantly recessed.

5. Discussion

5.1. Time Constraints on Barrier Origin

Relationships drawn from paleontological and geological evidence place time limitations on the origin of the two barriers crucial to the maintenance of shelter at Puerto Escondido. Upper Pleistocene deposits denoted by a shell drape over a sizable area in the hills west of the inner harbor (Figure 4) confirm that normal seawater circulated to that spot approximately 125,000 years ago during the last interglacial epoch. Fossil mollusks including species such as the dominant Chione californiensis and less abundant Turbo fluctuosus that still live in the Gulf of California today [18], are reliably taken as evidence for intertidal conditions at that locality. Sea level stood approximately 6 m higher compared to now [16,17], but the present elevation of the shell drape also reflects additional tectonic uplift. Higher global sea level probably enhanced marine circulation at this spot. Moreover, emplacement of the Upper Pleistocene deposit must have occurred prior to development of barriers #1 and #2. The fault traced through the narrow valley from Bahía Juncalito indicates that local uplift boosted the shell drape to a higher elevation than typically found in coeval shell drapes on 12-m terraces many places elsewhere along peninsular gulf shores [15]. In fact, the nearest expression of marine terraces cut in andesite bedrock occurs within sight of Puerto Escondido only 7 km across the Carmen Passage at the southern end of Isla del Carmen (Figure 12).
No traces of marine terraces are found along the outer shores at Puerto Escondido facing Isla del Carmen. Given the amount of coastal retreat implicated by the geomorphological model, such terraces may have existed but were entirely erased by coastal erosion. If true, the earliest development of barriers #1 and #2 occurred after the end of the Pleistocene in Holocene time. However, the physical juxtaposition on opposite sides of the Carmen Passage raises the question why marine terraces survived on neighboring Isla del Carmen but not the outer coast at Puerto Escondido? The answer likely lies in the principle sources of coastal erosion still taking place in the Gulf of California, today.

5.2. Energy Sources Affecting Barrier Development

As discussed in our earlier work [1,2], the potential range of dynamic influences capable of shore erosion in the Gulf of California includes tidal action, long-shore currents related to strong seasonal winds, alleged tsunamis, and hurricanes. Tidal influence is especially strong in the far northern part of the gulf, where maximum amplitudes of 12 m are recorded. The tidal range around the central gulf is far less, approximately 2.75 m [19]. Tides of this magnitude transport coarse sand, but have little or no effect on rocky shores. South-directed sea swells with an amplitude of 2 m and wavelength of 10 m are not unusual during episodes of strong winds in the Carmen Passage that play out episodically between November and May [6,7]. Such prevailing winter winds stimulate long-shore currents that flow parallel to the gulf shores, or otherwise result in wave refraction around obstructing islands or headlands [20]. The energy generated by such currents is capable of moving pebbles and smaller cobbles.
Sea storms of lesser intensity are expected to shift sand, pebbles, and even cobbles entrained in a natural barrier. In part, the overall decrease in boulder size from north to south from transect 1a to 1c and from transect 2a to 2b is related to littoral drift especially during the winter season when a strong north-south wind is common. It can be argued, however, that only those episodic storms of hurricane intensity generate sufficient energy to shift large boulders close to a metric ton in weight. During the Pacific Ocean hurricane season between the months of May and November, between 25 and 30 tropical depression originate off the southwest coast of mainland Mexico [8], but few diverge from an outward path to enter the Gulf of California. The incidence of hurricane activity in the gulf region increases every 6 to 8 years during El Niño events. Hurricane Odile in September 2014, for example, was filmed in action as it pounded the rocky coast near the Almeja CBD north of Loreto with waves that impacted sea cliffs at a height 8 m above normal [2]. Clocking wind speeds of 113 km/hr by the time it reached that far into the Gulf of California, wind bands rotating counter clockwise were strong enough to generate wave surge that lashed the coast initially from east to west. As the storm migrated northward, wind direction and wave surge shifted more to a direction from northeast to southwest. Such a pattern fits the predicted scenario of rocky-shore erosion and transfer of large boulders to the barrier seawalls at Puerto Escondido. In particular, oblong blocks of andesite already fallen from the unstable sea cliffs at Cerro El Chino and the un-named islet between barriers #1 and #2 would be pushed southward and eventually entrained in those barriers (Figure 9 and Figure 10). Marine terraces on SW Carmen (Figure 12) would be sheltered from west-moving storm bands, and therefore avoid excessive erosion.
In theory, a large tsunami with a run-up of several meters would be energetic enough to breach the barriers protecting Puerto Escondido. In addition, the return outwash of coastal sediments dislodged during a tsunami should be transported seaward. However, the probability that a tsunami struck anywhere within the Gulf of California during the Holocene is nil, even though a recent interpretation of sedimentary deposits by McCloskey et al. (2015) for the lower Gulf of California [21] suggested a geological framework and seismic mechanisms for its interpretation. In the Alfonso Basin off La Paz, Gorsline et al. (2000) described only minor discharges from tributary coastal canyons that carried a high proportion of coarse-grained sand trapped on marine shelves, but blocked from supplying turbidites at a volume of a basin-wide magnitude [22]. Hence, those sediments reaching the basin floor probably were produced by seismically generated slope failures of silty clay deposits. The distribution of the dated turbidites and a slip face in a box core from the landward slope, indicate a source on the landward depositional slope of the fault-bounded basin. Comparable discontinuities of the same age also are reported from the east side of the gulf in the Guaymas area farther north [22].
Most earthquakes in the lower Gulf of California are generated by transform faults [23]. Fletcher and Mungia (2000) indicate that such a level of seismicity falls along different strands in a major system of normal faults extending at least 300 km along strike to define the western limit of the Gulf Extensional Province [24]. The dominant normal faults controlled distribution of Neogene basins active during middle to late Miocene times. Structural analysis of secondary faults in the southern gulf segment reveals that fault populations are Pliocene to Holocene in age and represented by mixed normal and dextral-normal faults with a bulk extension direction of west-northwest–east-southeast [25]. From the perspective of regional tectonics summarized above, it is evident that a major earthquake is not responsible for the presence of turbidites within the Alfonso basin at least during recent times.
Based on the experience of the junior author (J.L.-V.), the extraneous evidence shown by McCloskey et al. (2015, their Figure 5c) relates to a kitchen midden and not a tsunami deposit. Tsunami events are well documented outside the Gulf of California far to the south on the Mexican mainland at Jalisco [26], but such events result from deep-seated earthquakes (magnitude 7.7 or greater) associated with an active subduction zone where the Rivera lithospheric plate meets the continental mainland.

5.3. Comparisons with Other Coastal Boulder Deposits

Our previous contributions on Holocene boulder accumulations within Mexico’s Gulf of California conform to the normal definition of coastal boulder deposits, where CBDs occur either at the top of sea cliffs or next to sea cliffs with well-developed bedrock stratification and jointing that corresponds to the dimensions of rocks loosened by wave impact. Metric-ton blocks of Pliocene limestone sit atop 12 m high cliffs on Isla del Carmen (Figure 1b, locality 2) from which they were peeled away [2]. Similar-size rhyolite boulders at Ensenada Almeja (Figure 1b, locality 3) occur at sea level adjacent to the sea cliffs from which they were extracted [3]. Elsewhere, major CBDs occur atop sea cliffs in northern France [27] and western Ireland [28,29]. Mega-boulders left high above sea level but close to the parent bed rock from which they were eroded also are known from the Bahamas and Bermuda [30,31]. It is debated to what extent super-waves and hurricanes are responsible for these CBDs, fueling ongoing controversy over the growing threat of global warming. In the case of giant blocks derived from low limestone cliffs on Calicoan Island in the Philippines [32], the run-up of waves exceeding 15 m inland is linked directly to the impact of Super Typhoon Haiyan in November 2013. A related but somewhat different phenomenon concerns the detachment of large boulders from the seafloor and onshore transferal to low rocky shores. The recent study by Biolchi et al. (2019) fits this category in relation to movement of limestone boulders in the northern Adriatic Sea onto the Premantura (Kamenjak) Promontory in Croatia [33]. In this case, however, the coastline is formed by a low-angle rocky shore that is more like a ramp in configuration than a sea cliff.
The barriers that close off the inner harbor at Puerto Escondido are natural breakwaters formed by a mixture of pebbles, cobbles, and boulders that trace back to single sources of bed rock in exposed sea cliffs. Those sea cliffs are steeply inclined (50° to 55°) and are unstable. Andesite layers within the bedrock are tilted at a high angle dipping westward and rock falls leave fresh material at the base of the cliffs. Essentially, a combination of long-shore currents and storm waves harvest the materials and carry them southward where they are entrained in the linear barriers. A more appropriate term for this kind of feature is a barrier boulder deposit (BBD). This term is a good fit with the many bars formed by andesite cobbles and boulders that close off lagoons on Isla Angel de la Guarda in the upper Gulf of California—some of which extend for as much as 1.25 km [34]. The aerial photo from Johnson et al. (2019, their Figure 10) illustrates two such barriers and others in the process of extension from the nearest bedrock source [2]. Granite is another major rock type from which rocky shores are formed in the Gulf of California. Eroded granite boulders at Bahía San Antonio (Figure 1, locality 4) are encrusted by Upper Pleistocene fossils representing an intertidal biota preserved in growth position [35]. Close to granite bedrock at Punta San Antonio, the scenario corresponds well with the BBD concept. The potential for development of a BBD appears to be less dependent on rock type than climatic patterns that bring longshore currents and wave impact from a recurrent and propitious direction.

6. Conclusions

A multifaceted approach to our study of the natural harbor at Puerto Escondido and its development over time involved aspects of geology, geomorphology, paleontology, and sedimentology, leading to the following conclusions:
  • During the last interglacial epoch near the close of Pleistocene time 125,000 years ago, the inner shores at Puerto Escondido were exposed to normal sea water that resulted in a substantial shell deposit dominated by a few marine invertebrates with a preference for intertidal conditions. By comparison, the present-day lagoon at the center of the inner harbor is far more restricted in its marine ecology. Therefore, the hills around the outer margin must have had gaps that permitted sufficient marine circulation to generate the Pleistocene shell deposit.
  • The exaggerated topographic asymmetry expressed today by hills on the outer shores of Puerto Escondido was likely initiated through the coastal erosion along a major fault scarp shortly after the Late Pleistocene, but ongoing erosion during the Holocene provided more than enough raw materials to construct two natural barriers that closed off the large inner harbor. A parallel fault trace through the inner hills on the west side of the harbor accounts for post-depositional uplift of the Pleistocene shell beds.
  • Shallow earthquakes are a common occurrence throughout the Gulf of California, but no credible evidence exists that tsunamis ever played a role in the geomorphology of coastal or basin sedimentology. Longshore currents related to strong seasonal winds are an important factor in the gulf’s pattern of marine circulation and shore erosion on an annual basis. More common during El Niño years, hurricanes are the leading cause of rocky-shore erosion and development of coastal boulder deposits. Local production of boulders approaching a metric ton in weight can only be explained by sea surge stimulated by hurricane-force winds.
  • Comparisons with other boulder deposits in the Gulf of California suggest that a named sub-category is appropriate to describe barriers or bars where large boulders are entrained in linear structures linked at one or both ends to sea cliffs. More often, a coastal boulder deposit (CBD) refers to extra-large clasts at the top of or at the immediate side of sea cliffs where natural jointing controls the initial size and shape of eroded materials. Herewith, we propose the term boulder barrier deposit (BBD) for geomorphic features that appear to be especially widespread around the Gulf of California. Future contributions are invited to explore the extent to which such features are well developed elsewhere around the world.

Author Contributions

Initial field reconnaissance was conducted by M.E.J. in February 2018, with a follow-up visit by M.E.J. and E.M.J. to collect field data in April 2019. M.E.J. prepared the first draft of this contribution, drafted all figures, and supplied all ground photos. R.G.-F. was responsible for working out the mathematics related to storm hydrodynamics. J L.-V. summarized the literature on basin turbidites in the lower Gulf of California that negates claims regarding tsunami activity in the region. In addition, J.L.-V. contributed input on fault orientations within the study area. Authorship has been limited to those who contributed substantially to the work reported. All authors have read and agreed to the published version of the manuscript.

Funding

This research received no external funding.

Acknowledgments

Foremost, we are grateful to Norm Christy, part-time resident of Loreto, for his crucial assistance with logistics during our 2019 visit including guidance on overland access to the boulder barriers at Puerto Escondido. Use of a vehicle and two-person kayak was made available for completion of fieldwork. M.E.J. is indebted to Jay Racela (Environmental Lab, Williams College) for help with the experimental calculation of density for the andesite sample from Puerto Escondido. Reviews of an earlier manuscript for which the authors are most grateful were provided by two anonymous readers.

Conflicts of Interest

The authors declare no conflict of interest.

References

  1. Backus, D.H.; Johnson, M.E.; Ledesma-Vazquez, J. Peninsular and island rocky shores in the Gulf of California. In Atlas of Coastal Ecosystems in the Western Gulf of California; Johnson, M.E., Ledesma-Vazquez, J., Eds.; University Arizona Press: Tucson, AZ, USA, 2009; pp. 11–27. ISBN 978-0-8165-2530-0. [Google Scholar]
  2. Johnson, M.E.; Ledesma-Vázquez, J.; Guardado-France, R. Coastal geomorphology of a Holocene hurricane deposit on a Pleistocene marine terrace from Isla Carmen (Baja California Sur, Mexico). J. Mar. Sci. Eng. 2018, 6, 108. [Google Scholar] [CrossRef] [Green Version]
  3. Johnson, M.E.; Guardado-France, R.; Johnsob, E.M.; Ledesma-Vázquez, J. Geomorphology of a Holocene Hurricane deposit eroded from rhyolite sea cliffs on Ensenada Almeja (Baja California Sur, Mexico). J. Mar. Sci. Eng. 2019, 7, 193. [Google Scholar] [CrossRef] [Green Version]
  4. Steinbeck, J.; Ricketts, E.F. Sea of Cortez: A Leisurely Journal of Travel and Research; Viking Press: New York, NY, USA, 1941; p. 598. [Google Scholar]
  5. Ricketts, E.F. Between Pacific Tides; University of Stanford Press: Palo Alto, CA, USA, 1939. [Google Scholar]
  6. Merrifield, M.A.; Winant, C.D. Shelf-circulation in the Gulf of California: A description of the variability. J. Geophy. Res. 1989, 94, 133–160. [Google Scholar] [CrossRef]
  7. Ledesma-Vázquez, J.; Johnson, M.E.; Gonzalez-Yajimovich, O.; Santamaría-del-Angel, E. Gulf of California geography, geological origins, oceanography and sedimentation patterns. In Atlas of Coastal Ecosystems in the Western Gulf of California; Johnson, M.E., Ledesma-Vázquez, J., Eds.; University of Arizona Press: Tucson, AZ, USA, 2009; pp. 1–10. ISBN 978-0-8165-2530-0. [Google Scholar]
  8. Romero-Vadillo, E.; Zaystev, O.; Morales-Pérez, R. Tropical cyclone statistics in the northeastern Pacific. Atmósfera 2007, 20, 197–213. [Google Scholar]
  9. Muriá-Vila, D.; Jaimes, M.Á.; Pozos-Estrada, A.; López, A.; Reinoso, E.; Chávez, M.M.; Peña, F.; Sánchez-Sesma, J.; López, O. Effects of hurricane Odile on the infrastructure of Baja California Sur, Mexico. Nat. Hazards 2018, 9, 963–981. [Google Scholar] [CrossRef]
  10. Mark, C.; Gupta, S.; Carter, A.; Mark, D.F.; Gautheron, C.; Martin, A. Rift flank uplift at the Gulf of California: No requirement for asthenosperhic upwelling. Geology 2014, 42, 259–263. [Google Scholar] [CrossRef] [Green Version]
  11. Carreño, A.L.; Helenes, J. Geology and ages of the islands, 14–40. In A New Island Biogeography of the Sea of Cortés; Case, T.J., Cody, M.L., Ezcurra, E., Eds.; Oxford University Press: Oxford, UK, 2002; p. 669. [Google Scholar]
  12. Wentworth, C.K. A scale of grade and class terms for clastic sediments. J. Geol. 1922, 27, 377–392. [Google Scholar] [CrossRef]
  13. Sneed, E.D.; Folk, R.L. Pebbles in the lower Colorado River of Texas: A study in particle morphogenesis. J. Geol. 1958, 66, 114–150. [Google Scholar] [CrossRef]
  14. Nott, J. Waves, coastal bolder deposits and the importance of pre-transport setting. Earth Planet. Sci. Lett. 2003, 210, 269–276. [Google Scholar] [CrossRef]
  15. Orlieb, L.; Dauphin, J.P. Quaternary Vertical Movements along the Coasts of Baja California and Sonora; Dauphin, J.P., Simoneit, B.R.T., Eds.; American Association of Petroleum Geologists Memoir 47: Gulf, CA, USA; Peninsular, CA, USA, 1991; pp. 447–480. [Google Scholar]
  16. Bender, M.L.; Fairbanks, R.G.; Taylor, F.W.; Matthews, R.K.; Goddard, J.G.; Broecker, W.S. Uranium-series dating of the Pleistocene reef tracts of Barbados, West Indies. Geol. Soc. Am. Bull. 1979, 90, 577–594. [Google Scholar] [CrossRef]
  17. Neumann, A.C.; Hearty, P.J. Rapid sea-level changes at the close of the last interglacial (substage 532) recorded in Bahamian island geology. Geology 1996, 24, 775–778. [Google Scholar] [CrossRef]
  18. Brusca, R.C. Common Intertidal Invertebrates of the Gulf of California, 2nd ed.; Universityu of Arizona Press: Tucson, AZ, USA, 1973; p. 513. [Google Scholar]
  19. Hayes, M.L.; Johnson, M.E.; Fox, W.T. Rocky-shore biotic associations and their fossilization potential: 
Isla Requeson (Baja California Sur, Mexico). J. Coast. Res. 1993, 9, 944–957. [Google Scholar]
  20. Simian, M.E.; Johnson, M.E. Development and foundering of the Pliocene Santa Ines Archipelago in the Gulf of California: Baja California Sur, Mexico. In Pliocene Carbonates and Related Facies Flanking the Gulf of California, Baja California Mexico, Geological Society of America Special Paper; Geological Society of America: McLean, VA, USA, 1997; Volume 318, pp. 25–38. [Google Scholar]
  21. McCloskey, T.A.; Bianchette, T.A.; Liu, K.-B. Geological and sedimentological evidence of a large tsunami occurring ~1100 year BP from a small coastal lake along the Bay of La Paz in Baja California Sur, Mexico. J. Mar. Sci. Eng. 2015, 3, 1544–1567. [Google Scholar] [CrossRef]
  22. Gorsline, D.S.; De Diego, T.; Nava-Sanchez, E.H. Seismically triggered turbidites in small margin basins: Alfonso Basin, Western Gulf of California and Santa Monica Basin, California Borderland. Sediment. Geol. 2000, 135, 21–35. [Google Scholar] [CrossRef]
  23. Castro, R.; Stock, J.M.; Hauksson, E.; Clayton, R.W. Active tectonics in the Gulf of California and seismicity (M > 3.0) for the period 2002–2014. Tectonophysics 2017, 719–720, 4–16. [Google Scholar] [CrossRef] [Green Version]
  24. Fletcher, J.M.; Munguía, L. Active continental rifting in southern Baja California, Mexico: Implications for plate motion partitioning and the transition to seafloor spreading in the Gulf of California. Tectonics 2000, 19, 1107–1123. [Google Scholar] [CrossRef]
  25. Umhoefer, P.J.; Mayer, L.; Dorsey, R.J. Evolution of the margin of the Gulf of California near Loreto, Baja California Peninsula, Mexico. Geol. Soc. Am. Bull. 2002, 114, 849–868. [Google Scholar] [CrossRef] [Green Version]
  26. Trejo-Gómez, E.; Ortiz, M.; Núñez-Cornú, J. Source model of the October 9, 1995 Jalisco-Colima tsunami as constrained by field survey reports and on the numerical simulation of the tsunami. Geofís. Int. 2015, 54, 149–159. [Google Scholar] [CrossRef]
  27. Suanez, S.; Fichaut, B.; Magne, R. Cliff-top storm deposits on Banneg Island, Briggany, Rrance: Effects of giant waves in the eastern Atlantic Ocean. Sediment. Geol. 2009, 220, 12–28. [Google Scholar] [CrossRef]
  28. Cox, R.; Jahn, K.L.; Watkins, O.G.; Cox, P. Extraordinary boulder transport by storm waves (west Ireland, winter 2013-14) and criteria for analyzing coastal boulder deposits. Earth Sci. Rev. 2018, 177, 623–636. [Google Scholar] [CrossRef]
  29. Erdmann, W.; Scheffers, A.M.; Kelletat, D.H. Holocene coastal sedimentation in a rocky environment: Geomorphological evidence from the Aran Islands and Galway Bay (Western Ireland). J. Coast. Res. 2018, 34, 772–792. [Google Scholar] [CrossRef]
  30. Hearty, P.J. Boulder deposits from large waves during the last inter-glaciation on North Eleuthera Island, Bahamas. Quat. Res. 1997, 48, 326–338. [Google Scholar] [CrossRef]
  31. Rovere, A.; Casella, E.; Harris, D.L.; Lorscheid, T.; Nandasena, N.A.K.; Dyer, B.; Sandstrom, M.R.; Stocchi, P.; D’Amdrea, W.J.; Raymo, M.E. Giant boulders and last interglacial storm intensity in the North Atlantic. Proc. Natl. Acad. Sci. USA 2017, 114, 12144–12149. [Google Scholar] [CrossRef] [PubMed] [Green Version]
  32. Kennedy, A.B.; Mori, N.; Yasuda, T.; Shimozono, T.; Tomiczek, T.; Donahue, A.; Shimura, T.; Imai, Y. Extreme block and boulder transport along a cliffed coastline (Calicoan Island, Philippines) during Super Typhoon Haiyan. Mar. Geol. 2017, 383, 65–77. [Google Scholar] [CrossRef] [Green Version]
  33. Biolchi, S.; Denamiek, C.; Devoto, S.; Korbar, T.; Macovaz, V.; Scicchitano, G.; Vilibic, I.; Furlani, S. Impact of the October 2018 Storm Vaia on coastal boulders in the northern Adriatic Sea. Water 2019, 11, 2229. [Google Scholar] [CrossRef] [Green Version]
  34. Johnson, M.E.; Ledesma-Vázquez, J.; Backus, D.H.; González, M.R. Lagoon microbialites on Isla Angel de la Guarda and associated peninsular shores, Gulf of California (Mexico). Sediment. Geol. 2012, 263, 76–84. [Google Scholar] [CrossRef]
  35. Johnson, M.E.; Ledesma-Vázquez, J. Biological zonation on a rocky-shore boulder deposit: Upper Pleistocene Bahía San Antonio (Baja California Sur, Mexico). Palaios 1999, 14, 569–584. [Google Scholar] [CrossRef]
Figure 1. Locality maps showing Mexico’s Baja California peninsula and Gulf of California; (a) Mexico and border area with the Unite States, denoting key villages or cities with inset box marking the study region around the town of Loreto; (b) Region around Loreto in Baja California Sur, marking coastal boulder deposits (*) at localities 1 to 4.
Jmse 08 00075 g001
Figure 2. View east over the inner harbor at Puerto Escondido with Isla del Carmen on the horizon.
Jmse 08 00075 g002
Figure 3. Schematic portrayal of the sampling method applied at Puerto Escondido (not to scale).
Jmse 08 00075 g003
Figure 4. Topographic map showing the hills surrounding Puerto Escondido and other key features including a Pleistocene fossil deposit and faults.
Jmse 08 00075 g004
Figure 5. Upper Pleistocene shell drape in the western hills around Puerto Escondido: (a) View from an elevation of 45 m above sea level looking west toward the Sierra de la Gigante in the background; (b) Close-up view of the shell drape dominated by disarticulated vales of the Mollusk bivalve, Chione californiensis. Pocket knife for scale is 9 cm in length.
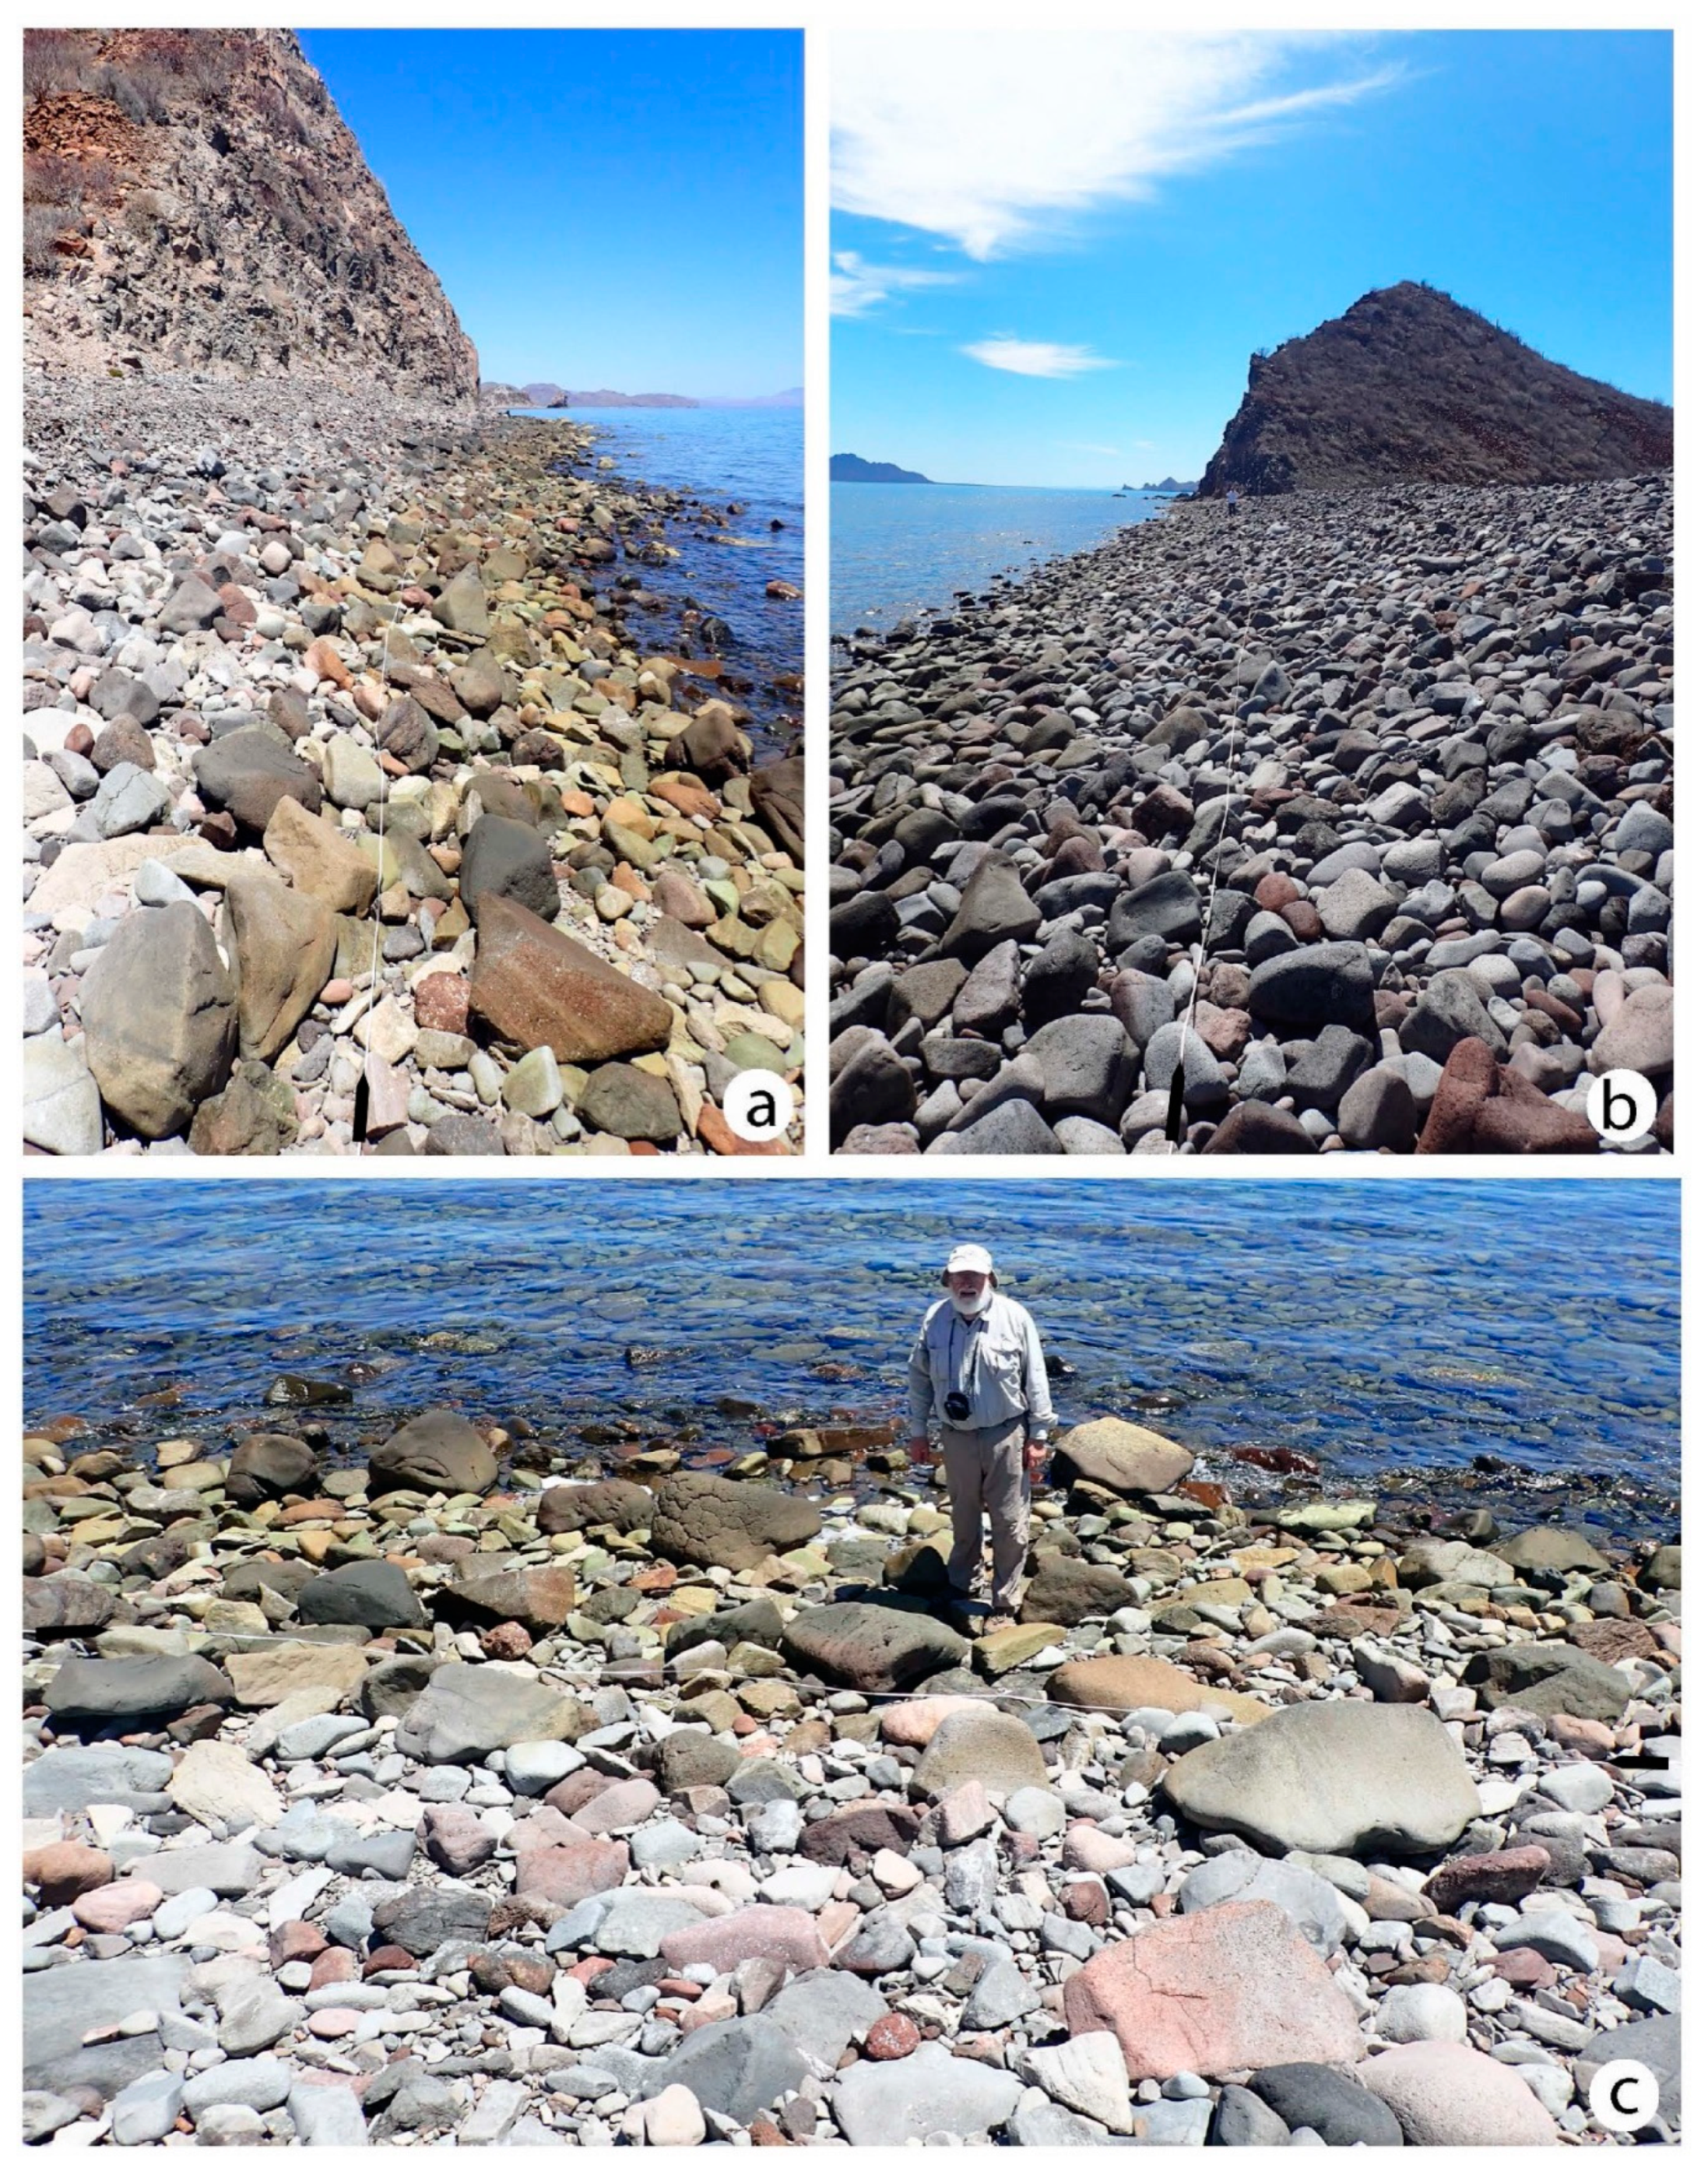
Jmse 08 00075 g005
Figure 6. Boulder deposits from barrier #1; (a) View from the north end of the boulder deposit with the eroded cliff face of Cerro El Chino in the background; (b) View looking toward the south end with the eroded cliff face of an un-named islet in the distance; (c) View east from the center of the barrier. In each view, the anchor position of the meter tape is at the upper tide line marked by black arrows.
Jmse 08 00075 g006
Figure 7. Set of four triangular Sneed-Folk diagrams used to appraise variations in boulder shape on barrier #1; (a) Trend for boulders from Transect 1a; (b) Trend for boulders from Transect 1b; (c) Trend for boulders from Transect 1c; (d) Trend for boulders from Transect 1d. Note the similarity in slopes from sample to sample.
Jmse 08 00075 g007
Figure 8. Pair of triangular Sneed-Folk diagrams used to appraise variations in boulder shape on barrier #2; (a) Trend for boulders from Transect 2a; (b) Trend for boulders from Transect 2b. Note similarities in slopes with those from barrier #1 in Figure 7.
Jmse 08 00075 g008
Figure 9. Parallel sets of bar graphs used to appraise variations in the long and intermediate axes on boulders from barrier #1; (a) Long axis from boulders in Transect 1a; (b) Long axis from boulders in Transect 1b; (c) Long axis from boulders in Transect 1c; (d) Long axis from boulders in Transect 1d; (e) intermediate axes from boulders in Transect 1a; (f); Intermediate axis from boulders in Transect 1b; (g); Intermediate axis from boulders in Transect 1c; (h) Intermediate axis from boulders in Transect 1d.
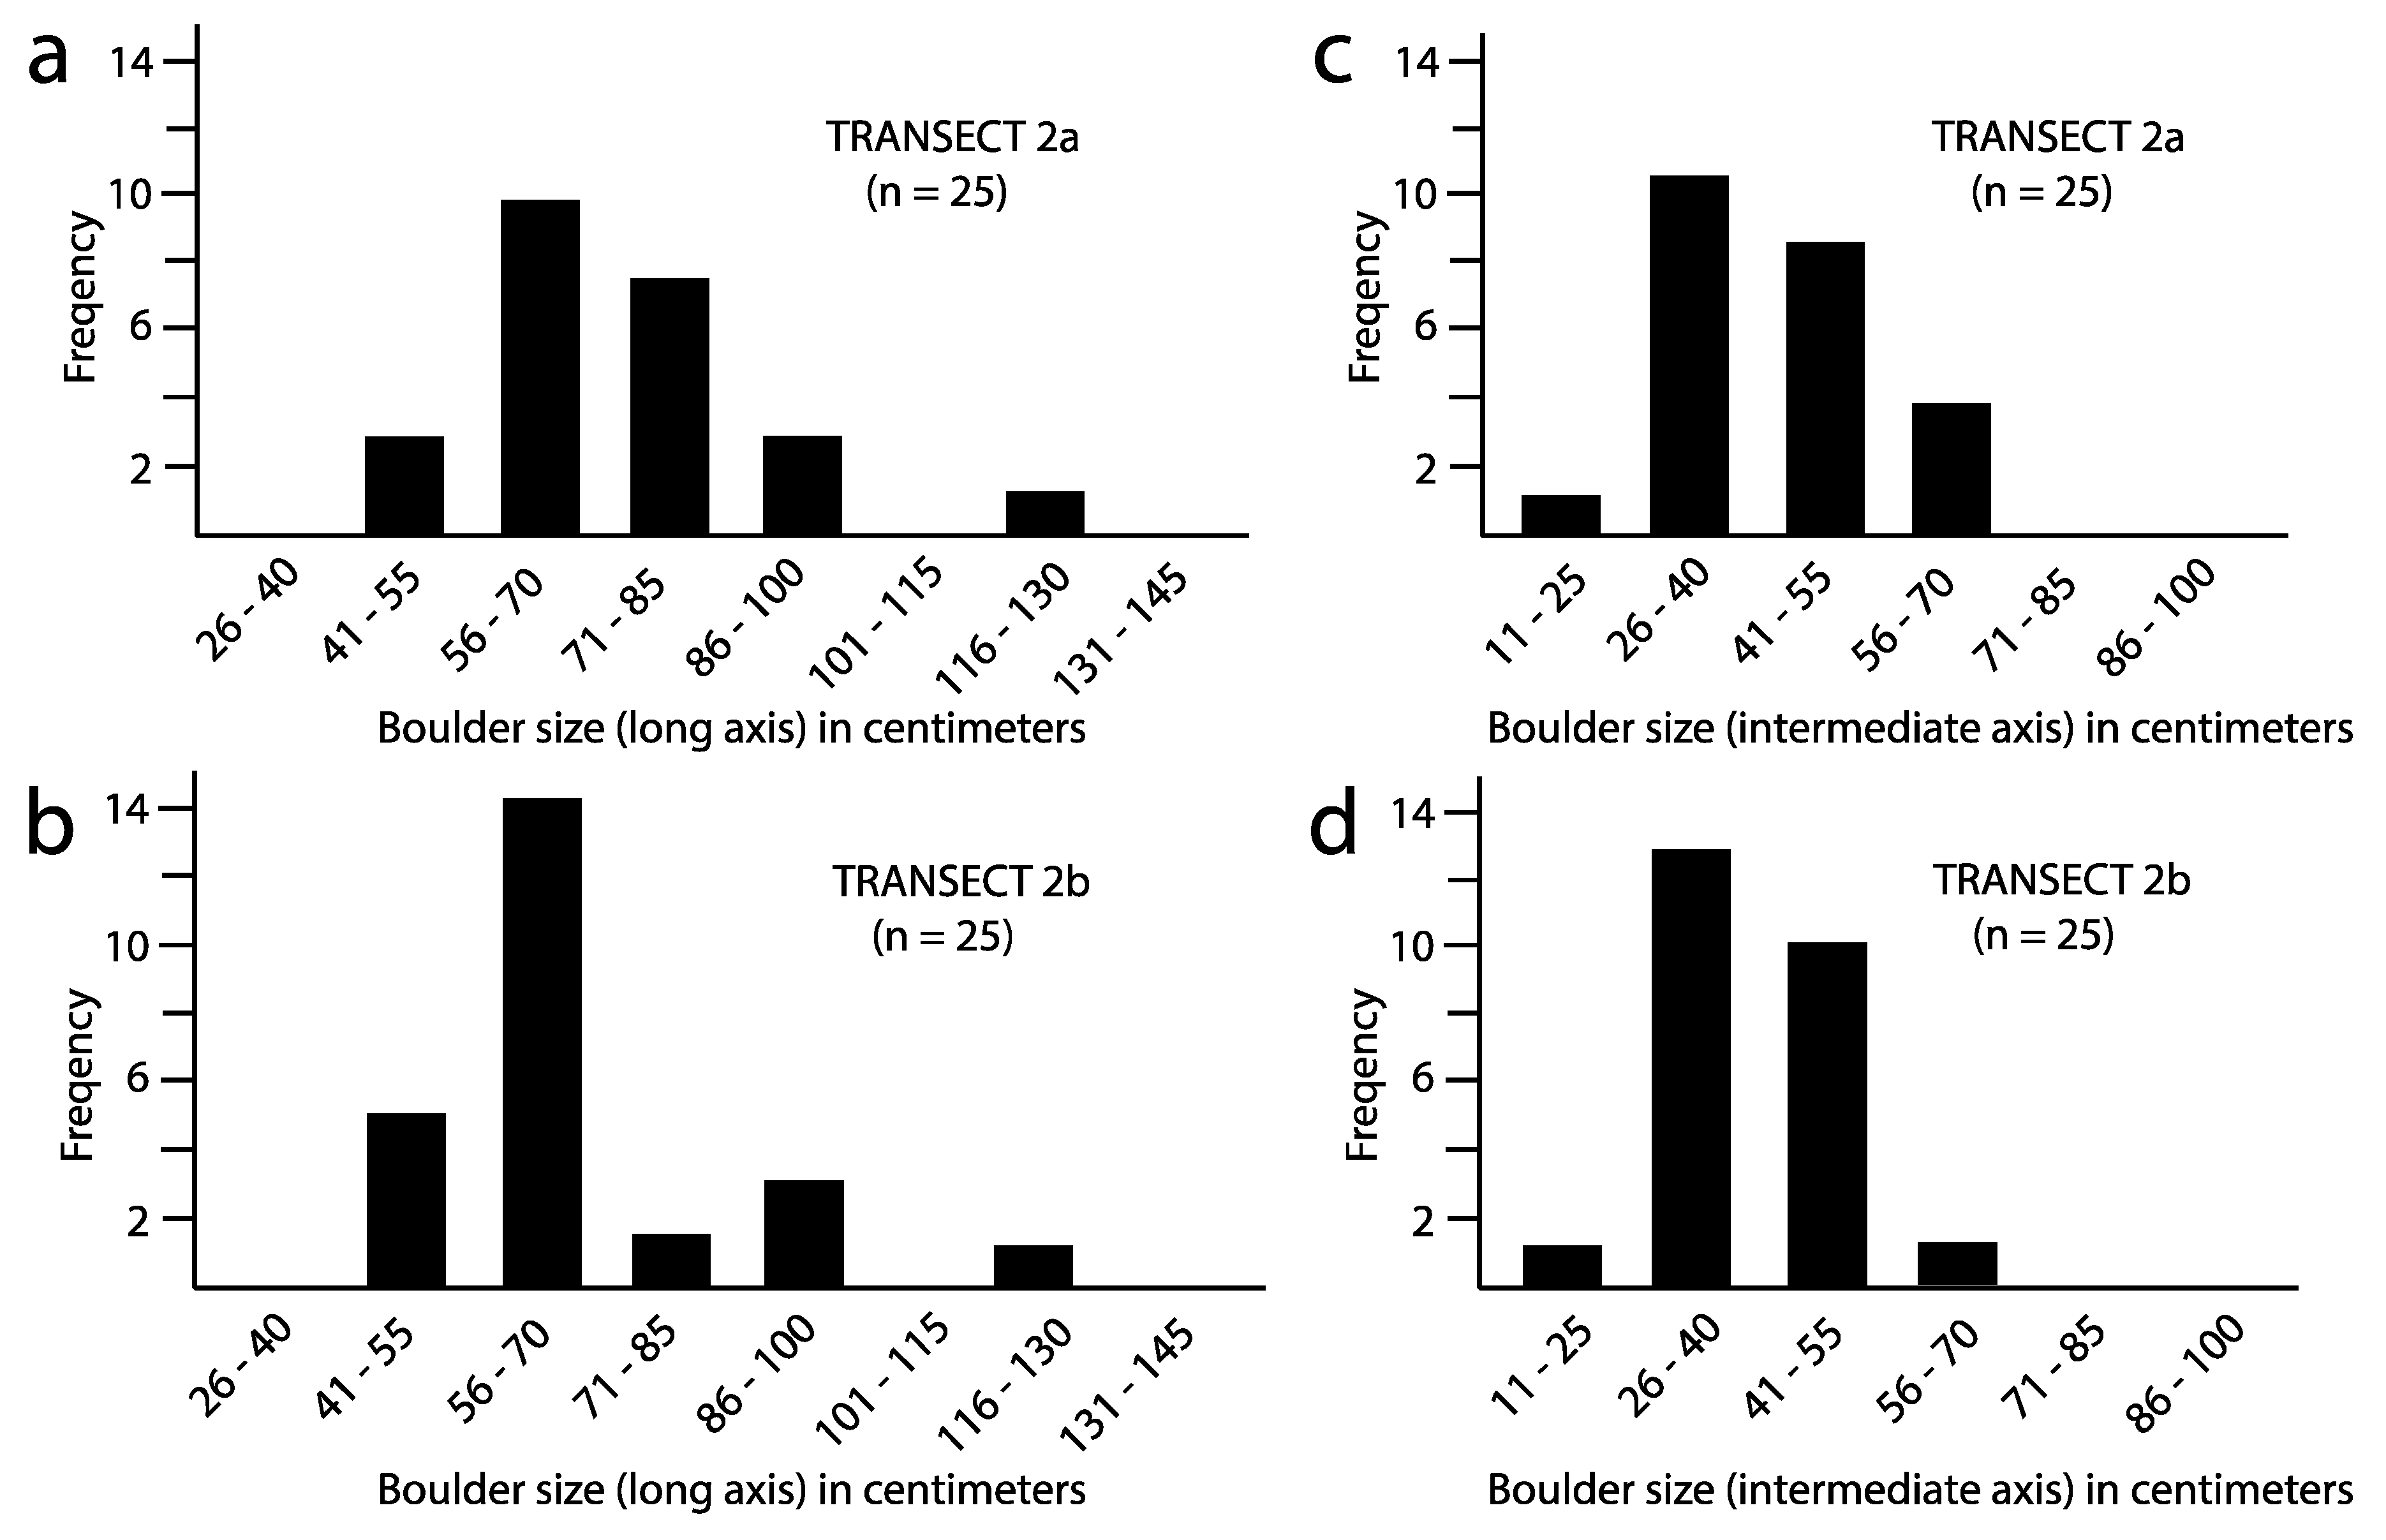
Jmse 08 00075 g009
Figure 10. Parallel sets of bar graphs used to appraise variations in the log and intermediate axes on boulders from barrier #2; (a) Long axis from boulders in Transect 2a; (b) Long axis from boulders in Transect 2b; (c) Intermediate axis from boulders in Transect 2a; (d) Intermediate axis from boulders in Transect 2b.
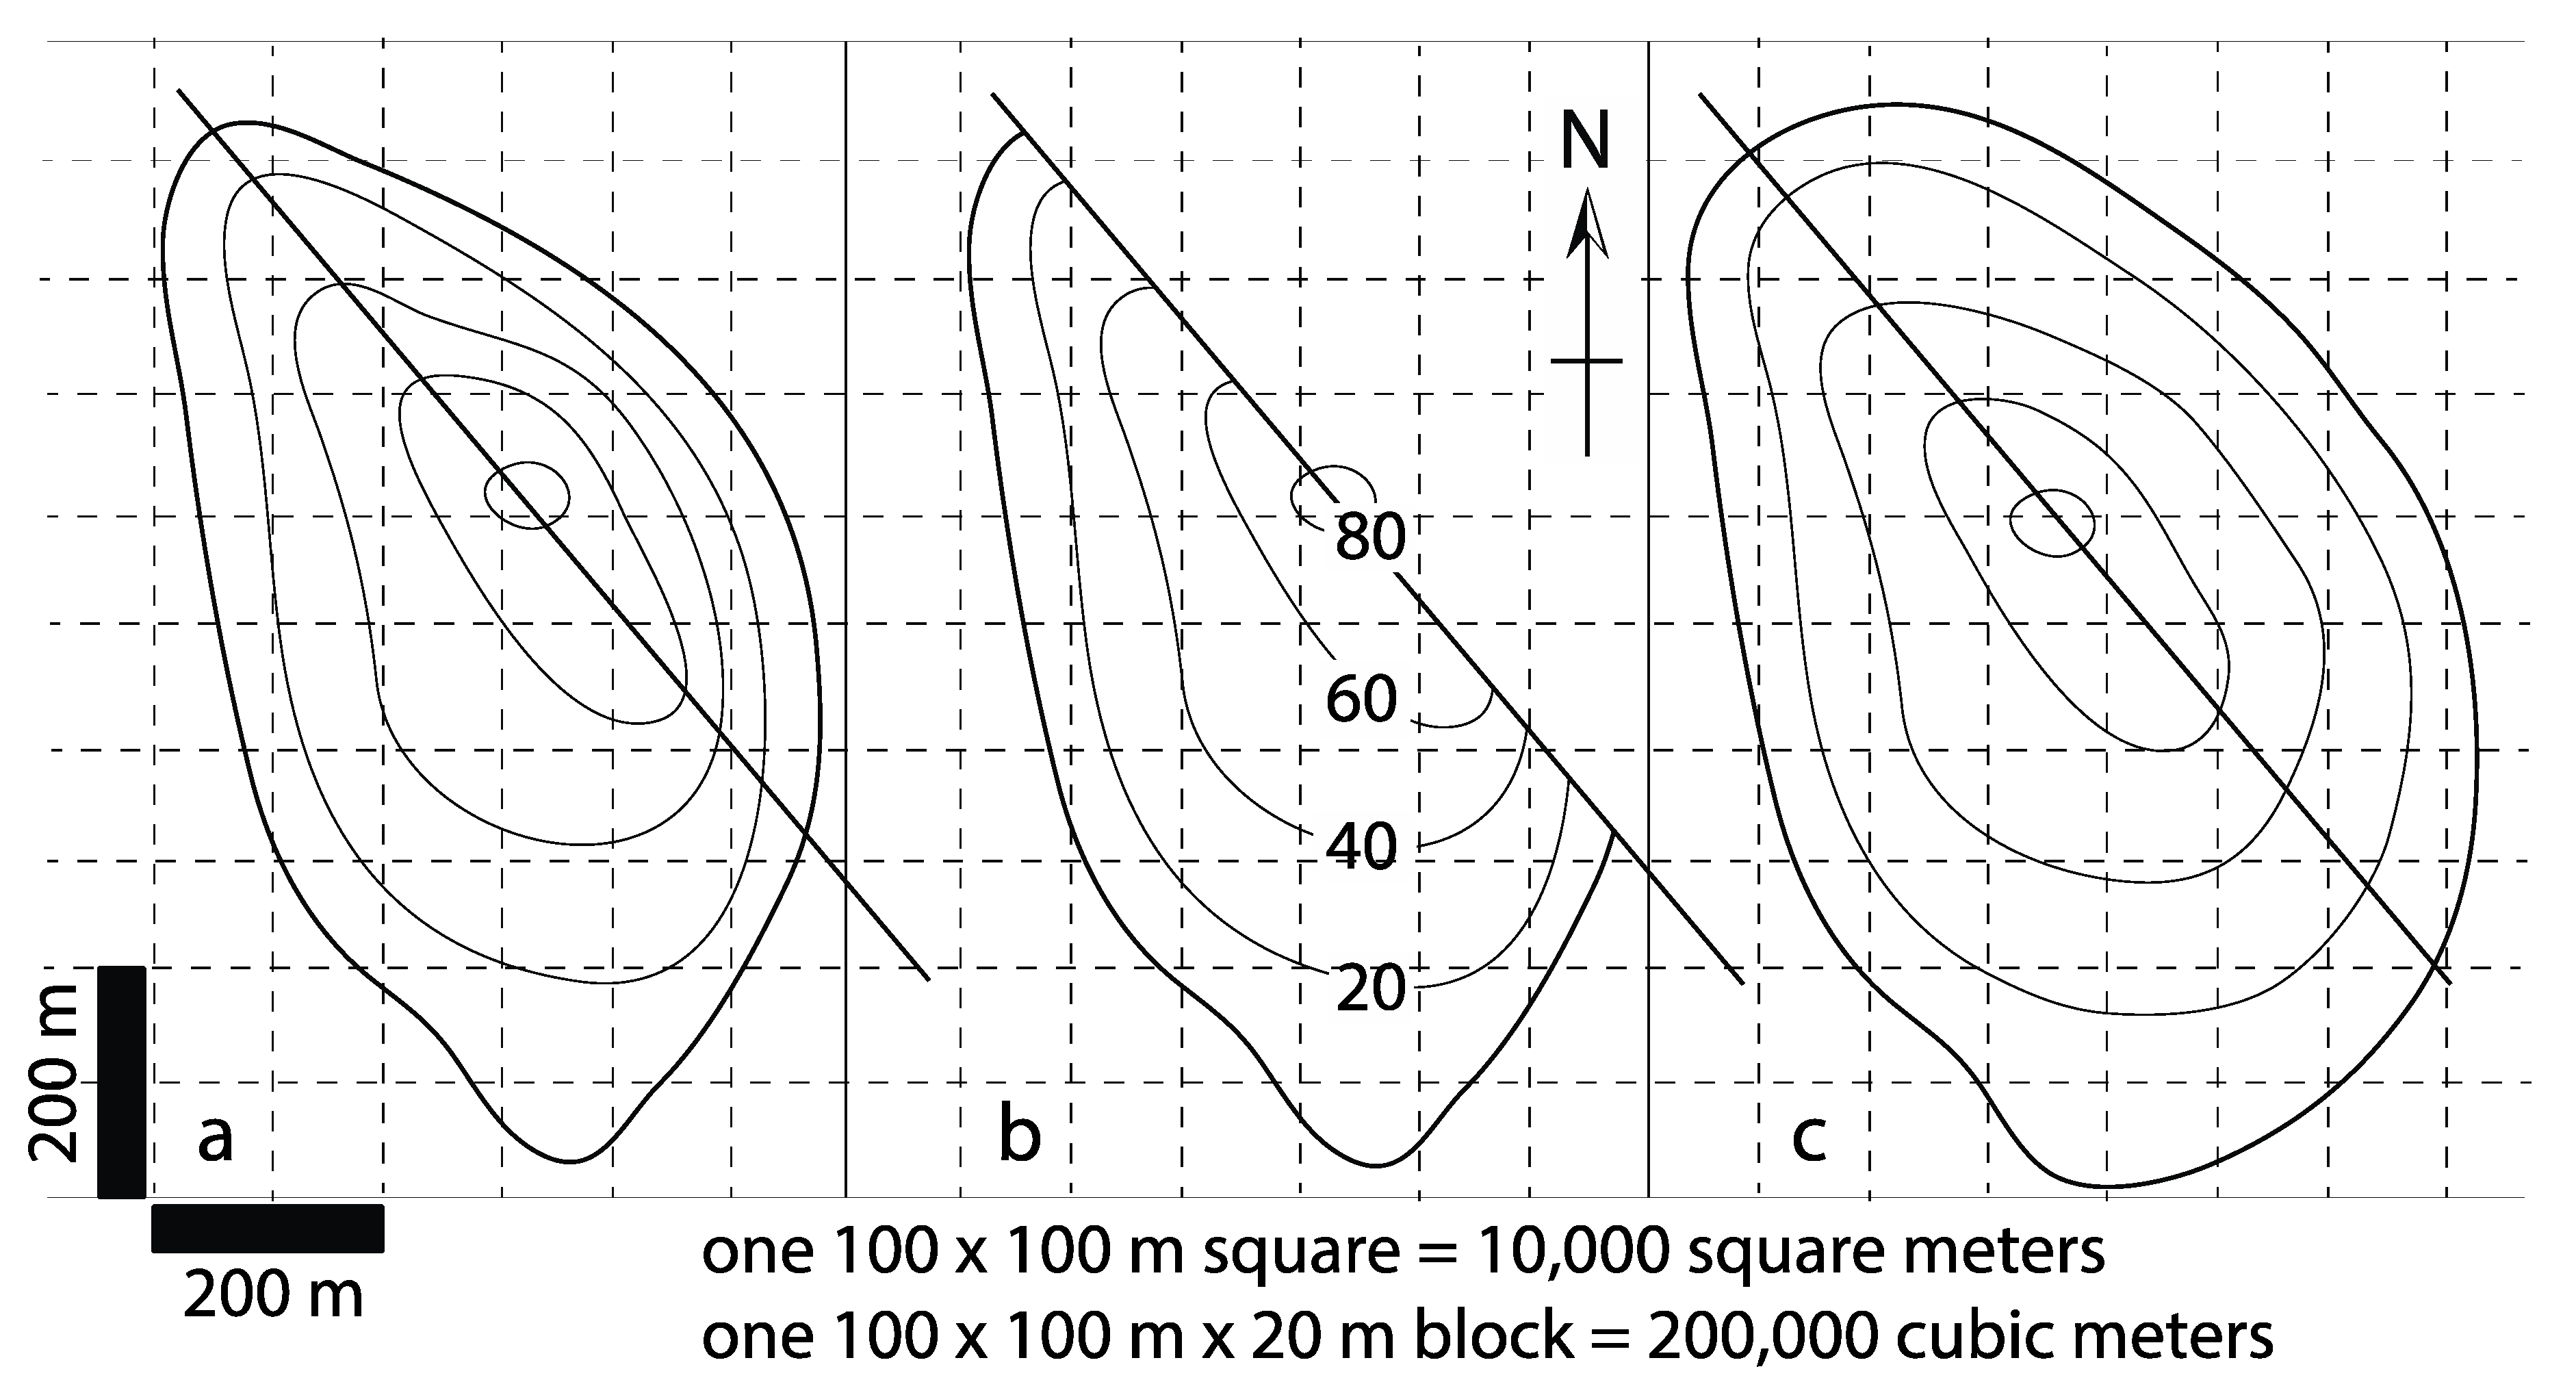
Jmse 08 00075 g010
Figure 11. Progression of stages in geomorphological modeling with respect to the un-named islet between barriers # and #2; (a) Topography of present day islet with dividing line showing disparity between the gentler lagoon side and exposed cliff face on the open sea; (b) Erasure of the outer cliff face; (c) Restoration of past topographic gradient on the seaward face showing a better match with the sheltered side.
Jmse 08 00075 g011
Figure 12. View east from Puerto Escondido across the Carmen Passage showing distinct marine terraces cut in the southwest side of Isla del Carmen. Motor boat and wake for scale at left, center.
Jmse 08 00075 g012
Table 1. Quantification of boulder size, volume and estimated weight from coastal bar samples through Transect 1a at the east end of Cerro El Chino (Puerto Escondido). The laboratory result for density of andesite at 2.55 gm/cm3 is applied uniformly in order to calculate wave height for each boulder.
SampleDistance to Next (cm)Long Axis (cm)Intermediate Axis (cm)Short Axis (cm)Volume (cm3)Adjust. to 75%Weight (kg)Estimated Wave ht. (m)
101006035210,000157,5004028.3
2+100764636125,85694,3742416.3
3+250856323123,16592,3742367.1
4+200826534181,220135,9143476.8
5+2401005026130,00097,5002498.3
6+140824536132,84099,6302546.8
7+15042373655,94441,9581073.5
8+21066332554,45040,8381045.5
9+7057302339,33029,497754.7
10+23067382153,46640,1001025.6
11+7070342559,50044,6251145.8
12+5069431750,43937,829965.7
13+10064362455,29641,4721065.3
14+10069353277,28057,9601485.7
15+13081382370,79453,0961356.7
16+220846148245,952184,4644707.0
17+37052512258,34443,7581124.3
18+260787523134,550100,9132576.5
19+170895549239,855179,8914597.4
20+2301314341230,953173,21544210.9
21+10063352555,12541,3441055.2
22+1005391941,4931,122794.7
23+42058352550,75038,063974.8
24+10075312865,1048,8251256.2
25+25050272635,10026,325674.2
Average+170744429103,07277,3031976.3
Table 2. Quantification of boulder size, volume and estimated weight from coastal bar samples through Transect 1b (continuation from 1a east of El China). The laboratory result for density at 2.55 gm/cm3 is applied uniformly to all samples in order to calculate wave height for each boulder.
SampleDistance to Next (cm)Long Axis (cm)Intermediate Axis (cm)Short Axis (cm)Volume (cm3)Adjust. to 75%Weight (kg)Estimated Wave ht. (m)
1073312352,04939,0371006.1
230047292534,07525,556653.9
313059251826,55019,913514.9
417086321849,53666,0481687.3
530049392649,68666,2481694.1
63044423972,07296,0962453.7
730036252320,70015,525403
821042282327,04820,286523.5
916072392981,43261,0741566
1016048252530,00022,500574
11100954029110,20082,6502117.9
1219060361941,04030,780785
1311059322241,53631,152794.9
1417062452878,12058,5901495.2
1533059412970,15152,6131344.9
1620047231718,37713,783353.9
1720062363373,65655,2421415.2
1817078292556,55042,4121086.5
1923063402563,00047,2501205.2
20170704937126,91095,1832435.8
21100744341130,46297,8422506.3
2122052341831,82423,868614.3
2318046332334,91426,186673.8
2410075282246,20034,650886.2
2515053482768,68851,5161314.4
Average17560352657,39147,0401205
Table 3. Quantification of boulder size, volume and estimated weight from coastal bar samples through Transect 1c (continuation from 1b east of El China). The laboratory result for density at 2.55 gm/cm3 is applied uniformly in order to calculate wave height for each boulder.
SampleDistance to Next (cm)Long Axis (cm)Intermediate Axis (cm)Short Axis (cm)Volume (cm3)Adjust. to 75%Weight (kg)Estimated Wave ht. (m)
1045301722,95017,213443.7
225040211512,6009,450243.3
312058221924,24418,183464.8
413060401843,20032,400835
517086353399,33074,4981907.3
620061282440,99230,744785.1
711065351636,40027,300705.4
818055252433,00024,750634.6
926069422057,96043,4701115.7
1025049371832,63424,476624.1
1125044343349,36837,026943.7
1233052362954,28840,7161044.3
1318059181819,11631,152374.9
143203612177,3445,508143
158036281717,13612,852333
1624039221210,2967,722203.2
1723038201813,68010,260263.2
1827049311319,74742,4121084.1
1913050361863,00014,810384.2
2023080502932,40024,300626.7
21110492525116,00087,0002224.1
2216037221330,62522,969593.1
2330043281821,67216,254413.6
2425048241517,28012,960334
256079373293,53670,1521796.6
Average19853302038,75229,0647444
Table 4. Quantification of boulder size, volume and estimated weight from coastal bar samples through Transect 1d (continuation from 1c east of El China). The laboratory result for density at 2.55 gm/cm3 is applied uniformly in order to calculate wave height for each boulder.
SampleDistance to Next (cm)Long Axis (cm)Intermediate Axis (cm)Short Axis (cm)Volume (cm3)Adjust. to 75%Weight (kg)Estimated Wave ht. (m)
1045312534,87526,156673.7
232051302436,72027,540704.2
333049262329,32021,990564.1
410038191712,2749,206233.2
518040211815,12011,340293.3
62104316149,6327,224183.6
719047191715,18111,386291.9
820059372656,75842,5691094.9
922057202022,80017,100444.7
1011057271624,62418,468474.7
1117047231415,13411,351293.9
123038201914,44010,830283.2
13210965620107,52080,6402068
14180764632111,87283,9042146.3
1512054423068,04051,0301304.5
1614052252431,20023,400604.3
174072351845,36034,020876
1820057262029,64022,230574.7
1910067413082,41061,8081585.6
2025059302137,17037,170714.9
2138076402679,04059,2801516.3
2220744038112,48084,3602156.2
2312051392753,70340,2771034.2
2417055423069,30051,9751334.6
25270785031120,90090,6752316.5
Average17058322349,42137,437954.8
Table 5. Quantification of boulder size, volume and estimated weight from coastal bar samples collected from transect 2a. (north of Cerro Enfermería). The laboratory result for density at 2.55 gm/cm3 is applied uniformly in order to calculate wave height for each boulder.
SampleDistance to Next (cm)Long Axis (cm)Intermediate Axis (cm)Short Axis (cm)Volume (cm3)Adjust. to 75%Weight (kg)Estimated Wave ht. (m)
1062282645,13633,852865.2
222073342152,12239,0921006.1
32101186342312,228234,1715979.8
4170865833164,604123,4533157.2
517048322843,00832,256824
616048382952,89639,6721014
71058432767,33850,5041294.8
8210614845131,76098,8202525.1
9380905323109,71082,2832107.5
10220755829126,15094,6132416.2
1132055383573,15054,8631404.6
1218082512292,00469,0031766.8
1322069251729,32521,994565.7
1480785225101,40076,0501946.5
1510078342566,30049,7251276.5
168064432055,04041,2801055.3
1712059412355,63741,7281064.9
188080342568,00051,0001306.7
1911065393383,65562,7411605.4
2023065451749,72537,294955.4
21180883935120,12090,0902307.3
2215072442269,69652,0721336
2314073602296,36072,2701846.1
2418067312041,54031,155795.6
2523064392562,40046,8001195.3
Average16671432786,77265,0711665.9
Table 6. Quantification of boulder size, volume and estimated weight from coastal bar samples from transect 2b. (north of Cerro Enfernmera). The laboratory result for density at 2.55 gm/cm3 is applied uniformly in order to calculate wave height for each boulder.
SampleDistance to Next (cm)Long Axis (cm)Intermediate Axis (cm)Short Axis (cm)Volume (cm3)Adjust. to 75%Weight (kg)Estimated Wave ht. (m)
101185248294,528220,8965639.8
230056372347,65635,742914.7
311051241720,80815,606404.2
426079492285,16263,8721636.6
524050402244,00033,000844.2
611051352646,41034,808894.2
76066401744,88033,660865.5
810067383076,38057,2851465.6
915066432673,78855,3411415.5
1017058443589,32066,9901714.8
1170864931130,63497,9762507.2
1225063442055,44041,5801065.2
136075451860,75045,5631166.1
1412063312752,73139,5481015.3
1528086452181,27060,9531555.3
1690603735116,55087,4132237.2
1732056353160,76045,5701165
18046342234,40825,806664.7
1930061342755,99841,9991073.8
2010070442886,24064,6801655.1
21470895842216,804162,6034155.8
2218059332650,62237,967977.4
2312059311731,09323,320594.9
2438048312435,71226,784684
2536070422161,74046,3051185.8
Average18466402678,14758,6111495.5
Table 7. Summary data from Table 1, Table 2, Table 3, Table 4, Table 5 and Table 6 showing maximum boulder size and estimated weight compared to the average values for all boulders (N = 25) from each of transects 1–6 together with calculated values for wave heights estimated as necessary for boulder mobility.
Tran-SectNumber of SamplesAverage Boulder Size (cm3)Average Bolder Weight (kg)Estimated Average Wave ht. (m)Max. Boulder Size (cm3)Max. Bolder Weight (kg)Estimated Wave Height (m)
1a2577,3031976.3179,8914707
1b2547,040120597,8422506.3
1c2557,391744.487,0002224.1
1d2537,437954.890,6752156.2
2a2565,0711665.9234,1715979.8
2b2558,6111495.5220,8965639.8

