Article

Experimental Study on 2D Motion Characteristics of Submerged Floating Tunnel in Waves

1
National Engineering Laboratory of Port Hydraulic Construction Technology, Tianjin Research Institute of Water Transport Engineering, Tianjin 300456, China
2
State Key Laboratory of Coastal and Offshore Engineering, Dalian University of Technology, Dalian 116023, China
3
College of Transportation, Shandong University of Science and Technology, Qingdao 266590, China
*
Author to whom correspondence should be addressed.
J. Mar. Sci. Eng. 2020, 8(2), 123; https://doi.org/10.3390/jmse8020123
Submission received: 29 January 2020 / Accepted: 12 February 2020 / Published: 15 February 2020
(This article belongs to the Section Ocean Engineering)

Abstract

:
Submerged floating tunnel (SFT) is a new type of transportation infrastructure for crossing sea straits in relatively deeper water. Compared with the fixed tunnel, the main challenge in designing a SFT is the stability maintaining in a complex hydrodynamic environment, especially for the wave-induced dynamic load. In this study, a series of systematic experiments were conducted to investigate the 2D motion characteristics (i.e., heave, sway and roll) of the SFT exposed to regular waves. The movement of the SFT model is measured by the image processing method which is a noncontact measurement. The experimental observation of SFT motion during the process of wave and SFT interaction is described in detail, and the influence of several governing parameters is thoroughly analyzed, including the wave height and period, submergence depth, buoyancy to weight ratio (BWR), and the mooring line angle. The results show that the motion amplitudes of SFT increase with the wave height increasing. The effect of wave period is related to the natural period of the structure. The sway, heave and roll of the SFT submerged beneath the water surface are much smaller than that of the SFT on the water surface. With the increase of BWR, the motion of SFT decreases. The motion amplitude increases with mooring line angle increasing. Finally, empirical equations are proposed to estimate the motion characteristics of the SFT.

1. Introduction

The submerged floating tunnel (hereafter referred to as SFT) is considered to be one of the competitive alternatives for crossing sea straits in relatively deeper water. Compared to available strait-crossing techniques, namely bridges, floating bridges, immersed or undersea tunnels, the SFT offers many advantages, such as having a lower environmental impact, less sensitivity to wind and seismic actions, and higher adaptability to site morphology [1]. Moreover, the SFT is also economically more affordable when long distances are to be covered [2], as well as in those cases where a long suspension bridge is not feasible and undersea tunnels have to cope with hard geotechnical problems.
In an ideal world, the SFT is not completely suspended but relatively fixed by some supporting system. According to the different supporting systems, the SFT can be classified into pontoon-type, tether-type and pile-type. The SFT maintains its stability through a balance of main loads, for instance the buoyancy, gravity and tether tension. Moreover, it is continuously exposed to wave effects on the body from the free surface. The waves in the sea tend to have particle velocity, which decays exponentially when the sea-bed is deep, but the motion of particles on the free surface tends to have some effect on the body to a considerable depth when the sea-bed is not deep [3,4]. Therefore, for an SFT to be safe during its whole life, designing it in preparation for potential waves is necessary. To date, many proposals and case studies on the SFT have been reported worldwide, which includes Høgsfjord/Bjørna fjord in Norway, the Strait of Messina in Italy, Funka Bay in Japan, Qiandao Lake in China, and the Mokpo-Jeju SFT in Korea. However, most of them are still in the concept design stage and have not yet been seen in engineering applications [5]. Recently, the Norwegian Public Road Administration has been considering the first construction of the SFT crossing ‘fjords’ in Norway and initial research has been carried out [6,7]. In China, the concept of the SFT has also been selected as one of the potential 60 future-oriented scientific and engineering technical challenges by the China Association for Science and Technology (CAST) in 2018.
Compared with the fixed tunnel, the main challenge in designing an SFT is the stability in a complex hydrodynamic environment, especially for the wave-induced dynamic load [8,9,10,11]. The wave or current induced motion of SFT involving displacements and rotations should be kept within safety limits. In this line, relevant studies have been carried out to verify structural safety in wave and seismic excitations on the SFT. Kunisu et al. [12] evaluated the SFT dynamic responses affected by the mooring-line configurations including possible snap loading. Long et al. [13] conducted parametric studies to investigate the effects of the buoyancy to weight ratio and mooring-line stiffness. Lu et al. [14] and Hong et al. [15] focused on slack mooring phenomena at various buoyancy–weight ratios of the SFT and inclination angles of mooring lines. Seo et al. [3] proposed a simplified theoretical method to estimate the 2D behavior of the SFT in waves, which showed that the mooring systems played a significant role in the motion of SFT. Sundar et al. [16] experimentally investigated the hydrodynamic loading on a fully submerged bottom moored circular cylinder due to the action of regular and random waves. Jin et al. [17] used the time-domain numerical simulation to investigate the global dynamic performance of the SFT for varying design parameters and wave conditions. They noted that the most effective way to reduce SFT motions was to increase the submergence depth. Mandara et al. [1] investigated the behavior of the SFT using numerical analyses based on computational fluid dynamics and the finite element method. However, by reviewing the previous relevant studies on SFT, the systematic experimental study on the SFT motion characteristics, especially for the influence of related parameters on the SFT movement, is scarce.
The motion behavior of a real SFT structure system is very complicated, since the SFT includes many structural components, for example, tunnel segment, connection between two segments, shore connection or mooring line, etc. Different motions of neighbor segments may have significant effects on the tunnel. It is very difficult to directly study the 3D global motion behavior by experiment due to the problem complexity and limitation of the existing facility conditions. However, from many proposals and case studies on the SFT reported worldwide, the SFT project is generally built in a place where the main direction of waves is perpendicular to longitudinal structure. According to this assumption, the 2D motion response for each segment still has a prominent effect, especially considering that the tunnel is long enough. Therefore, the main method currently is using the 2D experiment, which has been widely reported in the literature [3]. The main output of 2D provides support for analyzing the 3D motion characteristics, and identifying the environmental factors related to SFT, and it is useful for establishing the appropriate measures to address construction, for instance, reducing the motions.
This study focuses on the motion characteristics of a tether-type SFT under different wave conditions using a series of 2D physical experiments, with the main purpose being the sensitivity analysis of influencing parameters from hydrodynamic and structural aspects. The model is simplified as a 2D case. The remainder of this paper is structured as follows. First, the experimental setup as well as the motion analysis method is presented. Next, the structural dynamic characteristics of the SFT are determined. The experimental observations of SFT motion during the process of wave and SFT interaction are described in detail. Following this, the time series of motion characteristics are discussed. The influence of several governing parameters on the motion characteristics is thoroughly analyzed. Finally, the empirical equations are proposed to estimate the SFT motion characteristics.

2. Experimental Setup

2.1. Experimental Facility

In this study, the experiments were conducted in a large 2D wave flume with 90 m length, 3 m width, and 1.8 m height, at the Tianjin Research Institute of Water Transport Engineering. For the wave flume, the two wall sides of the wave flume are made of glass which enables direct observation during the experiments. It is equipped with a paddle wave maker in the flume inlet, which is capable of generating regular and irregular waves. The wave absorbers are set at the outlet side, which is capable of effectively absorbing the reflected waves.
The SFT model was manufactured based on the prototype design suggested for a part of the link crossing in China. The diameter of the circular cross-section of the prototype SFT was 12.8 m, and water depth was 56 m. The movement of the prototype SFT was confined by tension legs that are fixed to the sea floor bottom. Taking into account of the dimension of the wave flume, the model scale was determined to be 1/80 of the prototype structure based on Froude similitude for a real world SFT project.
The present SFT model was made of PVC and steel materials, with the diameter of 0.16 m and length of 0.987 m. The model was sealed to prevent water penetration into it. In order to obtain different buoyancy to weight ratio (BWR), lead blocks were placed inside the SFT model. As depicted in Figure 1, the model was moored by wires linked to the front and rear sides of the model to fix it above the bottom. Three standard color blocks (i.e., red, green and blue) were stuck on the surface of the section in order to track the movement of the model. This will be described in detail in the following section.

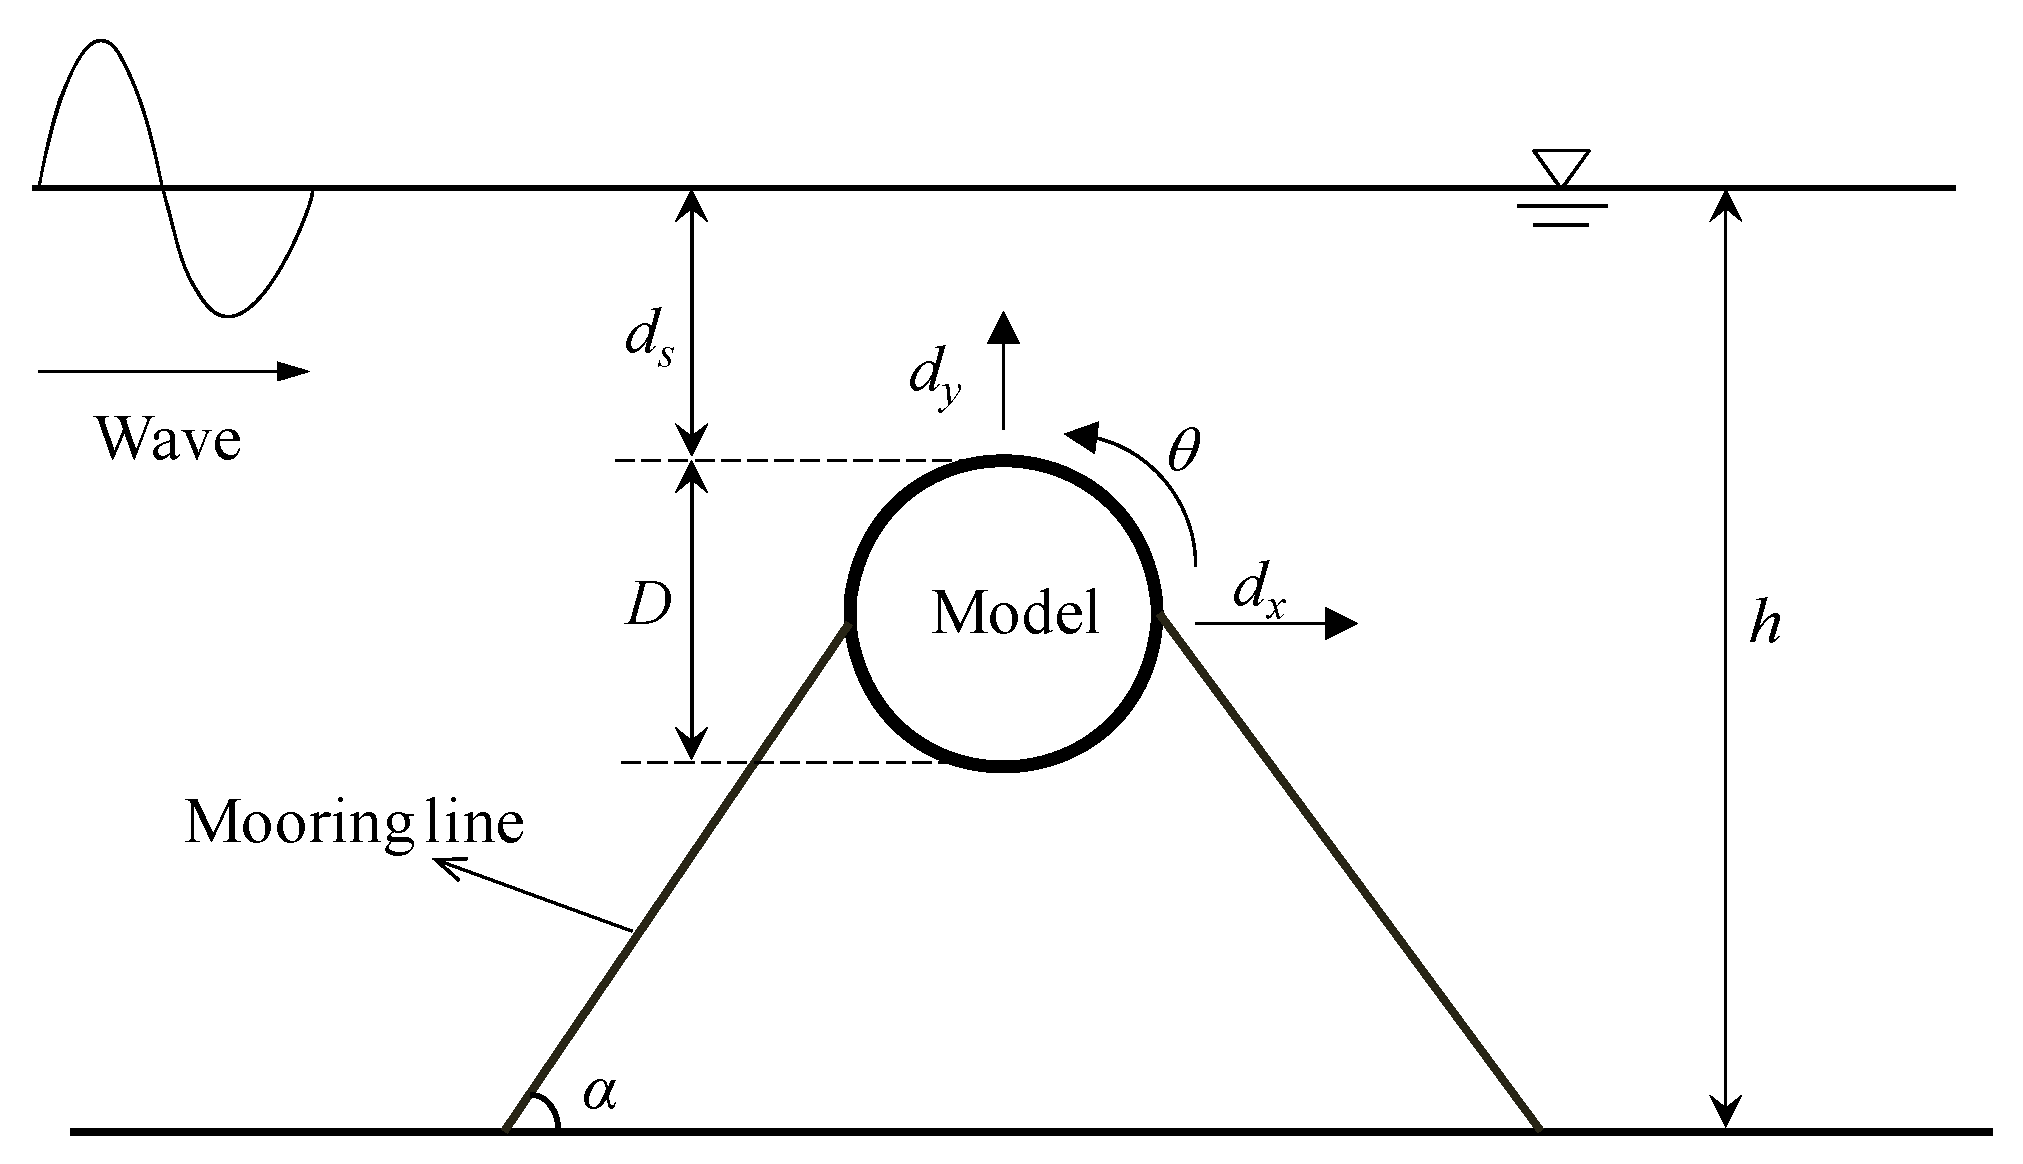
2.2. Parameters Definition

The present experiment was simplified as a 2D set up. Figure 2 presents the definition sketch of the moored SFT, in which some governing parameters were defined, including water depth h, submergence depth ds, diameter of the circular section D, and mooring line angle α. The motion characteristics of SFT, involving the sway, heave and roll are denoted by dx, dy, and θ, respectively, which will be mainly focused on in the results analysis and discussion.

2.3. Experimental Condition

In this experiment, we mainly focus on the influence of design parameters of SFT model and the wave conditions. The regular wave conditions are considered and listed in Table 1, where H and T represent wave height and period, respectively, and kA represents dimensionless wave number. Additionally, to investigate the influence of submergence depth ds, BWR, mooing line angle α, these parameters were varied and selected as: ds = [−6, 9.5, 27] cm; BWR = 1.03, 1.54, 1.90; α = 20°, 30°, 90°. It should be noted that the submergence depth is defined as the distance from the top of model to the still water level. Hence, for the case of the model located on the water surface, the submergence depth is negative, such as ds = −6 cm. Generally, a total of 77 combination tests were conducted in this study. Since this paper does not consider the effect of mooring-line stiffness, all the mooring-lines were made of wire rope with low elongation. Hence, the stiffness can be considered to be infinity. In the present experiment, some physical quantities for both the model and prototype of SFT are listed in Table 2, including the buoyancy, mass and the corresponding inertia moment for different BWR. For the SFT model, the location of the lead blocks inside was carefully adjusted to keep the gravity center, mass center and geometric center of the model homocentric.

2.4. Motion Analysis Method

In the present experiment, the movement of the SFT model was measured through the image processing method, which is a nonintrusive technology with high-precision trajectory prediction of a moving object [18,19]. The images analyzed were captured using a digital camera with a frequency of 60 Hz, such that the time interval between two frames was 0.0167 s. The spatial resolution of the image is 1920 × 1024 pixels and the measurement accuracy of the movement is ±0.1 mm. From the recorded videos data, the displacements can be extracted based on a video image processing script written by MATLAB. As shown in Figure 3, three trackers (i.e., red, green, and blue) were placed on the surface of the model, and the video images were in an RGB color scheme. Hence, it is possible to isolate a tracker by subtracting the grayscale image from the corresponding RGB component. In order to track an object, the detailed processing procedure is as follows:
(1)
Load video file
(2)
Retrieve video frames
(3)
Create time stamp of the frames
(4)
For each frame:
a
Isolate the tracker
b
Calculate centroid and storing values
(5)
Scale values to real distances
(6)
Export data

3. Results and Discussion

3.1. Structural Dynamic Characteristics

Before conducting the systematic experiments of the SFT motion exposed to waves, the free decay test was performed to determine the structural dynamic characteristics of the SFT. It was determined under still water conditions at a submergence depth of 17.5 cm. A force was applied to give the model an initial displacement. Subsequently the force was removed and the response was recorded. The time series of the displacement is depicted in Figure 4. It should be noted that the 8 cm for BWR = 1.54 and 20 cm for BWR = 1.9 denote the initial displacements rather than the motion amplitudes of the model. For the sway, no clear natural vibration was found, but the heave showed an obvious dampened periodic signal. Correspondingly, the natural period T0 and natural frequency ω0 of the SFT for different BWR were obtained and are listed in Table 3. As can be seen, with the increase of BWR, the natural period decreases and the natural frequency increases. We found that the natural period T0 for the case of BWR = 1.54 was 0.96 s, which is close to some wave conditions with wave period T = 0.92 s (as listed in Table 1). This means that resonance may have occurred for these wave conditions, which should be avoided in real world SFT engineering.

3.2. Observation of SFT Motion

Figure 5 presents the observation of SFT motion during the process of wave and SFT interaction under different conditions. At the moment of t = 0, the SFT is initially still in the water. Figure 5a,b show the experimental observations for the cases of SFT on the water surface, and Figure 5c shows the observation for the case of SFT submerged under the water surface. At the moment of t = T/4, when the wave crest arrives at the SFT, a significant movement of SFT is found with large displacement and rotation. At this moment, the SFT moves to the highest point and rolls anticlockwise. The mooring line in front of the SFT is stretched tightly while that at the back becomes slack, which implies that the tension for the front line becomes largest while that for the rear line becomes zero. At the moment of t = 3T/4, when the wave trough arrives, the SFT moves downwards and rolls clockwise, meanwhile the front mooring line of the SFT becomes slack, while the rear line is stretched tightly.
Compared to the phenomenon observed in Figure 5a, the wave overtopping is clearly observed in Figure 5b due to its large wave height, and the associated jet flow is formed at the back of the SFT, which induces large air entrainment and wave breaking. In reality, the submerged floating tunnel is normally under the water surface and the breaking wave may have little influence on the structure. However, as a fundamental study on the hydrodynamic of submerged floating horizontal cylinder, the case with the model on the surface and subjected to breaking waves should not be excluded, for example, during its construction phase. For the case of the SFT submerged under the water surface as shown in Figure 5c, the movement of the SFT becomes significantly small because the influence of the free surface becomes weak.
Figure 6 shows the xy-trajectories of SFT motion under different conditions. It generally demonstrates that the SFT moves towards the left bottom and the trajectories are mainly in the third quadrant, except for the case of mooring line angle α = 90° which shows a swing movement. More specifically, we can qualitatively identify the influence of related parameters on the SFT movement: (1) the amplitude of movement increases with increasing wave height (Figure 6a), whereas it decreases with increasing wave period (Figure 6b); (2) the motion amplitude is reduced significantly once the SFT is submerged under the water surface (Figure 6c); (3) with the increase of mooring line angle α, the mooring line mainly restricts the vertical movement while the horizontal movement is relaxed, which results in the sway of the SFT becomes larger than the heave (Figure 6d).

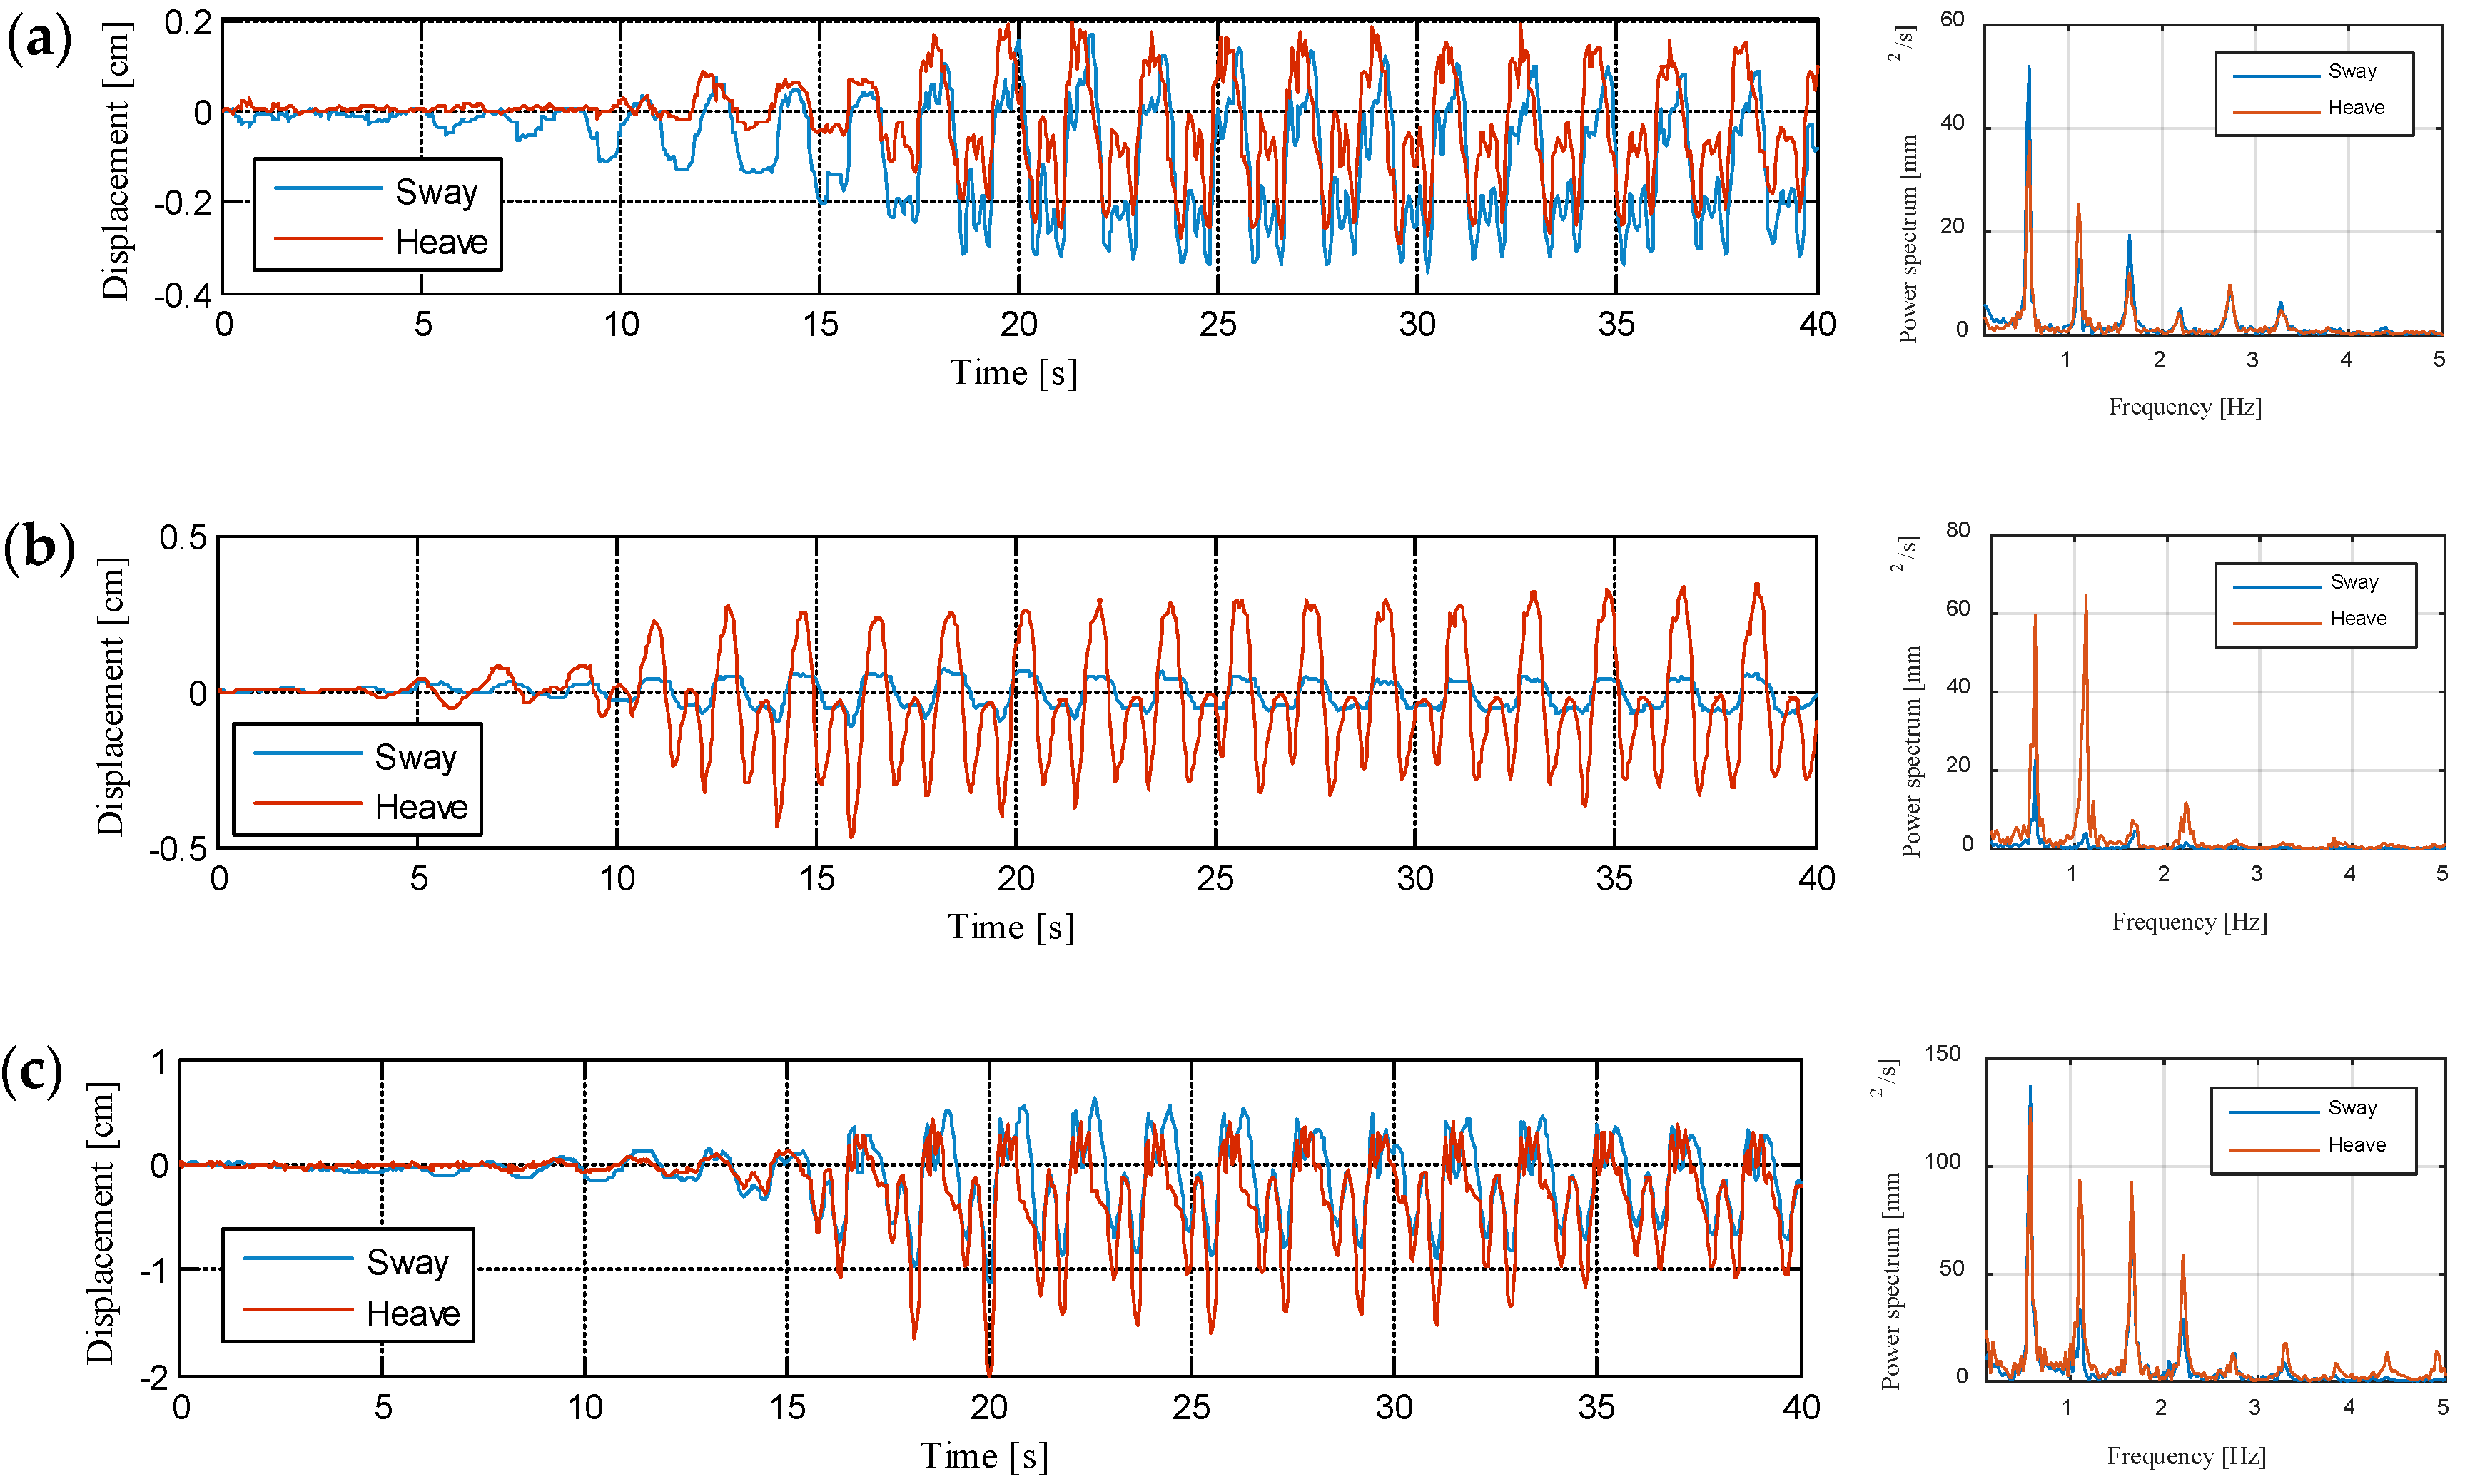
3.3. Time Series and Spectral Analysis of Motion Characteristics

Figure 7 demonstrates the time series as well as spectral analysis of motion characteristics of SFT under the condition of T = 1.41 s, H = 0.08 m, BWR = 1.9, ds = −6 cm, α = 30°. Clearly, the motion of SFT exhibits significant regular variation with time under regular wave, and the motion period is consistent with the wave period. The time series indicates that when the incident wave arrives at the SFT model, the model starts to move, and then the motion characteristics gradually increase, and finally reach stable states. In order to verify the stable state, the corresponding trajectories for different periods are presented separately in Figure 7c. At the initial stage of the first 10 s, the movement of SFT model is very small. The model subsequently experiences an adjustment stage during the period of 11–20 s as the trajectories gradually extend. During the period of 21–30 s, there still exists slight difference between the trajectories. After 30 s, the trajectories almost coincide indicating that the movement reaches the stable state. The amplitude of heave is approximately 4 cm, which is relatively larger than the sway amplitude (3 cm), and the value of roll exceeds 10°. If we extend this experimental result to the prototype based on the scaling factor of 1/80, the amplitudes of sway and heave can reach 2 m and 1.5 m, respectively.
Since no real SFT project exists yet in the world, there is no recommended value on the allowable value of motion for SFT. However, by referencing the relevant study on floating bridges of US, it is noted that the motion value should be less than 1/500 of the length. It means that if the length of the tunnel is 1000 m, the allowable value of motion is 2 m. Hence, this value is related to the length of the tunnel. In the present study, the model is simplified as a 2D case without considering the effect of length, thus it is difficult to recommend an allowable value of the motion. It is interesting that the fluctuation occurred near the peak value of sway and heave, as shown in Figure 7a. This phenomenon is due to the tension of mooring line inducing the vibration of SFT model, which was also observed from the video record of the SFT motion. Figure 8 shows the time series combined with spectral analysis of sway and heave for different mooring line angle and BWR conditions. Figure 8b shows the results for the case of α = 20°, which indicates that the sway is obviously smaller than the heave. The reason is that the mooring line mainly restricts the horizontal movement of the SFT, which has been also illustrated from the trajectories as shown in Figure 6c. Figure 8c shows that the sway and heave are increased as the BWR (=1.54) is decreased. As for the detailed analysis of the influencing parameters, it will be presented in the next section.
In order to assess the periodicity and verify the appearance of super-harmonics of the SFT movement, the spectral analysis was also conducted by using fast Fourier transformation (FFT) of time-series data. The corresponding results are plotted at the right of Figure 7 and Figure 8. As can be seen, there exist several peaks in different frequency regions. The most significant peak is in the low-frequency region, for which the frequency corresponds to the wave frequency, (i.e., ω = 1/T). The frequency for the secondary highest peak is approximately twice that of the main frequency. Through inspection of the time series in the left, the secondary peak is always appeared closely after the main peak. In other words, there exist two peaks for the SFT motion characteristics in one wave period. In addition to the low-frequency peaks due to the action of the linear regular waves, several high-frequency peaks are also observed reflecting the nonlinear phenomenon of SFT response. As mentioned, when the SFT moves to the highest position, the mooring line is stretched tightly, and the vibration of SFT is occurred induced by the tension of mooring line. From the point of SFT safety, the influence of this nonlinear response or vibration induced by the structure and mooring line interaction should be considered and controlled in the real-world engineering.

3.4. Influencing Parameters Analysis
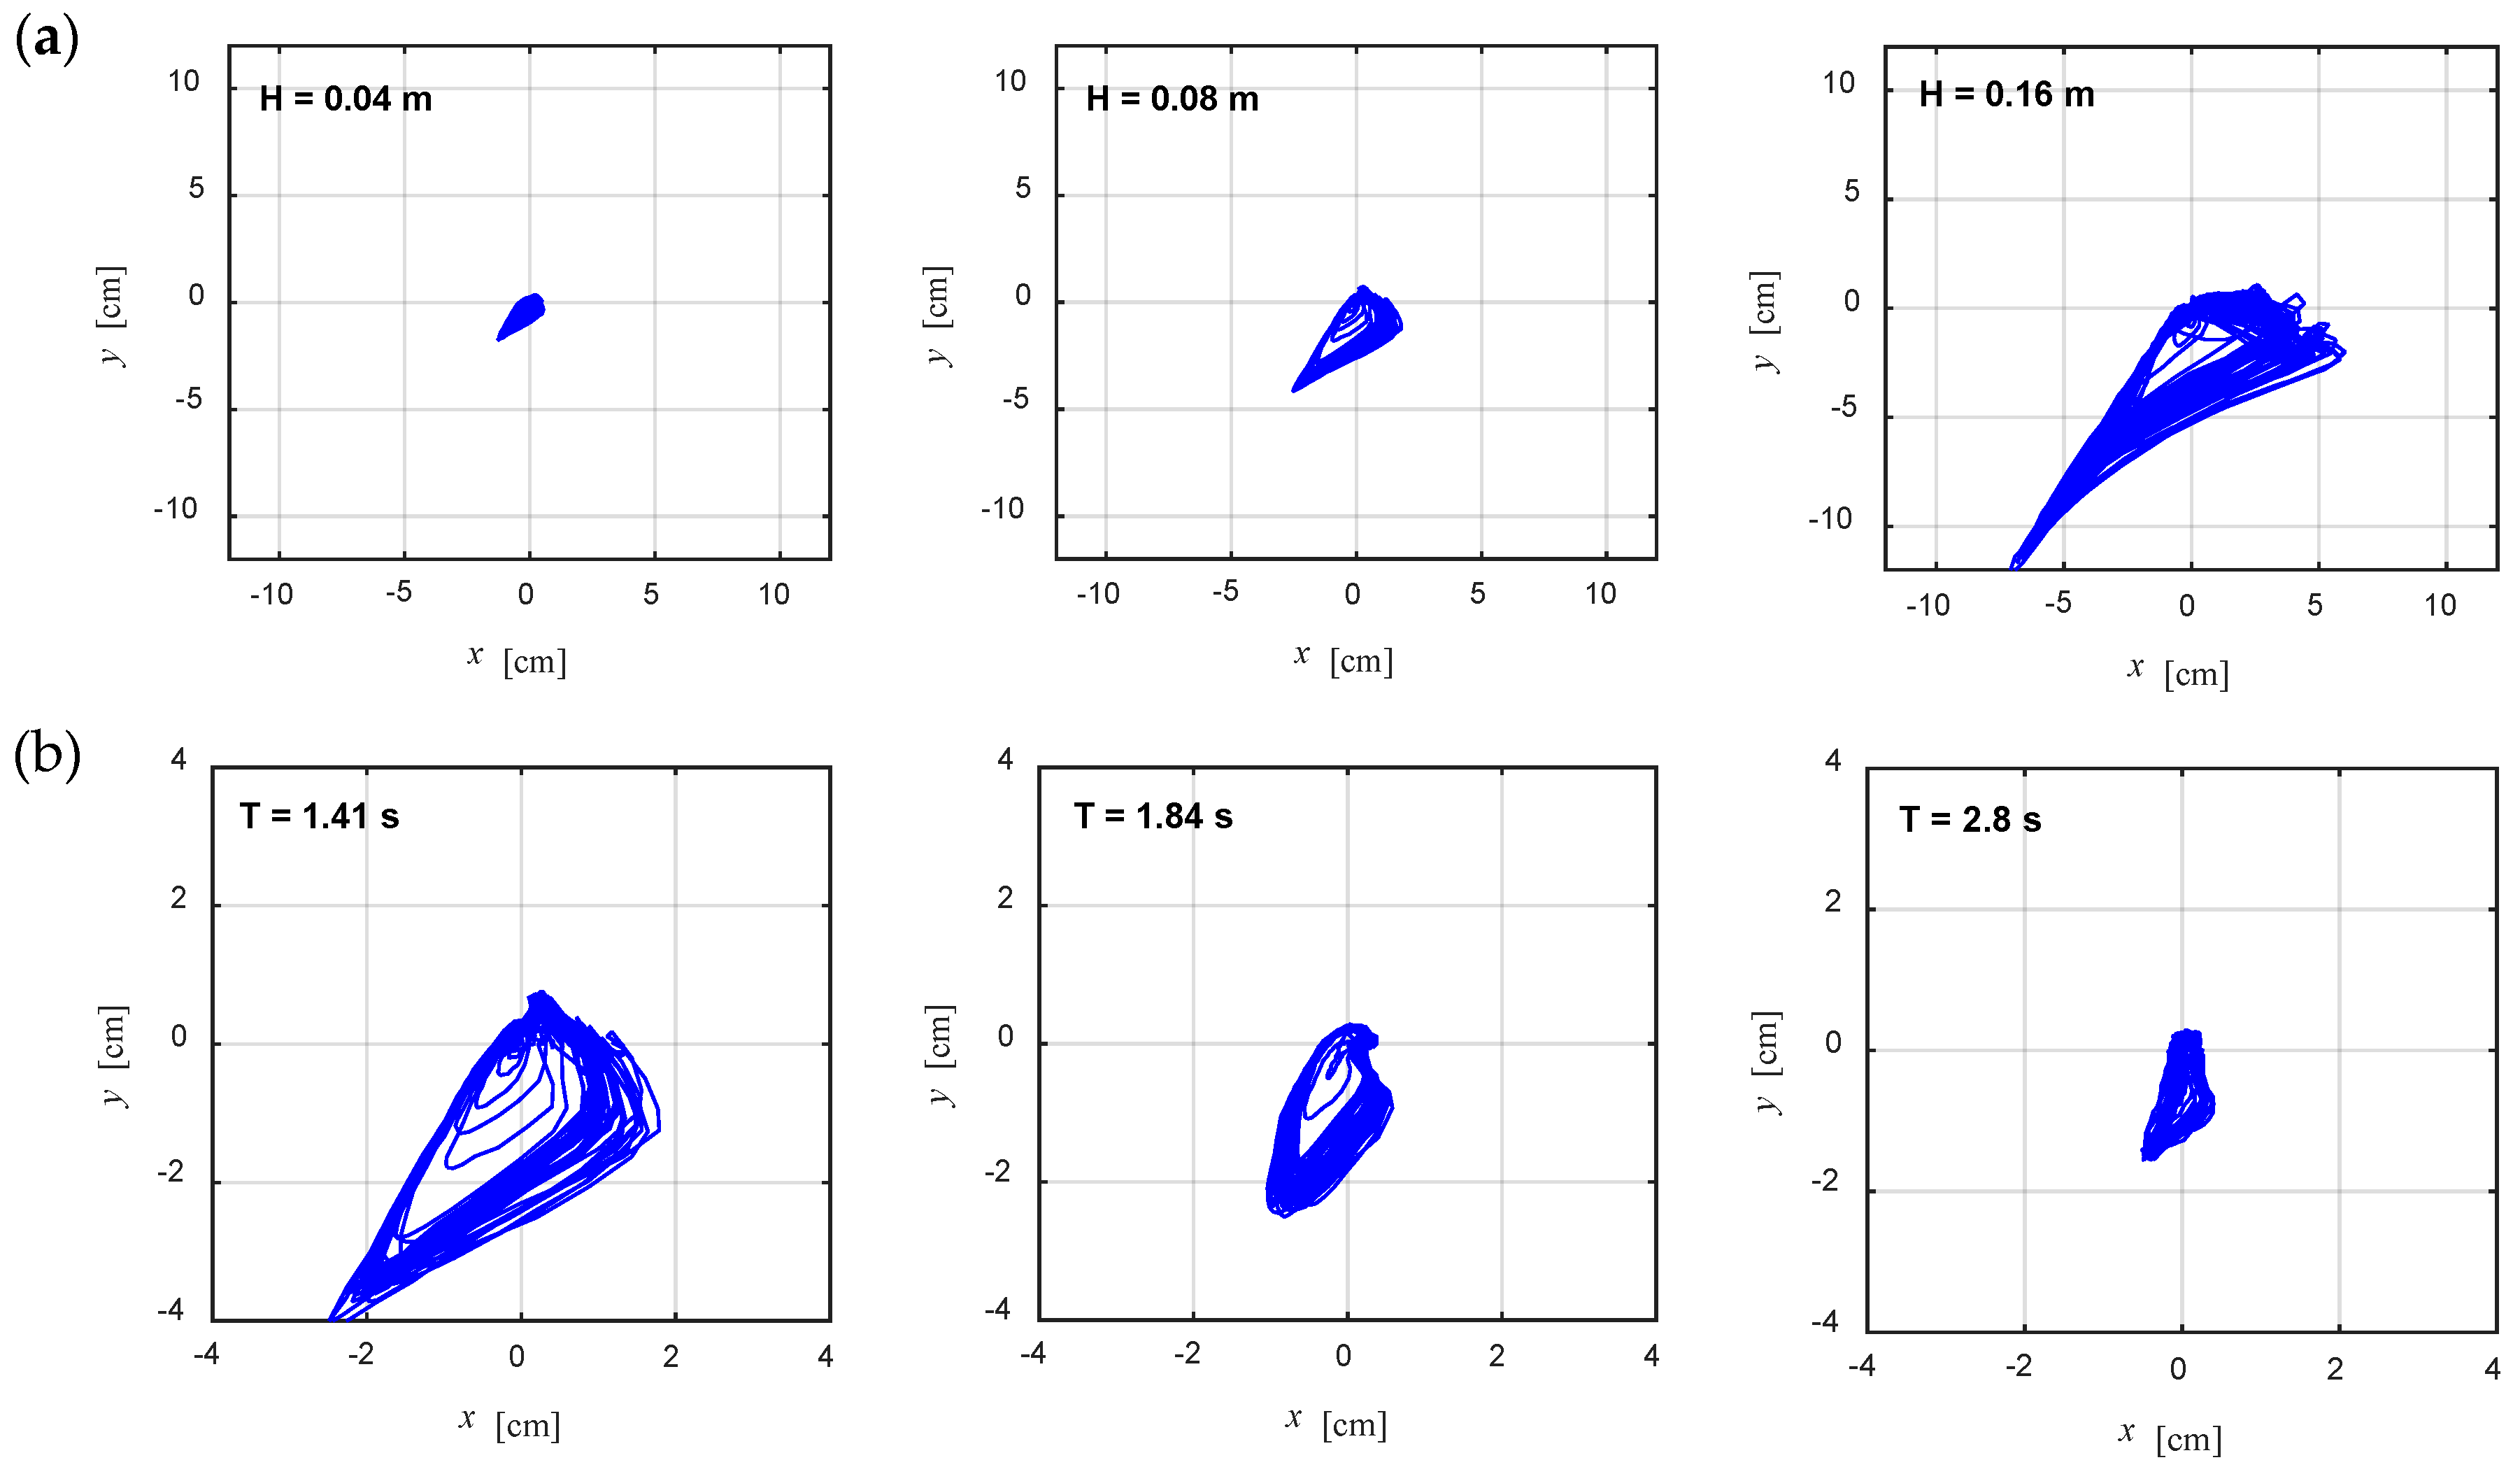
In this section, the influence of several governing parameters on the SFT motion characteristics will be thoroughly analyzed, involving wave height H and period T, submergence depth ds, BWR, and mooring line angle α.

3.4.1. Wave Height

Figure 9 shows the motion characteristics varied with wave height in different wave periods for the case of BWR = 1.5, ds = 9.5 cm, α = 30°. In this figure, the motion characteristics are normalized by the diameter of model D. It clearly shows that as the wave height increases, each of the motion characteristic amplitude increases. This is reasonable because waves with a large wave height support more energy, as well as a large wave force to drive the SFT model moving. Additionally, Figure 9 also shows that for the cases of T = 0.92 s, the motion characteristics are obviously larger compared to other cases. As mentioned in the section on structural dynamic characteristics, the natural period T0 for the SFT of BWR = 1.54 is 0.96 s, which is close to the wave period of T = 0.92 s, and hence the resonance may have occurred, which intensifies the SFT movement.

3.4.2. Wave Period

Figure 10 shows the influence of wave period T on the sway, heave and roll. As can be seen, the motion amplitude shows a decreasing tendency with the increase of T. To further identify the effect of wave period, we only selected the results with varied T and kept the other parameters at almost constant value, as plotted in Figure 11. The trajectories indicate that the movement becomes small as the wave period increases. In fact, the influence of wave period T is related to the natural period T0 of the structure. Figure 11b indicates that the motion characteristics are significantly enlarged when T is close to T0 (the dashed vertical line) due to the resonance. With the wave period farther away from the natural period of the structure, the motion characteristics decrease, and the rate of decrease becomes small. Therefore, in the design of SFT, the natural period should be adjusted to be far away from the wave period, such that the resonance can be avoided in order to guarantee the stability of the structure.

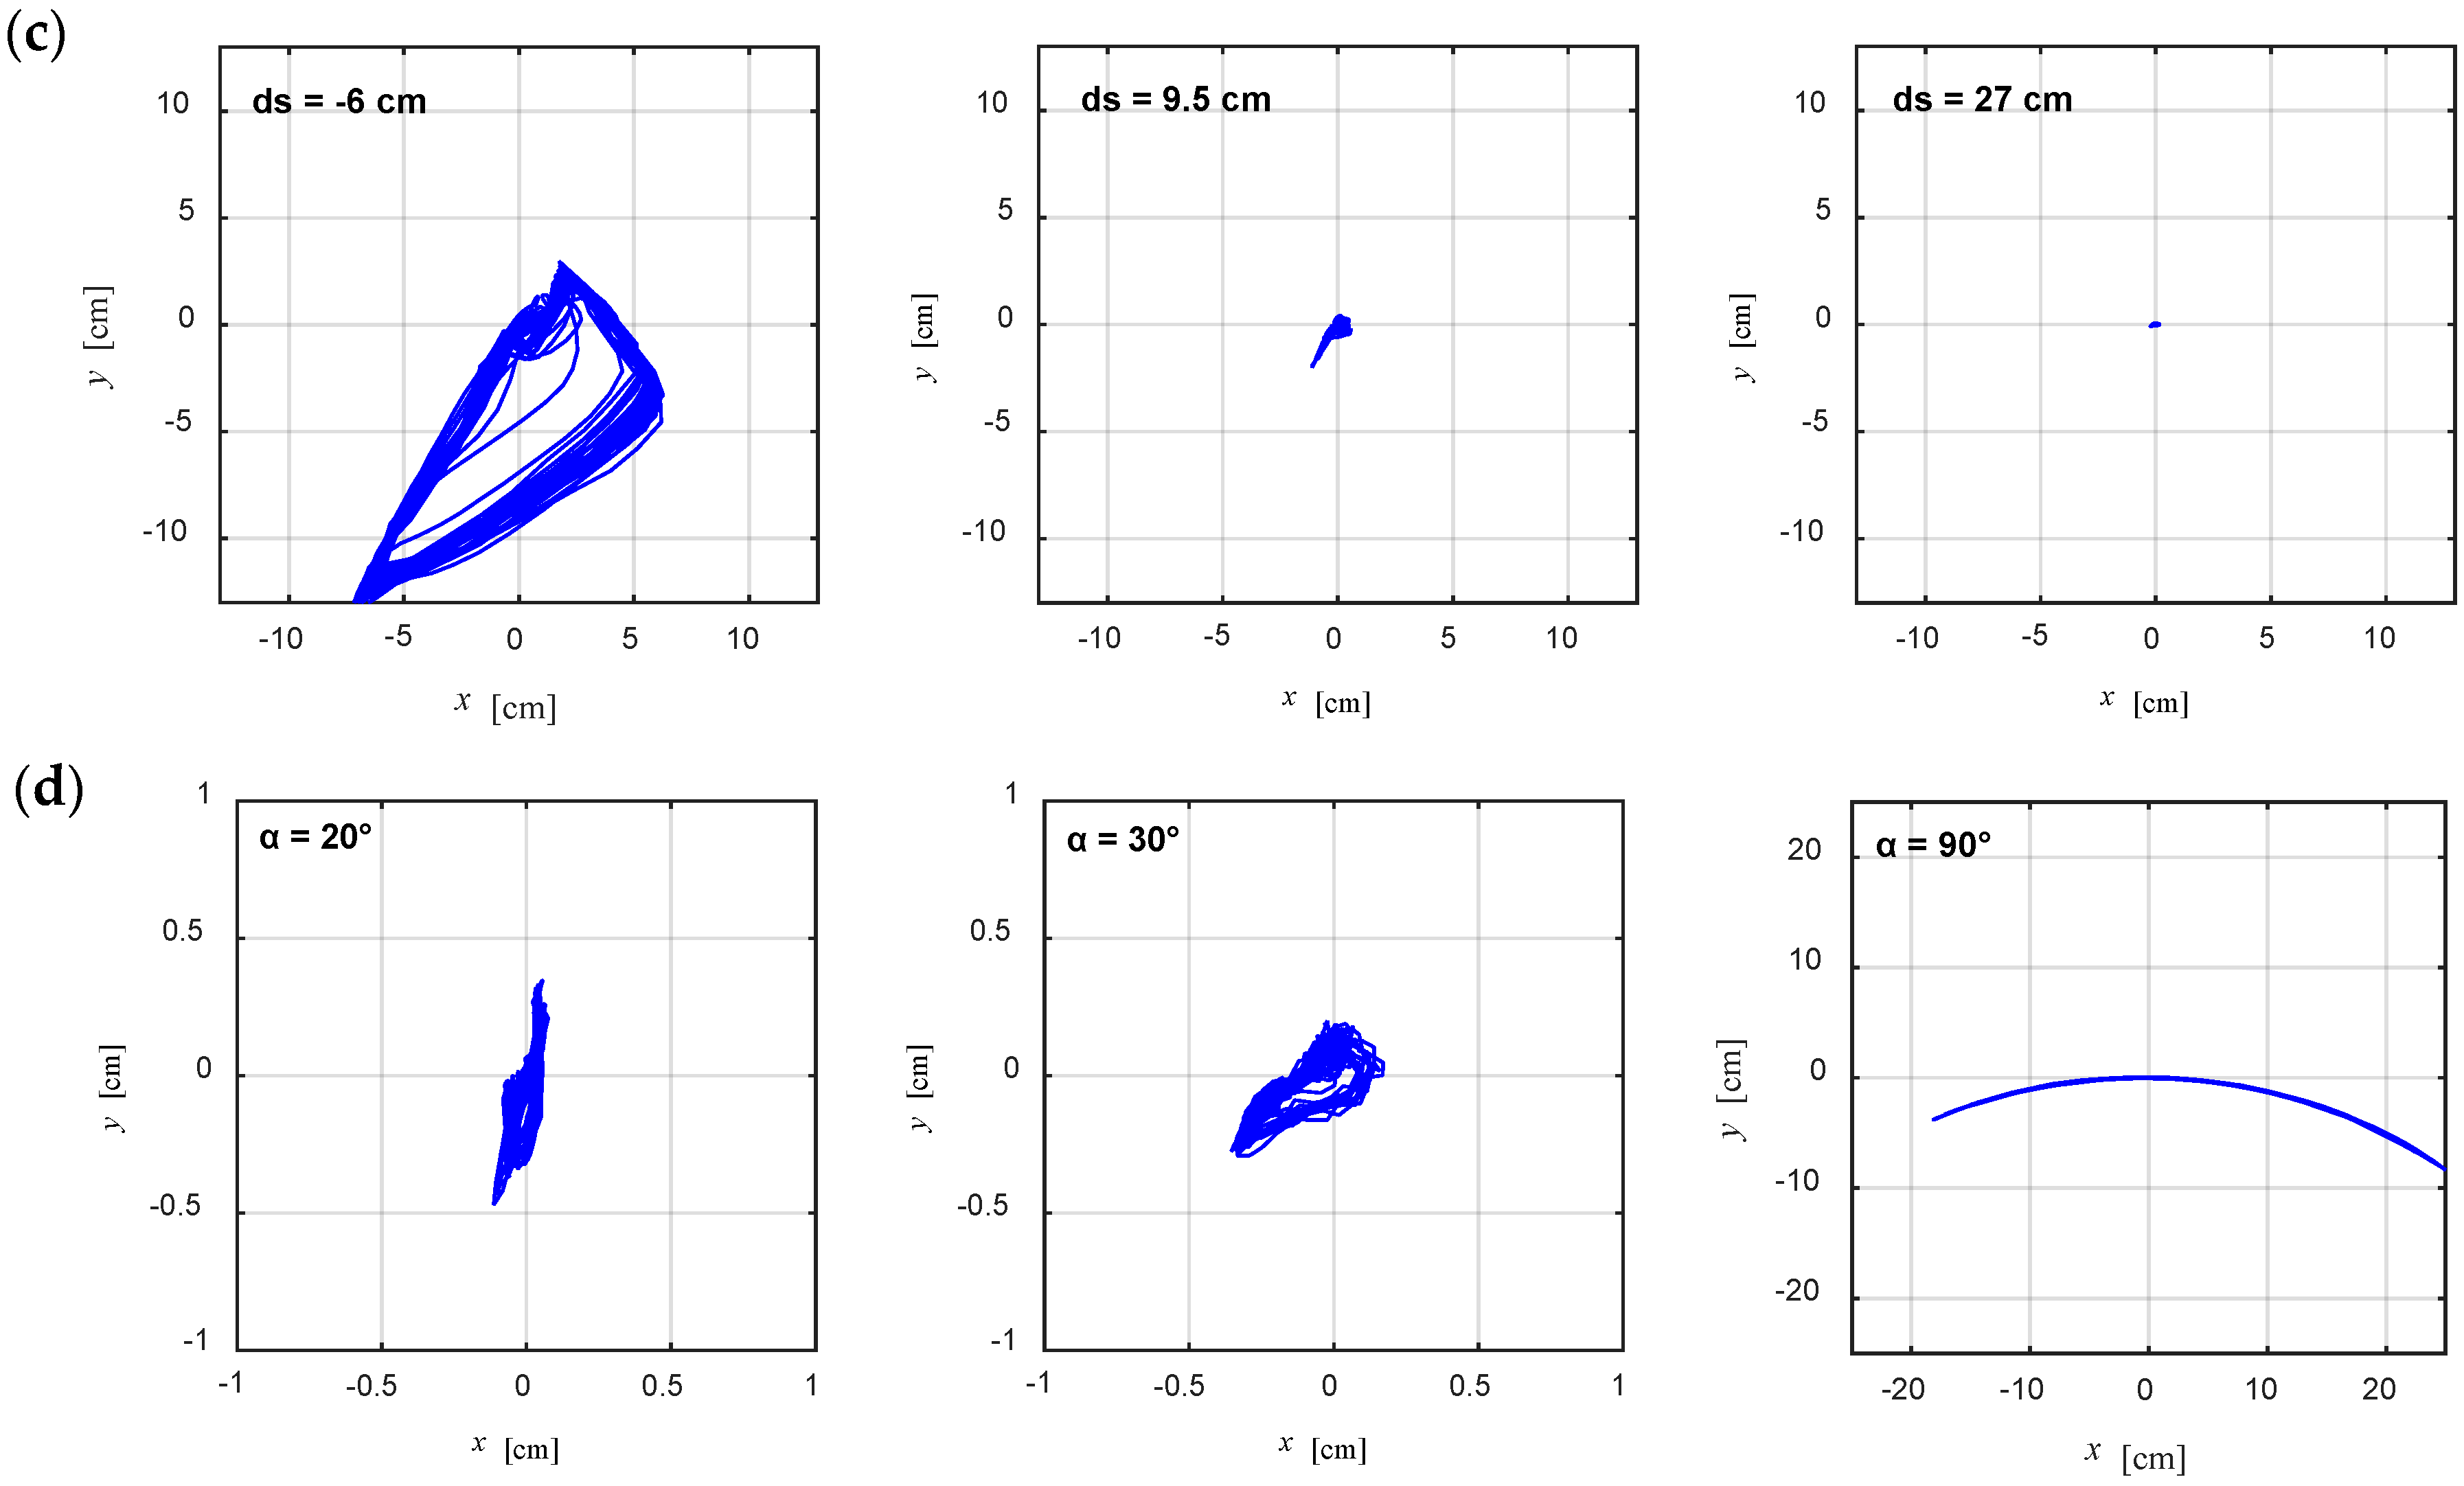
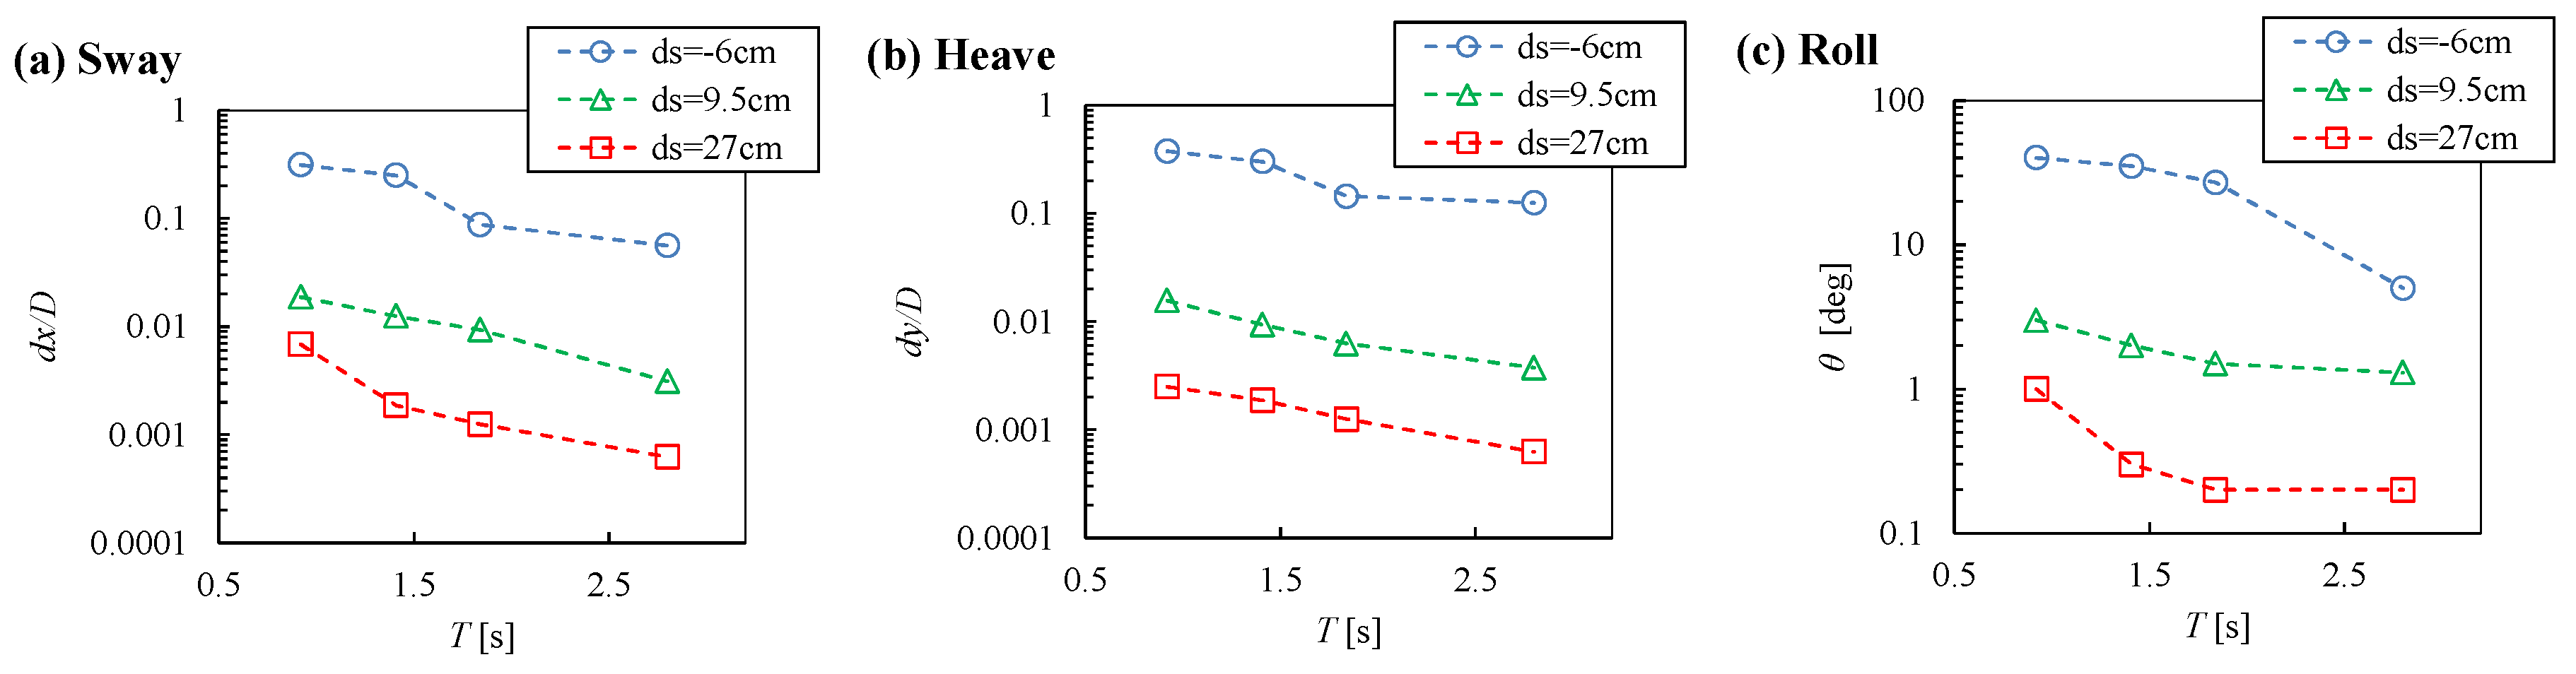
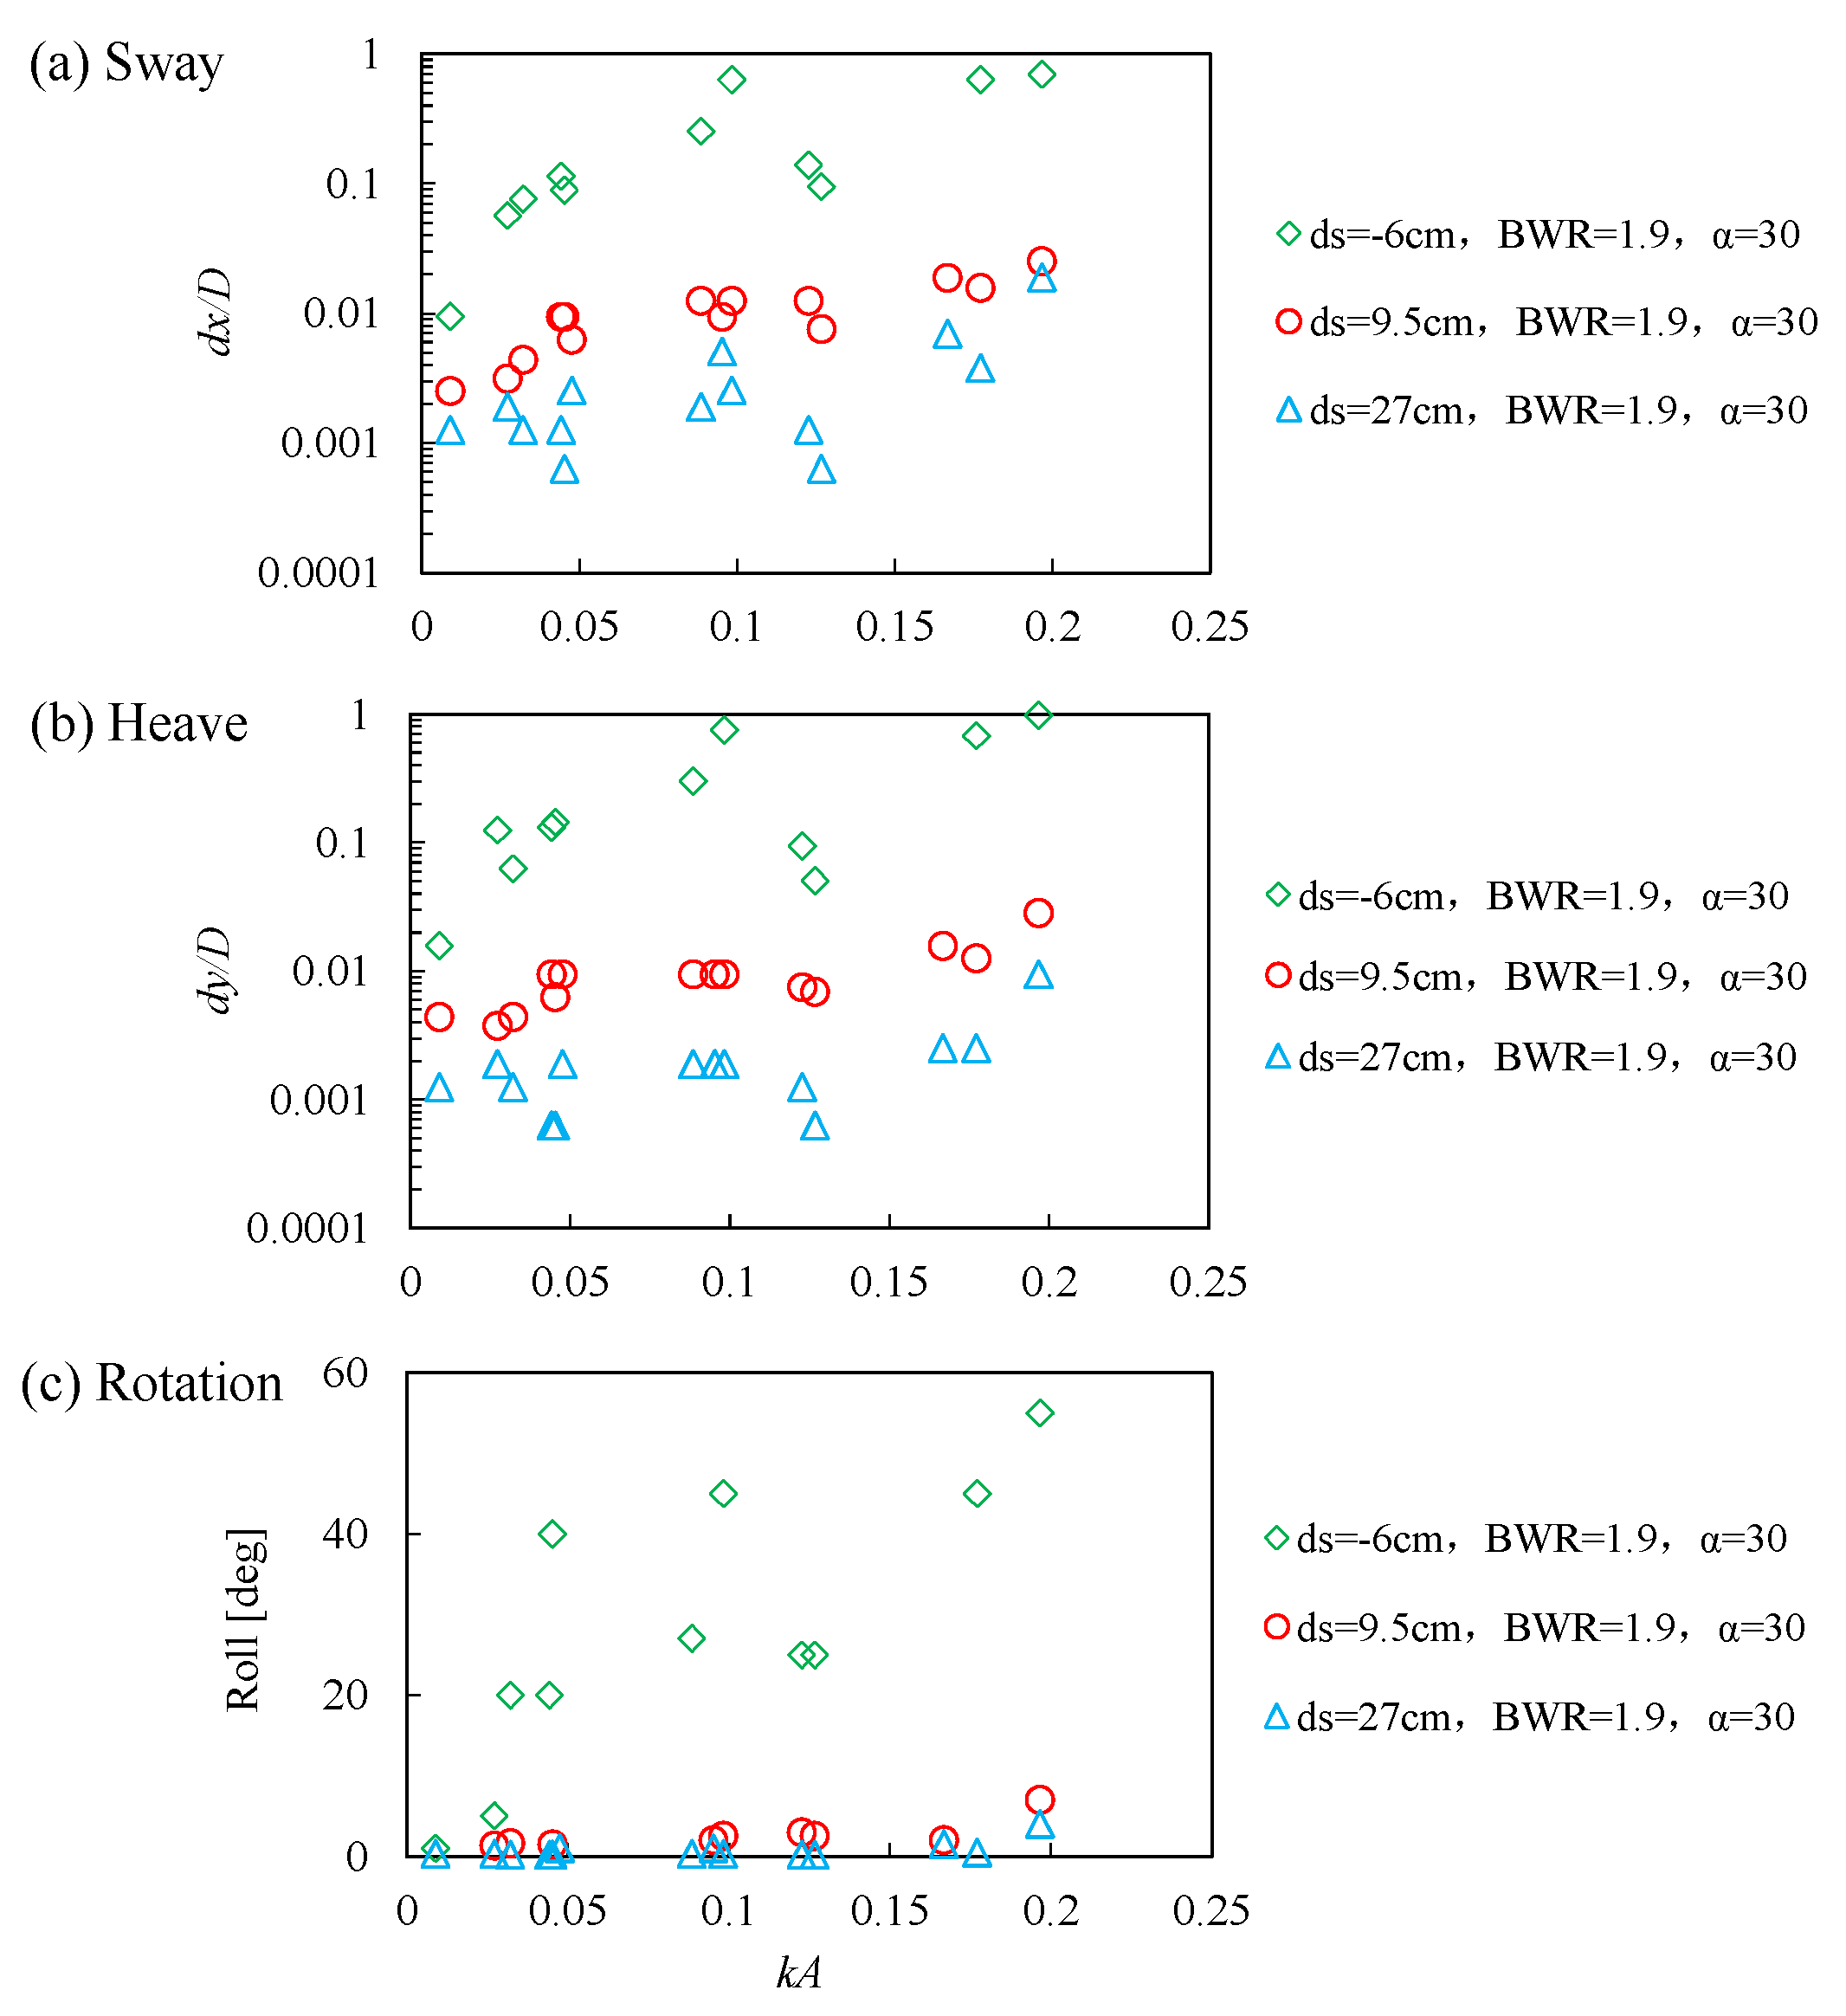
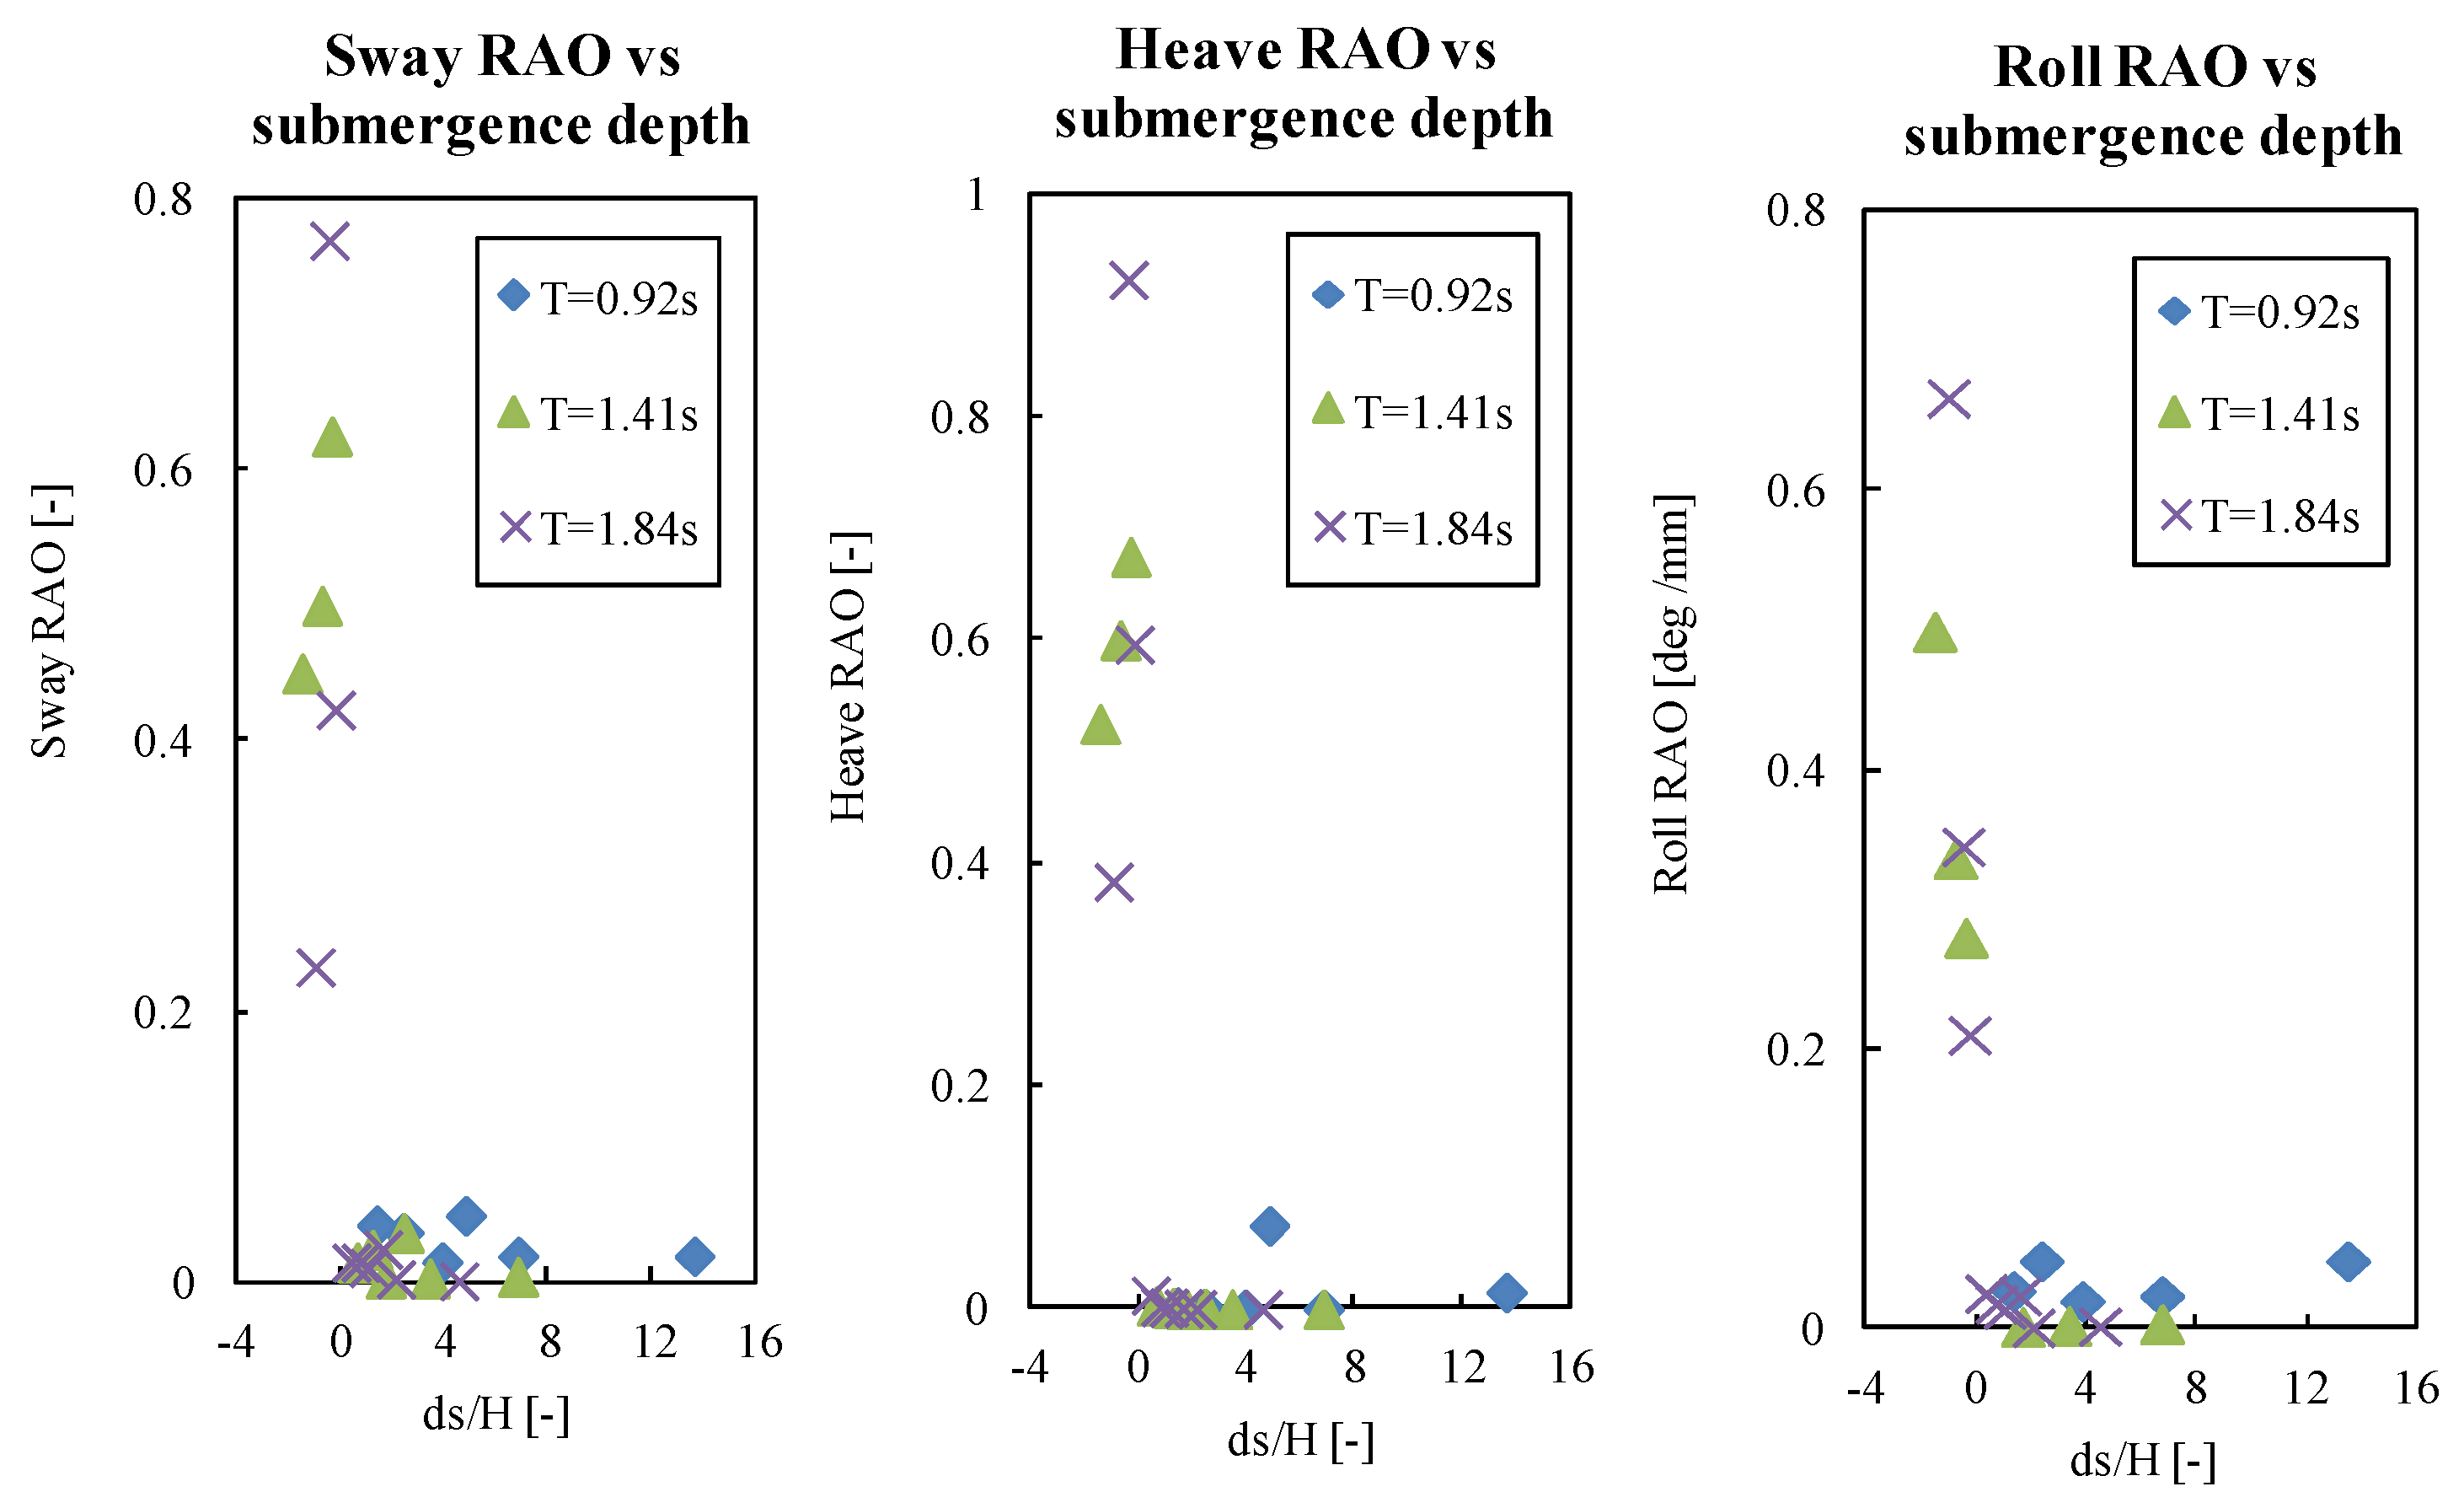
3.4.3. Submergence Depth

The motion characteristics of SFT under different submergence depths are plotted in Figure 12, where the horizontal axis kA represents the dimensionless wave number. The results show that the motion amplitude for the case with ds = −6 cm (i.e., SFT model is located at the water surface) is much larger than that of the submerged cases (i.e., ds = 9.5 cm and 27 cm), and particularly for the sway and heave, the amplitude for the case of ds = −6 cm is almost an order larger. For the case of ds = 27 cm, the amplitude of each motion characteristic is small, particularly for the value of roll that is almost zero as shown in Figure 12c. In addition, the variations of motion characteristics with kA do not exhibit a clear tenancy. In general, the amplitudes of motion characteristics decrease significantly with submergence depth.
Figure 13 presents the motion characteristics of sway, heave and roll varied with submergence depth. Each motion amplitude is normalized by wave amplitude, and represented by a dimensionless parameter RAO (Response Amplitude Operator). The horizontal axis is represented by the dimensionless submergence depth ds/H. It clearly shows that for the submerged case of SFT locating under the water surface, i.e., ds/H > 0, the RAO of sway, heave and roll is much smaller than that of the SFT located on the water surface, i.e., ds/H < 0. This result is expected because the flow particle velocity near the water surface is maximum along the water depth, and thus the wave force on the SFT induced by the surface wave is the largest compared to the cases of the SFT beneath the water surface.

3.4.4. Buoyancy to Weight Ratio

Figure 14 shows the motion characteristics of SFT under different BWR conditions. It can be seen that the motion amplitude generally decreases with the increasing BWR. The motion amplitude in the condition of BWR = 1.03 is much larger than the other cases. From the video record we can observe that the SFT with BWR = 1.03 moves apparently once exposed to small wave action, and even the occurrence of the slack of mooring line which induces that SFT sinks towards the bottom of flume for some large wave conditions. It therefore indicates that when the BWR is close to one, that is, the buoyancy is close to weight, the SFT become very unstable, which must be avoided in the design. Comparing the results of BWR = 1.54 with BWR = 1.9, the motion amplitudes for these two cases are similar. This illustrates that with the increase of BWR the decrease of motion amplitude tends to be insignificant. In other words, the motion amplitude does not decrease linearly with BWR but yields a reduced decreasing rate. Nevertheless, it needs further study to identify the quantitative relationship between the SFT motion and BWR.

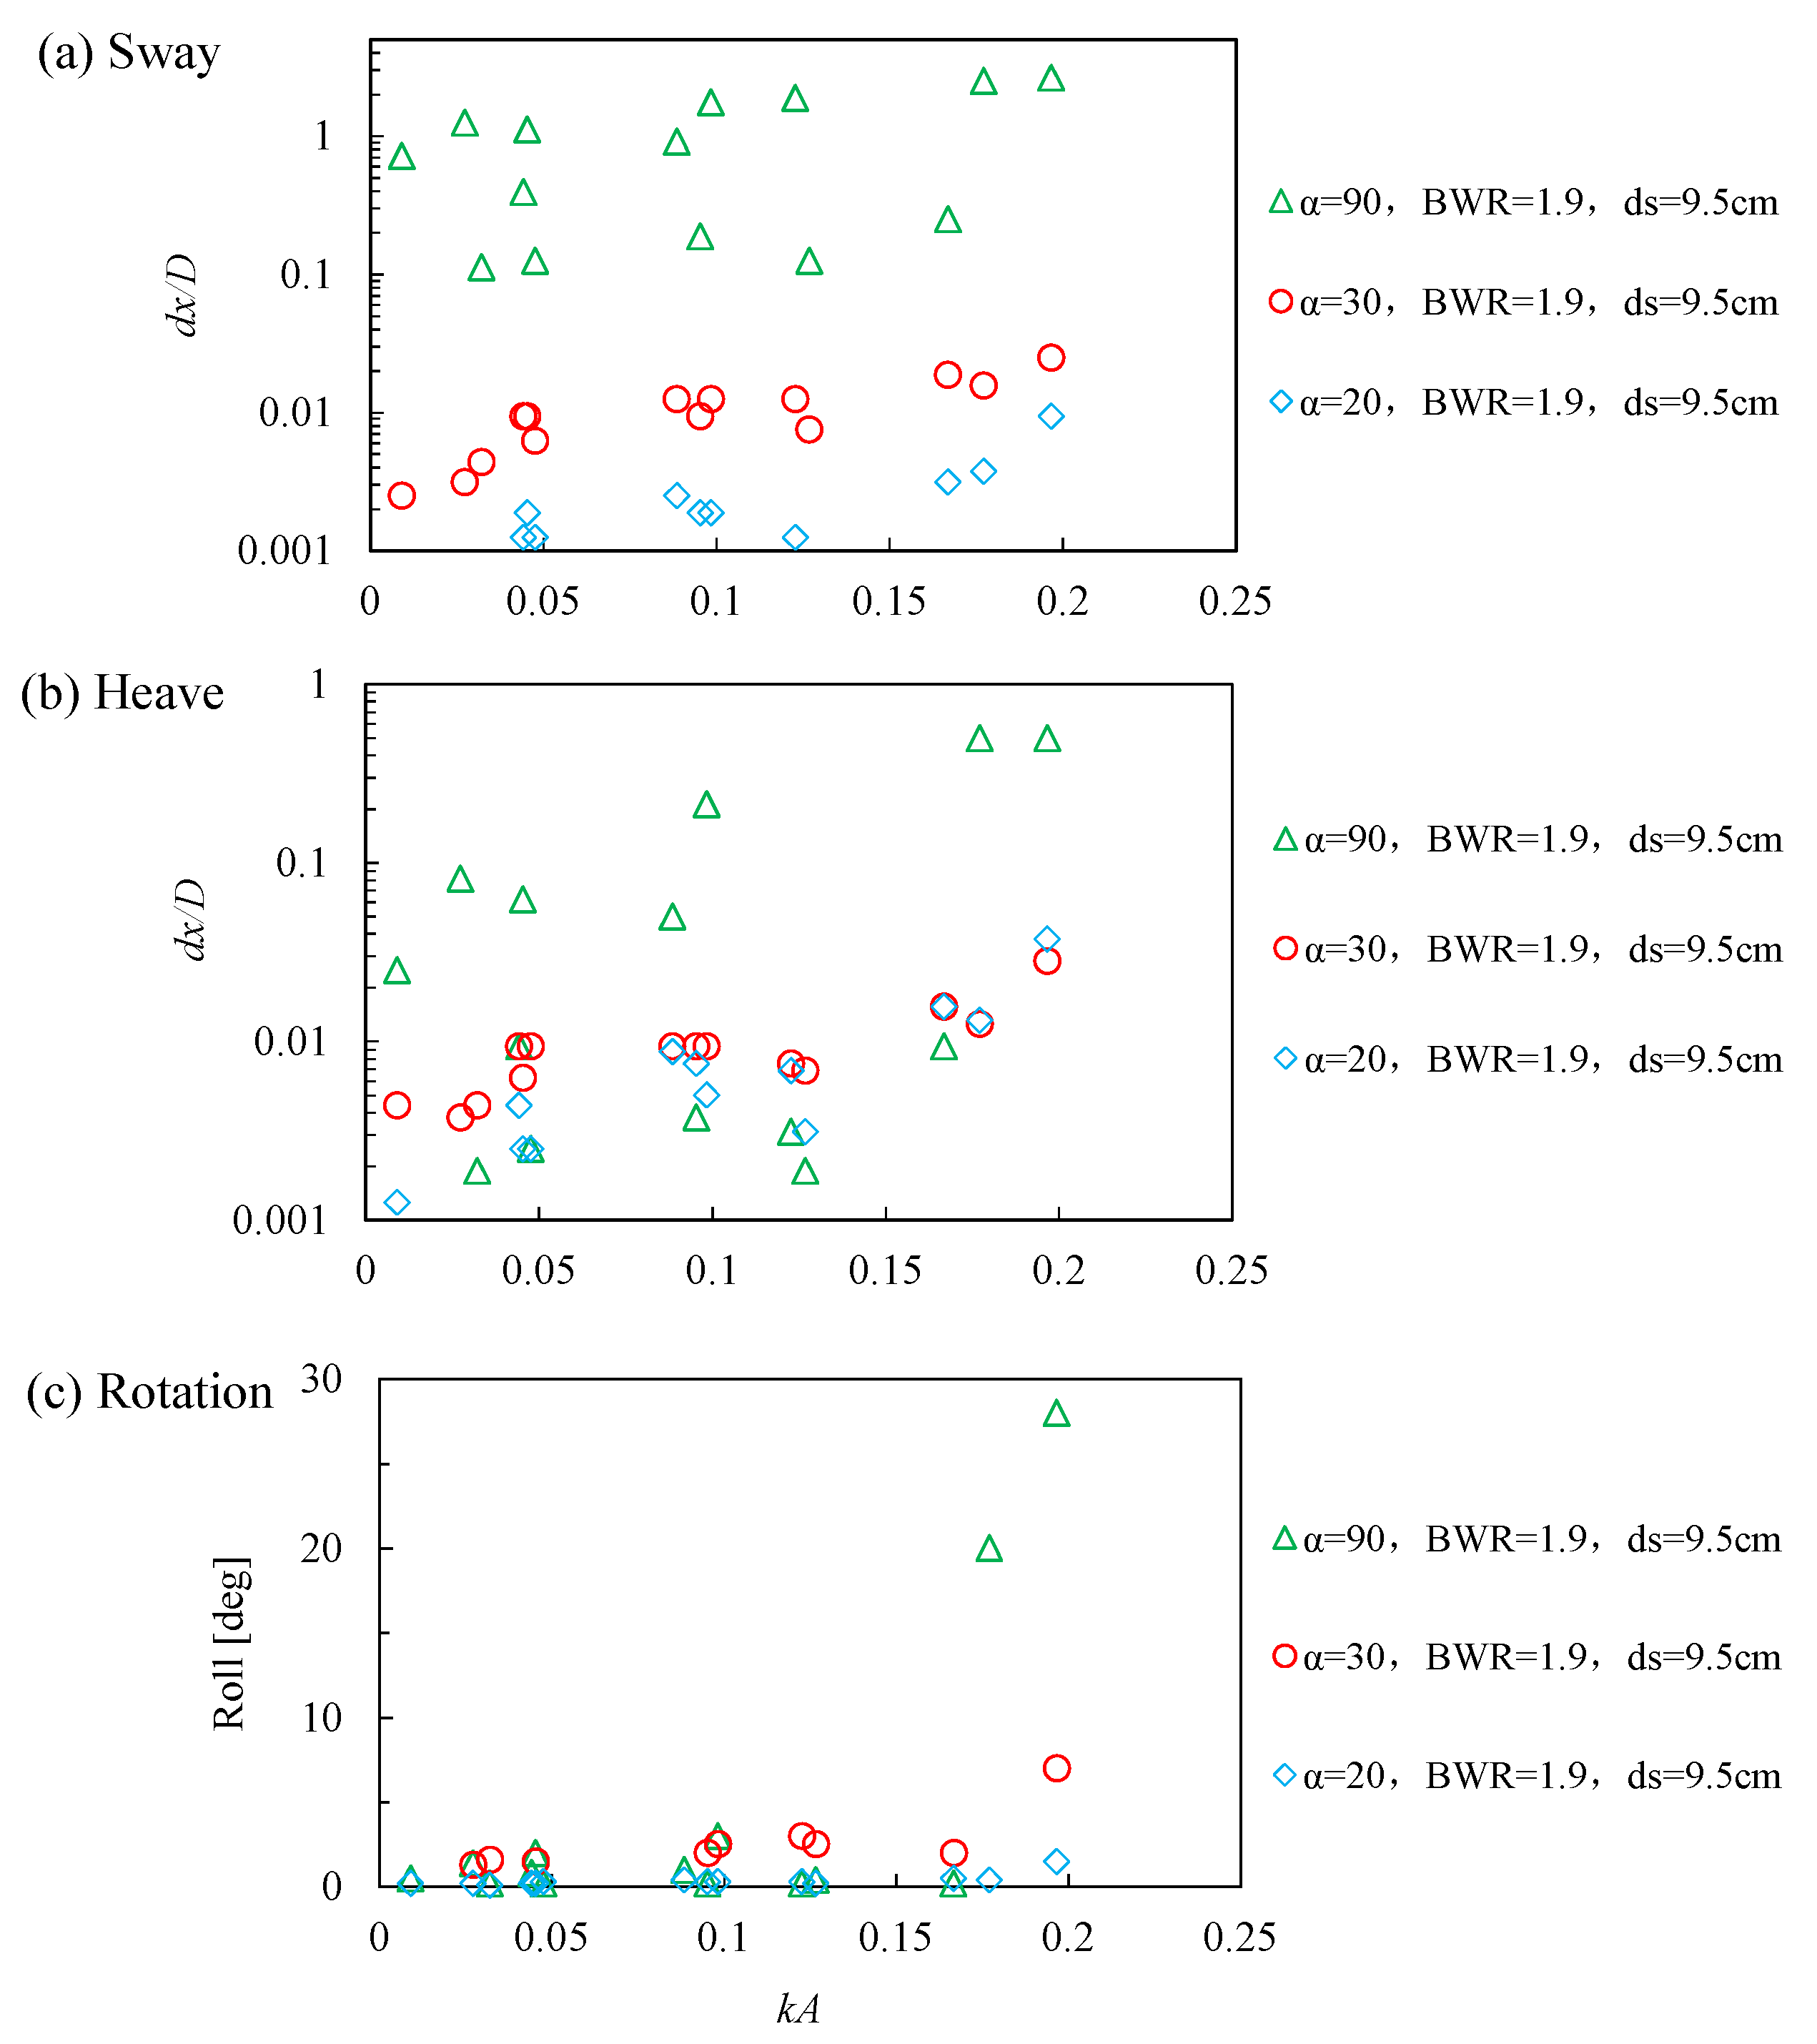
3.4.5. Mooring Line Angle

Figure 15 plots the results of motion characteristics for the cases with different mooring line angle. The general tenancy indicates that the motion amplitude decreases with decreasing mooring line angle. For the case of α = 90°, the sway is obviously larger than the other cases due to the absence of horizontal restraint. For the case of α = 20°, the motion amplitude is the minimum, which indicates that the SFT with α = 20° is more optimum from the view of structure stability and safety. It should be noted that this result is based on the limited data of three mooring line angles conditions considered in the present experiment.
Based on the parameters effects analysis in the present study and the previous literature, we believe that the following suggestions can be taken into account to reduce the motion against wave excitation: (1) Optimize the mooring line configuration. For example, increase mooring line number or use X-type arrangement. (2) Increase the stiffness of the mooring line by using some rigid material. (3) Increase the stiffness of the tunnel through structural optimization. (4) Optimize the design parameters of the structure, making sure the natural period of the structure is far away from the wave period to avoid the resonance. All the aforementioned points will be investigated in the forthcoming 3D experiment.

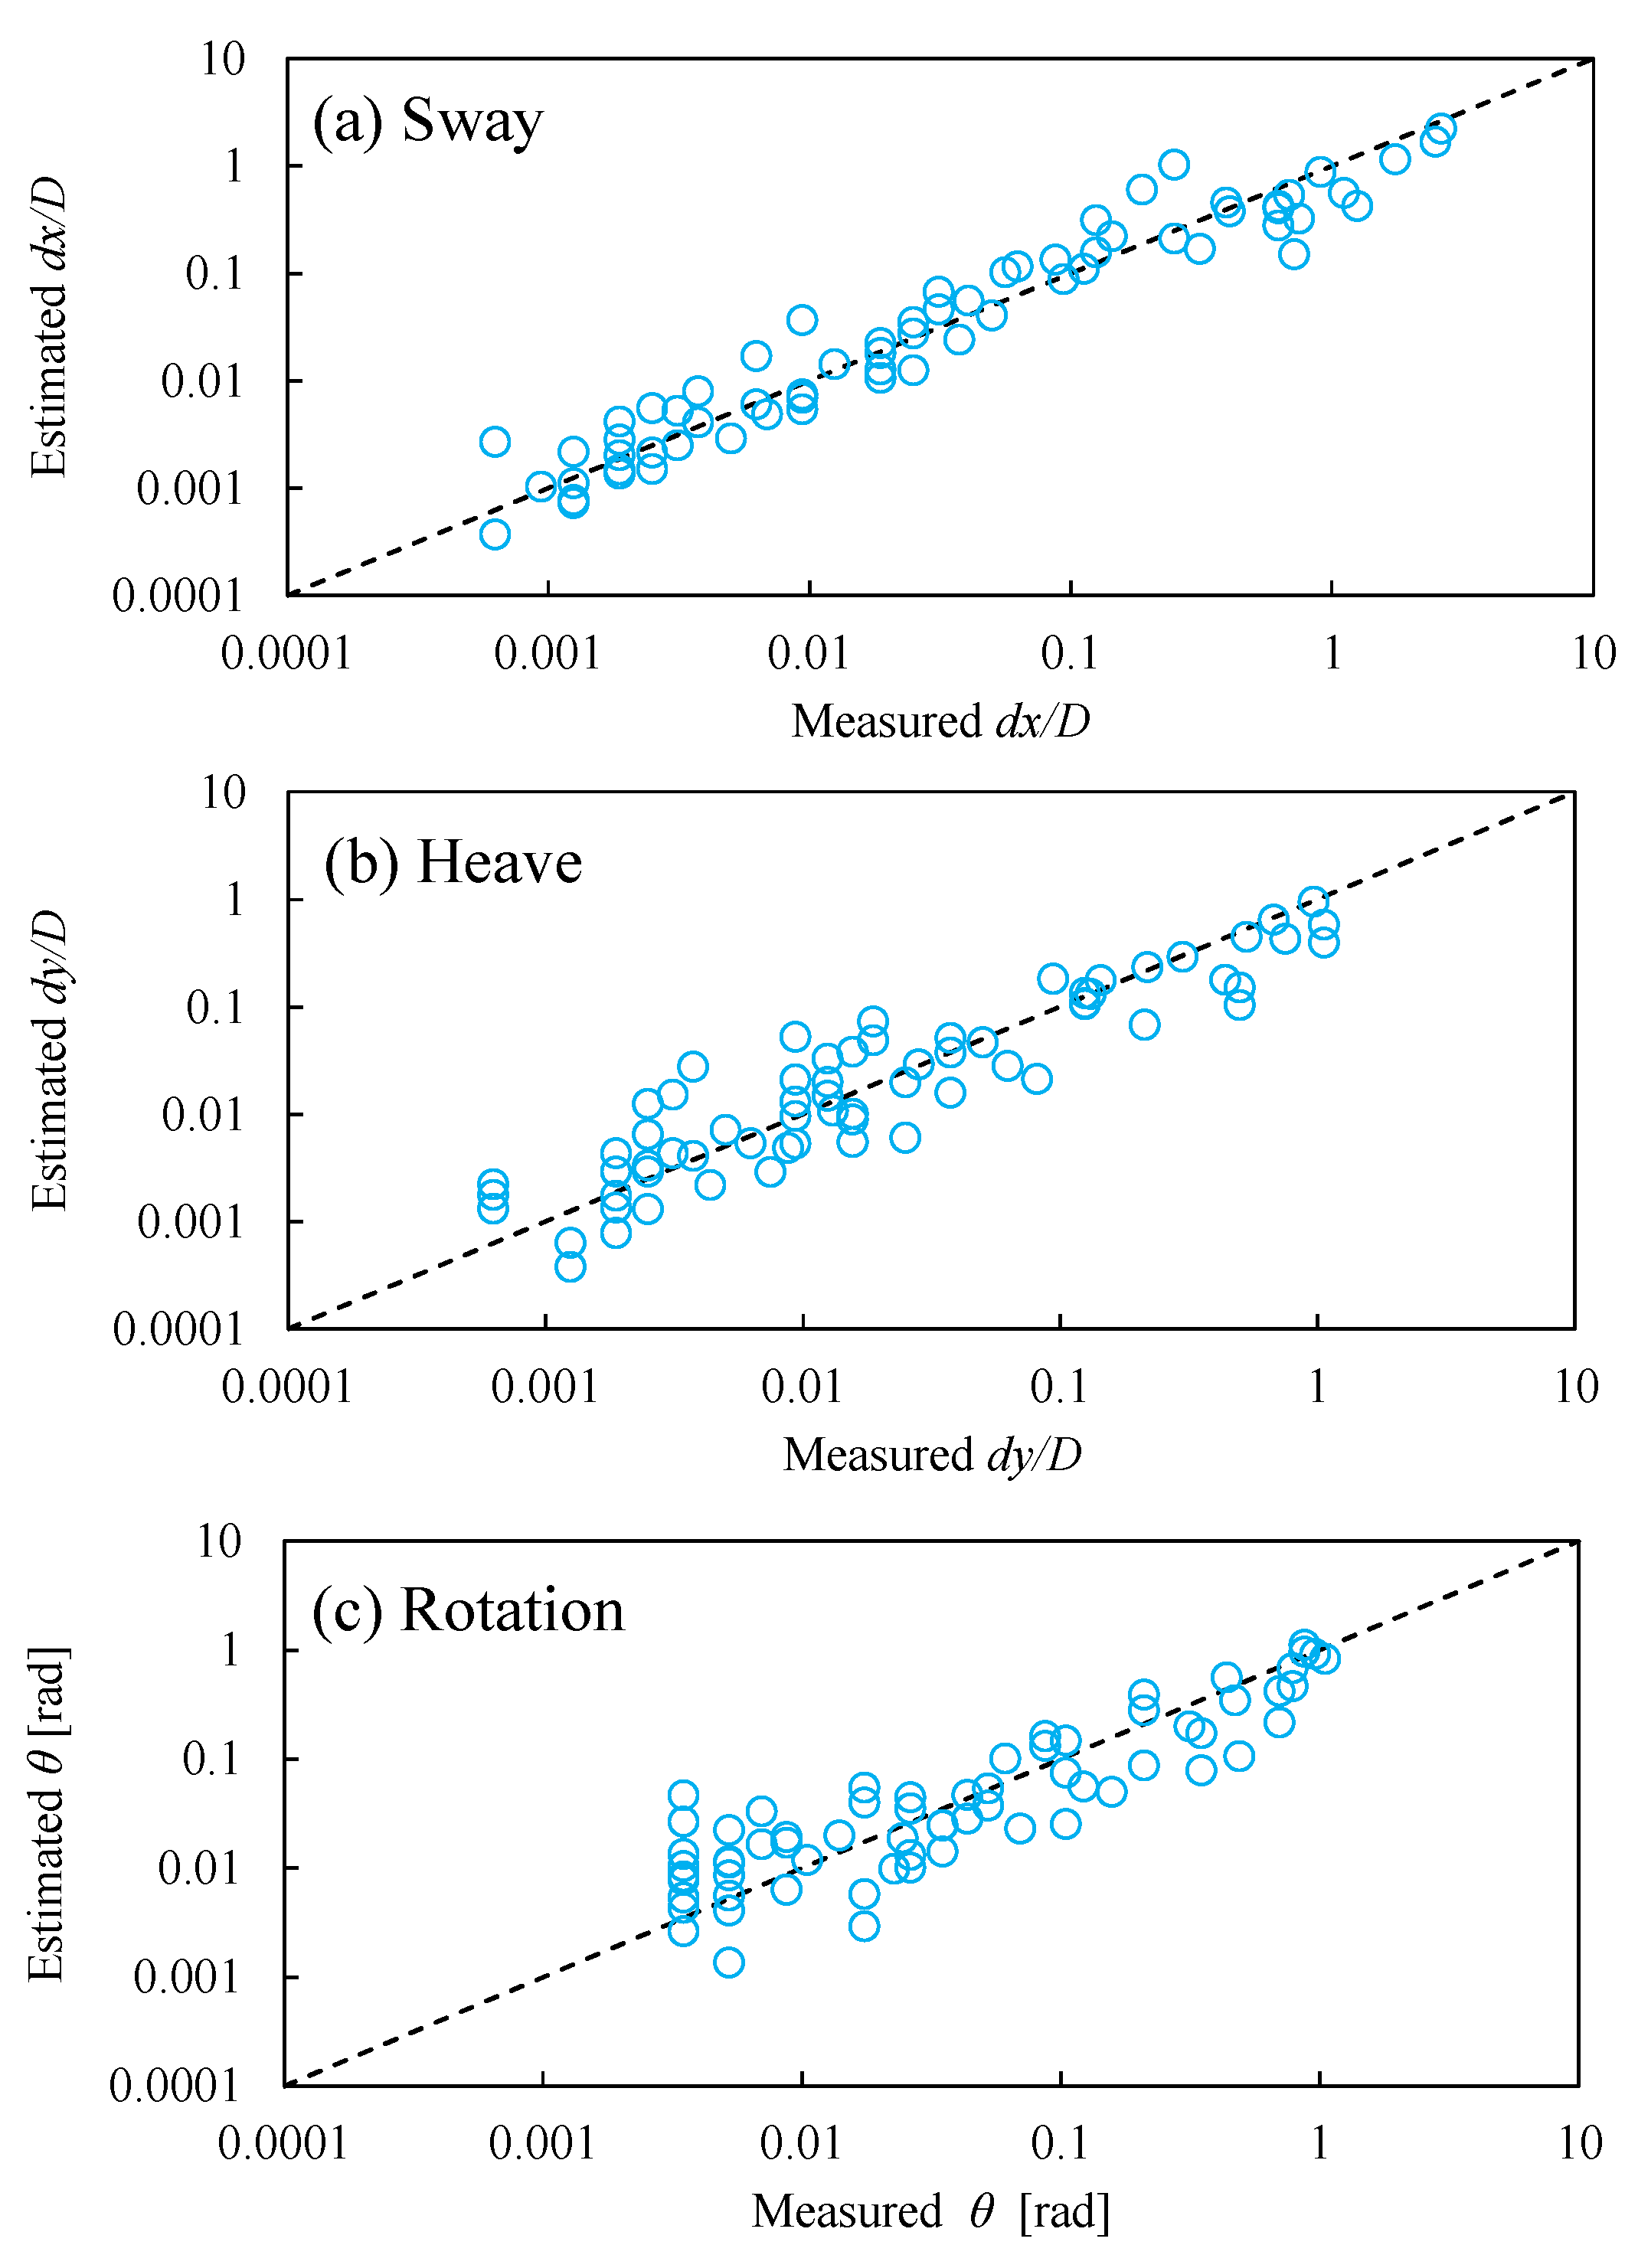
3.5. Empirical Equations to Estimate Motion Characteristics

From dimensional analysis, a function of the main parameters of the SFT motion characteristics can be expressed as:
F ( H , T , r , d s , α , D , g , d x , d y , θ ) = 0
where r represents the buoyancy to weight ratio (BWR) and F is an unspecified function. Considering dx (sway), dy (heave) and θ (roll) as independent parameters and applying the Buckingham Π theorem, the variables in Equation (1) are transformed into the following dimensionless form:
d x D , d y D , θ = F ( H D , T g D , r , d s D , α )
Based on the relationship in Equation (2) and the experimental data in this study, the regression analysis leads to the following relations for the SFT motion characteristics:
d x D = 53.5 ( H D ) 0.94 ( T g D ) 0.66 r 5.55 ( d s D ) 1.37 α 4.00   ( R 2   =   0.95 )
d y D = 15.3 ( H D ) 1.15 ( T g D ) 0.65 r 6.19 ( d s D ) 1.61 α 1.50   ( R 2   =   0.85 )
θ = 16.4 ( H D ) 0.99 ( T g D ) 0.68 r 6.01 ( d s D ) 1.29 α 0.58   ( R 2   =   0.78 )
where R2 represents the determination coefficient. The positive value of exponent of the wave height term indicates that the motion characteristics increase with wave height, whereas the negative value of the exponent of the wave period term indicates that the motion characteristics increase with wave period. This is consistent with the results of the aforementioned influencing parameter analysis. Likewise, the exponents of the other parameters included in the above equations also correspond to the experimental results and observations. The comparisons of the measured and estimated SFT motion characteristics are shown in Figure 16, which confirms the accuracy of Equation (3)–(5) as most of the data collapses to the perfect line (dashed line).
It should be noted that the ranges of applicability of the above empirical equations obtained in this study are the same as those of the experimental conditions. For field applications, it is still too premature to predict the scour reduction by using Equation (3)–(5) at this stage, and more studies are needed in the future.

4. Conclusions

In this study, a series of systematic 2D experiments were conducted to investigate the motion characteristics of SFT with the main purpose on the influence of wave height and period, submergence depth, BWR, and mooring line angle. Finally, empirical equations were proposed to estimate the motion characteristics of SFT by fitting to the present experimental data. The main findings are summarized as follows:
(1)
The motion amplitudes of SFT increase with the increase of wave height because the large wave provides more energy and larger hydrodynamic force to drive the SFT moving
(2)
The effect of wave period T is related to the natural period T0 of the structure. The motion characteristics are significantly increased when T is close to T0 due to the resonance. With the wave period farther away from the natural period of the structure, the motion characteristics decrease.
(3)
The amplitudes of motion characteristics decrease significantly with submergence depth. For the submerged case of SFT located under the water surface, the sway, heave and roll is much smaller than that of SFT located on the water surface.
(4)
With the increase of BWR, the motion of SFT decreases. When the BWR is close to one, the SFT becomes very unstable, and this must be avoided in the design.
(5)
As the mooring line angle α increases, the amplitudes of motion characteristics generally increase, and the sway of the SFT becomes larger than the heave, because the mooring line mainly restricts the vertical movement while relaxing the horizontal movement.
In this study, the model is simplified as a 2D case. Regarding the 3D effects, such as the effect of neighbor segments and oblique waves, it is also very important for the real tunnel especially for the traffic in the tunnel. This work is being conducted by the same author of this paper, which will be presented in the near future.

Author Contributions

Z.Y. designed, built the experiment model, and set up the test and data acquisition system, as well as draft, reviewed the paper; J.L. conducted the experiments, analyzed the data, and wrote the paper. C.Y. participated in recording the experimental data; H.Z. and H.Y. provided guidelines and suggestions for the improvement of the paper. All authors have read and agreed to the published version of the manuscript.

Funding

This research was funded by the Basic Funding of the Central Public Research Institutes (grant number TKS190101), the Open Fund of the State Key Laboratory of Coastal and Offshore Engineering in Dalian University of Technology (grant number LP1825), the National Natural Science Foundation of China (grant number 51509119, 51609186, 51609029, 51779112) and the Project of Tianjin Natural Science Foundation (grant number 16JCQNJC06900).

Acknowledgments

The authors thank the editors and two anonymous reviewers for their constructive comments to improve this paper. Special thanks to financial support from the CCCC SFT technical joint research team.

Conflicts of Interest

The authors declare no conflict of interest.

References

  1. Mandara, A.; Russo, E.; Faggiano, B.; Federico, M. Analysis of fluid-structure interaction for a submerged floating tunnel. Procedia Eng. 2016, 166, 397–404. [Google Scholar] [CrossRef]
  2. Martire, G.; Faggiano, B.; Mazzolani, F.M. Compared cost evaluation among traditional versus innovative strait crossing solutions. Procedia Eng. 2010, 4, 293–301. [Google Scholar] [CrossRef] [Green Version]
  3. Seo, S.; Mun, H.; Lee, J.; Kim, J. Simplified analysis for estimationof the behavior of a submerged floating tunnel in waves and experimental verification. Mar. Struct. 2015, 44, 142–158. [Google Scholar] [CrossRef]
  4. Aalbers, S.Y.; Bosma, G.T.; Breedveld, R. Submerged Floating Tunnels—Structural Response. Bachelor’s Thesis, Delft University of Technology, Delft, The Netherland, 2018. [Google Scholar]
  5. Xiang, Y.; Yang, Y. Challenge in design and construction of submerged floating tunnel and state-of-art. Procedia Eng. 2016, 166, 53–60. [Google Scholar] [CrossRef]
  6. Tveit, P. Submerged Floating Tunnels (SFTs) for Norwegian fjords. Procedia Eng. 2010, 4, 135–148. [Google Scholar] [CrossRef] [Green Version]
  7. Engebretsen, K.B.; Jakobsen, K.K.; Haugerud, S.A.; Minoretti, A.A. Submerged floating tube bridge concept for the Bjørna fjord Crossing: Marine operations. In Proceedings of the ASME 2017 36th International Conference on Ocean, Offshore and Arctic Engineering, Trondheim, Norway, 25–30 June 2017; pp. 1–16. [Google Scholar]
  8. Kanie, S. Feasibility studies on various SFT in Japan and their technological evaluation. Procedia Eng. 2010, 4, 13–20. [Google Scholar] [CrossRef] [Green Version]
  9. Martinelli, L.; Barbella, G.; Feriani, A.A. Numerical procedure for simulating the multi-support seismic response of submerged floating tunnels anchored by cables. Eng. Struct. 2011, 33, 2850–2860. [Google Scholar] [CrossRef]
  10. Oh, S.H.; Park, W.S.; Jang, S.C. Physical experiments on the hydrodynamic response of submerged floating tunnel against the wave action. In Proceedings of the 7th International Conference on Asian and Pacific Coasts, Bali, Indonesia, 24–26 September 2013. [Google Scholar]
  11. Xiang, X.; Minoretti, A.; Eidem, M.E.; Belsvik, K.H.; Aasland, T.E.; Vodolazkin, M. Simplified hydrodynamic design procedure of a submerged floating tube bridge across the Digernessund of Norway. In Proceedings of the ASME 2017 36th International Conference on Ocean, Offshore and Arctic Engineering, Trondheim, Norway, 25–30 June 2017; pp. 1–11. [Google Scholar]
  12. Kunisu, H.; Mizuno, S.; Mizuno, Y.; Saeki, H. Study on submerged floating tunnel characteristics under the wave condition. In Proceedings of the Fourth International Offshore and Polar Engineering Conference, Osaka, Japan, 10–15 April 1994; International Society of Offshore and Polar Engineers: Osaka, Japan, 1994; pp. 27–32. [Google Scholar]
  13. Long, X.; Ge, F.; Wang, L.; Hong, Y. Effects of fundamental structure parameters on dynamic responses of submerged floating tunnel under hydrodynamic loads. Acta Mech. Sin. 2009, 25, 335–344. [Google Scholar] [CrossRef] [Green Version]
  14. Lu, W.; Ge, F.; Wang, L.; Wu, X.; Hong, Y. On the slack phenomena and snap force in tethers of submerged floating tunnels under wave conditions. Mar. Struct. 2011, 24, 358–376. [Google Scholar] [CrossRef] [Green Version]
  15. Hong, Y.; Ge, F.; Lu, W. On the two essential concepts for SFT: Synergetic buoyancy-weight ratio and slack-taut map. Procedia Eng. 2016, 166, 221–228. [Google Scholar] [CrossRef]
  16. Sundar, V.; Sundaravadivelu, R.; Kalyani, M. Forces due to oblique waves on a submerged open moored cylinder in deep waters. Ocean Eng. 2005, 32, 651–666. [Google Scholar] [CrossRef]
  17. Jin, C.; Kim, J.M.; Choi, J.; Park, W. Coupled dynamics simulation of submerged floating tunnel for various system parameters and wave conditions. In Proceedings of the ASME 2018 37th International Conference on Ocean, Offshore and Arctic Engineering, Madrid, Spain, 17–22 June 2018; pp. 1–6. [Google Scholar]
  18. Sun, C.; Wang, Q.; Yu, Q. Online Machine version method for measuring the diameter and straightness of seamless steel pipes. Optical Eng. 2001, 40, 2565–2571. [Google Scholar] [CrossRef]
  19. Wang, Q.; Zhang, Z.; Zang, Z. The trajectory prediction of spacecraft by grey method. Meas. Sci. Technol. 2016, 27, 085011. [Google Scholar] [CrossRef]
Figure 1. The SFT model setup in the present experiment.
Jmse 08 00123 g001
Figure 2. Definition sketch of moored floating tunnel.
Jmse 08 00123 g002
Figure 3. Different colors on the SFT cross section.
Jmse 08 00123 g003
Figure 4. Series of model displacement to determine the natural period and natural frequency: (a) buoyancy to weight ratio (BWR) = 1.54; (b) BWR = 1.9.
Jmse 08 00123 g004
Figure 5. Experimental observation of SFT motion exposed to waves under different conditions: (a) T = 1.41 s, H = 0.08 m, BWR = 1.9, ds = −6 cm, α = 30°; (b) T = 1.84 s, H = 0.26 m, BWR = 1.9, ds = −6 cm, α = 30°; (c) T = 1.84 s, H = 0.26 m, BWR = 1.9, ds = 9.5 cm, α = 30°.
Jmse 08 00123 g005
Figure 6. Trajectories of SFT motion under different conditions: (a) T = 1.41 s, ds = −6 cm, α = 30°, BWR = 1.9; (b) H = 0.06 m, ds = 9.5 cm, α = 30°, BWR = 1.9; (c) T = 1.84 s, H = 0.26 m, α = 30°, BWR = 1.9; (d) T = 1.84 s, H = 0.26 m, ds = 9.5 cm, α = 30°, BWR = 1.9.
Jmse 08 00123 g006aJmse 08 00123 g006b
Figure 7. Time series and spectral analysis of motion characteristics for the condition of T = 1.41 s, H = 0.08 m, BWR = 1.9, ds = −6 cm, α = 30°: (a) sway and heave; (b) roll, and (c) trajectories for different periods.
Jmse 08 00123 g007
Figure 8. Time series and spectral analysis of sway and heave for the conditions of (a) T = 1.84 s, H = 0.26 m, BWR = 1.9, ds = 9.5 cm, α = 30°; (b) T = 1.84 s, H = 0.26 m, BWR = 1.9, ds = 9.5 cm, α = 20°; and (c) T = 1.84 s, H = 0.26 m, BWR = 1.54, ds = 9.5 cm, α = 30°.
Jmse 08 00123 g008
Figure 9. Influence of wave height on motion characteristics of SFT for the case of ds = 9.5 cm, BWR = 1.54, α = 30°.
Jmse 08 00123 g009
Figure 10. Influence of wave period on the (a) sway, (b) heave and (c) roll for the case of H = 0.6~0.8 cm, BWR = 1.9, α = 30°.
Jmse 08 00123 g010
Figure 11. Effect of wave period for the case of BWR = 1.54: (a) trajectories for different wave period; (b) motion characteristics versus wave period.
Jmse 08 00123 g011
Figure 12. Characteristics of SFT under different submergence depths.
Jmse 08 00123 g012
Figure 13. Sway, heave and roll RAO versus dimensionless submergence depth.
Jmse 08 00123 g013
Figure 14. Influence of BWR on motion characteristics of SFT.
Jmse 08 00123 g014
Figure 15. Influence of mooring line angle on motion characteristics of SFT.
Jmse 08 00123 g015
Figure 16. Measured and estimated SFT motion characteristics.
Jmse 08 00123 g016
Table 1. Wave conditions.
Test No.Water Depth h [m]Wave Height H [m]Wave Period T [s]kA [−]
10.70.020.920.048
20.70.040.920.095
30.70.070.920.167
40.70.041.410.044
50.70.081.410.089
60.70.161.410.177
70.70.061.840.045
80.70.131.840.098
90.70.261.840.197
100.70.022.80.009
110.70.062.80.027
Table 2. Physical quantities for the model and prototype of SFT.
BWRPhysical QuantitiesModelPrototype (×107)
Buoyancy [kg]19.8351.016
1.03Mass [kg]19.2570.986
1.5412.8800.660
1.9010.4390.535
1.03Inertia moment [kg·m2]0.0616220.19
1.540.0412213.51
1.900.0334110.95
Table 3. Structural dynamic characteristics of the SFT model with different BWR.
Test No.BWRNatural Period T0 [s]Natural Frequency ω0 [rad/s]
11.031.793.51
21.540.966.54
31.900.669.13

