Sediment Deposition Following Construction of a Breakwater Harbor: Point Judith Harbor of Refuge, Rhode Island, USA

 ,
,
Abstract
1. Introduction
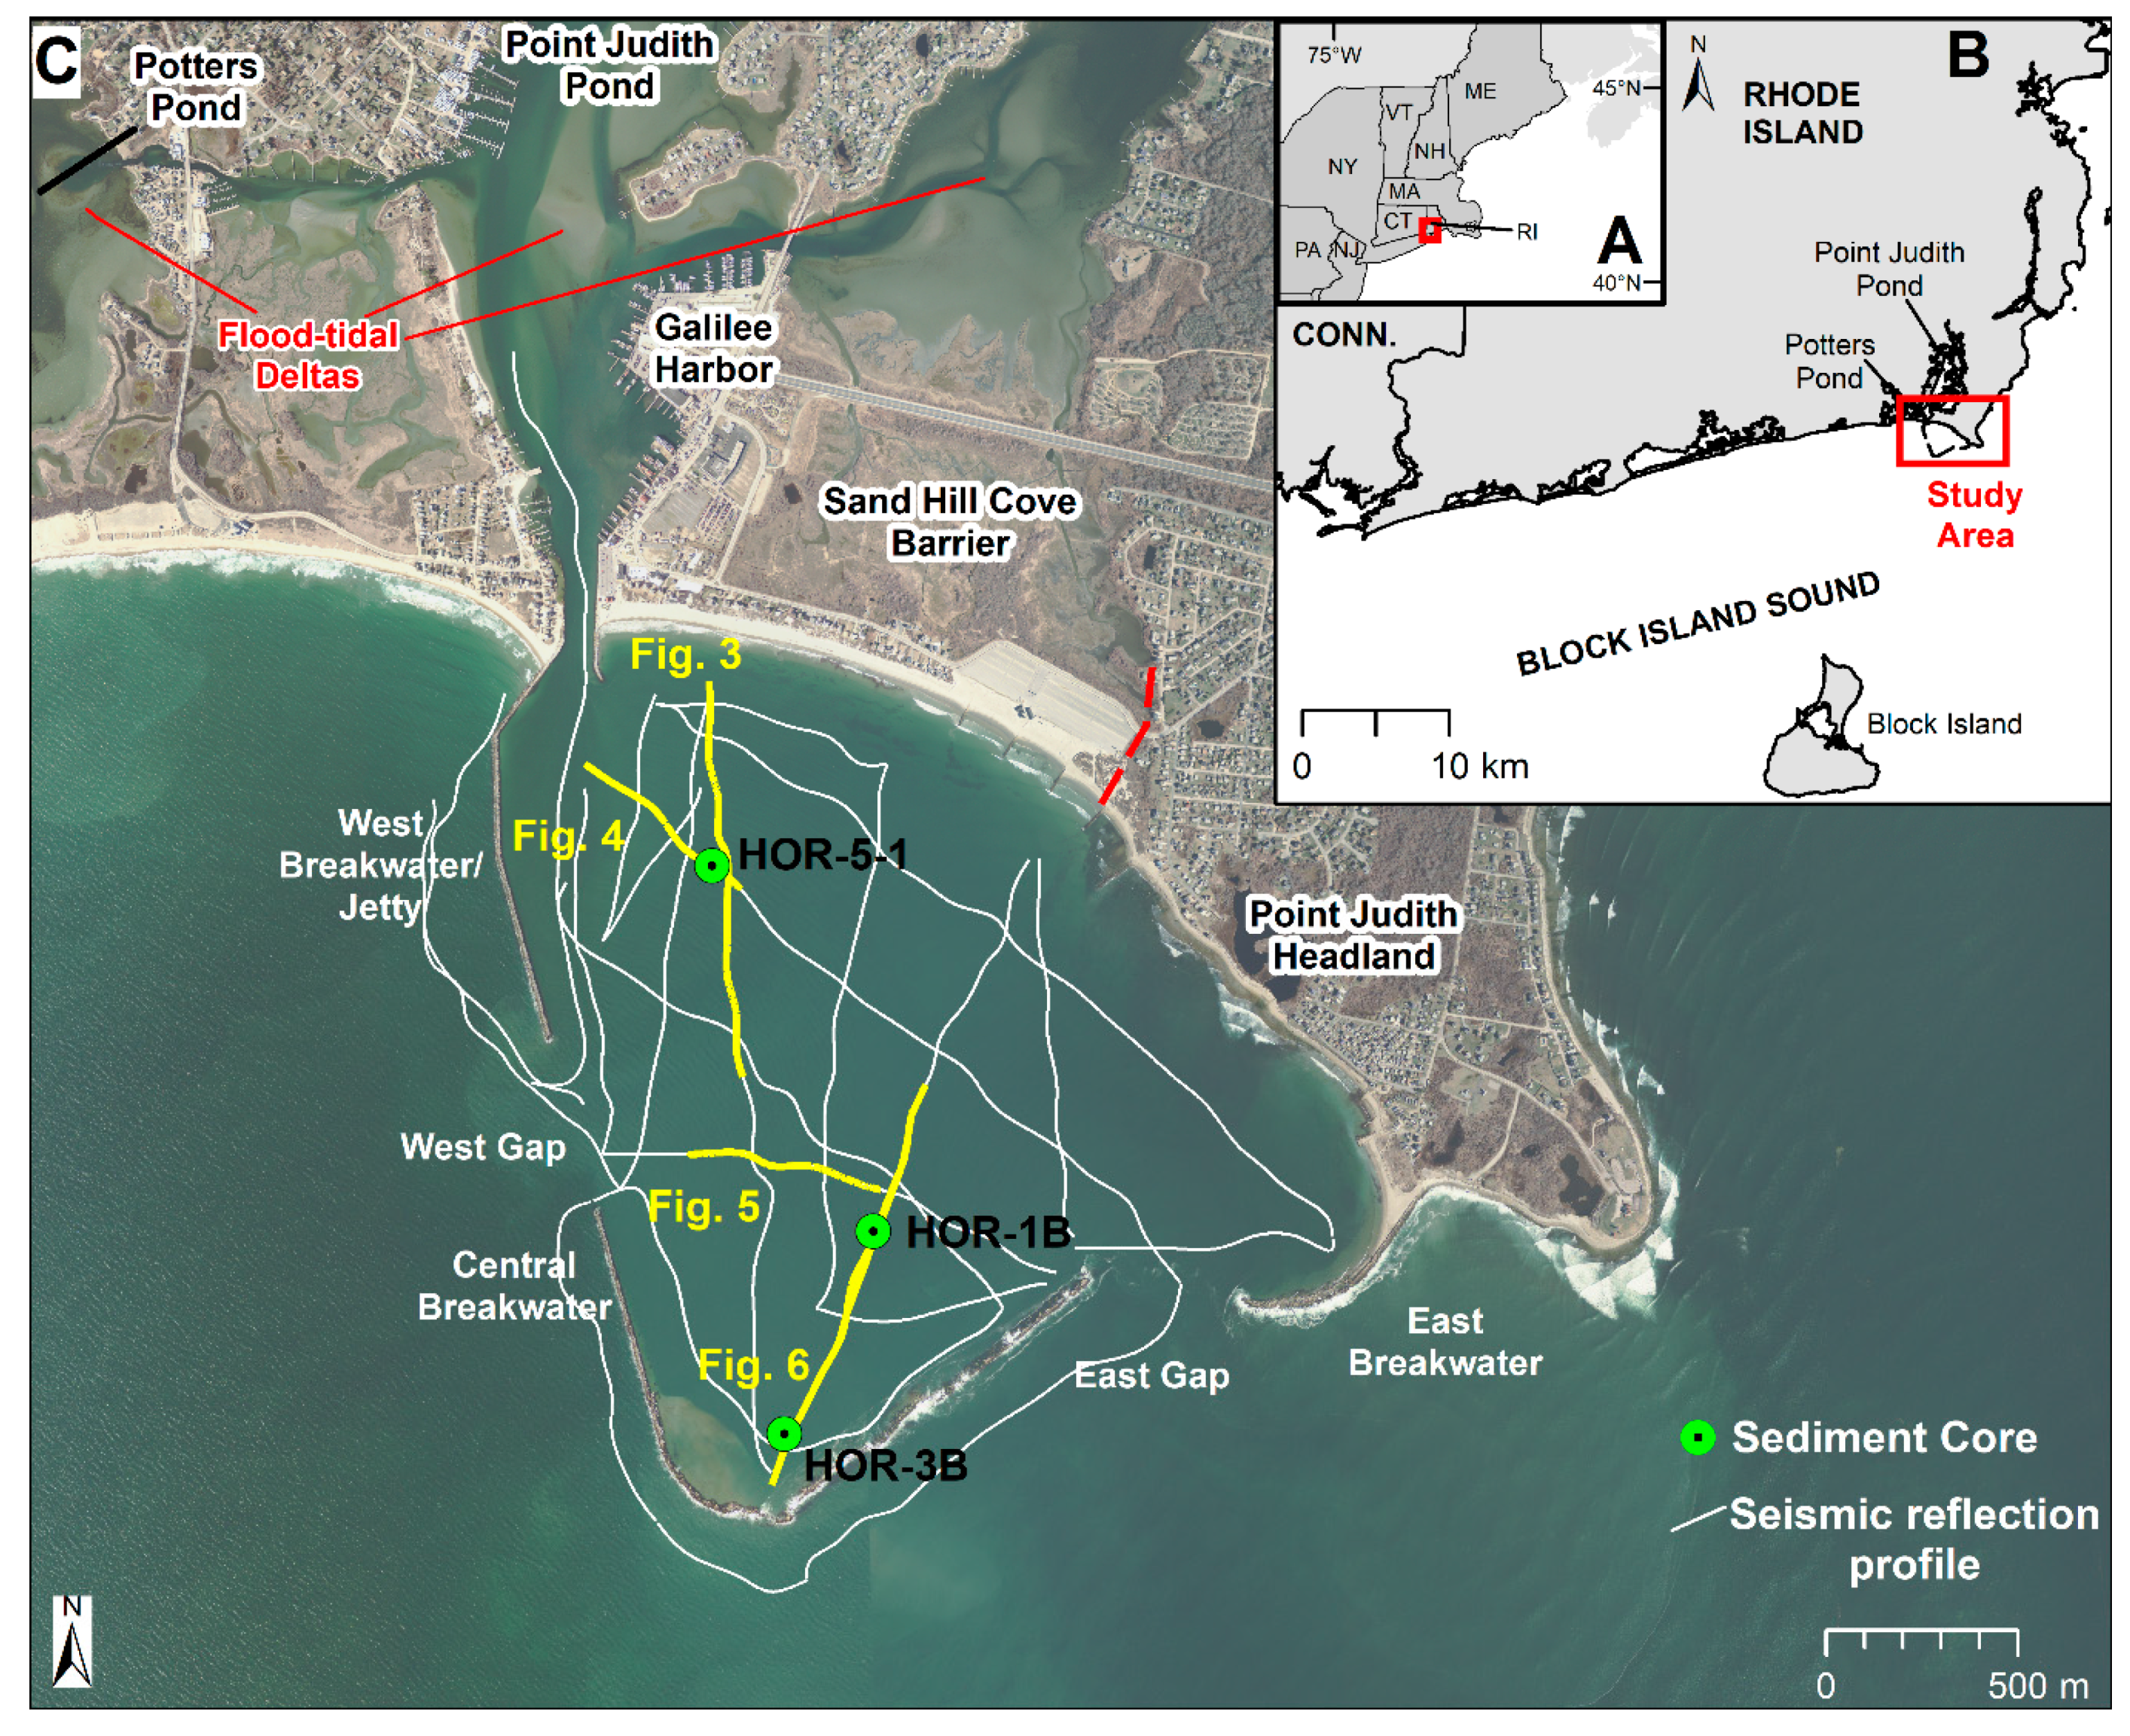
2. Study Area
3. Materials and Methods
3.1. Sub-Bottom Data and Analysis
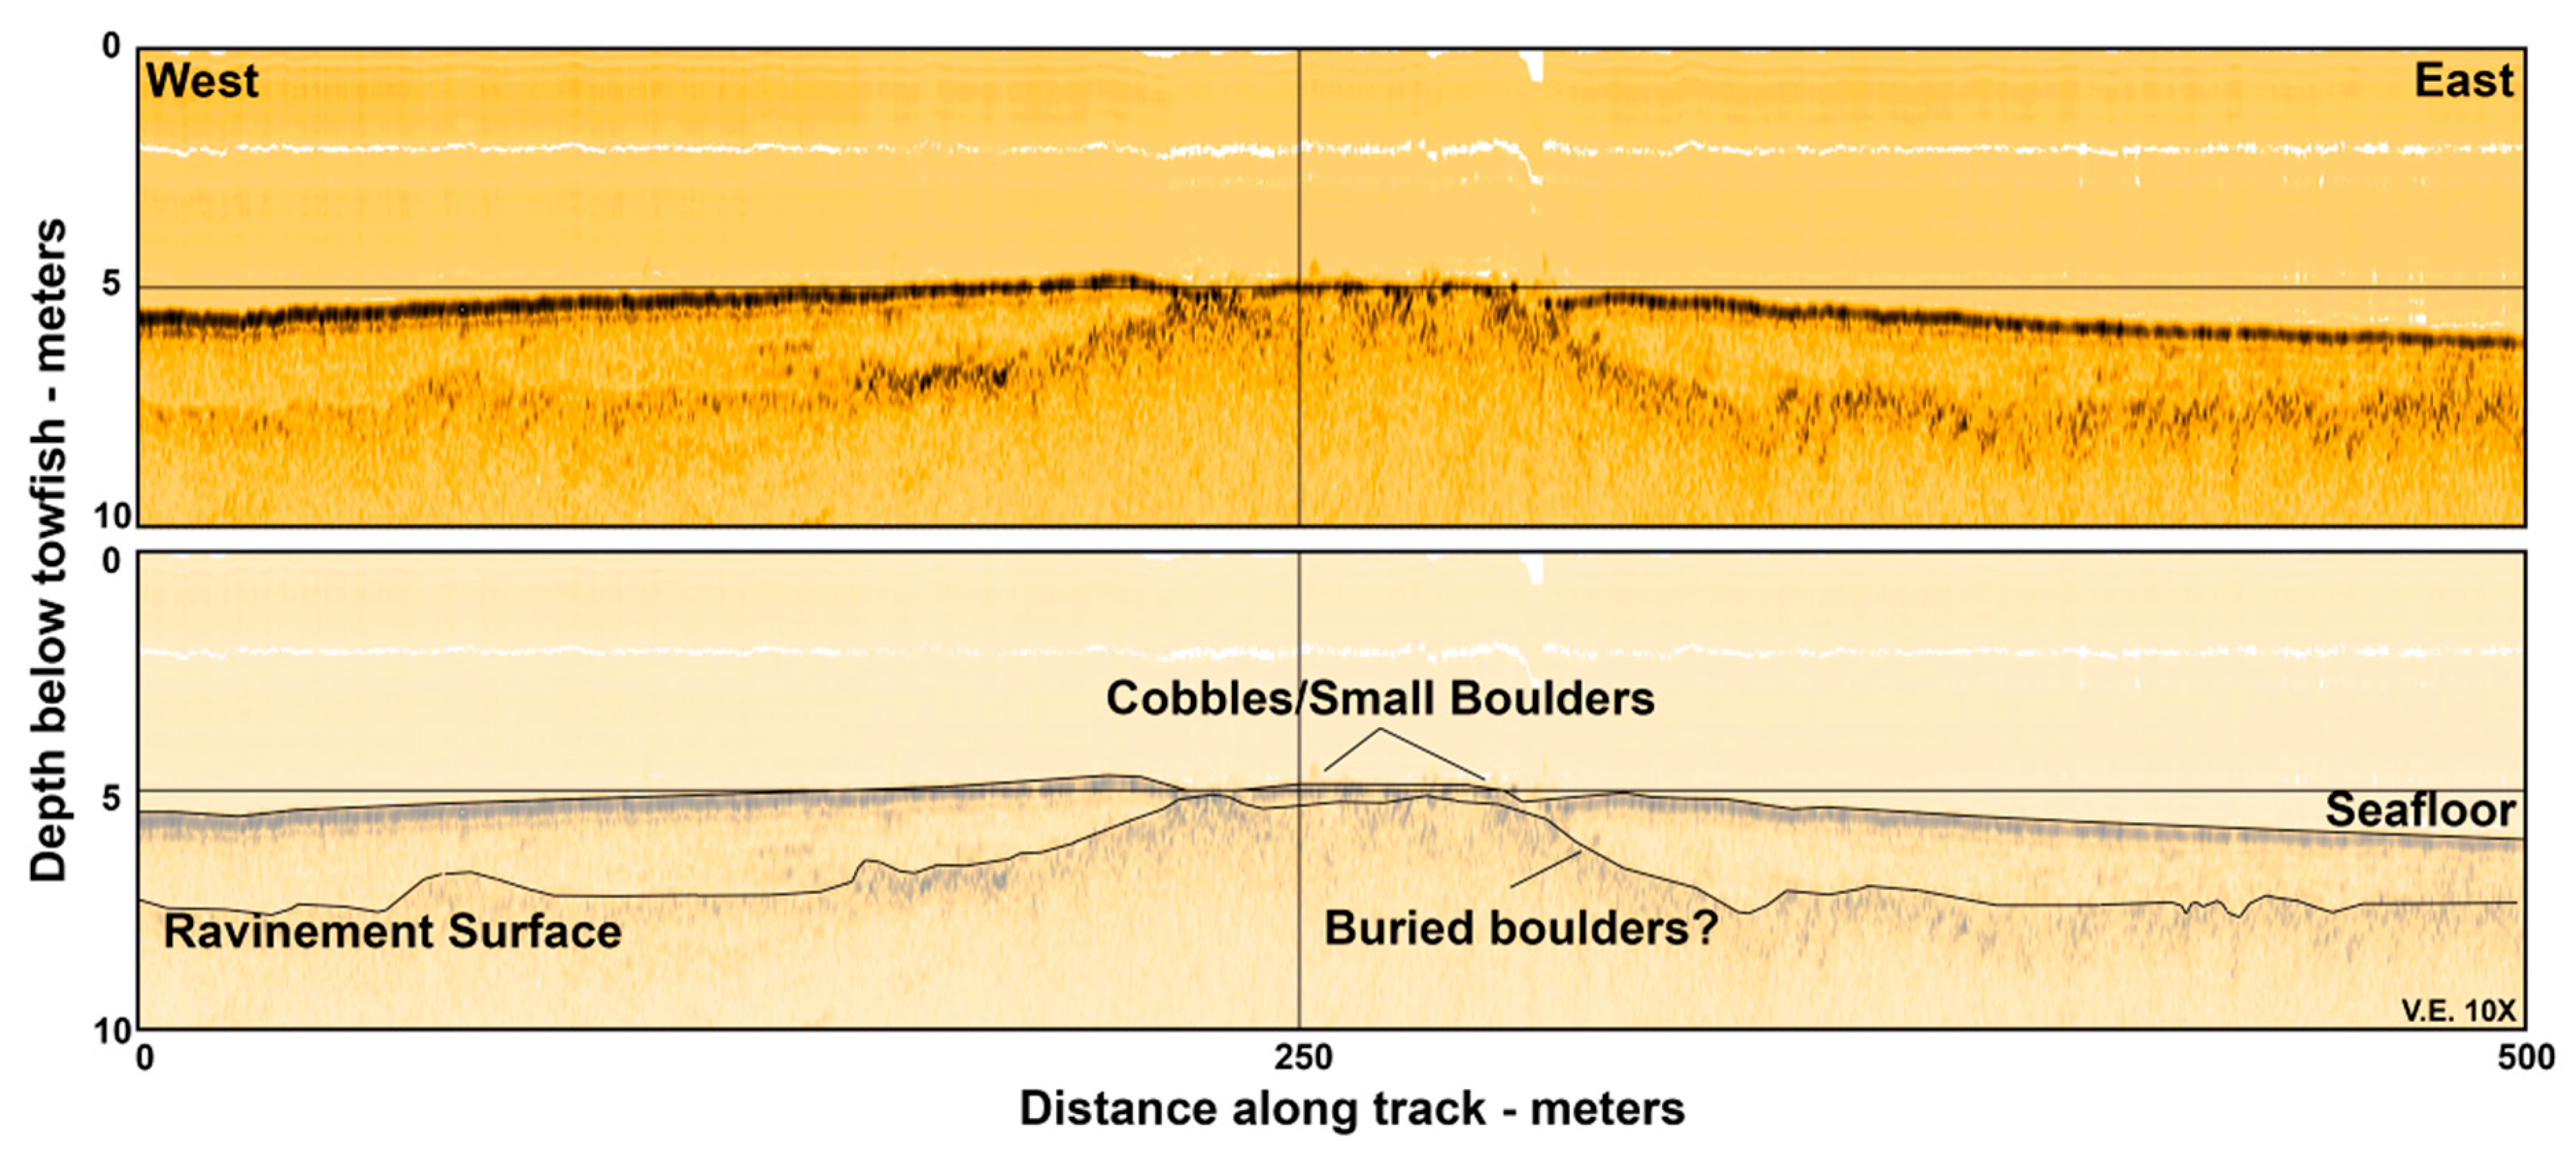
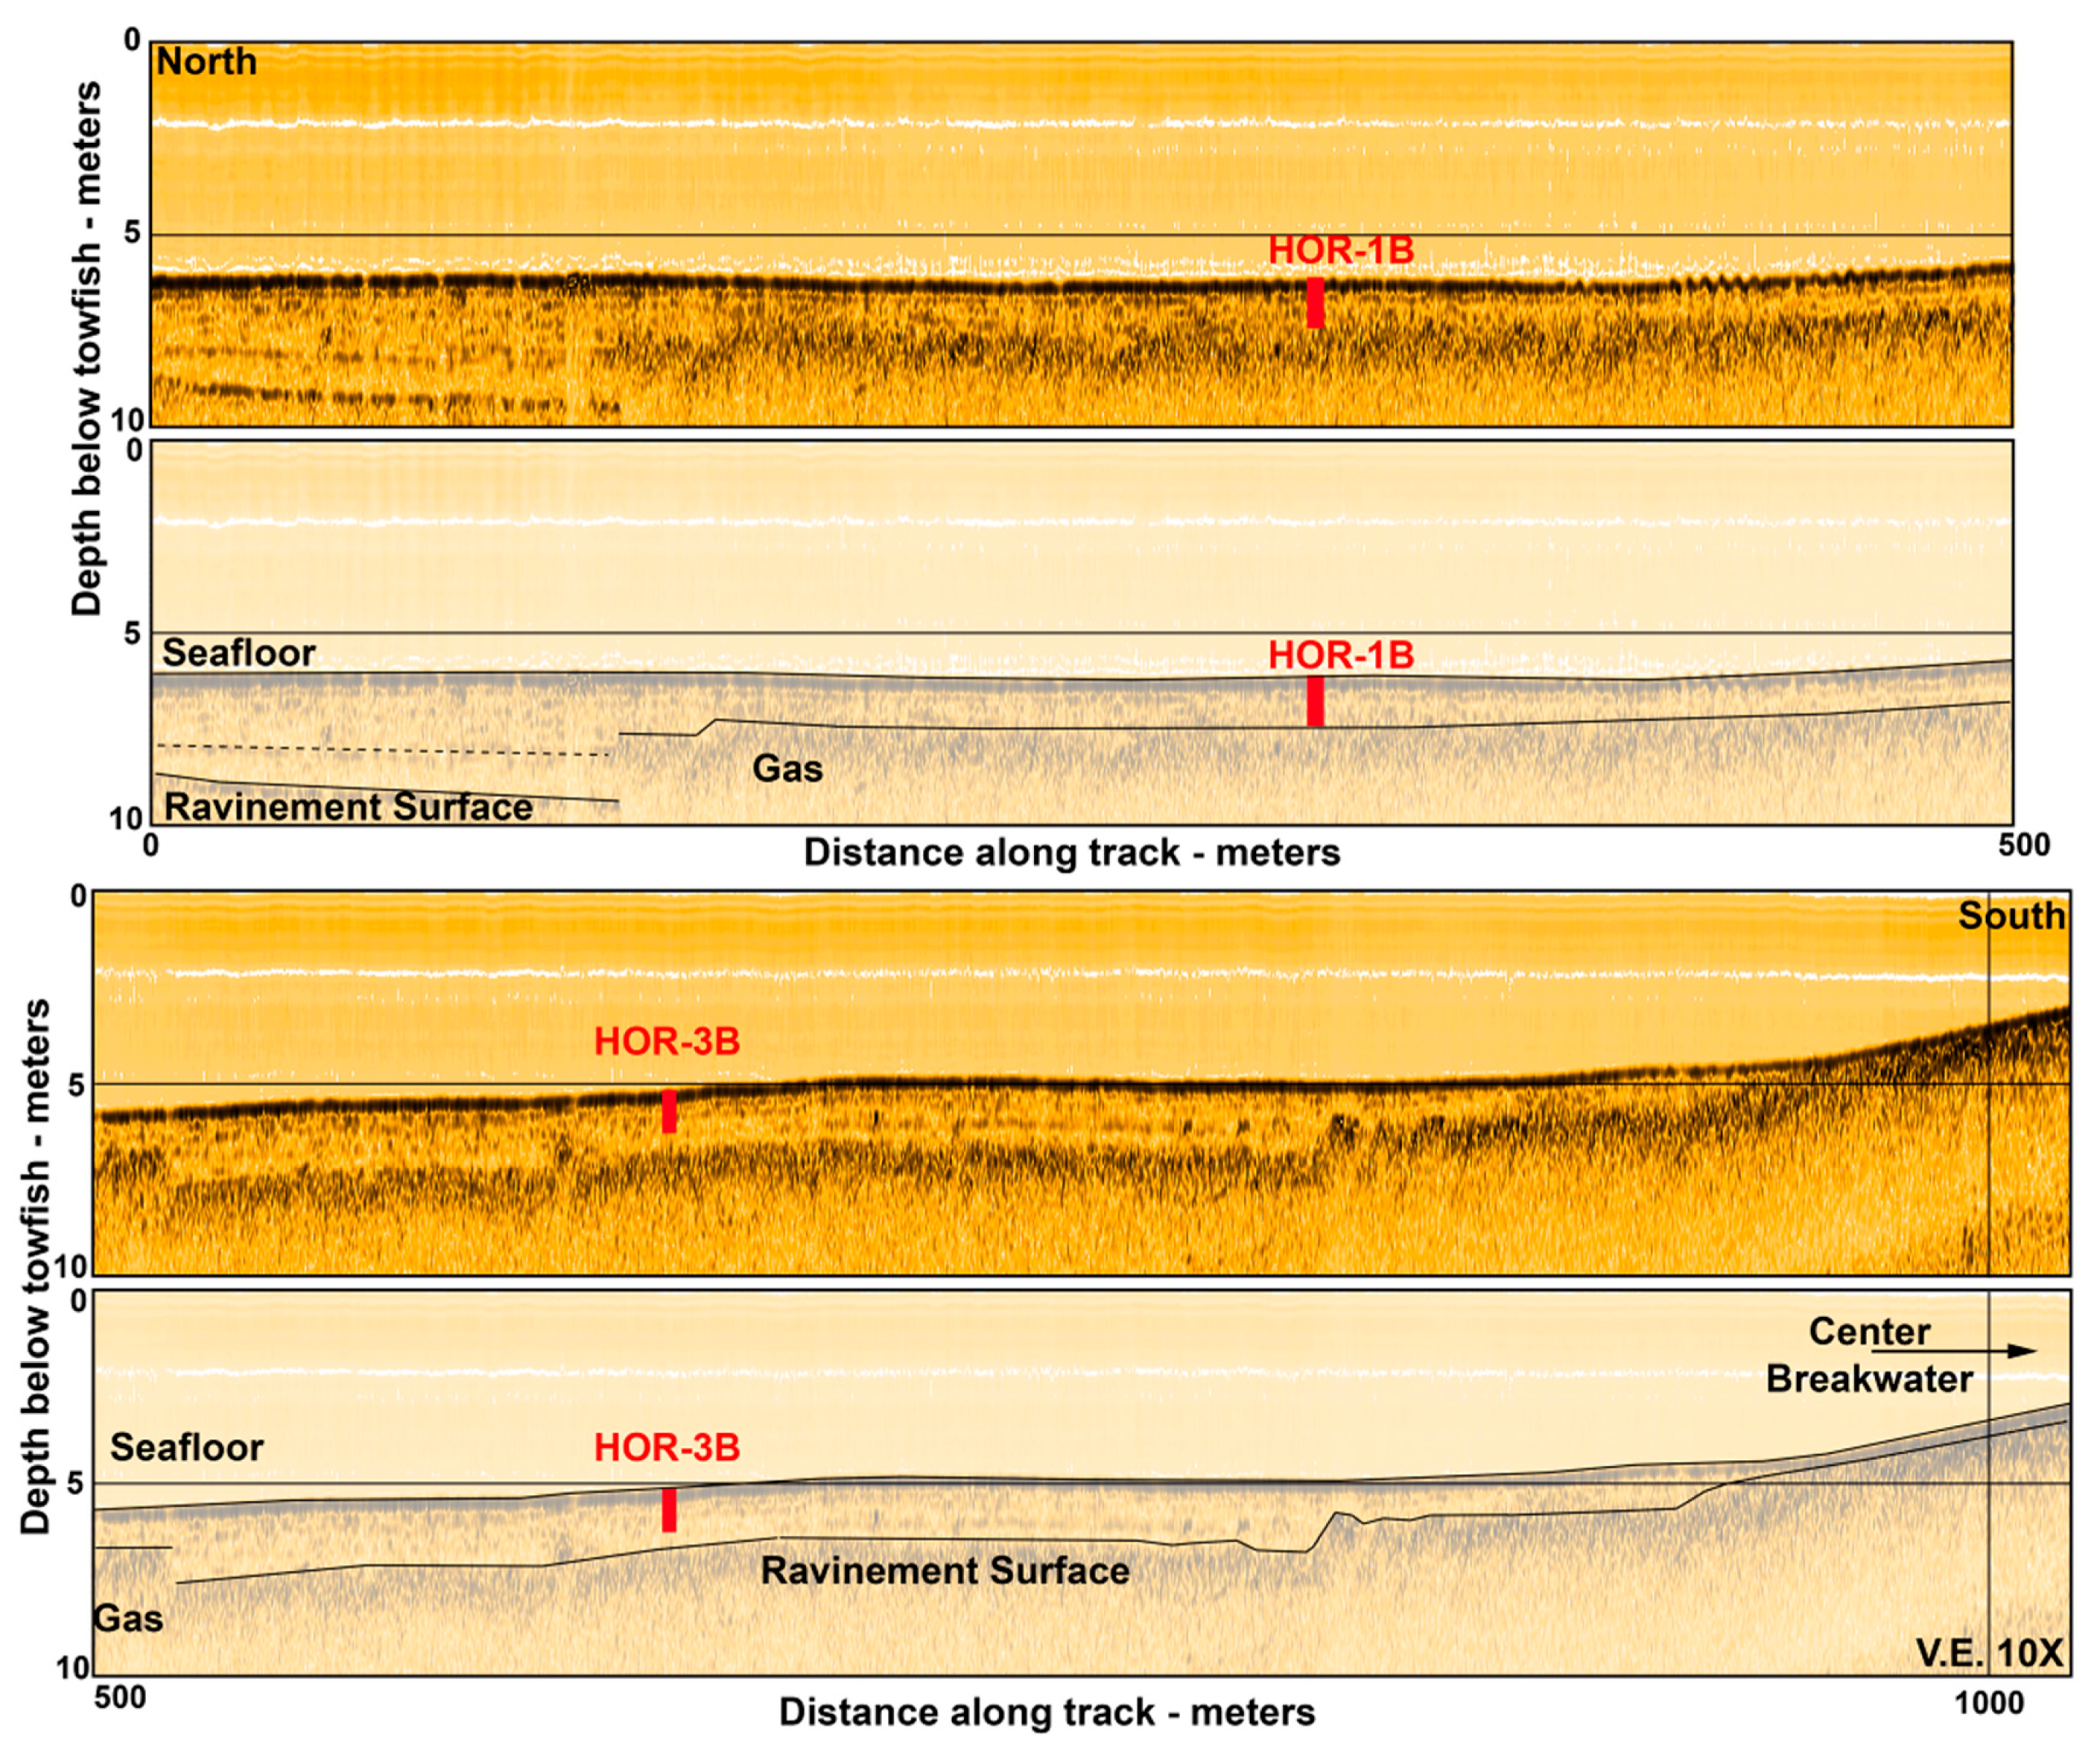
3.2. Sub-Bottom Seismic Reflection Interpretation
3.3. Bathymetric Data and Analysis
3.4. Sediment Coring
3.5. Isotope Analysis
4. Results
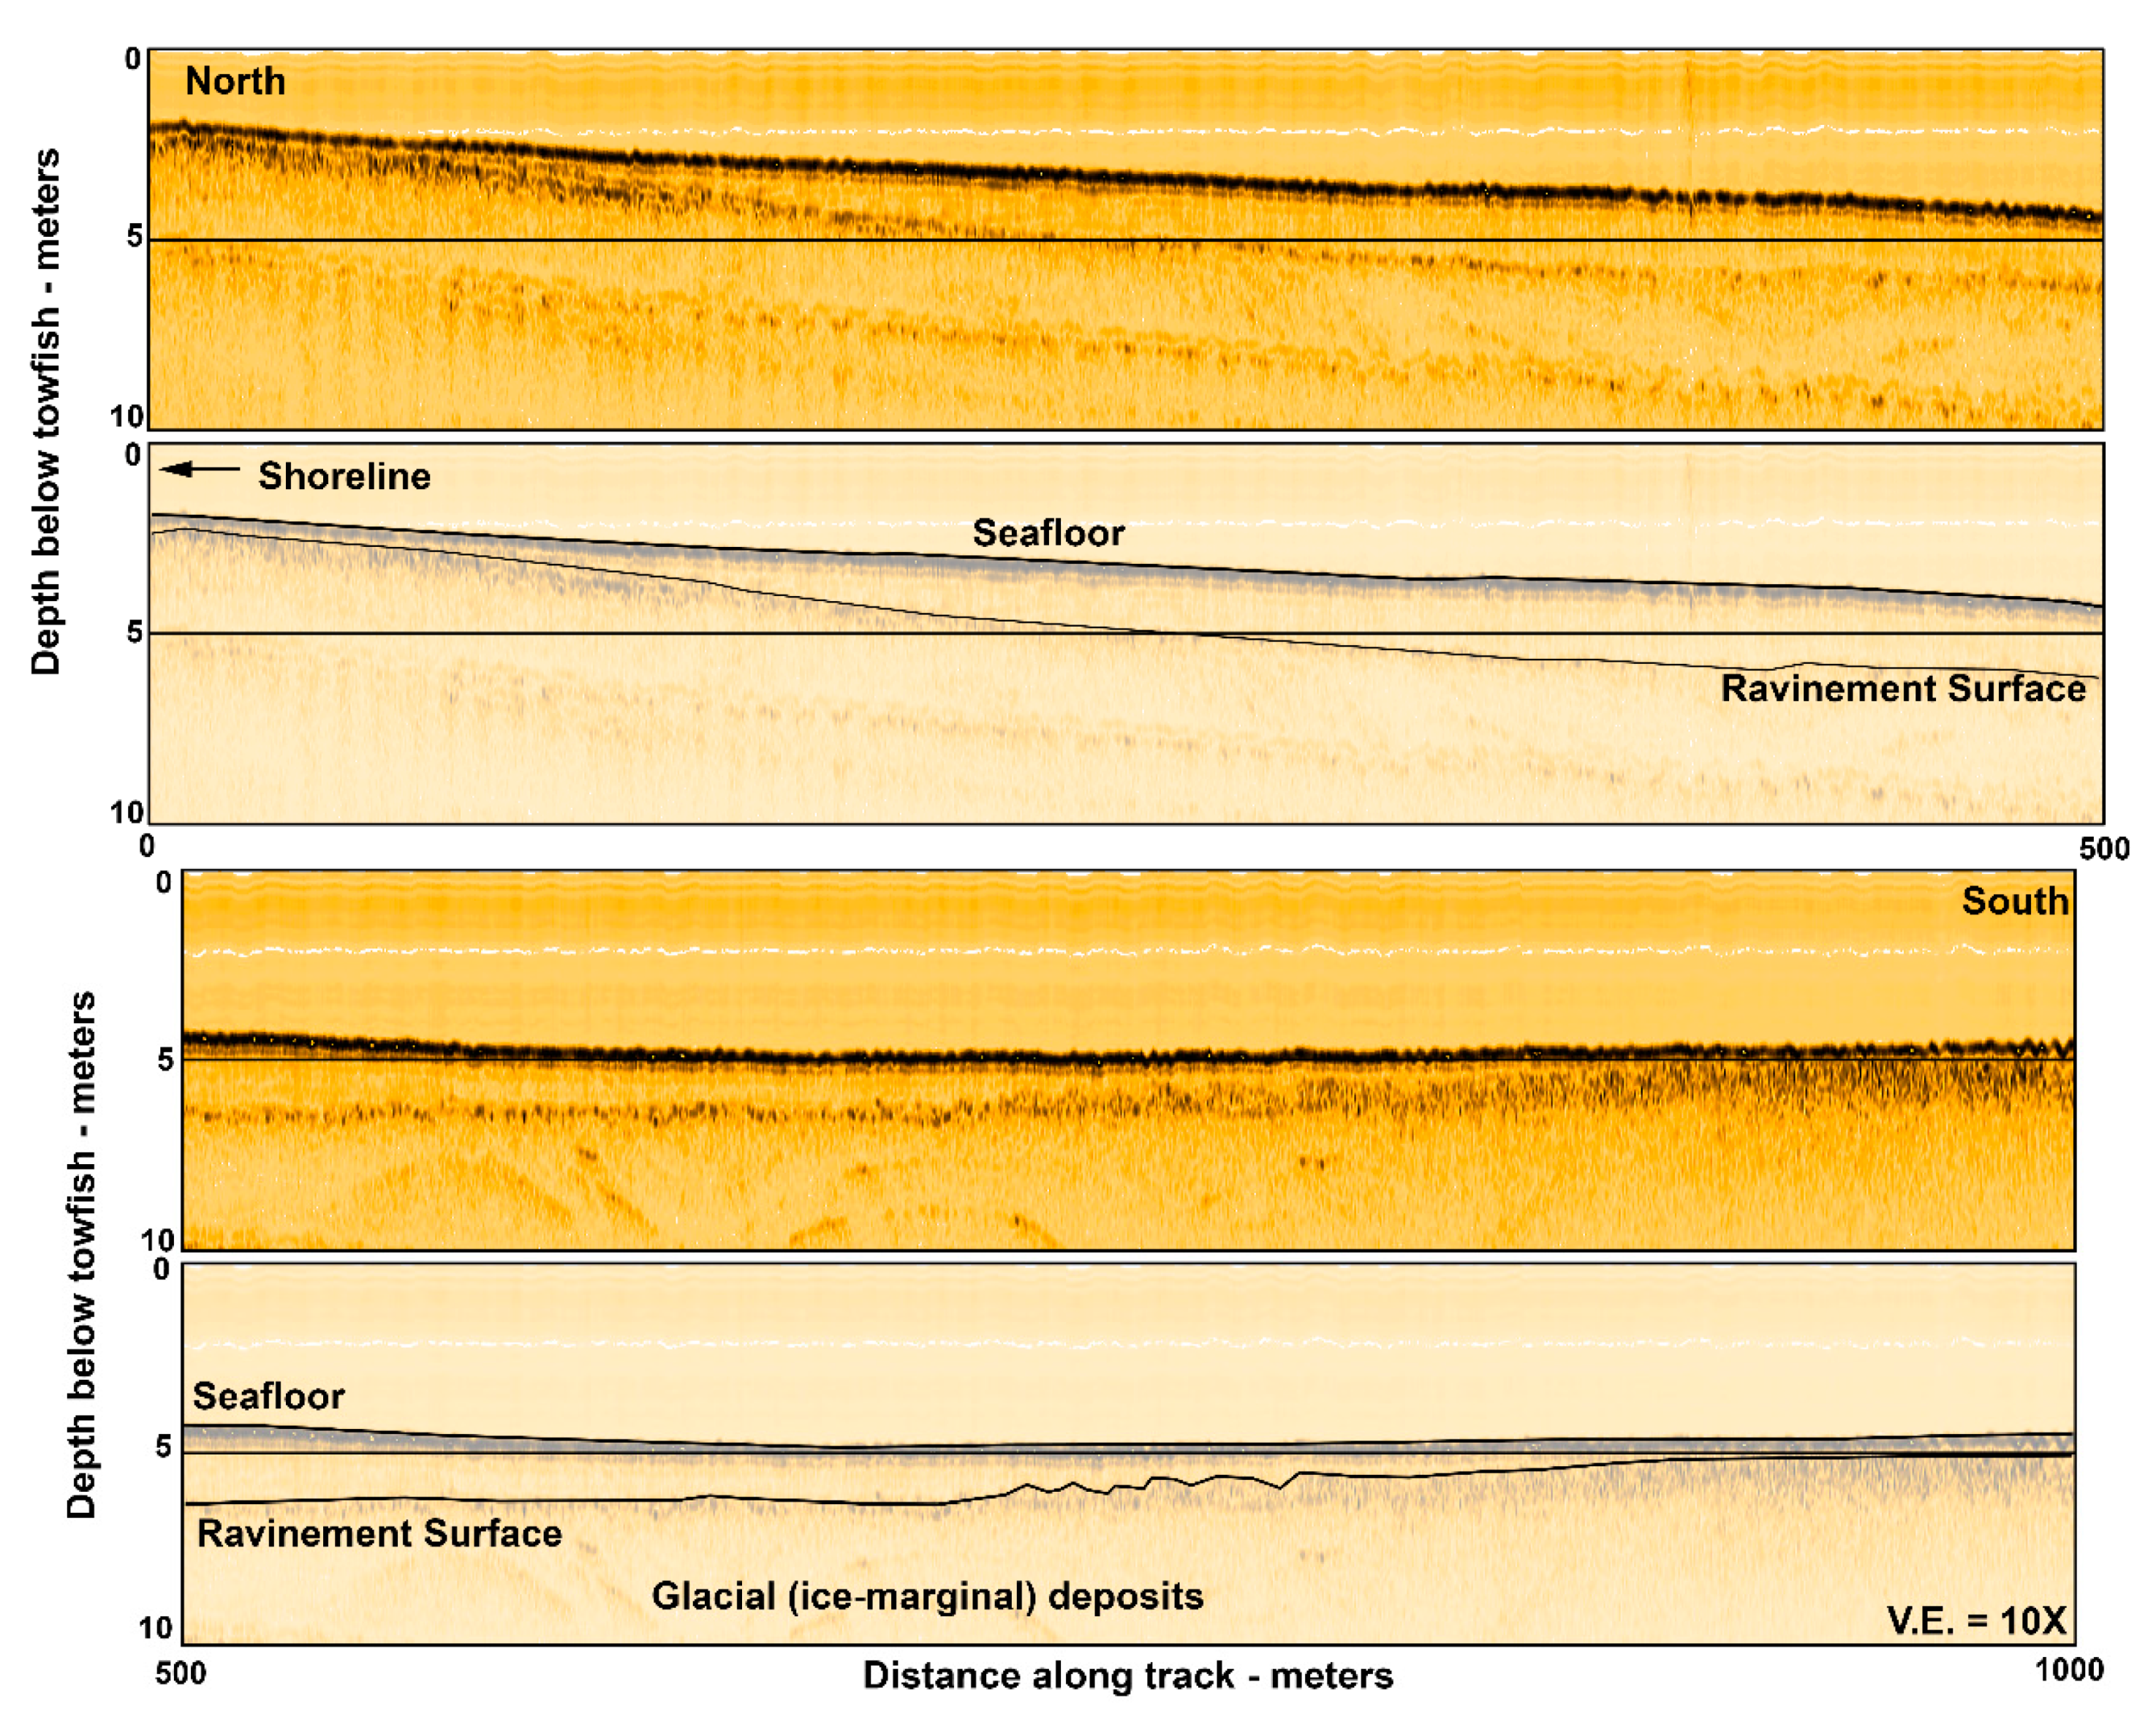
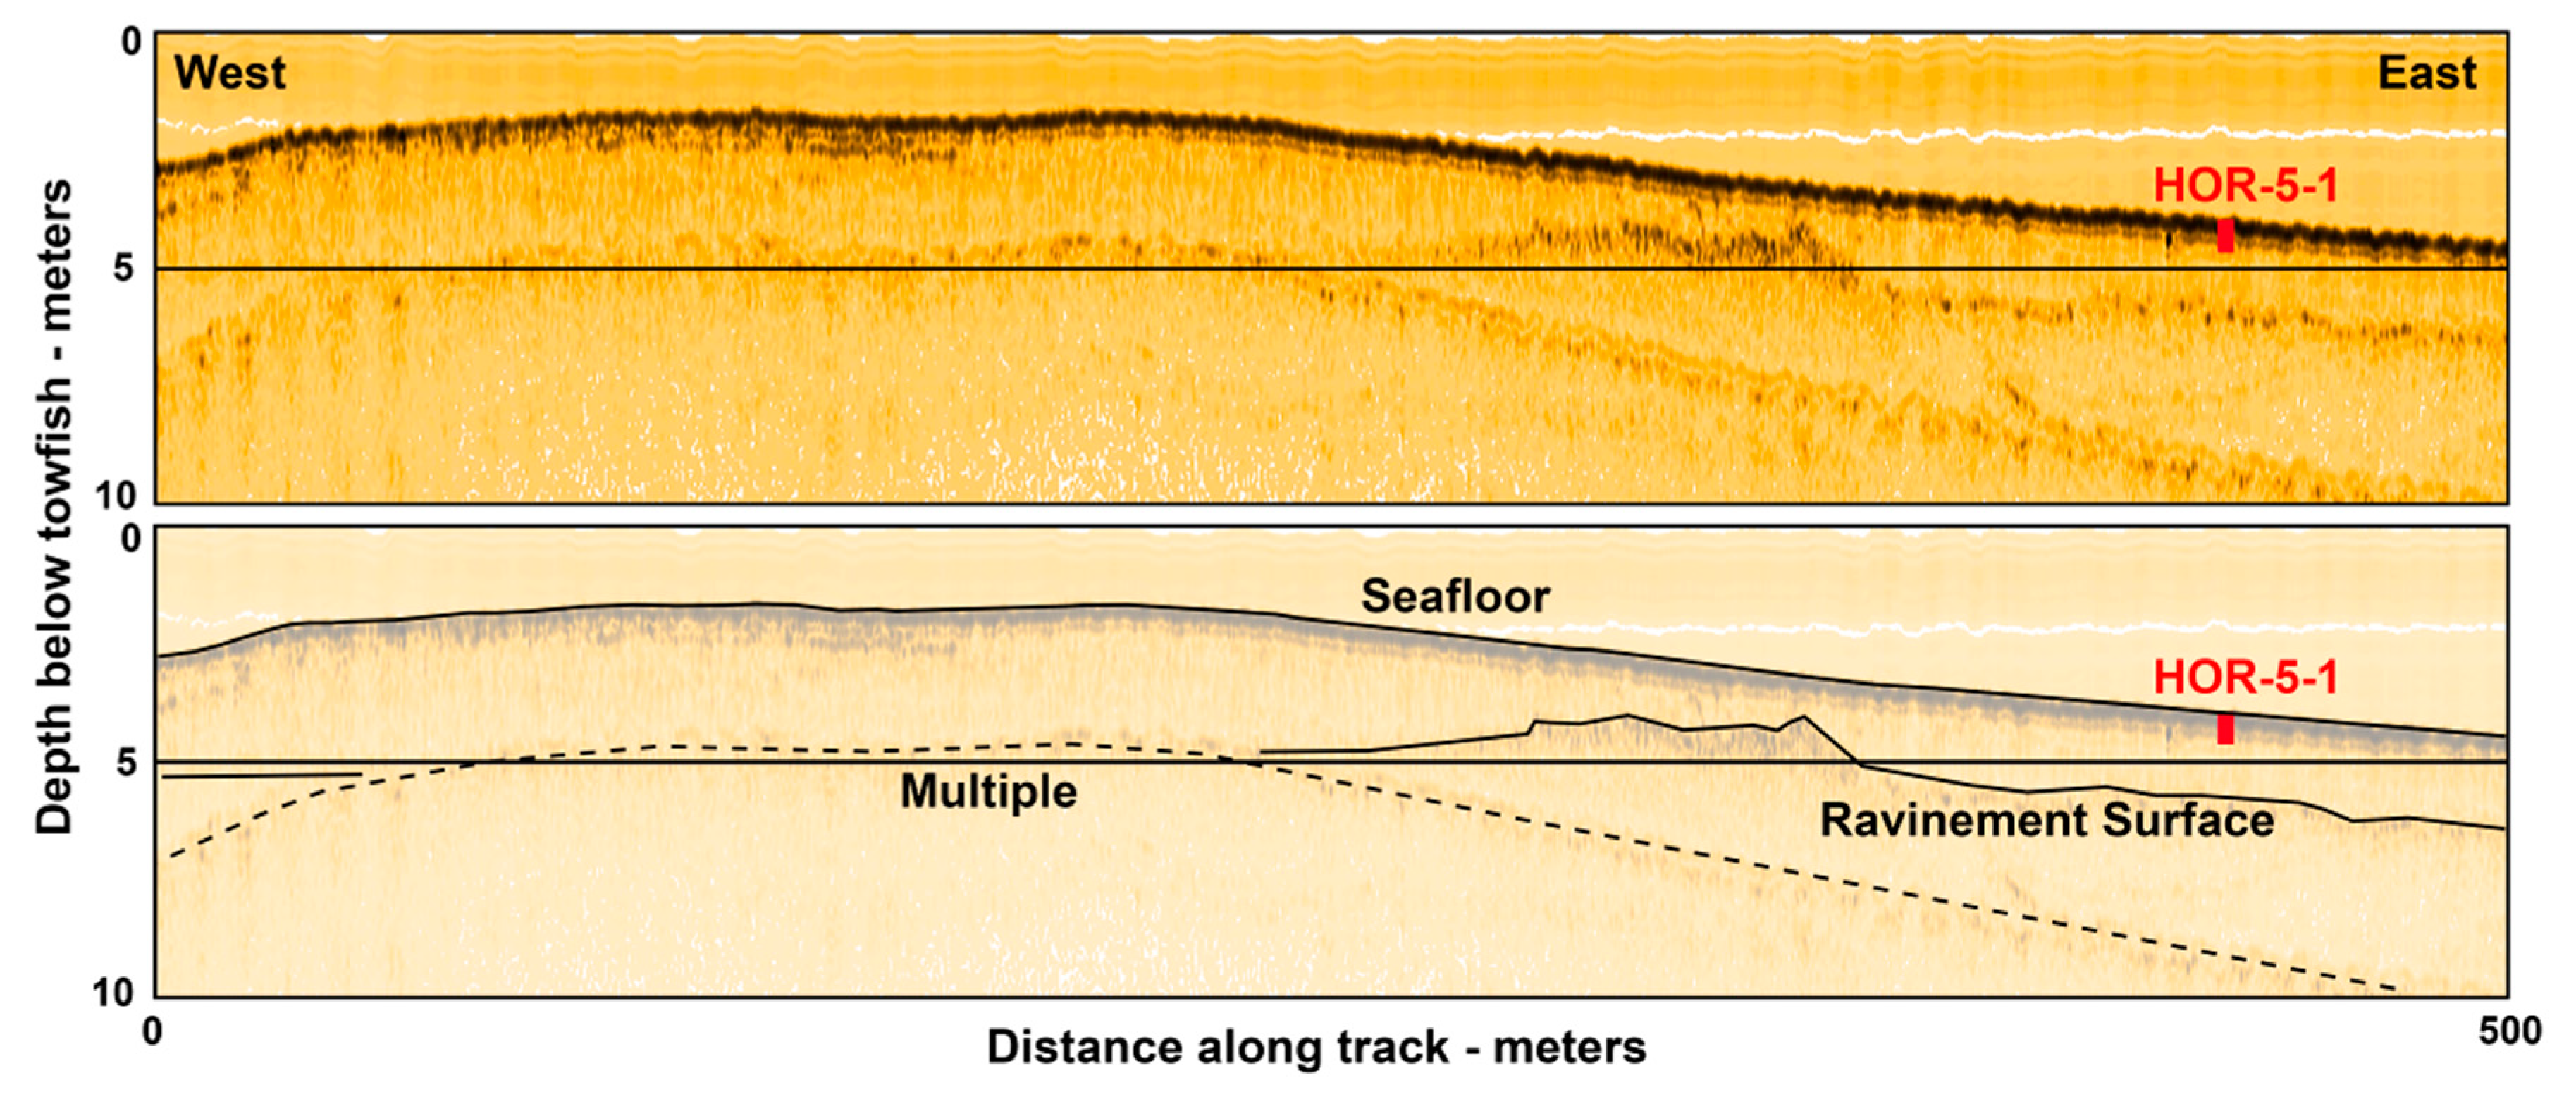
4.1. Sub-Bottom Seismic Reflection Profiles
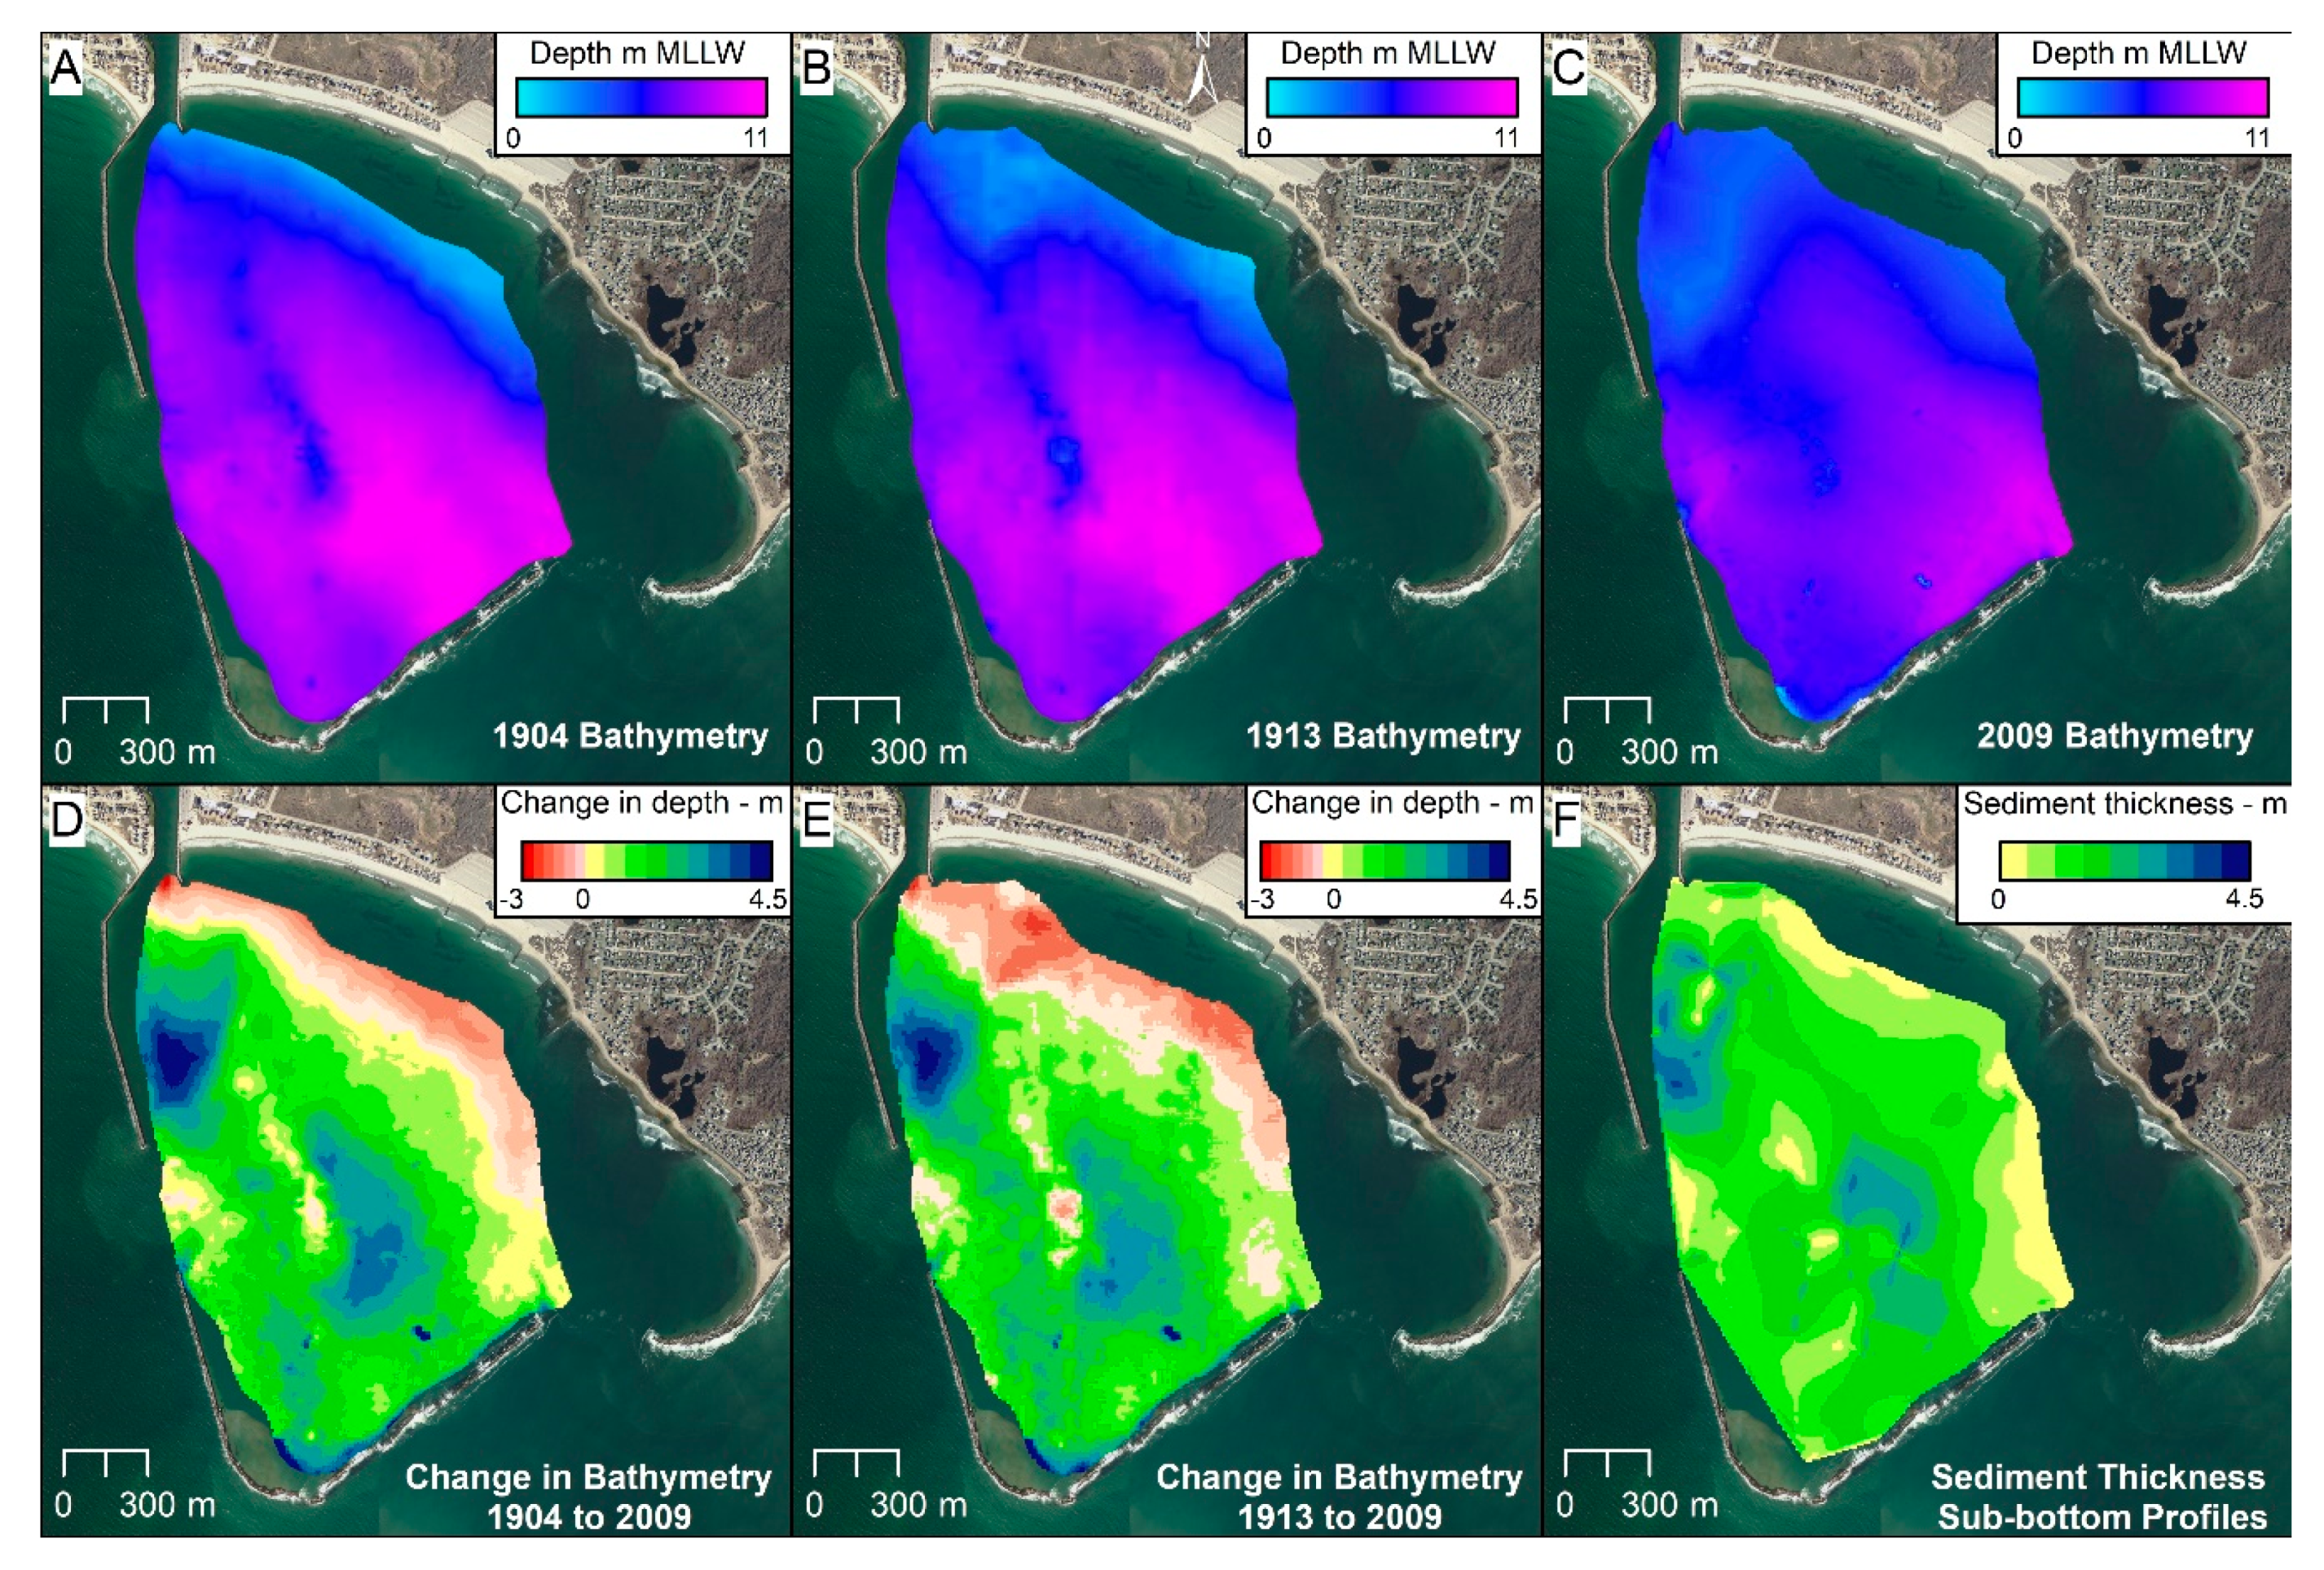
4.2. Bathymetric Surfaces
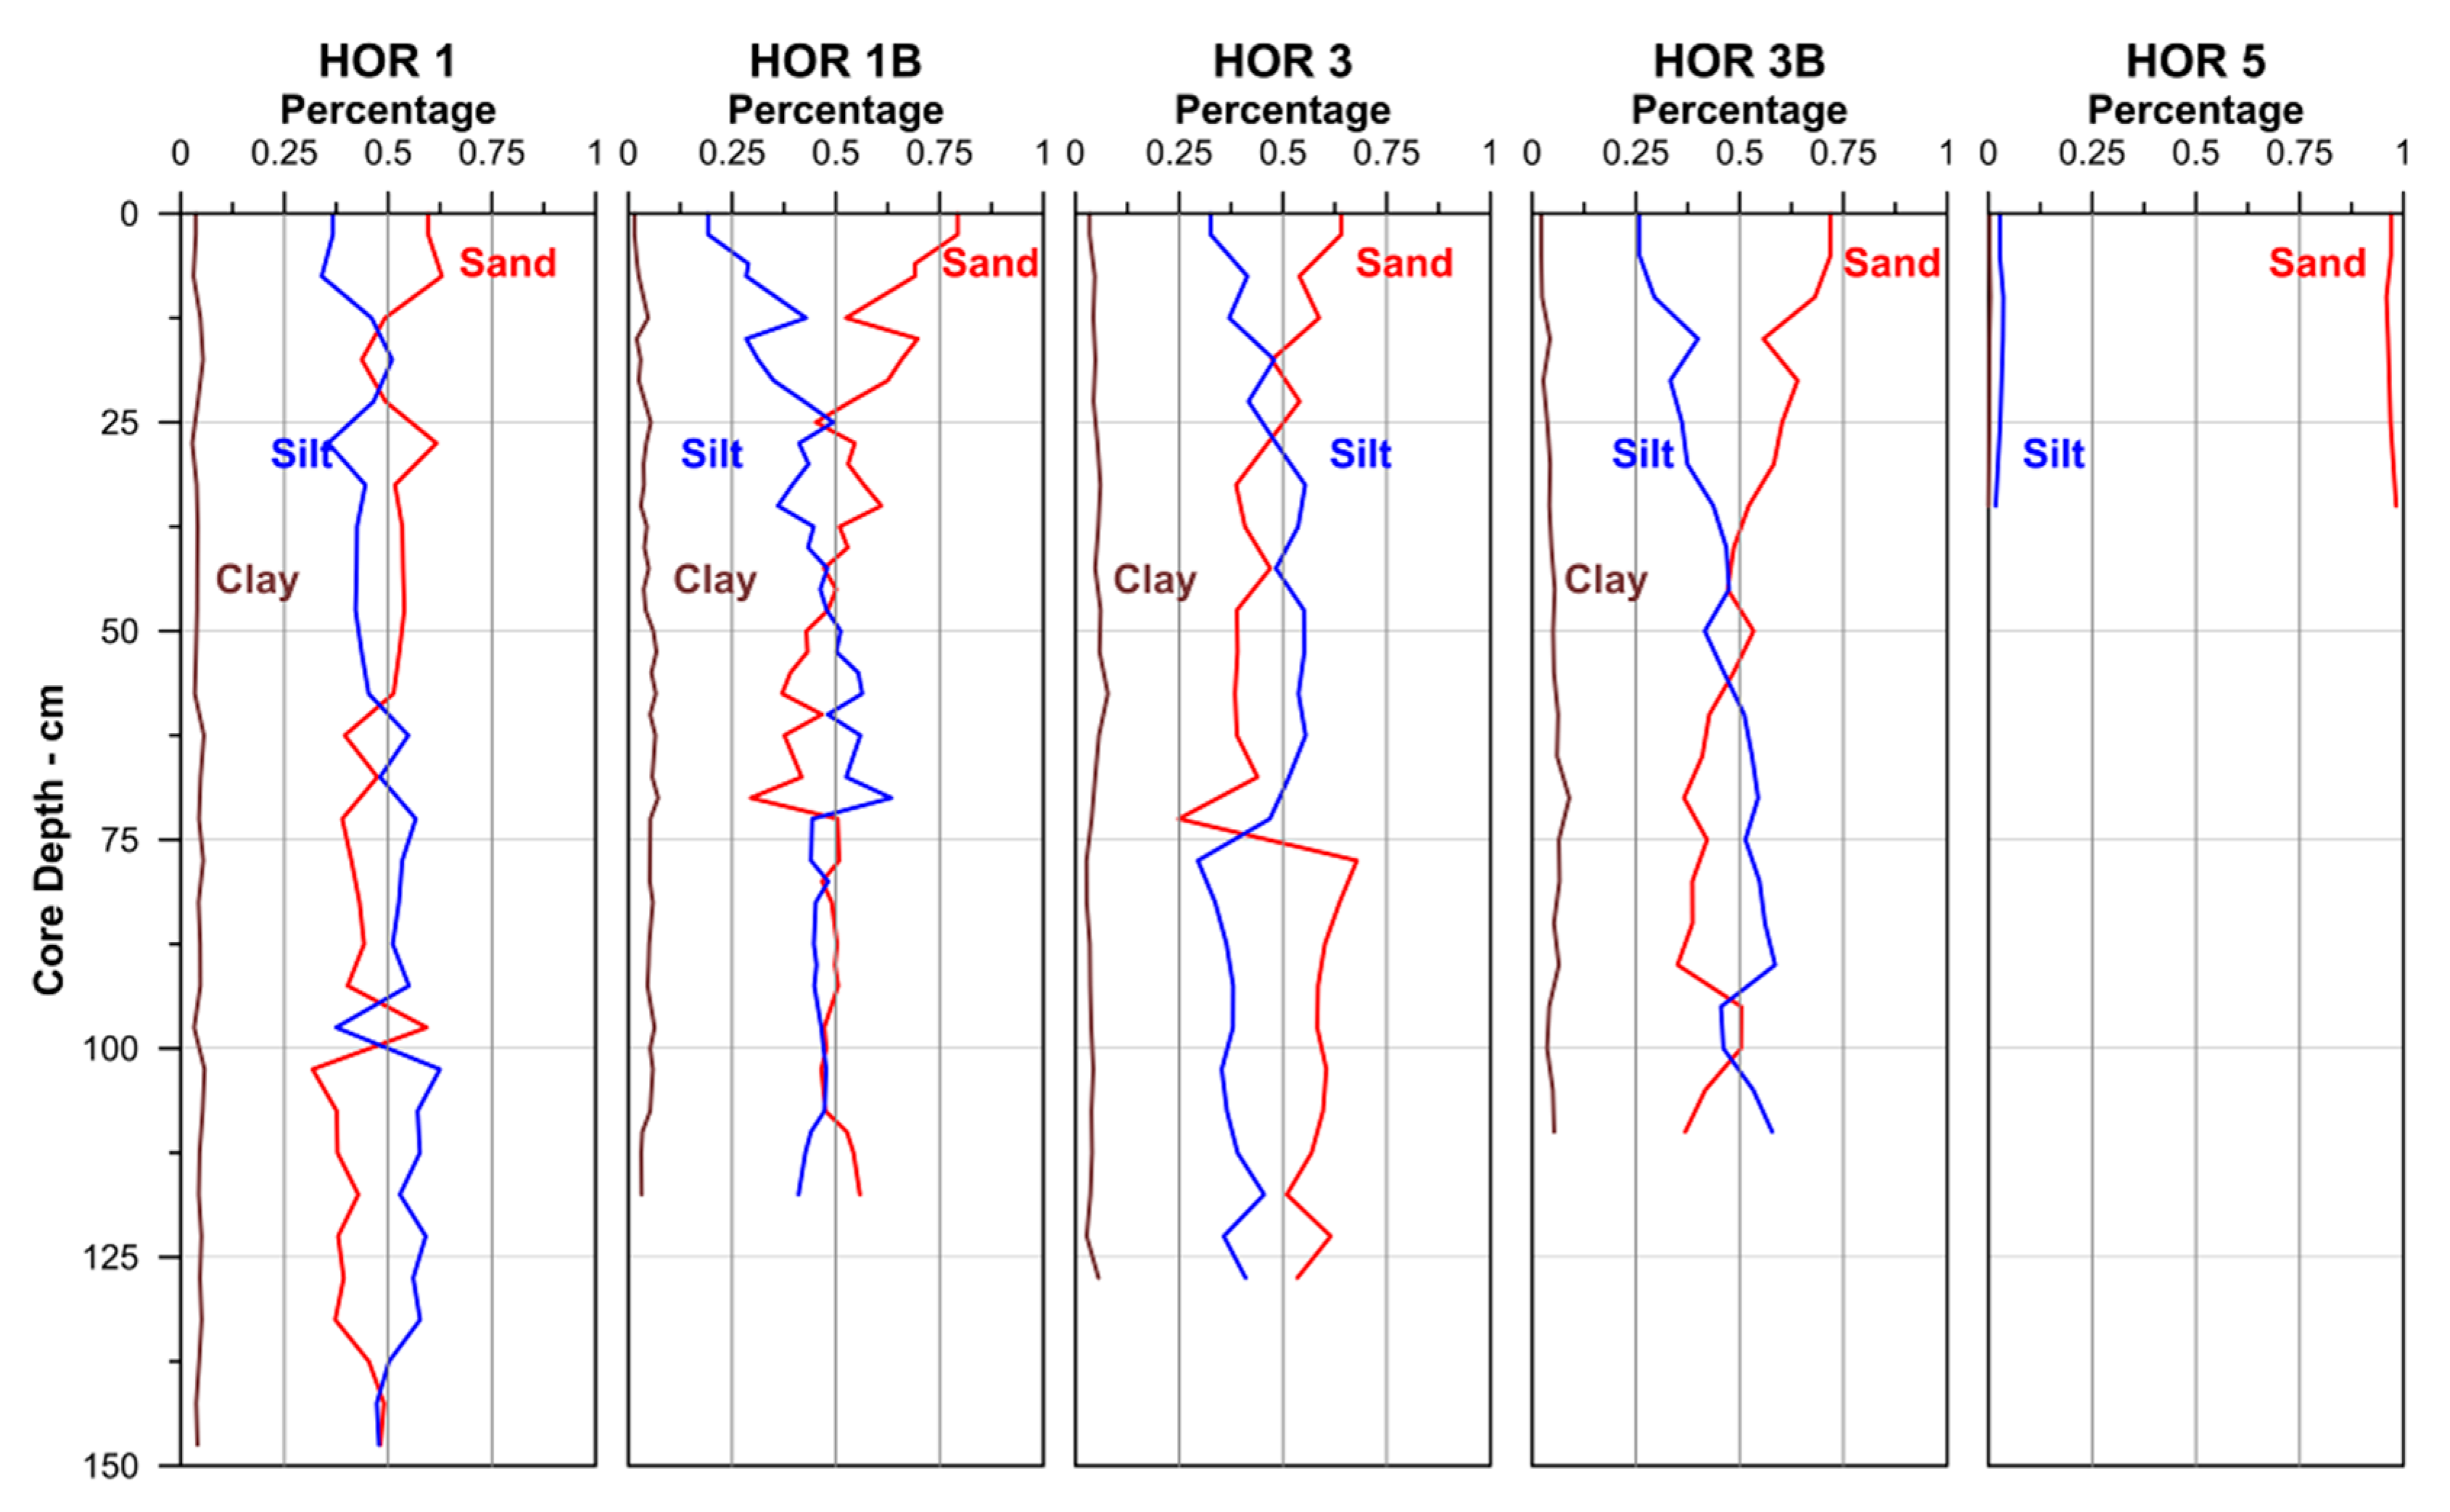
4.3. Sediment Coring
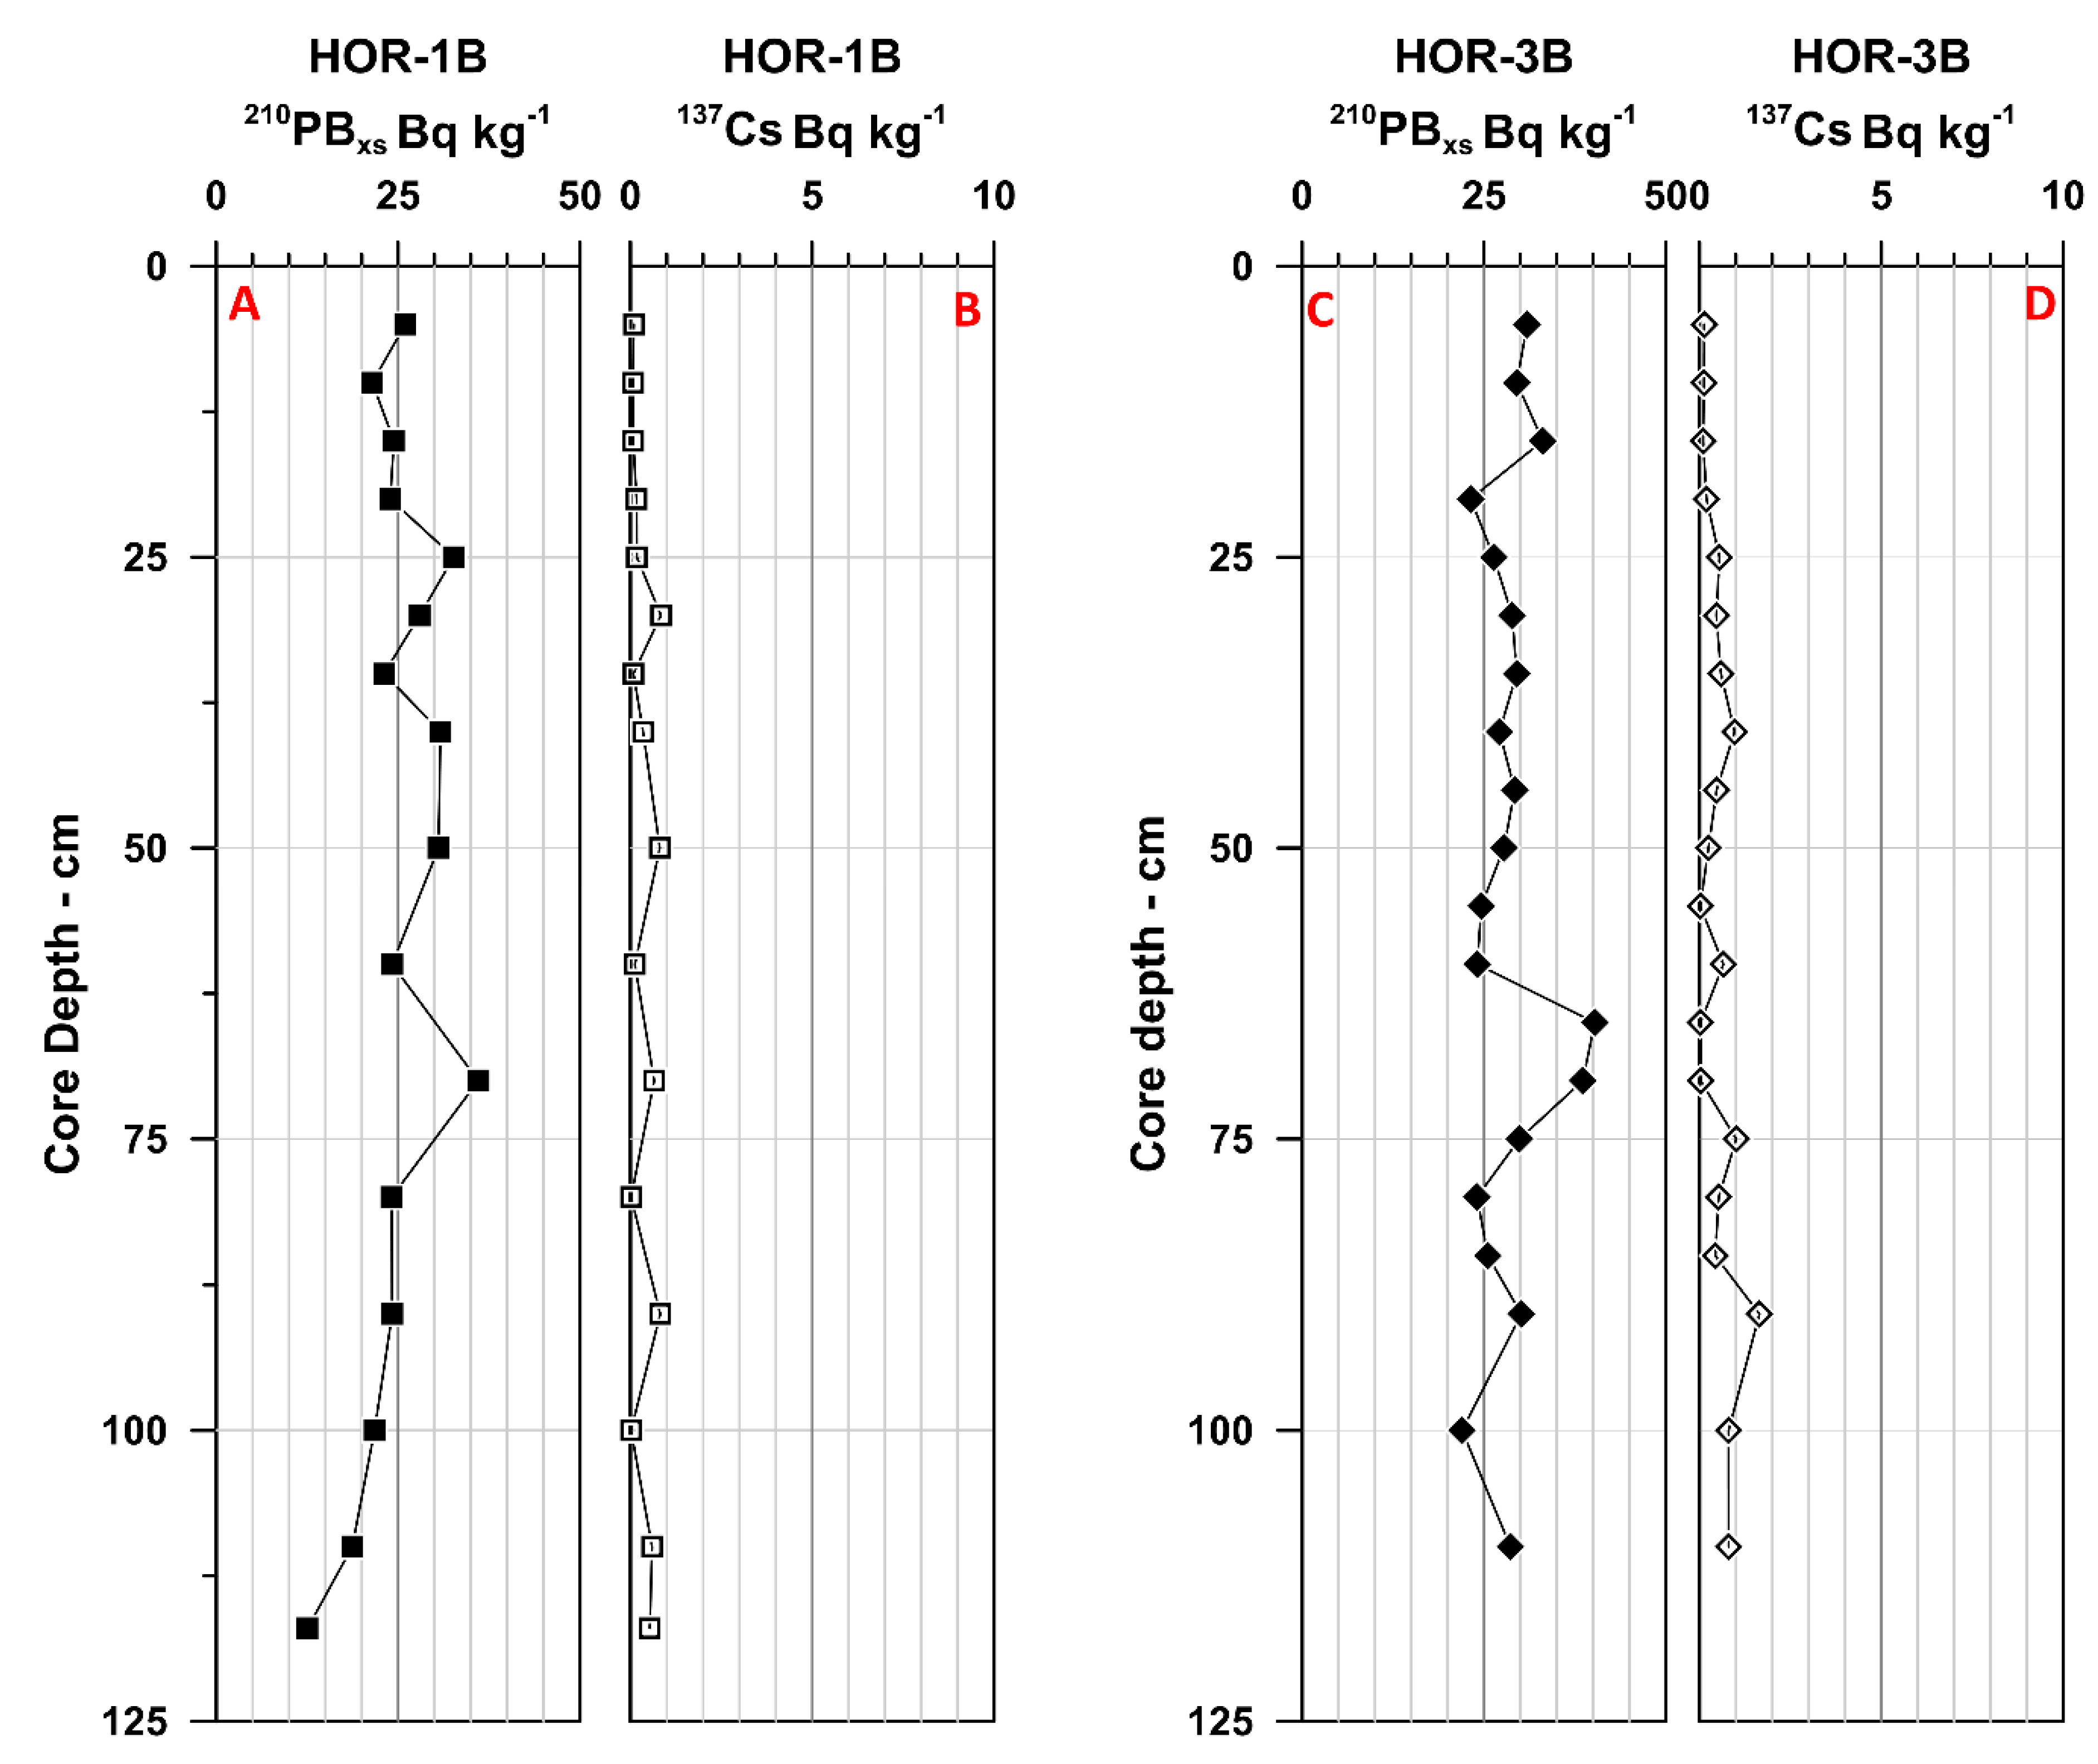
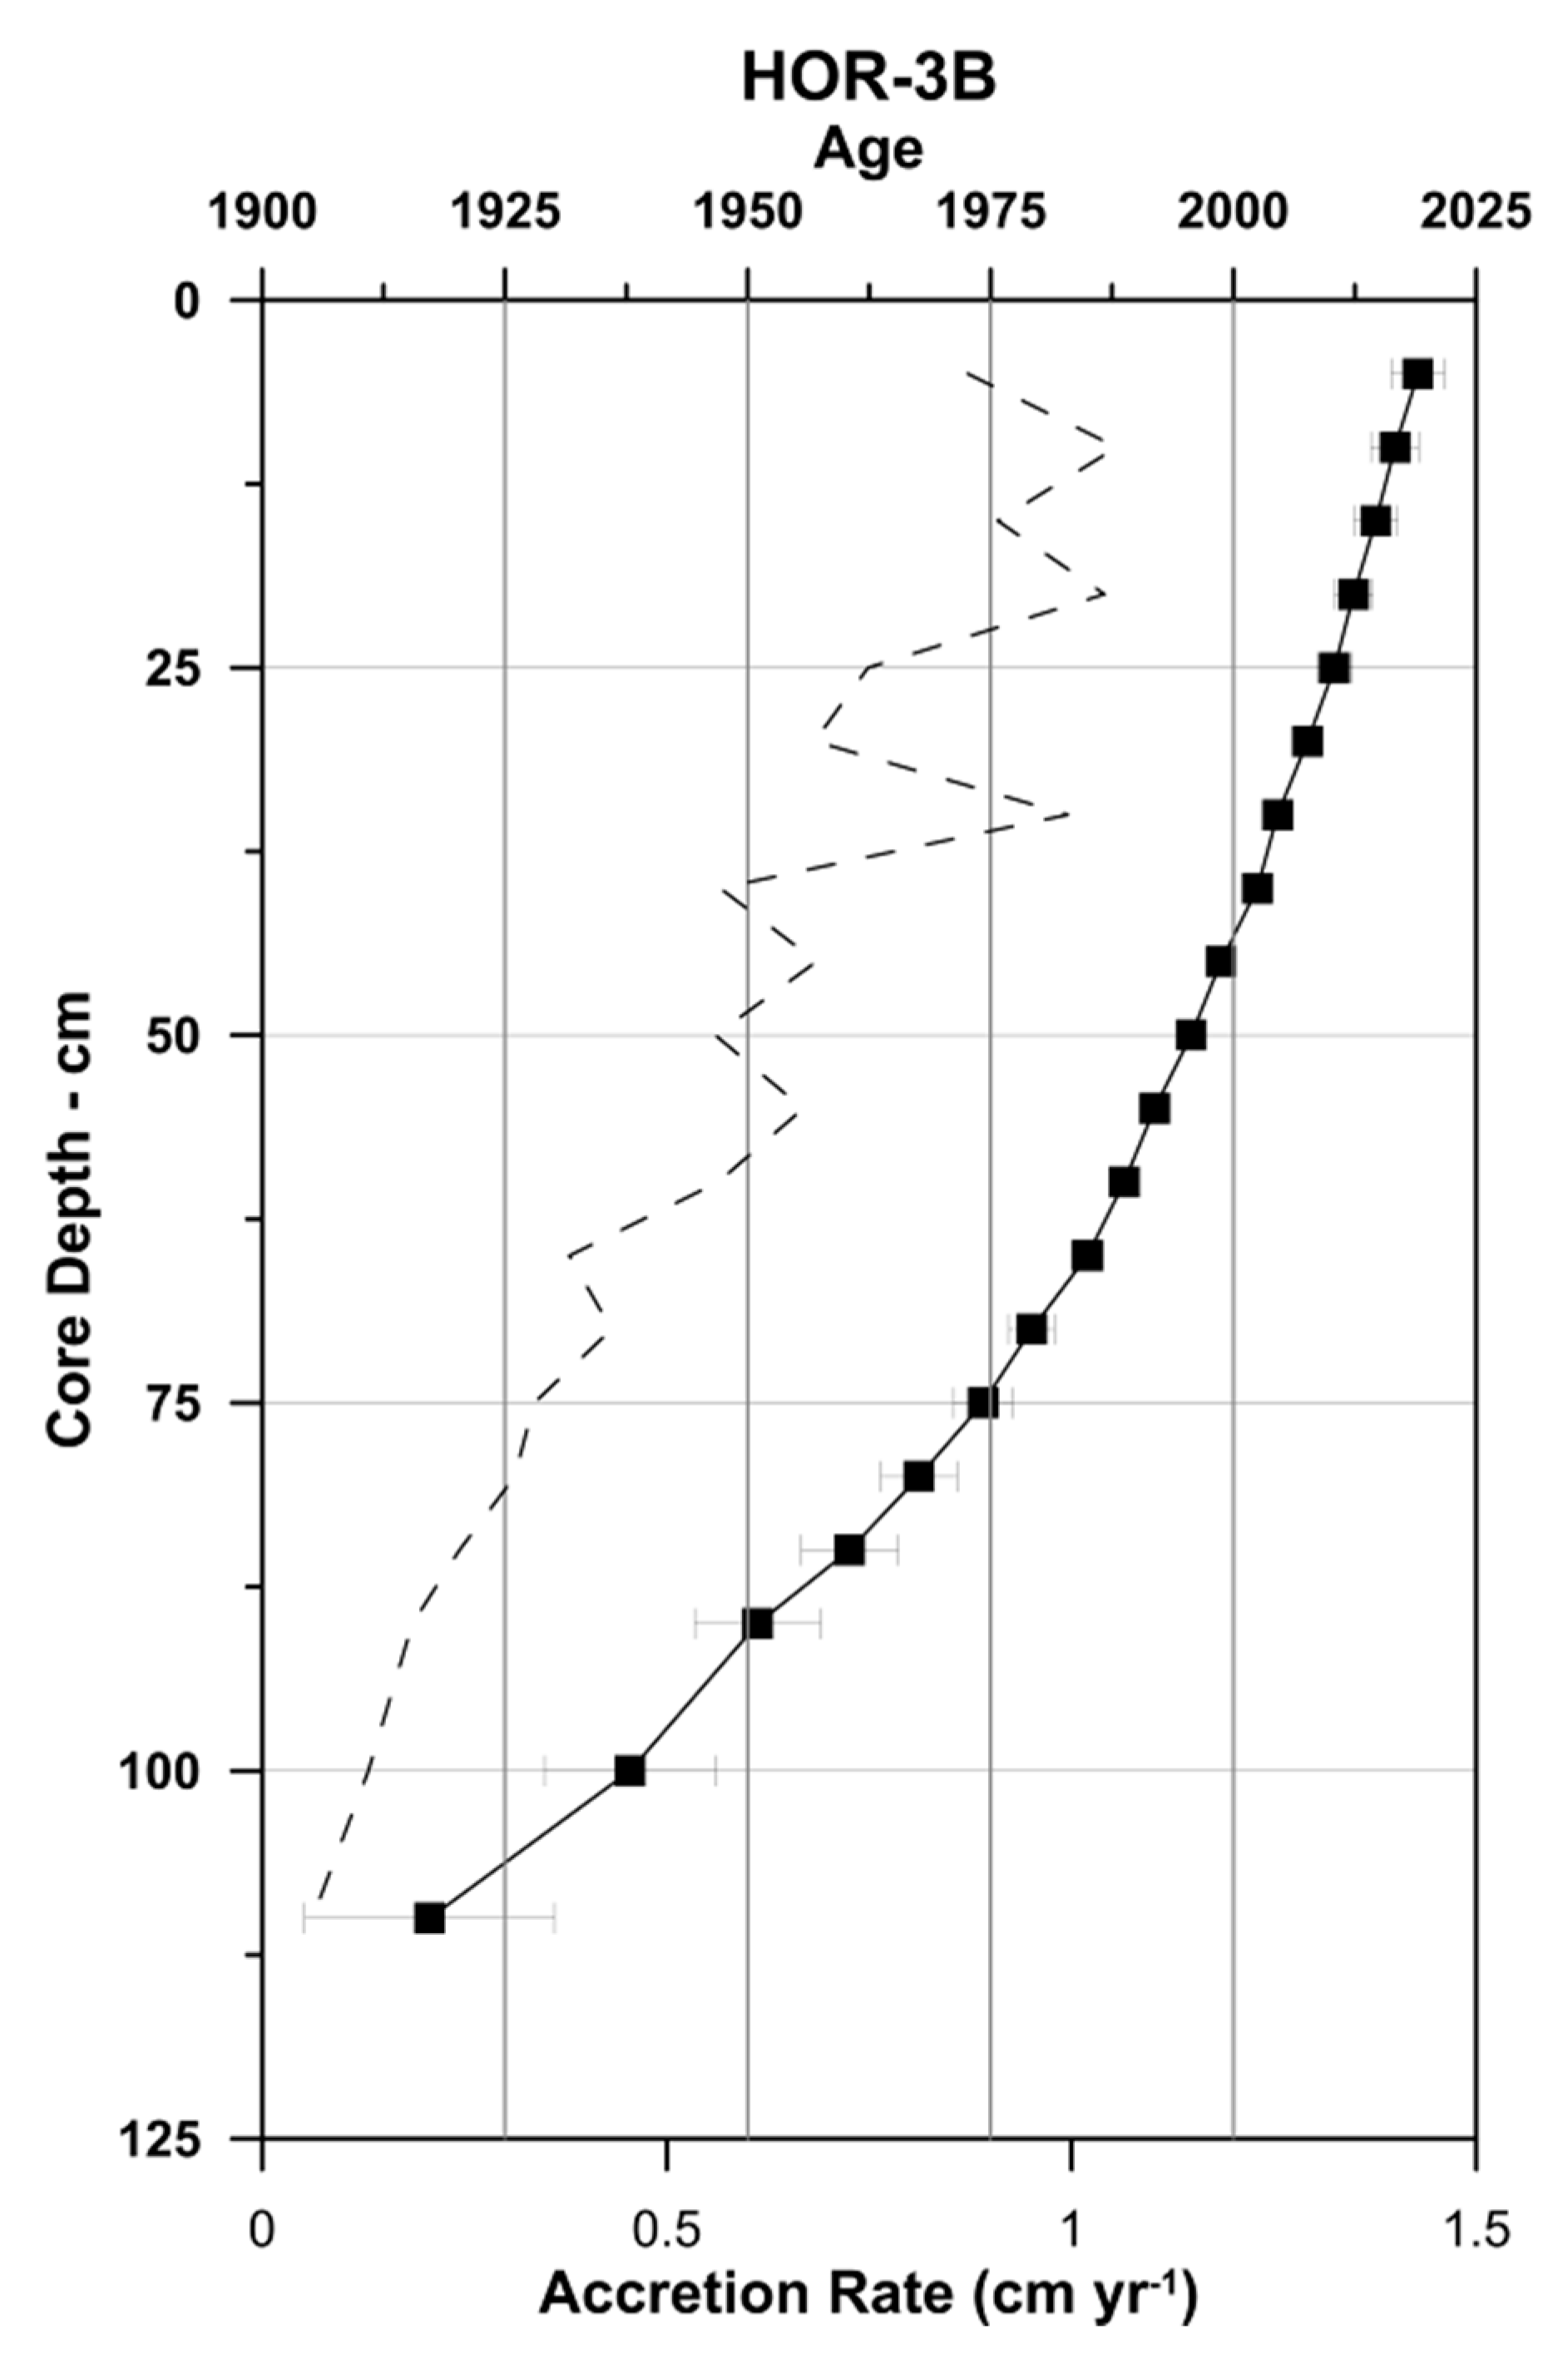
4.4. Lead 210 Isotope Analysis
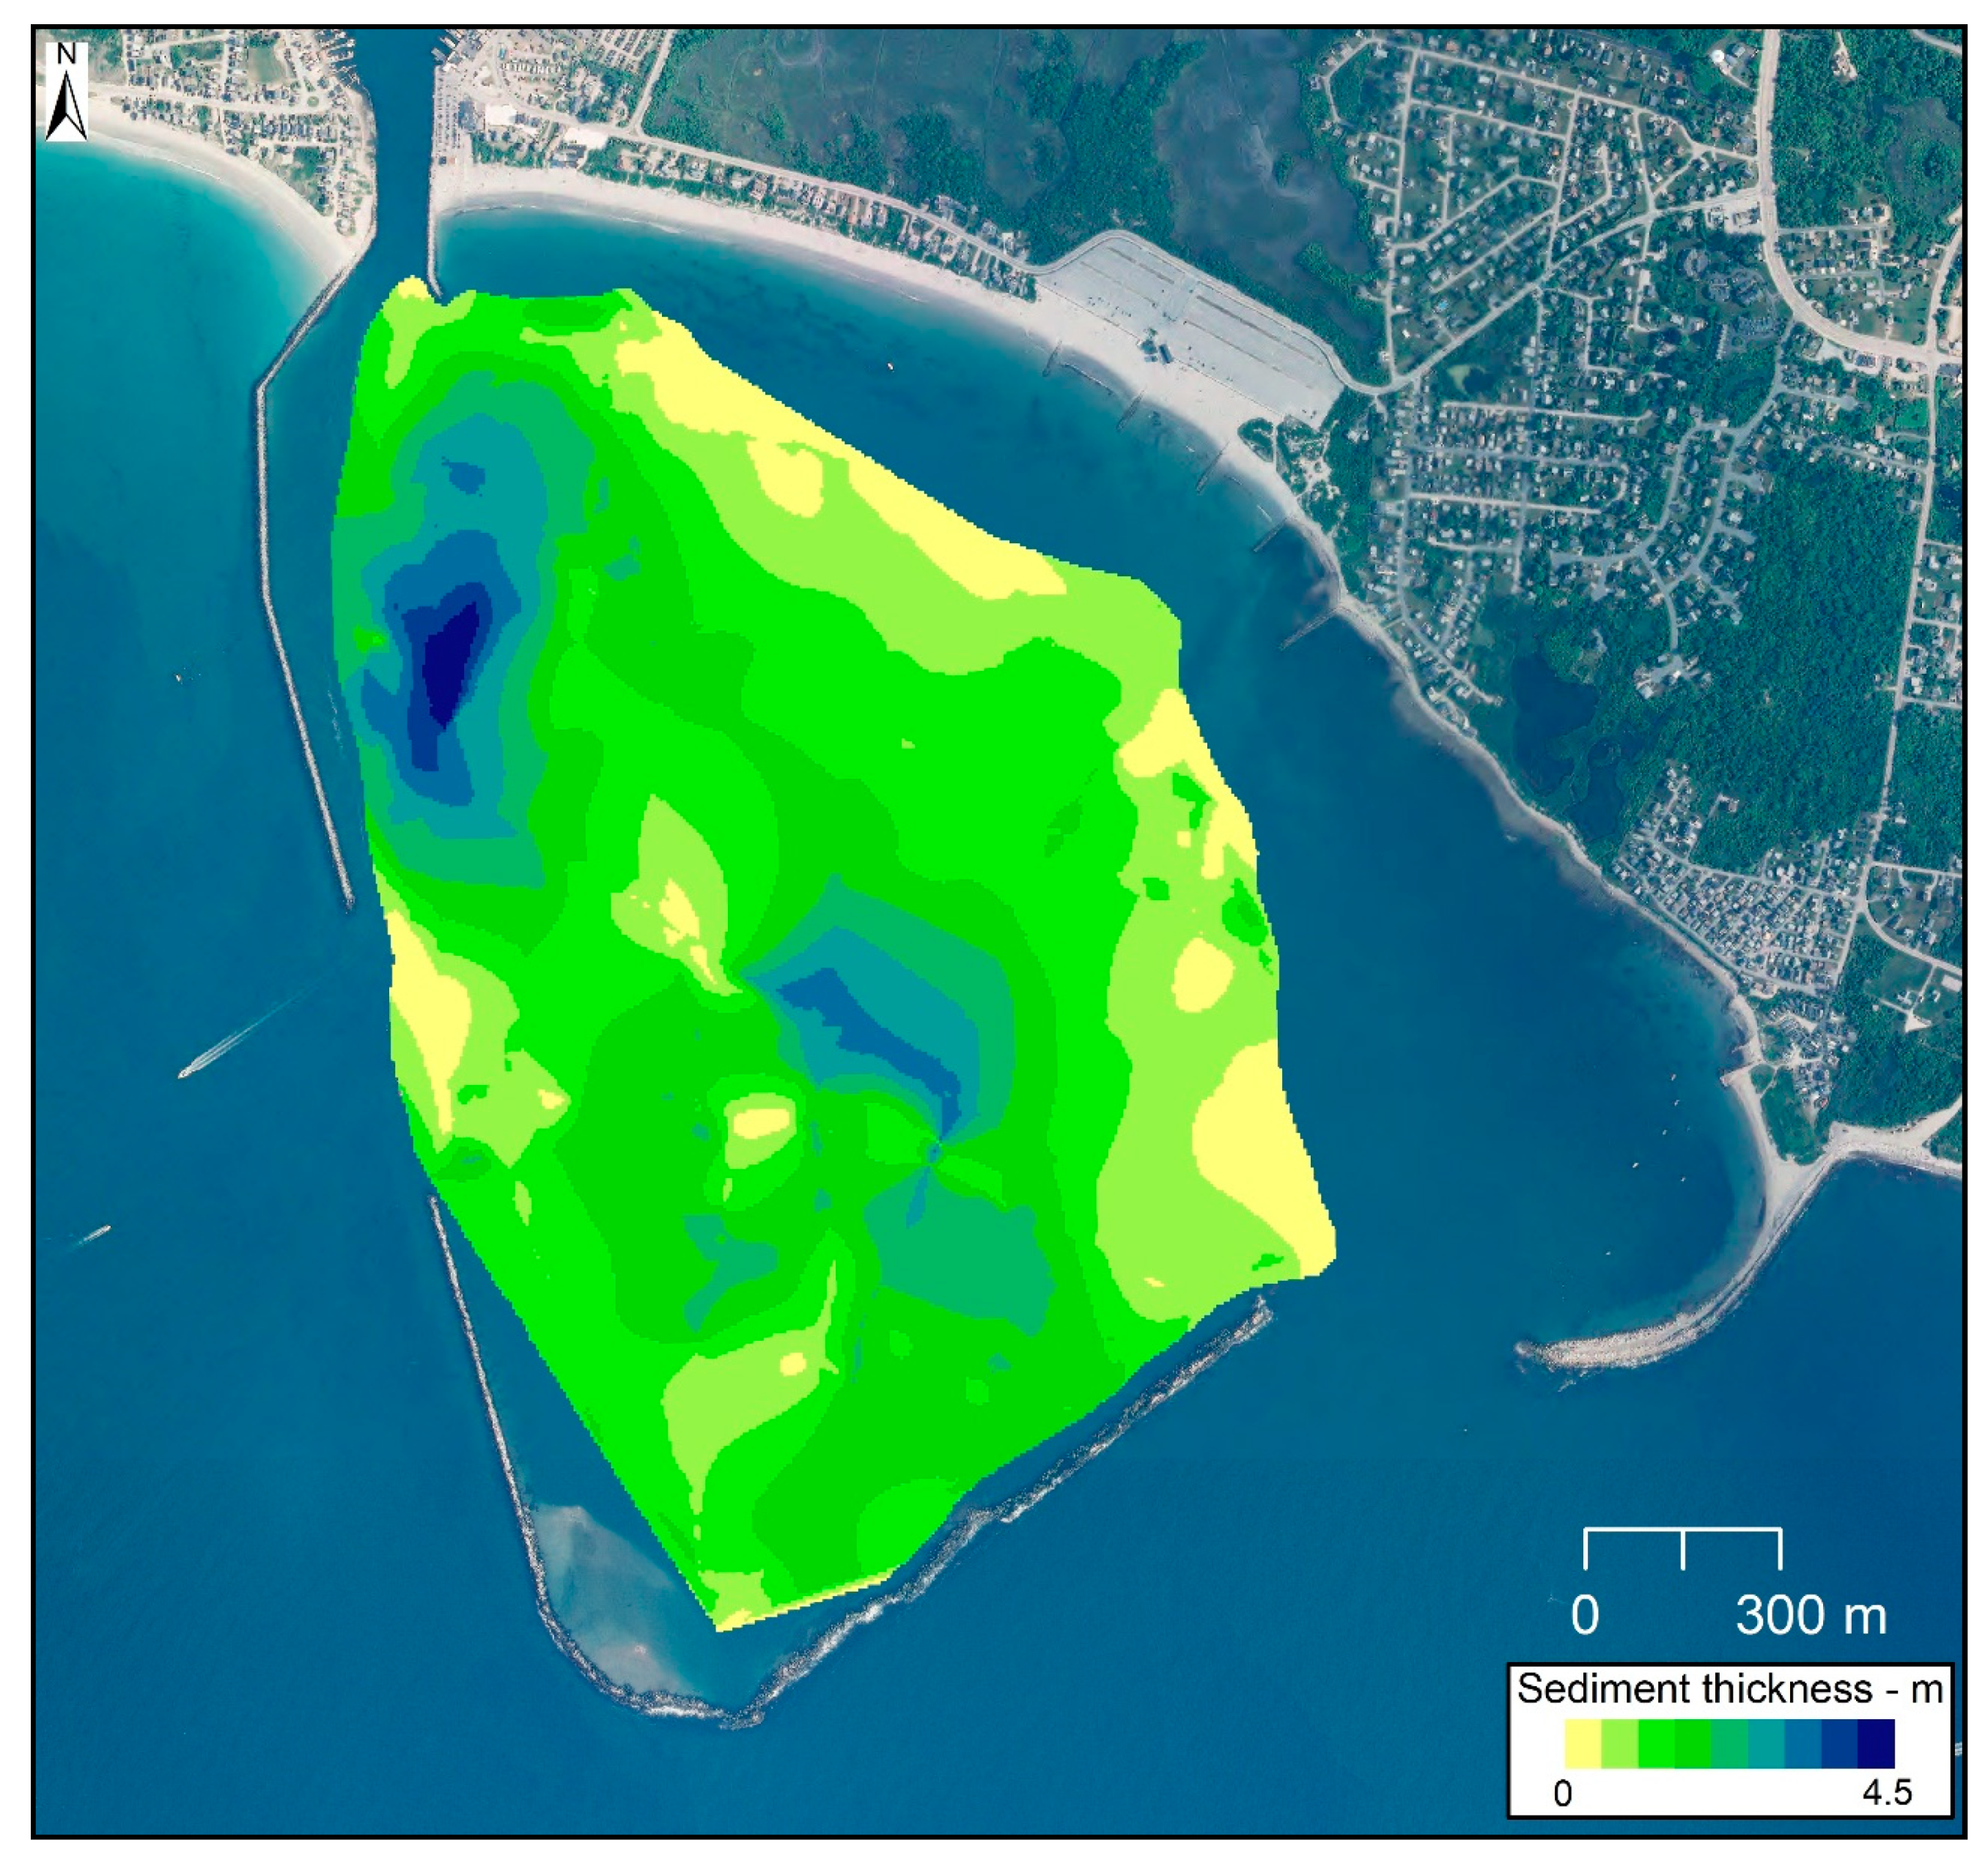
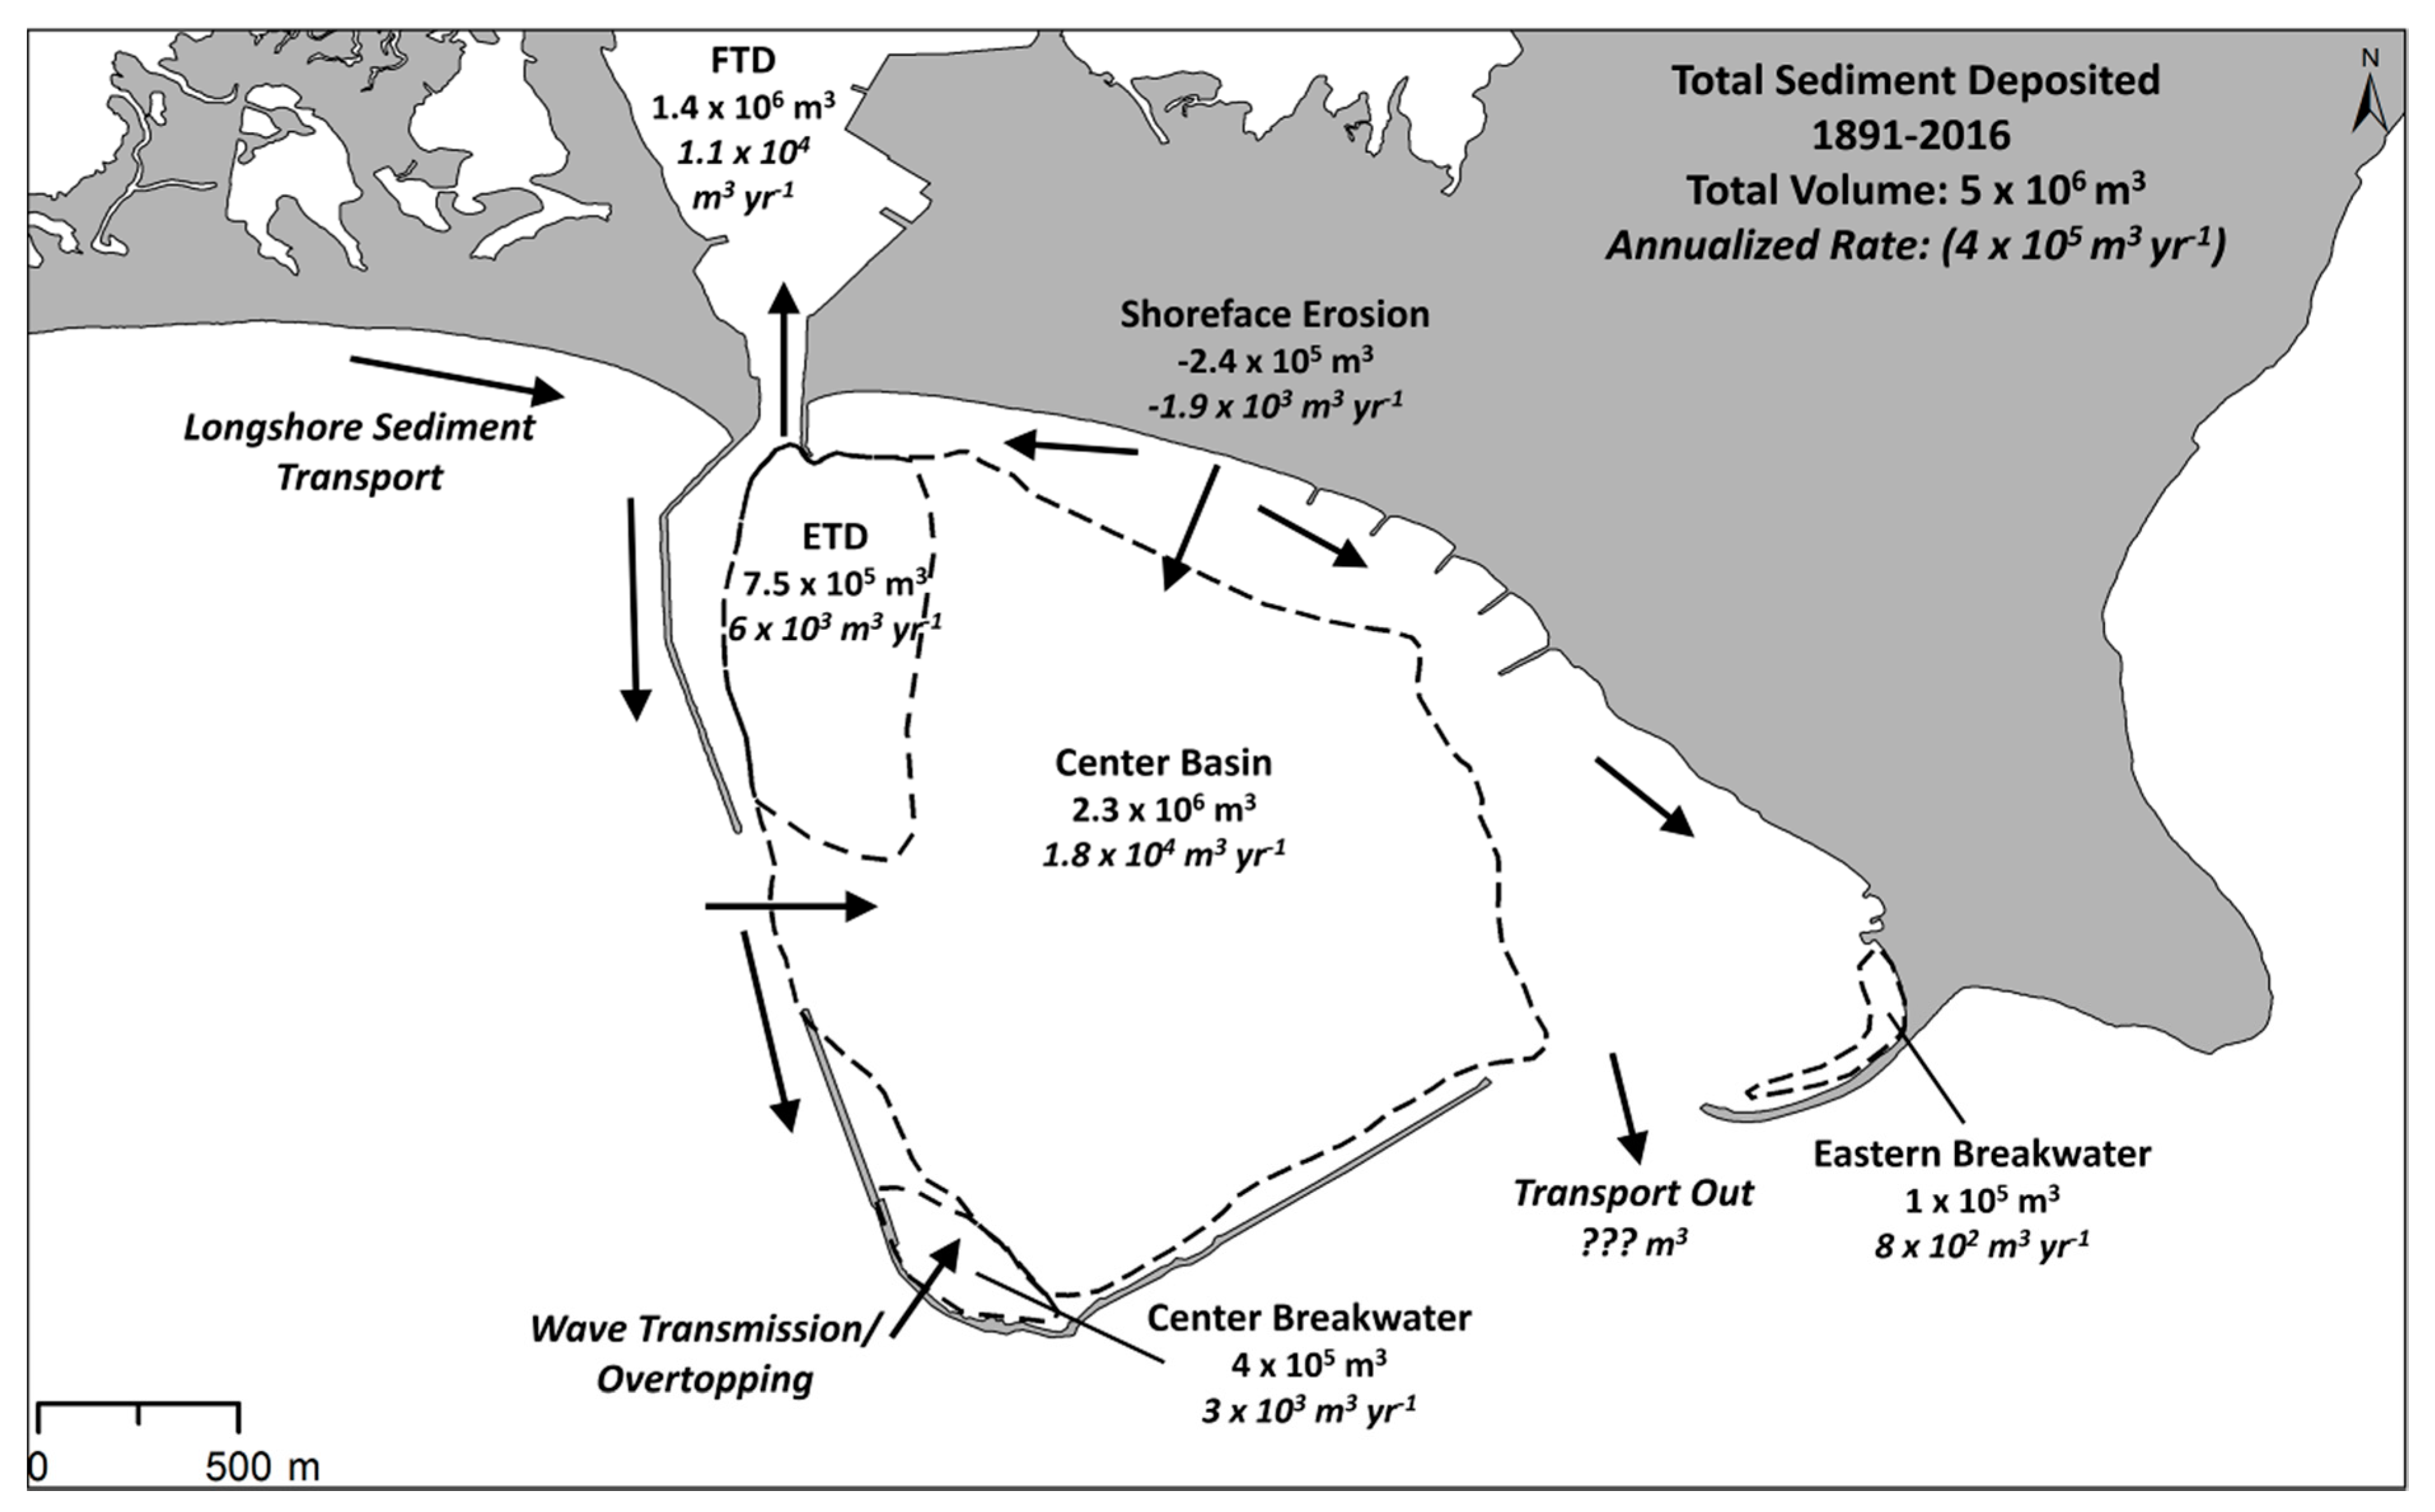
4.5. Total Volume of Post-Construction Sediment
5. Discussion
6. Conclusions
Supplementary Materials
Author Contributions
Funding
Acknowledgments
Conflicts of Interest
References
- Gittman, R.K.; Fodrie, F.J.; Popowich, A.M.; Keller, D.A.; Bruno, J.F.; Currin, C.A.; Peterson, C.H.; Piehler, M.F. Engineering away our natural defenses: An analysis of shoreline hardening in the US. Front. Ecol. Environ. 2015, 13, 301–307. [Google Scholar] [CrossRef]
- USACE. Coastal Engineering Manual; U.S. Army Corps of Engineers: Washington, DC, USA, 2006. [Google Scholar]
- Pilkey, O.H.; Wright, H.L., III. Seawalls Versus Beaches. J. Coast. Res. 1988, 4, 41–64. [Google Scholar]
- Dean, R.G. Coastal armoring: Effects, principles and mitigation. In Proceedings of the 20th International Conference on Coastal Engineering, Taiwan, 9–14 November 1986; pp. 1843–1857. [Google Scholar]
- Dugan, J.E.; Hubbard, D.M.; Rodil, I.F.; Revell, D.L.; Schroeter, S. Ecological effects of coastal armoring on sandy beaches. Mar. Ecol. 2008, 29, 160–170. [Google Scholar] [CrossRef]
- Griggs, G.B. The impacts of coastal armoring. Shore Beach 2005, 73, 13–22. [Google Scholar]
- Church, J.A.; Clark, P.U.; Cazenave, A.; Gregory, J.M.; Jevrejeva, S.; Levermann, A.; Merrifield, M.A.; Milne, G.A.; Nerem, R.S.; Nunn, P.D.; et al. Sea Level Change; PM Cambridge University Press: Cambridge, UK; New York, NY, USA, 2013. [Google Scholar]
- Emanuel, K.; Sundararajan, R.; Williams, J. Hurricanes and global warming: Results from downscaling IPCC AR4 simulations. Bull. Am. Meteorol. Soc. 2008, 89, 347–368. [Google Scholar] [CrossRef]
- Knutson, T.R.; McBride, J.L.; Chan, J.; Emanuel, K.; Holland, G.; Landsea, C.; Held, I.; Kossin, J.P.; Srivastava, A.K.; Sugi, M. Tropical cyclones and climate change. Nat. Geosci. 2010, 3, 157–163. [Google Scholar] [CrossRef]
- Komar, P.D. The budget of littoral sediments—concepts and applications. Shore Beach 1996, 64, 18–26. [Google Scholar]
- Bowen, A.J.; Inman, D.L. Budget of Littoral Sand in the Vicinity of Point Arguello, California. Technical Memorandum No. 19; U.S. Army Coastal Engineering Research Center: Washington, DC, USA, 1966. [Google Scholar]
- Rosati, J.D. Concepts in sediment budgets. J. Coast. Res. 2005, 2005, 307–322. [Google Scholar] [CrossRef]
- Boothroyd, J.C.; Galagan, C.W.; Graves, S.M. Advance and Retreat of the Southern Rhode Island Shoreline, 1939–1985; Including 1985 Berm Volume: Technical Report 7-SRG; SeaGrant College Program; University of Rhode Island: Narragansett, RI, USA, 1988. [Google Scholar]
- Oakley, B.A.; Murphy, C.; Varney, M.; Hollis, R.J. Spatial extent and volume of the shoreface depositional platform on the upper shoreface of the glaciated Rhode Island south shore. Estuaries Coasts 2019. [Google Scholar] [CrossRef]
- Rosati, J.D.; Frey, A.H.; Grzegorzewski, A.S.; Maglio, C.K.; Morang, A.; Thomas, R.C. Conceptual Regional Sediment Budget for USACE North Atlantic Division: Technical Report ERDC/CHLSR-15-2; Coastal and Hydraulics Laboratory, U.S. Army Engineer Research and Development Center: Vicksburg, MS, USA, 2015. [Google Scholar]
- Swift, D.J.P. Coastal erosion and transgressive stratigraphy. J. Geol. 1968, 76, 444–456. [Google Scholar] [CrossRef]
- NOS. Elevations on Station Datum: Point Judith Harbor of Refuge. Available online: https://tidesandcurrents.noaa.gov/datums.html?id=8455083 (accessed on 9 September 2020).
- Hayes, M.O. Barrier Island Morphology as a Function of Tidal and Wave Regime. In Barrier Islands from the Gulf of St. Lawrence to the Gulf of Mexico; Leatherman, S.P., Ed.; Academic Press: New York, NY, USA, 1979; pp. 1–27. [Google Scholar]
- Nummedal, D.; Fischer, I.A. Process-response models for depositional shorelines: The German and the Georgia bights. Coast. Eng. Proc. 1978, 1, 1215–1231. [Google Scholar]
- Fitzgerald, D.M.; Van Heteren, S. Classification of paraglacial barrier systems: Coastal New England, USA. Sedimentology 1999, 46, 1083–1108. [Google Scholar] [CrossRef]
- CGS. H02691: NOS Hydrographic Survey; Survey, C.A.G., Ed.; Hydrographic Surveys Division, Office of Coast Survey, National Ocean Service, NOAA, U.S. Department of Commerce: Silver Spring, MD, USA, 1904.
- CGS. H03521: NOS Hydrographic Survey; Survey, C.A.G., Ed.; Hydrographic Surveys Division, Office of Coast Survey, National Ocean Service, NOAA, U.S. Department of Commerce: Silver Spring, MD, USA, 1913.
- Melby, J.A.; Nadal-Caraballo, N.C.; Winkleman, J. Point Judith, Rhode Island, Breakwater Risk Assessment, TR-15-13 ed.; Coastal and Hydraulics Laboratory: Vicksburg, MS, USA, 2015. [Google Scholar]
- NOAA-NOS. Datums for 8455083, Point Judith, Harbor of Refuge; National Ocean Service: Silver Spring, MD, USA, 2004.
- Lin, L.; Demirbilek, Z. Coupled BOUSS-2D and CMS-Wave Modeling Approach for Harbor Projects; U.S. Army Engineer Research and Development Center: Vicksburg, MD, USA, 2012. [Google Scholar]
- Boothroyd, J.C.; McCandless, S.J.; Dowling, M.J. Quaternary Geologic Map of Rhode Island. Interim Map, 21 Quadrangles ed.; Rhode Island Geological Survey STATEMAP Program: Kingston, RI, USA, 2003.
- Kaye, C.A. Surficial Geology of the Kingston Quadrangle: U.S; Geological Survey Bulletin 1071-1; US Government Printing Office: Washington, DC, USA, 1960; Volume 20.
- Schafer, J.P. Surficial Geology of the Narragansett Pier Quadrangle, Rhode Island; US Geological Survey, Quadrangle Map GQ-140: Washington, DC, USA, 1961.
- WHG. Wave, Tide and Current Data Collection, Washington County, Rhode Island: Report to the U.S.; Army Corps of Engineers by the Woods Hole Group: Bourne, MS, USA, 2012. [Google Scholar]
- USACE. North Atlantic Coast Comprehensive Study: Resilient Adaptation to Increasing Risk: Main Report; U.S. Army Corps of Engineers: Washington, D.C., WS, USA, 2015.
- Boothroyd, J.C.; Friedrich, N.E.; McGinn, S.R. Geology of microtidal coastal lagoons: Rhode Island. Mar. Geol. 1985, 63, 35–76. [Google Scholar] [CrossRef]
- NOAA. Current Predictions: Harbor of Refuge, south entrance, Station ID: ACT2266. Available online: https://tidesandcurrents.noaa.gov/noaacurrents/Predictions?id=ACT2266_1 (accessed on 25 September 2020).
- Boothroyd, J.C.; Hollis, R.J.; Oakley, B.A.; Henderson, R. Shoreline Change Maps for Washington County Rhode Island Depicting Shoreline Change from 1939–2014; Rhode Island Geological Survey: Kingston, RI, USA, 2016.
- Hapke, C.J.; Himmelstoss, E.A.; Kratzmann, M.G.; List, J.H.; Thieler, E.R. National Assessment of Shoreline Change: Historical Shoreline Change Along the New England and Mid-Atlantic Coasts; US Geological Survey: Reston, VA, USA, 2010.
- King, J.W.; Oakley, B.A.; Baxter, C.; Grilli, A.; Spaulding, M.; Fugate, G.; Crean, T.; McCann, J.; Englehart, S.; Meyerson, L.; et al. An Integrated Program of Environmental Characterization and Monitoring, Modeling, and Engineering to Develop Management Policies and Practices that will Enhance Coastal Resiliency in Rhode Island: FINAL REPORT: Prepared under: National Fish and Wildlife Foundation—Hurricane Sandy Coastal Resiliency Project #2300.14.044017/44017; The University of Rhode Island: Narragansett, RI, USA, 2019. [Google Scholar]
- U.S. Army Corps of Engineers, New England District. Environmental Assessment for maintenance dredging of the Point Judith Pond Federal Navigation Project, Port of Galilee, Narragansett, Rhode Island; U.S. Army Corps of Engineers: Concord, MA, USA, 2006.
- Billy, J.; Robin, N.; Certain, R.; Hein, C.; Berné, S. Barrier shoreline evolution constrained by shoreface sediment reservoir and substrate control: The Miquelon-Langlade Barrier, NW Atlantic. J. Coast. Res. 2013, 2086, 2089–2094. [Google Scholar] [CrossRef]
- Schwab, W.C.; Baldwin, W.E.; Warner, J.C.; List, J.H.; Denny, J.F.; Liste, M.; Safak, I. Change in morphology and modern sediment thickness on the inner continental shelf offshore of Fire Island, New York between 2011 and 2014: Analysis of hurricane impact. Mar. Geol. 2017, 391, 48–64. [Google Scholar] [CrossRef]
- NOAA-NOS. Hydrographic Survey H12023, Point Judith to Green Hill Point, Project NumberOPR-B363-TJ-09. U.S; Department of Commerce, N.O.A.A.; National Ocean Survey: Silver Spring, MD, USA, 2012.
- NOAA. Field Procedures Manual; National Oceanic and Atmospheric Administration: Washington, DC, USA, 2014.
- Saville, T.; Caldwell, J.M. Accuracy of Hydrographic Surveying in and Near the Surf Zone; US Beach Erosion Board; U.S. Army Corps of Engineers: Washington, DC, USA, 1953.
- Byrnes, M.R.; Baker, J.L.; Li, F. Quantifying Potential Measurement Errors and Uncertainties Associated with Bathymetric Change Analysis (ERDC/CHL CHETN-IV-50); US Army Corps of Engineers, Engineer Research and DevelopmentCenter, Coastal and Hydraulics Laboratory: Vicksburg, MS, USA, 2002. [Google Scholar]
- RIGIS. April 2014 Rhode Island Statewide High Resolution Orthoimages; Rhode Island Geographic Information System (RIGIS) Data Distribution System; Environmental Data Center: Kingston, RI, USA, 2015. [Google Scholar]
- Spaulding, M.L.; Grilli, A.; Damon, C.; Fugate, G.; Oakley, B.A.; Isaji, T.; Schambach, L. Application of state of art modeling techniques to predict flooding and waves for an exposed coastal area. J. Mar. Sci. Eng. 2017, 5, 10. [Google Scholar] [CrossRef]
- NOS. Relative Sea Level Trend, 8452660, Newport, RI. Available online: https://tidesandcurrents.noaa.gov/sltrends/sltrends_station.shtml?id=8452660 (accessed on 2 April 2020).
- Geise, G.S.; Borrelli, M.; Mague, S.T.; Smith, T.L.; Barger, P.; Hughes, P. Assessment of Multi-Decadal Coastal Change: Provincetown Harbor to Jeremy Point, Wellfleet. A Report Submitted to the Massachusetts Bays Program; Center for Coastal Studies: Provincetown, MA, USA, 2014. [Google Scholar]
- Mague, S.T. Retracing the Past: Recovering 19th century benchmarks to measure shoreline change along the outer shore of Cape Cod, Massachusetts. Cartogr. Geogr. Inf. Sci. 2012, 39, 30–47. [Google Scholar] [CrossRef]
- Cutshall, N.H.; Larsen, I.L.; Olsen, C.R. Direct analysis of 210Pb in sediment samples: Self-absorption corrections. Nucl. Instrum. Methods Phys. Res. 1983, 206, 309–312. [Google Scholar] [CrossRef]
- Corbett, D.R.; Walsh, J.P. 210Lead and 137Cesium. In Handbook of Sea-Level Research; Shennan, I., Long, A.J., Horton, B.P., Eds.; Wiley-Blackwell: Hoboken, NJ, USA, 2015; pp. 361–372. [Google Scholar] [CrossRef]
- Goldberg, G.D. Geochronology with 210 Pb; International Atomic Energy Agency: Vienna, Austria, 1963. [Google Scholar]
- Claypool, G.E.; Kvenvolden, K.A. Methane and other hydrocarbon gases in marine sediment. Annu. Rev. Earth Planet. Sci. 1983, 11, 299–327. [Google Scholar] [CrossRef]
- Shubel, J.R. Gas Bubbles and the Acoustically Impenetrable, or Turbid Character of Some Estuarine Sediments; Kaplan, I.R., Ed.; Springer: Boston, MA, USA, 1974; Volume 3, pp. 275–298. [Google Scholar]
- Ussler, W.; Paull, C.K.; Boucher, J.; Friederich, G.E.; Thomas, D.J. Submarine pockmarks: A case study from Belfast Bay, Maine. Mar. Geol. 2003, 202, 175–192. [Google Scholar] [CrossRef]
- NOAA-NOS. Point Judith Harbor, NOAA Chart 13219; National Ocean Service: Silver Spring, MD, USA, 2017.
- Shepard, F.P. Nomenclature based on sand-silt-clay ratios. J. Sediment. Res. 1954, 24, 151–158. [Google Scholar]
- McMullen, K.Y.; Poppe, L.J.; Ackerman, S.D.; Blackwood, D.S.; Lewit, P.G.; Parker, C.E. Sea-Floor Geology in Northeastern Block Island Sound, Rhode Island: U.S. Geological Survey Open-File Report 2013–1003; U.S. Geological Survey: Woods Hole, MA, USA, 2013.
- Komar, P.D. Beach Processes and Sedimentation; Prentice Hall: Upper Saddle River, NJ, USA, 1998. [Google Scholar]
- Edwards, B.L.; Namikas, S.L. Changes in Shoreline change trends in response to a detached breakwater field at grand Isle, Louisiana. J. Coast. Res. 2011, 27, 698–705. [Google Scholar]
- Handin, J.W.; Ludwick, J.W. Accretion of Beach Sand Behind a Detached a Breakwater; Beach Erosion Control Board Technical Memorandum 16; U.S. Army Corps of Engineers: Washington, DC, USA, 1950; Volume 16.
- Johnson, J.W. Sand transport by littoral currents. In Proceedings of the 5th Hydraulics Conference, Iowa, IA, USA, 9–11 June 1952; pp. 89–109. [Google Scholar]
- King, D.M.; Cooper, N.J.; Morfett, J.C.; Pope, D.J. Application of offshore breakwaters to the UK: A case study at Elmer0Bbeach. J. Coast. Res. 2000, 16, 172–187. [Google Scholar]
- Komar, P.D. Coastal Erosion in Response to the Construction of Jetties and Breakwaters. In Handbook of Coastal Processes and Erosion; CRC Press: Boca Raton, FL, USA, 1983; pp. 191–204. [Google Scholar]
- Nummedal, D.; Sonnenfeld, D.L.; Taylor, K. Sediment Transport and Morphology at the Surf Zone of Presque Isle, Lake Erie, Pennsylvania. In Developments in Sedimentology; Greenwood, B., Davis, R.A., Eds.; Elsevier: Amsterdam, The Netherlands, 1984; Volume 39, pp. 99–122. [Google Scholar]
- Zaker, N.H.; Etemad-Shahidi, A. Sedimentation in Babolsar and Pozm fishery ports in Iran. In Proceedings of the 8th International Coastal Symposium (ICS 2004), Santa Catarina, Brazil, 14–19 March 2004; pp. 424–427. [Google Scholar]
- Belknap, D.F.; Kraft, J.C. Influence of antecedent geology on stratigraphic preservation potential and evolution of Delaware’s barrier systems. Mar. Geol. 1985, 63, 235–262. [Google Scholar] [CrossRef]
- Riggs, S.R.; Cleary, W.J.; Snyder, S.W. Influence of inherited geologic framework on barrier shoreface morphology and dynamics. Mar. Geol. 1995, 126, 213–234. [Google Scholar] [CrossRef]
- Thieler, E.R.; Brill, A.L.; Cleary, W.J.; Hobbs, C.H.; Gammisch, R.A. Geology of the Wrightsville Beach, North Carolina shoreface: Implications for the concept of shoreface profile of equilibrium. Mar. Geol. 1995, 126, 271–287. [Google Scholar] [CrossRef]
- Hayes, M.O. General morphology and sediment patterns intidal inlets. Sediment. Geol. 1980, 26, 139–156. [Google Scholar] [CrossRef]
- van Gaalen, J.F.; Tebbens, S.F.; Barton, C.C. Longshore sediment transport directions and rates from Northern Maine to Tampa Bay, Florida: Literature compilation and interpretation. J. Coast. Res. 2016, 32, 1277–1301. [Google Scholar] [CrossRef]
- Fisher, J.J. Coastal Structures in Rhode Island; Walker, H.J., Ed.; The GeoJournal Library; Springer: Dordrecht, Netherlands, 1988; pp. 560–571. [Google Scholar]
- McMaster, R.L. Mineralogy as an indicator of beach sand movement along the Rhode Island shore. J. Sediment. Res. 1960, 30, 404–413. [Google Scholar]
- Boothroyd, J.C. Toward a sediment budget for the southern Rhode Island shoreline. In Proceedings of the Northeastern Section Geological Society of America, Springfield, MA, USA, 25–27 March 2002; p. 78. [Google Scholar]
- Morton, R.A.; Bohlen, W.F.; Aubrey, D.G.; Miller, M.C. Changes at Misquamicut Beach Rhode Island, 1962–1973; Miscellaneous paper CERC-84-12; Coastal Engineering Research Center: Vicksburg, MS, USA, 1984. [Google Scholar]
- Nixon, S.W.; Granger, S.; Oviatt, C.; Fields, L.; Mercer, J. Spatial and Temporal Variability of Surface Chlorophyll, Primary Production, and Benthic Metabolism in Rhode Island and Block Island Sounds Technical Report 9: Rhode Island Ocean Special Area Management Plan; Rhode Island Coastal Resources Management Council and University of Rhode Island Coastal Resources Center: Narragansett, RI, USA, 2010.
- U.S. Army Corps of Engineers, N.E.D. Point Judith Harbor of Refuge and Point Judith Pond, Narragansett, Rhode Island, Detailed Project Report and Environmental Assessment. 2018. Available online: https://www.nae.usace.army.mil/Portals/74/docs/Topics/PtJudith107/01-PtJudith107-DraftDPR-Sept2018.pdf?ver=2018-09-19-123339-400 (accessed on 30 October 2020).
- Walton, T.L.; Bruno, R.O. Longshore transport at a detached breakwater, phase II. J. Coast. Res. 1989, 5, 679–691. [Google Scholar]
- Patch, K.; Griggs, G.B. Development of Sand Budgets for California’s Major Littoral Cells Eureka, Santa Cruz, Southern Monterey Bay, Santa Barbara, Santa Monica (including Zuma), San Pedro, Laguna, Oceanside, Mission Bay, and Silver Strand Littoral Cells; Institute of Marine Sciences, Department of Boating and Waterways California Coastal Sediment Management Work Group: Santa Cruz, CA, USA, 2007.
- Li., H.; Lin, L.; Lu, C.; Shak, A. Evaluation of breakwaters and sedimentation at dana point harbor, CA. In Proceedings of the Coastal Sediments ’11, Miami, FL, USA, 2–6 May 2011. [Google Scholar]
- Hoyt, W.H. Processes of Sedimentation and Geologic History of the Cape Henlopen/Breakwater Harbor Area, Delaware. 1983. Available online: https://elibrary.ru/item.asp?id=7363849 (accessed on 30 October 2020).
- Pratt, J.C. Cape Henlopen Spit Complex and Recent Evolution of Breakwater Harbor, Lewes, Delaware; M.S.; University of Delaware: Newark, Delaware, 2007. [Google Scholar]
- Demarest, J. The Shoaling of Breakwater Harbor, Cape Henlopen Area, Delaware Bay, 1842 to 1971; Sea Grant Report, Delaware SeaGrant Report DEL-SG-1-78; Delaware SeaGrant: Newark, DE, USA, 1978.
- Schwab, W.C.; Baldwin, W.E.; Hapke, C.J.; Lentz, E.E.; Gayes, P.T.; Denny, J.F.; List, J.H.; Warner, J.C. Geologic evidence for onshore sediment transport from the inner continental shelf: Fire Island, New York. J. Coast. Res. 2013, 29, 526–544. [Google Scholar] [CrossRef]
- Niedoroda, A.W.; Swift, D.J.P. Maintenance of the shoreface by wave orbital currents and mean flow: Observations from the Long Island Coast. Geophys. Res. Lett. 1981, 8, 337–340. [Google Scholar] [CrossRef]
- Klinger, J.P. Sedimentary environments and processes on the Charlestown-Green Hill Barrier/Headland shoreface and Misquamicut Barrier/Headland shoreface, south coast of Rhode Island: M.S.; University of Rhode Island: Kingston, RI, USA, 1996. [Google Scholar]
- Birkemeir, W.A. Field data on seaward limit of profile change. J. Waterw. Port Coast. Ocean Eng. 1985, 111, 598–602. [Google Scholar] [CrossRef]
- Brutsche, K.E.; Rosati, J., III; Pollack, C.E.; McFall, B.C. Calculating Depth of Closure Using WIS Hindcast Data; U.S. Army Engineer Research and Development Center, Coastal and Hydraulics Laboratory; U.S. Army Corps of Engineers: Washington, DC, USA, 2016.
- Hallermeier, R.J. A profile zonation for seasonal sand beaches from wave climate. Coast. Eng. 1981, 4, 253–277. [Google Scholar] [CrossRef]
- Tait, J.F.; Ferrand, E.A. Chapter 6—Observations of the Influence of Regional Beach Dynamics on the Impacts of Storm Waves on the Connecticut Coast During Hurricanes Irene and Sandy. In Learning from the Impacts of Superstorm Sandy; Bennington, J.B., Farmer, E.C., Eds.; Academic Press: Boston, MA, USA, 2015; pp. 69–88. [Google Scholar] [CrossRef]


| Method | Time Period | Total Volume (m3) of HoR | Annualized Deposition Rate (m3·year−1) |
|---|---|---|---|
| Seismic Survey | 1891–2016 | 3.1 × 10⁶ | 2.5 × 10⁴ |
| Bathymetric Changes | 1904–2009 | 2.9 × 10⁶ | 2.8 × 10⁴ |
| Bathymetric Changes | 1913–2009 | 2.2 × 10⁶ | 2.3 × 10⁴ |
| Core | Core Type | Latitude | Longitude | Water Depth (m) | Core Length (m) | Interpolated Thickness (m) |
|---|---|---|---|---|---|---|
| HoR 5-1 | VC | 41.36955 | −71.50963 | 5.2 | 0.5 | 1.8 |
| HoR 5-2 | VC | 41.36955 | −71.50963 | 5.2 | 0.5 | 1.8 |
| HoR 4-1 | VC | 41.36752 | −71.50090 | 5.0 | 0.0 | 1.3 |
| HoR 4-2 | VC | 41.36752 | −71.50090 | 5.0 | 0.0 | 1.3 |
| HoR 4-3 | VC | 41.36745 | −71.50090 | 5.5 | 0.1 | 1.3 |
| HoR 2-1 | VC | 41.36407 | −71.50153 | 6.7 | 0.6 | 1.4 |
| HoR 1-1 | VC | 41.36095 | −71.50460 | 7.6 | 1.8 | 2.5 |
| HoR 3-1 | VC | 41.35615 | −71.50785 | 5.8 | 0.0 | 0.9 |
| HoR 3-2 | VC | 41.35615 | −71.50785 | 5.8 | 0.3 | 0.9 |
| HoR 3-3 | VC | 41.35620 | −71.50785 | 6.4 | 0.6 | 1.0 |
| HoR 3-4 | VC | 41.35620 | −71.50737 | 6.4 | 1.4 | 1.5 |
| HoR 1B | P | 41.36095 | −71.50460 | 7.7 | 1.2 | 2.4 |
| HoR 3B | P | 41.35620 | −71.50740 | 5.8 | 1.1 | 1.4 |
| Depositional Sink | Total Volume (m3) | Percent Sand | Sand Volume (m3) | Source |
|---|---|---|---|---|
| Central basin | 2.3 × 10⁶ | * 50% | 1.2 × 10⁶ | Seismic/bathymetry |
| Ebb-tidal delta | 7.5 × 10⁵ | >90% | 6.8 × 10⁵ | Seismic/bathymetry |
| Flood-tidal delta | 1.4 × 10⁶ | >90% | 1.3 × 10⁶ | Boothroyd et al., 1985 |
| Eastern breakwater | 1.0 × 10⁵ | >90% | 0.9 × 10⁵ | Estimated from bathymetry |
| Center axis | 4.0 × 10⁵ | >90% | 3.6× 10⁵ | Estimated from bathymetry |
| Total Volume | 5.0 × 10⁶ | 3.6 × 10⁶ | ||
| Annualized Rate | 4 × 10⁴ m3·year−1 | 2.9 × 10⁴ m3·year−1 |
Publisher’s Note: MDPI stays neutral with regard to jurisdictional claims in published maps and institutional affiliations. |
© 2020 by the authors. Licensee MDPI, Basel, Switzerland. This article is an open access article distributed under the terms and conditions of the Creative Commons Attribution (CC BY) license (http://creativecommons.org/licenses/by/4.0/).
Share and Cite
Oakley, B.A.; Murphy, C.J.; Lee, K.K.; Hollis, R.J.; Caccioppoli, B.; King, J.W. Sediment Deposition Following Construction of a Breakwater Harbor: Point Judith Harbor of Refuge, Rhode Island, USA. J. Mar. Sci. Eng. 2020, 8, 863. https://doi.org/10.3390/jmse8110863
Oakley BA, Murphy CJ, Lee KK, Hollis RJ, Caccioppoli B, King JW. Sediment Deposition Following Construction of a Breakwater Harbor: Point Judith Harbor of Refuge, Rhode Island, USA. Journal of Marine Science and Engineering. 2020; 8(11):863. https://doi.org/10.3390/jmse8110863
Chicago/Turabian StyleOakley, Bryan A., Cody J. Murphy, Kym K. Lee, Robert J. Hollis, Brian Caccioppoli, and John W. King. 2020. "Sediment Deposition Following Construction of a Breakwater Harbor: Point Judith Harbor of Refuge, Rhode Island, USA" Journal of Marine Science and Engineering 8, no. 11: 863. https://doi.org/10.3390/jmse8110863
APA StyleOakley, B. A., Murphy, C. J., Lee, K. K., Hollis, R. J., Caccioppoli, B., & King, J. W. (2020). Sediment Deposition Following Construction of a Breakwater Harbor: Point Judith Harbor of Refuge, Rhode Island, USA. Journal of Marine Science and Engineering, 8(11), 863. https://doi.org/10.3390/jmse8110863