Abstract
Nowadays many countries plan to increase the percentages of renewable energies by developing offshore wind power. Due to the large sizes of offshore foundations, such as spudcan footings of jack-up barges or pile anchors of wind turbines, the affected soil depth range caused by the foundation under loading can be relatively deep, so the affected range may include a single thick layer or stratified soils. This paper utilizes limit analysis and FLAC numerical simulation to investigate the bearing capacity of a footing on single thick stratum or two-layered cohesive soils. Under nature deposition condition, the undrained shear strength of most cohesive soil approximately increases linearly as the depth increases. The closed-form upper bound solutions of fully rough or fully smooth footings on thick cohesive soils are provided, for the purpose of fast evaluations in practical engineering, and the outcomes are within the results from the FLAC simulation and slip circle method. The problems of punch-through shear failure or soil squeezing could be critical for two-layered soils under some conditions, and the associated bearing factors and the failure mechanisms from different methods are demonstrated and discussed in the article.
1. Introduction
The ultimate bearing capacity of strip foundations on a homogeneous and isotropic soil layer is generally estimated by using Terzaghi’s [1] expression. The exact solution of the bearing capacity factor, , for perfectly rough surface footing resting on homogeneous and isotropic undrained cohesive soils is proposed by Prandtl [2] and for perfectly smooth footing is estimated by Hill [3]. However, in reality, the undrained shear strength profile of cohesive soils usually does not satisfy the homogeneous and isotropic conditions. Under nature deposition conditions, the strength profile of cohesive soils might vary with depth. For example, the self-weight of the soil causes a decrease in void ratio with depth, and this decrease often causes an approximately linear increase in strength with depth, particularly in normally-consolidated clays (Figure 1) [4,5].
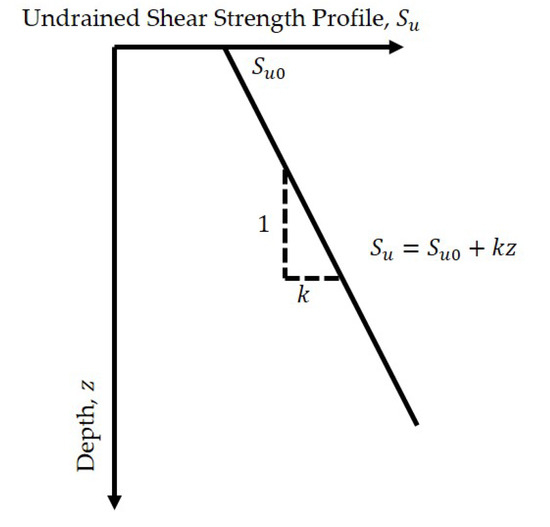
Figure 1.
Soil profile of the strength increasing with depth linearly.
There are several on-going offshore wind farm constructions in Taiwan Strait. The in-situ soil conditions of Taiwan offshore wind farm locations are complicated, and it is common that the affected soil depth range caused by the foundation contains different soil types strata, such as clay, silt or sand layers. Because the silty soils exhibit the undrained behavior during shear, they could be regarded as cohesive soils in the analysis of foundation bearing capacity [6]. Brown and Meyerhof [7], Merifield et al. [8], and SNAME [9] indicate that there are at least three basically different foundation failure mechanisms that should be considered in layered cohesive soils: (I) General shear failure occurs if the soil strengths of the following layers do not vary significantly; (II) Squeezing should be considered if the footing is placed on a soft cohesive soil layer overlying a strong layer; (III) Punch-through failure must be of particular note if the footing is placed on a strong layer that overlies a weak layer.
To estimate the ultimate bearing capacity of strip footings resting on non-homogeneous cohesive soils, Reddy and Srinivasan [10], Brown and Meyerhof [7], Davis and Booker [11], Chen [12], and Merifield et al. [8] developed different analysis models and methods. Davis and Booker [11] provided the exact solutions of bearing capacity of foundations on cohesive soils with the undrained shear strength increasing with the depth (Figure 1) based on the method of characteristics. Brown and Meyerhof [7] proposed semi-empirical bearing capacity factors for layered clay by conducting a series of model tests. Merifield et al. [8] applied numerical limit analysis to evaluate the bearing capacity for layered clay and Reddy and Srinivasan [10] and Chen [12] calculated upper bound solutions assuming a simple circular failure surface (Figure 2).
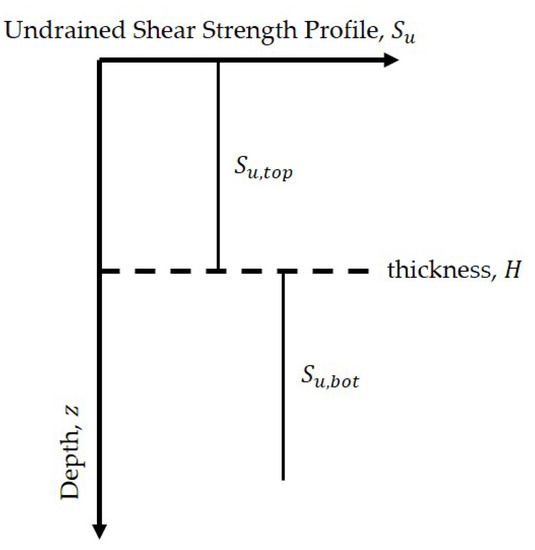
Figure 2.
Two-layered cohesive soil strength profile.
The plastic collapse load of the foundations can be solved by the upper bound method or the lower bound method, and the upper bound method is much easier to apply than the lower bound method and widely used. To study the ultimate bearing capacity of a strip footing on the surface of a cohesive soil with strength increasing with depth and stratified cohesive soils, this paper applies the upper bound method and FLAC numerical simulation. The geometric (top layer thickness H and footing width B) and soil strength (top layer undrained shear strength and bottom layer undrained shear strength ) parameters used in FLAC analysis cover most of the possible ranges. Brown and Meyerhof [7], Meyerhof and Hanna [13], and Merifield et al. [8] indicate the bearing capacity of a foundation on two-layered cohesive soils is the function of the normalized layer thickness () and strength ratio (). Furthermore, the bearing capacity is not affected by subsequent layers for a weaker layer overlying a stronger layer system () when , or stronger layer overlying softer layer system () when according to the laboratory testing study by Brown and Meyerhof [7]. In summary, the properties applied in FLAC numerical simulation, and , cover most problems of practical interest.
2. Background
Reddy and Srinivasan [10] and Chen [12] employed the slip circle method (Figure 3) to compute the ultimate bearing capacity () of a strip footing on two-layered cohesive soils by Equation (1)
where B is width of foundation, r is the radius of the slip circle, is an angle, n is the relative strength and could be given by
and could be expressed as
where H is the distance from the bottom of the footing to the interface of the two cohesive soil layers.
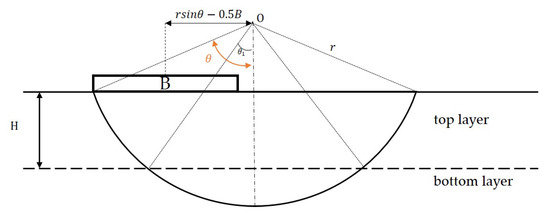
Figure 3.
Sketch of failure surface of two-layered slip circle method (modified from [10]).
For a least upper bound value of Equation (1) corresponding to the circle, the following conditions must be satisfied
The bearing capacity factors, , of layered cohesive soils could be computed by Equations (1) and (4), and the values of with various normalized layered thicknesses () and the relative strength (n) are given in Figure 4a. It can be seen from this figure that if remains a constant value, the value of increases as the relative strength (n) increases until reaching a critical relative strength (). For example, the critical relative strength is 0.07 for and the value would be a plateau value after . On the other hand, the critical relative strength decreases as increases. When is 0.66, the critical relative strength is 0.0 or and the plateau value of is 5.52. It can be inferred that the bearing capacity would not be affected by the subsequent layer after . Additionally, the value of for the side should be less or equal to 5.52, the bearing factor of the foundation on the top stronger layer, and it decreases to 5.52 for the side once the normalized layered thickness is greater than 0.66. Therefore, all the curves in Figure 4a should be bounded and the corrected results are shown in Figure 4b. It can be further seen in this figure that the foundation failure mechanism changes with varying n value. For instance, as n value increases for , it could be inferred that the foundation failure mode transfers from punch-through shear failure, general shear failure, to squeezing while the value of reaches the plateau value (7.97).
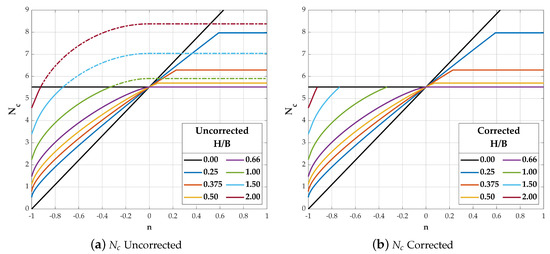
Figure 4.
Bearing capacity factor of various relative strength and normalized layered thickness for strip footings.
Considering only single cohesive stratum with undrained shear strength varying linearly with depth (Figure 1) can be given by
the expression for is shown as the following equation
where is the soil strength at the surface, and k is the rate of increase in undrained strength with depth.
3. Numerical Verification and Comparison to Traditional Limit Analysis
This paper applies the upper bound method and FLAC numerical simulation to analyze the ultimate bearing capacity of a rigid strip footing resting on: (I) a cohesive soil layer with increasing undrained shear strength with depth; (II) two-layered cohesive soil profiles. In the FLAC simulation, a constant downward velocity applied on the footing and the foundation-soil-interface being perfectly rough or smooth are imposed. Reddy and Srinivasan [10], Chen [12], and Merifield et al. [8] considered the undrained bearing capacity of a rigid surface footing and the Poisson’s ratio () of undrained behavior of cohesive soils approaches 0.5 [14]. Therefore, the value is imposed in FLAC to avoid Bulk Modulus of Elasticity (K) approaching infinity. Finally, the Mohr–Coulomb Yield Criteria with plane-strain conditions are applied in the upper bound method and FLAC simulation.
3.1. A Strip Footing on the Surface of a Clay Layer with Increasing Strength with Depth
3.1.1. Slip Circle Method
When the soil strength gradient , the condition represents a homogeneous case and the geometric solutions are
and the associated bearing factor
The results (5.52) obtained in this study are slightly lower than that (5.53) from Chen [12] and Merifield et al. [8]. Figure 5 illustrates the slip circle surfaces and associated centers of various non-homogeneity factors. It can be seen from this figure that if the value of non-homogeneity factor () increases, the zone of the soil failure surface shrinks to the foundation and the shrinkage would become more gentle and denser. Furthermore, the center of soil slip arc locates exactly above the edge of the footing for the homogeneous case (). As the value of non-homogeneity factor () increases, the center of soil slip arc gradually approaches the centric axis of the footing and associates the value increases rapidly. Obviously, the center of soil slip circle has a vertical asymptote with value increasing, and the satisfied the following equation leads to the denominator of Equation (6) approaching zero and the corresponding value approaching infinity.
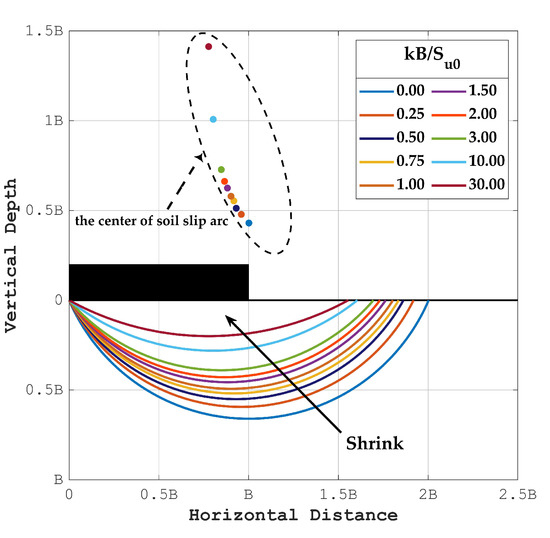
Figure 5.
Slip circle surfaces and associated centers of various non-homogeneity factors.
3.1.2. New Upper Bound Plasticity Solutions
Davis and Booker [11] employed slip line analysis to obtain the exact solutions of bearing factors of footings, including fully rough and fully smooth conditions, on cohesive soil with the undrained shear strength increasing with the depth. The studies indicated the bearing factor curves increase rapidly for low non-homogeneity factor but slowly after . Both the velocity and stress fields vary with the non-homogeneity factor, so considerable complicated numerical calculations are expected. It could be inferred that the failure mechanisms of the foundation on the small non-homogeneity cohesive soils are close to that on homogeneous soils; therefore, the formula upper bound solutions are helpful for the purpose of fast evaluations in practical engineering since the non-homogeneity factor of most soils is limited.
Figure 6 and Figure 7 illustrate the velocity fields for a fully rough footing and a fully smooth footing, respectively, on homogeneous cohesive soils. However, the linearly increasing undrained shear strength profile is employed in the upper bound solution calculations. The external work done by normal force F equates the total internal energy dissipation:
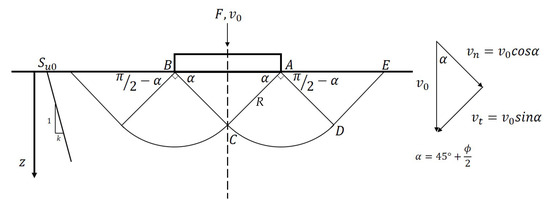
Figure 6.
Velocity field with a radial zone for a perfectly rough footing on homogeneous cohesive soil [2].
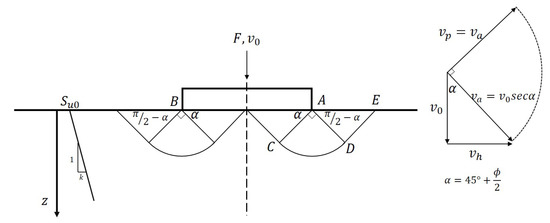
Figure 7.
Velocity field with a radial zone for a perfectly smooth footing on homogeneous cohesive soil [3].
The energy dissipation along line and line are
along arc is
The energy dissipation in zone is calculated as
Therefore, the bearing factor of the rough footing can be expressed as
Referring to the mechanism and velocity diagram given in Figure 7, the expression of the bearing factor for a smooth punch is
3.1.3. FLAC Simulation Results
A constant downward velocity is imposed on the foundation and the following equation is used to calculate the soil reaction forces at footing grid points in FLAC analysis [15]:
where is the reaction force in the vertical direction at footing joint i. Figure 8 demonstrates that the Prandtl mechanism and the FLAC numerical determined velocity field are similar in the case which is a perfectly rough footing on homogeneous cohesive material under collapse load. Furthermore, with the circular mechanism it is assumed that the circular failure surface of the plastic collapse load slides or rotates, and the result estimated by circular mechanism is also given in Figure 8 for reference. On the other hand, Hill-type failure mechanism is utilized to estimate the bearing capacity of perfectly smooth footing. Figure 9 illustrates the velocity field of a cohesive soil with non-homogeneity factor 1.6 from FLAC simulation, and the range of the field is slightly smaller than that of the homogeneous Hill mechanism. It is obvious that the roughness of foundation affects the failure mechanism according to the results of numerical simulation.
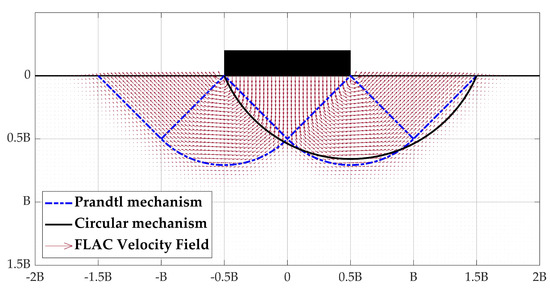
Figure 8.
Perfectly rough footing velocity field at the numerical limit load ().
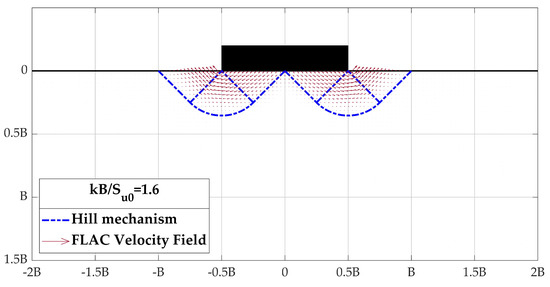
Figure 9.
Perfectly smooth footing velocity field at the numerical limit load ().
The value of of both fully rough and fully smooth footing on cohesive soils with the undrained shear strength increasing with the depth increases as the non-homogeneity factor () value raising (Figure 10); furthermore, the results of all methods have the same trend. Consider the perfectly rough footing case, Figure 10a, it shows: (I) when , the bearing factors obtained from Equation (17) or Davis and Booker [11] are equal to the Prandtl’s solution, , and the FLAC numerical solution, , is approximately 0.6% higher than the exact solution; (II) the values estimated by circular mechanism are the highest, for , in all analysis methods used in this study, but the upper bound solutions are getting closer to the slip circle solutions as non-homogeneity factor () value rises; (III) the FLAC numerical simulation results indicate that the bearing factor () has a similar trend to Davis and Booker [11] solutions, and both of them show that the value increases rapidly for a lower non-homogeneity factor. Similar phenomena for the fully smooth footing are shown in Figure 10b. For homogeneous material, the bearing factors obtained from Equation (18) or Davis and bnnmjnm Booker [11] are equal to the Hill’s solution, , but the FLAC result () is about 0.8% below the exact solution. However, it seems the non-homogeneity factor () plays a less important role to the bearing factor for fully smooth footing, and the differences among FLAC, Davis and Booker, and the upper bound solution are smaller. The range of the non-homogeneity factor is not wide for most practical engineering; for instance, the seafloor cohesive soil strength of western Taiwan offshore wind farms is more than 10-kPa and the strength gradient is around 1 to 2 kPa/m, so the non-homogeneity factor is expected to be lower than 2 for most of the engineering cases. Since the actual roughness of a footing is between perfect rough and smooth, the upper bound solutions provide fast and reliable evaluations for foundation bearing capacity in practical engineering.
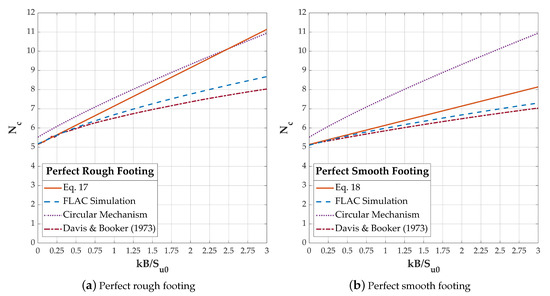
Figure 10.
Roughness effect to bearing capacity factor .
3.2. A Strip Footing on the Surface of Two-Layered Cohesive Soils
3.2.1. Slip Circle Method
- () and
Considering a foundation on two-layered cohesive soils, the bearing factor could be computed by Equations (1) and (4). The failure mechanism of the footing on a thick weaker top stratum of a two-layered system is similar to that on a single layer homogeneous () cohesive soil. Therefore, the expression of could be reduced from Equation (1) to
By using Equation (4), the minimum with associated geometric conditions can be obtained as
It could be inferred that the value should be a constant and would not vary with the thickness (H) of the upper thick layer. Nevertheless, the soil failure surfaces obtained by a slip circle mechanism (Figure 3) must go through the subsequent layer or be tangent to the strata line; hence, the geometric conditions in slip circle analysis of a footing on a thick weaker top soil should be bounded by the following restriction
The center of the slip circle of the homogeneous case is right above the edge of the footing as well as the bearing factor (Figure 11). When the normalized layer thickness () is large, , the failure surfaces are tangent to the strata line and the corresponding bearing factor values are overestimated (). Moreover, the center of the slip circle is gradually away from the edge of the foundation and approaching to the ground surface as the normalized layer thickness () is increasing. The bearing capacity results, from the evaluation by Equation (1), could be seriously overestimated for foundations on a thick weaker top layer, without the restriction of Equation (22).
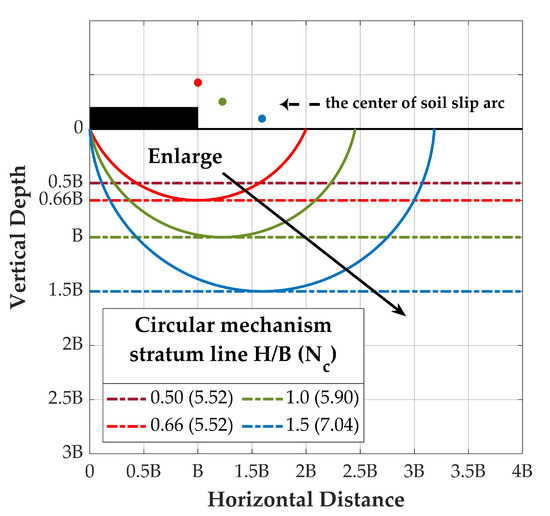
Figure 11.
Slip surfaces enlarge with the increasing for a thick upper layer.
- () and
Once the normalized layer thickness , the stronger bottom stratum soil strength may contribute to the entire foundation bearing capacity. The higher bearing factor is expected () because the failure surface passes through the stronger bottom stratum (Figure 12). It is obvious that the failure surface shrink as the relative strength increases and the center moves toward the central line of the footing. In addition, all centers are above the foundation for and it exists a minimum slip circle for each with associated maximum bearing factor, such as for in Figure 12. The required minimum relative strength is 0.23, , for and the bearing factor is not affected by the bottom stronger soil once . The soil failure surface is constrained in the top weaker soil layer and this is so-called soil squeeze. Figure 13 demonstrates the required relative strength of various for soil squeeze. As mentioned earlier, the depth of the slip circle for homogeneous soil () is about two thirds (0.66) of the foundation width, and the value of increases as decreases. It should be noted that the evaluation results of soil squeeze the bearing factor from the slip circle method for a smaller normalized layer thickness is higher than those from finite element analysis. The slip circle failure mechanism may not describe the actual soil squeezing phenomenon well once the is small.
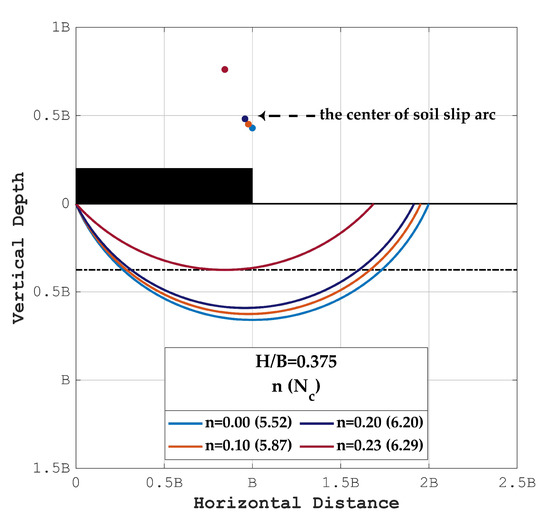
Figure 12.
Slip surfaces shrink with the increasing n for .
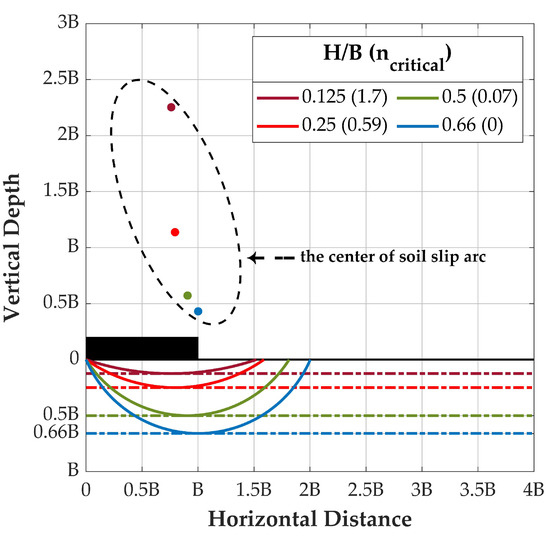
Figure 13.
Required relative strength of various for soil squeeze.
- ()
The slip circles tend to enlarge when the bottom stratum soil strength is lower than the top layer soil strength, as shown in Figure 14, but the corresponding bearing factor decreases with the circle size growing. It is obvious that the failures may cause catastrophic disasters because the bearing factor drops rapidly for small with a huge soil strength difference between the two layers (Figure 4). This is so-called punch-through shear failure and more likely to happen for jack-up barges since their jumbo foundation dimensions make the normalized layer thickness smaller. The ground surface is the horizontal asymptote and centers of slip circles move away from the edge of the footing with the soil strength difference of two layers increasing. Additionally, the spacing of adjacent centers becomes larger as the relative strength decreases.
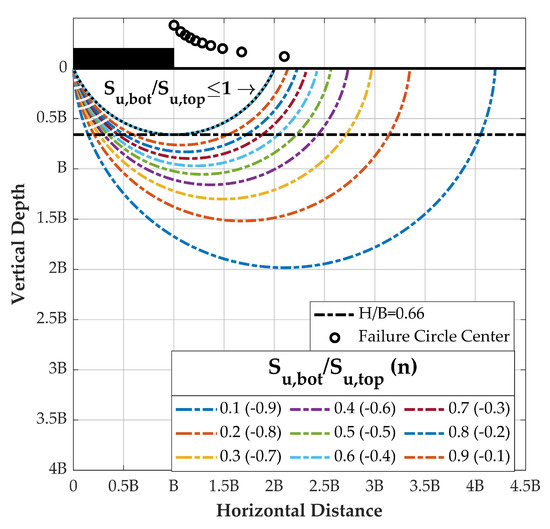
Figure 14.
Slip surfaces shrink with the increasing n for .
3.2.2. FLAC Simulation Results
Merifield et al. [8] apply Finite Element Method to compute the numerical upper bound and lower bound solutions to the undrained bearing capacity of a surface foundation on a two-layer clay deposit, and results are compared with those from the slip circle method and FLAC analysis in this study. The following are some important points imposed in FLAC simulation: (I) the foundation-soil-interface is fully rough and there is not any relative slide; (II) the foundation is applied a constant downward velocity; (III) the boundaries of a numerical model system are velocity or displacement boundary conditions; (IV) the Mohr–Coulomb Yield Criteria with plane-strain conditions are applied; (V) the associated flow rule is used. Additionally, the numerical simulation method applied in this article is close to the upper bound method, so the value of the bearing factor of a footing on homogeneous soil obtained from FLAC is , for example. The plastic collapse load of a foundation is associated with the type of the steady-state velocity field, based on the numerical simulation from FLAC.
Figure 15a–h show that the results of all methods have similar trends, which the bearing factor of a foundation on two-layered cohesive soils increases as the strength ratio () increases, and the corresponding failure mode transfers from punch-through shear failure to squeezing or general shear failure. Even though the strength ratio plays the primary role in the determination of the failure mode, its importance is less prominent for the larger normalized layer thickness () soil conditions. According to the FLAC simulations, the results could be generalized as: (I) , the bearing factor is independent with and maintains at the value around 5.17 (5.32 for Merifield FEM Upper Bound as reference). This is the case of a footing on homogeneous cohesive soils so the results are not affected by the normalized layer thickness; (II) , the soil squeezing is more likely to occur for a higher strength ratio for the same normalized layer thickness. The bearing factor increases () as the strength ratio increases until reaching a plateau value in which the associated failure surface is fully constrained in the upper softer stratum (soil squeezing shown in Figure 16). However, the bearing factor maintains at the minimum plateau value (5.17) for , and these results imply that the corresponding failure modes are general shear failure. It is worth noticing that the laboratory tests from Brown and Meyerhof [7] suggested the bearing factor of a strip footing sustains at for , and this recommendation coincides with the result mentioned above. Additionally, the range of the minimum plateau reaches to when the normalized layer thickness ; (III) , the punch-shear failure is more probable to occur and the bearing factor reduces () rapidly for smaller normalized layer thickness, such as . With the normalized layer thickness increasing, the range of the minimum plateau extends to this zone when , and the following bearing factor even diminishes slightly for . Therefore, it could be inferred that the full punch-through failure is unlikely to happen for high normalized layer thickness. Although the partial punch-through shear failure is between the general shear failure and the full punch-through shear failure [16], depending on the strength ratio and the normalized layer thickness, the features of this failure mode are not apparent from the variations of bearing factor figures.
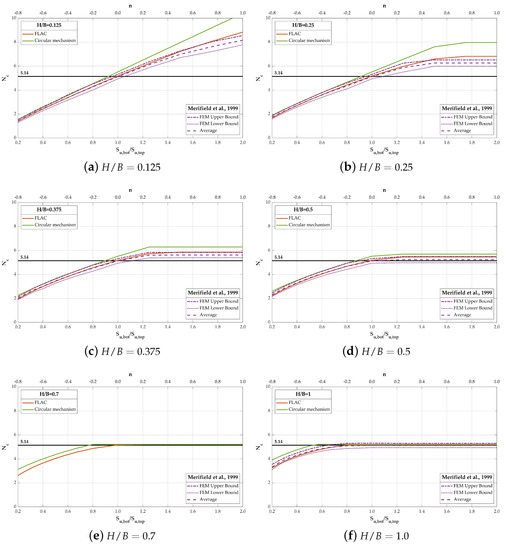
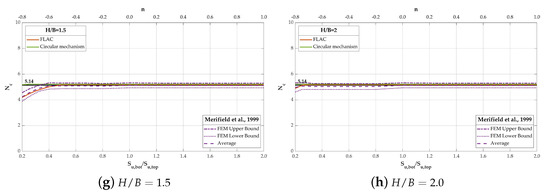
Figure 15.
Comparison of bearing factors from various methods.
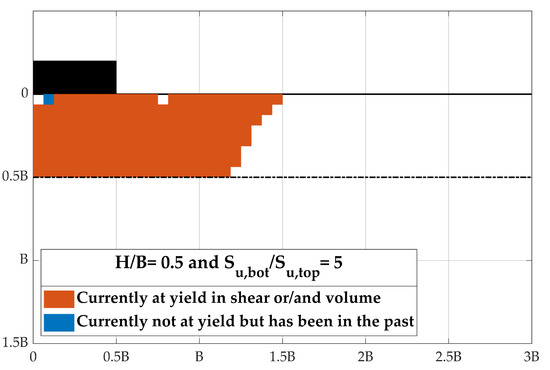
Figure 16.
Deflected mesh and zone of plastic yielding (, ).
4. Discussion
SNAME [9] proposed three different types of failure mechanisms, including general shear, squeezing, and punch-through, for a foundation rested on a two-layered cohesive soil profile. When a footing is placed on a cohesive layer with increasing strength with depth, the behavior of the soil under ultimate loading is similar to that on a softer stratum overlaying a stronger layer cohesive soil system (). According to the figures in previous sections, the trend of the rotation block shrinking due to the non-homogeneity factor () increasing is pretty close to the slip circle shrinking because of the strength ratio () raising.
The soil failure mechanism varies with the non-homogeneity factor and foundation roughness for a footing on a cohesive layer with increasing strength with depth, on the basis of numerical simulation results. It is expected that complicated math skills and numerical procedures are necessary to obtain the exact solutions for both fully rough and fully smooth footings, so the new upper bound plasticity closed-form solutions provide the fast “upper estimation” and “lower estimation” for foundation capacity calculation in practical engineering. The users could employ the closed-form solutions with their engineering judgements for specific problems. According to the geotechnical investigation data of western Taiwan offshore wind farms, most of the in-situ soil strength descriptions of seabed cohesive soils are very soft and soft. Additionally, Lunne et al. [17], Quirós and Little [18], Randolph [19], and Hossain and Randolph [20] suggested typical strengths at a seabed level of = 2–10 kPa and k in the range of 0–2 kPa/m. The results of proposed formula upper bound solutions, Equations (17) and (18), are within the calculations from other methods in most of the possible soil properties ranges, so they provide fast and reliable evaluations in practical engineering. Furthermore, in reality, the foundation-soil-interface is neither fully rough nor fully smooth. The actual bearing capacity factor falls in the region bracketed by these two extreme interface cases. Prandtl [2], Hill [3], Davis and Booker [11], and Chen [12] indicated that the effect of footing roughness has no influence on the estimated bearing capacity of a footing on isotropic and homogeneous cohesive soil, but the soil failure surfaces shrink as the non-homogeneity factor () increases. Figure 17 shows the maximum shear strain rate at the numerical collapse loading corresponding to the different soil-foundation interface roughness. By comparing Figure 17a,b, it could be seen that the shape of the shear failure plane of perfectly smooth footing is more relatively flat and the zone of soil shear failure of the fully rough footing is larger than the other one.
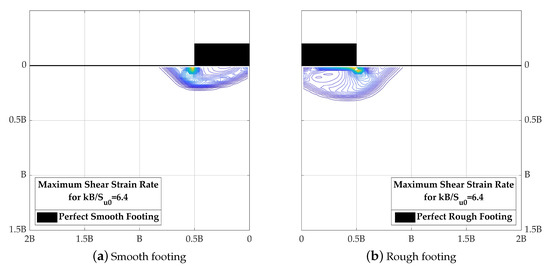
Figure 17.
Maximum shear strain rate at the numerical limit load ().
The bearing capacity of the foundation placed on two-layered cohesive soil profiles is affected by the normalized layer thickness and the strength ratio, and , and the associated foundation failure mechanism also varies with the those parameters. The failure surface in the slip circle method is assumed to be an arc but it may not be able to represent the actual failure mechanism well, especially for the case of top layer soil strength much greater than bottom stratum soil strength. Figure 18 and Figure 19 illustrate the soil shear strain rate for and , respectively, but the soil plastic flow in the latter figure behaves differently from what the slip circle does. The failure planes in the top soil layer extend downward vertically from the footing base to the strata interface, and then the pattern of soil plastic flow in the bottom layer is similar to the failure mechanism of shallow foundation. Actually, this simulation result is very close to the theoretical model proposed by Meyerhof [21] for the punch-through shear failure of a foundation on two-layered soil. Furthermore, the effect of footing roughness is considered and the results are also presented in these figures. By comparing Figure 18 and Figure 19, it could be seen that the effect of footing roughness is less significant for the footing on a stronger top stratum of two-layered system condition () because the maximum shear strain rate patterns of both footing conditions are pretty similar.
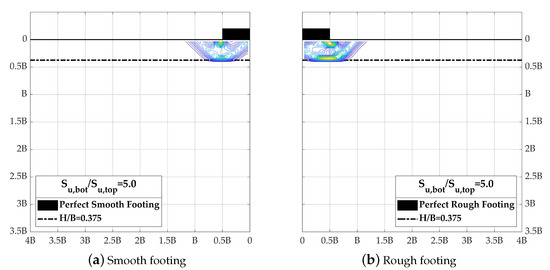
Figure 18.
Maximum shear strain rate at the numerical limit load (, ).
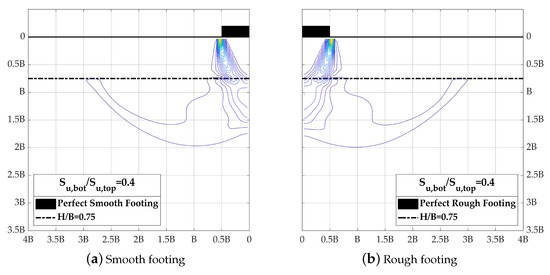
Figure 19.
Maximum shear strain rate at the numerical limit load (, ).
5. Conclusions
Estimating the ultimate bearing capacity of a foundation on non-homogeneous soil is one of the critical issues in geotechnical engineering. The bearing factor and associated failure mechanism vary with the soil and foundation conditions, such as non-homogeneity factors, normalized layer thickness, and the soil-footing interface roughness. This article discusses the foundation failure mechanism and the bearing capacity factor of a foundation on the surface of a non-homogeneous soil layer (Figure 1), and a two-layered cohesive soil profile (Figure 2). Based on the analysis of the upper bound methods and FLAC numerical simulation, the results and highlights of the foundation on the surface of a cohesive soil with increasing strength with depth, Figure 1, are as follows:
- The bearing factor of a footing on homogeneous soil, , obtained by the slip circle method in this article is slightly lower than that, , from Chen [12] and Merifield et al. [8]. As the non-homogeneity factor () increases, the zone of the soil failure surface shrinks to the foundation and the shrinkage would become more gentle and denser. Furthermore, the center of the soil slip arc locates exactly above the edge of the footing for the homogeneous case ().
- The results of proposed formula upper bound solutions, Equations (17) and (18), are within the calculations from other methods in most of the possible soil properties ranges, so they provide fast and reliable evaluations in practical engineering. Furthermore, in reality, the foundation-soil-interface is neither fully rough nor fully smooth. The actual bearing capacity factor falls in the region bracketed by these two extreme interface cases.
- Consider the homogenous material case, the bearing factors computed from FLAC simulation are and for fully rough and smooth footing, respectively, and both values are close to the exact solutions of two footing types. Furthermore, the Prandtl mechanism and the FLAC numerical determined velocity field are similar in the case which is a perfectly rough footing on homogeneous cohesive material under collapse load. On the other hand, Hill-type failure mechanism is utilized to estimate the bearing capacity of perfectly smooth footing. It is obvious that the roughness of foundation affects the failure mechanism according to the results of numerical simulation.
The plastic collapse load of a strip footing resting on a two-layered cohesive soil profile (Figure 2) has been investigated and the following conclusions can be drawn from the results of the slip circle method and FLAC numerical simulation:
- Based on the circular mechanism, the center of the slip circle of homogeneous case is right above the edge of the foundation as well as the bearing factor . However, when the normalized layer thickness () is large, , the failure surfaces are tangent to the strata line and the corresponding bearing factor value would be overestimated (). Therefore, the geometric conditions in slip circle analysis of a footing on a thick weaker top soil should be bounded by the restriction condition, .
- Consider the footing on a thin weaker top stratum of two-layered system condition ( or ), the stronger bottom stratum soil strength may contribute to the entire foundation bearing capacity. The soil squeezing is more likely to occur for higher strength ratio for the same normalized layer thickness. The bearing factor increases ( and ) as the strength ratio increases until reaching a plateau value in which the associated slip circular failure surface or the soil plastic flow zone is fully constrained in the upper softer stratum. However, the bearing factor maintains at the minimum plateau value (5.17) for , and these results imply that the corresponding failure modes are general shear failure. It is worth noting that the laboratory tests from Brown and Meyerhof [7] suggested the bearing factor of a strip footing sustains at for , and this recommendation coincides with the result mentioned above.
- While the foundation is placed on a strong layer overlying a weak layer ( or ), a rapid reduction in bearing capacity ( or ) might occur for small normalized layer thickness. Additionally, the slip circular failure surface or the soil plastic flow zone tends to enlarge for decreasing relative strength or strength ratio, and hence affected soil ranges extend to deeper depths of the weaker bottom deposit. With the normalized layer thickness increasing, the range of the minimum plateau () extends to side when , and the bearing factor even diminishes slightly as the strength ratio increases for . Therefore, it could be inferred that the full punch-through failure is unlikely to happen for high normalized layer thickness. Although the partial punch-through shear failure is between the general shear failure and the full punch-through shear failure [16], depending on the strength ratio and the normalized layer thickness, the features of this failure mode is not apparent from the variations of bearing factor figures.
Author Contributions
C.-M.C. conceived the study; C.-M.C. and Z.-S.L. carried out the bearing capacity curves analysis; C.-M.C. supervised the study and edited the manuscript, and is the principal investigator of project “The Ultimate Bearing Capacity Evaluation of Spread Foundations in Layered Soils of Jack-Up Barges (Project No. MOST 108-2218-E-035-016-MY2)”. All authors have read and agreed to the published version of the manuscript.
Funding
This research was funded by the Ministry of Science and Technology (MOST) of Taiwan, grant number “MOST 108-2218-E-035-016-MY2”.
Acknowledgments
This research presented here was supported by the grants “The Ultimate Bearing Capacity Evaluation of Spread Foundations in Layered Soils of Jack-Up Barges (Project No. MOST 108-2218-E-035-016-MY2)”, the Ministry of Science and Technology of Taiwan.
Conflicts of Interest
The authors declare no conflict of interest.
References
- Terzaghi, K. Theoretical Soil Mechanics; OCLC: 802546718; John Wiley and Sons: New York, NY, USA, 1943. [Google Scholar]
- Prandtl, L. Hauptaufsätze: Über die Eindringungsfestigkeit (Härte) plastischer Baustoffe und die Festigkeit von Schneiden. ZAMM J. Appl. Math. Mech./Z. Für Angew. Math. Mech. 1921, 1, 15–20. [Google Scholar] [CrossRef]
- Hill, R. The Mathematical Theory of Plastic; Clarendon Press: Oxford, UK, 1950. [Google Scholar]
- Skempton, A.W. A study of the geotechnical properties of some post-glacial clays. Géotechnique 1948, 1, 1–16. [Google Scholar] [CrossRef]
- Raymond, G.P. The bearing capacity of large footings and embankments on clays. Géotechnique 1967, 17, 1–10. [Google Scholar] [CrossRef]
- Chi, C.M.; Lin, Z.S. The footing size effect on punch-through bearing capacity assessment of jack-up barges in western Taiwan offshore layered soil. In Proceedings of the 30th International Ocean and Polar Engineering Conference, Shanghai, China, 11–16 October 2020; The International Society of Offshore and Polar Engineers: Shanghai, China, 2020. [Google Scholar]
- Brown, J.; Meyerhof, G.G. Experimental study of bearing capacity in layered clays. In Proceedings of the 7th International Conference on Soil Mechanics and Foundation Engineering, Mexico City, Mexico, 25–29 August 1969; International Society for Soil Mechanics and Geotechnical Engineering: Mexico City, Mexico, 1969; Volume 2, pp. 45–51. [Google Scholar]
- Merifield, R.S.; Sloan, S.W.; Yu, H.S. Rigorous plasticity solutions for the bearing capacity of two-layered clays. Géotechnique 1999, 49, 471–490. [Google Scholar] [CrossRef]
- SNAME. Guidelines for Site Specific Assessment of Mobile Jack-Up Units; Technical Report; Technical and Research Bulletin 5-5A; The Society of Naval Architects and Marine Engineers: Jersey City, NJ, USA, 2008. [Google Scholar]
- Reddy, A.S.; Srinivasan, R.J. Bearing capacity of footings on layered clays. J. Soil Mech. Found. Div. 1967, 93, 83–99. [Google Scholar]
- Davis, E.H.; Booker, J.R. The effect of increasing strength with depth on the bearing capacity of clays. Géotechnique 1973, 23, 551–563. [Google Scholar] [CrossRef]
- Chen, W.F. Limit Analysis and Soil Plasticity; Number v. 7 in Developments in Geotechnical Engineering; Elsevier Scientific Pub. Co.: Amsterdam, The Netherlands; New York, NY, USA, 1975. [Google Scholar]
- Meyerhof, G.G.; Hanna, A.M. Ultimate bearing capacity of foundations on layered soils under inclined load. Can. Geotech. J. 1978, 15, 565–572. [Google Scholar] [CrossRef]
- Lambe, T.W.; Whitman, R.V. Soil Mechanics; Series in Soil Engineering; Wiley: New York, NY, USA, 1969. [Google Scholar]
- FLAC—Fast Lagrangian Analysis of Continua, Ver. 8.0; Itasca Consulting Group, I: Minneapolis, MN, USA, 2016.
- Merifield, R.S.; Nguyen, V.Q. Two- and three-dimensional bearing-capacity solutions for footings on two-layered clays. Geomech. Geoeng. 2006, 1, 151–162. [Google Scholar] [CrossRef]
- Lunne, T.; Myrvoll, F.; Kjekstad, O. Observed settlements of five north sea gravity platforms. In Offshore Technology Conference; Offshore Technology Conference: Houston, TX, USA, 1981. [Google Scholar] [CrossRef]
- Quirós, G.; Little, R. Deepwater soil properties and their impact on the geotechnical program. In Offshore Technology Conference; Offshore Technology Conference: Houston, TX, USA, 2003. [Google Scholar] [CrossRef]
- Randolph, M. Characterisation of soft sediments for offshore applications. In Proceedings of the 2nd International Conference on Site Characterization, Porto, Portugal, 19–22 September 2004; Da Fonseca, A., Mayne, P., Eds.; Millpress Science: Porto, Portugal, 2004; Volume 1, pp. 209–232. [Google Scholar]
- Hossain, M.S.; Randolph, M.F. New mechanism-based design approach for spudcan foundations on single layer clay. J. Geotech. Geoenviron. Eng. 2009, 135, 1264–1274. [Google Scholar] [CrossRef]
- Meyerhof, G.G. Ultimate bearing capacity of footings on sand layer overlying clay. Can. Geotech. J. 1974, 11, 223–229. [Google Scholar] [CrossRef]
Publisher’s Note: MDPI stays neutral with regard to jurisdictional claims in published maps and institutional affiliations. |
© 2020 by the authors. Licensee MDPI, Basel, Switzerland. This article is an open access article distributed under the terms and conditions of the Creative Commons Attribution (CC BY) license (http://creativecommons.org/licenses/by/4.0/).