1. Introduction
Biofouling is the process of marine organism accumulation on immersed surfaces that begins immediately after immersion in the sea, which may result in various negative effects depending on the type of surface. Although very often, when discussing the problem of antifouling (AF) coatings, vessels are considered as immersed objects requiring protection, but all other immersed static objects are subject to biofouling—various floating rigs and plants, wind turbines, offshore oil rigs, gas plants and installations, ocean installations, etc. [
1]. Depending on the type of object, biofouling results in undesirable effects and accordingly various methods and means are applied with the aim of reducing the negative processes and biofouling effects which are considerable, including increased resistance, consumption, atmospheric emissions and possible harmful effects on handling systems for cargo and bunkering, and corrosion of immersed structures [
1].
The introduction of self-polishing copolymer (SPC) technology with the application of Tributyltin (TBT) was a turning point in the development of AF means, in which seawater reacts with the surface layer of the coating, causing biocide release. The release of TBT biocides is constant and uniform, allowing ships to sail for up to 60 months without repainting the hull [
2]. For this reason, until their ban, AF TBT coatings were used on about 70% of the world’s merchant fleet [
3]. Following the ban on the use of TBT compounds in 2008, various methods were tested to find an effective replacement, and currently the development of commercial AF coatings is based on two approaches: gradual biocide release coatings and non-biocide coatings.
Biocide-free coatings are usually based on silicone compounds, which, when applied to the plating, form a smooth and slippery surface, reducing surface energy, thus discouraging organisms from initial adhesion. Their disadvantages include resistance to physical wear and mechanical contact, higher price (being up to five times more expensive than AF biocide coatings), and the speed of 20 knots that is required for the coating to work. Claims by some producers that the coatings are effective at 8 knots have not been independently confirmed [
4]. At lower speeds, coatings are not effective, and therefore the types of commercial ships on which this type of AF coating can be applied are significantly limited.
In AF coatings with biocide release excluding TBT, the most common are copper−and zinc−based compounds, most often Cu
2O and ZnO [
3,
5,
6,
7,
8,
9], with three modes of biocide action: coatings with contact release of biocides (hard matrix coatings), Controlled Depletion Polymer soluble coatings (CDP) and SPC coatings. In all coatings, the aim is to achieve a controlled release of biocide molecules from the polymer matrix (so called binder), while the release mechanisms themselves differ. Although the coating release mechanisms have been elucidated and explained [
10,
11,
12], estimates of total AF biocide emissions from cargo vessels engaged on commercial ocean-going routes are still largely based on the researchers’ estimates.
The aim of this paper is to propose a new advanced numerical method for determining the wetted area of container ships in order to increase the estimation accuracy of total emission of copper biocides in container ships.
The choice of copper emission estimate is based on research showing that, since the ban of TBT, copper is the most important active compound of the AF coatings that are being used. At high concentrations, metals are toxic to microorganisms, which occurs through several processes, including the interchange of essential metals from their natural binding sites or through ligand interactions. Generally, it is considered that the site of action for copper is its plasma membrane, while the exposure of fungi to increased copper concentrations has been proven to lead to a decline in membrane integrity, resulting unavoidably in loss of cell viability [
13].
The harmful effects of the copper usage in AF coatings, although significantly less toxic, have been the subject of research, and therefore its application has been regulated in Europe [
14], specifying the application, production and marketing of products for use in biocides, including, among others, copper—based compounds [
15]. Some countries have independently limited the emissions of copper compounds from AF coatings in their coastal waters, or the application of AF coatings with copper biocides has been restricted to smaller recreational craft [
7,
16].
So far, the research has shown limitations in terms of determining two basic parameters: copper emissions from AF coatings per unit area (cm2), and the wetted area of a container ship. The findings of research on the specific emissions of biocides so far vary significantly and depend directly on the applied method.
The conducted evaluation of available copper emission studies of AF coatings contains the following initial limitations:
Emission data refer to the copper oxide compound, which is the most used copper compound in today’s AF coatings. Emissions of other copper compounds that act as booster biocides were not considered;
The evaluation is based on the results obtained by testing AF coating samples used for merchant ships, but not for recreational craft;
The estimation of the container ship wetted area was performed for a single container ship 193 m in length and a width of 32.2 m, with a maximum design draft of 10.56 m, and with the capacity of 1500–2000 TEU (Twenty-Foot Equivalent Unit) [
17].
By combining different ranges of draft, cb coefficients or displacements, the change of the wetted area is observed in correlation with the specifics related to the forms and corresponding relations between container ships’ dimensions.
2. Impact of Anti-Fouling Coatings on the Marine Environment
There are two key requirements for the development of AF biocide coatings is represented by two basic requirements: to have the most efficient AF properties for organisms that adhere to immersed structures, and simultaneously be safe for other marine organisms. Additional requirements include reduced bioaccumulation properties, increased release period over time, and favorable price/performance ratio [
10]. Although the compounds used as biocides are known and have their own industrial applications, it is quite complicated to assess the effects of their use in vessels. Part of the problem is related to the lack of scientifically based approaches to selecting the appropriate AF coating for a particular ship [
18]. Although the International Maritime Organization (IMO) has published guidelines for the appropriate selection of AF coatings (including docking period planning, vessel profile and speed, and legal requirements for the sale and application of AF coatings), so as to be able to fully select the appropriate coating, but very often, other parameters of sailing routes are not known in advance, e.g., the ratio of the time spent in navigation and at berth. The main problem is the lack of an appropriate method for estimating the life cycle of coatings [
18], while assessments are subject to various limitations and assumptions. Some of the parameters necessary for the selection of the best AF coatings are as follows:
Period until the next dry docking of the ship;
Vessel life span;
Biofouling impact assessment;
An increase in the vessel’s resistance with regard to the assessment of the biofouling extent;
Estimate of increased fuel consumption and price;
Estimate of AF coating losses during the application process;
Number of days spent at rest and in sailing.
These parameters are the subject to different assessments for each ship and for specific circumstances, while the choice of AF coating is usually determined in consultation with the coating manufacturers. However, each type of AF coating reaches its expected efficiency under the given optimal operating conditions. Deviation from those conditions (e.g., change of navigation route to areas with different biochemical characteristics in the sea, alteration of the ship’s operating speed, change of sailing/idle time ratio, etc.) changes the overall effect of AF coatings on the marine environment.
Biocide toxicity is considered in relation to the level of release from AF coatings, the concentration of biocide compounds in water, the effect on organisms that are not included in the biofouling process, and the process of accumulation in sediments [
19]. The release of biocides during hull cleaning is very important for the presence of AF biocides in the sea. In marinas, an additional source of biocide emissions is the passive release of biocides [
20] and the disproportionate practice (regarding the input from pressure hosing), and manual cleaning of the hulls of smaller vessels annually [
21]. The current world merchant fleet of 63,000 ships [
22] (over 500 GT, engaged in international trade) annually releases a minimum of 113,000 tons of biocides during hull cleaning alone, with an existing share of biocide coatings of approximately 90% [
15].
Presence of Copper in the Aquatic Environment
As the most important biocidal agent beside organotin [
23], cooper is a naturally occurring chemical element in the aquatic environment, present in most marine organisms and anthropogenic structures Anthropogenic sources include emissions of copper from chemicals used in agriculture and industry, emissions from sewage, industrial activities, refining, etc. The presence and reactions of copper differ in ocean and freshwater environments. Copper concentration values in the seas vary from less than 1 μg/L do 3000 μg/L. Copper concentration values in ocean areas vary from 0.1 μg/L to a maximum of 3.9 μg/L, with an average value of 0.8 μg/L [
24]. The increase in copper concentration can be caused by natural ecosystem processes such as geothermal and eolithic processes, or by anthropogenic activity such as waste disposal, airborne particles emissions, PO paint emissions, or water inflow emissions. Although copper also occurs in the elemental form [
25], most copper occurs in the hydrosphere in several chemical and physical forms including insoluble particles, soluble organic and inorganic particles, and in various oxidative states of copper ions, in which mutual availability of copper forms determine their availability and thus their toxic potential [
24]. Although the exchange of copper compounds is crucial for catalytic and structural metabolic processes [
25], an excessive concentration of copper has a lethal effect. The amount, distribution and form of copper ions [
24] are crucial to the effect of copper in aquatic biota. In the aquatic environment, copper occurs in the form of oxidative ions Cu
0, Cu
+, Cu
2+ and Cu
3+, with the most common and most important form of Cu
2 [
24,
25]. Most Cu ions form less active compounds such as Cu(OH)
2(s) and CuCO
3(s), which are considered to be less harmful to the marine environment [
26]. The greatest influence on the dissolution of Cu
2O from the pigment of AF coatings in seawater is exerted by
and
ions, which react with Cu
2O particles in the dissolution process shown in Formulas (1) and (2):
The reaction shown in (1) is reversible, but also possesses a kinetic constraint, while the process in (2) takes place instantaneously and reversibly. In the presence of dissolved oxygen, monovalent copper within the release layer of the AF coating rapidly oxidizes to its biocide form Cu
2+ [
27]. The process shows the relationship between the release rate of copper biocides depending on the characteristics of the water, the most important being the salinity and pH of the water, as well as its temperature. The release rate in fresh water is less than that in salt water [
5,
9,
10,
27], while the increase in water temperature also leads to an increase in copper emissions from AF coatings [
23]. The content of copper biocide in AF coating is a direct indicator of the efficiency of AF coating, since it has been shown that the emission of copper compounds from AF coating increases with the increase of weight–percent proportion (
wt) of copper in coating [
28], observing antifouling effect in coatings with the initial concentration of
wt 20% copper oxide. The typical concentration of copper oxide compound used as the main active ingredient in biocide AF coatings is
wt 35–70%, while other copper compounds that act as booster biocides (e.g., copper pyrithione, cooper thiocyanate, Irgarol) [
29,
30] are contained up to
wt 10% [
15].
The speciation of copper is essential for understanding its subsequent toxicity to aquatic flora and fauna. The effects of dissolved copper have been reported in fish, bivalves, macroalgae and unicellular algae. Chronic effects of Cu to fish may include decreased growth, changes in behavior, including olfactory responses, agonistic responses, avoidance, and attraction, and changes in swimming ability or swimming speed. It was found that Chinook salmon significantly avoided Cu concentrations of 0.8 μg L
−1 and concentrations from 2.8 to 22.5 μg L
−1; however, avoidance was not observed by Chinook salmon in water containing 1.6 μg L
−1 [
31]. The adult Atlantic salmon migrating upstream avoided areas contaminated with a mixture of zinc and copper approximate concentrations from 17–21 μg Cu·L
−1 and 210 to 258 μg Zn·L
−1. The researchers believed that concentrations of 38 μg Cu·L
−1 and 480 μg Zn·L
−1 could completely block spawning runs [
31].
The mussel embryo, oyster and sea urchin were reported to be sensitive, with total dissolved copper EC50 concentrations of 6.8, 12.1 and 14.3 mg L
−1. Of all species tested, cyanobacteria have been found to be the most sensitive group of organisms to copper exposure, with growth effects reported at 0.2 mg L
−1 total dissolved copper [
13].
Chronic Cu toxicity (
Table 1) may result in damage to specific organs, including olfactory receptor neurons. The mechano-sensory cells of the lateral line may also be damaged by Cu exposure, although recovery usually occurs within a few days in cases where the Cu concentrations are low [
31].
The copper values in oyster tissues appear quite high in the Indian River, but they fluctuate quite a bit (the same sites were sampled). For instance, in the first year of research, the copper level in oyster tissues was 512 μg/g and after three years it was 235 μg/g [
32].
The conducted research also showed that manatees had a high concentration of copper in their livers, with maximum levels of 1200 ppm dry weight [
32]. Numerous studies have shown that Cu inhibits growth and interferes with photosynthesis, respiration, enzyme activity, pigment synthesis and cell division [
31]. As per the conducted research [
31], all aquatic species, except for algae and certain fish species experienced a generalized increase in Cu concentrations as exposure levels increased. No evidence was found that Cu bio magnified in aquatic systems, although it does seem to be passed on through aquatic food chains to humans.
3. Methods for Estimation of Copper Emissions from AF Coatings
When assessing the degree of the presence of metals in the hydrosphere, dissolved metal concentrations are predominantly considered. At the same time, the properties of bottom sediments are mostly neglected, which, due to the reduced oxygen level, show the property of anoxicity, leading to an increase in the concentration of sulphides, and causing metal sedimentation. The emission of copper compounds is a complex process that includes the release of copper from AF coatings, the reaction of copper compounds from marine sediments, binding to the present ligands, changes in concentration caused by sea currents, etc. Therefore, it is necessary to observe oscillations in these reactions [
19]. This presents the major drawback of hydrosphere environmental studies, very frequently do not assess the impact of metals from bottom sediments adequately [
10]. These extremely complex processes have been insufficiently researched, while the amount of biocide released from AF coatings is mostly used to assess the risk and impact of AF agents on the marine environment.
There are three types of methods for estimating the emission of AF biocides: laboratory testing, calculation methods and in situ methods with associated test procedures [
34,
35,
36,
37]:
Laboratory tests are based on the rotating cylinder method for estimating emissions. The procedure is defined according to ASTM and ISO procedures. The test involves a rotating disk with an applied AF coating that rotates inside an artificial seawater solution. All parameters, such as dimensions, rotation speed, water composition, pH parameters, temperature, methods and intervals of measurement and other conditions are prescribed by the ASTM D6442-06 2006 standard, i.e., IMO 15181-1 and 15181-2 standard. Several ASTM/ISO standards have been developed for determining biocide emissions, including Zineb, various organotin compounds, organic biocides, tralopyril, Pyridine-triphenylborane, etc. One of them is the standard based on ASTM 6442-05, which is intended for testing copper emissions over a longer period of time, which yields more realistic results [
35,
38];
The Harbor Exposed Panel (HEP) is a combined laboratory/field method in which test panels with applied AF coatings are exposed to port conditions followed by the laboratory emission estimation. The method was developed by the US Navy and it is used exclusively by US agencies [
35]. Due to the lack of available results, the reliability of the method is unknown;
The Flume method was developed by the Japanese Maritime Research Institute (JMR), Institute for Biocide Emission Measurement. It is a combined laboratory/field method, and there are no available data or indicators of the method reliability;
The Dome method was developed by the US Navy to measure the emission of organotin compounds directly from the hull of a sailing ship. It is also suitable for measuring emissions of copper compounds, and it is considered to be the procedure providing the most realistic data [
19,
34,
35,
39];
The CEPE Mass-Balance method is a computational method based on an empirical model of biocide emission. It is based on the fact that the total emission of biocides cannot exceed the amount of biocides present in PO coatings [
35]. The method assumes that the emission of biocides will be high in the initial period of 15 days, after which the emission will become uniform until the end of the coating life cycle [
40];
The ISO Mass-Balance method (ISO 10980:2010) considers the limitations of the CEPE method, and provides more realistic biocide emissions. The method considers the life cycle of the coating, allowing estimates to be obtained for the highest possible emission rate as well as for the highest possible amount of biocide release;
Polishing Rate Mass-Balance method starts from the fact that it is possible to calculate the biocide emission if the polishing rate is known [
35]. The calculated volume of reduced coating, with the known initial volume of biocides in the coating, gives the average biocide release rate over the observed period. The disadvantage of this method is that the determined emission of biocides does not consider alterations in the speed of the vessel, the ratio of time in navigation and at berth, but only gives the mean value of emission of biocides. The method is not applicable in all types of AF coatings.
The X-Ray Fluorescence spectrometer (XRF) method is a new procedure that uses X-ray spectrometry. The XFR analysis device measures and analyses the spectral emission reactions of metals in AF coatings (primarily copper and zinc) [
39] after exposure of AF coatings to high-energy X-rays.
All methods have significant constraints. The Dome method, which gives the most realistic data, is expensive and complex to implement. Its application is limited solely to the US Navy, and it has never been recommended as a standard model for estimating emissions and environmental risk [
29]. Moreover, the results obtained by this method are not suitable for areas with different sea properties (temperature, salinity) [
40].
Although they are affordable, the main disadvantage of mathematical methods is the fact that the required data on the life cycle of the coating and the thickness of the applied layer are obtained from the manufacturer. Therefore, the results obtained by these methods cannot be confirmed in real conditions [
16,
39]. Since it provides significantly increased results, it is necessary to apply a correction factor, which for the CEPE method is 2.9 [
34]. The main disadvantage for accepting the CEPE method as a generally accepted method is the inability to determine the exact emission of co-biocides in AF coatings, where their emission is not fully synchronized with the emission of the main biocide. The CEPE model, which predicts their synchronized emission, cannot be applied [
35].
ASTM and ISO methods with rotating cylinders are carried out under standardized conditions (pH 7.9–8.1, salinity 33–34‰, temperature 25–26 °C), with a duration of 45 days. The method does not give realistic results and has high costs. Moreover, this method was developed to measure the emission and efficacy of biocides in the laboratory, rather than real conditions of a particular location [
11,
35,
38], while the absence of organic matter in the solution is considered a significant drawback of the method [
16]. In addition, another disadvantage is that the emission results obtained by this method are significantly higher than the real emissions (compared to the results obtained by the Dome method from the same location) [
19,
35,
39,
40].
In the absence of a comprehensive model, the ASTM and ISO model of the rotating cylinder have been accepted by EU and US regulators [
40]. Since the biocide emissions obtained by this method are several times higher than the actual emissions, it is necessary to determine the appropriate correction factor for each type of coating [
35,
36]. As it is not possible to conduct testing for a longer period of time (according to the standard ASTM 6442-05), which would give results close to actual emissions, and in the absence of individual corrective factors, it is proposed for the results obtained by this method to be divided by the correction factor 5.4 [
34].
3.1. Estimation of Copper Emissions from AF Coatings
Since the ban on TBT and the introduction of copper-based compounds as the main biocide, several independent studies of emissions from AF coatings have been conducted. However, their results cannot be fully compared, as different methods with different constraints were applied [
25]. Furthermore, the share of the application of certain AF technologies is unknown; some estimates say that up to 90% of AF biocide coatings are used in the merchant fleet, i.e., that the transition to AF coatings without biocides would cancel the annual application of about 70 million tons of copper-based biocides and an additional 10 million tons of copper co-biocides [
15]. There is no standard test that could compare the properties of AF coatings under actual operating conditions, thus increasing the risk of inadequate coating selection. This may result in increased vessel operating costs, with unplanned dry dock hull cleaning [
30]. At the same time, the results of internal testing of AF coating manufacturers are not available [
28], so researchers choose their methodologies independently. This approach indicates the impossibility of universal interpretation of the obtained laboratory data. The analysis of available research indicates two areas of research on emissions of copper compounds from AF coatings: AF coatings emissions from pleasure craft and AF coatings emissions from merchant vessels.
3.2. Copper Emissions in Commercial Vessels
The most significant consequence of the biofouling process in merchant ships is the reduction of speed, which leads to increased fuel consumption and atmospheric emissions. Estimates vary depending on the type of vessel and operating conditions, with considerations that 1 mm of biofouling layer thickness leads to a 17% increase in fuel consumption and a 15% decrease in vessel speed [
10]. Other estimates state that for vessels with lower operating speeds (bulk carriers and tankers), the resistance to movement through the water increases by 70–90%, while in faster vessels (passenger, cruise liners and warships), the increase in resistance is about 40–50% [
15,
30,
41,
42,
43]. Given the surface roughness, some researchers note the possibility that the initial stages of microfouling can, to some extent reduce the resistance to movement through water if the affected surface is originally exposed roughness [
44].
Although the speeds of rotation of samples in used laboratory methods [
45] do not correspond to the actual speeds of container ships, it has been pointed out that the key to the stability of the copper release rate is the polymer solubility parameter, not the shear force caused by the action of water, and that after a long period of time, emission rates become uniform for both rotating disk methods and static methods of exposed panels. Hence, the data presented here also include the results of static emission measurement methods.
Table 2 shows the available research results of AF coatings intended for merchant ships, which as a rule have a significantly higher
wt content of biocide copper compounds than AF coatings intended for pleasure craft [
16].
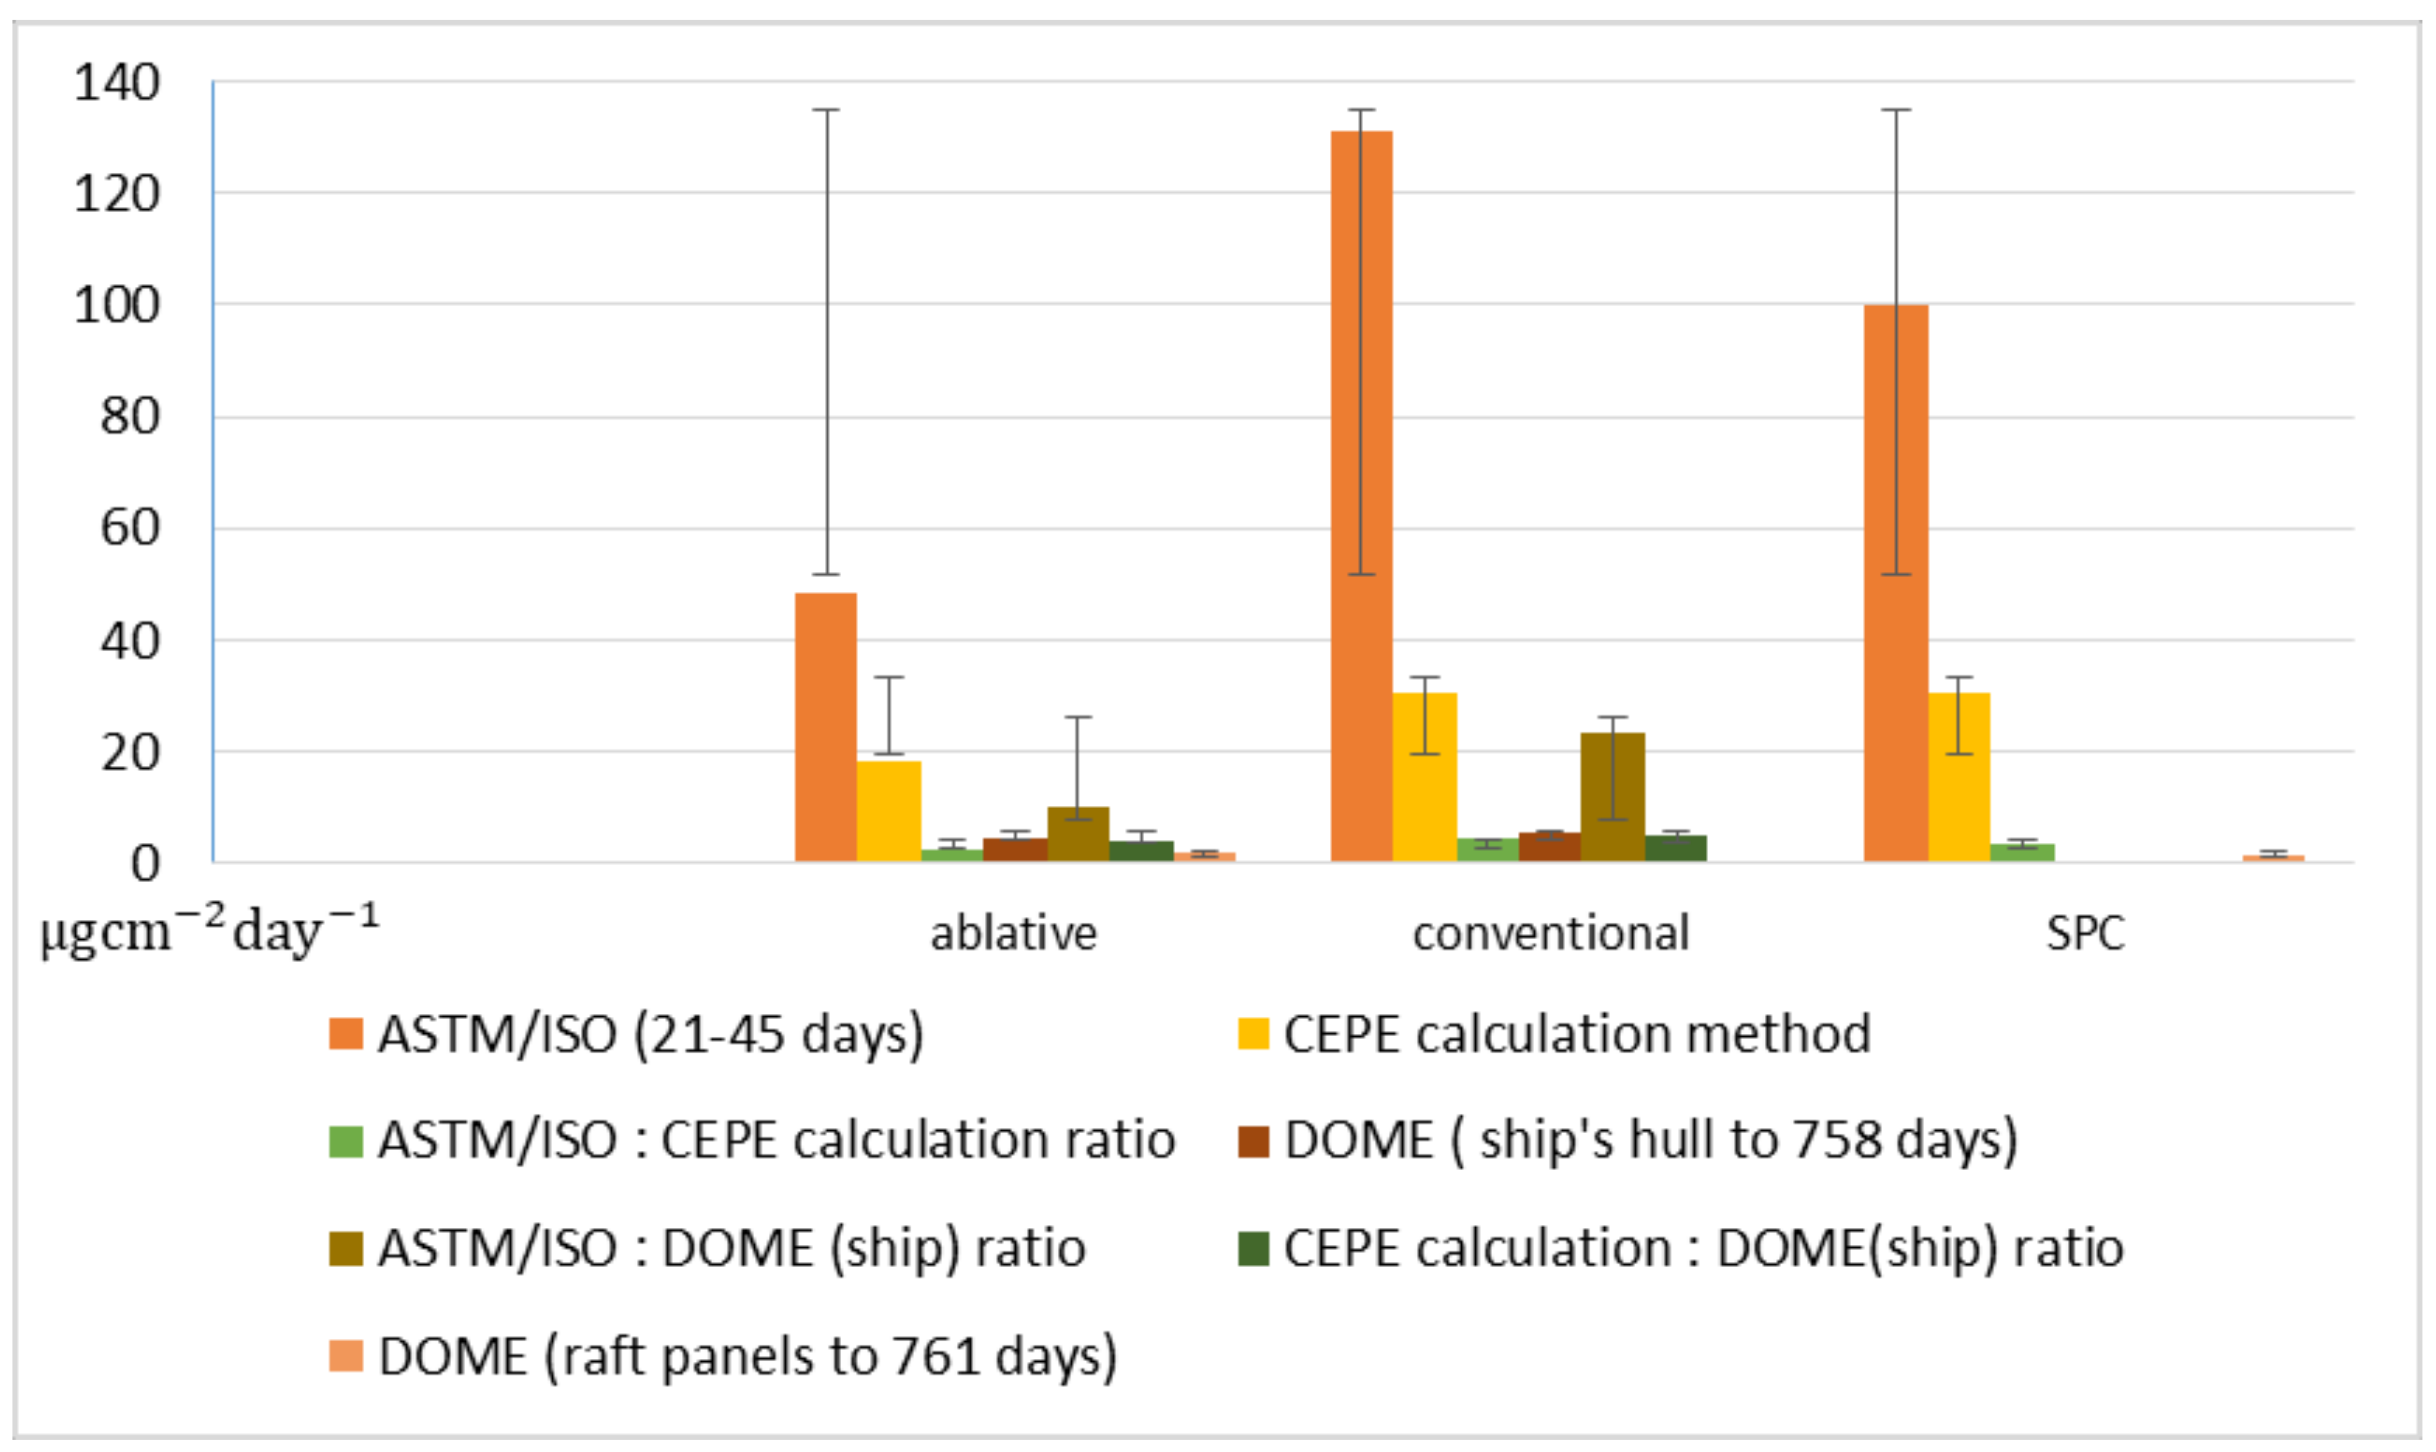
The obtained results show extremely large differences depending on the type of coating and the applied testing method. It can be seen that the ASTM/ISO method lasting 21 days gives multiplied results. With the extension of the testing, the emission rate decreases, and the results approach the values achieved by other testing methods. The results obtained by HEP and the in situ methods provides significantly more realistic results considering the testing period of two years, within which the emission rate stabilizes and approaches real values. The results of testing the three types of coatings by different methods, including standard deviation, are shown in
Figure 1.
The figure shows that the two-year testing period gives the lowest values. The Dome method gives the lowest emission values for ablative and SPC type of AF coatings, while the conventional coating has the lowest copper emission according to the combined ASTM/ISO—CEPE calculation ratio method.
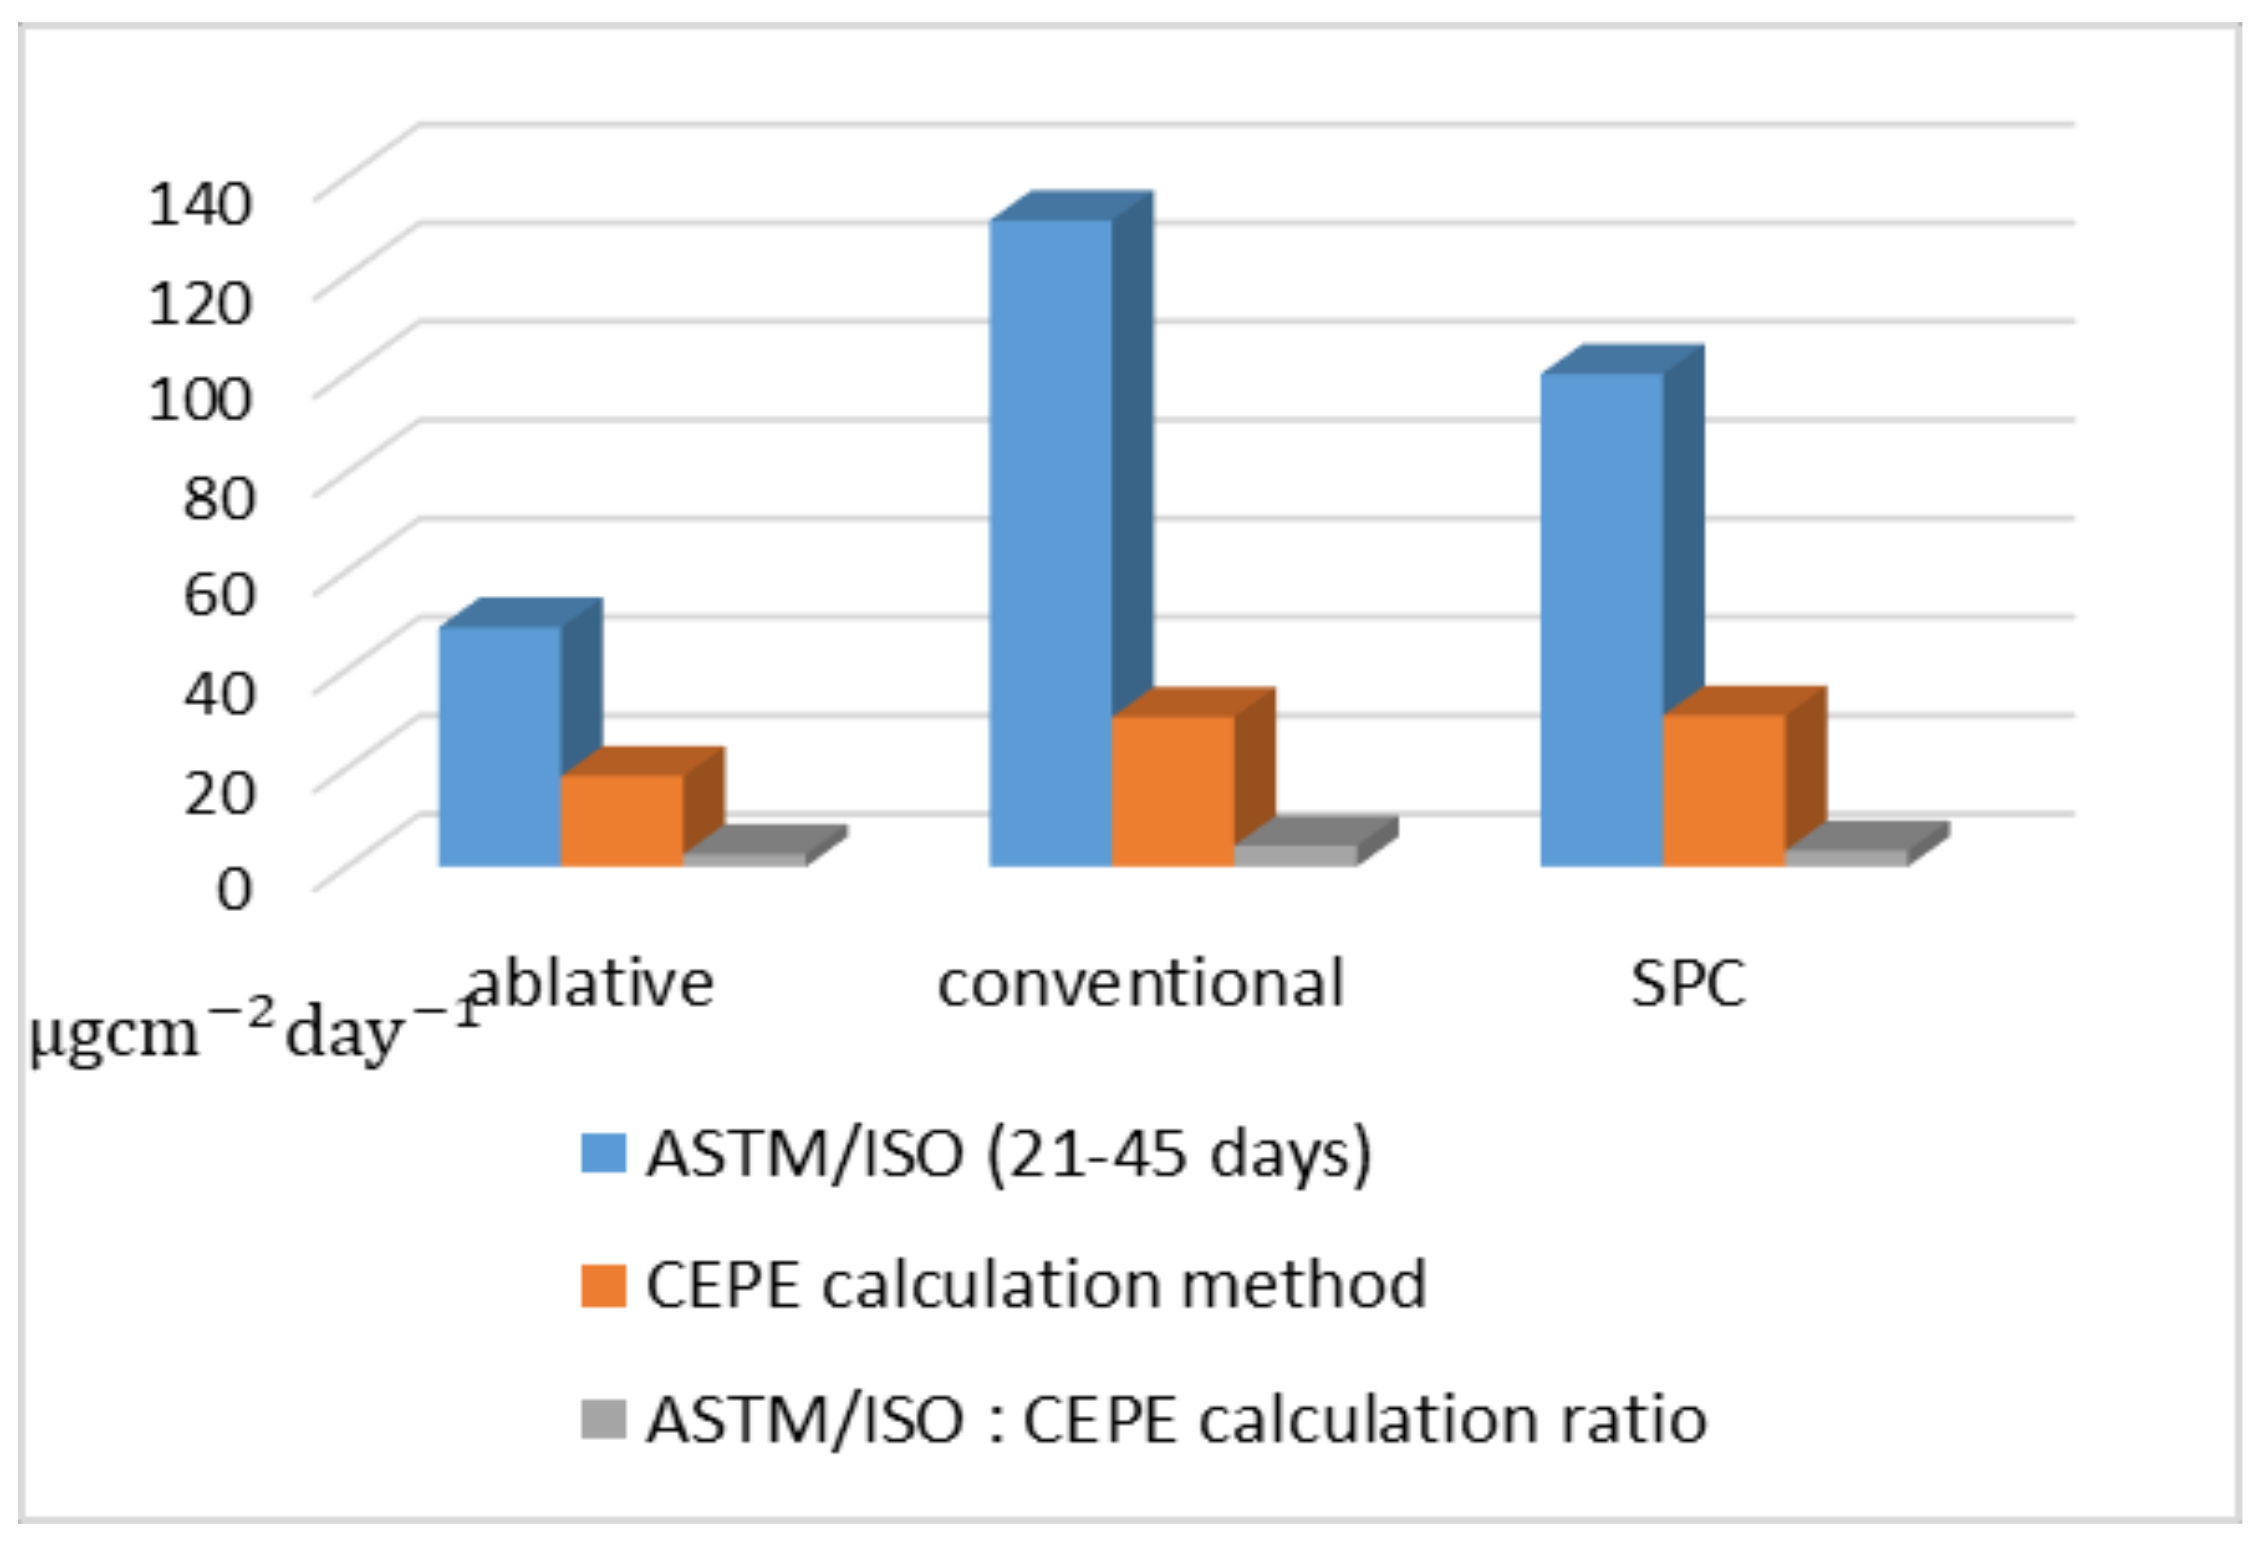
The available results of the three methods applied to the three types of AF coatings are shown in
Figure 2.
Figure 2 clearly shows that combining the laboratory ASTM/ISO and the calculation CEPE methods gives the lowest results, when compared to the values achieved by the Dome two-year method with a sample on the hull and additionally on the exposed panels. Observing the results obtained by the laboratory ASTM/ISO method, the calculation CEPE method, and taking the combination of these two methods as a reference, it is possible to determine the inter-emission ratios determined by applying different methods and types of AF coatings. This renders it possible to assess the joint deviations, to select which methods are suitable for testing emissions in a particular type of AF coating, and to identify potential factors for the correction of each method. The results are shown in
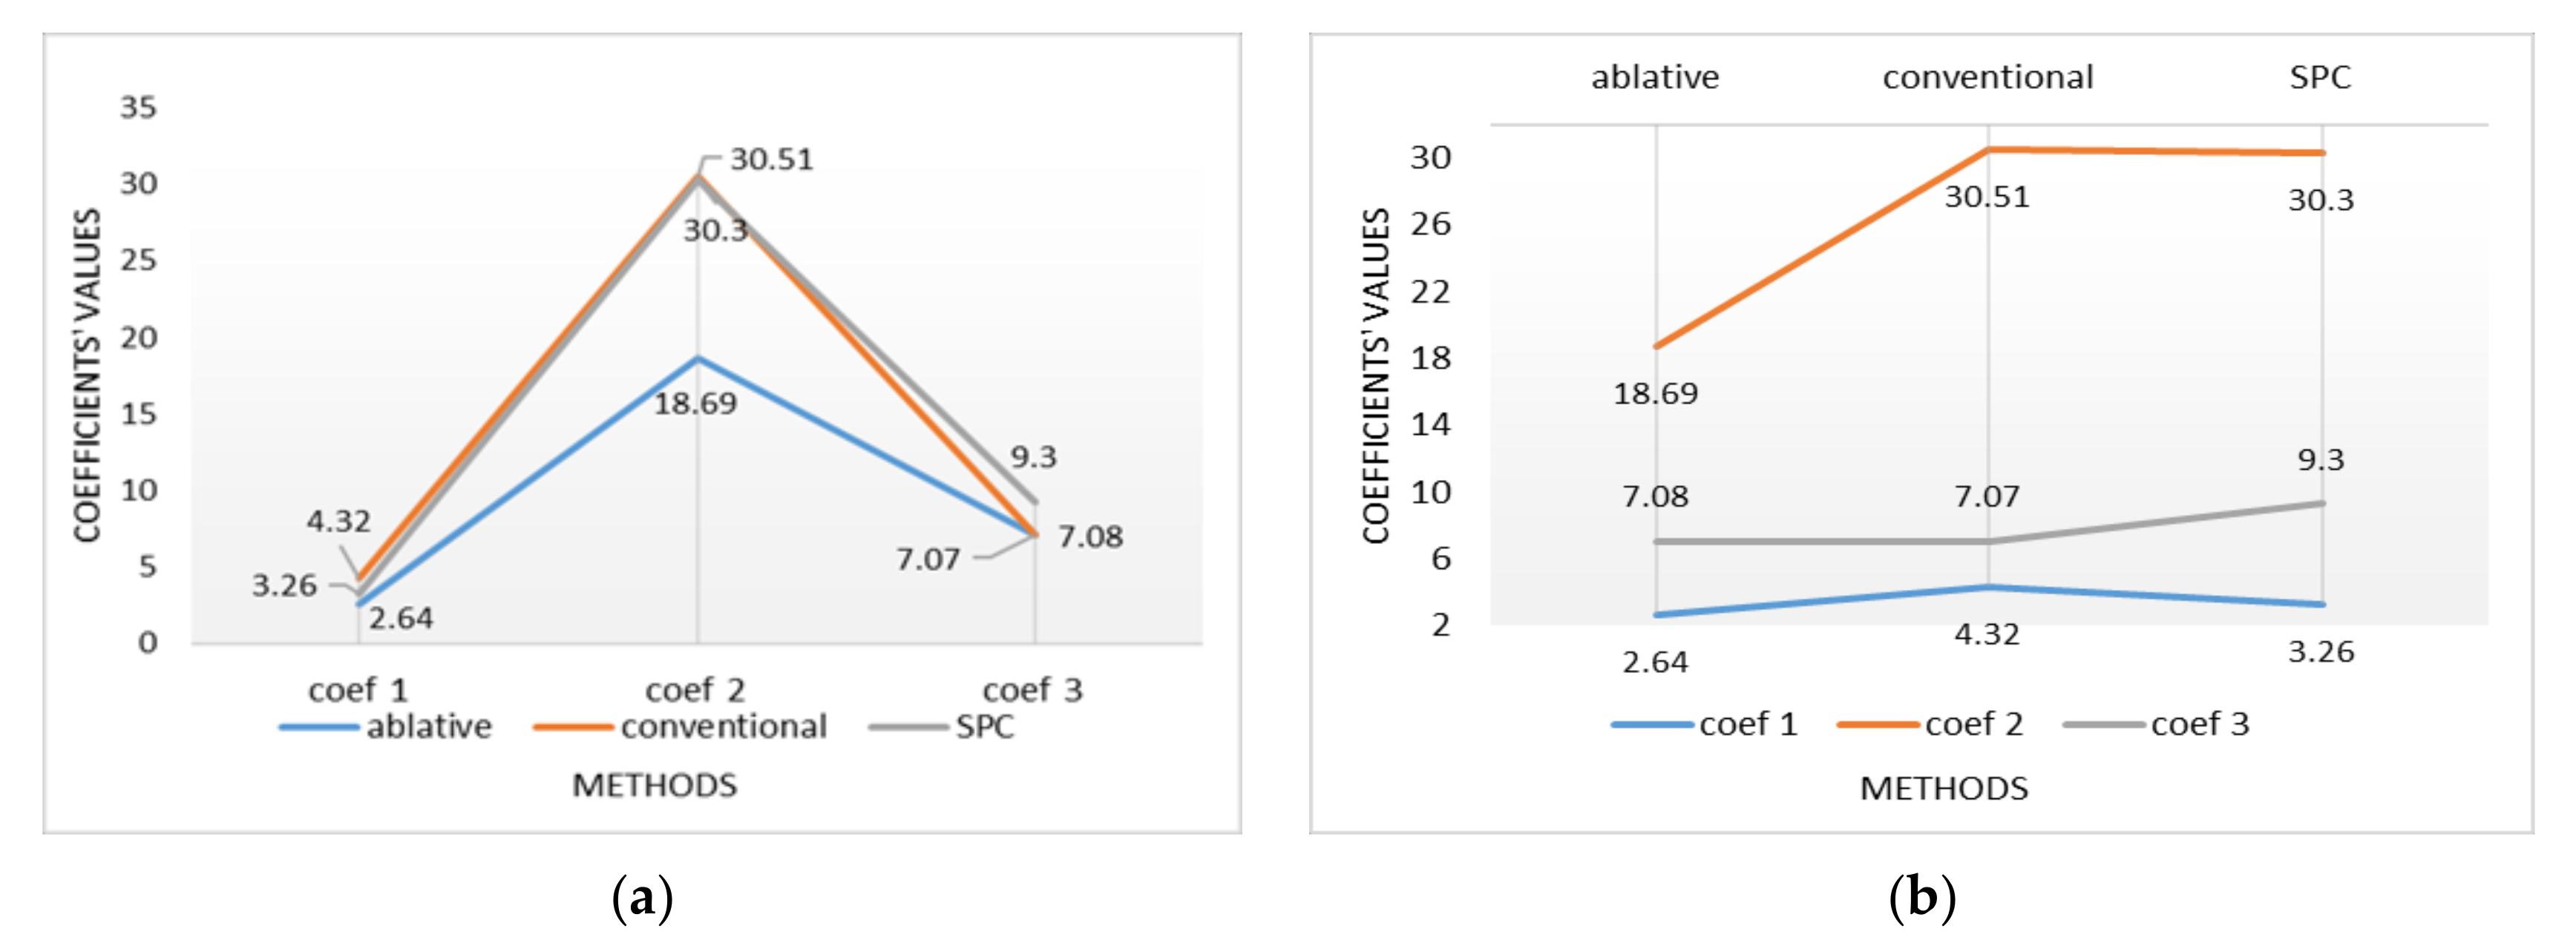
Figure 3. The non-dimensional coefficients 1, 2 and 3 represent:
Coefficient 1—ratio of ASTM/ISO (21–45 days) method and CEPE calculation method;
Coefficient 2—ratio of ASTM/ISO (21–45 days) method and ASTM/ISO: CEPE calculation ratio method;
Coefficient 3—ratio of CEPE calculation method and ASTM/ISO: CEPE calculation ratio method.
Figure 3 shows different non-dimensional coefficients of emission increase depending on the type of AF coating and the applied method. Regarding the estimation of emissions in conventional and SPC coatings, appropriate results will be provided by comparing the results obtained by ASTM/ISO (21–45 days) method with the ASTM/ISO: CEPE calculation ratio method (Coefficient 2), which is 30.51 for the conventional coating, and 30.3 for the SPC coating. The value of Coefficient 2 of 18.69 for the ablative coating shows that the emission ratio obtained by the ASTM/ISO method and the ASTM/ISO: CEPE calculation ratio method is low. Regarding the estimation of emissions from ablative coatings, the optimal results will be provided by comparing the results obtained by the CEPE calculation method with the results of ASTM/ISO: CEPE calculation ratio method—Coefficient 3. With a value of 7.07, it also coincides with the coefficient for conventional coatings (7.08) and shows that emission ratios obtained by the CEPE calculation method and the ASTM/ISO: CEPE calculation ratio method are completely linear for ablative and conventional AF coatings. Coefficient 1 (ratio of ASTM/ISO (21–45 days) method and CEPE calculation method) does not match with any coating, with its value varying from 2.64 to 4.32.
4. Proposed New Method for Determining the Wetted Area of a Container Ship
In our proposed numerical method for calculating the wetted area, we used the available
Maxsurf Integrated Naval Architecture Software [
47]. This tool is based on applying proven regression methods and potential flow calculations in creating a vessel’s NURBS model, together with numerous algorithms and analyses, as well. Its output has been validated against a variety of different data from various sources, including full-scale trials, model tests and other numerical methods [
47]. The results show that the considered container vessel changes the wetted area nonlinearly by changing the
coefficient, while maintaining the main vessel dimensions. The results are shown in
Table 3,
Table 4 and
Table 5, respectively.
Initial parameters include the observed unit container vessel without the trim and lateral tilt. The data in the tables show the change in vessel displacement, the length of the waterline and the wetted area depending on the change in draft and the design coefficient. The change depending on the design value of the coefficient is visible by comparing the wetted area for the same value of draft. Considering in general that a higher coefficient allows for a higher payload of the vessel, while at the same time reducing the speed of the vessel, the designers found a balance between the carrying capacity and the vessel’s resistance in navigation.
The exact wetted area can be calculated accurately only if we have an outline of the vessel’s form. Otherwise, the process of making the initial model starts with the typical values of vessel dimensions, displacement, draft and cb coefficient. The average values of cb coefficients for container vessels are in the range of 0.50–0.70, allowing speeds of 14–26 knots [
48].
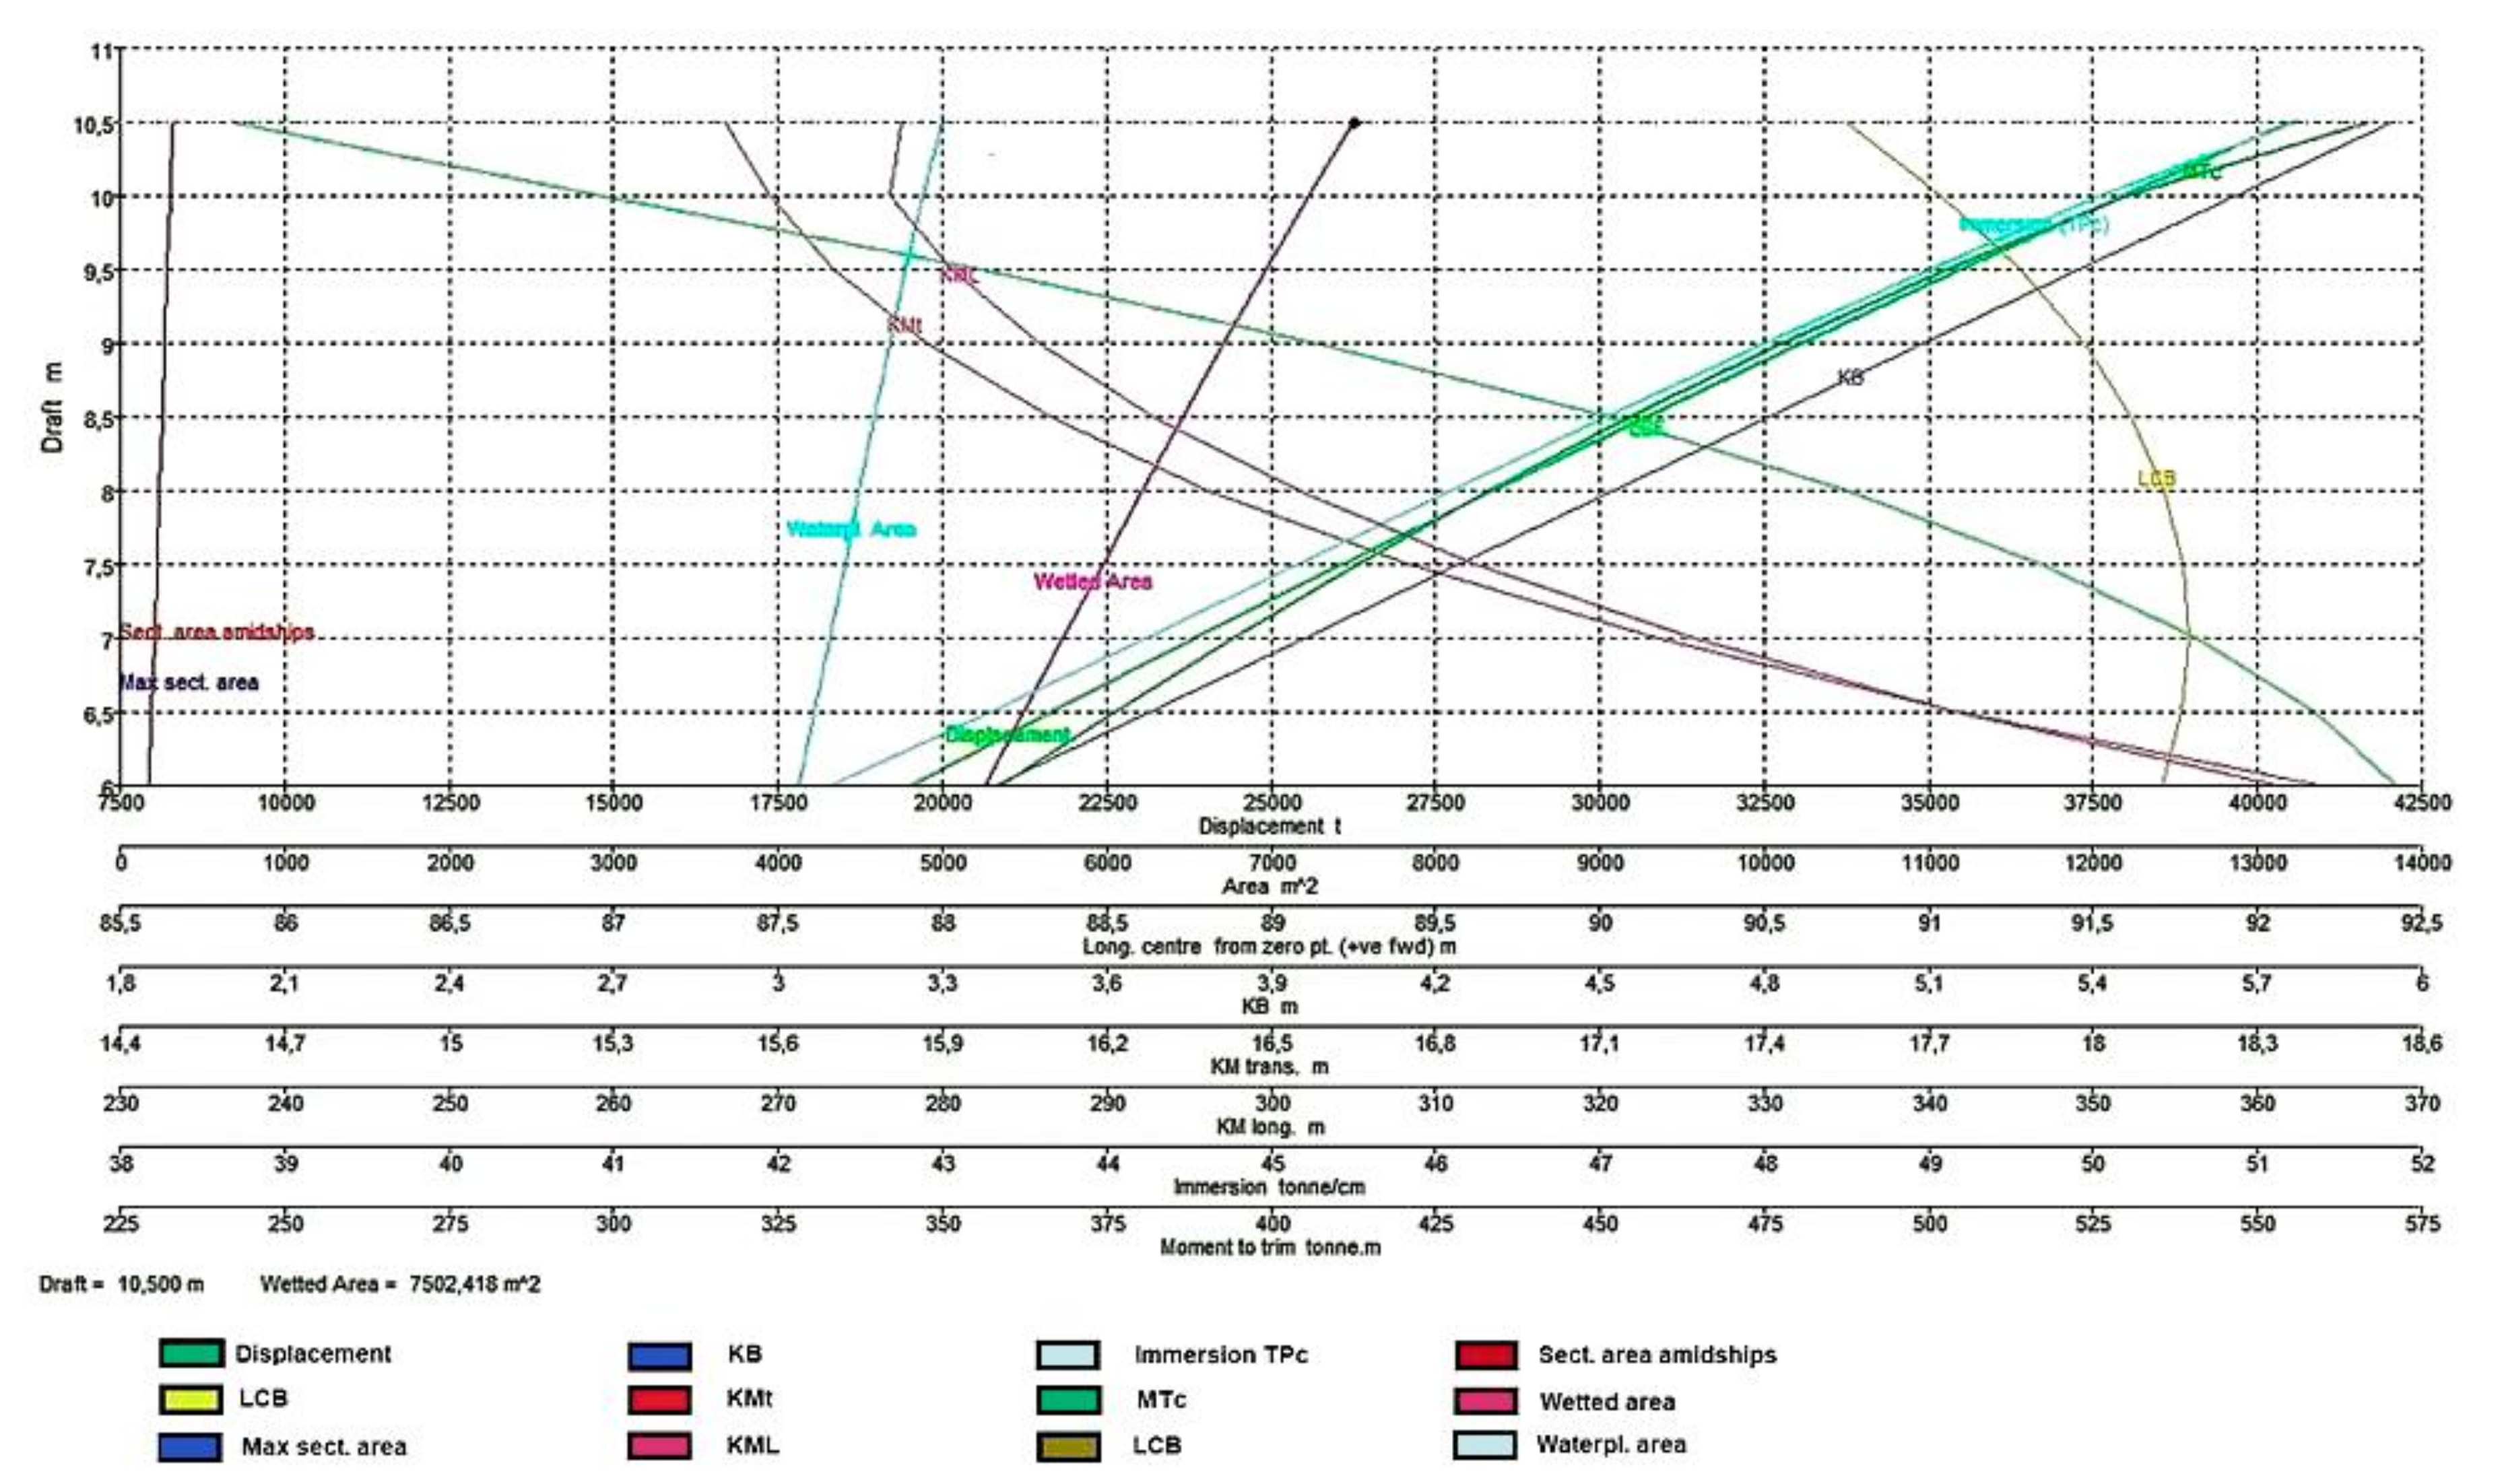
The wetted area can also be determined from the corresponding hydrostatic diagram (
Figure 4), where the input variable is a vessel’s draft.
Although the estimate of the wetted area depends on several parameters, it can be precisely determined using the AIS system. As the AIS messages contain information about the type, dimensions and draft of the vessel, the system could also provide a time frame for a vessel’s stay in a particular area, allowing accurate assessment of time in motion and at rest, if the estimate is based on separate emissions. The unknown coefficient
can be estimated using other available parameters, e.g., using the Alexander Formula [
49]:
where
: the speed of the vessel in knots; and
: the length of the vessel in feet.
The coefficient K has a value ranging from 1.03 for fast vessels to 1.12 for slow ones.
5. Discussion
The impossibility of replicating the results of laboratory tests of biocide emissions in actual operating conditions arises from the test conditions, since the process of chemical dissolution and equilibrium of particles takes place differently in given laboratory volumes and in unlimited water volumes during navigation [
28]. The measurement results shown in
Figure 1 illustrate that in all methods used, the initial release rate of copper biocides is extremely high in the initial testing period, while decreasing significantly and stabilizing with an extension of the testing time. Some studies show that the stability of copper biocide emission occurs more with SPC coating types than with ablative and conventional AF coatings [
36], requiring about 4–6 months to achieve stable copper emission, which cannot be determined by the ASTM/ISO method. The testing time using the ASTM/ISO method is 2–45 days, which explains the high values of emissions obtained by these methods, without the exponential reduction of copper emissions recorded in long-term methods [
36,
46]. Therefore, for an adequate assessment of copper emissions, it is necessary to observe the type and life cycle of AF coatings, as they have a significant impact on the mode of action and dynamics of biocide emissions.
However, the introduction of copper biocides requires subsequent appropriate estimates of their emissions. After the adoption of the test method and the average daily value of copper emissions from the unit area of the immersed hull, it is necessary to calculate the total biocide emissions of the observed vessel.
Different approaches can be applied depending on the purpose of the research. In estimating copper emissions when passing through the Suez Canal, the authors of [
50] used the (Formula (4)):
Or based on ship’s tonnage (Formula (5)):
where
the wetted hull area of the vessel;
the length of the vessel;
the vessel’s beam; and
the vessel’s draft.
In doing so, they estimated the average copper emission to be 2.2 μgcm
−2 day
−1. The total emission was obtained by multiplying the estimated average emission and the wetted surface area of the vessel. Both the number of ships at rest and the number of ships in motion within the observed area are considered when emitting biocides in marinas and ports. EU-OECD Guidelines [
46] proposed a formula (Formula (6)) for estimating total
emissions in ports:
where
the average immersed ship area of category
, for an example number of ship of length category
;
and
the number of vessels in motion and number of vessels at rest during the day;
application factor, expressed as the share of vessels category
with specific AF coating applied; and
and
the emission of observed biocide in vessels at rest or in motion
.
Based on the AIS data on the movement, type and size of vessels in the area of the Dutch continental shelf for 2007, a rough estimate of the amount of emissions of copper compounds [
51] was made. The formulas for the product of the immersed surface of the vessel and the emission coefficient were applied, with the highest emission coefficient for the annual period estimated at 1.2 μg/cm
2 per year. The total annual quantity (excluding fishing vessels) was estimated at 10 tons [
41]. The accuracy of determining the wetted area is extremely important for the proper assessment of the biofouling effect on a vessel. The form of the underwater part of the vessel depends on several requirements by the client, and is observed with regard to the overall form of the vessel and its main dimensions. For container vessels, the most significant consequence of biofouling is an increase in the frictional resistance of the submerged part of the vessel. The results of individual tests [
52], applied to a 230-m-long container vessel at a speed of 24 knots, showed an increase in resistance and effective thrust depending on the size of the colonizer, shown in
Table 6.
The other laboratory test included several types of AF coatings (Foul Release (FR), Linear-Polishing Polymer (LPP) and CDP) on surfaces with different degrees of roughness.
Table 7 shows the results obtained from a 232.5-m-long container vessel at speeds of 19 and 24 knots.
Although relatively fast vessels, in which the ratio of frictional resistance is lower in relation to the wave resistance component in the total resistance, it is evident that the selection of the appropriate AF coating is crucial for maintaining the required performance. In addition to the choice of coatings for the assessment of biocide emissions, it is necessary to know the area of the wetted submerged part of the hull. Data on the wetted area of vessels are considered a competitive factor of the shipyard and are not publicly available, which poses a problem in determining the exact wetted area of the container vessel whose biocide emissions are to be estimated.
Some manufacturers of AF coatings [
46] have proposed simplified formulas for determining the wetted area of merchant vessels in ports of Rotterdam (Formula (7)), New York (Formula (8)) and in Finnish harbors (Formula (9)), as follows:
Attempting to obtain more realistic wetted areas than the ones proposed by calculation (6), the estimation of the wetted area was revised by the following expression (Formula (10)):
where
: the main frame coefficient (0.95–0.98); and
: the block coefficient (0.75–0.85).
By comparing the actual wetted surfaces of vessels of different types with the results obtained by Formulas (7)–(10), it is shown that formulas based on simple linear regression can deviate from the actual value up to several times [
46]. Assuming that we have vessels of identical form, with all main dimensions changing evenly, the following ratio (Formula (11)) holds:
The same ratio (Formula (12)) holds for the volume of the immersed part of the vessel
:
From this, in addition to the data on water density
, the relation (Formula (13)) for vessel displacement
can be obtained:
Knowing the reference data on of the first vessel, the wetted area of the requested vessel can be obtained, assuming that we determine the range of displacement of the requested vessel is determined.
Starting from Formulas (11) and (12), ratio (Formula (14)) follows:
Ratio (Formula (15)) also holds that:
It follows (Formula (16)) that:
Thus, with the known values of
of one vessel, another vessel of identical form will have a wetted area as expressed in (Formula (17)):
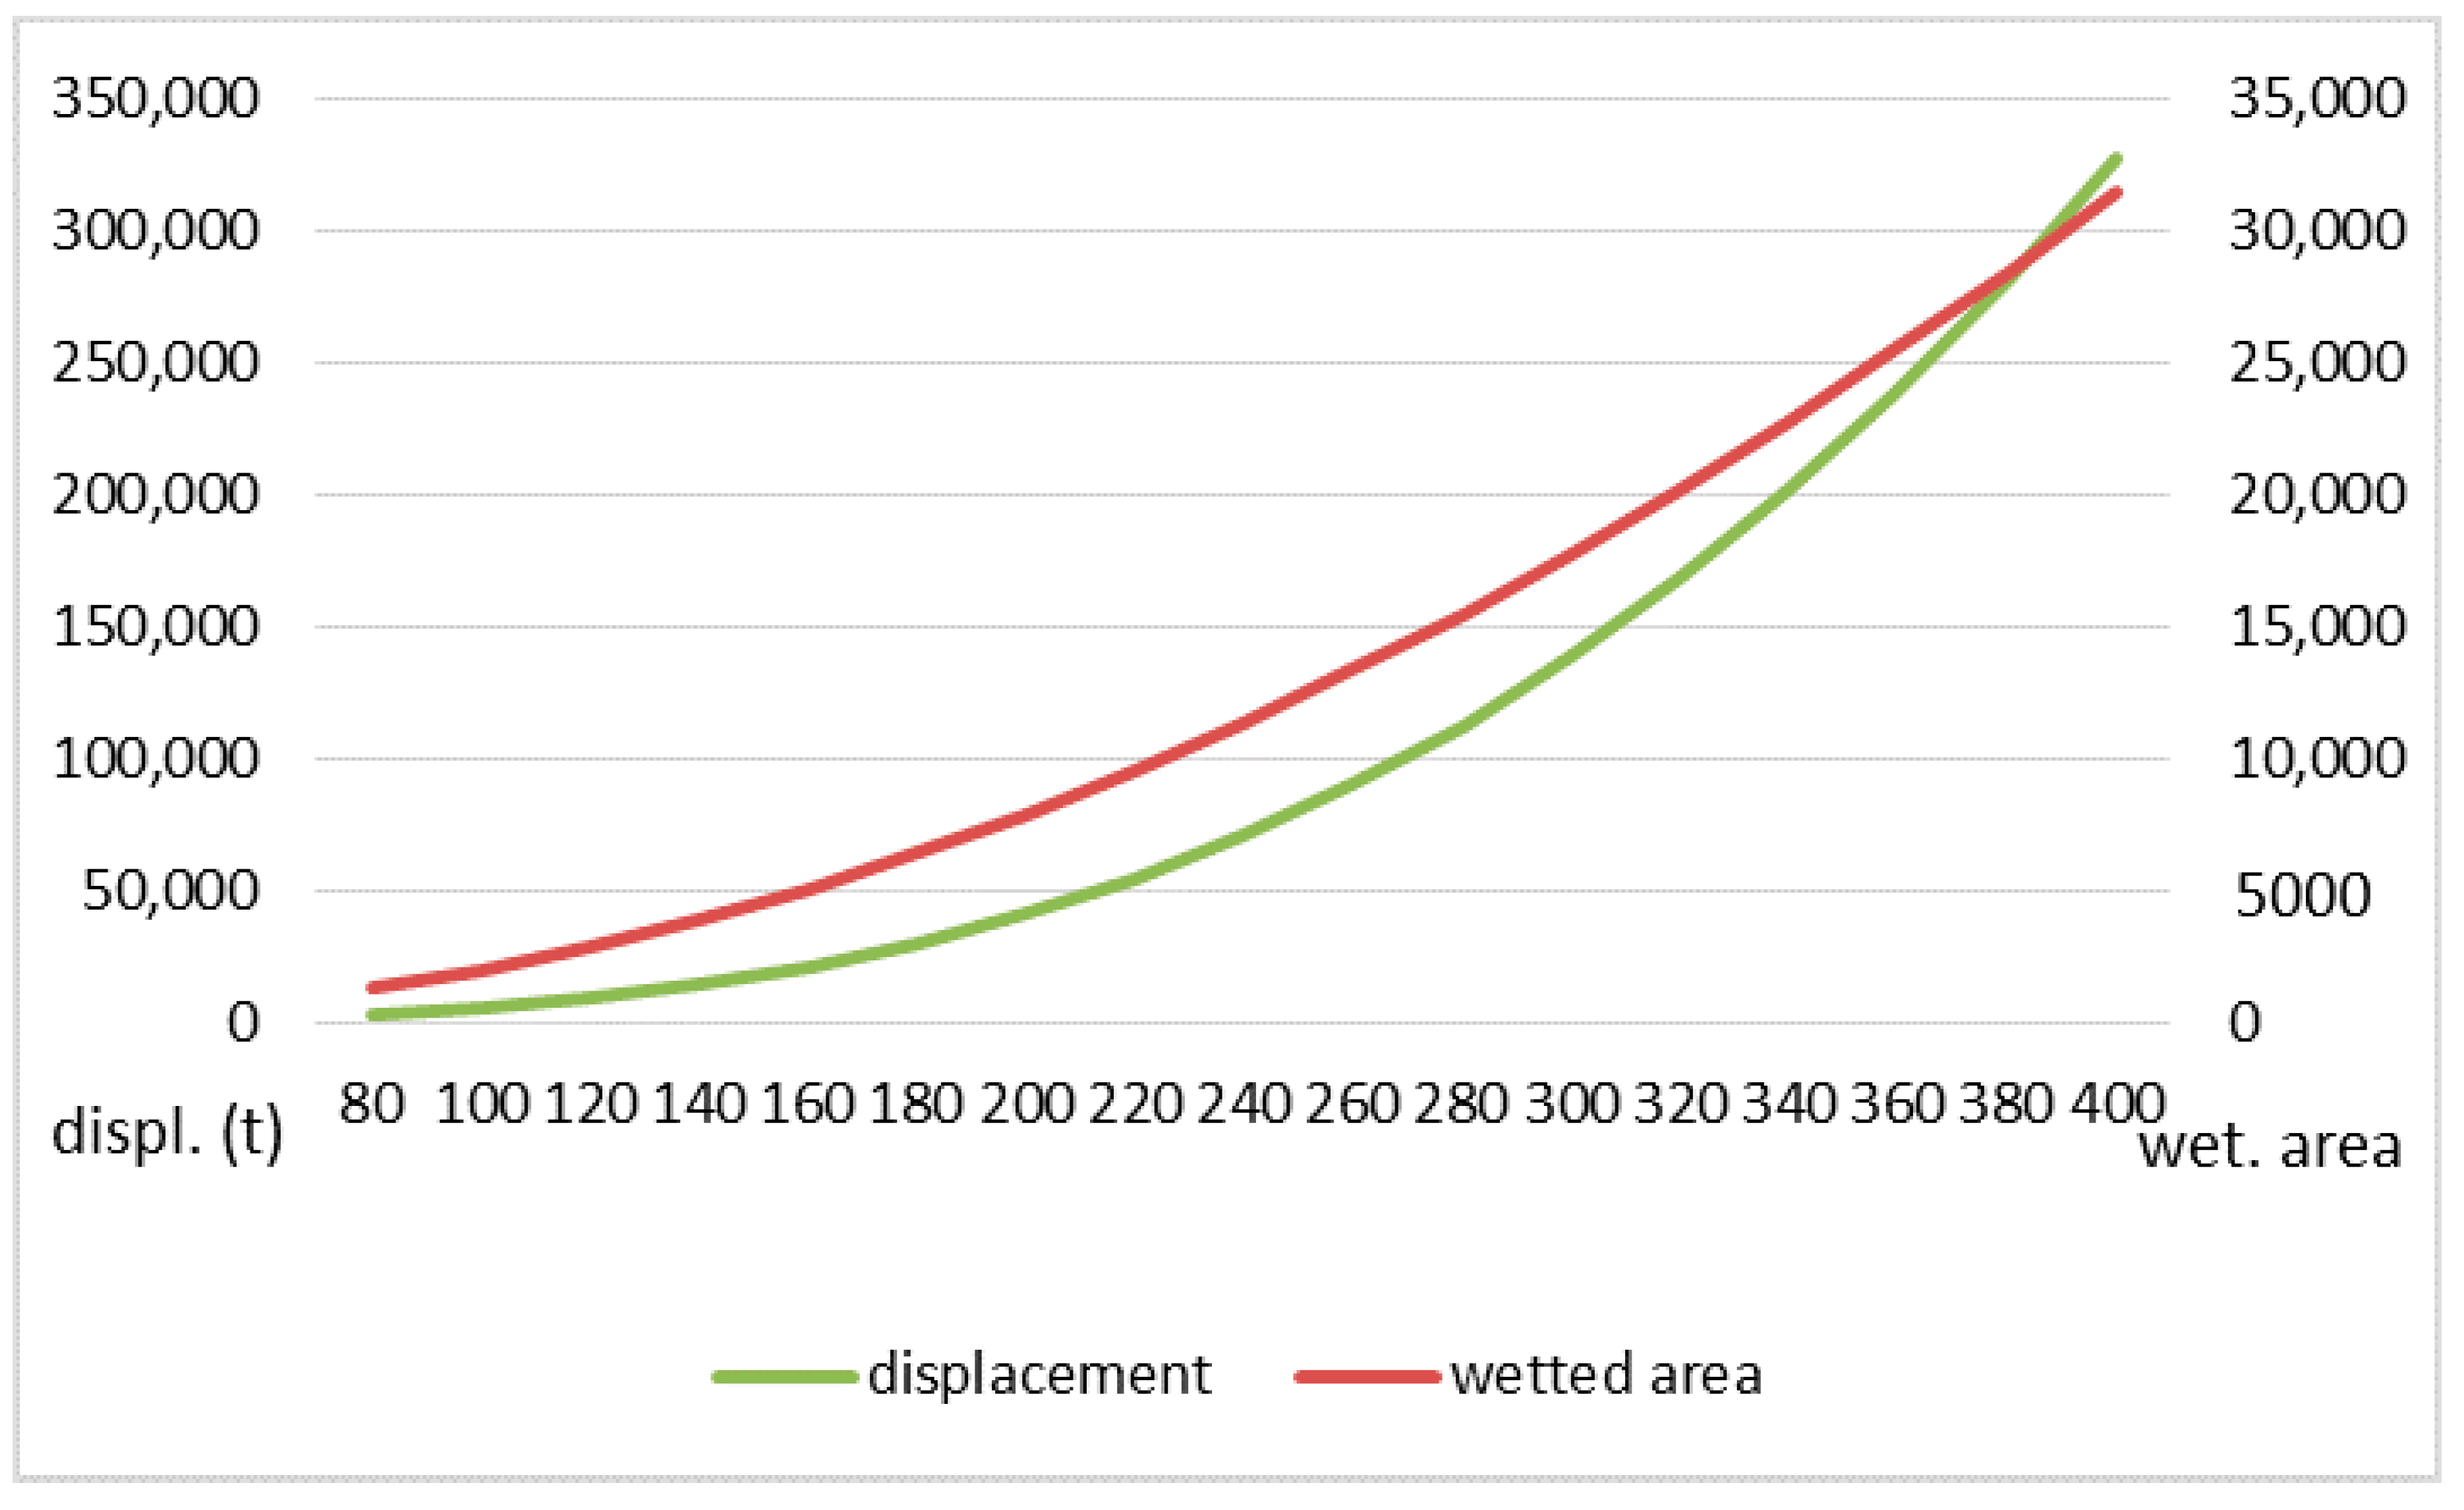
Applied to the container vessel under consideration with a length of 193 m and width of 32.2 m, a maximum design draft of 10.56 m, a known wetted area of 7330 m
2 and a block coefficient cb = 0.54, a linear model applied to vessels ranging from 80 to 400 m in length is shown in
Figure 5. These linear models are valid only if we look for the wetted area of two identical vessels in terms of form and relationship of the main dimensions, which is by no means the case with container vessels.
Observing several container vessels of various classes (designed in the period from 1990 to 2006), it is clear that the draft of vessels increases the least (given the depth limit on navigation routes and terminals), and that neither the length nor beam increases linearly.
Regardless of dimension when observing the relations of the wetted area of vessels of different forms, the following relation (Formula (18)) is valid:
where
: the wetted surface; and
: the hull displacement volume.
The dimensions are shown in
Table 8, where the change of the given characteristics in relation to the previous generation is also stated (in %).
Bearing in mind the basic vessel dimensions, it is obvious that the length increased by the highest percentage with each succeeding generation, averaging at 9.62%, and with a beam increase of 9.15%. The increase in maximum draft was 2.58%. These changes resulted in an average increase of dwt of 23.8% and a TEU capacity of 30.7% per generation, showing a nonlinear model of increase in vessel dimensions, therefore the above formulas for calculating the wetted area cannot be applied. This confirms that, by using the proposed method, the wetted area of a container ship could be determined consistently, with significantly higher accuracy than with the existing linear methods.
6. Conclusions
Although naturally present in the marine environment, copper has been recognized as a biocide, and efforts have been made to estimate its emissions from specific sources. Attempts to determine the emission of copper biocides from AF coatings are based on several variables, including the interaction of chemical properties of water and copper biocides, the effect of vessel speed on biocide emissions, copper biocides emission depending on type, matrix and lifetime cycle of AF coatings, suitability of selected methods for the estimation of a particular type of AF coating and vessels, etc. Therefore, the still-used emission values in estimations are based on a high proportion of assumptions, as well as estimates based on research results that often show inconsistencies.
A similar problem is present in determining the wetted area of the vessel. The range of obtained values of wetted areas acquired by the application of the proposed linear models deviates from the actual values by several times, and can thus reduce/increase the final estimate of biocide emissions. The proposed software model for calculating the wetted area, presented for a container vessel, enables considerably more precise estimation of the wetted area. Considering the main dimensions of the vessel’s form and the draft of the vessel, a multi-parameter table was made for estimations of the wetted area of the container vessel under consideration.
Given the range of dimensions of the present generations of container vessels, and the typical ranges of their coefficients, a series of hydrostatic diagrams can be made for estimating their wetted areas consistently. Required input data would be received via the AIS system, with monitoring of the sailing and rest periods of the vessel in a certain area in order to determine the time period of the emission. By selecting specific emission value, the total emission of copper biocides can be determined with a higher degree of accuracy; furthermore, an assessment of the impact on the marine environment on the shipping routes of container vessels can be performed.


