Testing A Methodology to Assess Fluctuations of Coastal Rocks Surface Temperature

Abstract
1. Introduction
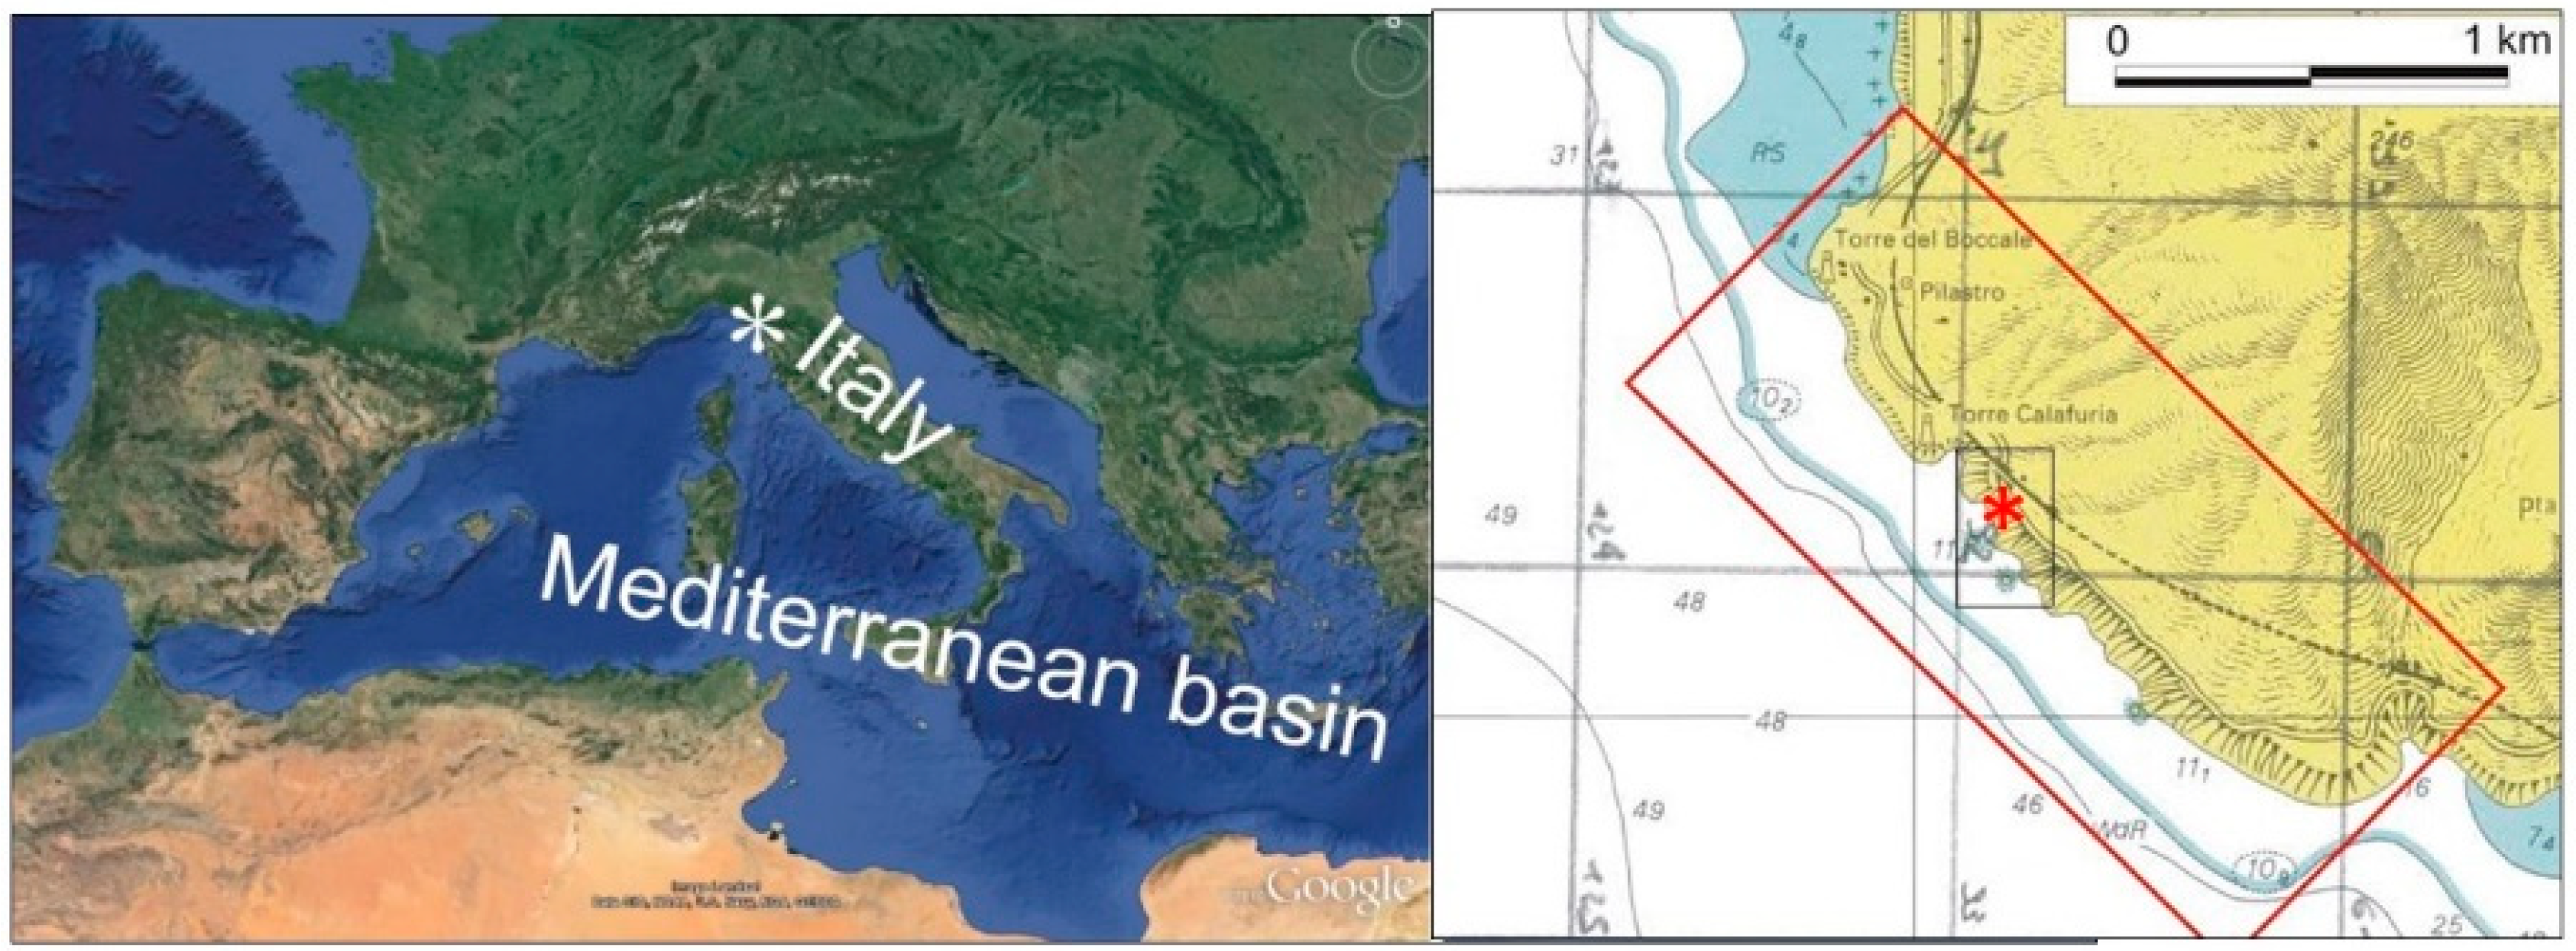
2. Study Area
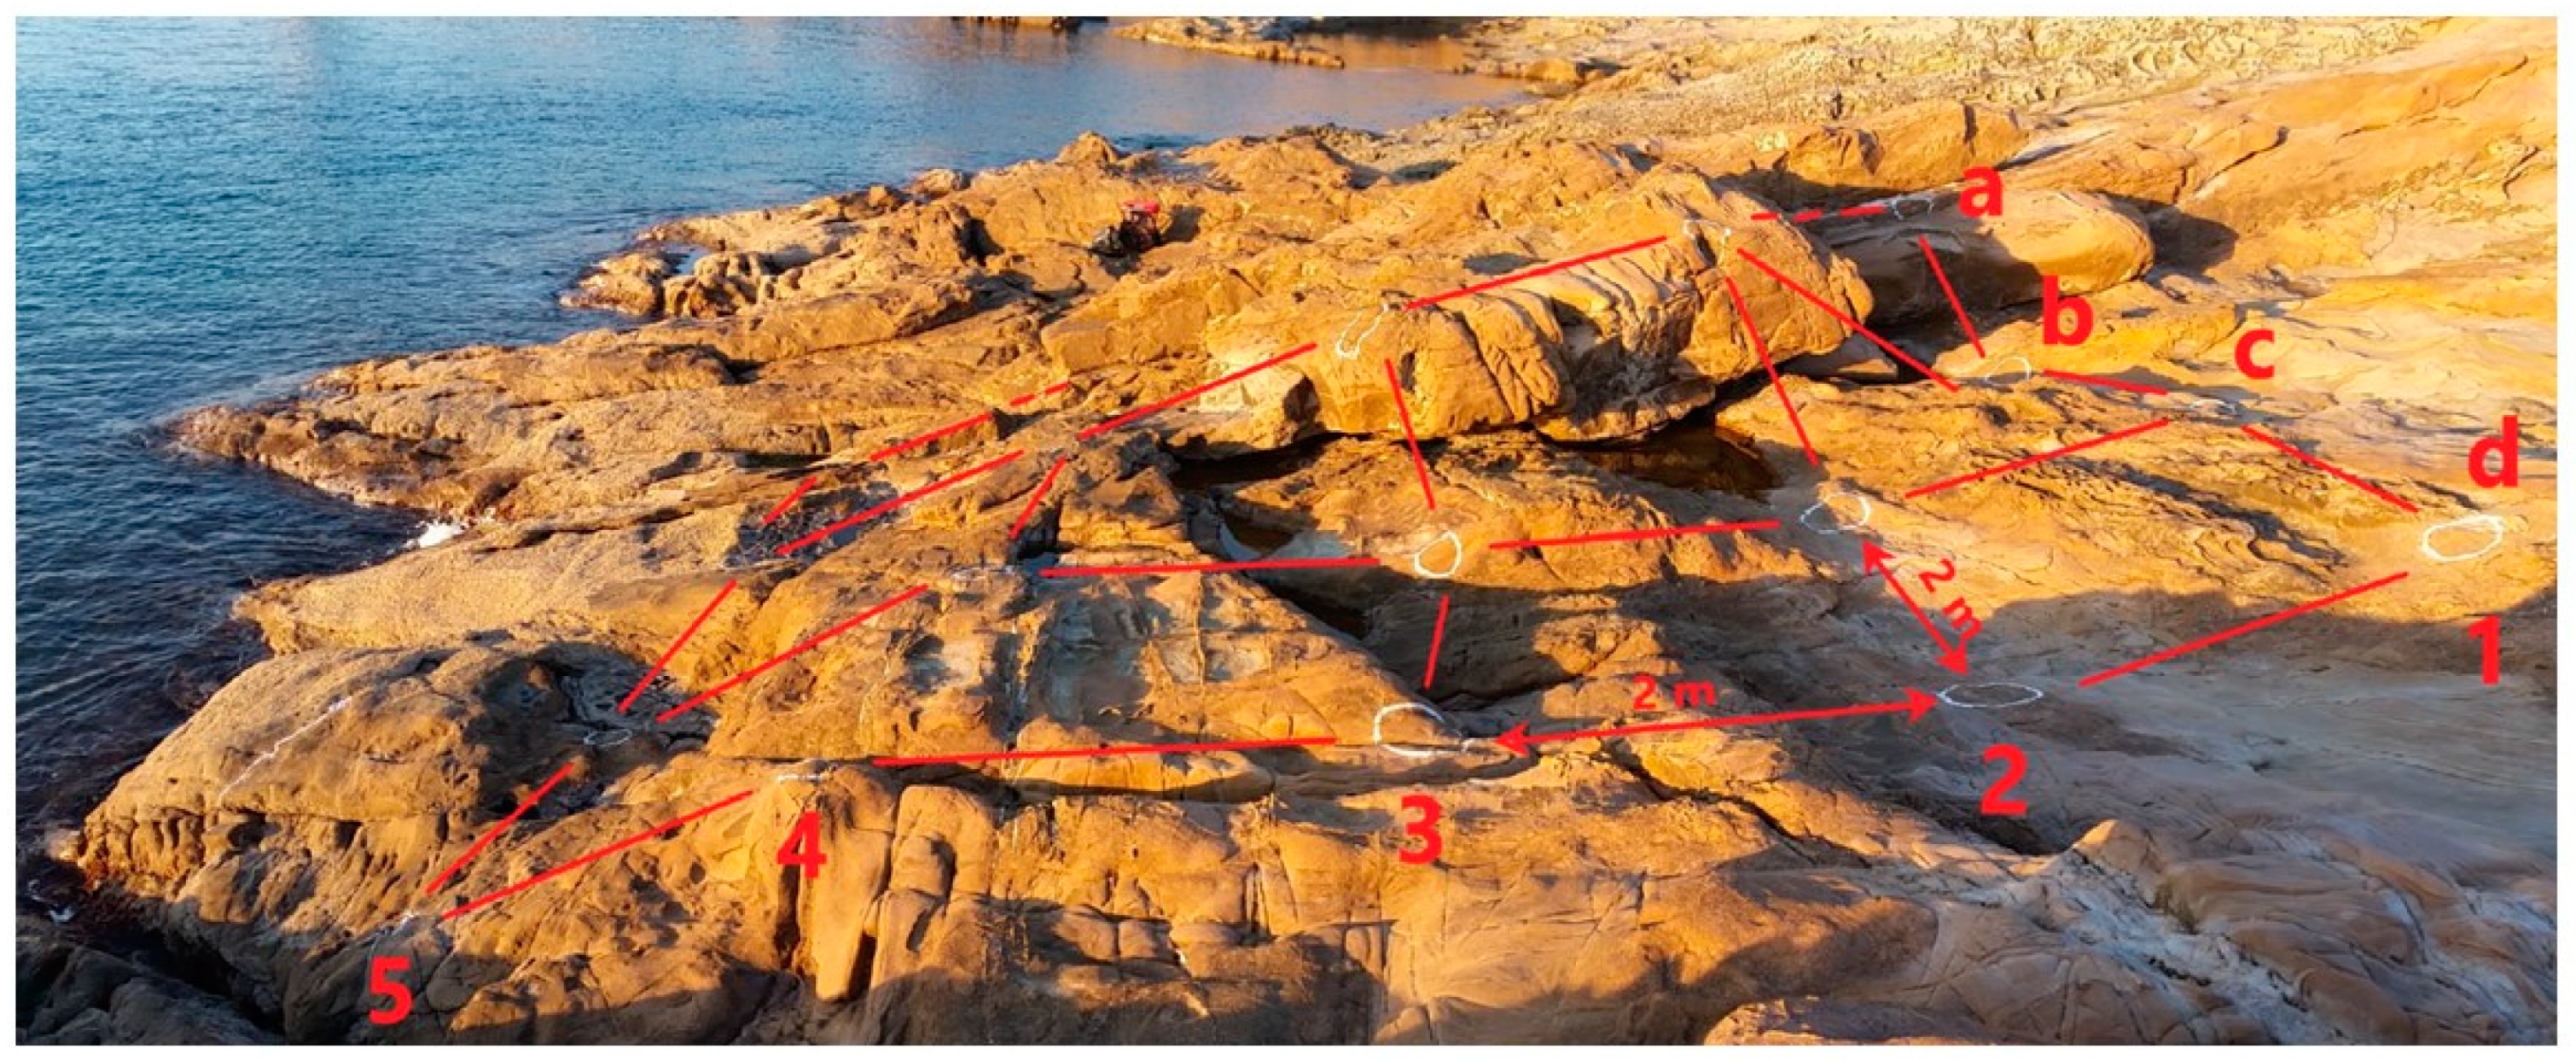
3. Materials and Methods
4. Results
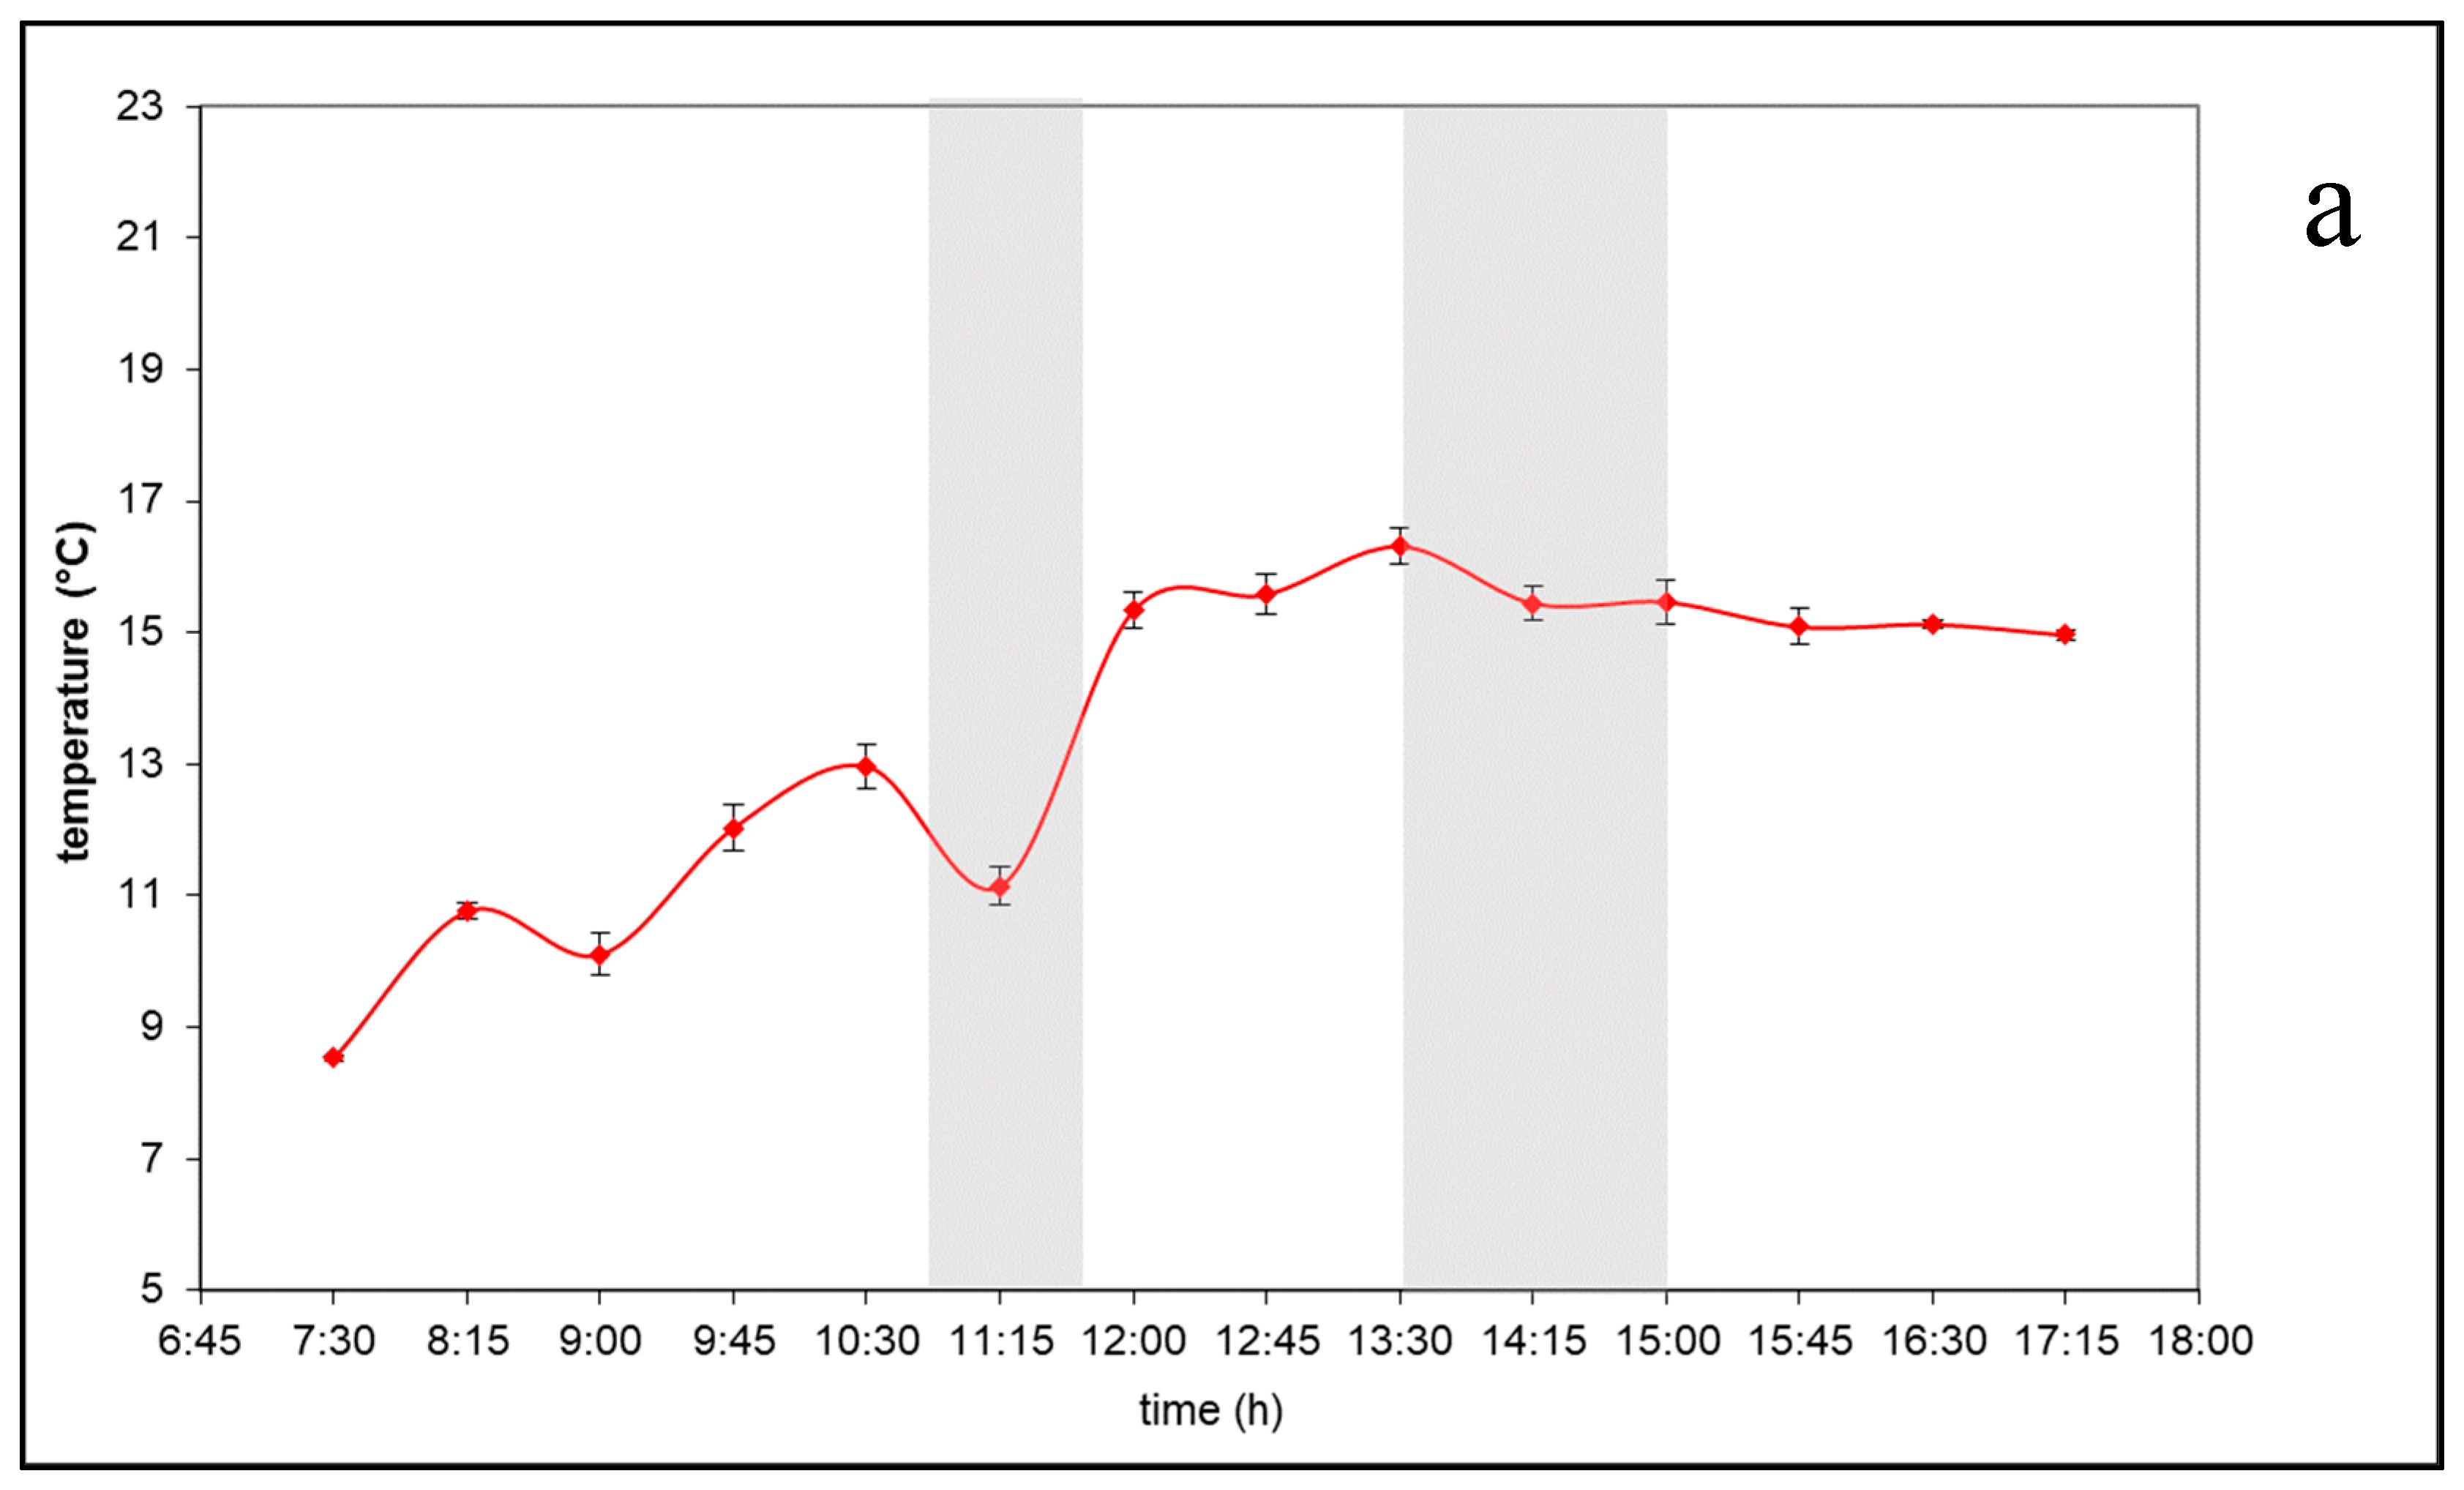
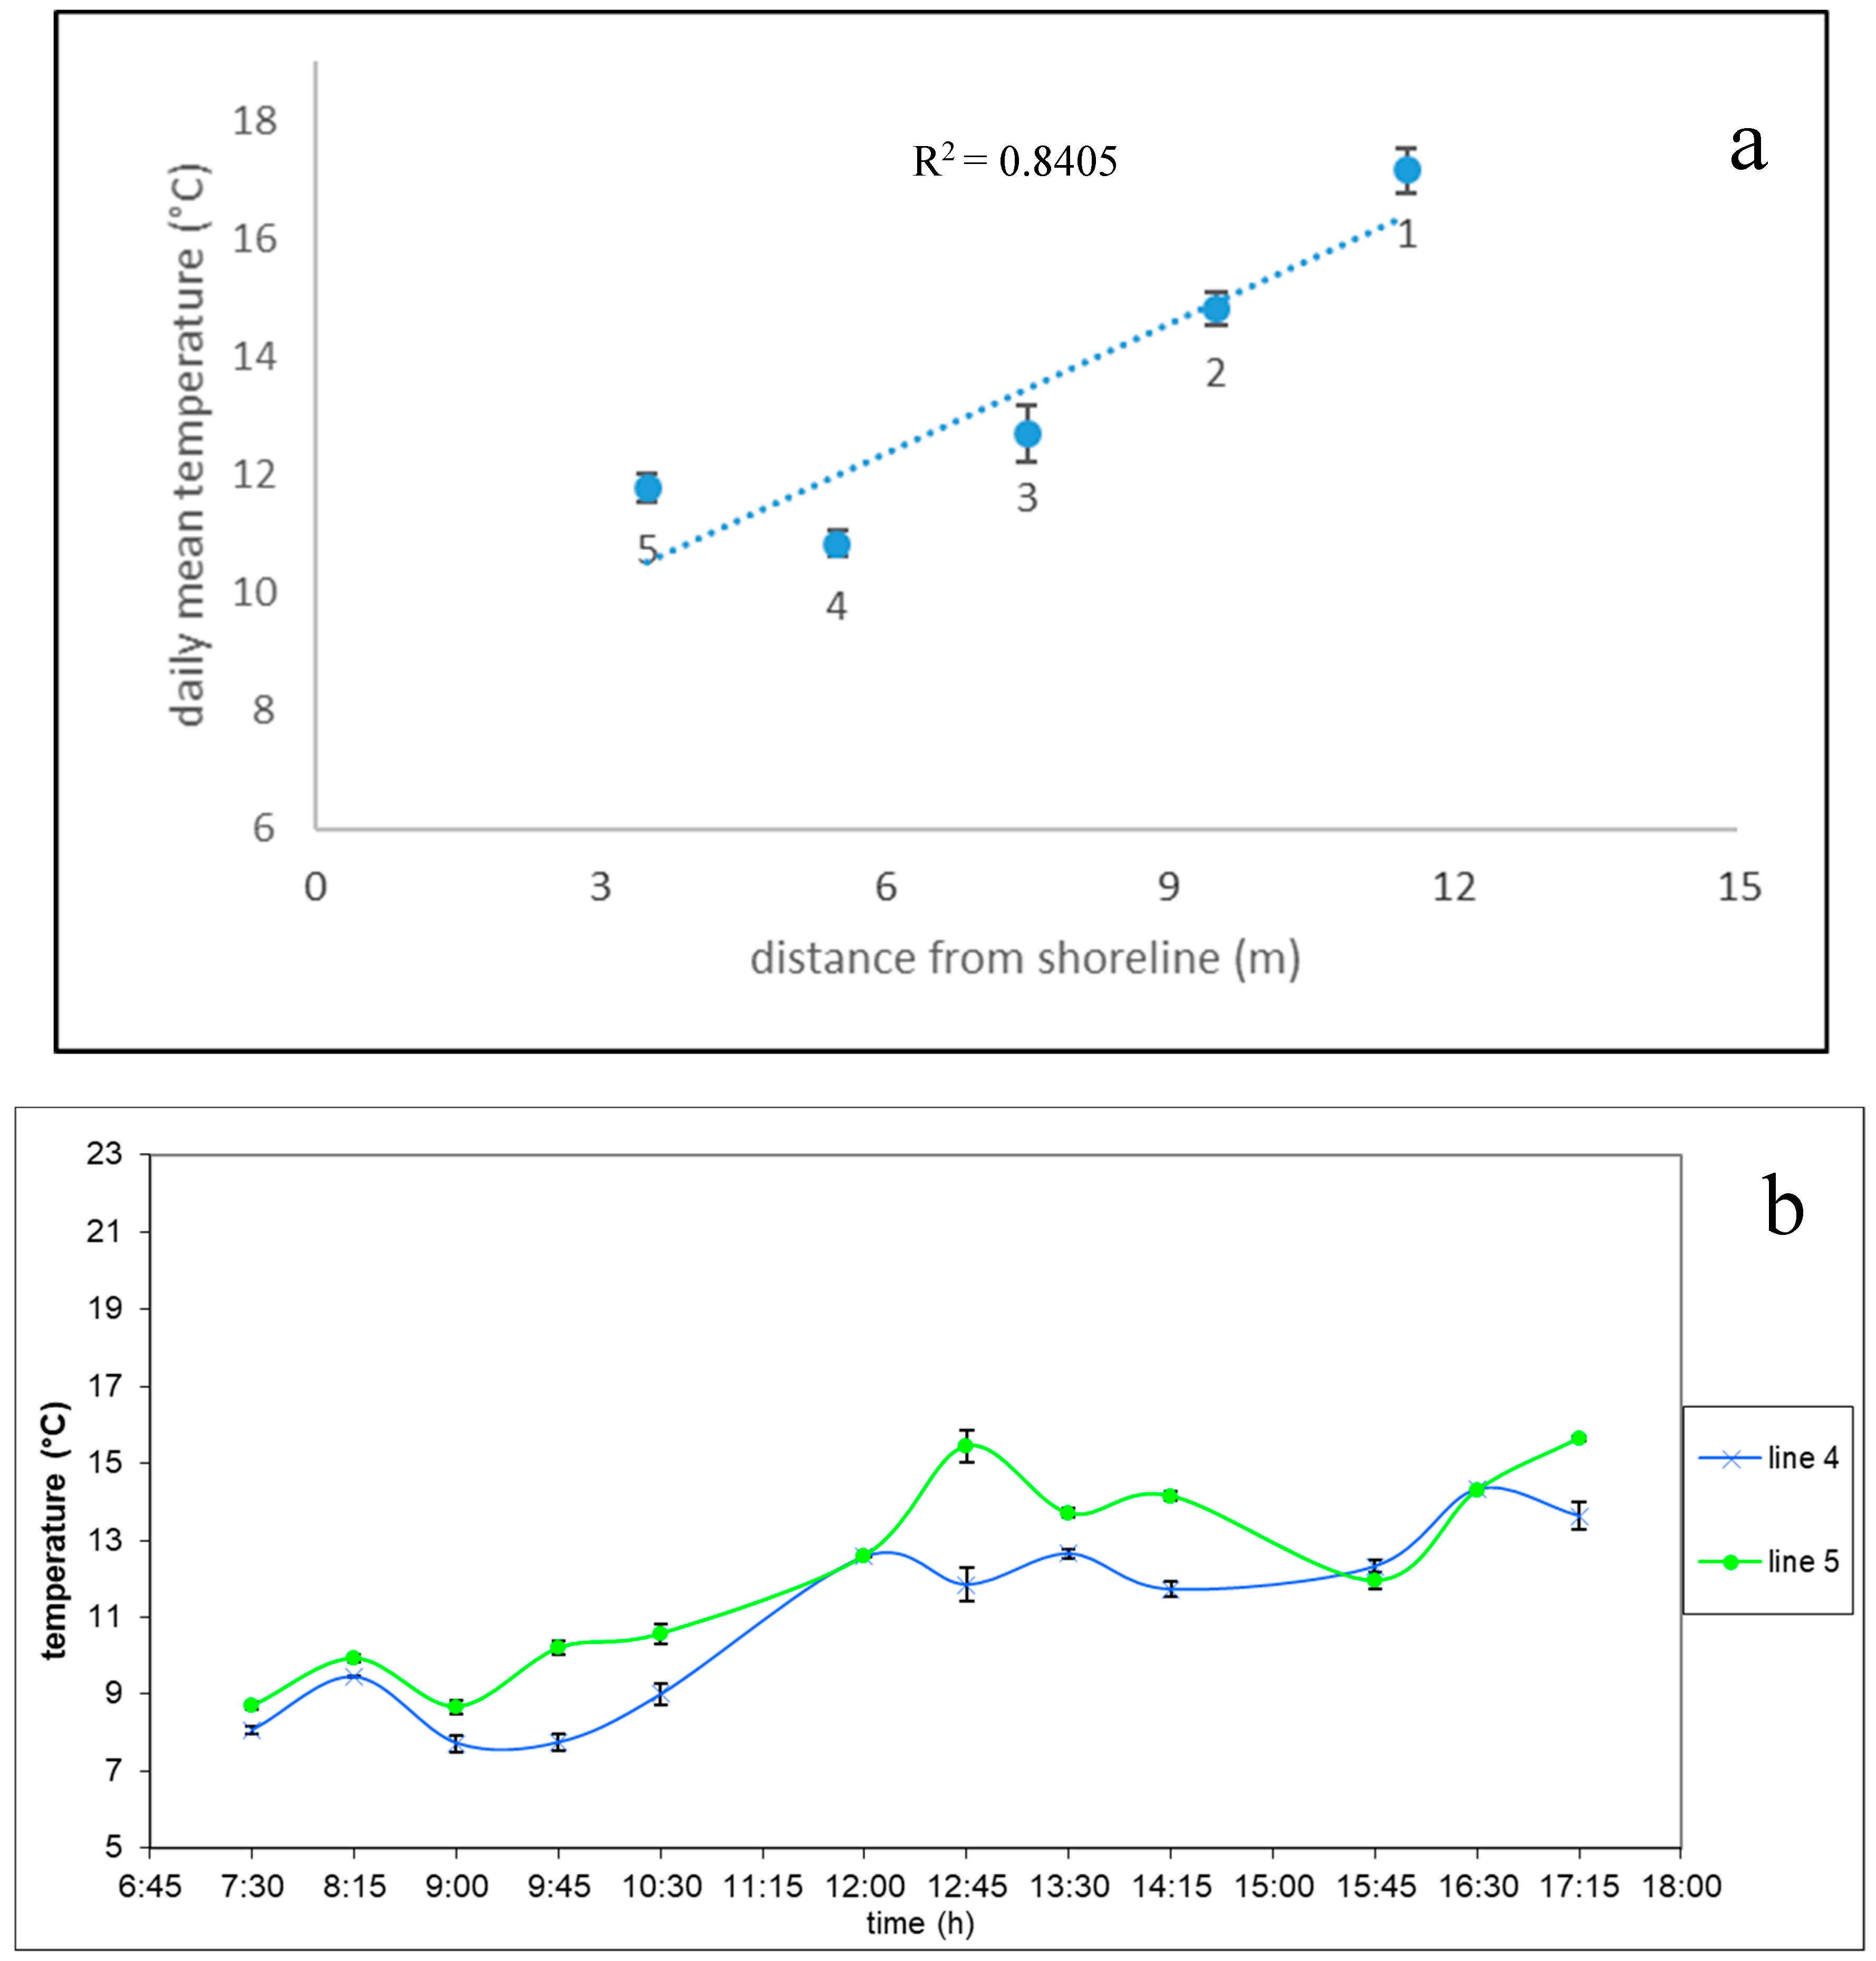
4.1. Temperature Change during the Day
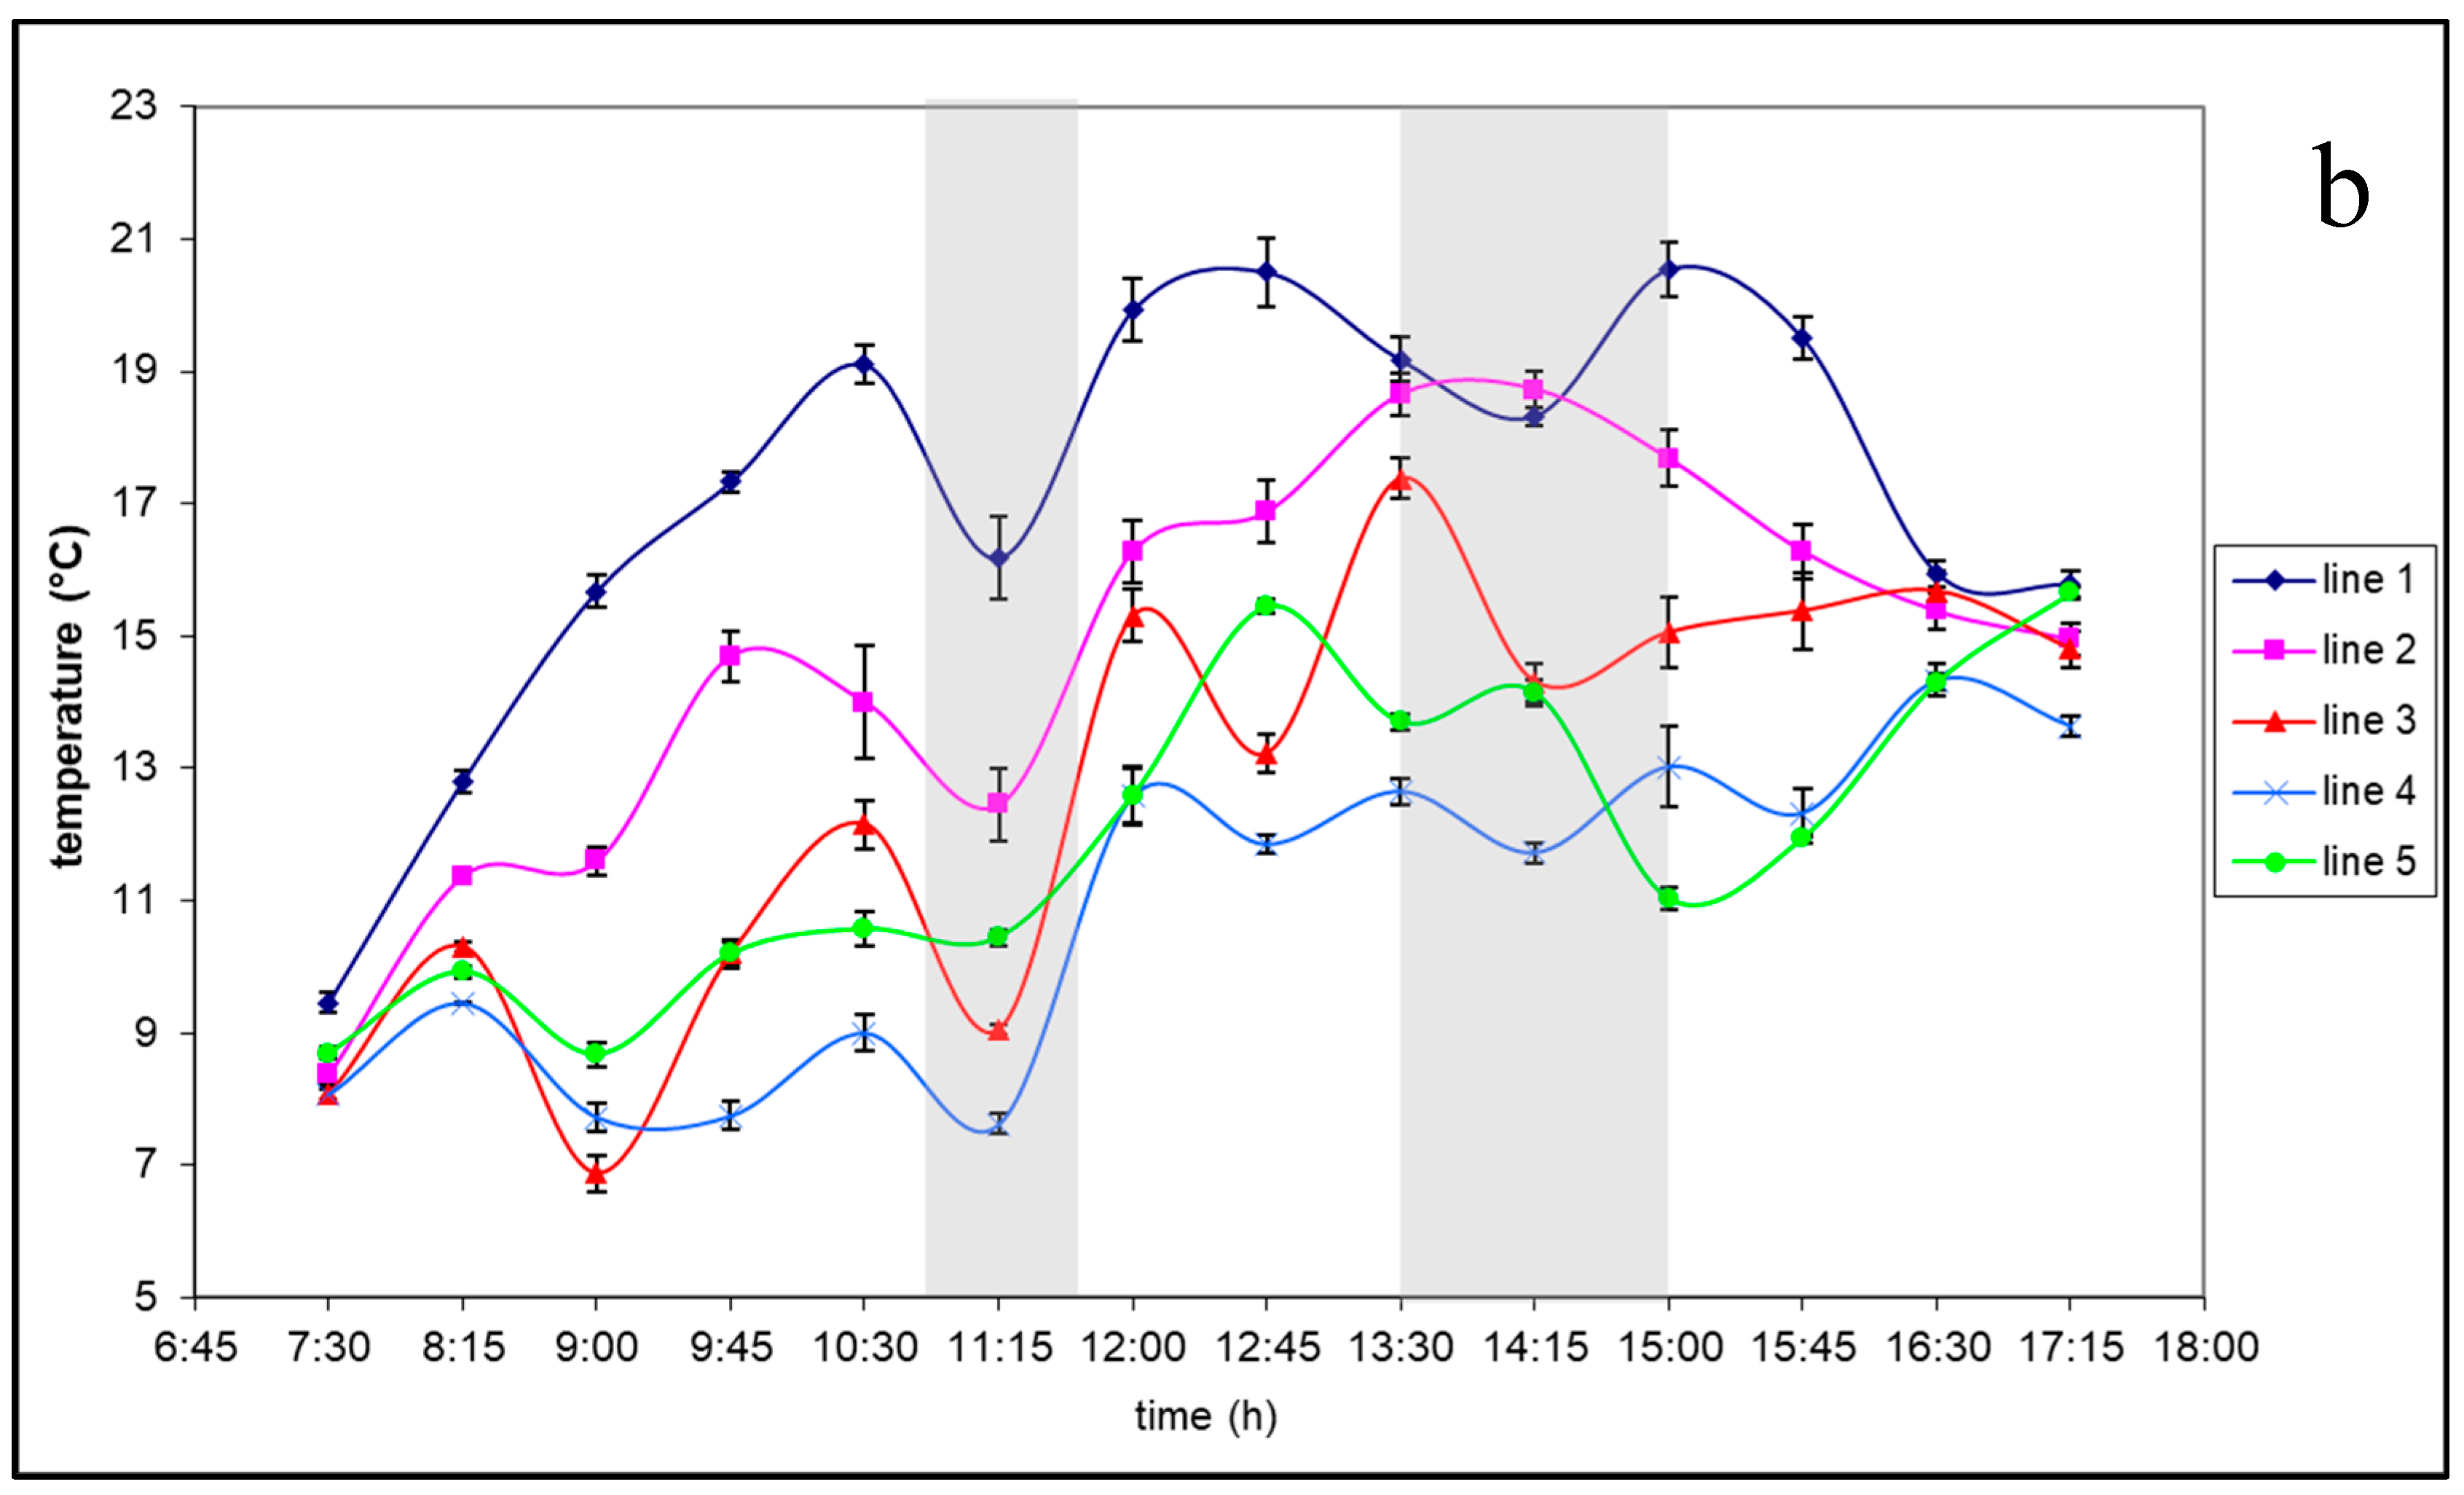
4.2. Temperature vs. Distance from Shoreline
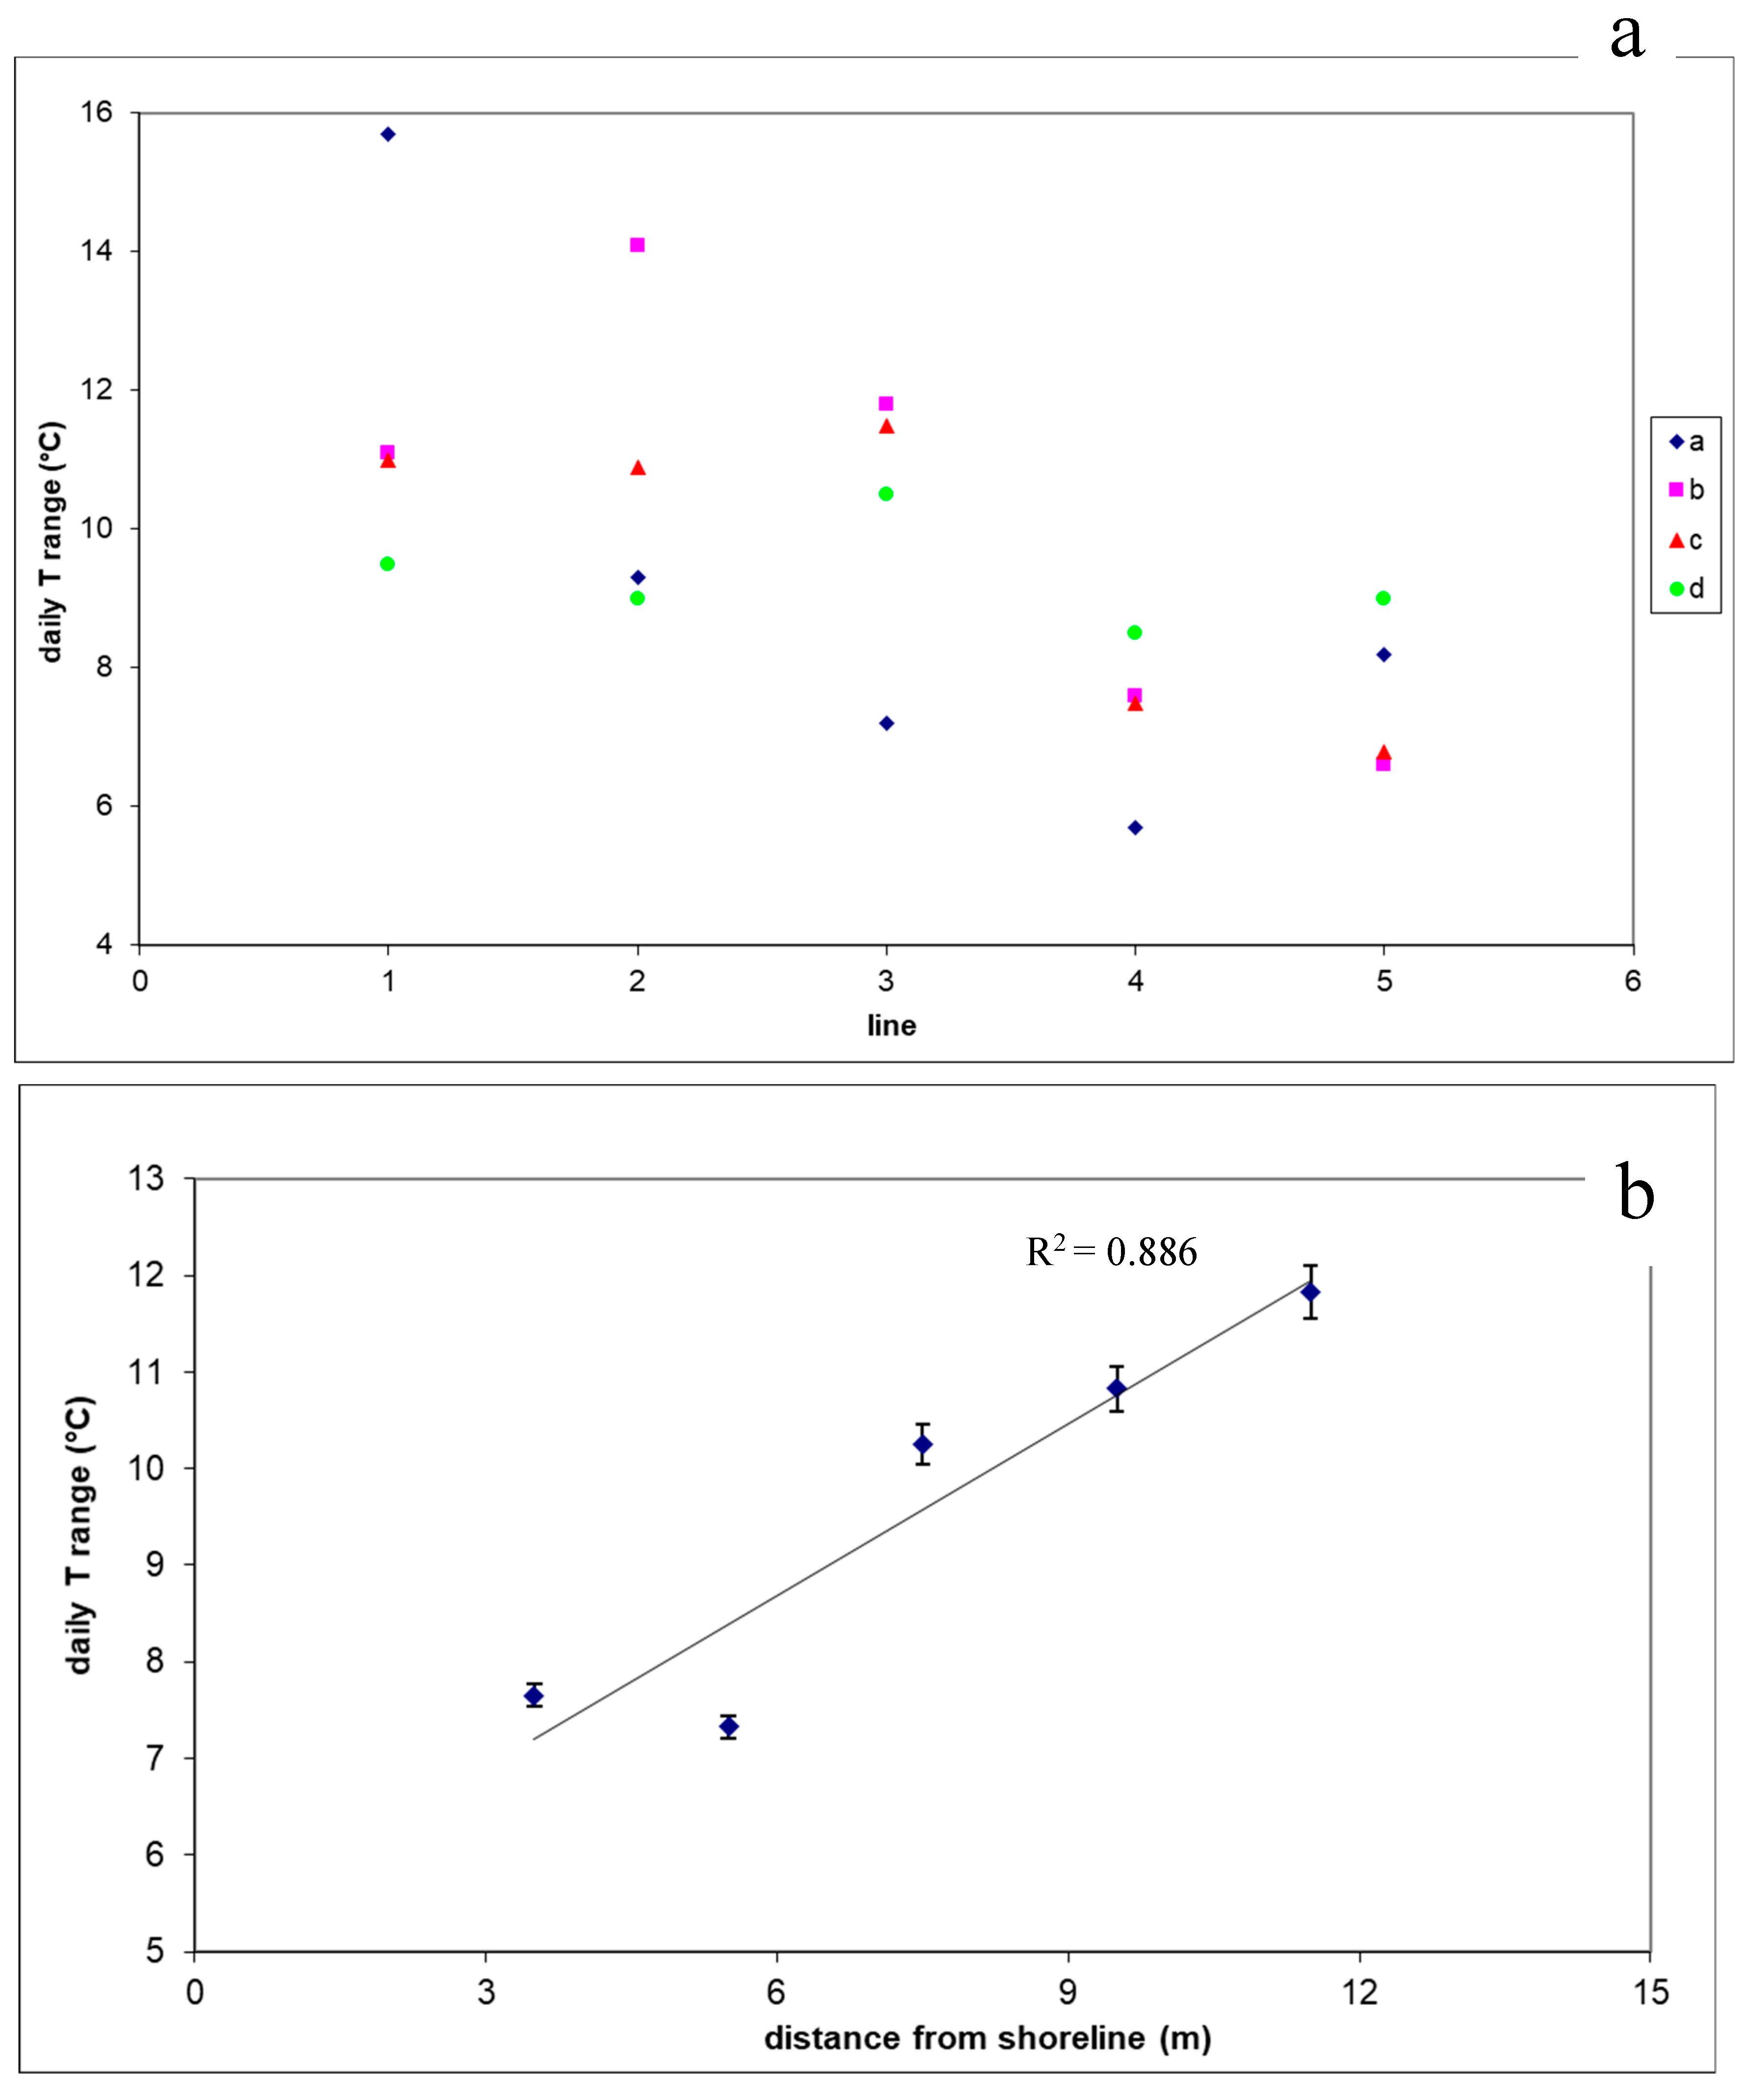
4.3. Temperature Range
5. Discussion
6. Conclusions
- -
- Overall temperature was minimum at dawn, reached its peak value shortly after sun culmination and then underwent a small-gradient decrease until sunset;
- -
- In connection with temporary sun-shading and wind gusts relevant short-term rock surface temperature fluctuations occurred;
- -
- The entity of measured daily temperature fluctuations is ca. one order of magnitude greater than air temperature fluctuations measured at the same elevation in the closest meteorological station;
- -
- Mean daily temperature proved to be positively correlated with distance from the shoreline;
- -
- The amplitude of daily temperature range progressively increased moving farther from the shoreline.
Author Contributions
Funding
Acknowledgments
Conflicts of Interest
References
- Huggett, R.J. Fundamentals of Gepmorphology; Routledge: London, UK; New York, NY, USA, 2007. [Google Scholar]
- Ollier, C. Weathering, 2nd ed.; Longman: London, UK, 1984; p. 270. [Google Scholar]
- McKay, C.P.; Molaro, J.L.; Marinova, M.M. High-frequency rock temperature data from hyper-arid desert environments in the Atacama and the Antarctic Dry Valleys and implications for rock weathering. Geomorphology 2009, 110, 182–187. [Google Scholar] [CrossRef]
- Hall, K. The role of thermal stress fatigue in the breakdown of rock in cold regions. Geomorphology 1999, 31, 47–63. [Google Scholar] [CrossRef]
- Hall, K.; Hall, A. Thermal gradients and rock weathering at low temperatures: Some simulation data. Permafr. Periglac. Process. 1991, 2, 103–112. [Google Scholar] [CrossRef]
- Hall, K.; Staffan-Lindgren, B.; Jackson, P. Rock albedo and monitoring of thermal conditions in respect of weathering: Some expected and some unexpected results. Earth Surf. Process. Landf. 2005, 30, 801–811. [Google Scholar] [CrossRef]
- Viles, H.; Ehlmann, B.; Cebula, T.; Wilson, C.; Mol, L.; Bourke, M. Simulating physical weathering of basalt on Earth and Mars. In Proceedings of the Goldsmiths Conference Abstracts 2007, Cologne, Germany, 19–24 August 2007; Available online: http://eprints.uwe.ac.uk/29466 (accessed on 20 June 2019).
- Sunamura, T. Geomorphology of Rocky Coasts; John Wiley Sons: Chichester, UK, 1992. [Google Scholar]
- Martini, P.I. Tafoni weathering with examples from Tuscany, Italy. Z. Für Geomorphol. 1978, 22, 44–67. [Google Scholar]
- Coombes, M.A.; Naylor, L.A. Rock warming and drying under simulated intertidal conditions, part II: Weathering and biological influences on evaporative cooling and near-surface micro-climatic conditions as an example of biogeomorphic ecosystem engineering. Earth Surf. Process. Landf. 2012, 37, 100–118. [Google Scholar] [CrossRef]
- Moses, C.; Robinson, D.; Barlow, J. Methods for measuring rock surface weathering and erosion: A critical review. Earth-Sci. Rev. 2014, 135, 141–161. [Google Scholar] [CrossRef]
- Coombes, M.A. Rock warming and drying under simulated intertidal conditions, Part I: Experimental procedures and comparisons with field data. Earth Surf. Process. Landf. 2011, 36, 2114–2121. [Google Scholar] [CrossRef]
- Coombes, M.A.; Viles, H.A.; Naylor, L.A.; La Marca, E.C. Cool barnacles: Do common biogenic structures enhance or retard rates of deterioration of intertidal rocks and concrete? Sci. Total Environ. 2017, 580, 1034–1045. [Google Scholar] [CrossRef]
- Yuan, R.; Kennedy, D.M.; Stephenson, W.J. Hourly to daily-scale microtopographic fluctuations of supratidal sandstone. Earth Surf. Process. Landf. 2018, 43, 3142–3151. [Google Scholar] [CrossRef]
- Kuenzer, C.; Dech, S. Thermal Infrared Remote Sensing. Sensors, Methods, Applications; Springer: Dordrecht, The Netherlands, 2013; p. 537. [Google Scholar] [CrossRef]
- Falorni, P. Macigno. Carta Geologica d’Italia 1:50.000-Catalogo delle formazioni. I; Servizio Geologico d’Italia: Rome, Italy, 2007; Volume 7, pp. 281–289. [Google Scholar]
- Pappalardo, M.; Maggi, E.; Geppini, C.; Pannacciulli, F. Bioerosive and bioprotective role of barnacles on rocky shores. Sci. Total Environ. 2018, 619–620, 83–92. [Google Scholar] [CrossRef] [PubMed]
- Pappalardo, M.; Cappietti, L.; Arozarena Llopis, I.; Chelli, A.; de Fabritis, L. Development of shore platforms along the NW Coast of Italy: The role of wind waves. J. Coast. Res. 2017, 33, 1102–1112. [Google Scholar] [CrossRef]
- Bland, J.; Rolls, D. Weathering: An Introduction to the Scientific Principles; Routledge: Oxford, UK, 1998; p. 261. [Google Scholar]
- Yatsu, E. The Nature of Weathering: An Introduction; Overseas distributor Maruzen Co: Sozosha, Tokyo, 1988; Volume 13, p. 624. [Google Scholar]
- Warke, P.A.; Smith, B.J. Short-Term Rock Temperature Fluctuations under Simulated Hot Desert Conditions: Some Preliminary Data; Robinson, D.A., Williams, R.B.G., Eds.; Rock Weathering and Landform Evolution; Wiley: Chichester, UK, 1994; pp. 57–70. [Google Scholar]
- McGreevy, J.P. Thermal rock properties as controls on rock surface temperature maxima, and possible implications for rock weathering. Earth Surf. Process. Landf. 1985, 10, 125–136. [Google Scholar] [CrossRef]
- Hall, K.; André, M.-F. New insights into rock weathering from high-frequency rock temperature data: An Antarctic study of weathering by thermal stress. Geomorphology 2001, 41, 23–35. [Google Scholar] [CrossRef]
- Gόmez-Heras, M.; Smith, B.J.; Fort, R. Surface temperature differences between minerals in crystalline rocks: Implications for granular disaggregation of granites through thermal fatigue. Geomorphology 2006, 78, 236–249. [Google Scholar] [CrossRef]
- McFadden, L.D.; Eppes, M.C.; Gillespie, A.R.; Hallet, B. Physical weathering in arid landscapes due to diurnal variation in the direction of solar heating. GSA Bull. 2005, 117, 161–173. [Google Scholar] [CrossRef]
- Coombes, M.A.; Naylor, L.A.; Viles, H.A.; Thompson, R.C. Bioprotection and disturbance: Seaweed, microclimatic stability and conditions for mechanical weathering in the intertidal zone. Geomorphology 2013, 202, 4–14. [Google Scholar] [CrossRef]
- Pappalardo, M.; Buehler, M.; Chelli, A.; Cironi, L.; Pannacciulli, F.; Qin, Z. Quantitative estimates of bio-remodeling on coastal rock surfaces. J. Mar. Sci. Eng. 2016, 4, 37. [Google Scholar] [CrossRef]


© 2019 by the authors. Licensee MDPI, Basel, Switzerland. This article is an open access article distributed under the terms and conditions of the Creative Commons Attribution (CC BY) license (http://creativecommons.org/licenses/by/4.0/).
Share and Cite
Pappalardo, M.; D’Olivo, M. Testing A Methodology to Assess Fluctuations of Coastal Rocks Surface Temperature. J. Mar. Sci. Eng. 2019, 7, 315. https://doi.org/10.3390/jmse7090315
Pappalardo M, D’Olivo M. Testing A Methodology to Assess Fluctuations of Coastal Rocks Surface Temperature. Journal of Marine Science and Engineering. 2019; 7(9):315. https://doi.org/10.3390/jmse7090315
Chicago/Turabian StylePappalardo, Marta, and Martina D’Olivo. 2019. "Testing A Methodology to Assess Fluctuations of Coastal Rocks Surface Temperature" Journal of Marine Science and Engineering 7, no. 9: 315. https://doi.org/10.3390/jmse7090315
APA StylePappalardo, M., & D’Olivo, M. (2019). Testing A Methodology to Assess Fluctuations of Coastal Rocks Surface Temperature. Journal of Marine Science and Engineering, 7(9), 315. https://doi.org/10.3390/jmse7090315