Article

Effects of Different Design Parameters on the Vortex Induced Vibration of FRP Composite Risers Using Grey Relational Analysis

1
School of Civil and Architectural Engineering, Shandong University of Technology, Zibo 255000, China
2
Department of Mechanical Engineering and Mechanics, Lehigh University, Bethlehem, PA 18015, USA
3
School of Resources and Environmental Engineering, Shandong University of Technology, Zibo 255000, China
4
Department of Geological Sciences, University of Texas at Austin, Austin, TX 78705, USA
*
Authors to whom correspondence should be addressed.
J. Mar. Sci. Eng. 2019, 7(7), 231; https://doi.org/10.3390/jmse7070231
Submission received: 28 May 2019 / Revised: 12 July 2019 / Accepted: 15 July 2019 / Published: 19 July 2019
(This article belongs to the Section Ocean Engineering)

Abstract

:
Risers are indispensable components of offshore platform systems that connect the wellhead at the sea bottom and to the platform at the sea surface and are normally made of high grade steel. Nowadays, fiber reinforced polymer (FRP) composite has been recognized as an attractive alternative riser material. Similarly to steel risers, FRP composite risers are also vulnerable to vortex induced vibration (VIV), and the effects of the composite makeup of these risers on VIV are the subject of the present investigation. Three risers (the tailored design composite riser, the composite riser with orthogonal reinforcements and the steel riser), three current velocities (0.36 m/s, 1.22 m/s and 2.13 m/s) and three water depths (12.5 m, 25 m and 37.5 m) are considered. In total, 9 study cases using orthogonal array (OA) sampling are investigated to study the risers’ VIV characteristics. The computational fluid dynamics (CFD) simulations with coupled fluid–structure interaction (FSI) are used to obtain the risers’ natural frequencies, global displacements, global stresses and the stress distributions in each composite lamina. The effect of 5 parameters (Etension, Ebending, L/Douter, tension force and current velocity) on the VIV amplitude in a cross flow direction of the risers is analyzed using Grey relational analysis (GRA) and the Grey relational grade of these parameters are: r 05 ( Velocity ) > r 03 ( L / D outer ) > r 04 ( Tension   Force ) > r 01 ( E t e n s i o n ) > r 02 ( E b e n d i n g ) .

1. Introduction

Risers are a critical component of offshore platform systems, and over 80% of offshore oil and gas accidents are related to the failure of these risers. The risers connect the wellhead (sea bottom) and the platform (sea surface) and can be divided into two main types: A drilling riser (which guides the drilling equipment and conducts the drilling fluid) and a production riser (which transports and exploits the gas and oil).
Presently, these risers are typically made from high grade steel. However, because of their extreme weight and problems with corrosion, fiber-reinforced polymer (FRP) composite risers have become an attractive alternative. Compared to steel, FRP composites have lower density, better mechanical properties, better corrosion and fatigue performance, and better thermal insulation [1,2]. In addition, the FRP composites can be tailored-designed by optimizing the fiber and matrix combinations, fiber orientations, the thicknesses of the liner and composite lamina, and the stacking sequence, according to the specific requirements, such as specific load conditions to achieve weight and thickness saving [3,4]. Therefore, using FRP composite risers to replace steel risers can economize the operational costs and maintenance costs of the whole offshore platform system and benefit the deeper sea exploitation [5]. However, it is noted that due to the material anisotropy, layered structure and multiple design variables of FRP composite riser, there are more complexities and challenges in the composite risers’ design.
Joint industry projects have investigated the feasibility and effectiveness of the concept of the composite riser since the 1980s. First, a glass and carbon fiber reinforced riser joint was fabricated and tested for its load bearing capacity by Institut Francais du Petrole and Aerospatiale of France [6]. Then, a carbon and E-glass fiber composite riser tube was tested by National Institute of Standards and Technology and Advanced Technology Programs in 1990s [7]. Norske Conoco AS and Kvaerner Oilfield Products replaced several steel riser joints with composite riser joints in the Heidrun platform for a 45-day test in 2001 [8]. In 2003, ConocoPhillips, Kvaerner Oilfield Products and ChevronTexaco conducted the Magnolia Project with pure carbon fiber reinforced composite risers [9,10]. Since 2007, the concept of a thermoplastic composite riser was investigated by Doris Engineering, Freyssinet, Total Soficar and Airborne Composite Tubulars [11]. In 2016, the UK national composites center announced that in the next few years, the composite riser reinforced by carbon and S2 glass fibers would be tested for practical engineering.
In addition to these joint industry projects, which focused mainly on the concept of feasibility and mechanical tests, the responses and performance under environmental and functional loads of composite risers were also studied. Chen et al. proved the performance improvement of composite risers over a pure metallic mandrel using a scaled-down test [12]. For the global response of composite risers, the maximum bending moment occurs on the bottom, followed by the joints at the sea surface and the tension force decreases with an increasing water depth in general [13,14,15,16,17,18]. These are much smaller than those in metal risers due to the lower overall weight and tension force required [15,16]. Previous studies confirmed that the structural composite body of the composite riser joint was likely to have an infinite fatigue life [14,15,16], but still may vary depending on the choice of constituent materials and manufacturing process. For the vortex induced vibration (VIV) of composite risers, it was found that, in comparison with a steel riser, the natural frequency of a composite riser with same conditions was larger [19] since the weight of composite riser was much smaller, but the value was still relatively small [14,15]. It was also found that larger tension force and higher structural damping reduced VIV-induced fatigue of composite risers [14,20]. Comprehensive studies on both local and global scale of composite and steel risers were conducted by Toh et al. [21] and Tan et al. [22] and a larger safety margin for composite risers were observed. Similarly, Omar et al. [19] found that the maximum VIV stresses of a composite riser were much smaller than those of a steel riser and a composite riser had a better fatigue life. Strakes and buoyancy modules were of benefit to the composite risers’ VIV responses, although a composite riser without VIV suppression had only a moderate VIV-induced fatigue damage [14,22]. In addition, the VIV of horizontal offshore pipelines were also investigated by experiments and the effects of sea-bottom proximity under a steady flow and/or wave-induced current on the fatigue life and VIV amplitude and frequency of metal horizontal pipelines were discussed [23,24].
In this paper, three riser types—the tailored design composite riser (riser 1), the composite riser with orthogonal reinforcements (riser 2) and the X80 steel riser (riser 3)—are considered for study along with their VIV characteristics. Three typical current velocities (0.36 m/s, 1.22 m/s and 2.13 m/s), which represent the 1 year winter storm, 100 year hurricane and 100 year loop current, are employed. In terms of water depths, 12.5 m, 25 m and 37.5 m, are selected. For this problem with three variables using three distinct levels, a full-factor sampling method requires 27 (33) samples. In contrast, the orthogonal array (OA) sampling method, which could provide a uniform coverage of the design space [25], only requires nine samples. An OA sample is a matrix of n rows and k columns with every element being one of the q symbols 0,…, q − 1 and its notation is OA (n, k, q, t), where n is the row number of the array which depends on both the distinct level number, q, which means that q points are included for each design variable, and the strength level number, t, and k the number of design variables [26]. More specifically, in this study, the OA program (bose) is employed as OA (q2, k, q, 2) [26]. Computational fluid dynamics (CFD) simulations with coupled fluid–structure interaction (FSI) are used to study the VIV characteristics of FRP composite risers’, which is one of three basic different methods. The three basic methods are: Semi-empirical models, Navier-Stokes models (or CFD methods) and simplified wake models [27]. For semi-empirical models, the three main types were included: (1) The wake–oscillator models, in which common terms in equations were used to couple the body and the wake oscillations; (2) the single degree-of-freedom (SDOF) models, in which a single dynamic equation with aeroelastic forcing terms on the right-hand side was employed; and (3) the force–decomposition models which depended on the certain components of the forces on the structure from experimental results [28]. For CFD methods, the flow field around the cylinder is computed by solving numerically the unsteady Navier-Stokes equations [27]. For simplified wake models, the flow forces were modelled using the simplified models and a strip theory was used to reconstruct the 3-dimensionality [27].The significant sequence of different parameters on the risers’ VIV characteristics are explored using the Grey relational analysis (GRA) which is a small sample, a small amount of calculation and no requirement for independency [29]. More specifically, GRA is utilized to determine the relational grade between the reference sequence (the VIV amplitude in cross flow direction) and a given set of parameters (Etension, Ebending, L/Douter, tension force and current velocity). Then, the best one can be found by comparing the resultant relational grades, i.e., GRA can be regarded as a measure of similarity for finite sequences. The main procedure of GRA includes: (1) the Grey relational generation; (2) the Grey relational coefficient calculation; and (3) the Grey relational grade calculation. When a variable sequence has the highest Grey relational grade, it is the most important one [30].

2. Materials and Methods

2.1. Materials

The conventional steel riser (riser 3) is made from X80 steel as a benchmark. For the composite riser, AS4-epoxy was selected for the composite layers while titanium alloy was used for the inner liner. More specifically, AS4 is a type of high strength carbon fiber with elastic modulus of 235 GPa and an ultimate strength of 3590 MPa in the fiber direction. The thermoset epoxy which has good mechanical properties and well-suited for filament winding was selected as the matrix. The fiber volume fraction of AS4-epoxy composite is 0.6. The material properties of these materials are presented in Table 1 and Table 2. Notably, for steel and titanium, the bilinear kinematic hardening model was considered while for AS4-epoxy, an elastic model was used.

2.2. Riser Geometries

Table 3 shows the geometries of the risers considered in this study. The internal diameters (IDs) of all three risers were fixed at 250 mm, while the thickness of each riser was determined by the previous studies [4,17,18,31] to accommodate all the local and global loads considered. More specifically, the thicknesses for risers 1, 2 and 3 were 30.5 mm, 39.5 mm and 25 mm, respectively. Both FRP composite risers, 1 and 2 (45.7 kg/m and 59.6 kg/m, respectively) achieved significant weight saving compared to the steel riser (169 kg/m) and the FRP composite riser 1 even led to a 23.3% weight reduction to the conventional FRP composite riser 2 [4]. These geometries of composite risers 1 and 2 have been verified by KIM [15] and Amaechi [3].
In terms of the length for the risers, 12.5 m, 25 m and 37.5 m are considered.

2.3. Flow Situation and Forces

In order to keep the risers’ vertical position, the top tension forces, which are 1.5 and 2 times of the structural weight for steel and composite risers, are applied. The gravity and buoyancy loads are determined by the geometry and material density of each riser.
The 1 year winter storm (0.36 m/s), 100-year hurricane (1.22 m/s) and 100-year loop current (2.13 m/s) situations in Gulf of Mexico [15,32] were employed in this study based on the requirement of API Recommended Practice [33]. For the sea water, the density was 1024 kg/m3 and the kinematic viscosity coefficient υ was 1.06 × 10⁻⁶. The Reynolds number (Re) and turbulent intensity (I) are calculated by Equations (1) and (2).
Re = UD υ  
I = 0.16 Re ( 1 / 8 )

2.4. OA Sampling

The study cases in this paper were determined by OA sampling (bose) [26] based on the riser types, current velocities and water depths (Table 4).

2.5. Finite Element (FE) Modeling

The ANSYS Workbench 17.1 was utilized for the study of vortex induced vibration (VIV) for the three different risers with three different current velocities and three different water depths. Dell Precision 7810 Workstation was used for the simulation which has Intel Xeon CPU E5−2640 v4 @ 2.40 GHz (×2) with 20 cores and 40 threads and RAM of 32 GB. The computing time for cases 1 to 9 were 27 h, 90 h, 27 h, 65 h, 31 h, 31 h, 16 h, 7 h and 43 h, respectively.
First, a pre-stress modal analysis was used to analyze the natural frequencies of all the risers. More specifically, the modules of Static Structural and Modal in ANSYS are required for the steel riser (riser 3) while the modules of ACP (Pre), Static Structural and Modal in ANSYS are involved for the FRP composite risers (risers 1 and 2).
The modules of geometry, ACP (Pre), transient structural, fluid flow, ACP (Post) and system coupling [34,35] were then employed to achieve the VIV simulation considering the fluid structure interface (FSI) for the composite risers 1 and 2. For the steel riser 3, ACP (Pre) and ACP (Post) were not needed.
The layered-structure method (LSM) [34], which could present the results in each composite layer, was employed for the FRP composite riser simulation. More particularly, in the module of ACP (Pre), the material properties, the thicknesses and layer numbers of composite laminate and liner, the fiber orientations and the stacking sequences of laminate were imported. In the ACP (Post), the stress and deformation response of every composite laminae can be obtained.
Next, the geometry and material data of FRP composite riser in ACP (Pre) were transferred to the module of transient structural. This is utilized to simulate the dynamic response of the risers. The gravitational acceleration, top-tension force, buoyancy, the end support condition (simple support at the top end, the fixed support at the bottom end) and the fluid solid interface were employed here and the time history of displacement and global stress distribution of the risers can be obtained as well in this module. The 12 elements/m in the axial direction and 20 elements in the hoop direction were employed for the risers. In the though-thickness direction, 18 elements, 22 elements and 1 element were employed for risers 1, 2 and 3, respectively (Figure 1a). The number of elements in though-thickness direction was set automatically as the number of layers of the structure from the ACP (Pre) module.
The simulation of flow conditions was achieved in the module of fluid flow (Fluent) with the input of flow density, kinematic viscosity coefficient, flow velocity, turbulent intensity, etc. The flow dimension was set as 20D (X-direction) × 10D (Y-direction) × water depth (Z-direction), where D is the outside diameter of the risers, X, Y and Z directions are in-line flow direction, the cross flow direction and the depth direction, respectively. The large eddy simulation (LES) with bounded second order implicit transient formulation, which reduces the computational cost with acceptable accuracy, was chosen as the mathematical model for turbulence in computational fluid dynamics (CFD). The LES was used here to give the numerical solution to the Navier–Stokes equations for turbulent flow. This allows the largest and most important scales of the turbulence to be resolved and is suitable for the riser with medium length [27], which allows larger time-steps and coarser mesh sizes than direct numerical simulation (DNS) but needs more computational costs than the Reynolds-averaged Navier–Stokes equations (RANS). Also, the fluid grid of 5D × 5D area around the riser was refined and set as the dynamic mesh zone with smoothing and re-meshing methods. In this study, the number of elements for fluid zone varied from 0.56 million to 2 million depending on the mesh size and flow zone size (Figure 1b).
The module of system coupling was employed to achieve the data transfer between the transient structural and fluid flow, i.e., the two-way fluid structure interaction (FSI).
This analysis procedure and models selected have been proved by previous studies [34,35] and the differences here were the load conditions which were current flows with different velocities, different top tension forces and buoyance, and the different geometries of FRP composite risers.

3. Results and Discussion

In this section, the VIV responses of all 9 study cases are presented and discussed, and the Grey relational grade of the 5 parameters (Etension, Ebending, L/Douter, tension force and current velocity) on the amplitude of VIV in cross flow direction for the risers is determined.

3.1. Natural Frequencies

When the natural frequency of a riser is close to the vortex shedding frequency, lock-in might occur, which would lead to fatigue failure of the riser. Using Equation (3), the vortex shedding frequency can be calculated.
f s = S t U D
where, St is Strouhal number, D is the outside diameter of riser and U is the flow velocity. According to the relationship between Re and St [36], the St are 0.2 for study cases 1, 4 and 7, 0.21 for study cases 2, 5 and 8 and 0.22 for study cases 3, 6, and 9.
Also, the possibility of a riser’s lock-in can be estimated using reduced velocity Ur (Equation (4)). Lock-in may occur, when Ur ranges 4–8 [36].
U r = U f n D
The natural frequencies, vortex shedding frequencies, and reduced velocities are listed in Table 5.
From Table 5, it can be seen that the natural frequencies of risers 1 and 3 in cases 3 and 9 are close to their vortex shedding frequencies, and similarly the reduced velocity Ur in these cases are close to the range of 4–8. Hence, lock-in might occur for these two cases. However, Equation (3) for vortex shedding frequency and Equation (4) for reduced velocity are based on the rigid cylinder without deformation and fluid structure interaction.

3.2. Time History of Displacements and von Mises Stresses for All Study Cases

The time history of displacements in the in-line flow direction (X) and cross flow direction (Y) for all study cases are plotted in Figure 2 and Figure 3, respectively. For all the study cases, the results of a typical location, i.e., the middle point of each riser, are presented.
From Figure 2, the in-line flow direction (X) displacements maintain at a relatively stable value and vibrate slightly after the initial growth for all cases. In case 3, the displacement of the middle point of the riser 1 reached 0.43 m, which is the maximum. The displacement of the middle point of riser 2 in case 5 reached 0.07 m. In cases 6 and 9, the maximum displacements were approximately 0.03 m and 0.02 m, respectively. For all the other cases, the maximum displacements were well below 0.0004 m.
As can be seen in Figure 3, the cross-flow direction (Y) displacements in all cases demonstrate continuous vibrations. Similarly to the displacements in the in-line flow direction, the amplitude of the middle point of riser 1 in case 3 in the cross flow direction was the maximum (9.01 × 10⁻² m). Then, the amplitude of riser 2 in case 5 was 1.28 × 10⁻² m. For all the other cases, the maximum amplitudes of the middle points of risers were well below 7.1 × 10⁻³ m.
The time history of von Mises stress for all study cases is plotted in Figure 4. For all the study cases, the results of a typical location, i.e., the fixed bottom end of each riser, are shown. Note that, for cases 1 and 7, which are dominated by tension forces, the von Mises stresses are not the maximum at the bottom end.
Figure 4 indicates that the time history of von Mises stresses has the similar change trend to displacement in the cross flow direction for each case. In case 3, the maximum von Mises stress of the bottom end of the riser 1 was 1.3 × 10⁸ Pa, followed by riser 3 in case 9 (3.07 × 10⁷ Pa). In cases 5 and 2, the maximum von Mises stresses were approximately 2.37 × 10⁷ Pa and 2.24 × 10⁷ Pa, respectively. For all the other cases, the maximum von Mises stresses were below 8.1 × 10⁶ Pa.

3.3. Maximum Displacements and Von Mises Stresses for All Study Cases

Similarly, the time history of displacements in the in-line flow direction (X), the cross flow direction (Y) and von Mises stresses at all locations of risers can be obtained. Based on these data, the maximum displacements and stresses at different locations of risers are presented in Figure 5, Figure 6, Figure 7, Figure 8 and Figure 9.
Figure 5a–c shows the maximum displacements in the in-line flow direction (X) for the water depths of 12.5 m (cases 1, 6 and 8), 25 m (cases 2, 4 and 9) and 37.5 m (cases 3, 5 and 7), respectively.
From Figure 5, deeper water depth results in larger displacement in general. However, cases 4 and 7 do not follow this rule. Also, it is clear that the maximum displacements in the in-line flow direction (X) occurs above the middle point in all the study cases, which indicates the simple support (top end) leads to larger displacement compared with the fixed support (bottom end). According to the procedure of creating Figure 5, the maximum displacements (X) and the location and time they occur for study cases 1–9 were 2.01 × 10⁻⁴ m (−5 m, 56.4 s), 3.03 × 10⁻² m (−11 m, 14.8 s), 4.44 × 10⁻¹ m (−16.5 m, 41.2 s), 1.27 × 10⁻³ m (−11 m, 55.6 s), 7.18 × 10⁻² m (−16.5 m, 33 s), 3.39 × 10⁻³ m (−5.5 m, 36.6 s), 3.23 × 10⁻³ m (−16.5 m, 57 s), 5.07 × 10⁻⁴ m (−5 m, 51.4 s) and 2.42 × 10⁻² m (−10 m, 46.6 s), respectively.
Figure 6a–c shows the maximum displacements in the cross flow direction (Y) for the water depths of 12.5 m (cases 1, 6 and 8), 25 m (cases 2, 4 and 9) and 37.5 m (cases 3, 5 and 7), respectively.
As can be seen in Figure 6, it is also clear that the maximum amplitude in the cross flow direction (Y) occurs above the middle point in all the study cases, which indicates the simple support (top end) leads to larger displacement compared with the fixed support (bottom end). According to the procedure of creating Figure 6, the maximum amplitudes in the cross flow direction and the location they occur for study cases 1–9 were 7.01 × 10⁻⁵ m (−5 m), 7.62 × 10⁻³ m (−10 m), 9.38 × 10⁻² m (−16.5 m), 4.42 × 10⁻⁴ m (−11 m), 1.31 × 10⁻² m (−16.5 m), 1.36 × 10⁻³ m (−5 m), 3.72 × 10⁻⁴ m (−15 m), 1.40 × 10⁻⁴ m (−5 m) and 7.00 × 10⁻³ m (−10 m), respectively. It has to be noted that the maximum and minimum displacements in the cross flow direction occur at different times and therefore, no time is measured for the maximum amplitude.
Comparing the results in Figure 5 and Figure 6, the in-line displacement is much larger than the cross flow displacement. Based on the time when the maximum in-line displacement occurs for all cases, Figure 7 presents the total displacement distributions of all cases at those specified times. More specifically, the maximum total displacements for cases 1–9 were 2.33 × 10⁻⁴ m (56.4 s), 3.06 × 10⁻² m (14.8 s), 4.44 × 10⁻¹ m (41.2 s), 1.31 × 10⁻³ m (55.6 s), 7.20 × 10⁻² m (33 s), 3.40 × 10⁻³ m (36.6 s), 3.26 × 10⁻³ m (57 s), 5.13 × 10⁻⁴ m (51.4 s) and 2.42 × 10⁻² m (46.6 s), respectively.
Figure 8a–c shows the maximum von Mises stresses for the water depths of 12.5 m (cases 1, 6 and 8), 25 m (cases 2, 4 and 9) and 37.5 m (cases 3, 5 and 7), respectively.
It is noted that only the failure of steel risers (cases 7, 8 and 9) can be verified by the von Mises stresses. Based on the American Bureau of Shipping standard [37], 67% of the yield stress of X80 steel (371 MPa) is the allowable stress. Therefore, the steel risers studied in this paper would not fail for all cases 7 (6.6 MPa), 8 (3.5 MPa) and 9 (30.7 MPa). In contrast, von Mises stresses of FRP composite risers 1 and 2 cannot be utilized to verify the failure because the global stresses cannot represent the stress distributions in each composite laminae. The global stress distributions of composite risers 1 and 2 in Figure 8 are only used to determine the locations and time of the maximum stresses and these data can be used to verify the stress failure in each composite layer in Section 3.4.
For all study cases, the maximum von Mises stresses occur at bottom end of all risers, except in case 1 (−2.5 m) and case 7 (top end). In the middle parts above the middle point are the locations where second maximum von Mises stresses happen. In the point which is approximately 25% of the riser length to the bottom end, the minimum von Mises stresses occur. This is because the fixed support at the bottom leads to maximum stress of the bending situation, and the middle parts have the largest deformation which also results in large stresses. In case 1, the tension force and vertical deformation together lead to maximum stresses at approximately −2.5 m, while in case 7, the tension force is dominant and the maximum stresses occur at the top end. For the part which is approximately 25% of the riser length to the bottom end, a comparatively small deformation happens and also relatively far from the fixed support, therefore, the minimum von Mises stresses occur.
Based on the time when the maximum von Mises stresses occur for all cases, Figure 9 presents the von Mises stress distributions of all cases at those specified times. More specifically, the maximum von Mises stresses for cases 1–9 were 2.68 MPa at −2.5 m (56.4 s), 23.67 MPa at bottom end (15 s), 135.21 MPa (42.2 s), 3.00 MPa at bottom end (30.6 s), 23.37 MPa at bottom end (33 s), 8.16 MPa at bottom end (37 s), 6.02 MPa at top end (35 s), 3.36 MPa at bottom end (26.4 s) and 23.37 MPa at bottom end (46.6 s), respectively.

3.4. Lock-In Phenomenon for Study Case 3

As mentioned in Section 3.1, the lock-in likely occurs for study case 3. Further, it is confirmed by riser 1 in case 3 which has the largest vibration amplitudes and stresses. In this section, the fast Fourier transform (FFT) is utilized to find out the vortex shedding frequency and the vibration frequency of riser 1 in case 3 to analyze the lock-in” phenomenon.
Figure 10 shows the movement track of riser 1 at 18.8 m under the water surface in case 3. From Figure 2, the stable vibration occurs after 10 s (the displacement in flow direction is comparatively stable at 0.44 m (Figure 5), while the maximum amplitudes in cross flow direction is about 0.094 m (Figure 6)), and the dominant vibration frequency 0.996 Hz of riser 1 can be obtained using FFT (see Figure 11).
Similarly, the vortex shedding frequency (0.996 Hz) can be calculated using FFT as well. The result is shown in Figure 12. The data used here for FFT is collected using the magnitude of the velocity at 18.8 m under the water surface in the cylinder wake.
From Table 5 and Figure 11 and Figure 12, the natural frequency of riser 1 in case 3 is 0.94 Hz. The vibration frequency of riser 1 in case 3 is 0.996 Hz, which equals the vortex shedding frequency and thereby indicates the occurrence of the lock-in phenomenon. Here, it is noted that the vortex shedding frequency obtained using FFT is different from that in Table 5, because in Table 5 the vortex shedding frequency calculated by Equation (3) is based on the rigid cylinder without deformation and fluid structure interaction.

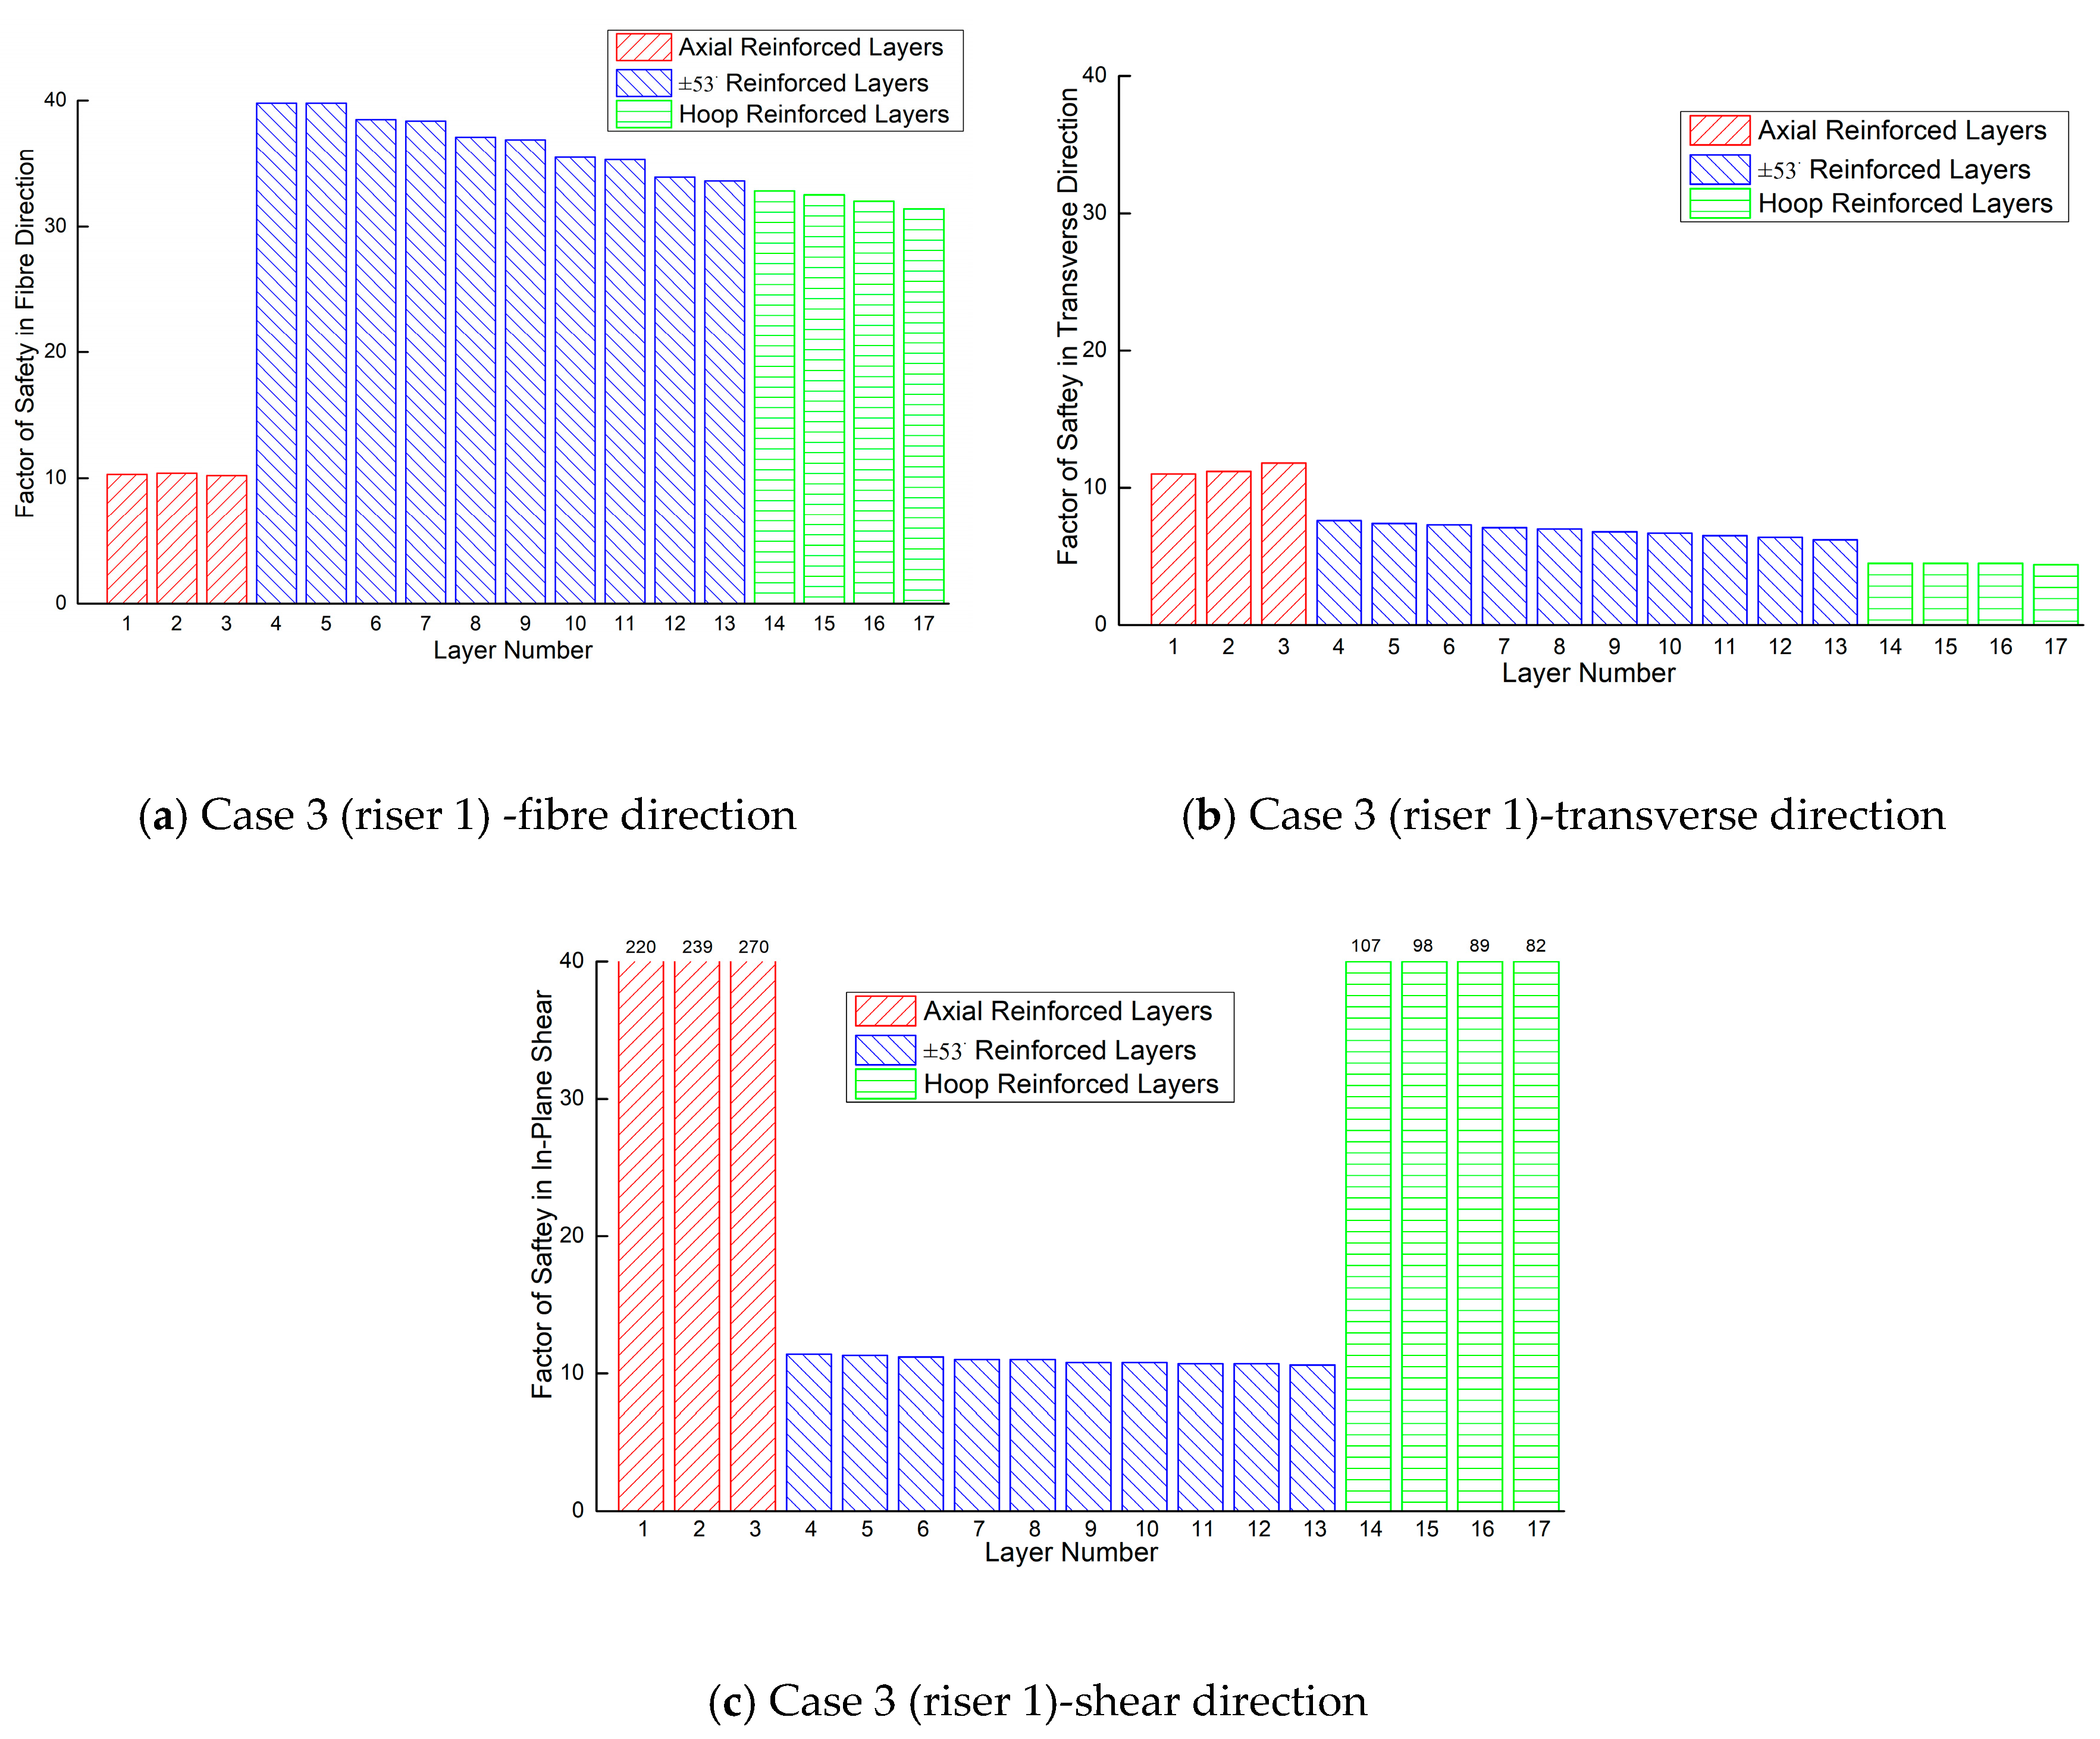
3.5. Stress Distributions in Every Layers for Study Case 3

For each case, there are two significant instances in time, i.e., the times at which the maximum stress and the maximum displacement occur. Comparing the stresses in FRP composite layers in these two time points, the maximum stresses in every lamina of FRP composite risers (risers 1 and 2) are obtained and the factor of safety (FS), which is defined as the allowable strength/stress, are illustrated in Figure 13. In this paper, the maximum stress failure criterion [38] considers failures in the fiber direction, transverse direction and in-plane shear separately for all composite layers. The minimum FS required are 1.53 for composite layers and 1.68 for titanium liners [39].
The worst scenario (study case 3) can be used as an example. The maximum von Mises stress of titanium liner is 127.8 MPa and FS = 6.88. The minimum FSs in the fiber, transverse and shear directions of all the composite layers in case 3 are shown in Figure 10. The minimum FS(s) in the fiber direction, the transverse direction and shear direction are 10.22 (layer 3), 4.44 (layer 17) and 10.65 (layer 13), respectively. Therefore, in case 3, the in-plane transverse stresses are the most critical stresses even though they are still far away from the failure stresses.

3.6. Grey Relational Analysis of Multiple Parameters

The parameters considered in this paper that affect the VIV amplitude in cross flow direction of the risers are Etension, Ebending, L/Douter, tension force and current velocity, listed in Table 6. It is noted that, for a composite laminate, there can be a significant difference between its effective moduli in tension and bending (Etension and Ebending). In this paper, Etension is calculated based on the 3D effective properties of the composite tube using the 3D laminate property theory [40,41]. Ebending is evaluated using static analyses of the FEA models of the selected lay-ups with Solid186 (layered brick) under bending situations. More specifically, the FEA model for calculating Ebending is a cantilever pipe (30 m) under a transverse force of 1000 N and therefore, the E bending P L 3 3 I Δ , where, P is the transverse force, L is the pipe length, I is the moment of inertia, and Δ is tip displacement of the pipe.
In this paper, the Grey relational analysis (Equations (5)–(12)) is utilized to determine the Grey relational grade of the 5 parameters on the amplitude of VIV in cross flow direction for the riser.
{ X 0 = { X 0 ( 1 ) , X 0 ( 2 ) , , X 0 ( 9 ) } X 1 = { X 1 ( 1 ) , X 1 ( 2 ) , , X 1 ( 9 ) } X 2 = { X 2 ( 1 ) , X 2 ( 2 ) , , X 2 ( 9 ) } X 3 = { X 3 ( 1 ) , X 3 ( 2 ) , , X 3 ( 9 ) } X 4 = { X 4 ( 1 ) , X 4 ( 2 ) , , X 4 ( 9 ) } X 5 = { X 5 ( 1 ) , X 5 ( 2 ) , , X 5 ( 9 ) }
where, X0 is original (reference) data and X1 to X5 are the comparative series. More specifically, X0 is the VIV amplitude in cross flow direction; X1 is the Etension; X2 is the Ebending; X3 is the L/Douter; X4 is the tension force; X5 is the current velocity, and 1–9 in brackets are the study cases.
The detailed values for X0 to X5 are presented below:
{ X 0 = { 7.01 × 10 5   ,   7.66 × 10 3 ,   9.42 × 10 2 ,   4.42 × 10 4 ,   1.31 × 10 2 ,   1.37 × 10 3 ,   3.76 × 10 4 ,   1.41 × 10 4 ,   7.01 × 10 3 } X 1 = { 40.5 ,   40.5 ,   40.5 ,   59.1 ,   59.1 ,   59.1 ,   207 ,   207 ,   207 } X 2 = { 35.7 ,   35.7 ,   35.7 ,   56.8 ,   56.8 ,   56.8 ,   207 ,   207 ,   207 } X 3 = { 40 ,   80 ,   121 ,   76 ,   114 ,   38 ,   125 ,   42 ,   83 } X 4 = { 11200 ,   22400 ,   33600 ,   29183 ,   43774 ,   14591 ,   93463 ,   31154 ,   62309 } X 5 = { 0.36 ,   1.22 ,   2.13 ,   0.36 ,   1.22 ,   2.13 ,   0.36 ,   1.22 ,   2.13 }
For X0 to X5, the units are different and their values have a very large range. Hence, these sequences are normalized to comparability sequences using a process of Grey relational generation (Equation (6)). Here, n = 1 9 X i ( n ) ¯ is the mean value of Xi(n), n   (1,9).
{ Y 0 = { Y 0 ( 1 ) , Y 0 ( 2 ) , , Y 0 ( 9 ) } = { X 0 ( 1 ) n = 1 9 X 0 ( n ) ¯ , X 0 ( 2 ) n = 1 9 X 0 ( n ) ¯ , , X 0 ( 9 ) n = 1 9 X 0 ( n ) ¯ } Y 1 = { Y 1 ( 1 ) , Y 1 ( 2 ) , , Y 1 ( 9 ) } = { X 1 ( 1 ) n = 1 9 X 1 ( n ) ¯ , X 1 ( 2 ) n = 1 9 X 1 ( n ) ¯ , , X 1 ( 9 ) n = 1 9 X 1 ( n ) ¯ } Y 2 = { Y 2 ( 1 ) , Y 2 ( 2 ) , , Y 2 ( 9 ) } = { X 2 ( 1 ) n = 1 9 X 2 ( n ) ¯ , X 2 ( 2 ) n = 1 9 X 2 ( n ) ¯ , , X 2 ( 9 ) n = 1 9 X 2 ( n ) ¯ } Y 3 = { Y 3 ( 1 ) , Y 3 ( 2 ) , , Y 3 ( 9 ) } = { X 3 ( 1 ) n = 1 9 X 3 ( n ) ¯ , X 3 ( 2 ) n = 1 9 X 3 ( n ) ¯ , , X 3 ( 9 ) n = 1 9 X 3 ( n ) ¯ } Y 4 = { Y 4 ( 1 ) , Y 4 ( 2 ) , , Y 4 ( 9 ) } = { X 4 ( 1 ) n = 1 9 X 4 ( n ) ¯ , X 4 ( 2 ) n = 1 9 X 4 ( n ) ¯ , , X 4 ( 9 ) n = 1 9 X 4 ( n ) ¯ } Y 5 = { Y 5 ( 1 ) , Y 5 ( 2 ) , , Y 5 ( 9 ) } = { X 5 ( 1 ) n = 1 9 X 5 ( n ) ¯ , X 5 ( 2 ) n = 1 9 X 5 ( n ) ¯ , , X 5 ( 9 ) n = 1 9 X 5 ( n ) ¯ }
From Equation (6), Y0 to Y5 are:
{ Y 0 = { 5.07 e 3 ,   5.54 e 1 ,   6.82 ,   3.2 e 2 ,   9.48 e 1 ,   9.91 e 2 ,   2.72 e 2 ,   1.02 e 2 ,   5.07 e 1 } Y 1 = { 0.4 ,   0.4 ,   0.4 ,   0.58 ,   0.58 ,   0.58 ,   2.03 ,   2.03 ,   2.03 } Y 2 = { 0.36 ,   0.36 ,   0.36 ,   0.57 ,   0.57 ,   0.57 ,   2.07 ,   2.07 ,   2.07 } Y 3 = { 0.5 ,   1.0 ,   1.51 ,   0.95 ,   1.43 ,   0.48 ,   1.56 ,   0.53 ,   1.04 } Y 4 = { 0.3 ,   0.59 ,   0.89 ,   0.77 ,   1.15 ,   0.38 ,   2.46 ,   0.82 ,   1.64 } Y 5 = { 0.29 ,   0.99 ,   1.72 ,   0.29 ,   0.99 ,   1.72 ,   0.29 ,   0.99 ,   1.72 }
Equation (7) is utilized to calculate the absolute difference between the original data and the comparative series.
{ Δ 01 = { | Y 1 ( 1 ) Y 0 ( 1 ) | , | Y 1 ( 2 ) Y 0 ( 2 ) | , , | Y 1 ( 9 ) Y 0 ( 9 ) | } Δ 02 = { | Y 2 ( 1 ) Y 0 ( 1 ) | , | Y 2 ( 2 ) Y 0 ( 2 ) | , , | Y 2 ( 9 ) Y 0 ( 9 ) | } Δ 03 = { | Y 3 ( 1 ) Y 0 ( 1 ) | , | Y 3 ( 2 ) Y 0 ( 2 ) | , , | Y 3 ( 9 ) Y 0 ( 9 ) | } Δ 04 = { | Y 4 ( 1 ) Y 0 ( 1 ) | , | Y 4 ( 2 ) Y 0 ( 2 ) | , , | Y 4 ( 9 ) Y 0 ( 9 ) | } Δ 05 = { | Y 5 ( 1 ) Y 0 ( 1 ) | , | Y 5 ( 2 ) Y 0 ( 2 ) | , , | Y 5 ( 9 ) Y 0 ( 9 ) | }
From Equation (7), Δ1 to Δ5 are:
{ Δ 01 = { 0.39 ,   0.16 ,   6.42 ,   0.55 ,   0.37 ,   0.48 ,   2.00 ,   2.02 ,   1.52 } Δ 02 = { 0.35 ,   0.20 ,   6.46 ,   0.54 ,   0.38 ,   0.47 ,   2.05 ,   2.06 ,   1.57 } Δ 03 = { 0.50 ,   0.45 ,   5.30 ,   0.92 ,   0.48 ,   0.38 ,   1.54 ,   0.52 ,   0.53 } Δ 04 = { 0.29 ,   0.04 ,   5.93 ,   0.74 ,   0.21 ,   0.29 ,   2.43 ,   0.81 ,   1.13 } Δ 05 = { 0.29 ,   0.43 ,   5.09 ,   0.26 ,   0.04 ,   1.62 ,   0.26 ,   0.98 ,   1.22 }
The maximum and minimum value of each data set from Equation (7) are obtained using Equations (8) and (9).
max Δ = max { m a x Δ 01 , m a x Δ 02 , m a x Δ 03 , m a x Δ 04 , m a x Δ 05 } = max { 6.42 ,   6.46 ,   5.30 ,   5.93 ,   5.09 } = 6.46
min Δ = m i n { m i n Δ 01 , m i n Δ 02 , m i n Δ 03 , m i n Δ 04 , m i n Δ 05 } = min { 0.16 ,   0.20 ,   0.38 ,   0.04 ,   0.04 } = 0.04
Equation (10) is utilized to calculate the Grey relational coefficient which is used to determine how close each parameter sequence is to its reference sequence. More specifically, the larger the Grey relational coefficient, the closer the variable sequence is to its reference sequence.
Z 0 i = m i n Δ + β m a x Δ Δ 0 i ( n ) + β m a x Δ
where i [ 1 ,   5 ] ,   n [ 1 ,   9 ] . The identification coefficient β ( 0 ,   1 ) is used to adjust the distinction between normalized reference series and comparative series. From the former study, the rank of the Grey relational grade cannot change with the change of β value and β only has an effect on the magnitude of the relational coefficient [42]. In this paper, β = 0.5 , which leads to medium distinguishing effect and stability, is utilized [43].
{ Z 01 = { Z 01 ( 1 ) , Z 01 ( 2 ) , , Z 01 ( 9 ) } = { m i n Δ + β m a x Δ Δ 01 ( 1 ) + β m a x Δ , m i n Δ + β m a x Δ Δ 01 ( 2 ) + β m a x Δ , , m i n Δ + β m a x Δ Δ 01 ( 9 ) + β m a x Δ } Z 02 = { Z 02 ( 1 ) , Z 02 ( 2 ) , , Z 02 ( 9 ) } = { m i n Δ + β m a x Δ Δ 02 ( 1 ) + β m a x Δ , m i n Δ + β m a x Δ Δ 02 ( 2 ) + β m a x Δ , , m i n Δ + β m a x Δ Δ 02 ( 9 ) + β m a x Δ } Z 03 = { Z 03 ( 1 ) , Z 03 ( 2 ) , , Z 03 ( 9 ) } = { m i n Δ + β m a x Δ Δ 03 ( 1 ) + β m a x Δ , m i n Δ + β m a x Δ Δ 03 ( 2 ) + β m a x Δ , , m i n Δ + β m a x Δ Δ 03 ( 9 ) + β m a x Δ } Z 04 = { Z 04 ( 1 ) , Z 04 ( 2 ) , , Z 04 ( 9 ) } = { m i n Δ + β m a x Δ Δ 04 ( 1 ) + β m a x Δ , m i n Δ + β m a x Δ Δ 04 ( 2 ) + β m a x Δ , , m i n Δ + β m a x Δ Δ 04 ( 9 ) + β m a x Δ } Z 05 = { Z 05 ( 1 ) , Z 05 ( 2 ) , , Z 05 ( 9 ) } = { m i n Δ + β m a x Δ Δ 05 ( 1 ) + β m a x Δ , m i n Δ + β m a x Δ Δ 05 ( 2 ) + β m a x Δ , , m i n Δ + β m a x Δ Δ 05 ( 9 ) + β m a x Δ }
From Equation (11), Z01 to Z05 are:
{ Z 01 = { 0.90 ,   0.96 ,   0.34 ,   0.86 ,   0.91 ,   0.88 ,   0.62 ,   0.62 ,   0.69 } Z 02 = { 0.91 ,   0.95 ,   0.34 ,   0.87 ,   0.90 ,   0.88 ,   0.62 ,   0.62 ,   0.68 } Z 03 = { 0.88 ,   0.89 ,   0.38 ,   0.79 ,   0.88 ,   0.91 ,   0.68 ,   0.87 ,   0.87 } Z 04 = { 0.93 ,   1.00 ,   0.36 ,   0.82 ,   0.95 ,   0.93 ,   0.58 ,   0.81 ,   0.75 } Z 05 = { 0.93 ,   0.89 ,   0.39 ,   0.94 ,   1.00 ,   0.67 ,   0.93 ,   0.78 ,   0.73 }
Finally, Equation (12) is used to calculate the Grey relational grade (GRG), which is defined as the numerical measure of the relevancy between the reference sequence (X0) and the comparability sequence (X1 to X5) and indicates the degree of similarity between the comparability sequence and the reference sequence [44]. The higher the GRG of the comparability sequence of a parameter, the more similar this comparability sequence is to the reference sequence, i.e., the parameter from this comparability sequence affects reference sequence (VIV amplitude in crossflow direction) more significantly.
{ r 01 ( E t e n s i o n ) = n = 1 9 Z 01 ( n ) ¯ = 0.755 r 02 ( E b e n d i n g ) = n = 1 9 Z 02 ( n ) ¯ = 0.753 r 03 ( L / D outer ) = n = 1 9 Z 03 ( n ) ¯ = 0.794 r 04 ( Tension   Force ) = n = 1 9 Z 04 ( n ) ¯ = 0.791 r 05 ( Velocity ) = n = 1 9 Z 05 ( n ) ¯ = 0.807
From Equation (12), r 05 ( Velocity ) > r 03 ( L / D outer ) > r 04 ( Tension   Force ) > r 01 ( E t e n s i o n ) > r 02 ( E b e n d i n g ) .
According to the GRG value for each parameter, the flow velocity has the largest effect, then the L/Douter, followed by the tension force, and after that, the Etension, and Ebending.

4. Conclusions

The study of vortex induced vibration of composite risers and steel riser is presented in this paper. Three types of risers, three current velocities and three water depths are considered which lead to five design parameters, i.e., Etension, Ebending, L/Douter, tension force and current velocity. Based on OA sampling, nine study cases are conducted using CFD with coupled FSI to investigate risers’ VIV characteristics including natural frequencies, global displacements, global stresses, and the stress distributions in each layer of the FRP composite risers. The effect of five parameters on the VIV amplitude in cross flow direction of the risers is analyzed using GRA and the Grey relational grade of these parameters is obtained.
The results show that:
(1)
Lock-in might occur for study cases 1 and 3 according to the relationship between natural frequency and vortex shedding frequency and the range of reduced velocity.
(2)
After an initial growth, the in-line flow displacement and von Mises stress maintain a relatively stable value and vibrate with a modest amplitude, while a significant vibration in the crossflow direction is obvious.
(3)
In general, deeper water depth and faster current velocities lead to a more severe VIV response.
(4)
Simple support leads to larger displacement compared with the fixed support.
(5)
Depending the dominant force, maximum von Mises stresses occur at the top/bottom of the risers, followed by the middle parts.
(6)
According to the von Mises stresses distribution of steel risers and FS in each composite lamina of FRP composite risers, stress failure does not occur for any of the cases studied.
(7)
The Grey relational grade of the five parameters are: r 05 ( Velocity ) > r 03 ( L / D outer ) > r 04 ( Tension   Force ) > r 01 ( E t e n s i o n ) > r 02 ( E b e n d i n g ) .

Author Contributions

Conceptualization, C.W. and J.W.J.; methodology, C.W.; validation, C.W. and S.G.; formal analysis, S.G.; investigation, C.W. and S.G.; resources, Z.J. and L.L.; data curation, S.G.; writing—original draft preparation, C.W.; writing—review and editing, C.W. and J.W.J.; supervision, L.L.; project administration, C.W. and Z.J.; funding acquisition, C.W.

Funding

This research was funded by Key Research and Development Program of Shandong Province (2019GHY112076), Shandong Provincial Natural Science Foundation (ZR2017LEE031, ZR2017LD006), National Natural Science Foundation of China (41703056) and Science and Technology Development Project of Zibo (2017KJ040017).

Conflicts of Interest

The authors declare no conflicts of interest.

References

  1. Balazs, G.L.; Borosnyoi, A. Long-term behavior of FRP. In Composites in Construction: A Reality; Edoardo, C., Gaetano, M., Antonio, N., Eds.; American Society of Civil Engineers: Reston, VA, USA, 2001; pp. 84–91. [Google Scholar]
  2. Jansons, J.O.; Glejbol, K.; Rytter, J.; Aniskevich, A.N.; Arnautov, A.K.; Kulakov, V.L. Effect of water absoption, elevated temperatures and fatigue on the mechanical properties of carbon-fiber-reinforced epoxy composites for flexible risers. Mech. Compos. Mater. 2002, 38, 299–310. [Google Scholar] [CrossRef]
  3. Amaechi, C.V.; Nathaniel, G.; Agbomerie, C.O.; Hou, X.; Ye, J. Composite risers for deep waters using a numerical modelling approach. Compos. Struct. 2018, 210, 486–499. [Google Scholar] [CrossRef] [Green Version]
  4. Wang, C.; Shankar, K.; Morozov, E.V. Tailored local design of deep sea FRP composite risers. Adv. Compos. Mater. 2015, 24, 375–397. [Google Scholar] [CrossRef]
  5. Ochoa, O.O.; Salama, M.M. Offshore composites: Transition barriers to an enabling technology. Compos. Sci. Technol. 2005, 65, 2588–2596. [Google Scholar] [CrossRef]
  6. Sparks, C.P.; Odru, P.; Bono, H.; Metivaud, G. Mechanical Testing of High-Performance Composite Tubes for TLP Production Risers. In Proceedings of the Offshore Technology Conference, Houston, TX, USA, 2–5 May 1988. [Google Scholar]
  7. Salama, M.M.; Johnson, D.B.; Long, J.R. Composite production riser-testing and qualification. SPE Prod. Facil. 1998, 13, 170–177. [Google Scholar] [CrossRef]
  8. Salama, M.M.; Stjern, G.; Storhaug, T.; Spencer, B.; Echtermeyer, A. The first offshore field installation for a composite riser joint. In Proceedings of the Offshore Technology Conference, Houston, TX, USA, 6–9 May 2002. [Google Scholar]
  9. Smith, K.L.; Leveque, M.E. Ultra-Deepwater Production Systems Technical-Progress Report; Conoco Phillips Company: Houston, TX, USA, 2003. [Google Scholar]
  10. Smith, K.L.; Leveque, M.E. Ultra-Deepwater Production Systems Technical-Final Report; Conoco Phillips Company: Houston, TX, USA, 2005. [Google Scholar]
  11. Picard, D.; Hudson, W.; Bouquier, L.; Dupupet, G.; Zivanovic, I. Composite carbon thermoplastic tubes for deepwater application. In Proceedings of the Offshore Technology Conference, Houston, TX, USA, 30 April–3 May 2007. [Google Scholar]
  12. Chen, Y.; Seemann, R.; Krause, D.; Tay, T.E.; Tan, V.B. Prototyping and testing of composite riser joints for deepwater application. J. Reinf. Plast. Compos. 2016, 35, 95–110. [Google Scholar] [CrossRef]
  13. Karayaka, M.; Wu, S.; Wang, S.; Lu, X.; Partha Ganguly, B.P. Composite Production Riser Dynamics and its Effects on Tensioners, Stress Joints, and Size of Deep Water Tension Leg Platform. In Proceedings of the Offshore Technology Conference, Houston, TX, USA, 4–7 May 1998. [Google Scholar]
  14. Huang, K.Z. Composite TTR Design for an Ultradeepwater TLP. In Proceedings of the Offshore Technology Conference, Houston, TX, USA, 2–5 May 2005. [Google Scholar]
  15. Kim, W.K. Composite Production Riser Assessment. Ph.D. Thesis, Texas A&M University, College Station, TX, USA, 2007. [Google Scholar]
  16. Ward, E.G.; Ochoa, O.O.; Kim, W.; Gilbert, R.M.; Jain, A.; Miller, C.; Denison, E. A Comparative Risk Analysis of Composite and Steel Production Risers; Texas A&M University: College Station, TX, USA, 2007. [Google Scholar]
  17. Wang, C.; Shankar, K.; Morozov, E.V. Global design and analysis of deep sea FRP composite risers under combined environmental loads. Adv. Compos. Mater. 2017, 26, 79–98. [Google Scholar] [CrossRef]
  18. Wang, C.; Shankar, K.; Morozov, E.V. Tailored design of top-tensioned composite risers for deep-water applications using three different approaches. Adv. Mech. Eng. 2017, 9, 1–18. [Google Scholar] [CrossRef]
  19. Omar, A.F.; Karayka, M.; Murray, J.J. A Comparative Study of the Performance of Top-tensioned Composite and Steel Risers under Vertex-induced Loading. In Proceedings of the Offshore Technology Conference, Houston, TX, USA, 3–6 May 1999. [Google Scholar]
  20. Rakshit, T.; Atluri, S.; Dalton, C. VIV of a composite riser at moderate Reynolds number using CFD. J. Offshore Mech. Arct. Eng. 2008, 130, 011009. [Google Scholar] [CrossRef]
  21. Toh, W.; Tan, L.B.; Jaiman, R.K.; Tay, T.E. A comprehensive study on composite risers: Material solution, local end fitting design and global response. Mar. Struct. 2018, 61, 155–169. [Google Scholar] [CrossRef]
  22. Tan, L.B.; Chen, Y.; Jaiman, R.K.; Sun, X.; Tan, V.B.C.; Tay, T.E. Coupled fluid–structure simulations for evaluating a performance of full-scale deepwater composite riser. Ocean Eng. 2015, 94, 19–35. [Google Scholar] [CrossRef]
  23. Tsahalis, D.; Jones, T.W. Vortex-induced Vibrations of a Flexible Cylinder near a Plane Boundary in Steady Flow. In Proceedings of the Offshore Technology Conference, Houston, TX, USA, 4–7 May 1981. [Google Scholar]
  24. Tsahalis, D.T. Vortex-induced vibrations due to steady and wave-induced currents of a flexible cylinder near a plane boundary. J. Offshore Mech. Arct. Eng. 1987, 109, 112–118. [Google Scholar] [CrossRef]
  25. Montgomery, D.C. Design and Analysis of Experiments; John Wiley & Sons: New York, NY, USA, 2001. [Google Scholar]
  26. Owen, A. Programs Construct and Manipulate Orthogonal Arrays; Department of Statistics, Stanford University: Stanford, CA, USA, 2005. [Google Scholar]
  27. Stabile, G.; Matthies, H.G.; Borri, C. A novel reduced order model for vortex induced vibrations of long flexible cylinders. Ocean Eng. 2018, 156, 191–207. [Google Scholar] [CrossRef] [Green Version]
  28. Gabbai, R.D.; Benaroya, H. An overview of modeling and experiments of vortex-induced vibration of circular cylinders. J. Sound Vibrat. 2005, 282, 575–616. [Google Scholar] [CrossRef]
  29. Morán, J.; Granada, E.; Míguez, J.L.; Porteiro, J. Use of Grey relational analysis to assess and optimize small biomass boilers. Fuel Process. Technol. 2006, 87, 123–127. [Google Scholar] [CrossRef]
  30. Wang, C.; Cui, Y.; Ge, S.; Sun, M.; Jia, Z. Experimental study on vortex-induced vibration of risers considering the effects of different design parameters. Appl. Sci. 2018, 8, 2411. [Google Scholar] [CrossRef]
  31. Wang, C.; Shankar, K.; Ashraf, M.A.; Morozov, E.V.; Ray, T. Surrogate-assisted optimisation design of composite riser. Proc. Inst. Mech. Eng. Part L 2016, 230, 18–34. [Google Scholar] [CrossRef]
  32. Chakrabarti, S.K. Handbook of Offshore Engineering, 1st ed.; Elsevier: London, UK, 2005; Volume 1. [Google Scholar]
  33. American Petroleum Institute (API). Recommended Practice for Planning, Designing and Constructing Fixed Offshore Platforms-Working Stress Design; American Petroleum Institute: Washington, DC, USA, 2000. [Google Scholar]
  34. Wang, C.; Sun, M.; Shankar, K.; Xing, S.; Zhang, L. CFD simulation of vortex induced vibration for FRP composite riser with different modeling methods. Appl. Sci. 2018, 8, 684. [Google Scholar] [CrossRef]
  35. Wang, C.; Ge, S.; Sun, M.; Jia, Z.; Han, B. Comparative study of vortex-induced vibration of frp composite risers with large length to diameter ratio under different environmental situations. Appl. Sci. 2019, 9, 517. [Google Scholar] [CrossRef]
  36. Blevins, R.D. Flow-Induced Vibration, 2nd ed.; Krieger Publishing Company: Malabar, FL, USA, 2001. [Google Scholar]
  37. American Bureau of Shipping (ABS). Guide for Building and Classing Subsea Riser Systems: Design Requirements and Loads; American Bureau of Shipping: Houston, TX, USA, 2008. [Google Scholar]
  38. Kaw, A.K. Mechanics of Composite Materials, 2nd ed.; CSC Press: Boca Raton, FL, USA, 2006. [Google Scholar]
  39. Det Norske Veritas (DNV). Offshore Standard for Composite Components (DNV-OS-C501); Det Norske Veritas: Høvik, Norway, 2009. [Google Scholar]
  40. Sun, C.T.; Li, S. Three-dimensional effective elastic constant for thick laminates. J. Compos. Mater. 1988, 22, 629–639. [Google Scholar] [CrossRef]
  41. Bogetti, T.A.; Hoppel, C.P.R.; Drysdale, W.H. Three-Dimensional Effective Property and Strength Prediction of Thick Laminated Composite Media; Aberdeen Proving Ground, United States Army Research Laboratory: Adelphi, MD, USA, 1995. [Google Scholar]
  42. Jiang, B.C.; Szu-Lang, T.; Chien-Chih, W. Machine vision-based gray relational theory applied to ic marking inspection. IEEE Trans. Semicond. Manuf. 2002, 15, 531–539. [Google Scholar] [CrossRef]
  43. Lin, S.J.; Lu, I.J.; Lewis, C. Grey relation performance correlations among economics, energy use and carbon dioxide emission in taiwan. Energy Policy 2007, 35, 1948–1955. [Google Scholar] [CrossRef]
  44. Fung, C.P. Manufacturing process optimization for wear property of fiber-reinforced polybutylene terephthalate composites with Grey relational analysis. Wear 2003, 254, 298–306. [Google Scholar] [CrossRef]
Figure 1. FE models for (a) steel and FRP composite risers and (b) flow zone.
Jmse 07 00231 g001
Figure 2. Time history of displacements in in-line flow direction (X) at the middle point of each riser for all study cases.
Jmse 07 00231 g002
Figure 3. Time history of displacements in cross flow direction (Y) at the middle point of each riser for all study cases.
Jmse 07 00231 g003
Figure 4. Time history of von Mises stresses at the bottom end of each riser for all study cases.
Jmse 07 00231 g004
Figure 5. The maximum displacements in the in-line flow direction (X) for all study cases.
Jmse 07 00231 g005
Figure 6. The maximum displacements in the cross flow direction (Y) for all study cases.
Jmse 07 00231 g006
Figure 7. The maximum total displacement distributions for all study cases.
Jmse 07 00231 g007
Figure 8. The maximum von Mises stresses for all study cases.
Jmse 07 00231 g008
Figure 9. The maximum von Mises stresses for all study cases.
Jmse 07 00231 g009
Figure 10. The movement track of riser 1 in case 3 at 18.8 m under the water surface.
Jmse 07 00231 g010
Figure 11. The vibration frequency of riser 1 in case 3.
Jmse 07 00231 g011
Figure 12. Vortex shedding frequency.
Jmse 07 00231 g012
Figure 13. The factor of safety of composite layers in study case 3.
Jmse 07 00231 g013
Table 1. The properties of the materials for the steel riser and composite riser’s inner liner.
MaterialDensity (kg/m3)Modulus (GPa)Tangent Modulus (GPa)νYield Stress (MPa)Ultimate Stress (MPa)Elongation at Break (%)
X80 steel78502071.250.35556255.868
Titanium4430113.80.530.34288095014
Table 2. The properties of unidirectional lamina of AS4-epoxy for composite risers.
MaterialDensity (kg/m3)E1 (GPa)E2 = E3 (GPa)G12 = G13 (GPa)ν12 = ν13G23 (GPa)ν23 σ 1 T (MPa) σ 1 C (MPa) σ 2 T (MPa) σ 2 C (MPa)τ12 (MPa)
AS4-Epoxy1530135.49.374.960.323.200.461732125649.4167.271.2
Subscripts 1—fibre direction, 2—in-plane transverse and 3—through-thickness direction. Superscript T—Tension, C—Compression.
Table 3. Geometries of risers.
RiserI.D. (m)O.D. (m)Lay-Upst_liner (mm)t_0 (mm)t_±θ (mm)t_90 (mm)±θ (°)
10.250.311[liner/03/(+53,−53)5 /904]21.701.641.7553
20.250.329[liner/90/(0/90)10]21.385/2.15/
30.250.3X80 steel
Subscript numbers in lay-ups represent the numbers of lamina with different fiber reinforcement angle. The fiber angle of 0° and 90° are the axial and hoop directions of FRP composite risers.
Table 4. Study cases.
Case No.RiserVelocity (m/s)Water Depth (m)ReTurbulent Intensity (%)Gravity (N)Tension Force (N)Buoyancy (N)
110.3612.5105,6233.77560011,2009529
211.2225.0357,9433.2411,20022,40019,058
312.1337.5624,9343.0216,80033,60028,587
420.3625.0111,7363.7414,59129,18321,328
521.2237.5378,6603.2121,88743,77431,992
622.1312.5661,1043.00729614,59110,664
730.3637.5101,8873.7962,30993,46326,600
831.2212.5345,2833.2520,77031,1548867
932.1325.0602,8303.0341,53962,30917,734
Table 5. Natural frequencies, vortex shedding frequencies and reduced velocities of the risers.
Case 1Case 2Case 3Case 4Case 5Case 6Case 7Case 8Case 9
natural frequency f n /(Hz)7.211.890.942.451.179.470.947.872.01
vortex shedding frequency fs/(Hz)0.230.821.510.220.781.420.240.851.56
reduced velocity Ur0.162.077.260.453.180.681.280.523.53
Table 6. Data for the Grey relational analysis (GRA).
Case No.RiserEtension (GPa)Ebending (GPa)L/DouterTension Force (N)Current Velocity (m/s)VIV Amplitude (m)
1140.535.74011,2000.367.01 × 10−5
2140.535.78022,4001.227.66 × 10−3
3140.535.712133,6002.139.42 × 10−2
4259.156.87629,1830.364.42 × 10−4
5259.156.811443,7741.221.31 × 10−2
6259.156.83814,5912.131.37 × 10−3
7320720712593,4630.363.76 × 10−4
832072074231,1541.221.41 × 10−4
932072078362,3092.137.01 × 10−3

