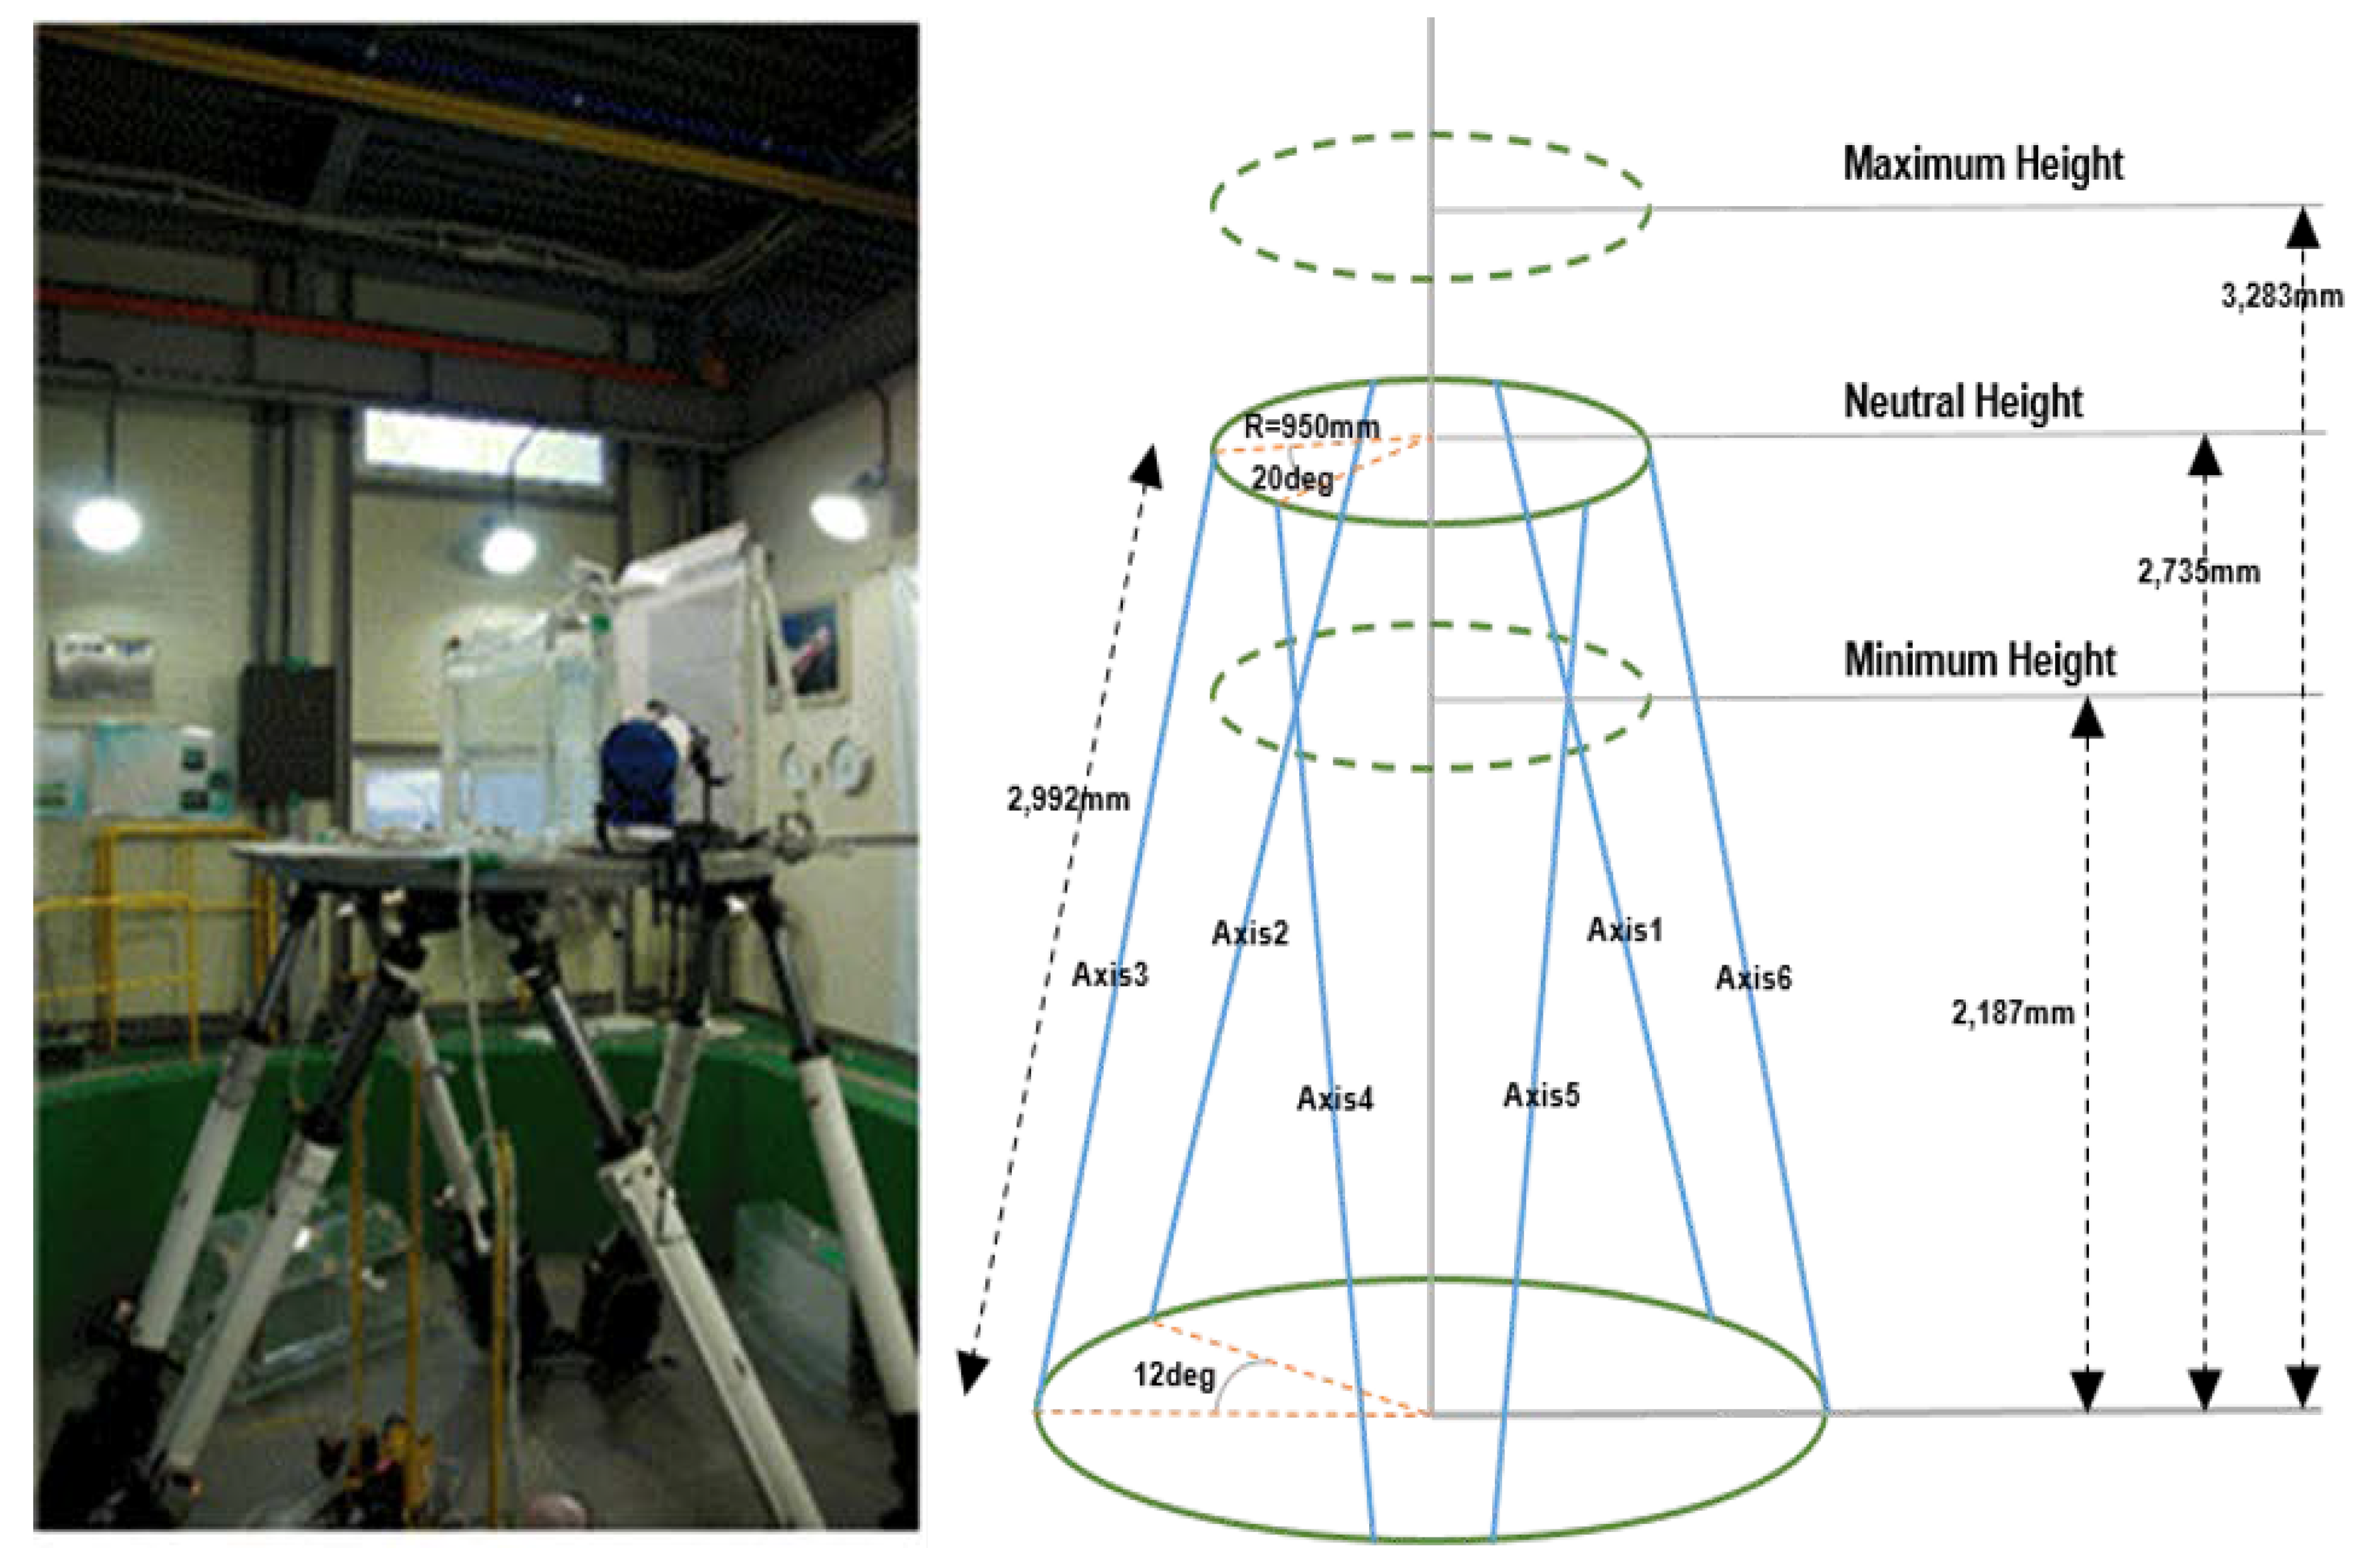
Figure 1.
6-Degree of Freedom (DOF) Sloshing Motion Platform.
Figure 1.
6-Degree of Freedom (DOF) Sloshing Motion Platform.
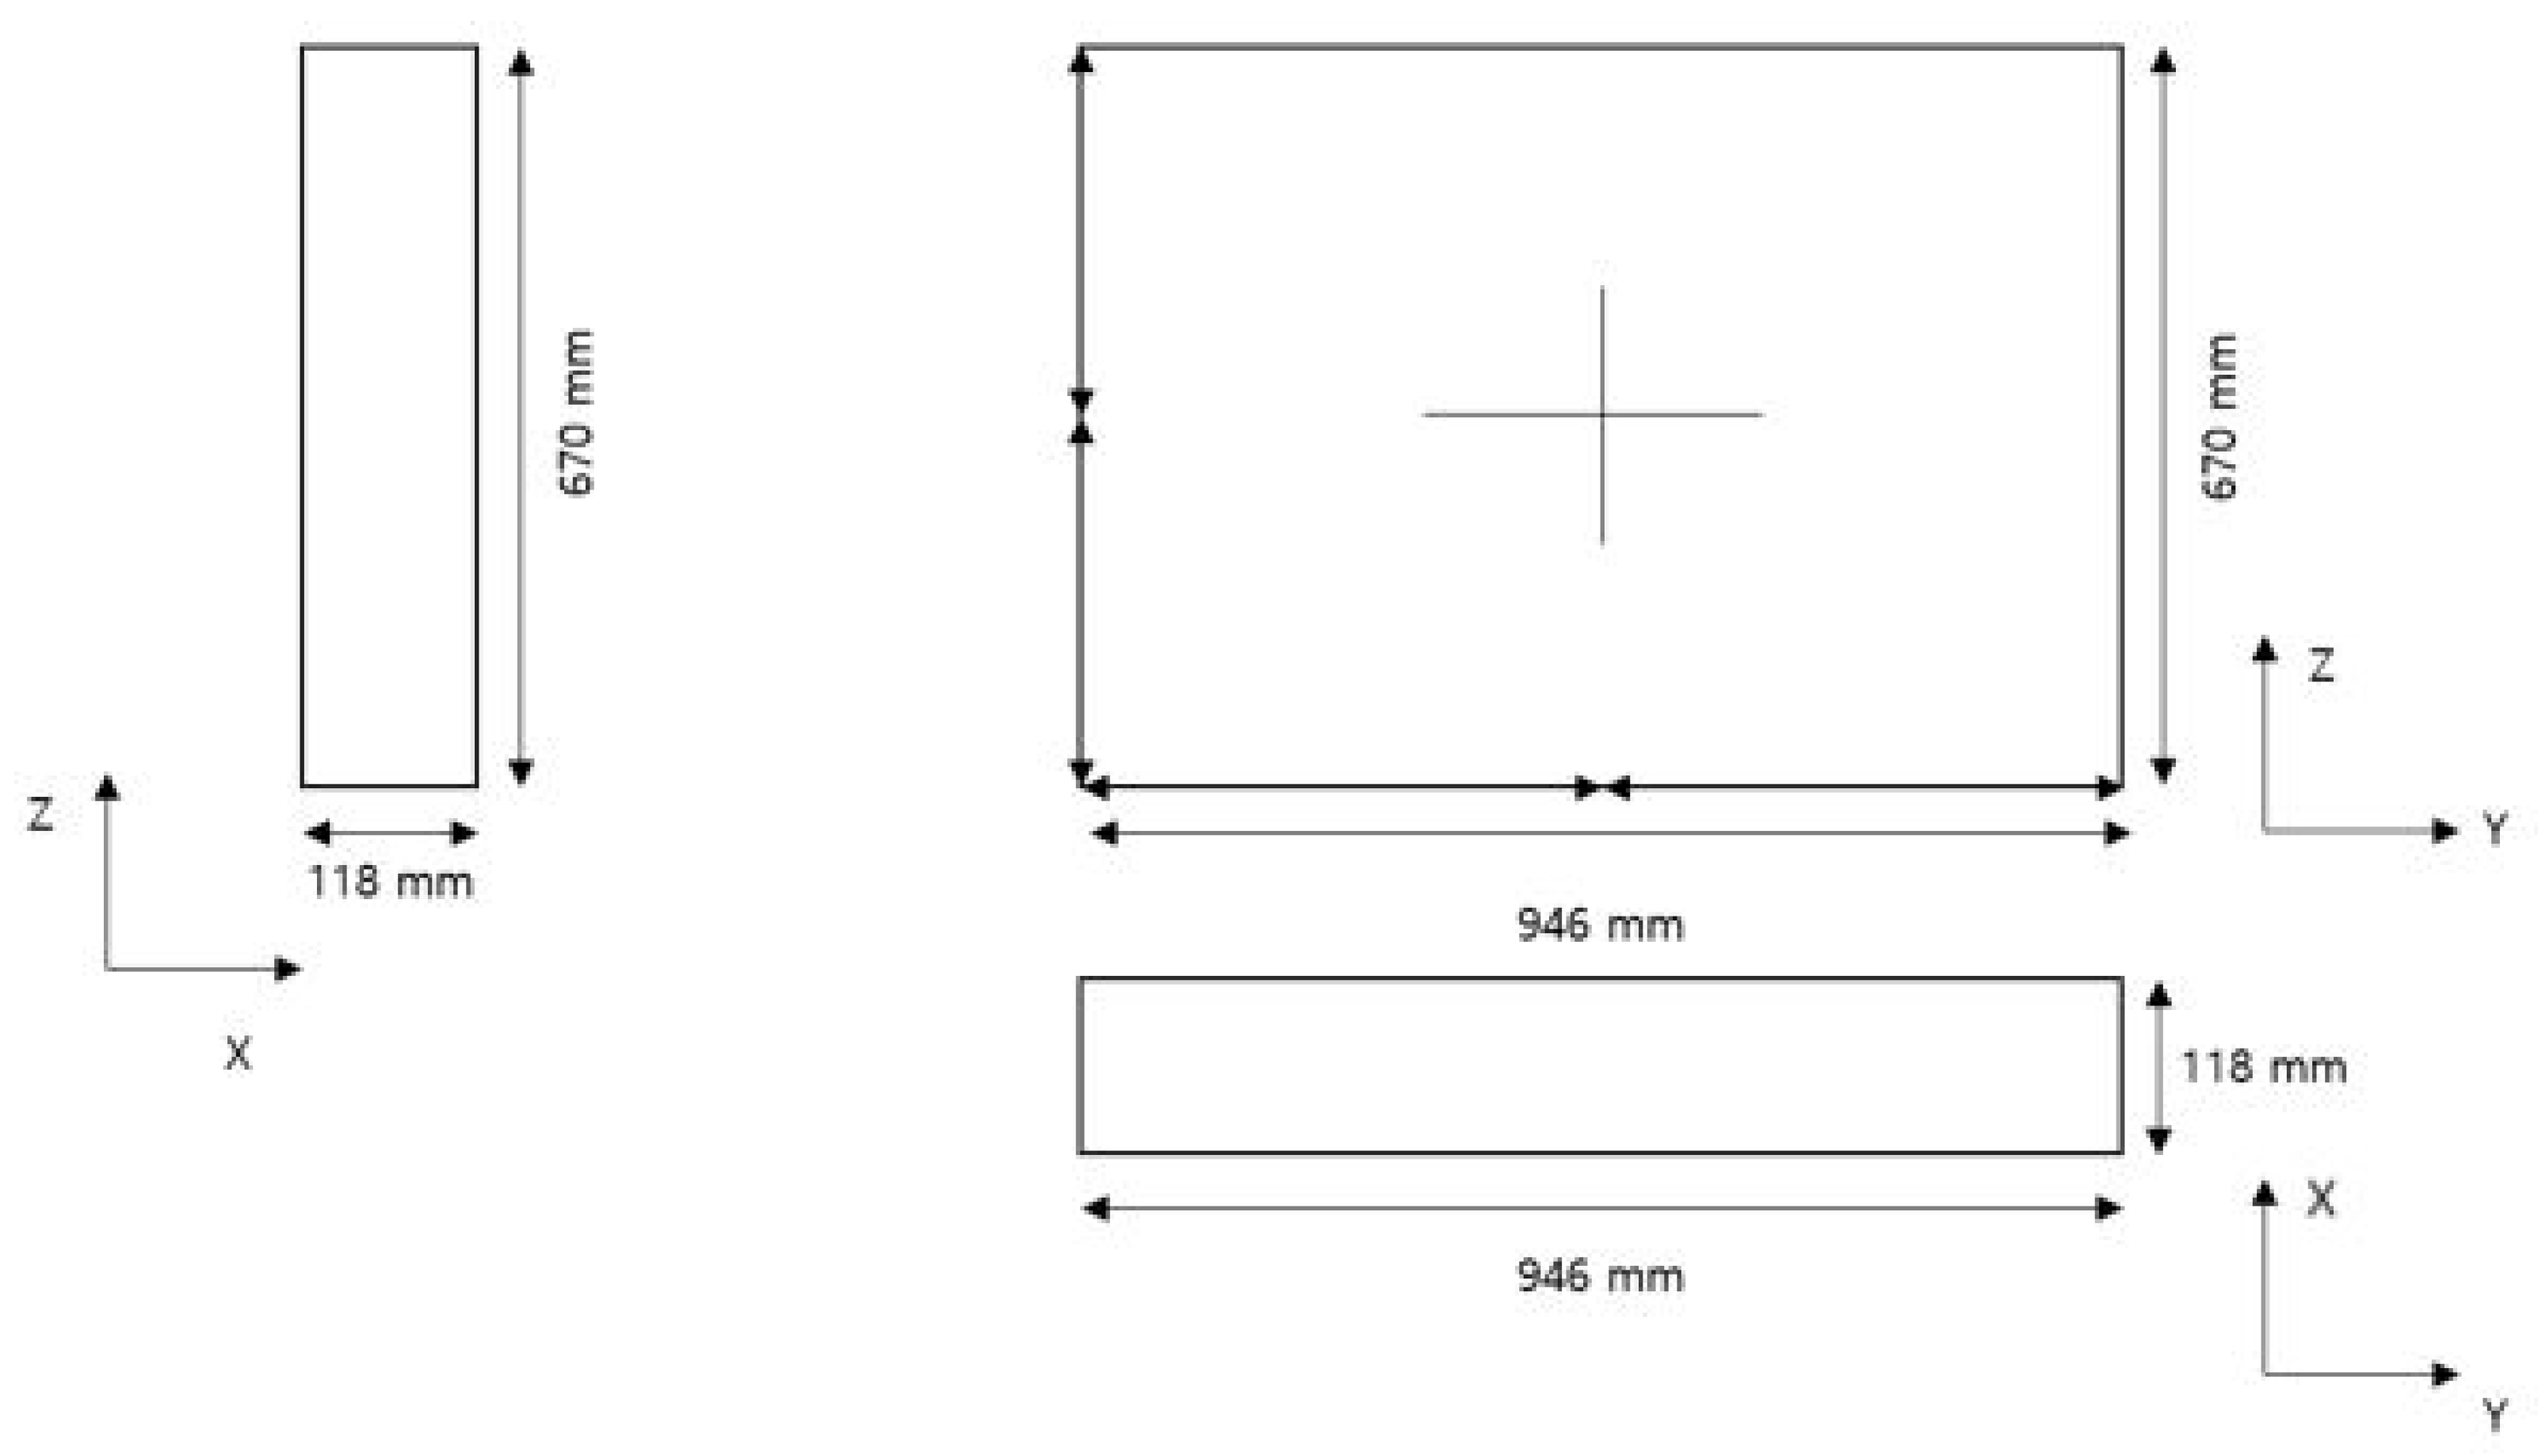
Figure 2.
Model tank dimensions.
Figure 2.
Model tank dimensions.
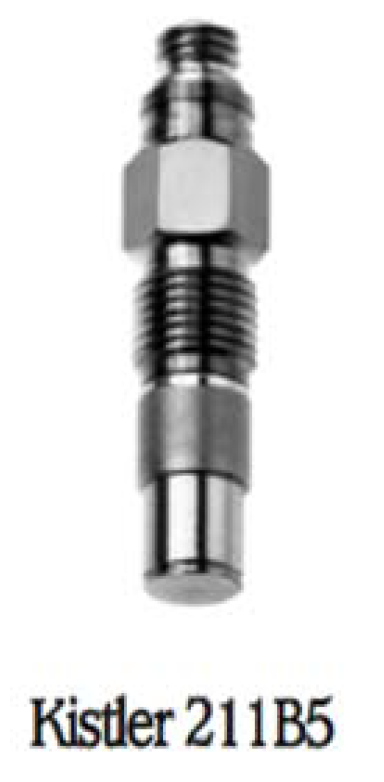
Figure 3.
Photo of Pressure Sensor.
Figure 3.
Photo of Pressure Sensor.
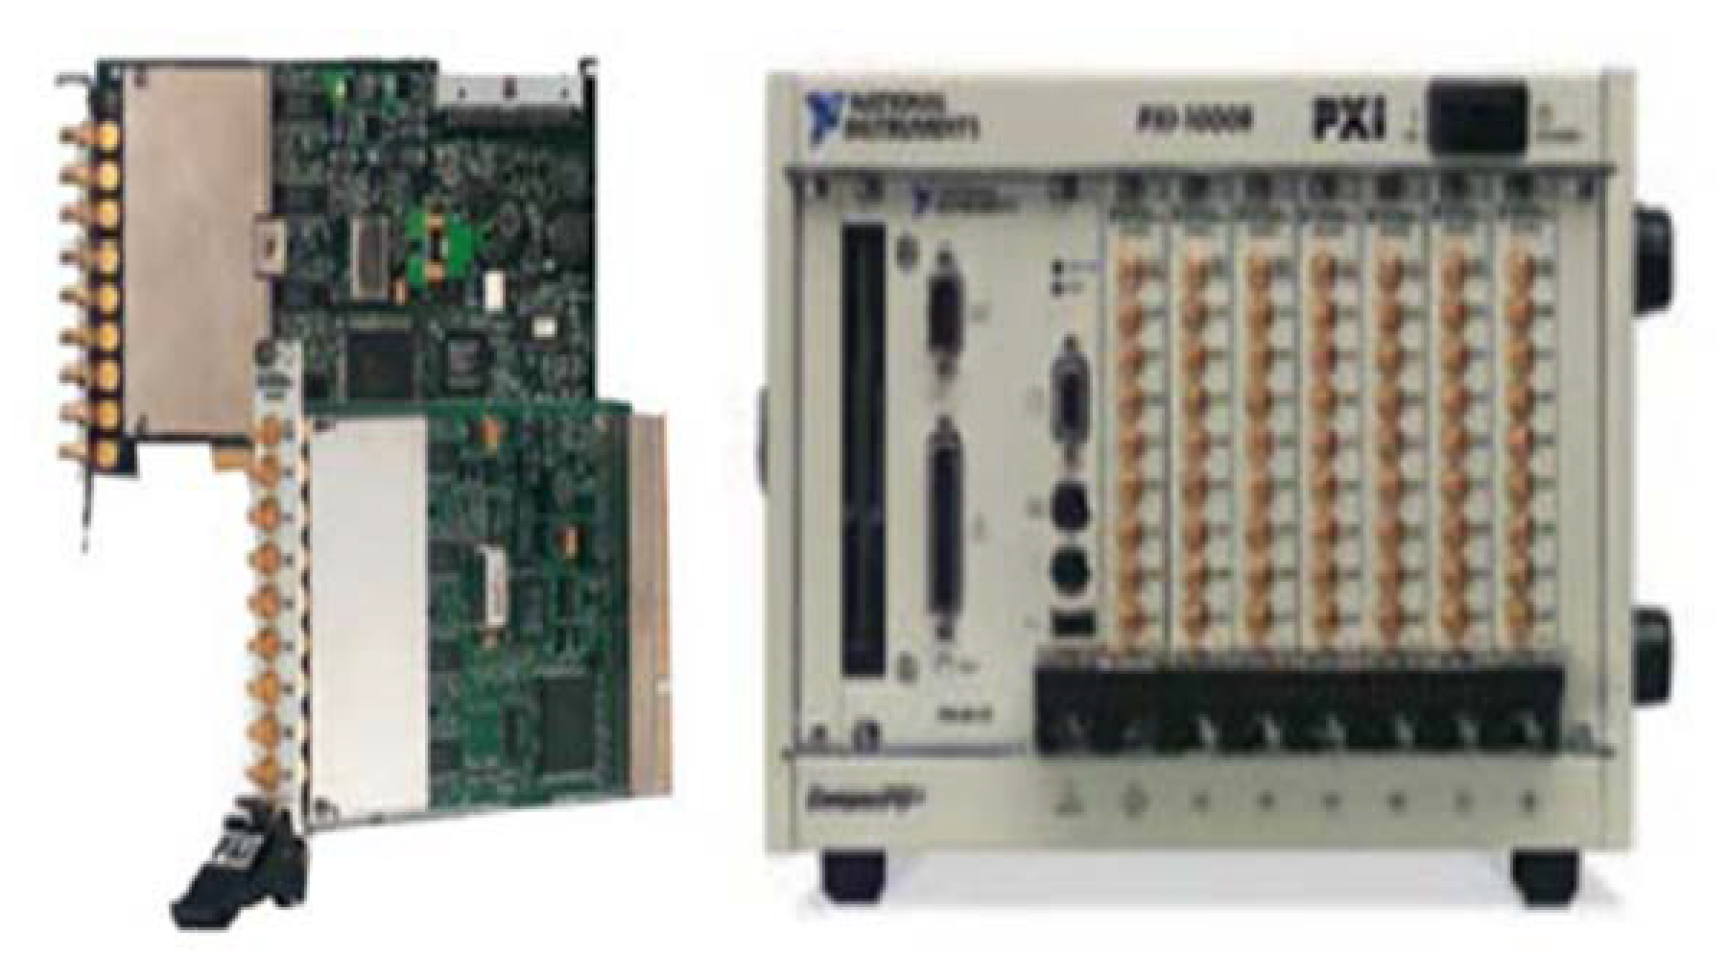
Figure 4.
National Instrument Board and Data Acquisition Equipment.
Figure 4.
National Instrument Board and Data Acquisition Equipment.
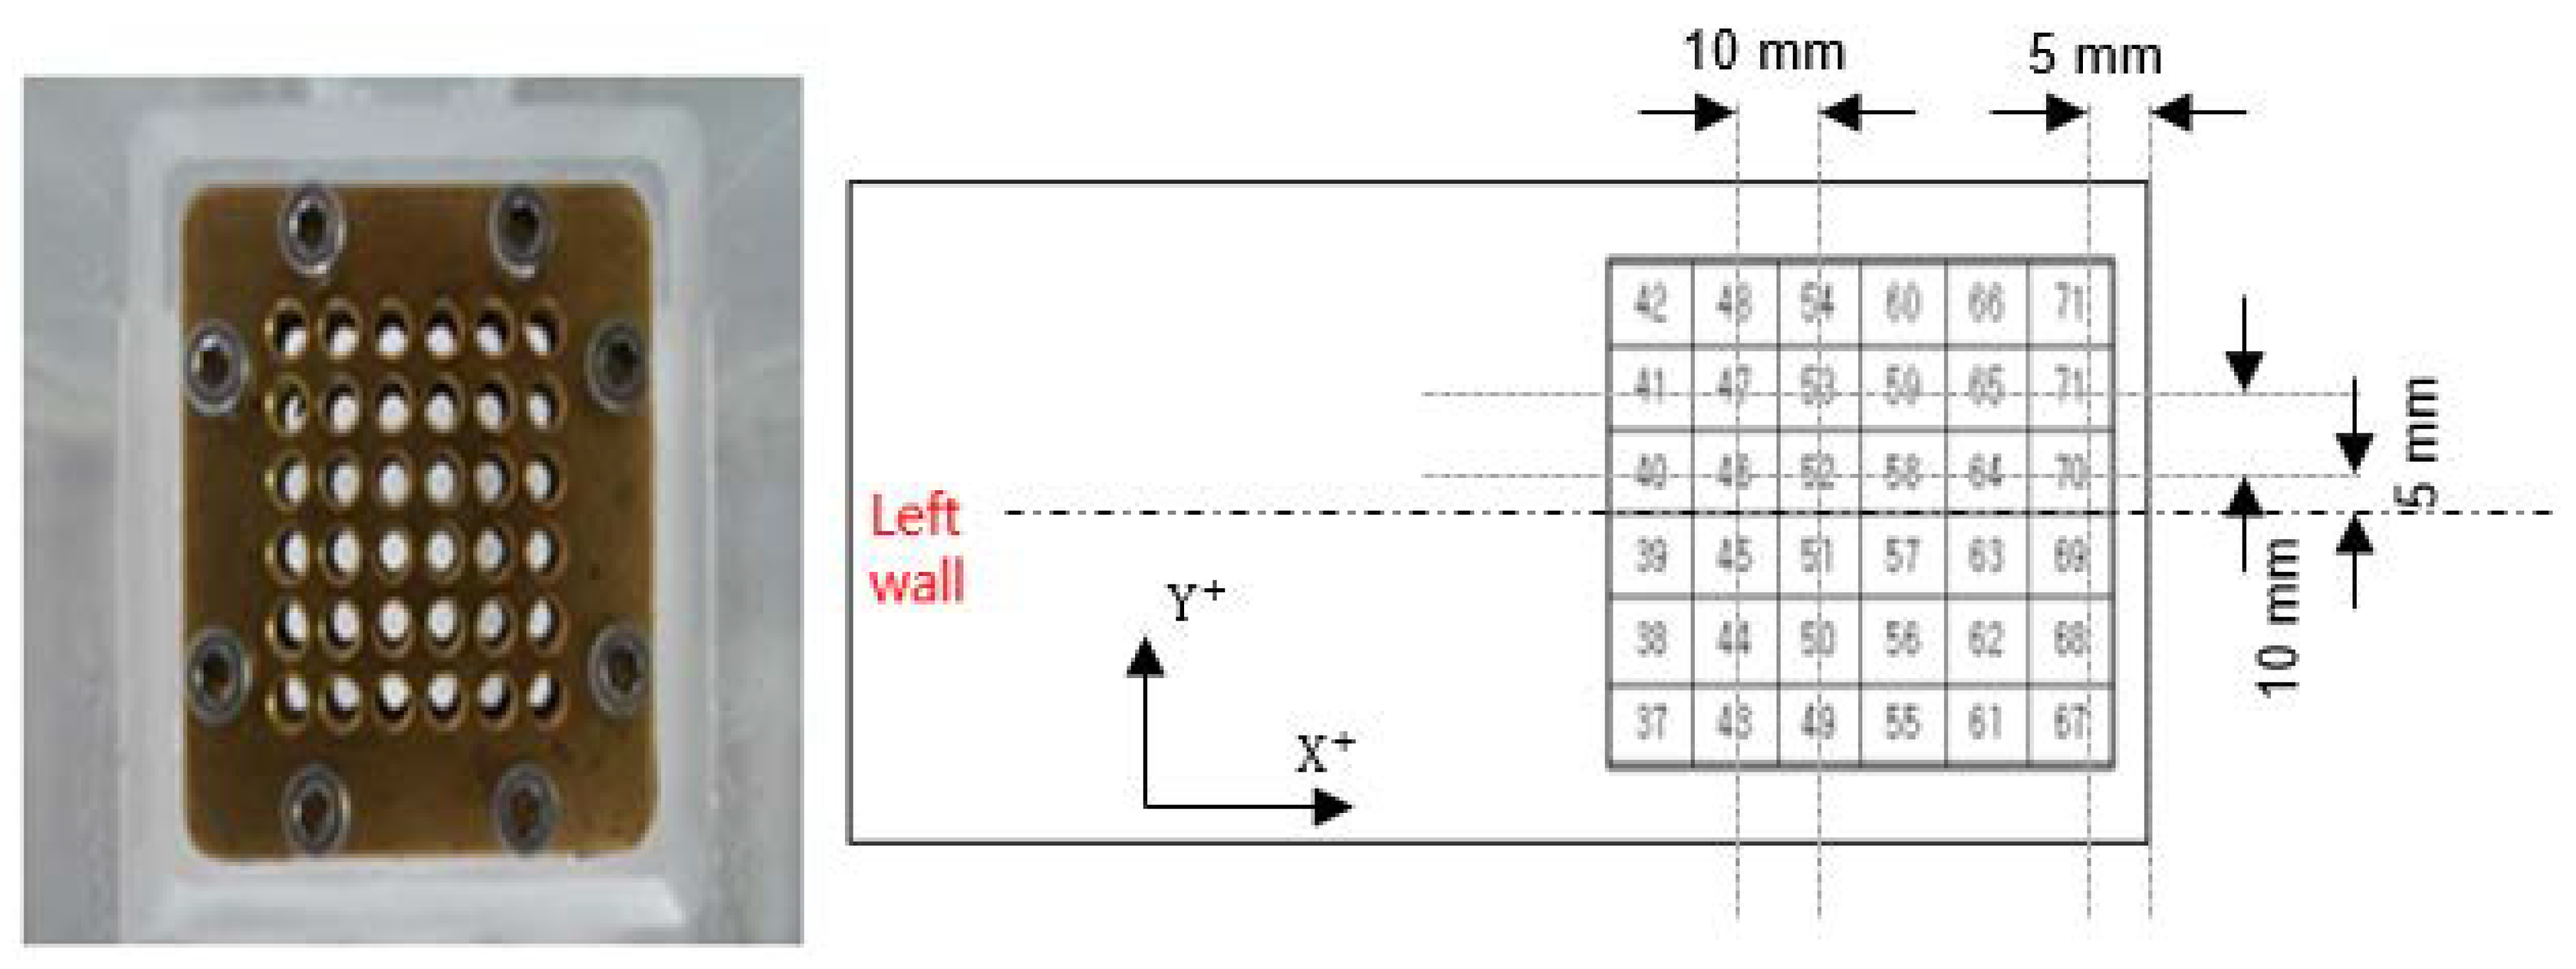
Figure 5.
Cluster and Location of Channels.
Figure 5.
Cluster and Location of Channels.
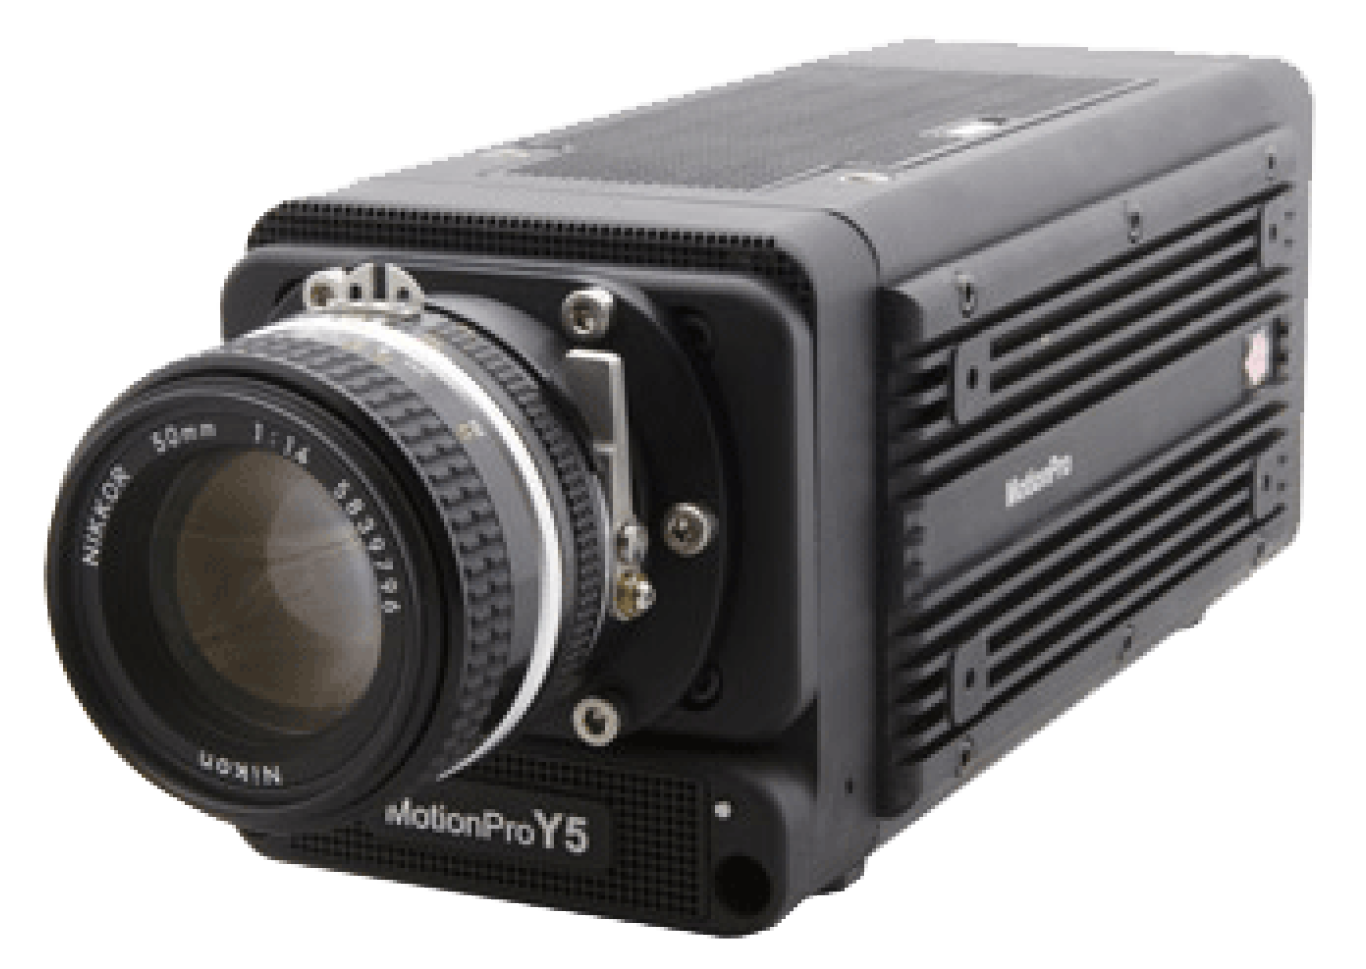
Figure 6.
High-Speed Camera.
Figure 6.
High-Speed Camera.
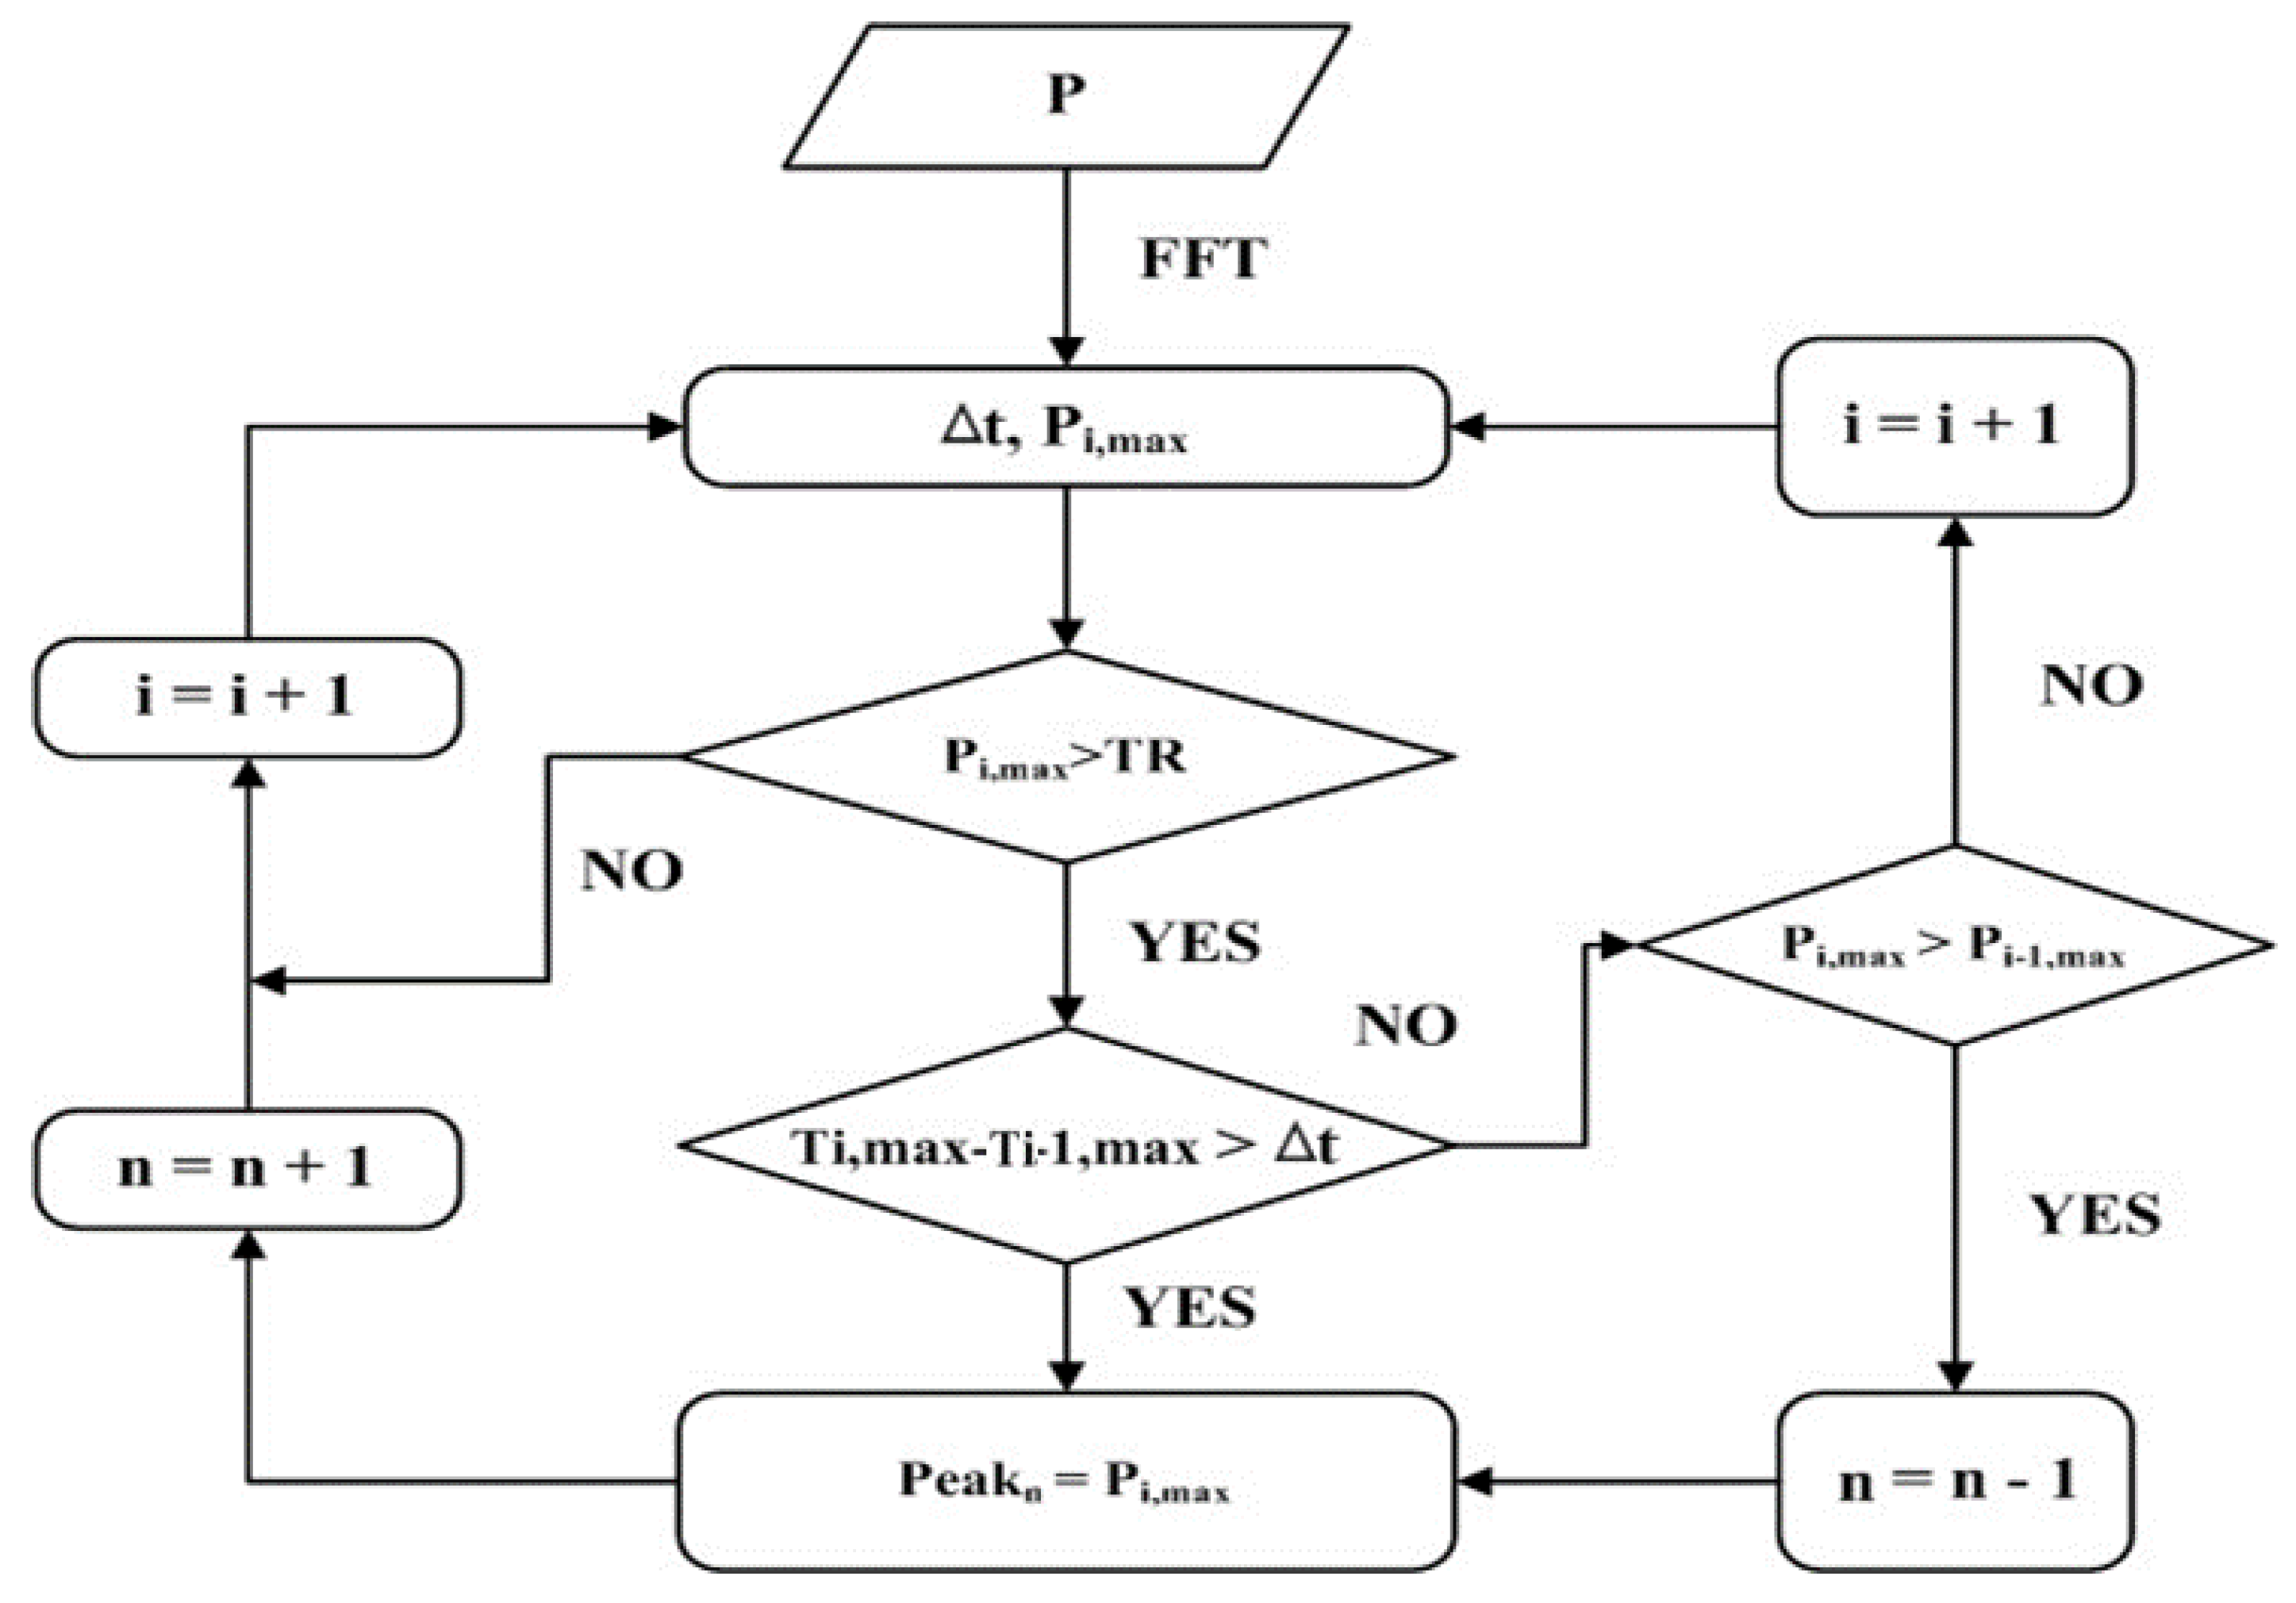
Figure 7.
Scheme of Peak Pressure Detection.
Figure 7.
Scheme of Peak Pressure Detection.
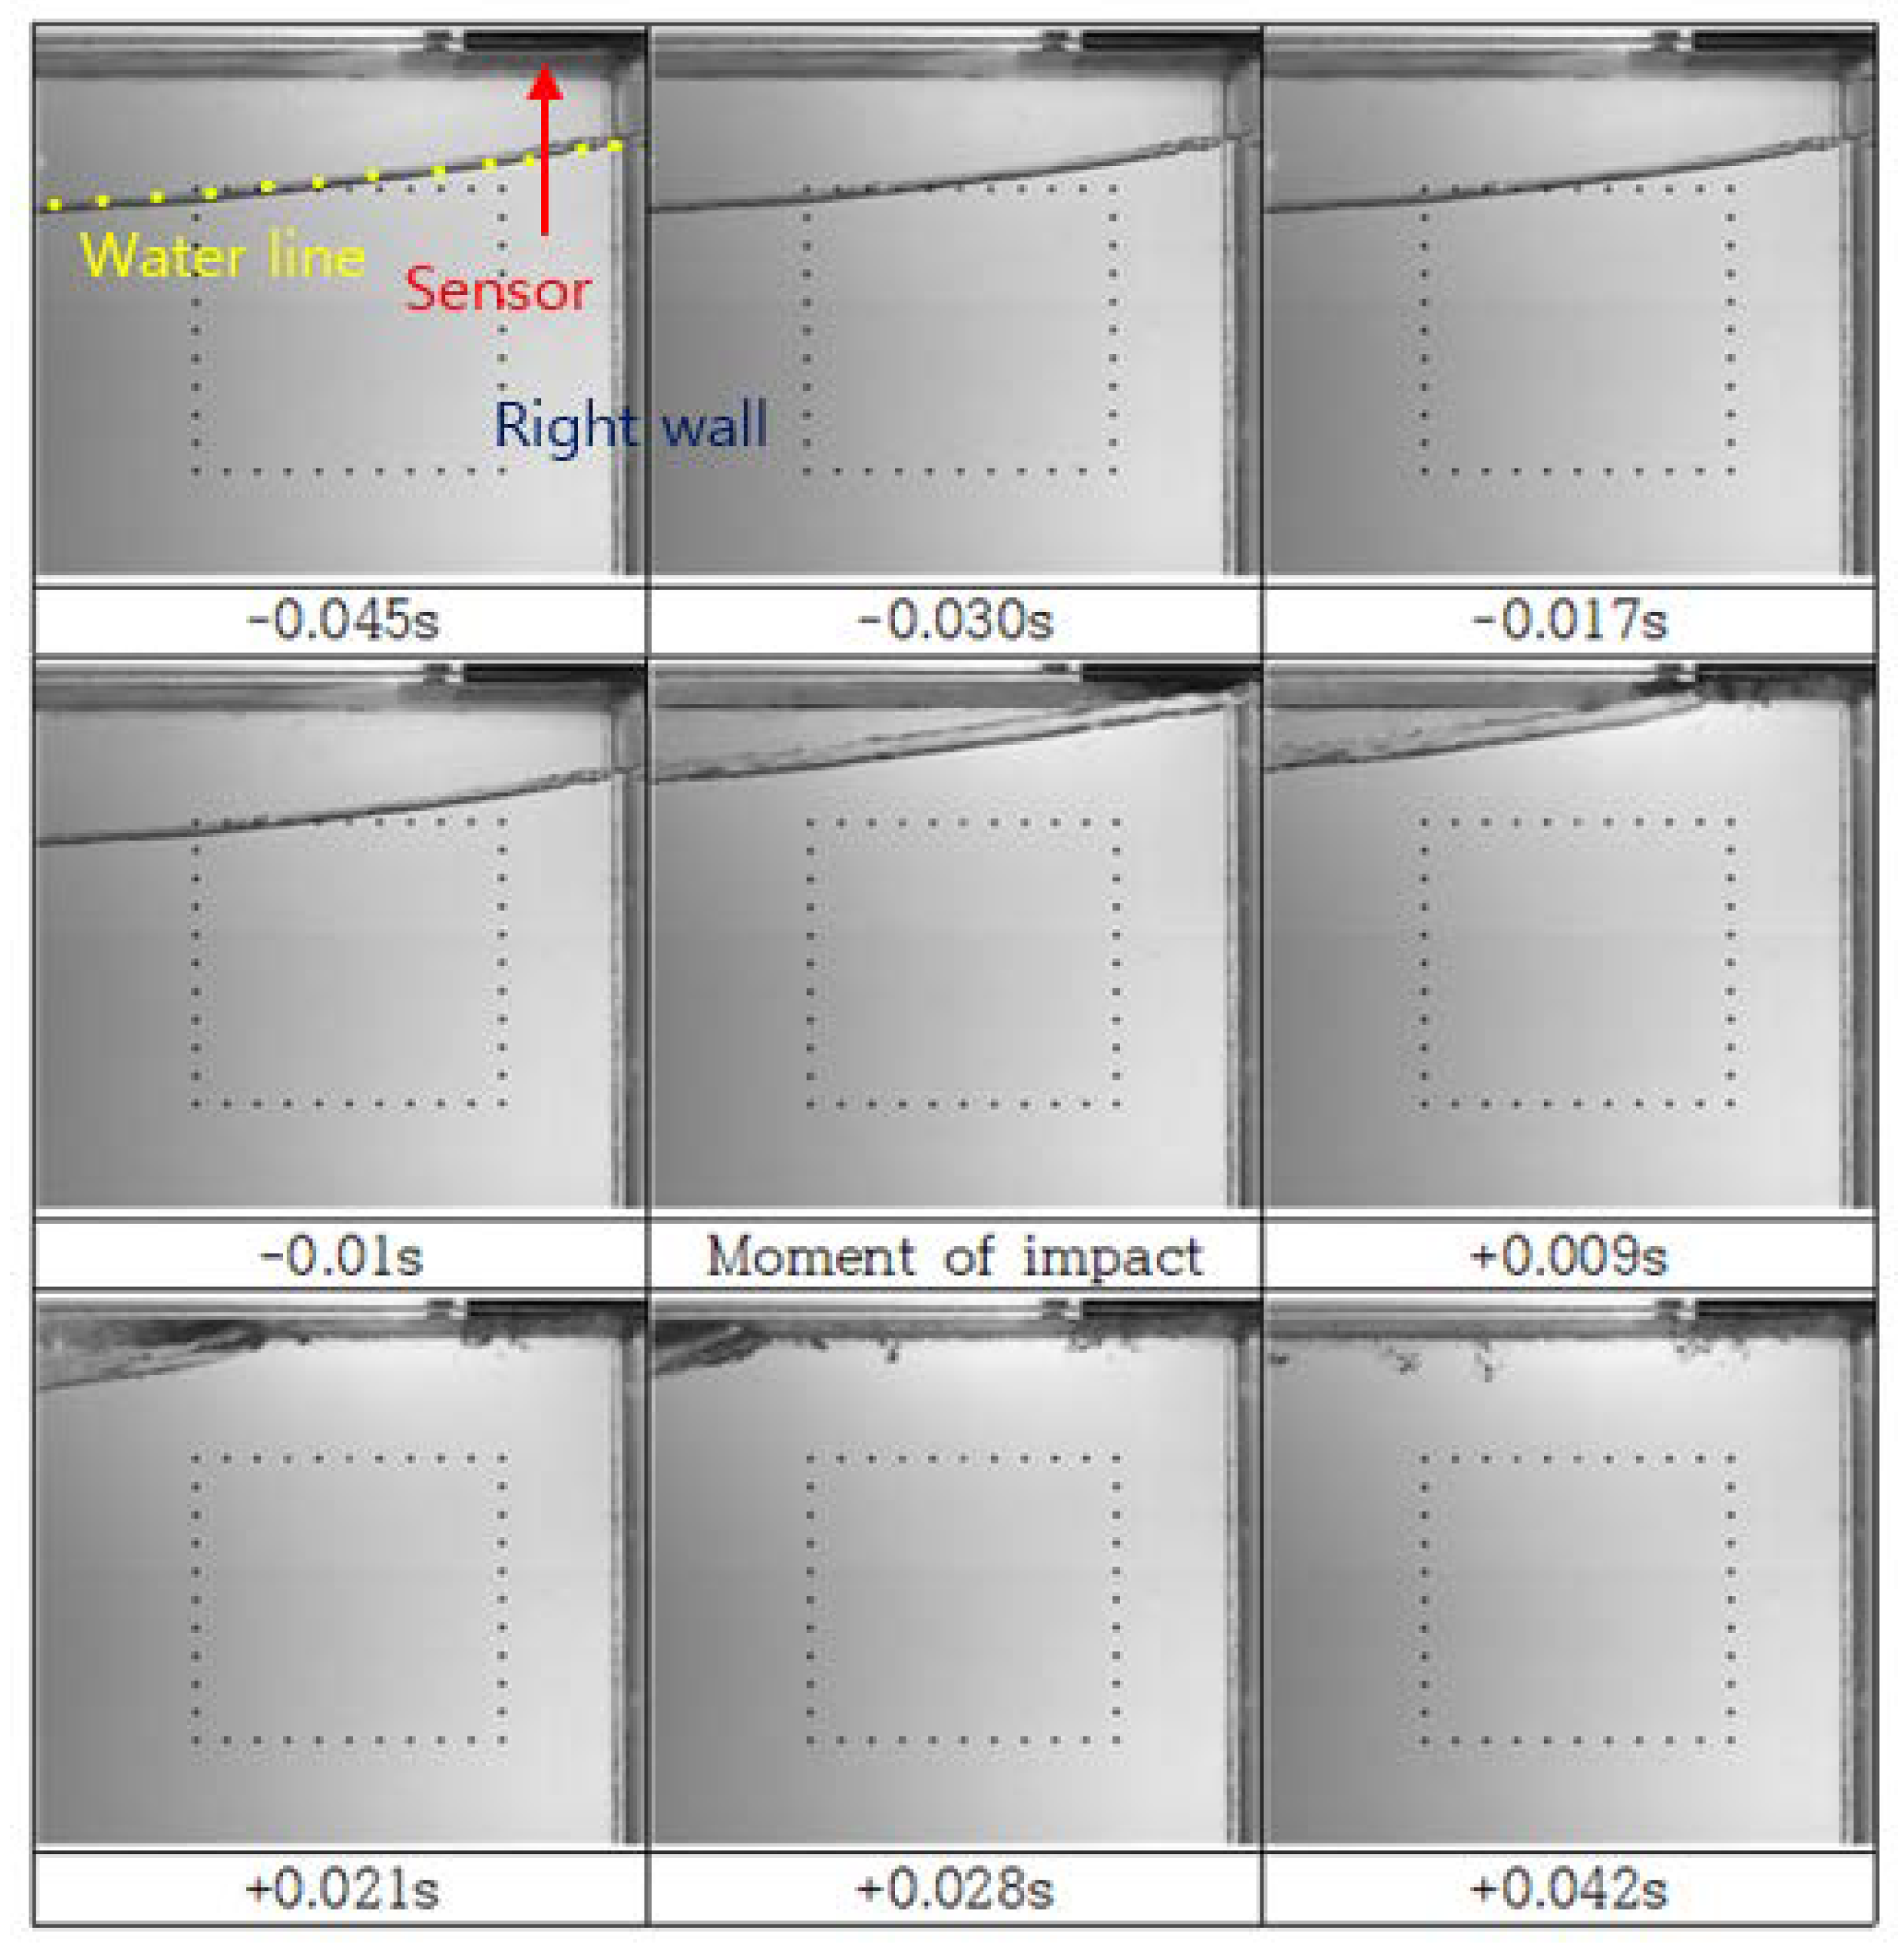
Figure 8.
Snapshots of Flow: SWAY (Dry).
Figure 8.
Snapshots of Flow: SWAY (Dry).
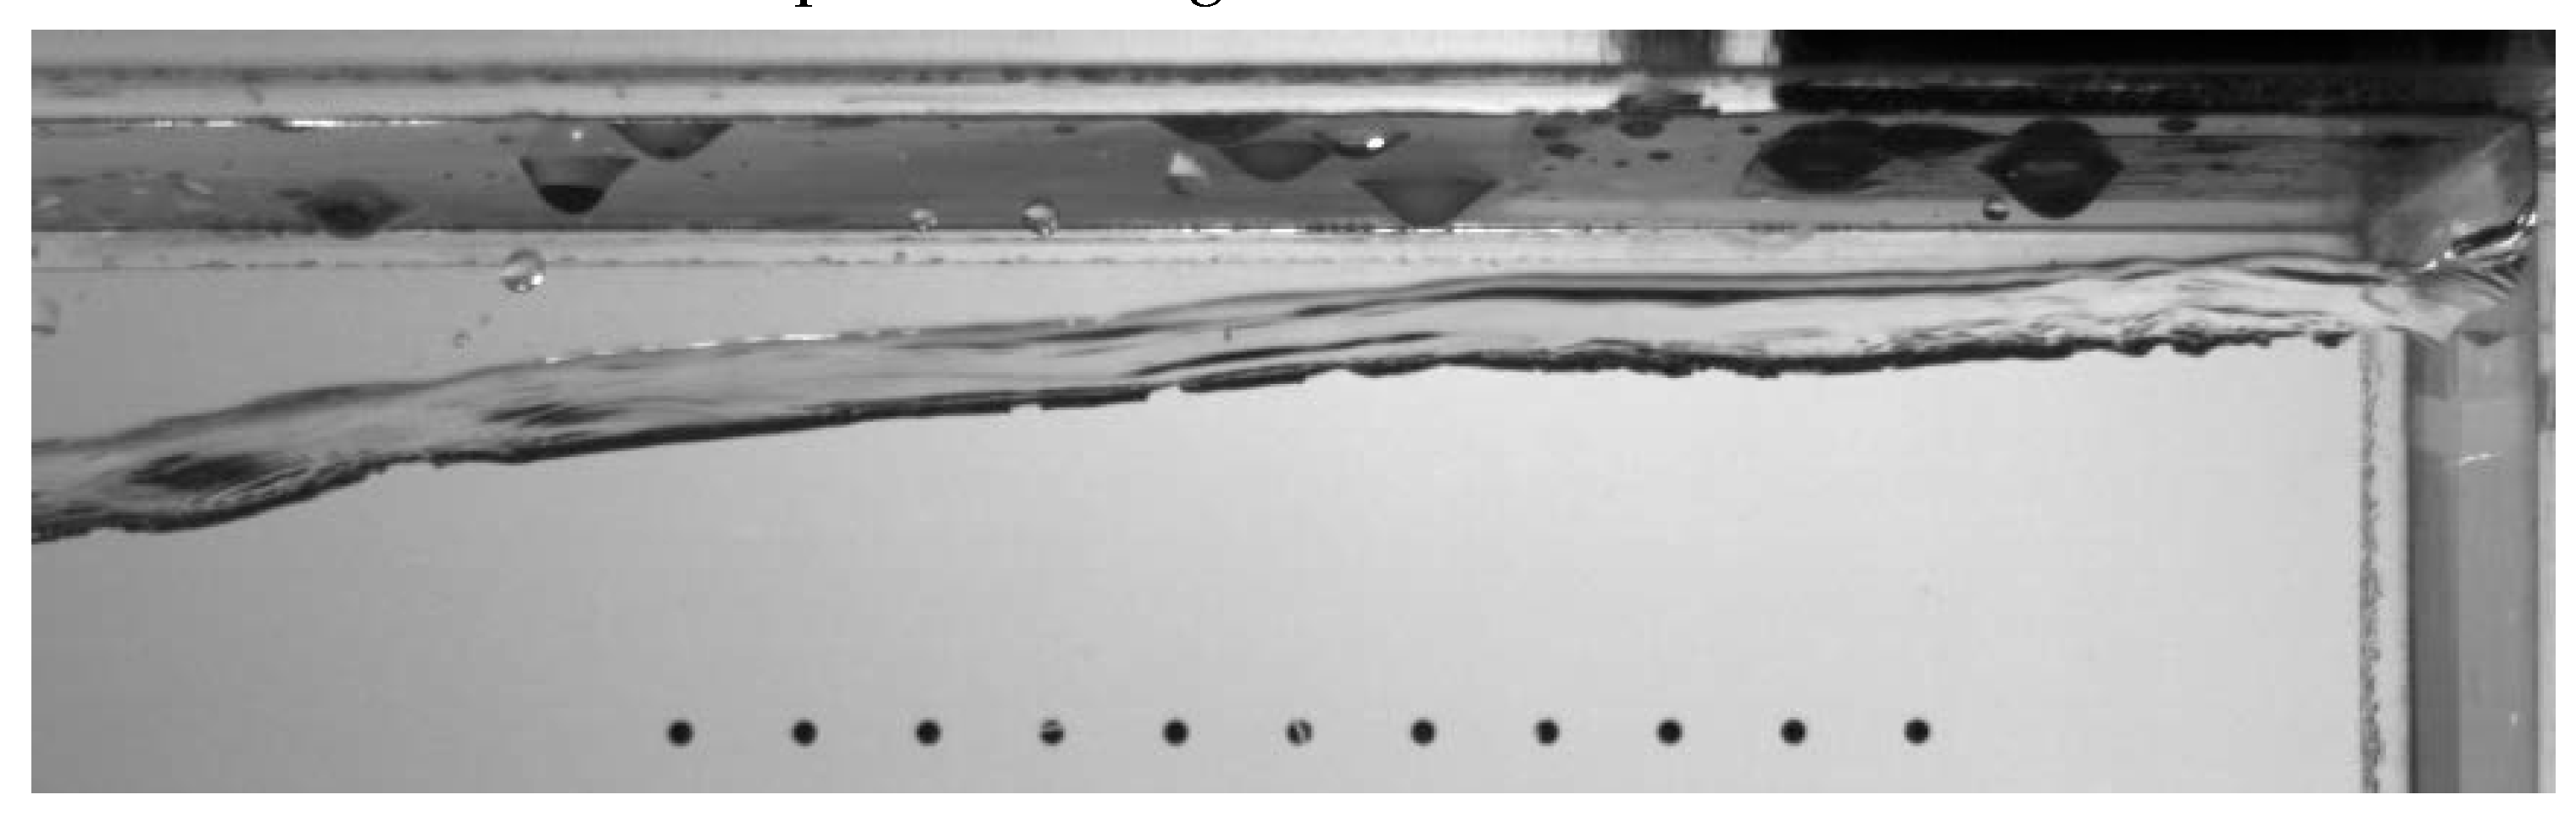
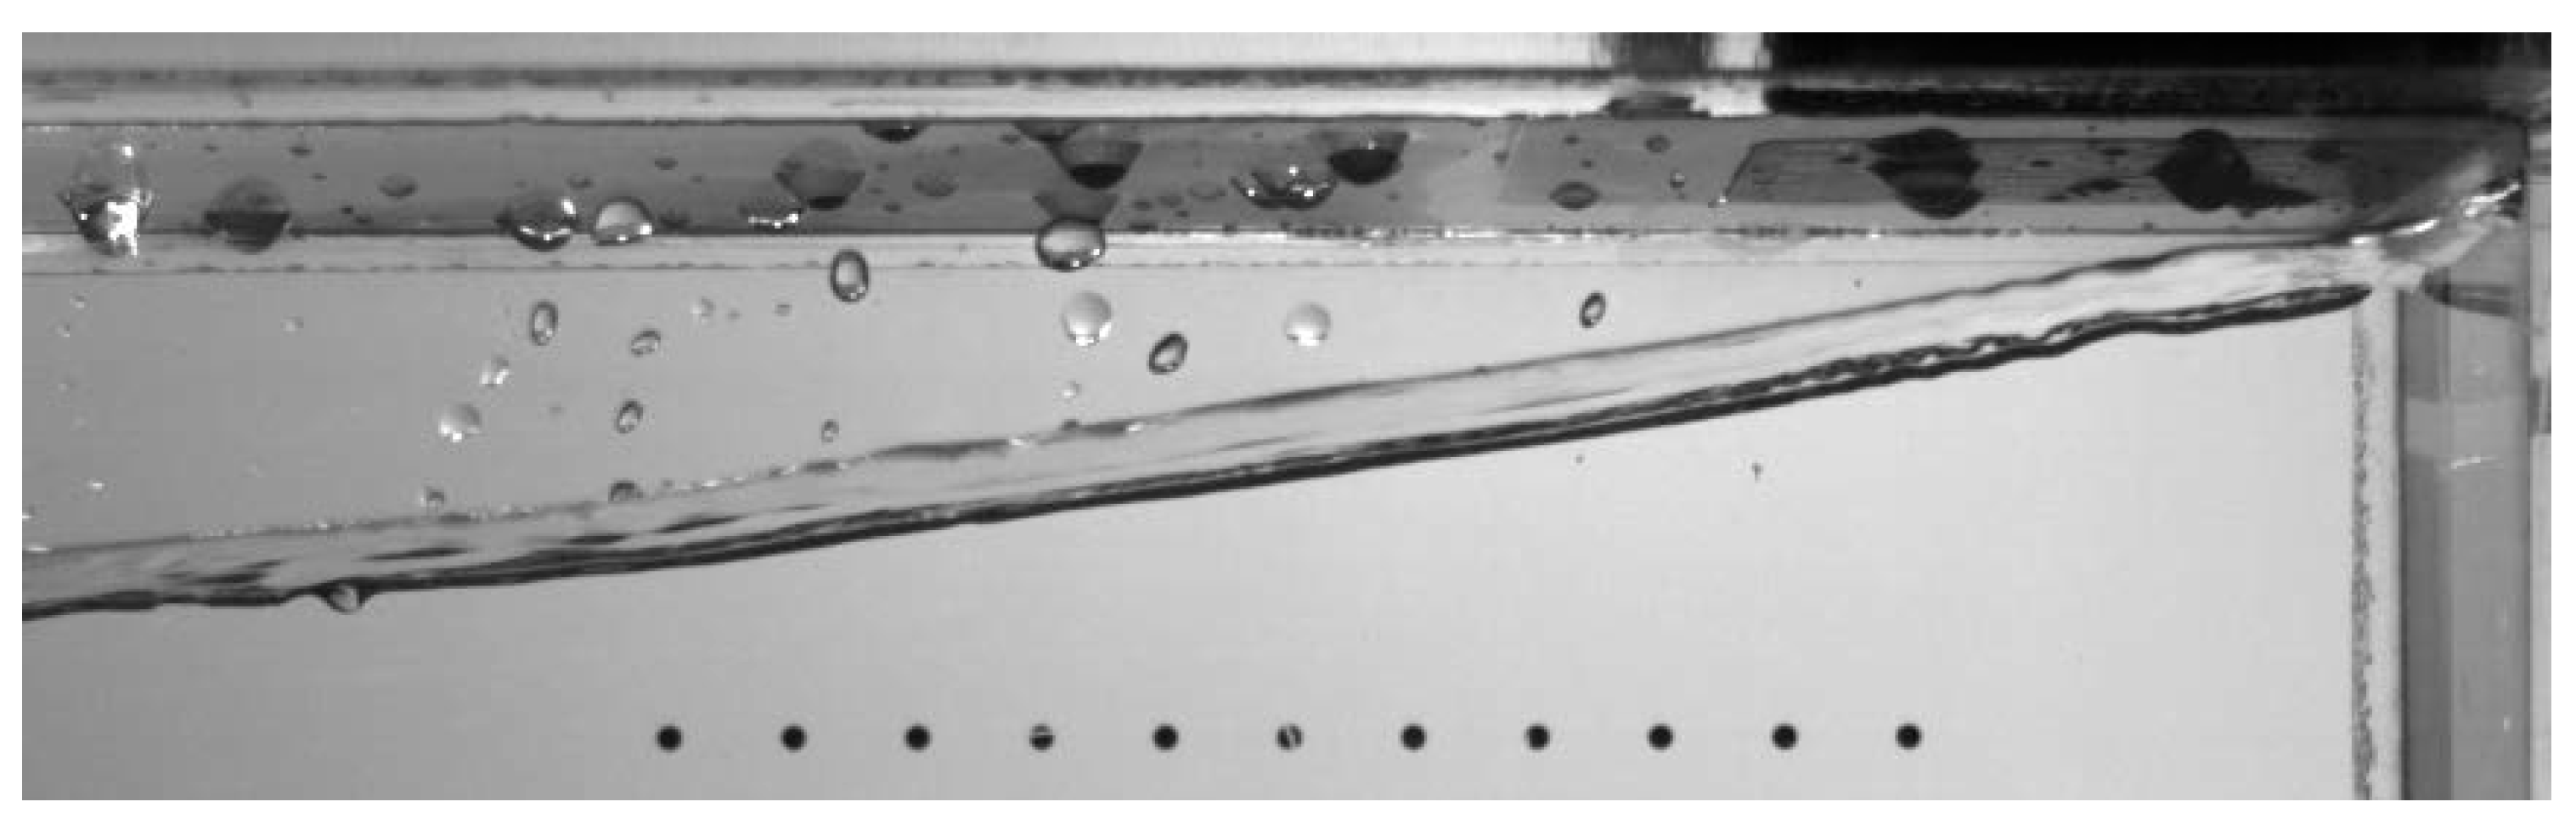
Figure 9.
Snapshots of Flow: SWAY (Wet).
Figure 9.
Snapshots of Flow: SWAY (Wet).
Figure 10.
Snapshots of Flow: ROLL (Dry).
Figure 10.
Snapshots of Flow: ROLL (Dry).
Figure 11.
Snapshots of Flow: ROLL (Wet).
Figure 11.
Snapshots of Flow: ROLL (Wet).
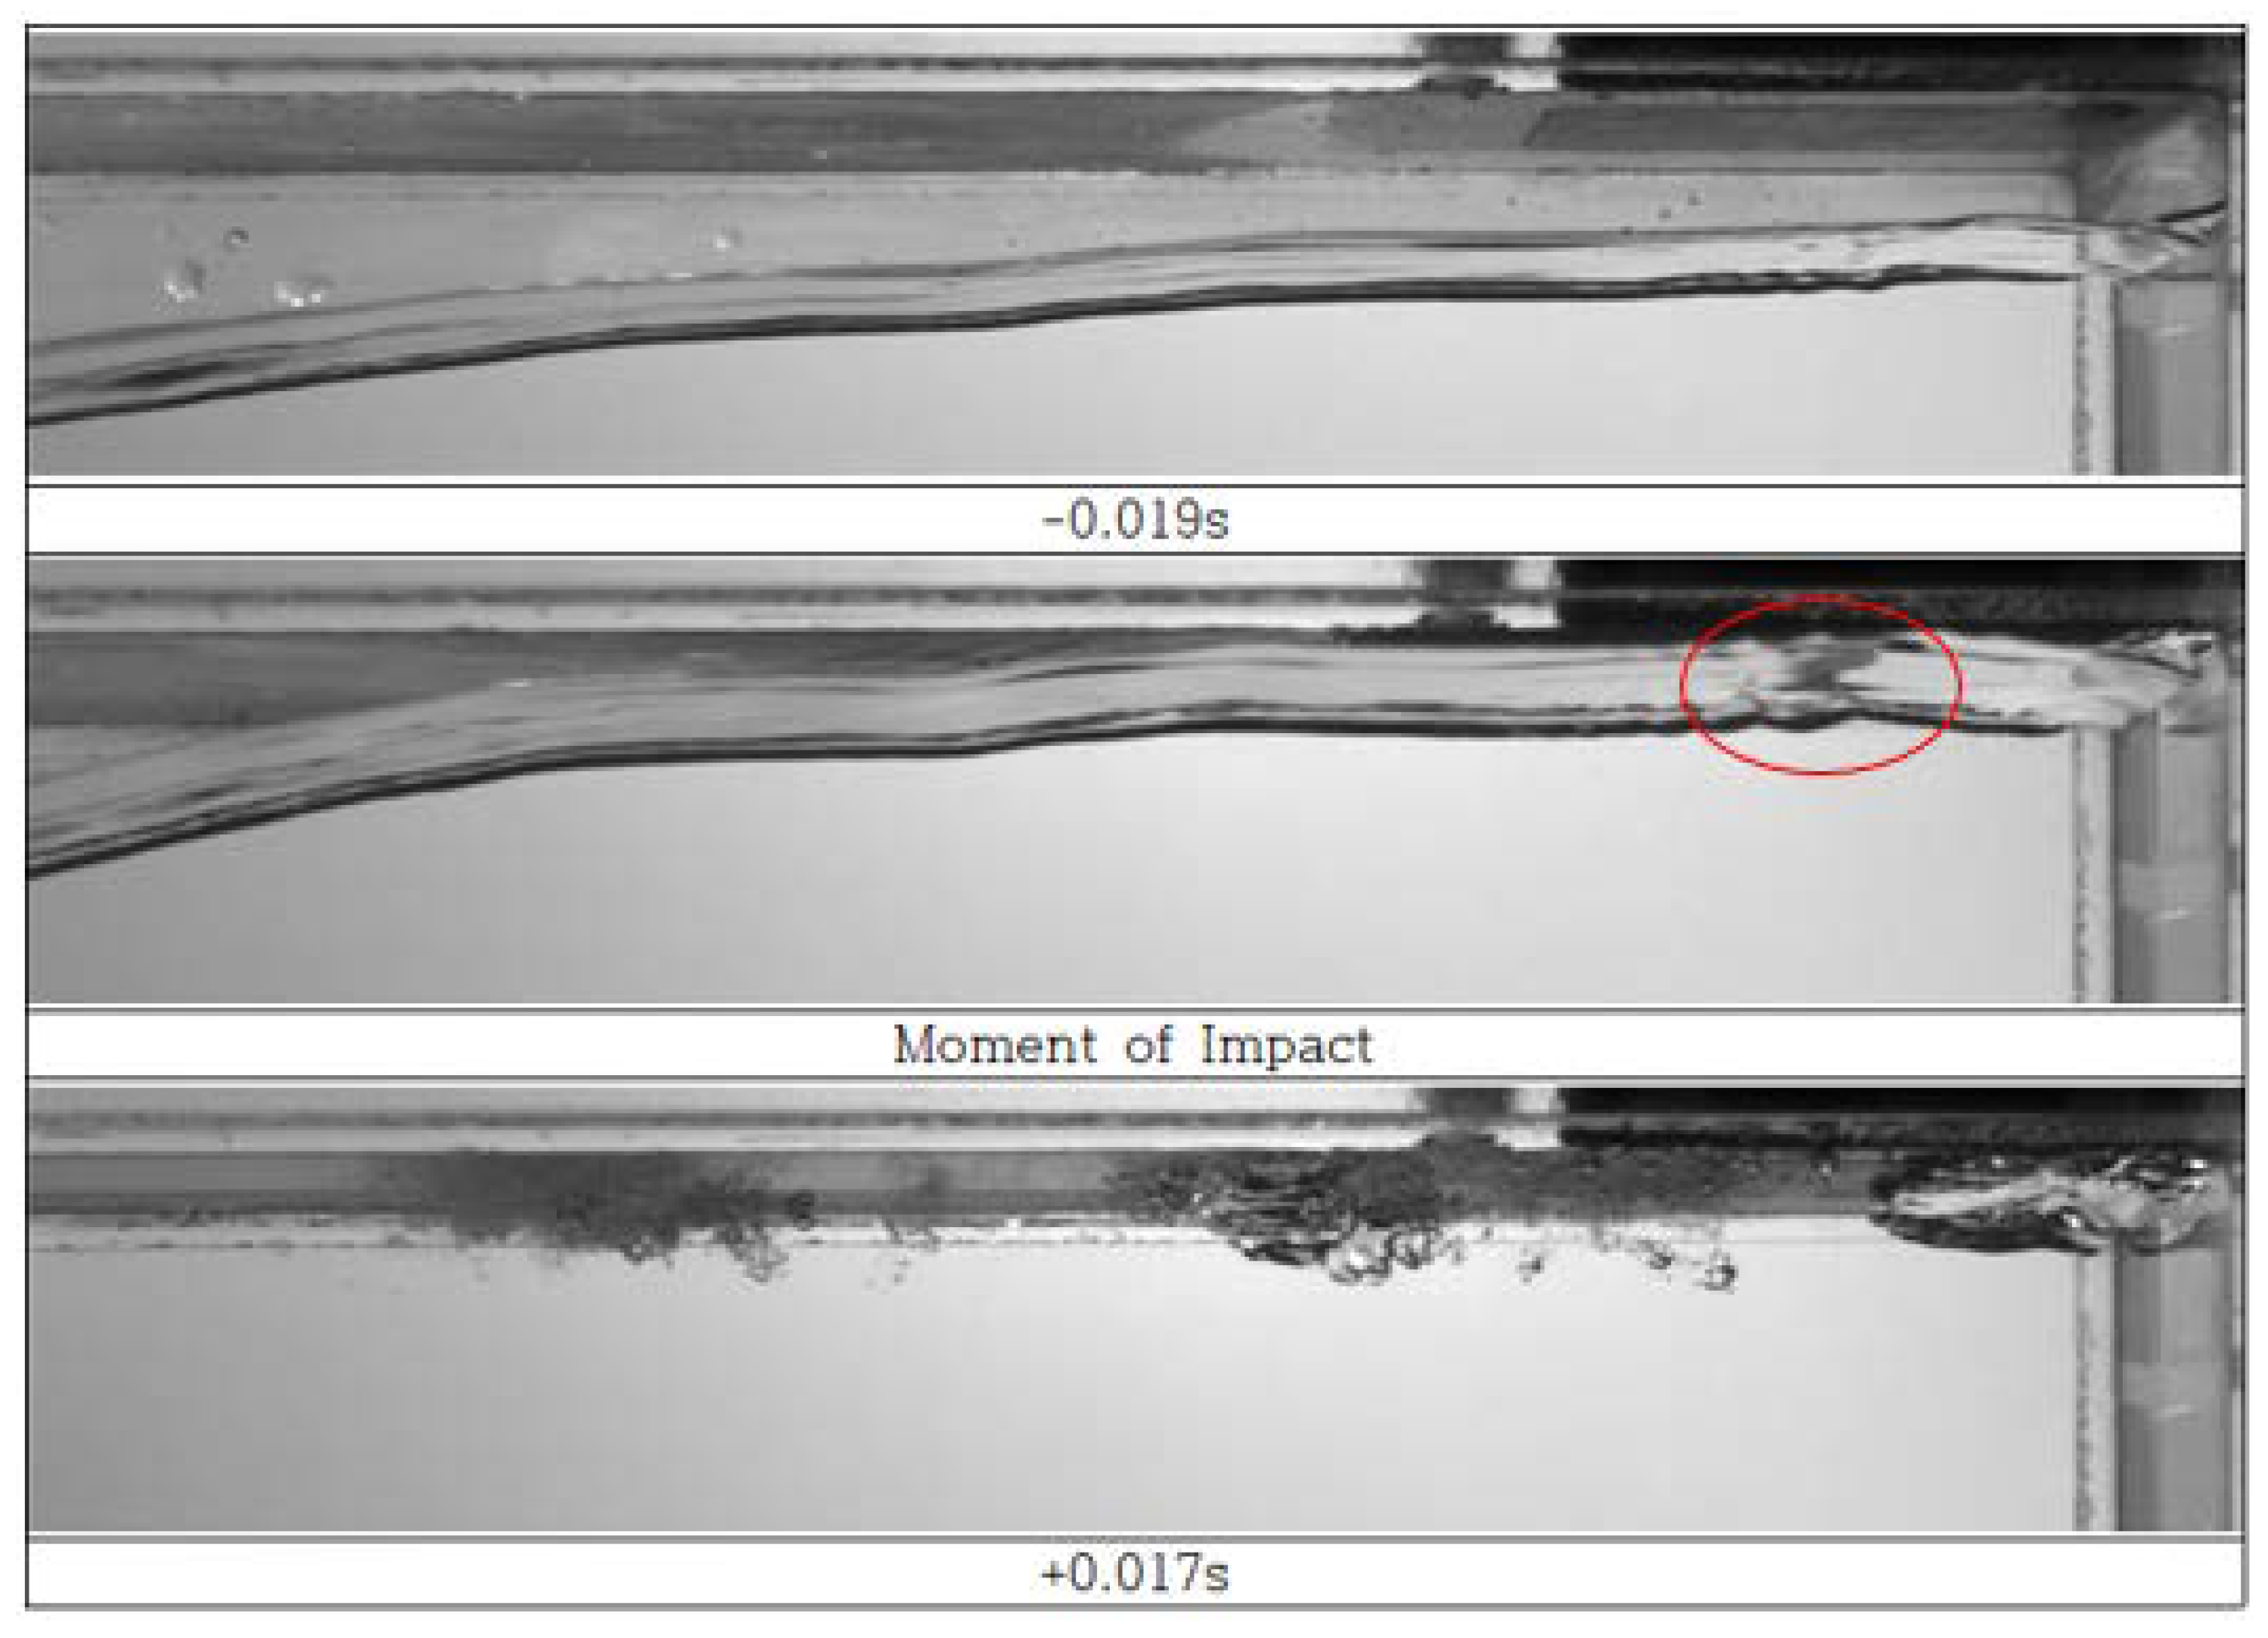
Figure 12.
Snapshots at First Impact: SWAY (Dry).
Figure 12.
Snapshots at First Impact: SWAY (Dry).
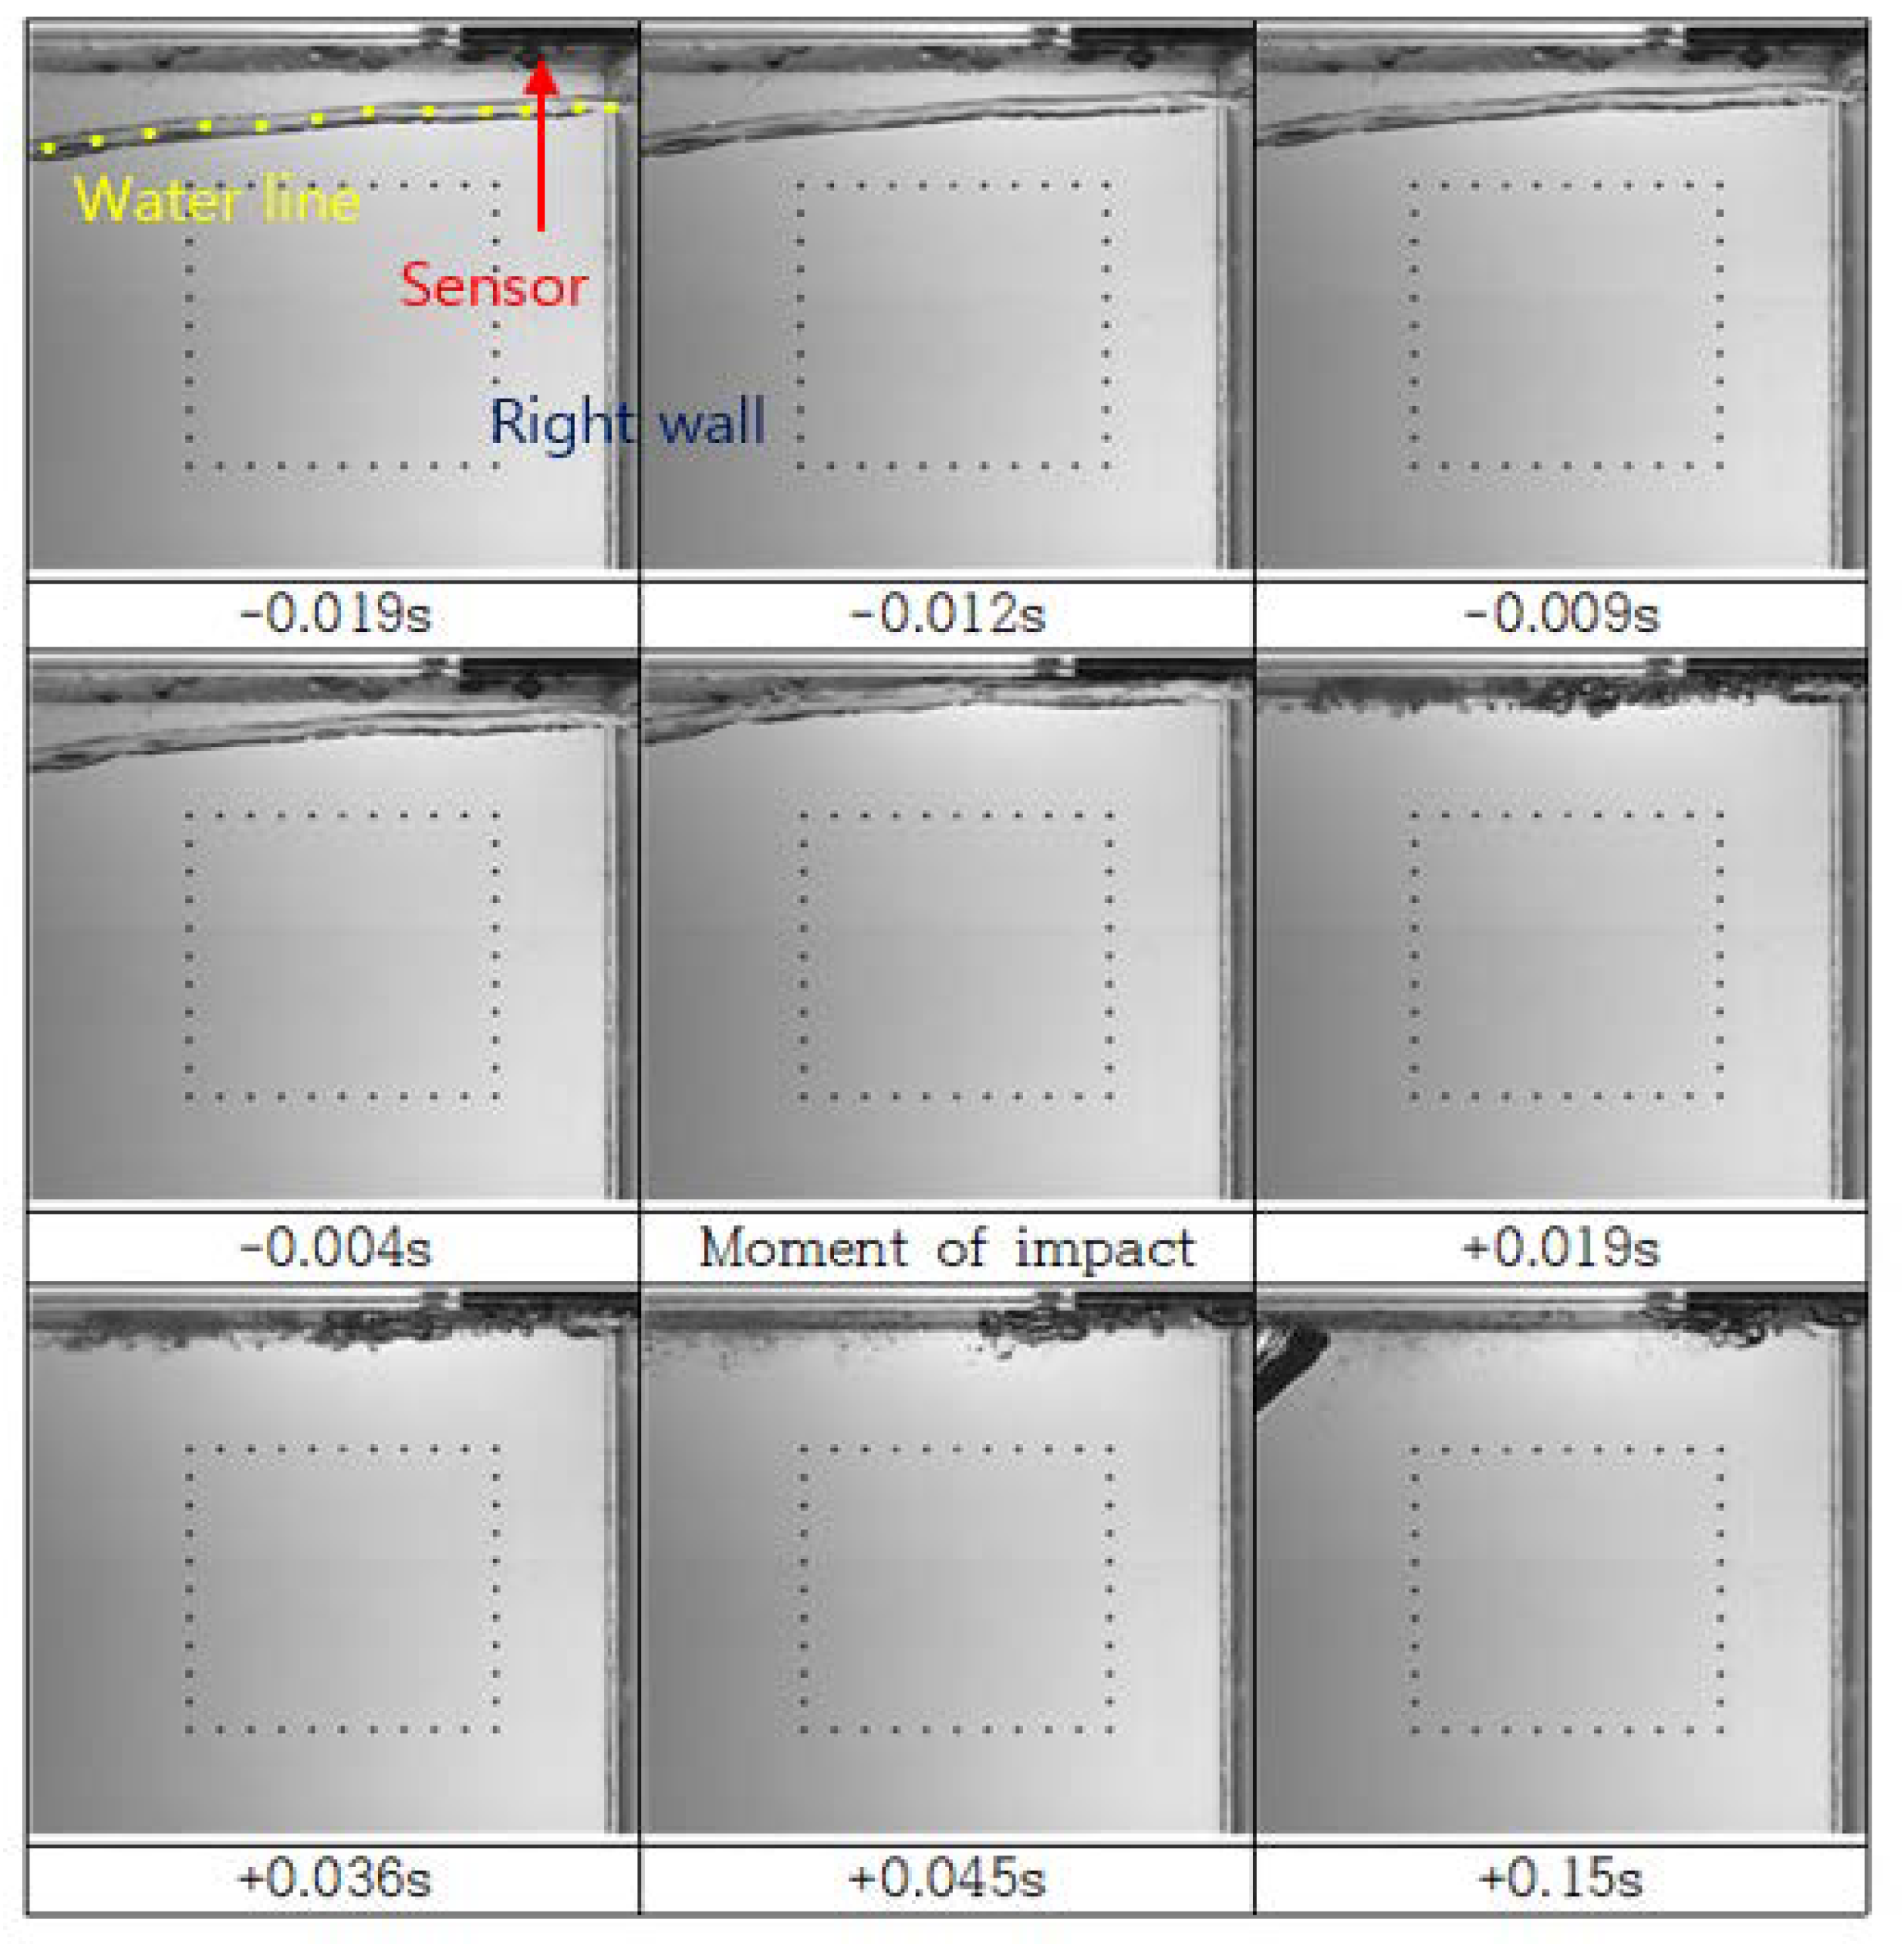
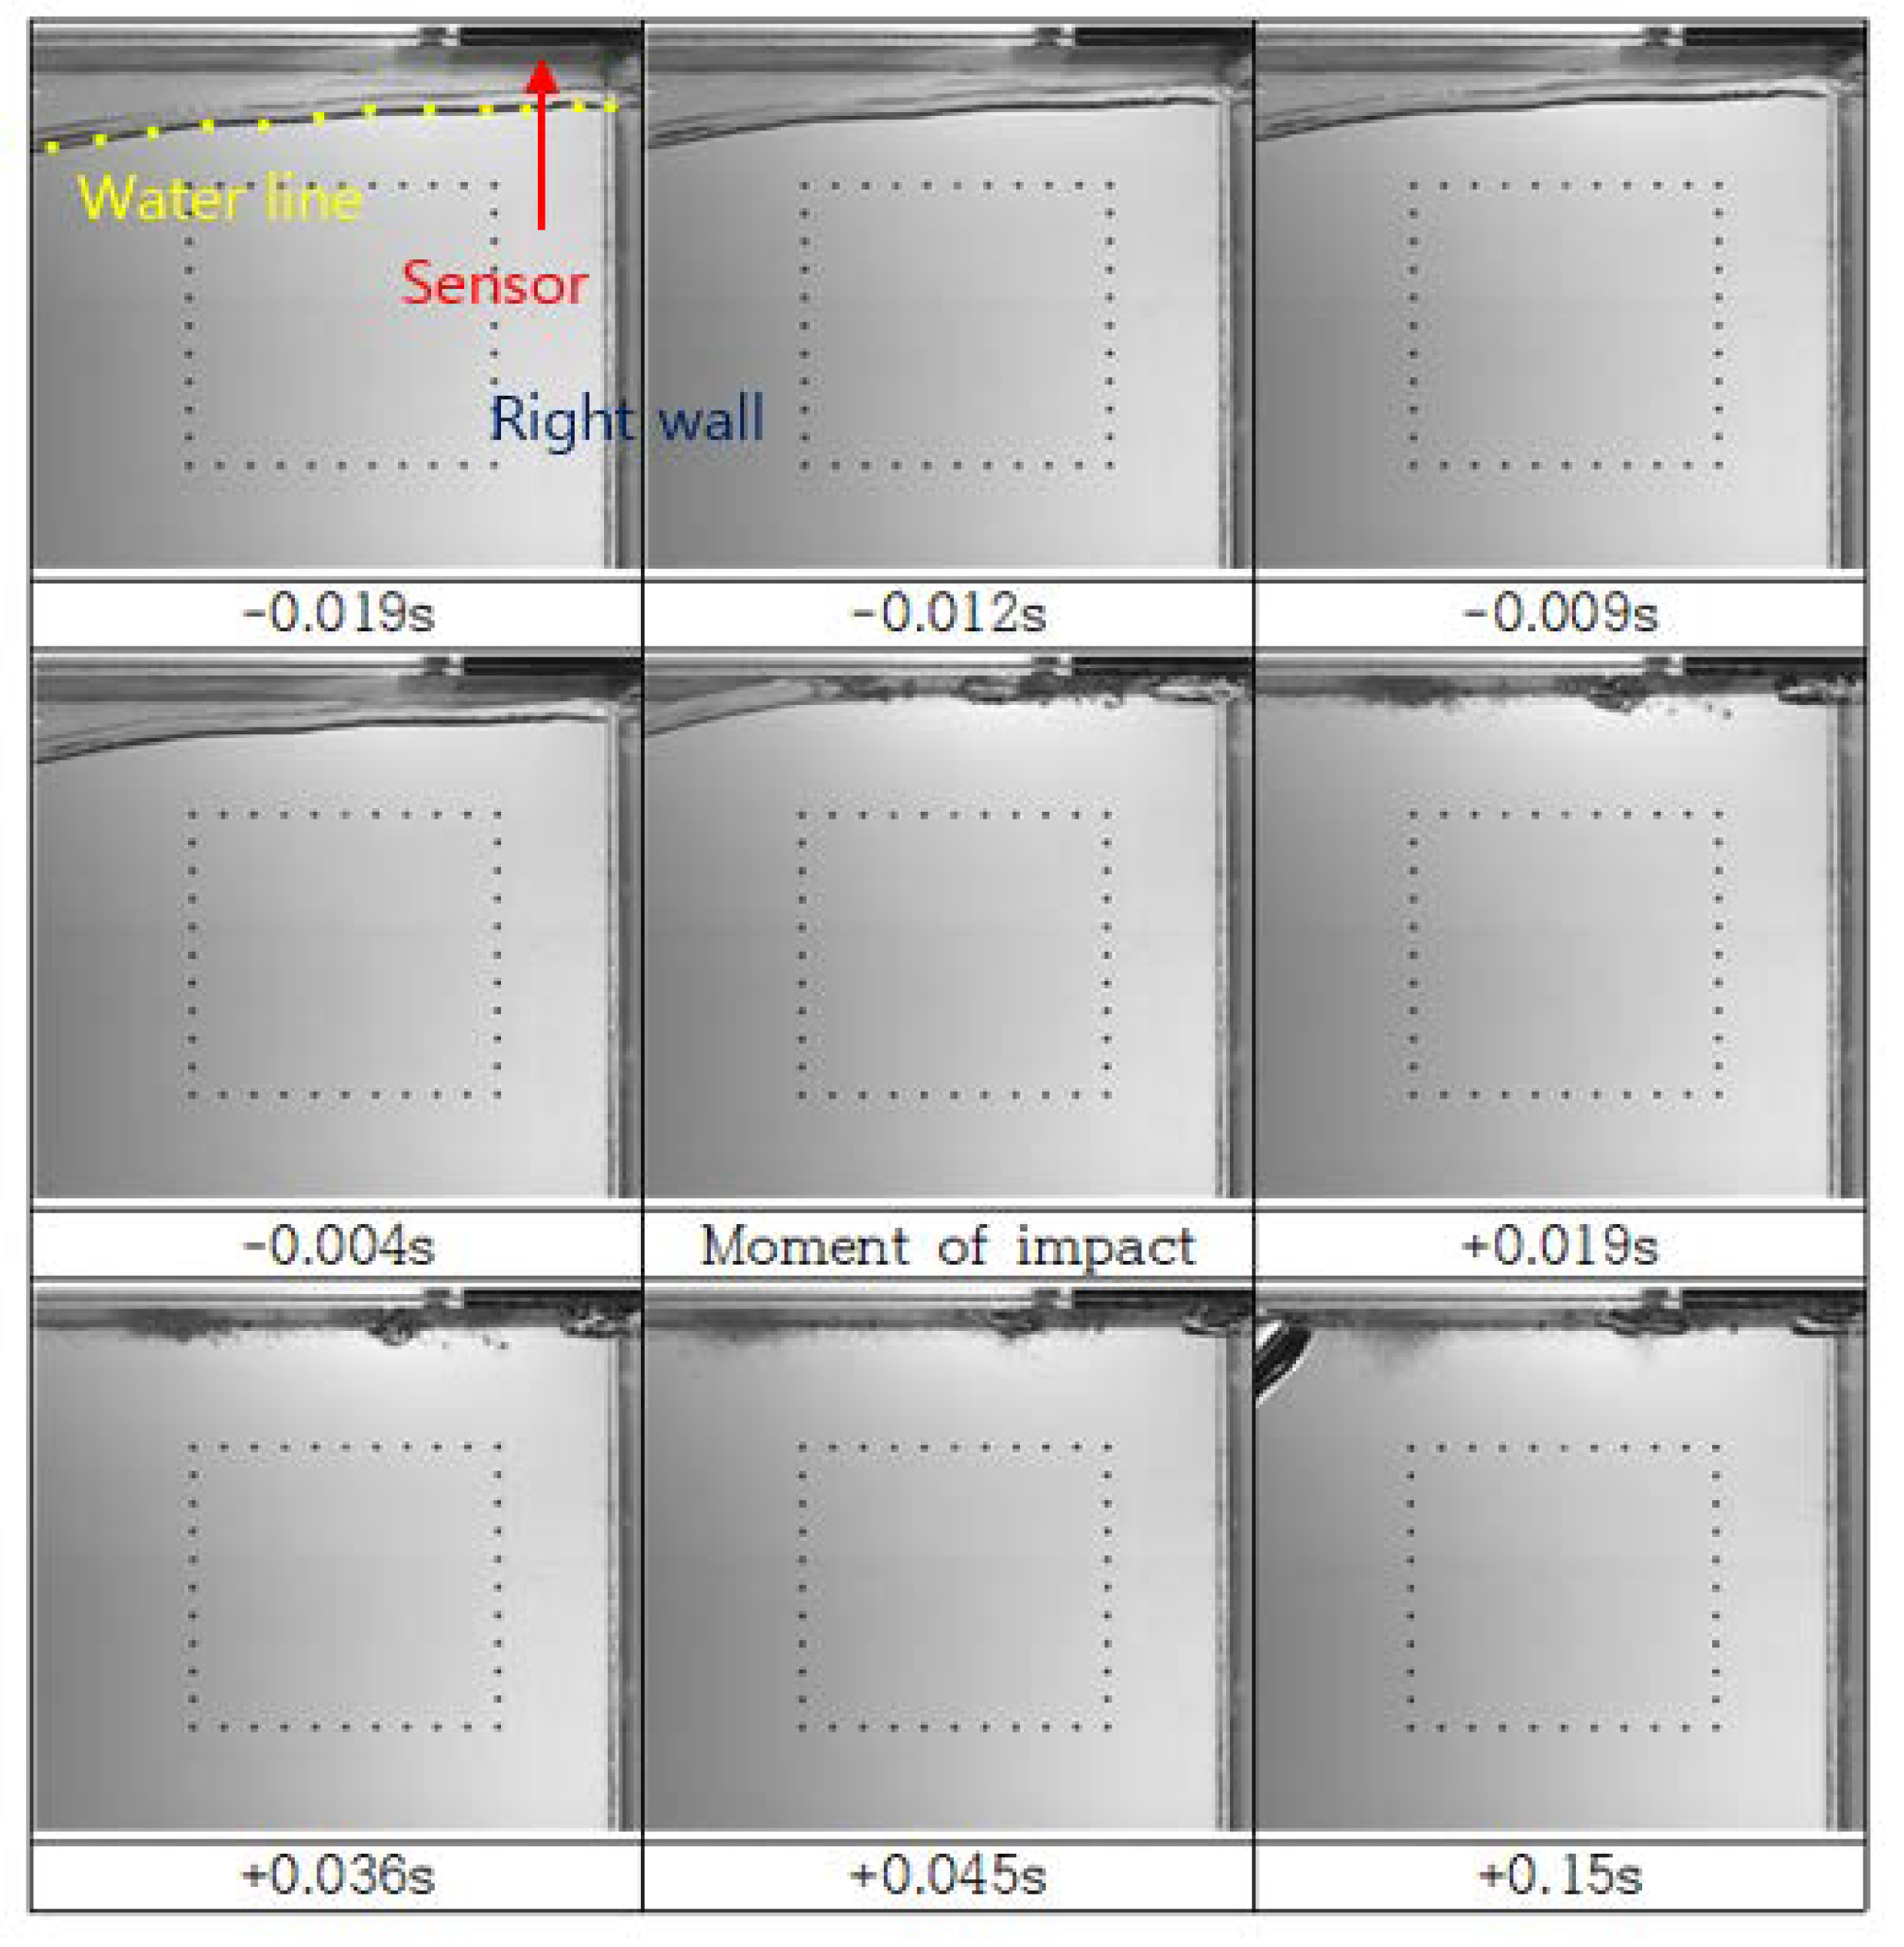
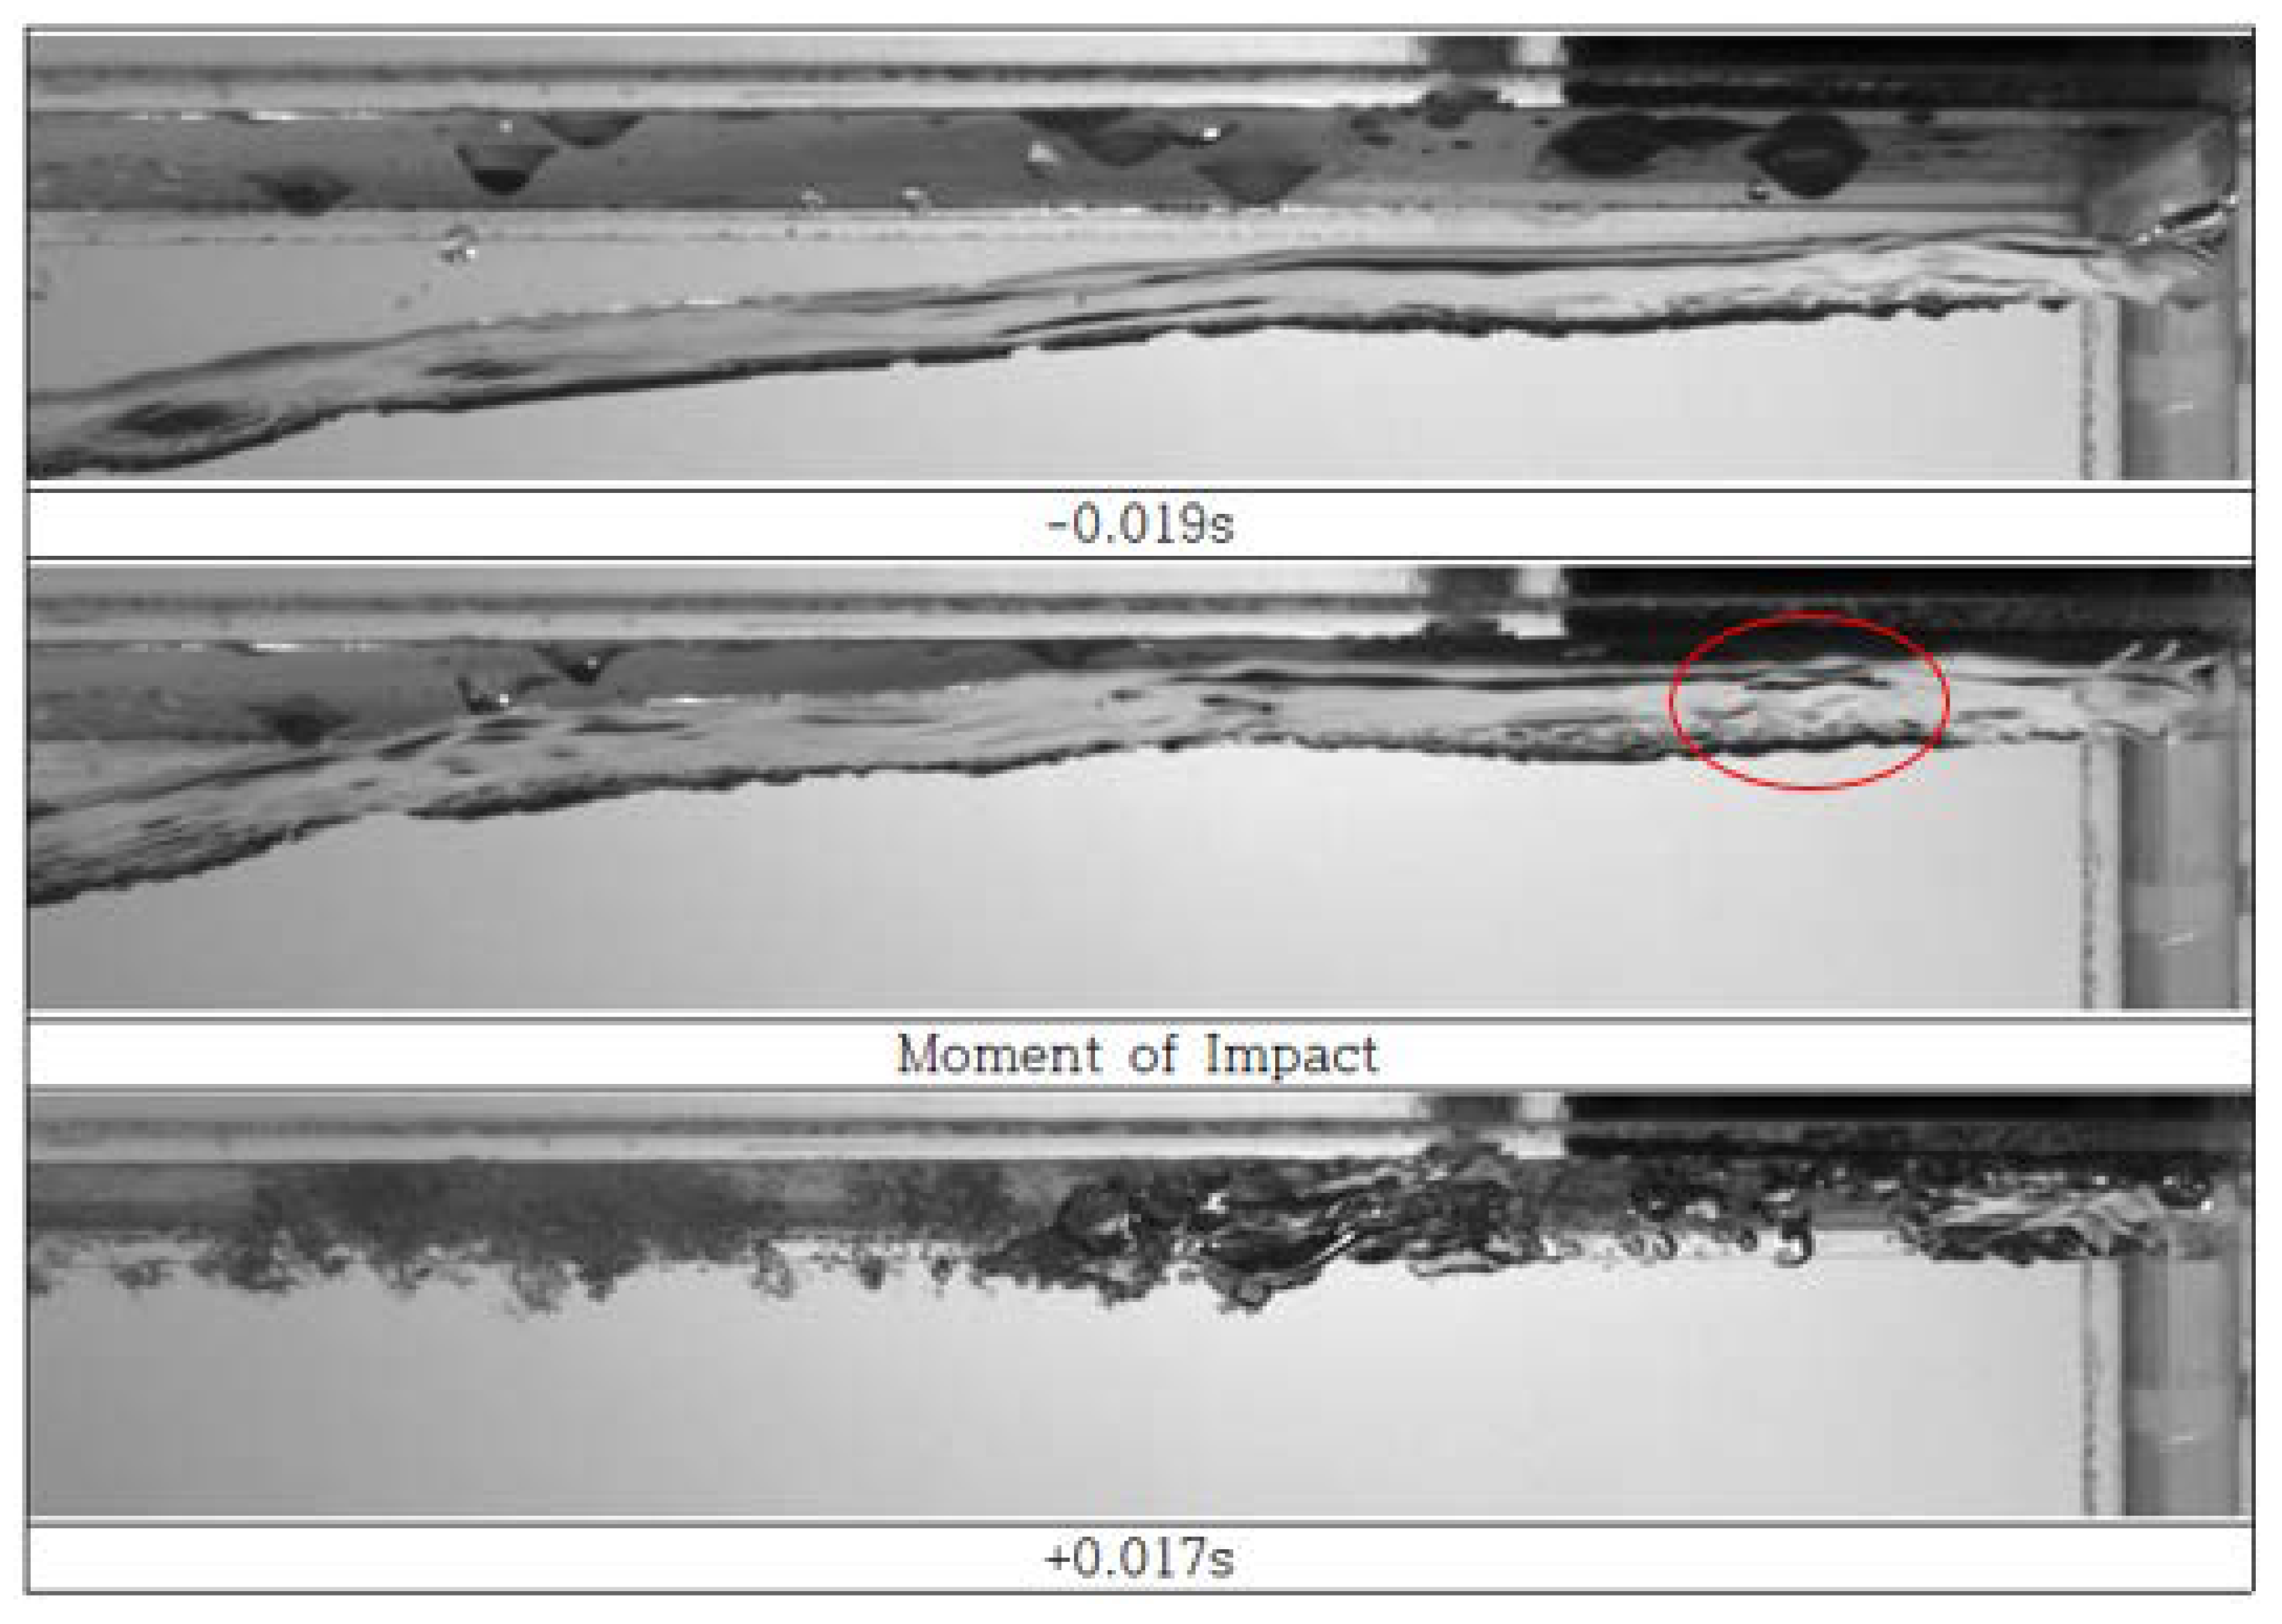
Figure 13.
Snapshots at First Impact: SWAY (Wet).
Figure 13.
Snapshots at First Impact: SWAY (Wet).
Figure 14.
Snapshots at First Impact: ROLL (Dry).
Figure 14.
Snapshots at First Impact: ROLL (Dry).
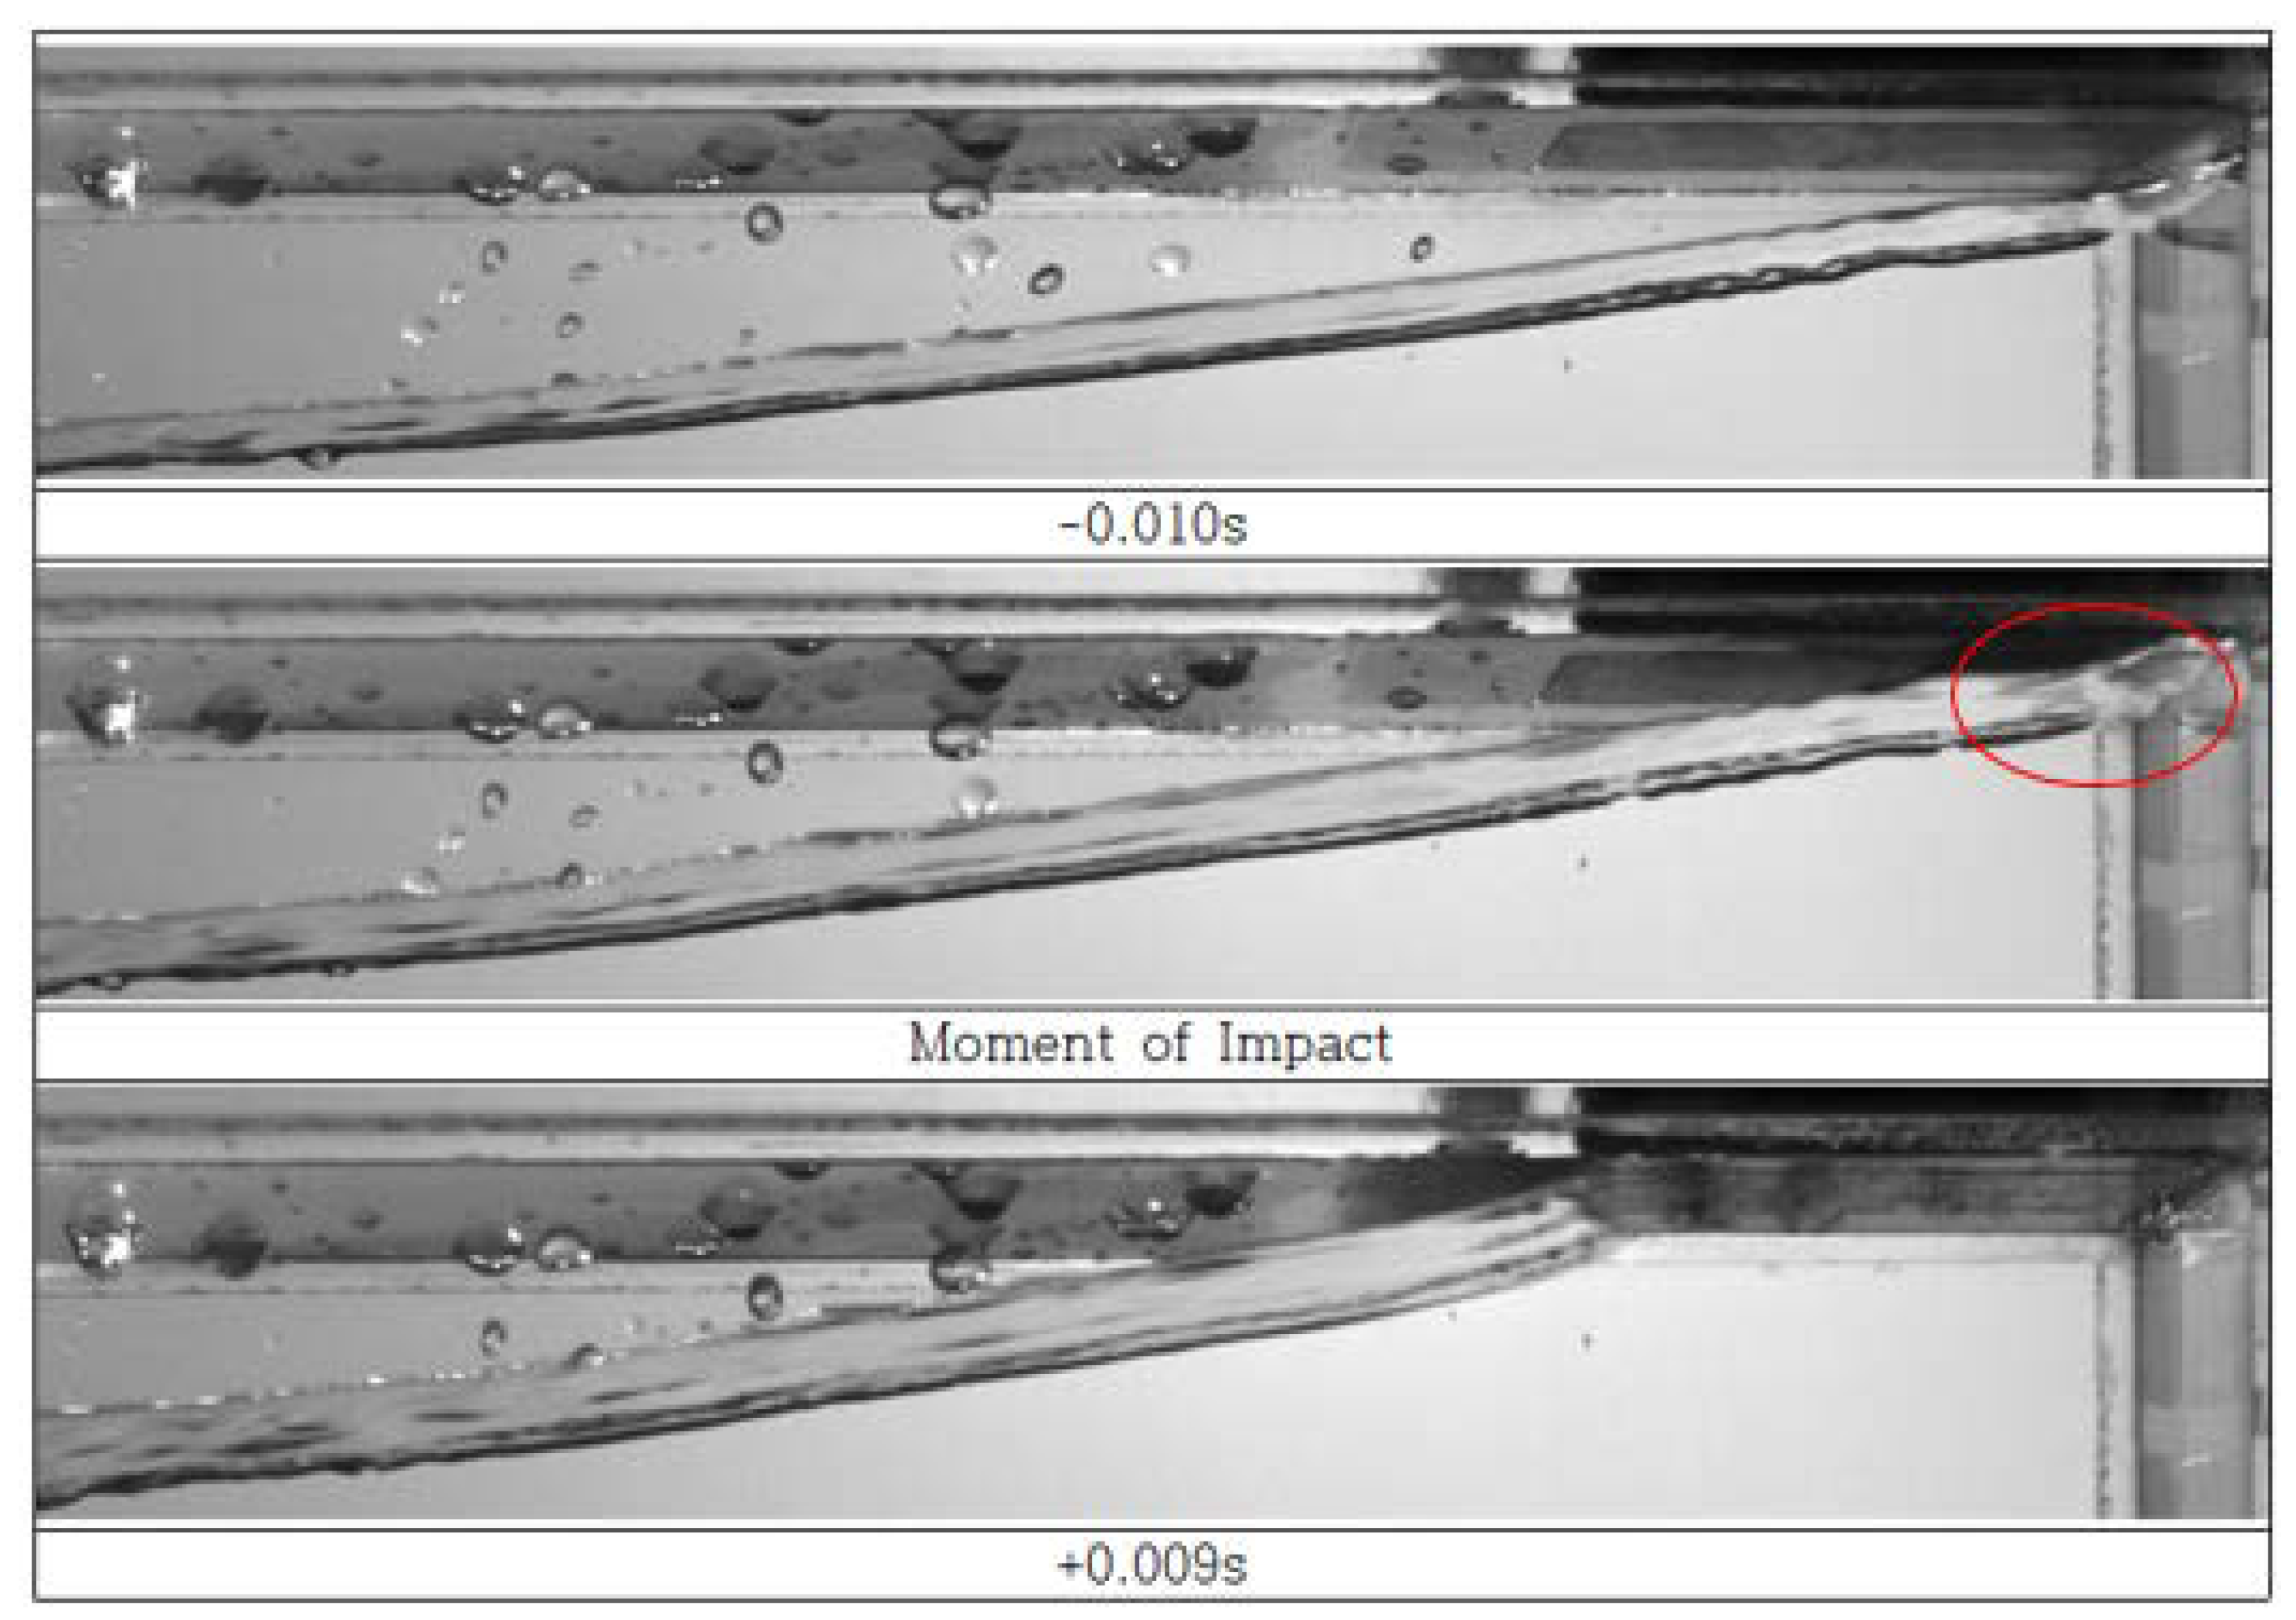
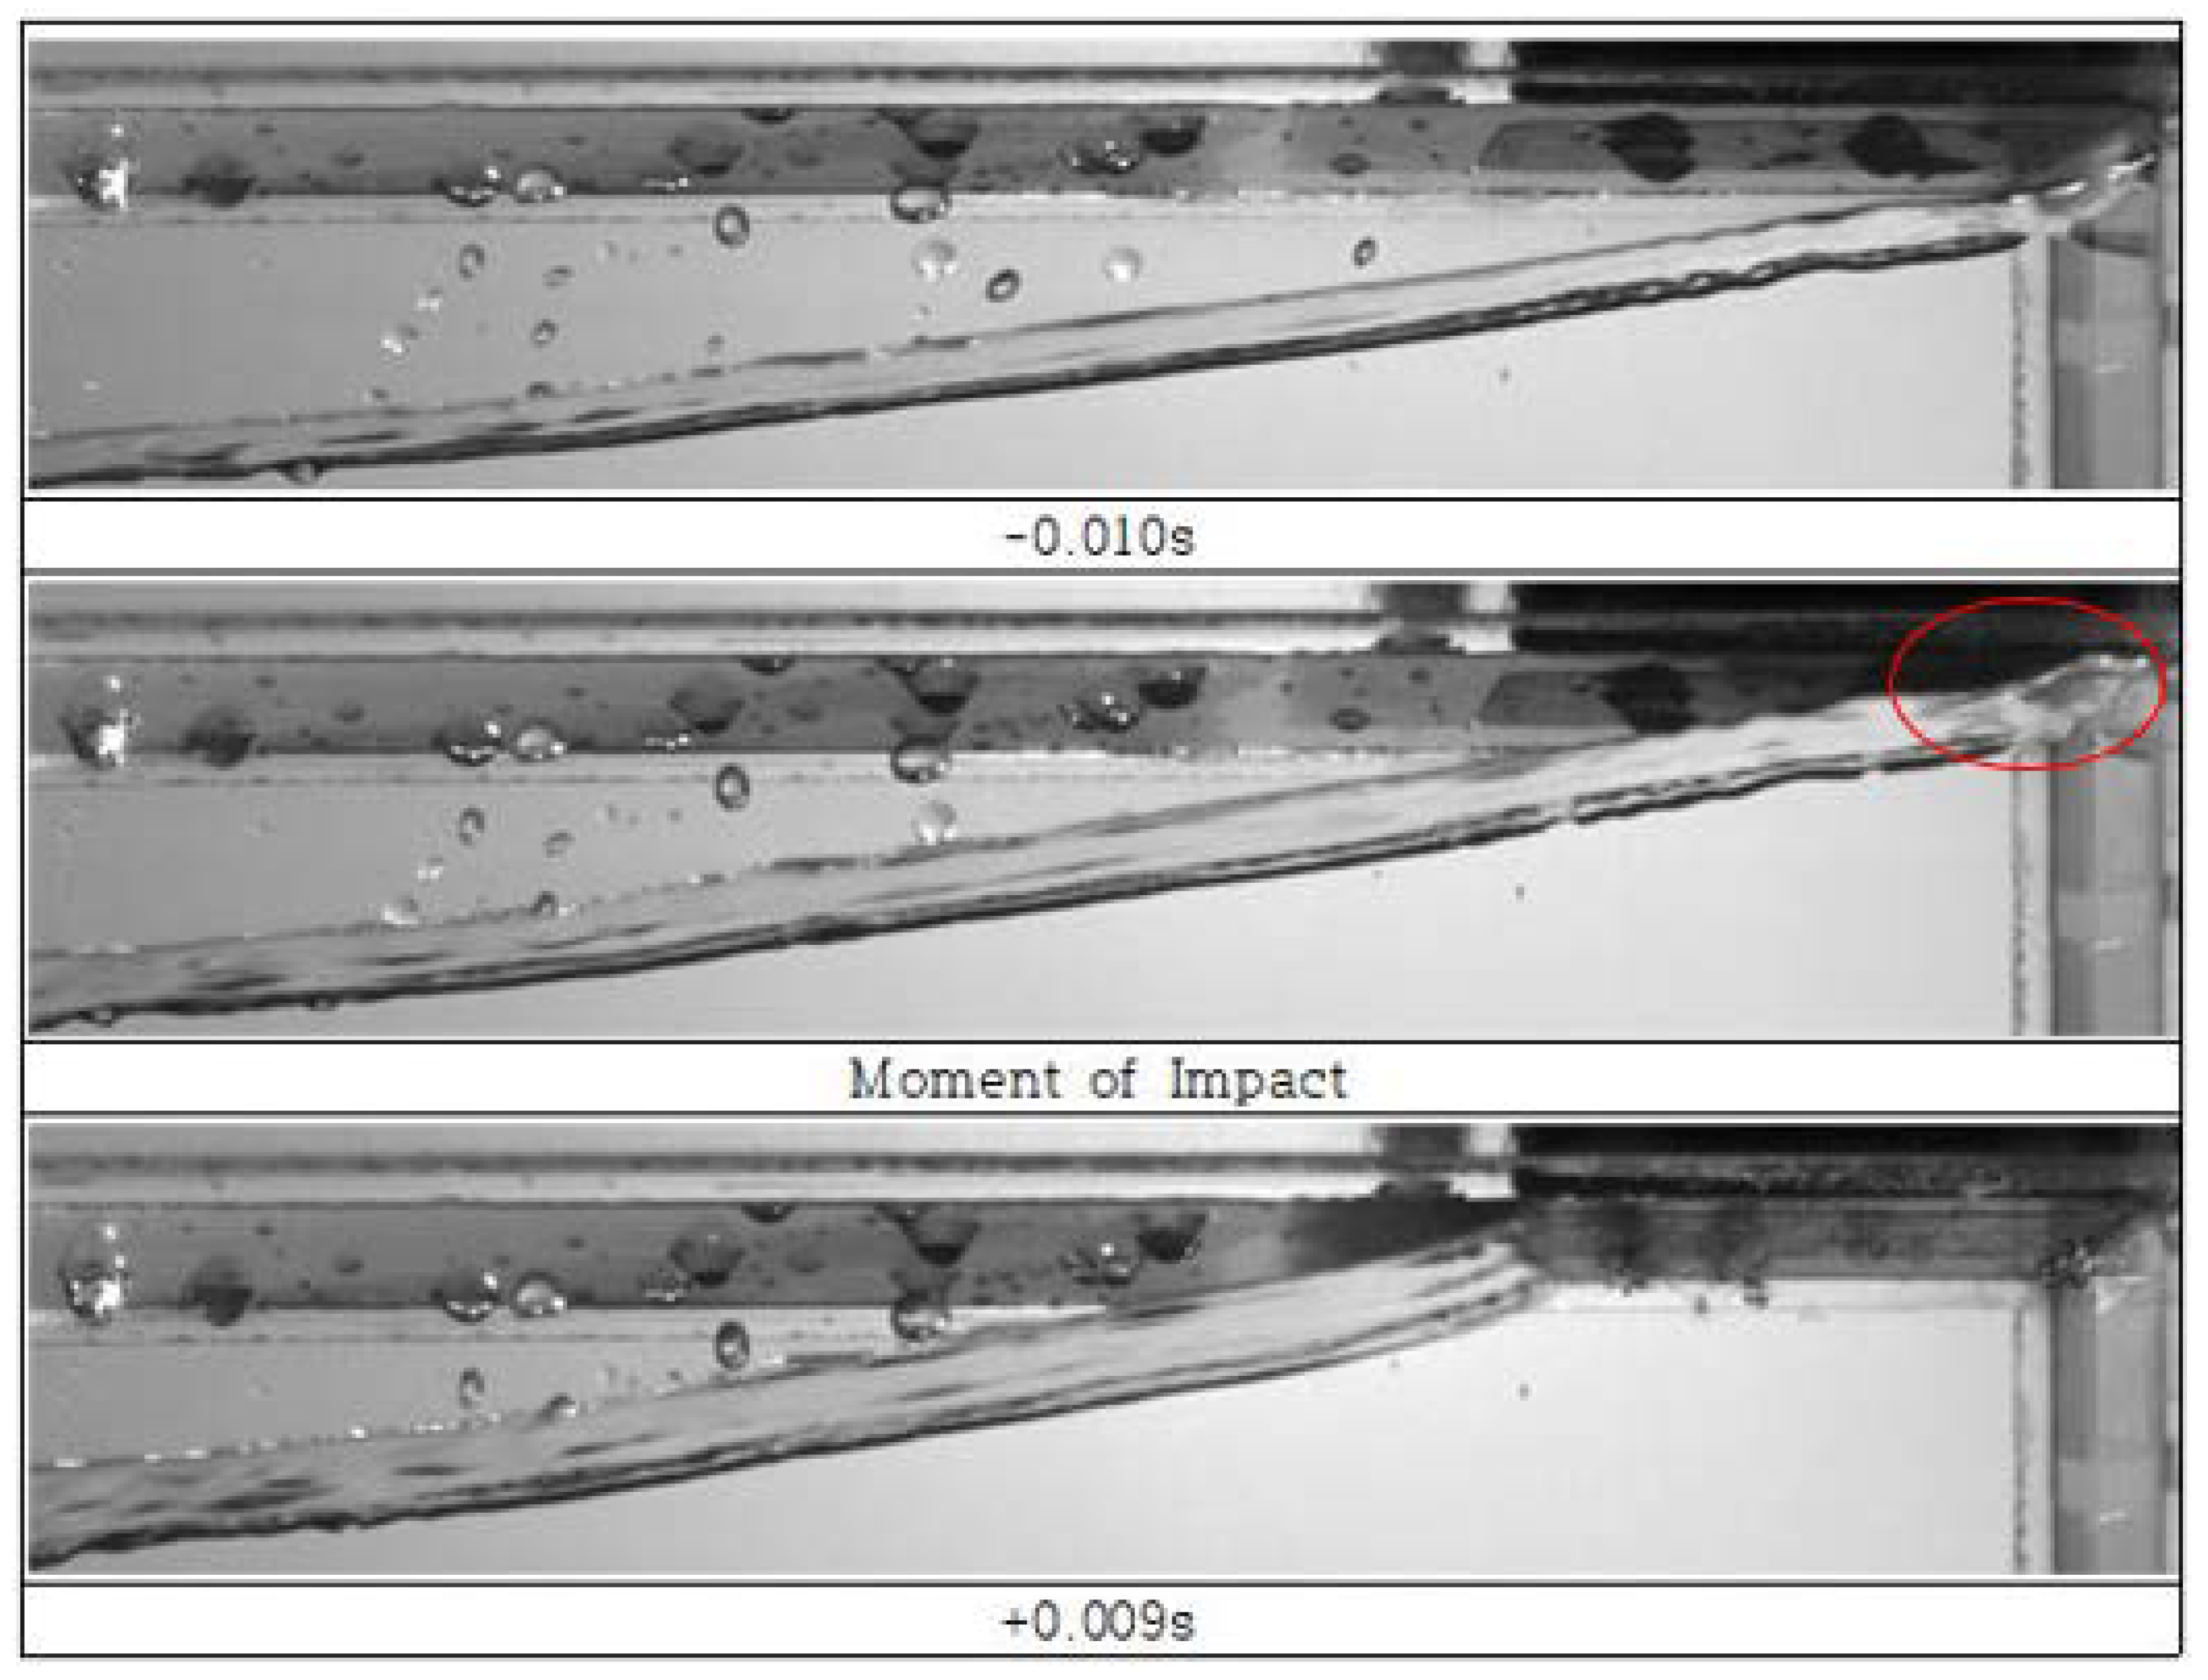
Figure 15.
Snapshots at First Impact: ROLL (Wet).
Figure 15.
Snapshots at First Impact: ROLL (Wet).
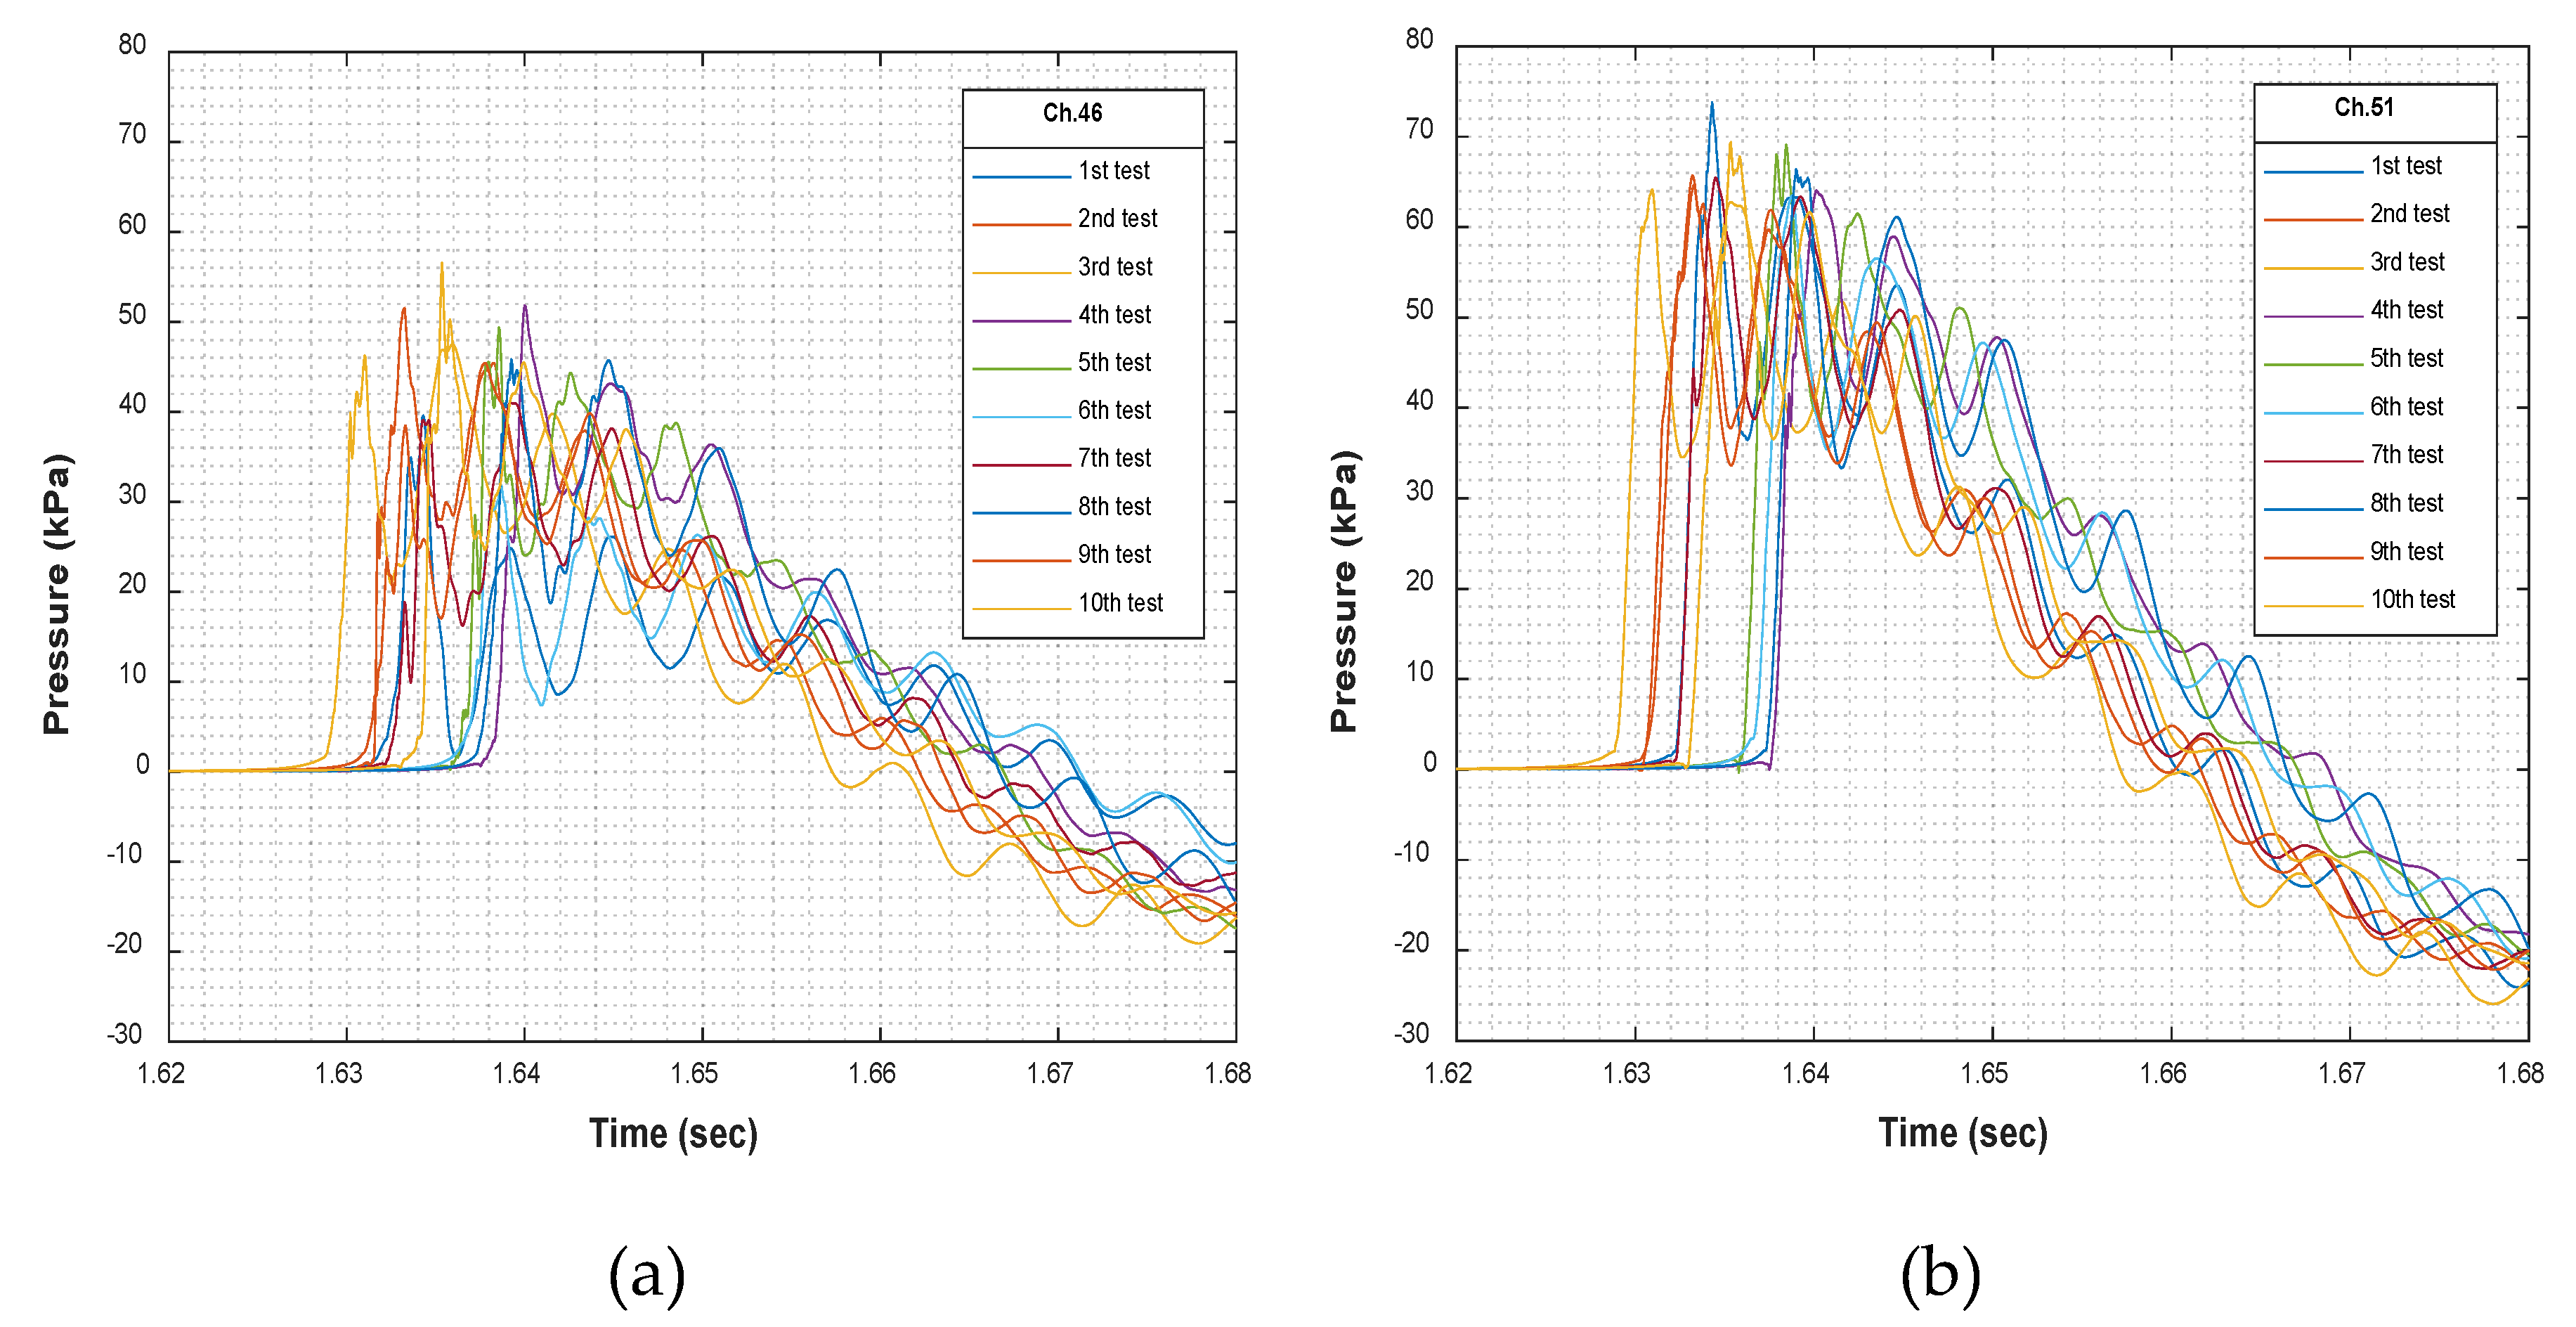
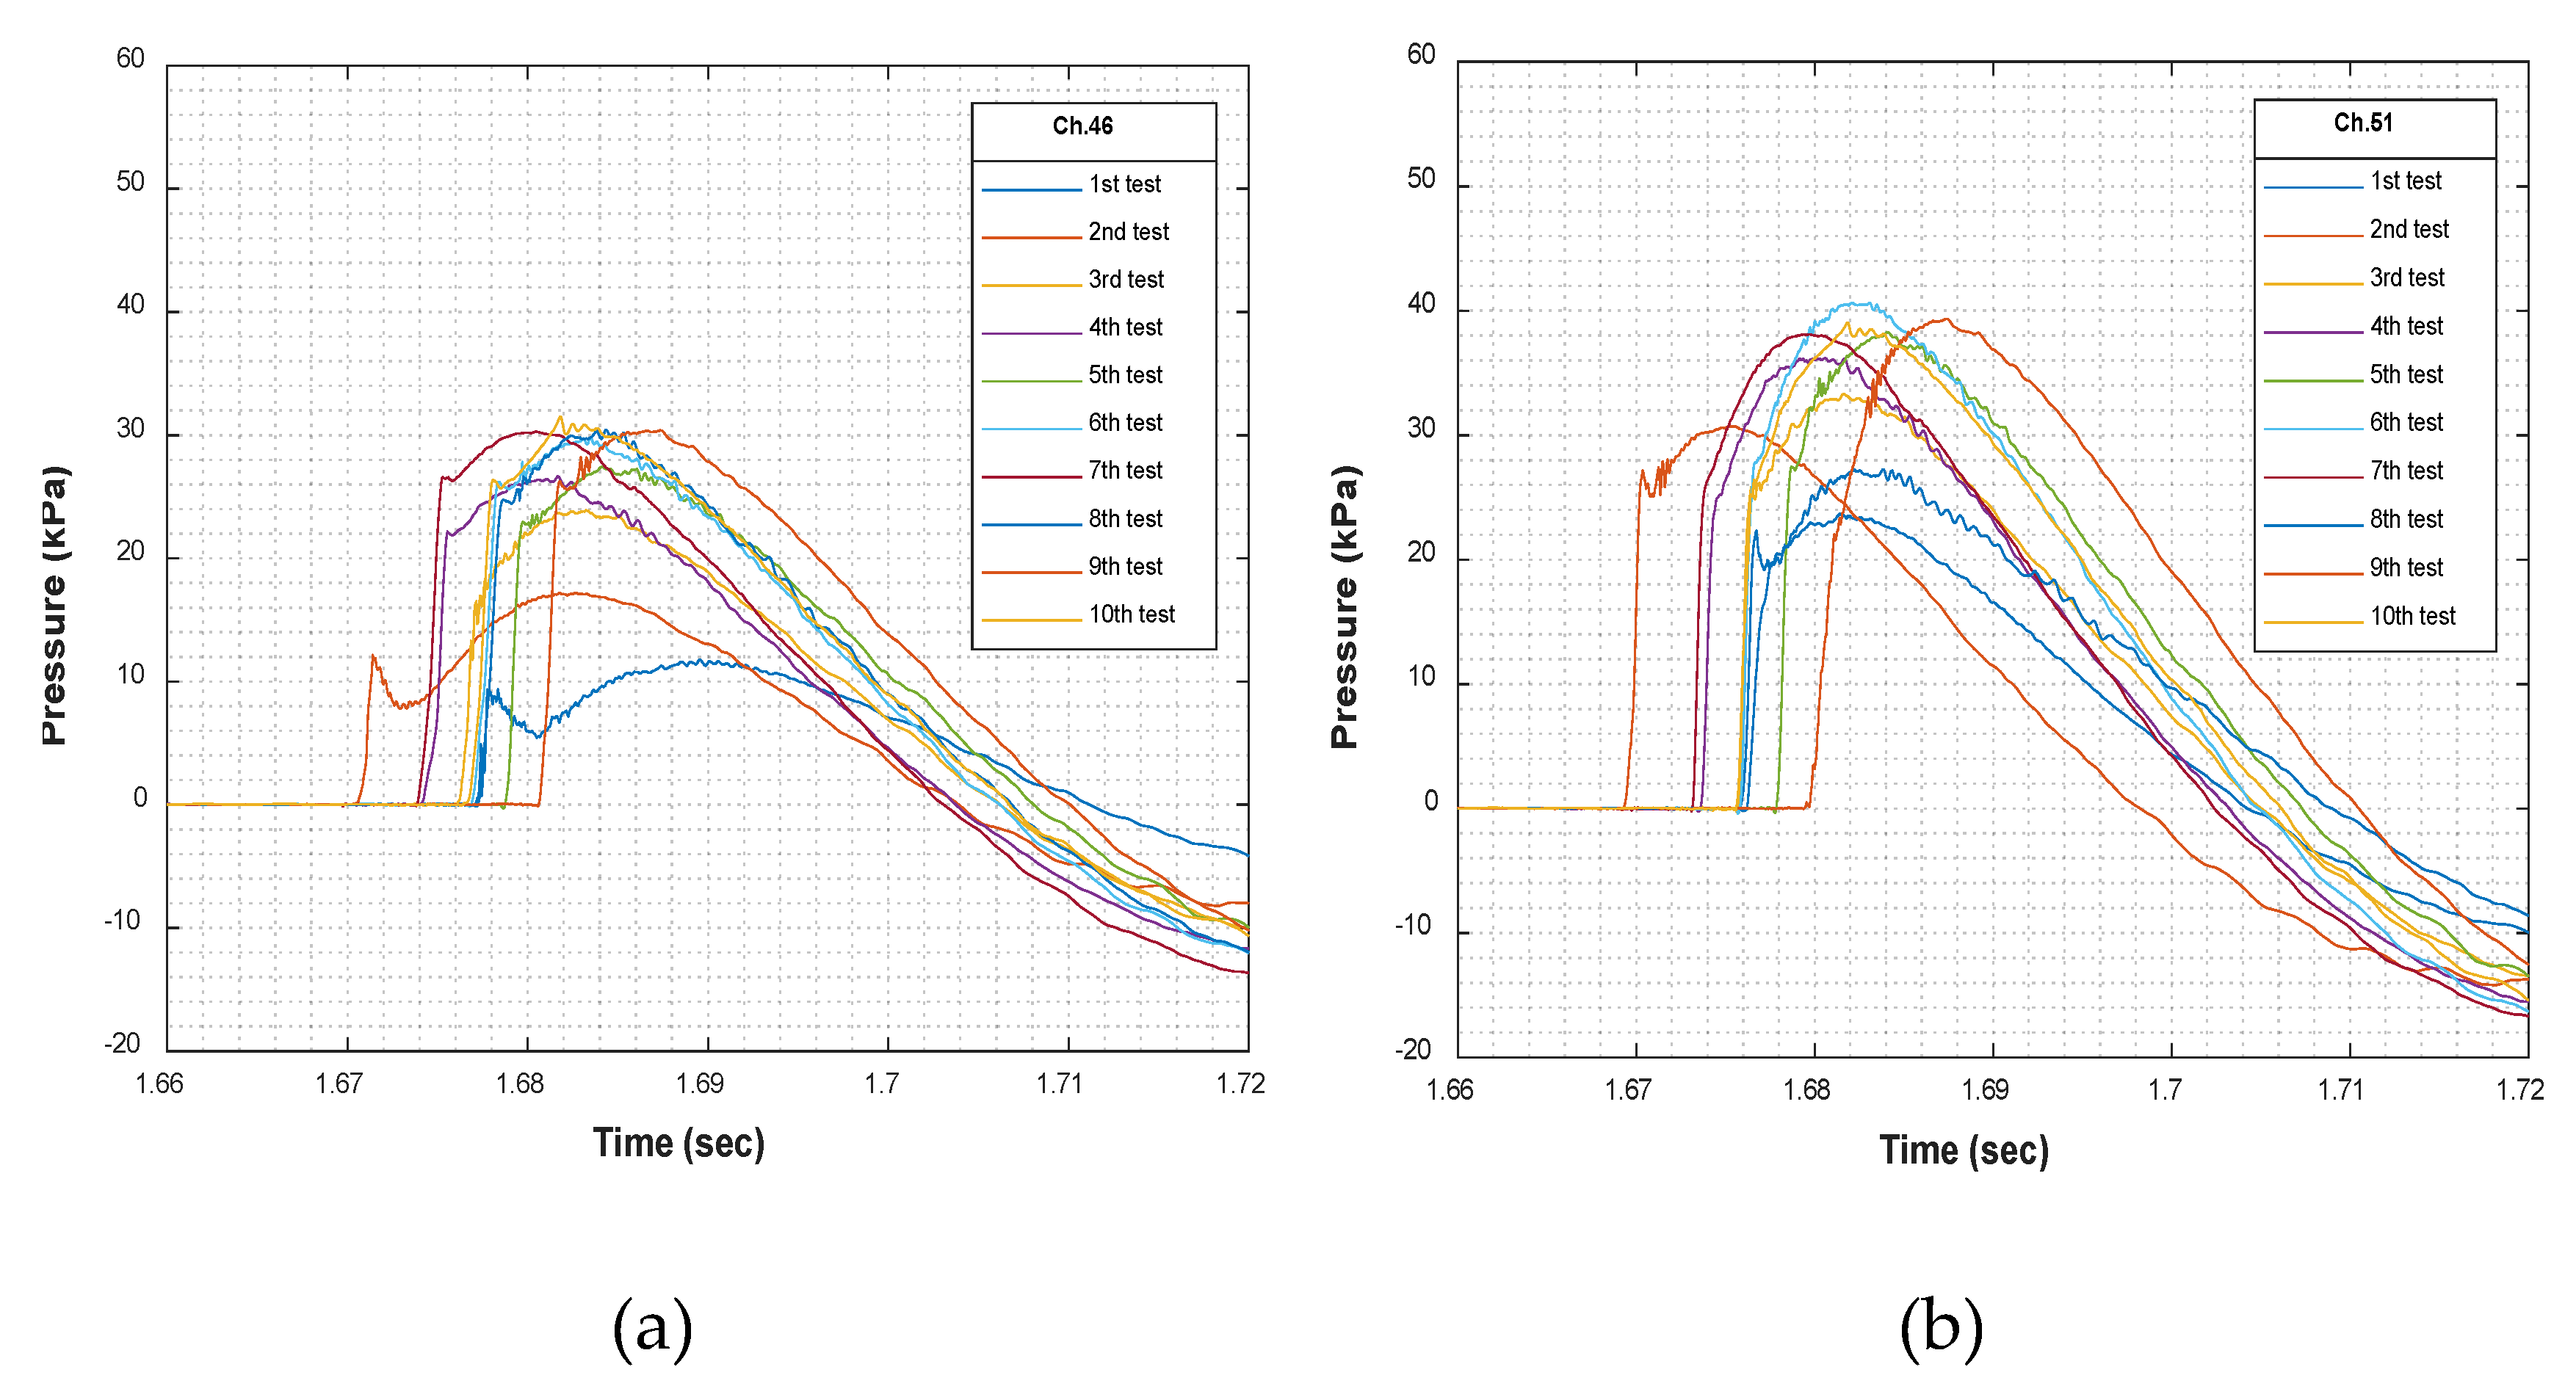
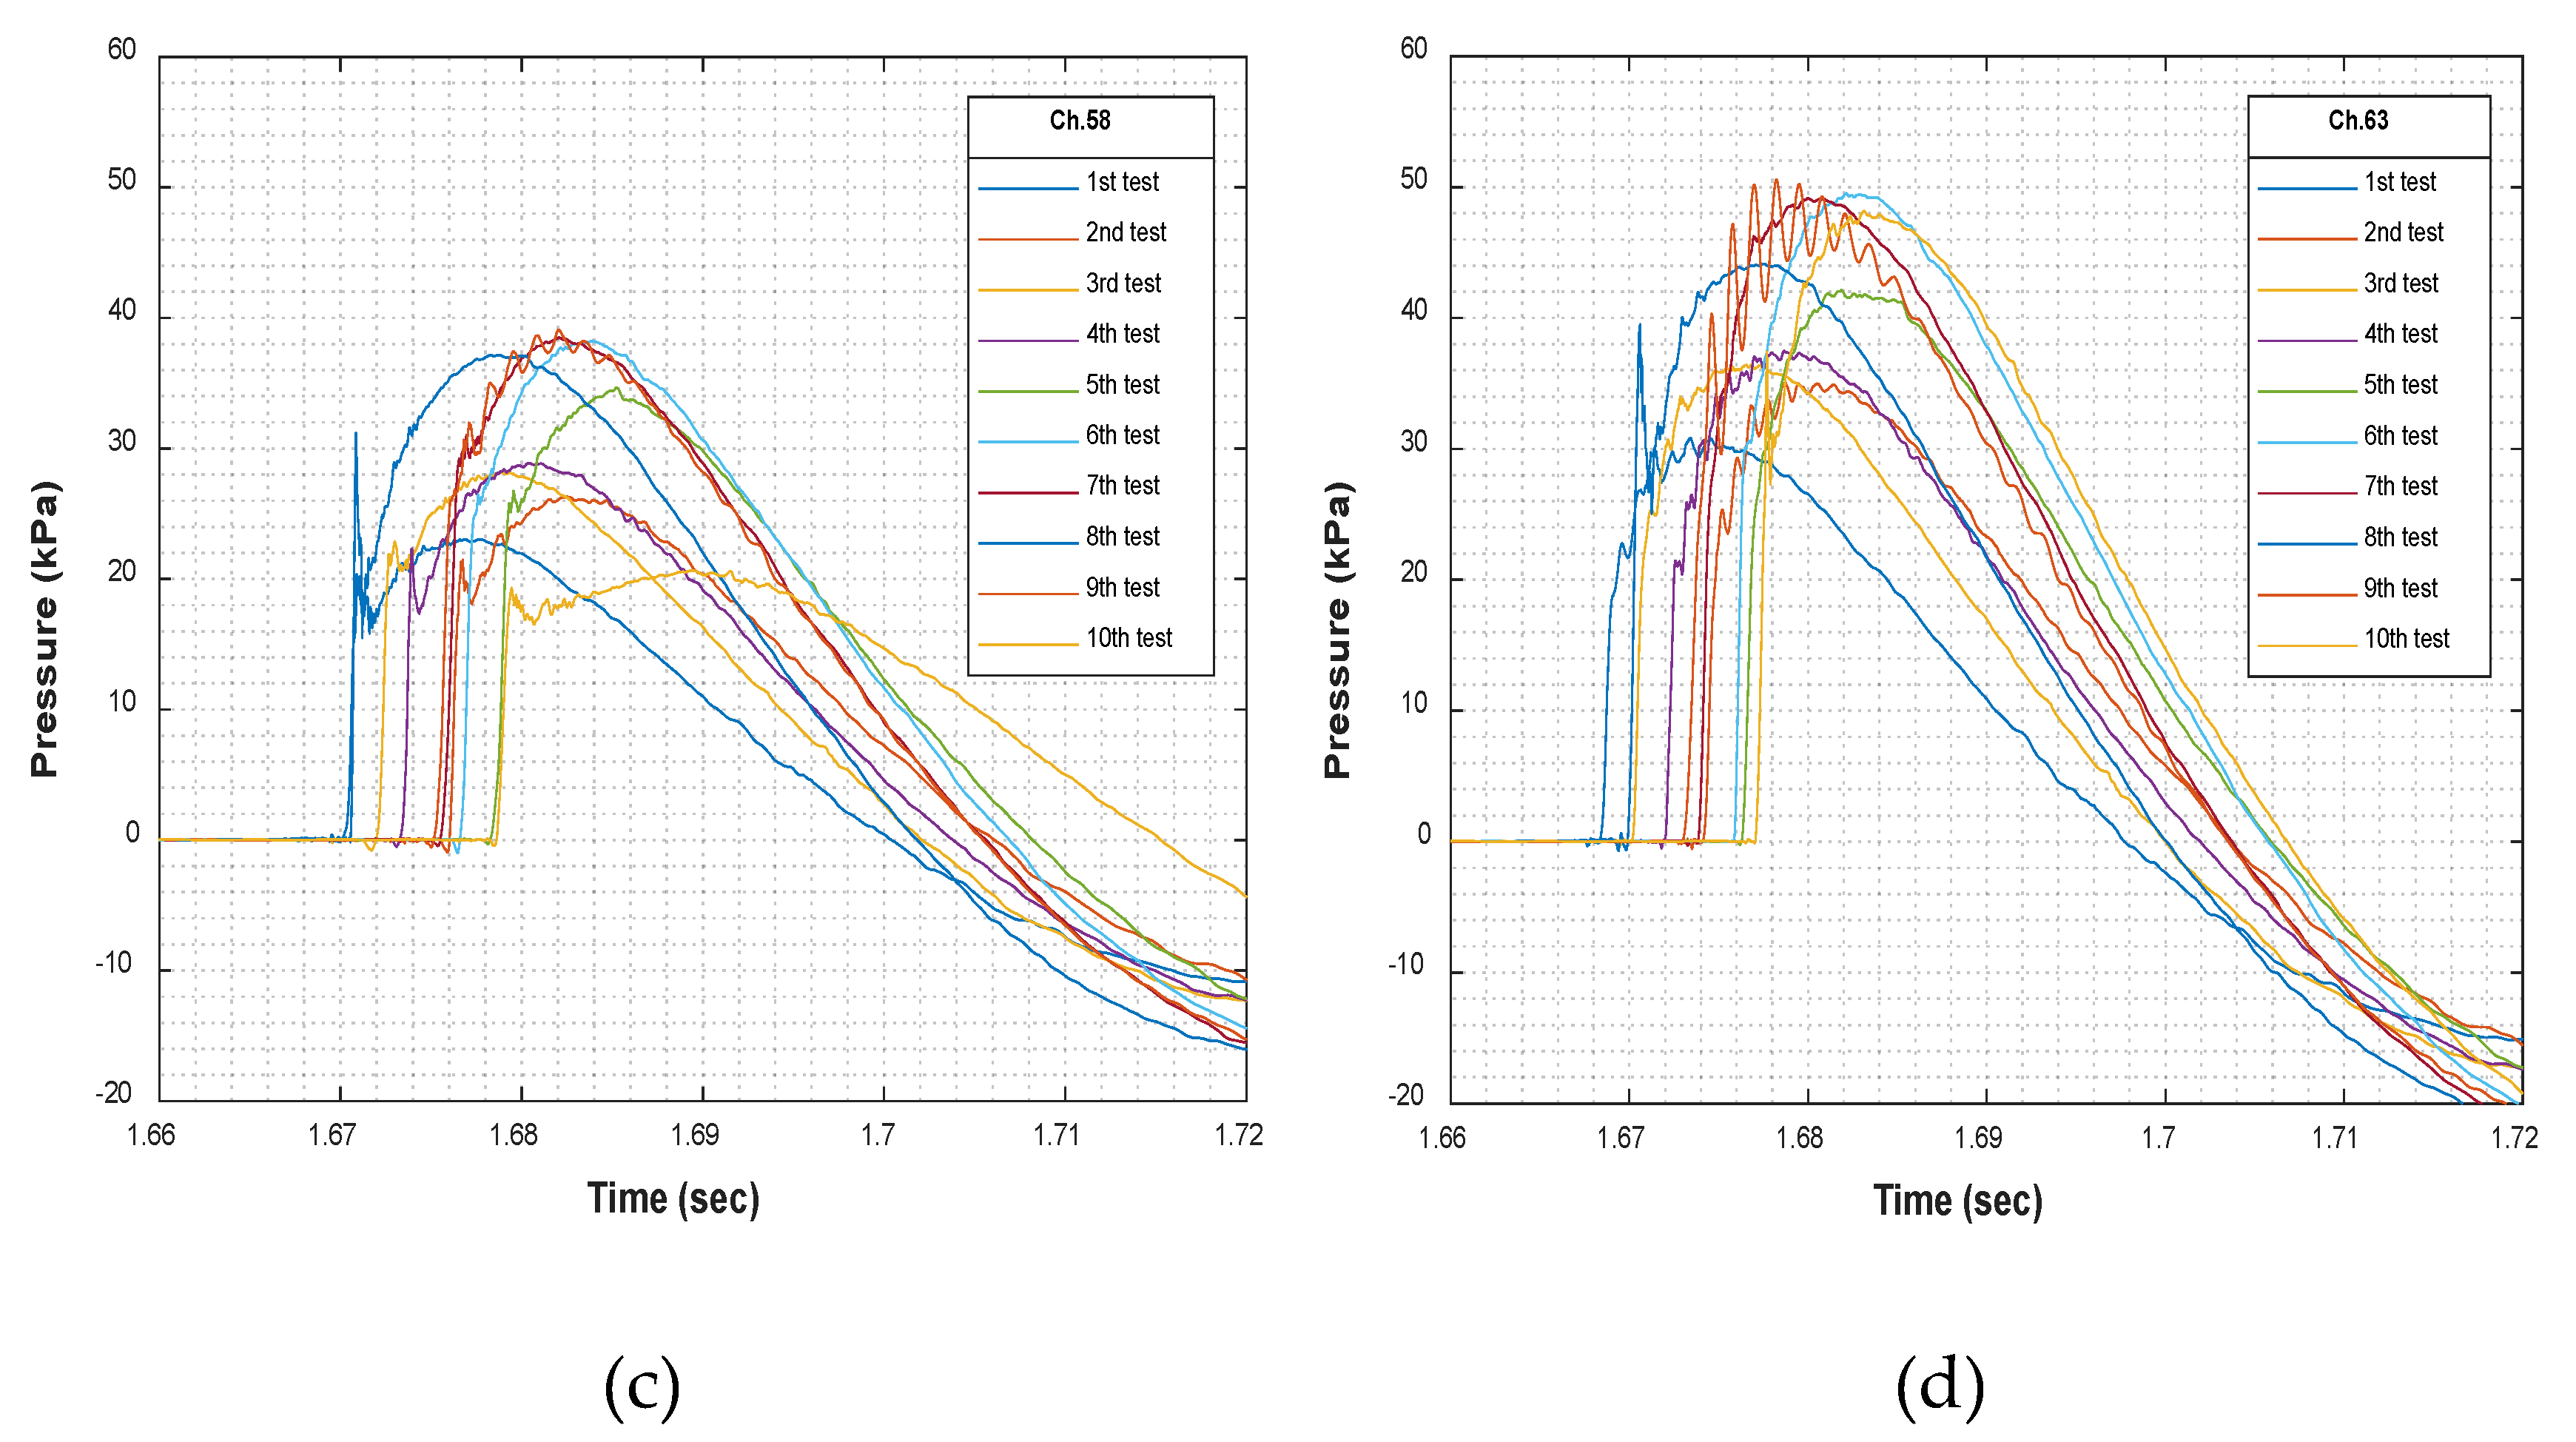
Figure 16.
Time Histories of the Pressure Measured at Four Different Channels for SWAY (Wet): (a) Channel 46, (b) Channel 51, (c) Channel 58 and (d) Channel 63.
Figure 16.
Time Histories of the Pressure Measured at Four Different Channels for SWAY (Wet): (a) Channel 46, (b) Channel 51, (c) Channel 58 and (d) Channel 63.
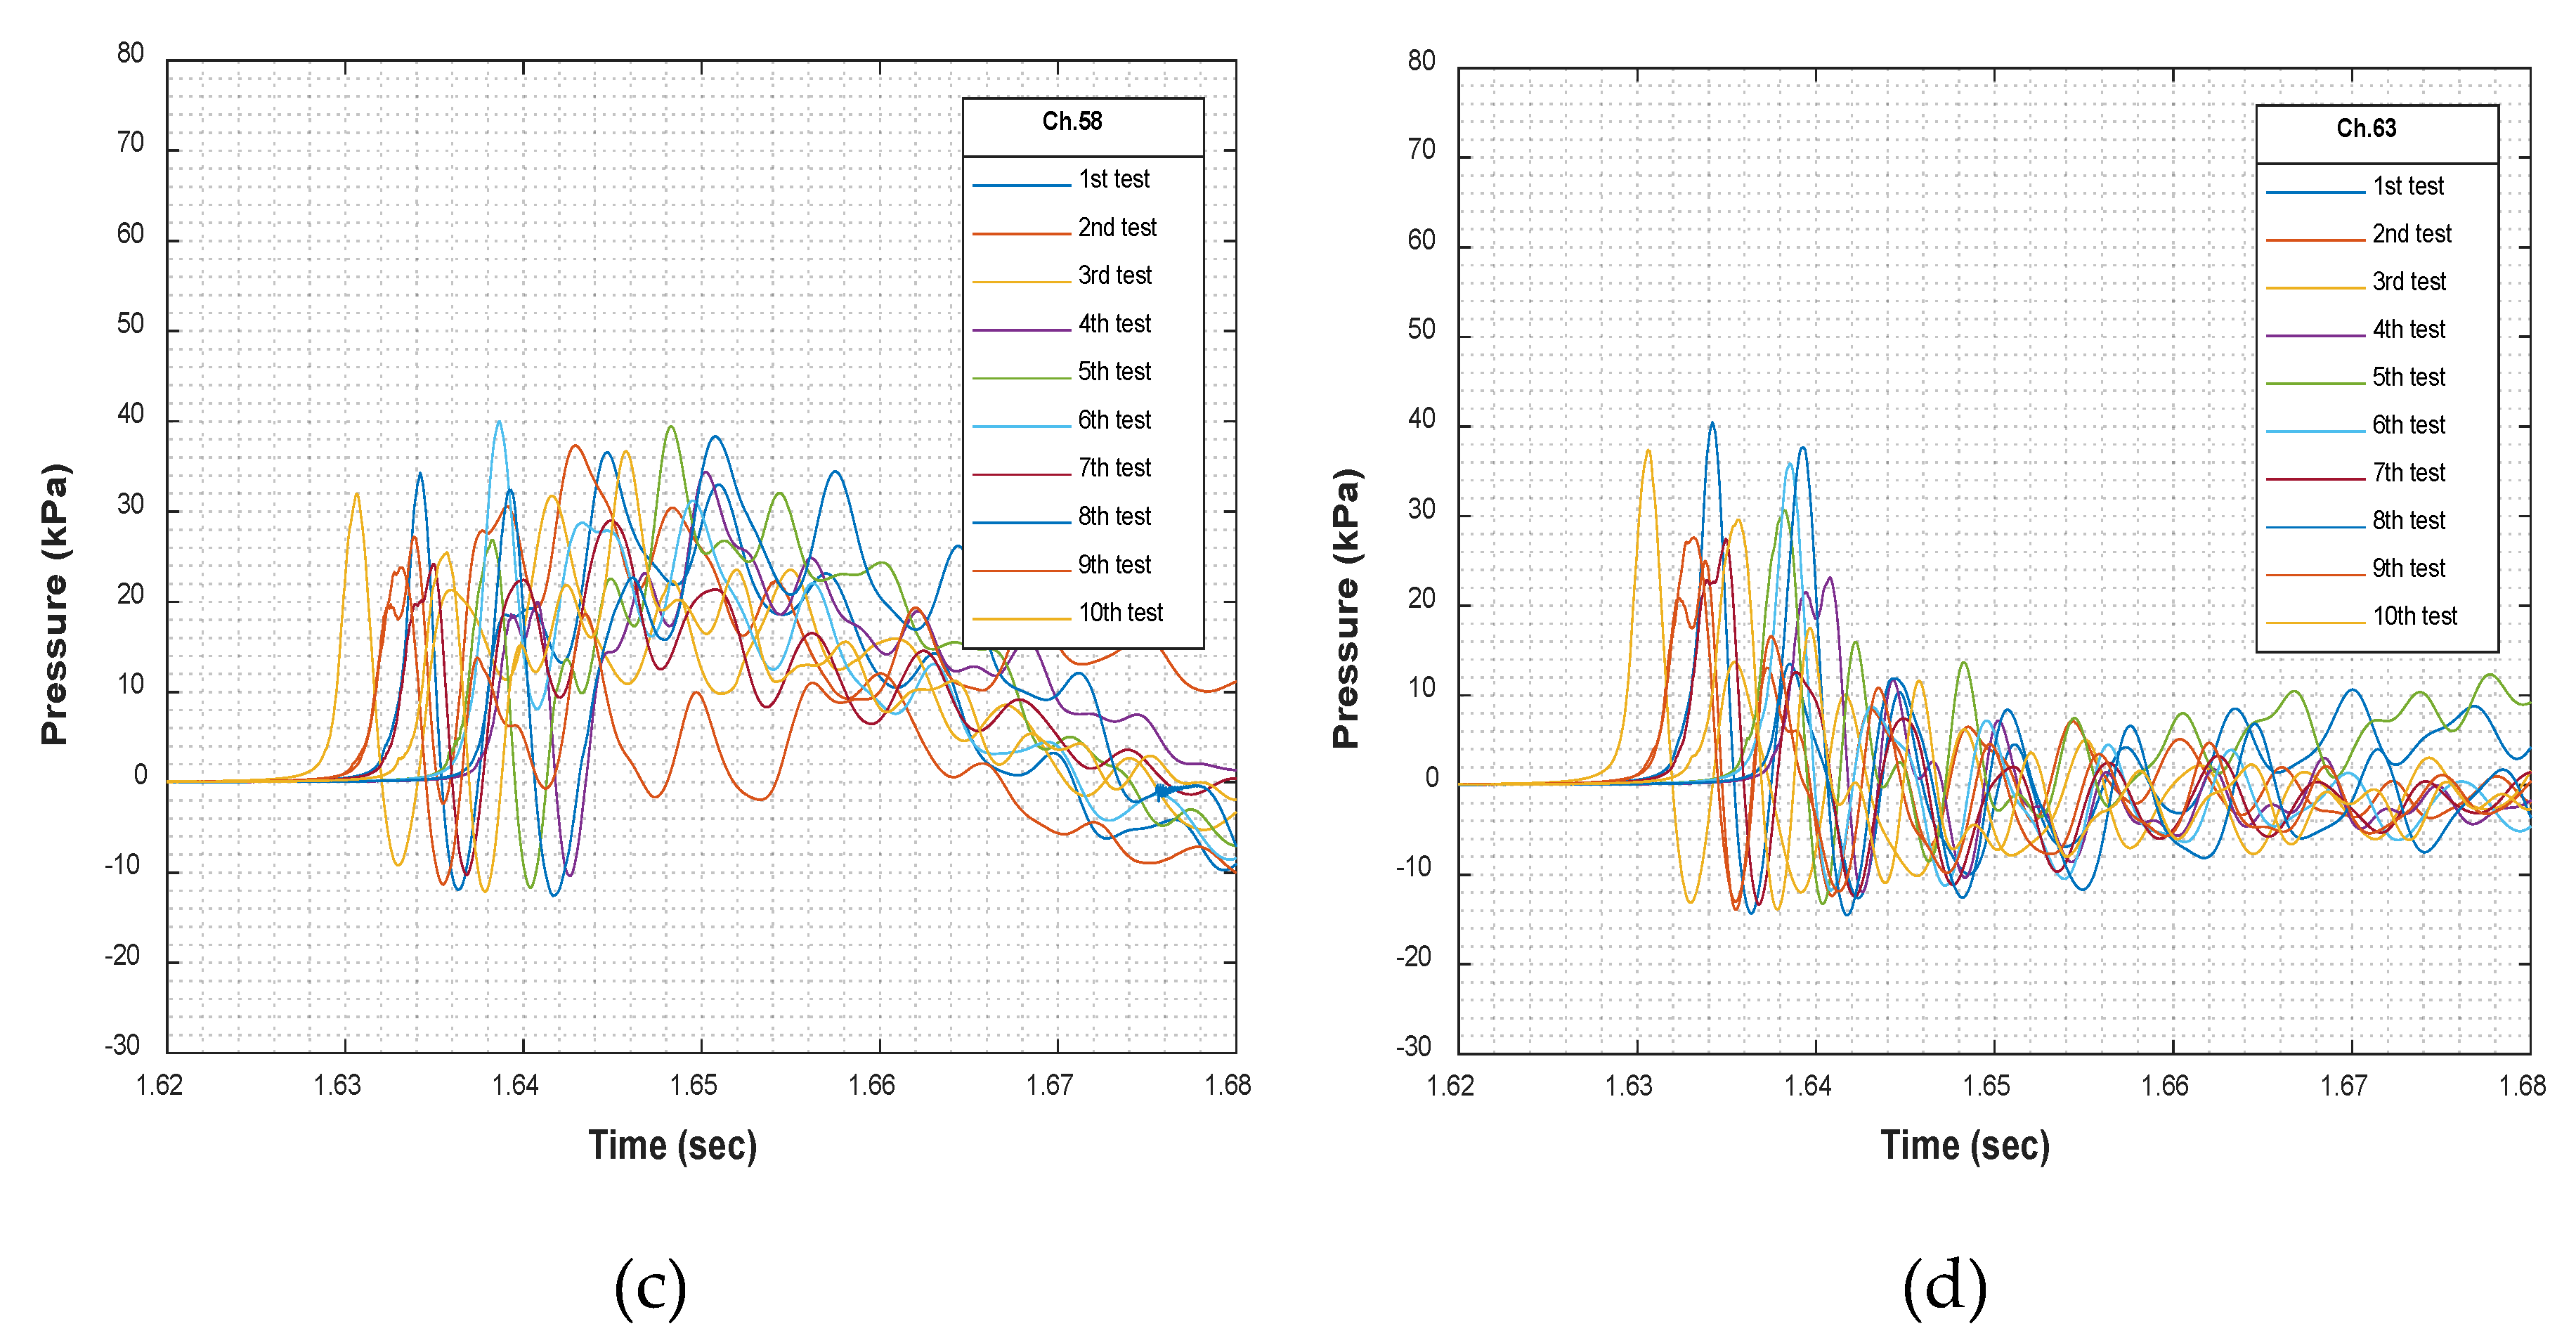
Figure 17.
Time Histories of the Pressure Measured at Four Different Channels for ROLL (Wet): (a) Channel 46, (b) Channel 51, (c) Channel 58 and (d) Channel 63.
Figure 17.
Time Histories of the Pressure Measured at Four Different Channels for ROLL (Wet): (a) Channel 46, (b) Channel 51, (c) Channel 58 and (d) Channel 63.
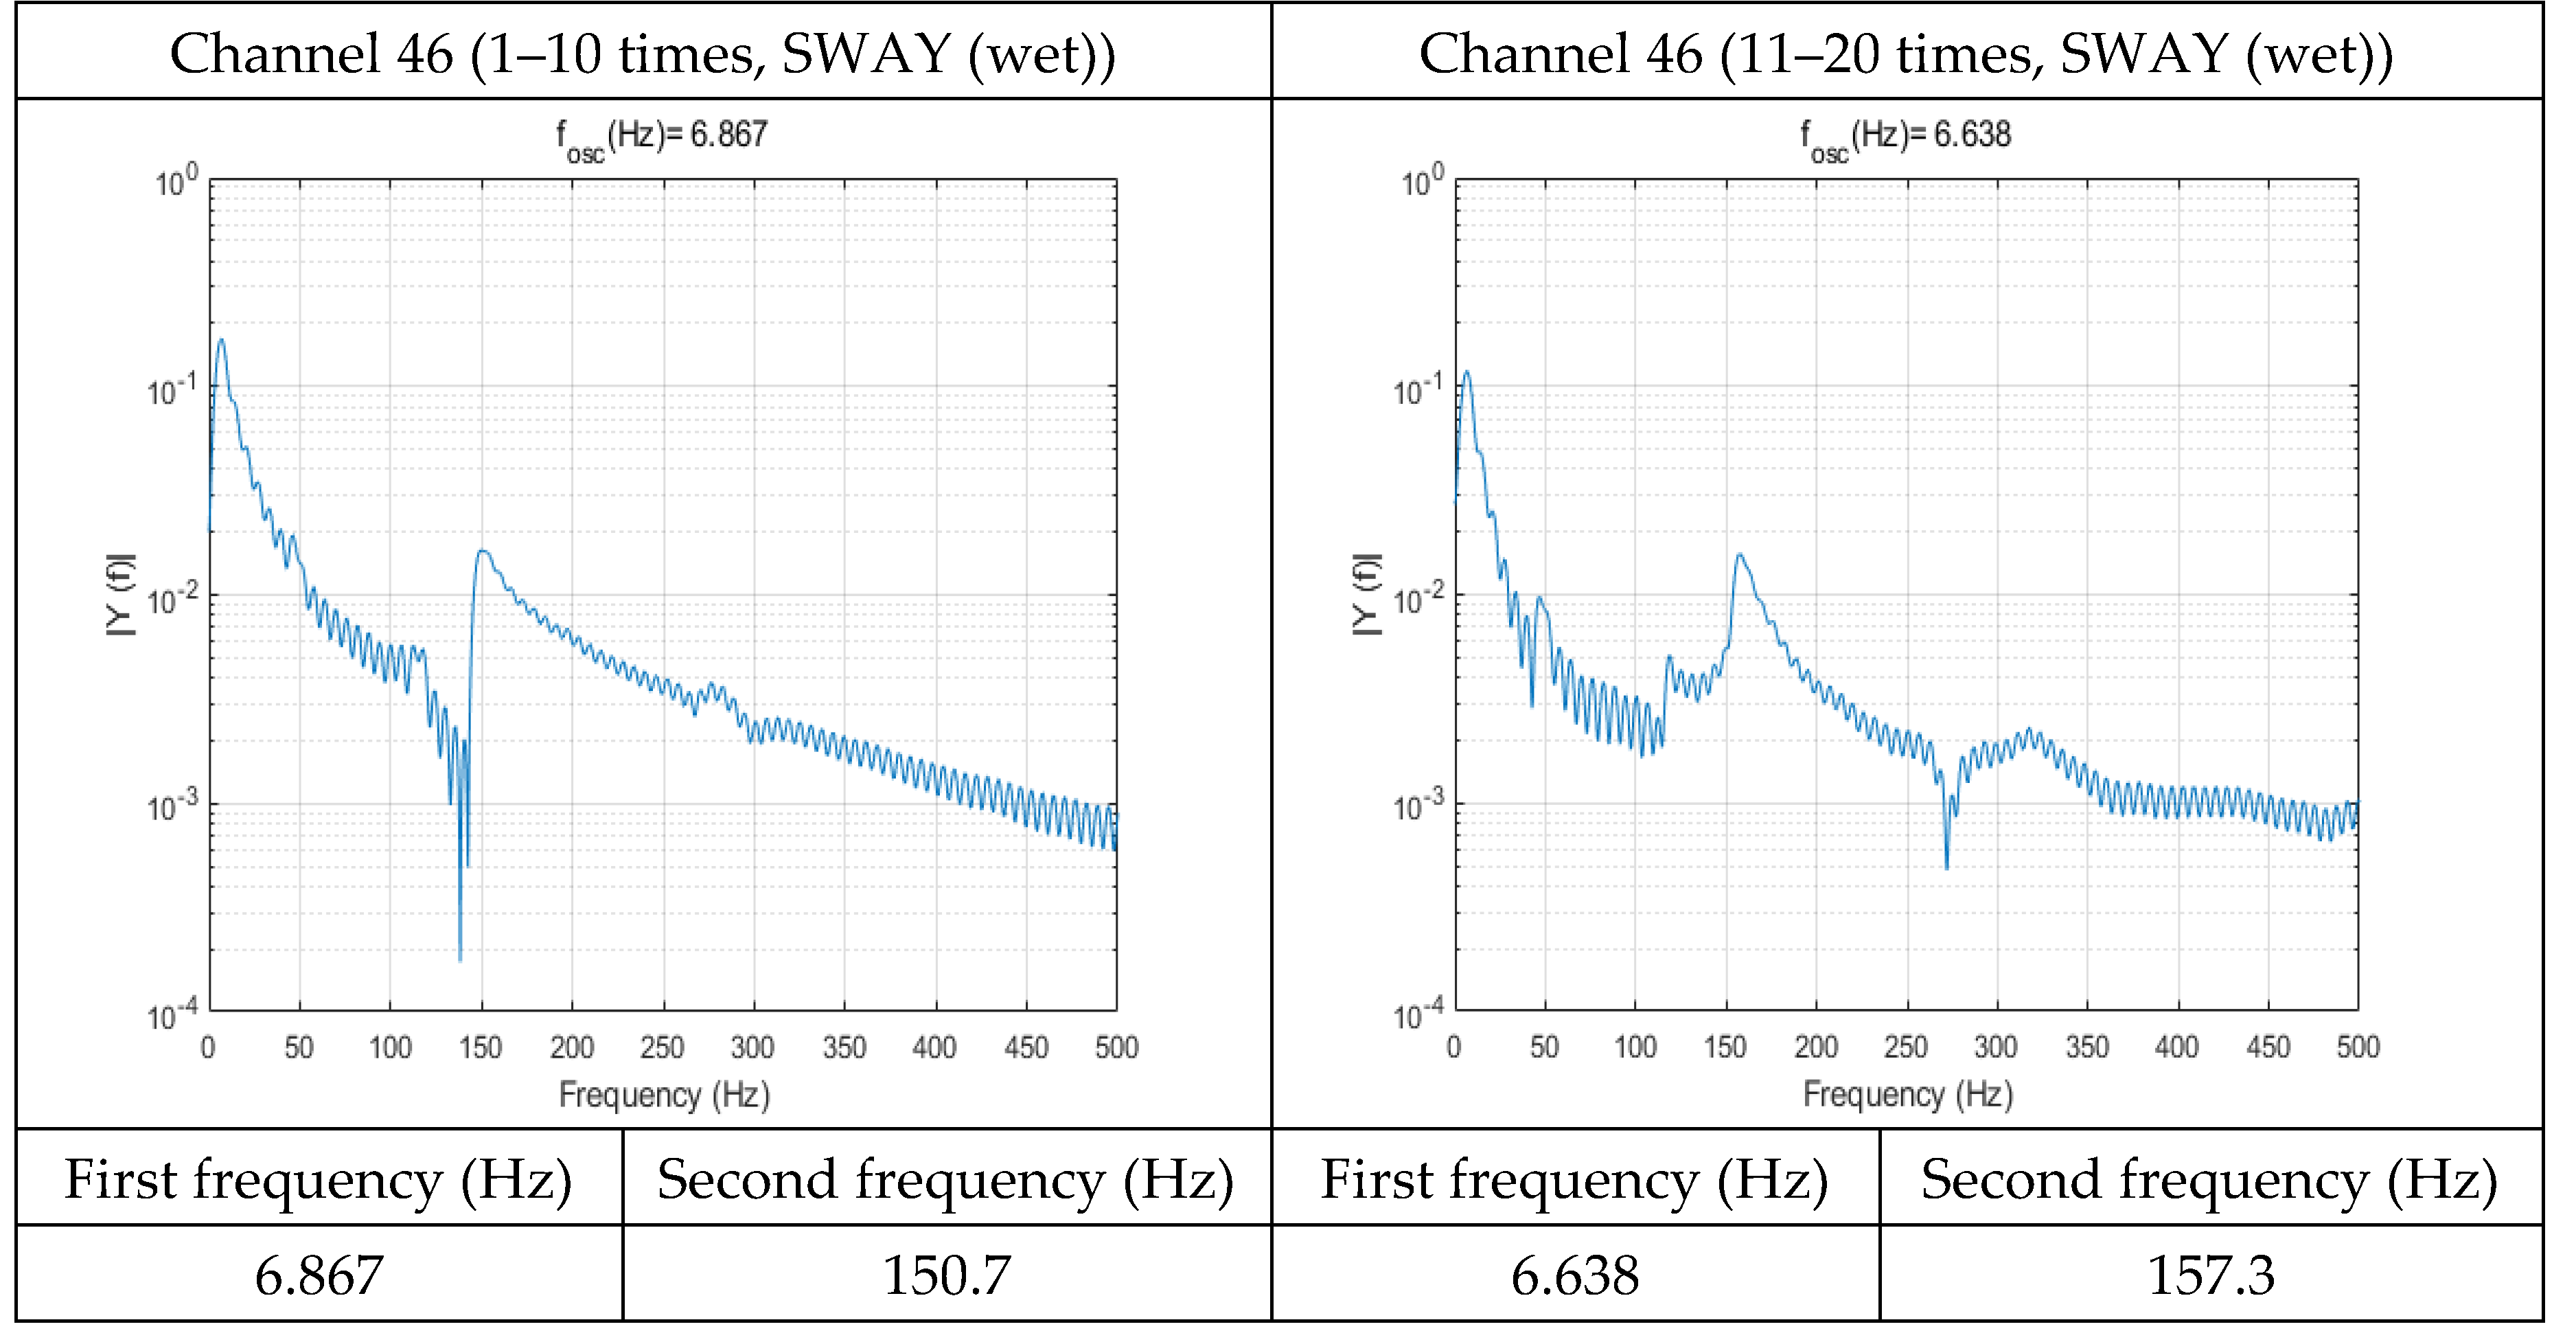
Figure 18.
FFT of Channel 46 (Wet Condition, SWAY).
Figure 18.
FFT of Channel 46 (Wet Condition, SWAY).
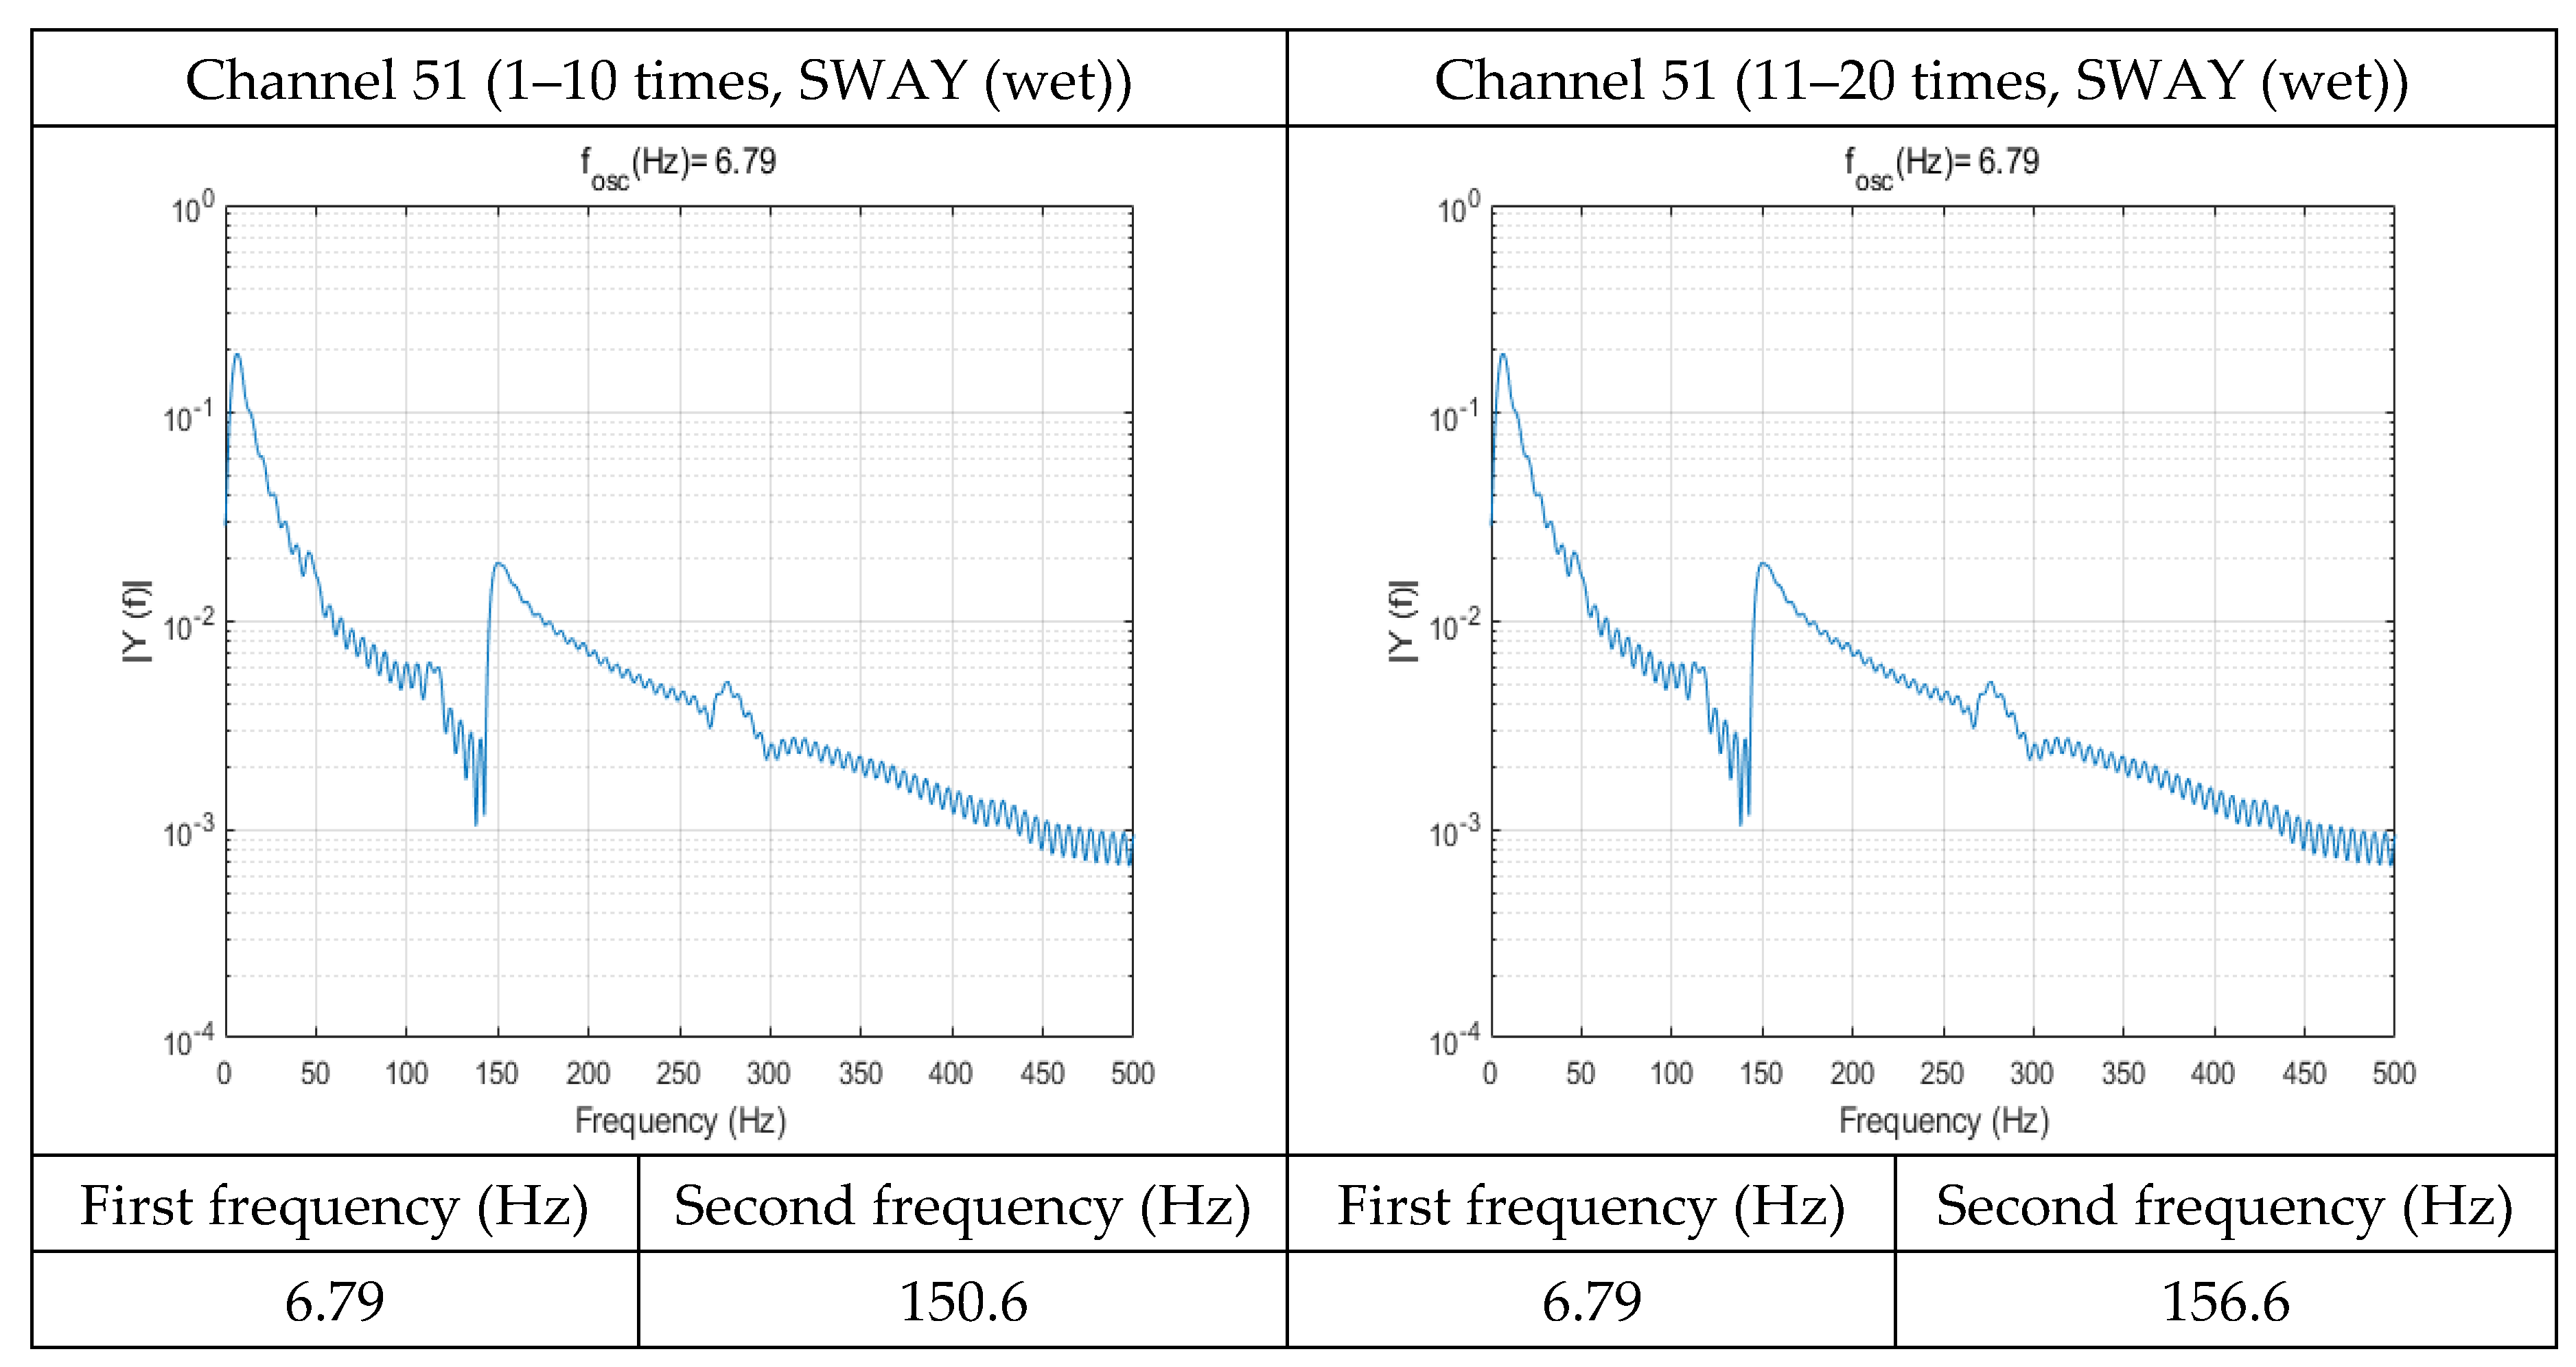
Figure 19.
FFT of Channel 51 (Wet Condition, SWAY)
Figure 19.
FFT of Channel 51 (Wet Condition, SWAY)
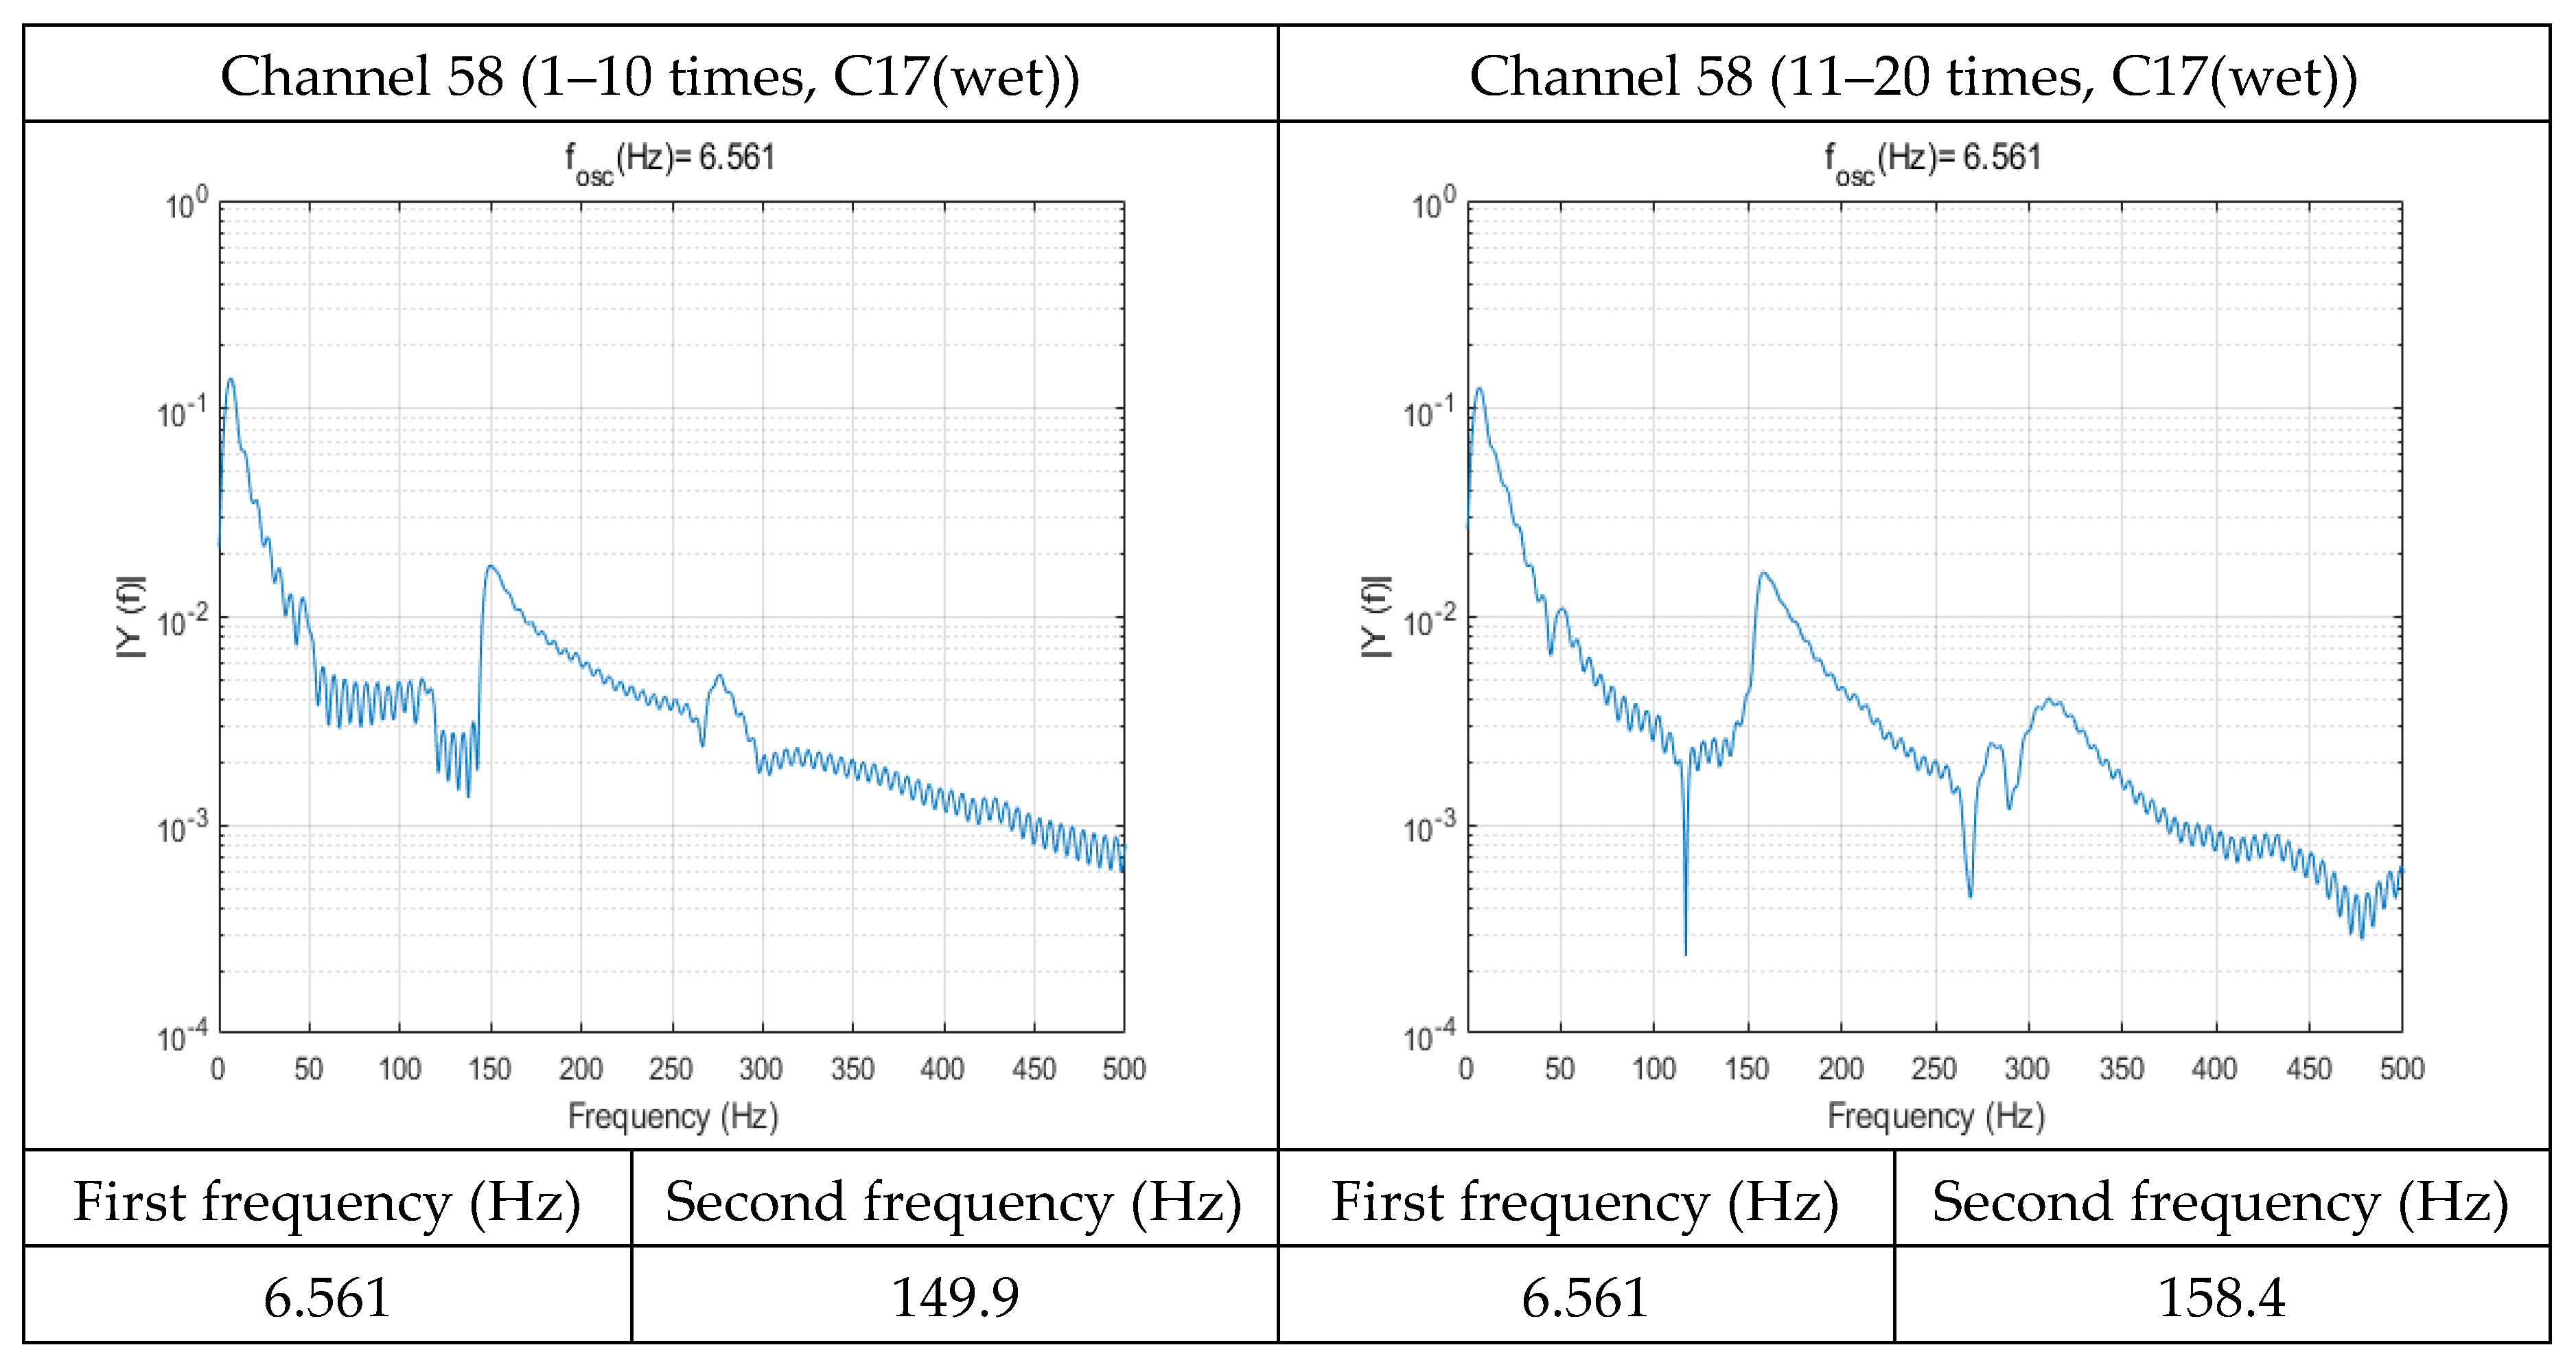
Figure 20.
FFT of Channel 58 (Wet Condition, SWAY).
Figure 20.
FFT of Channel 58 (Wet Condition, SWAY).
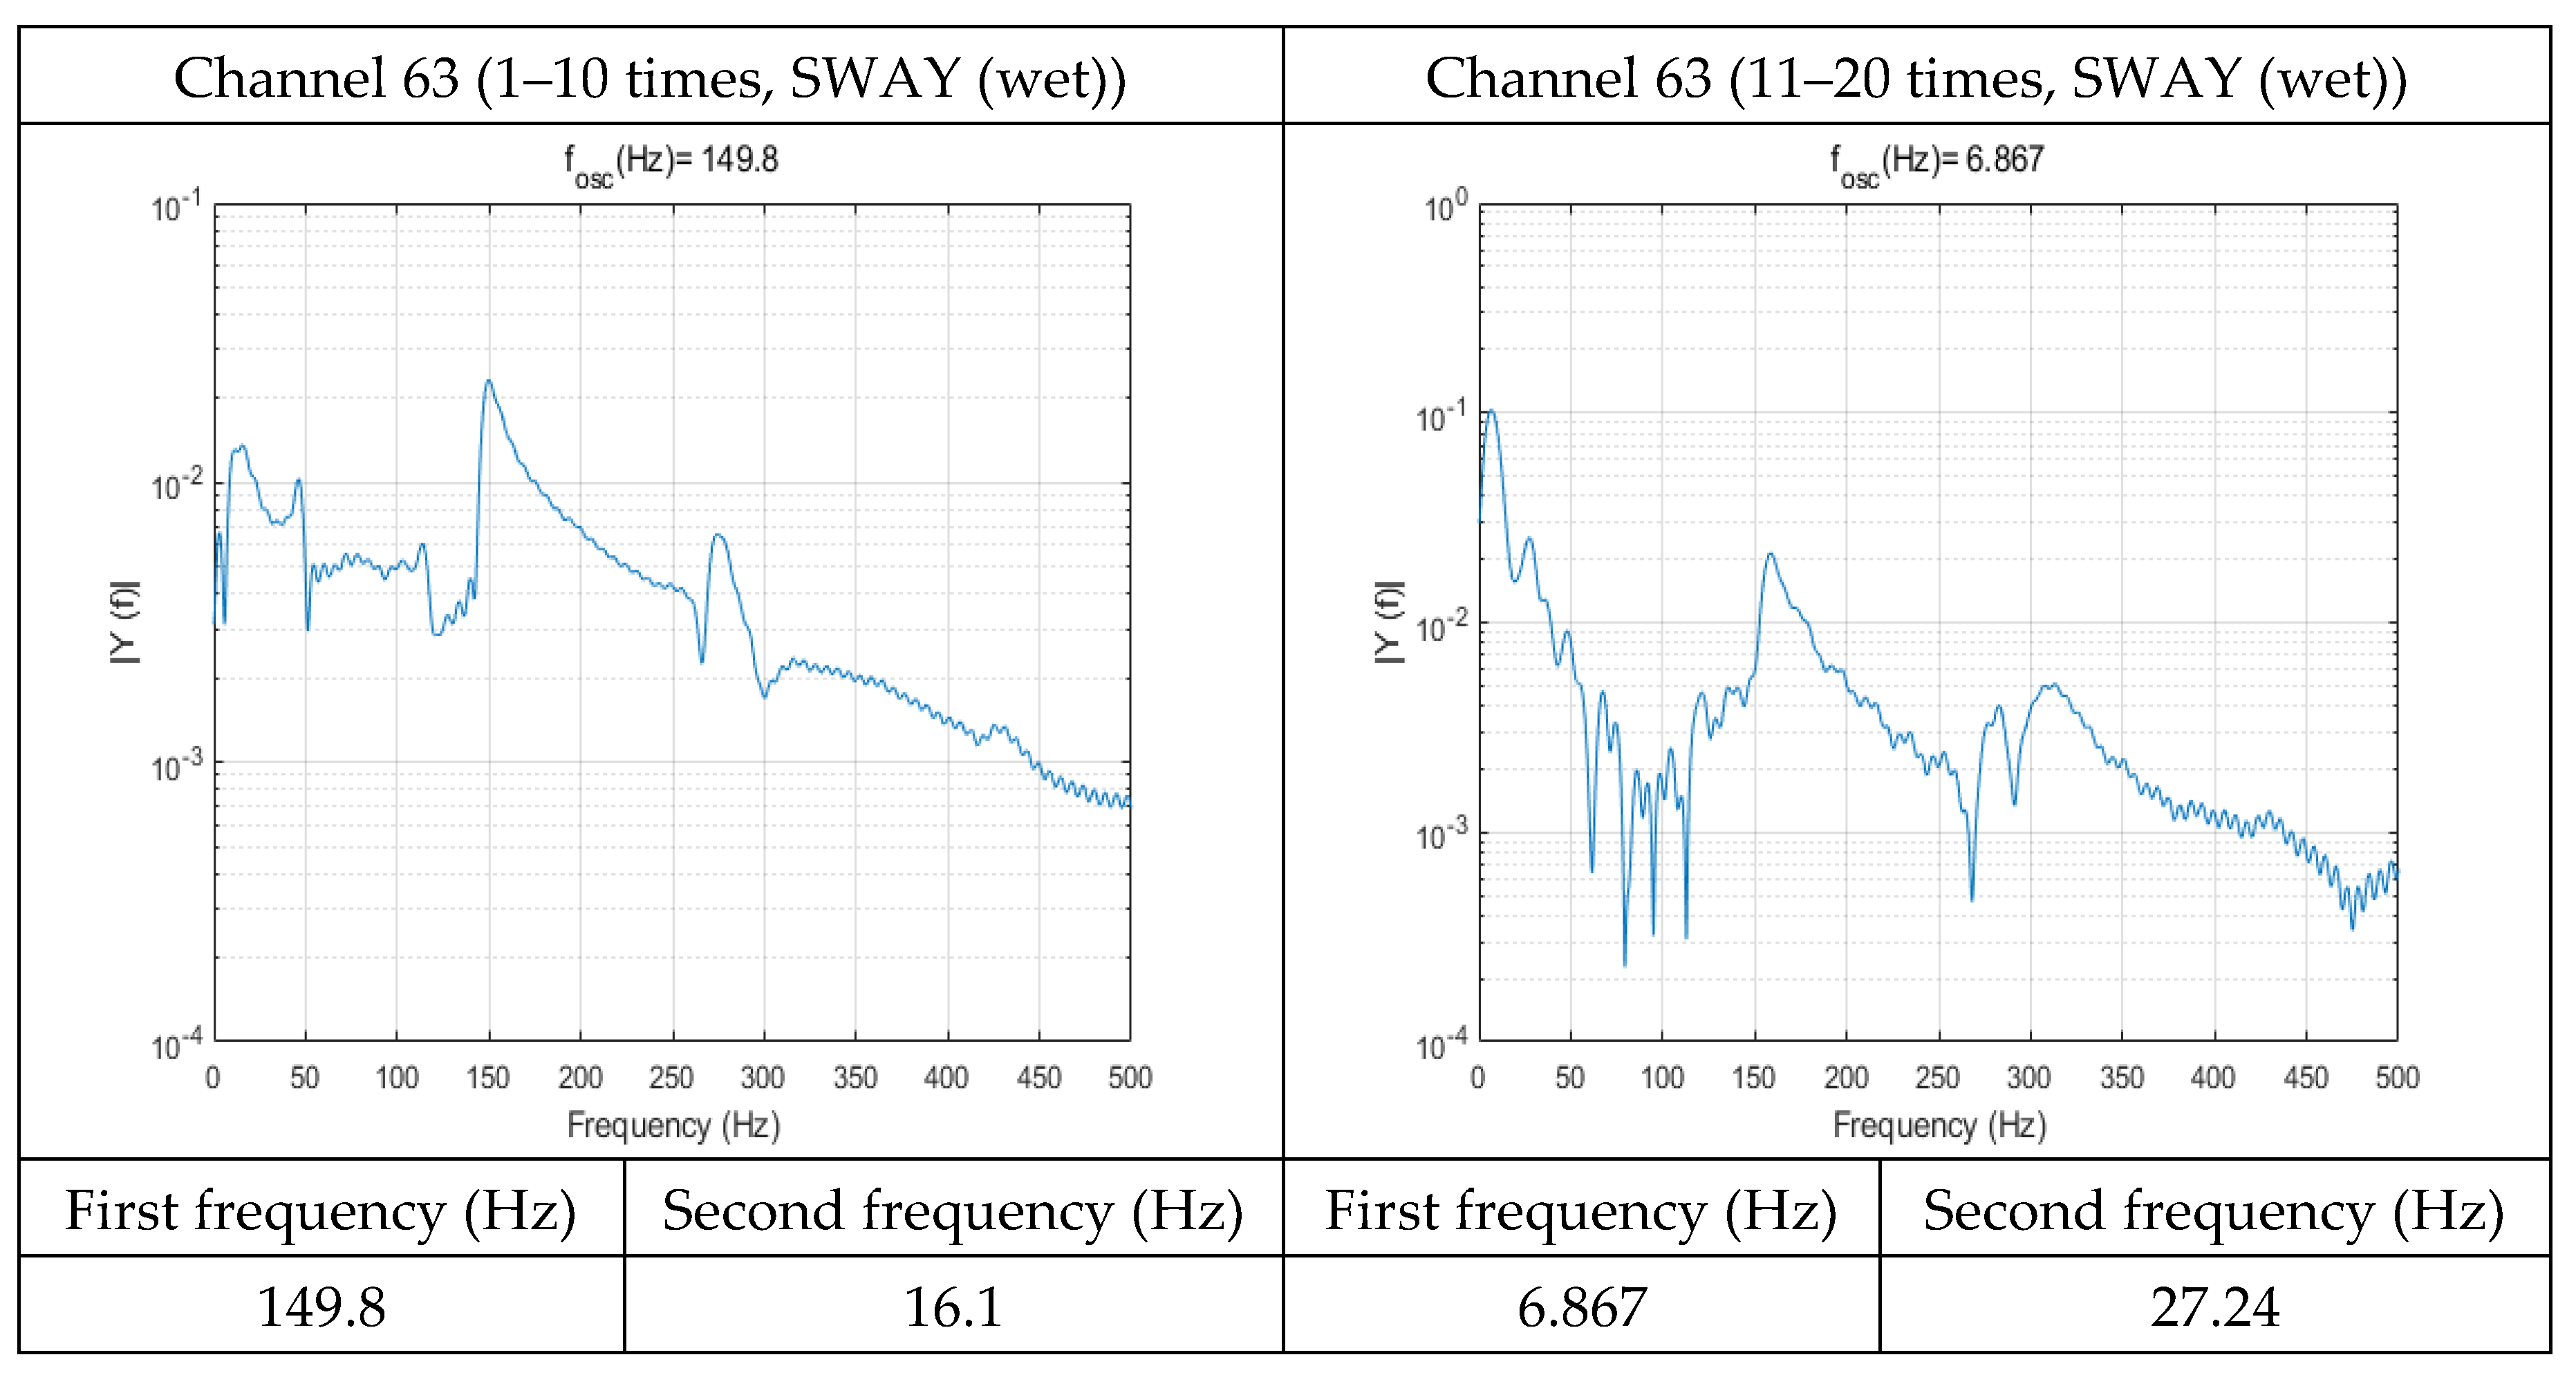
Figure 21.
FFT of Channel 63 (Wet Condition, SWAY)
Figure 21.
FFT of Channel 63 (Wet Condition, SWAY)
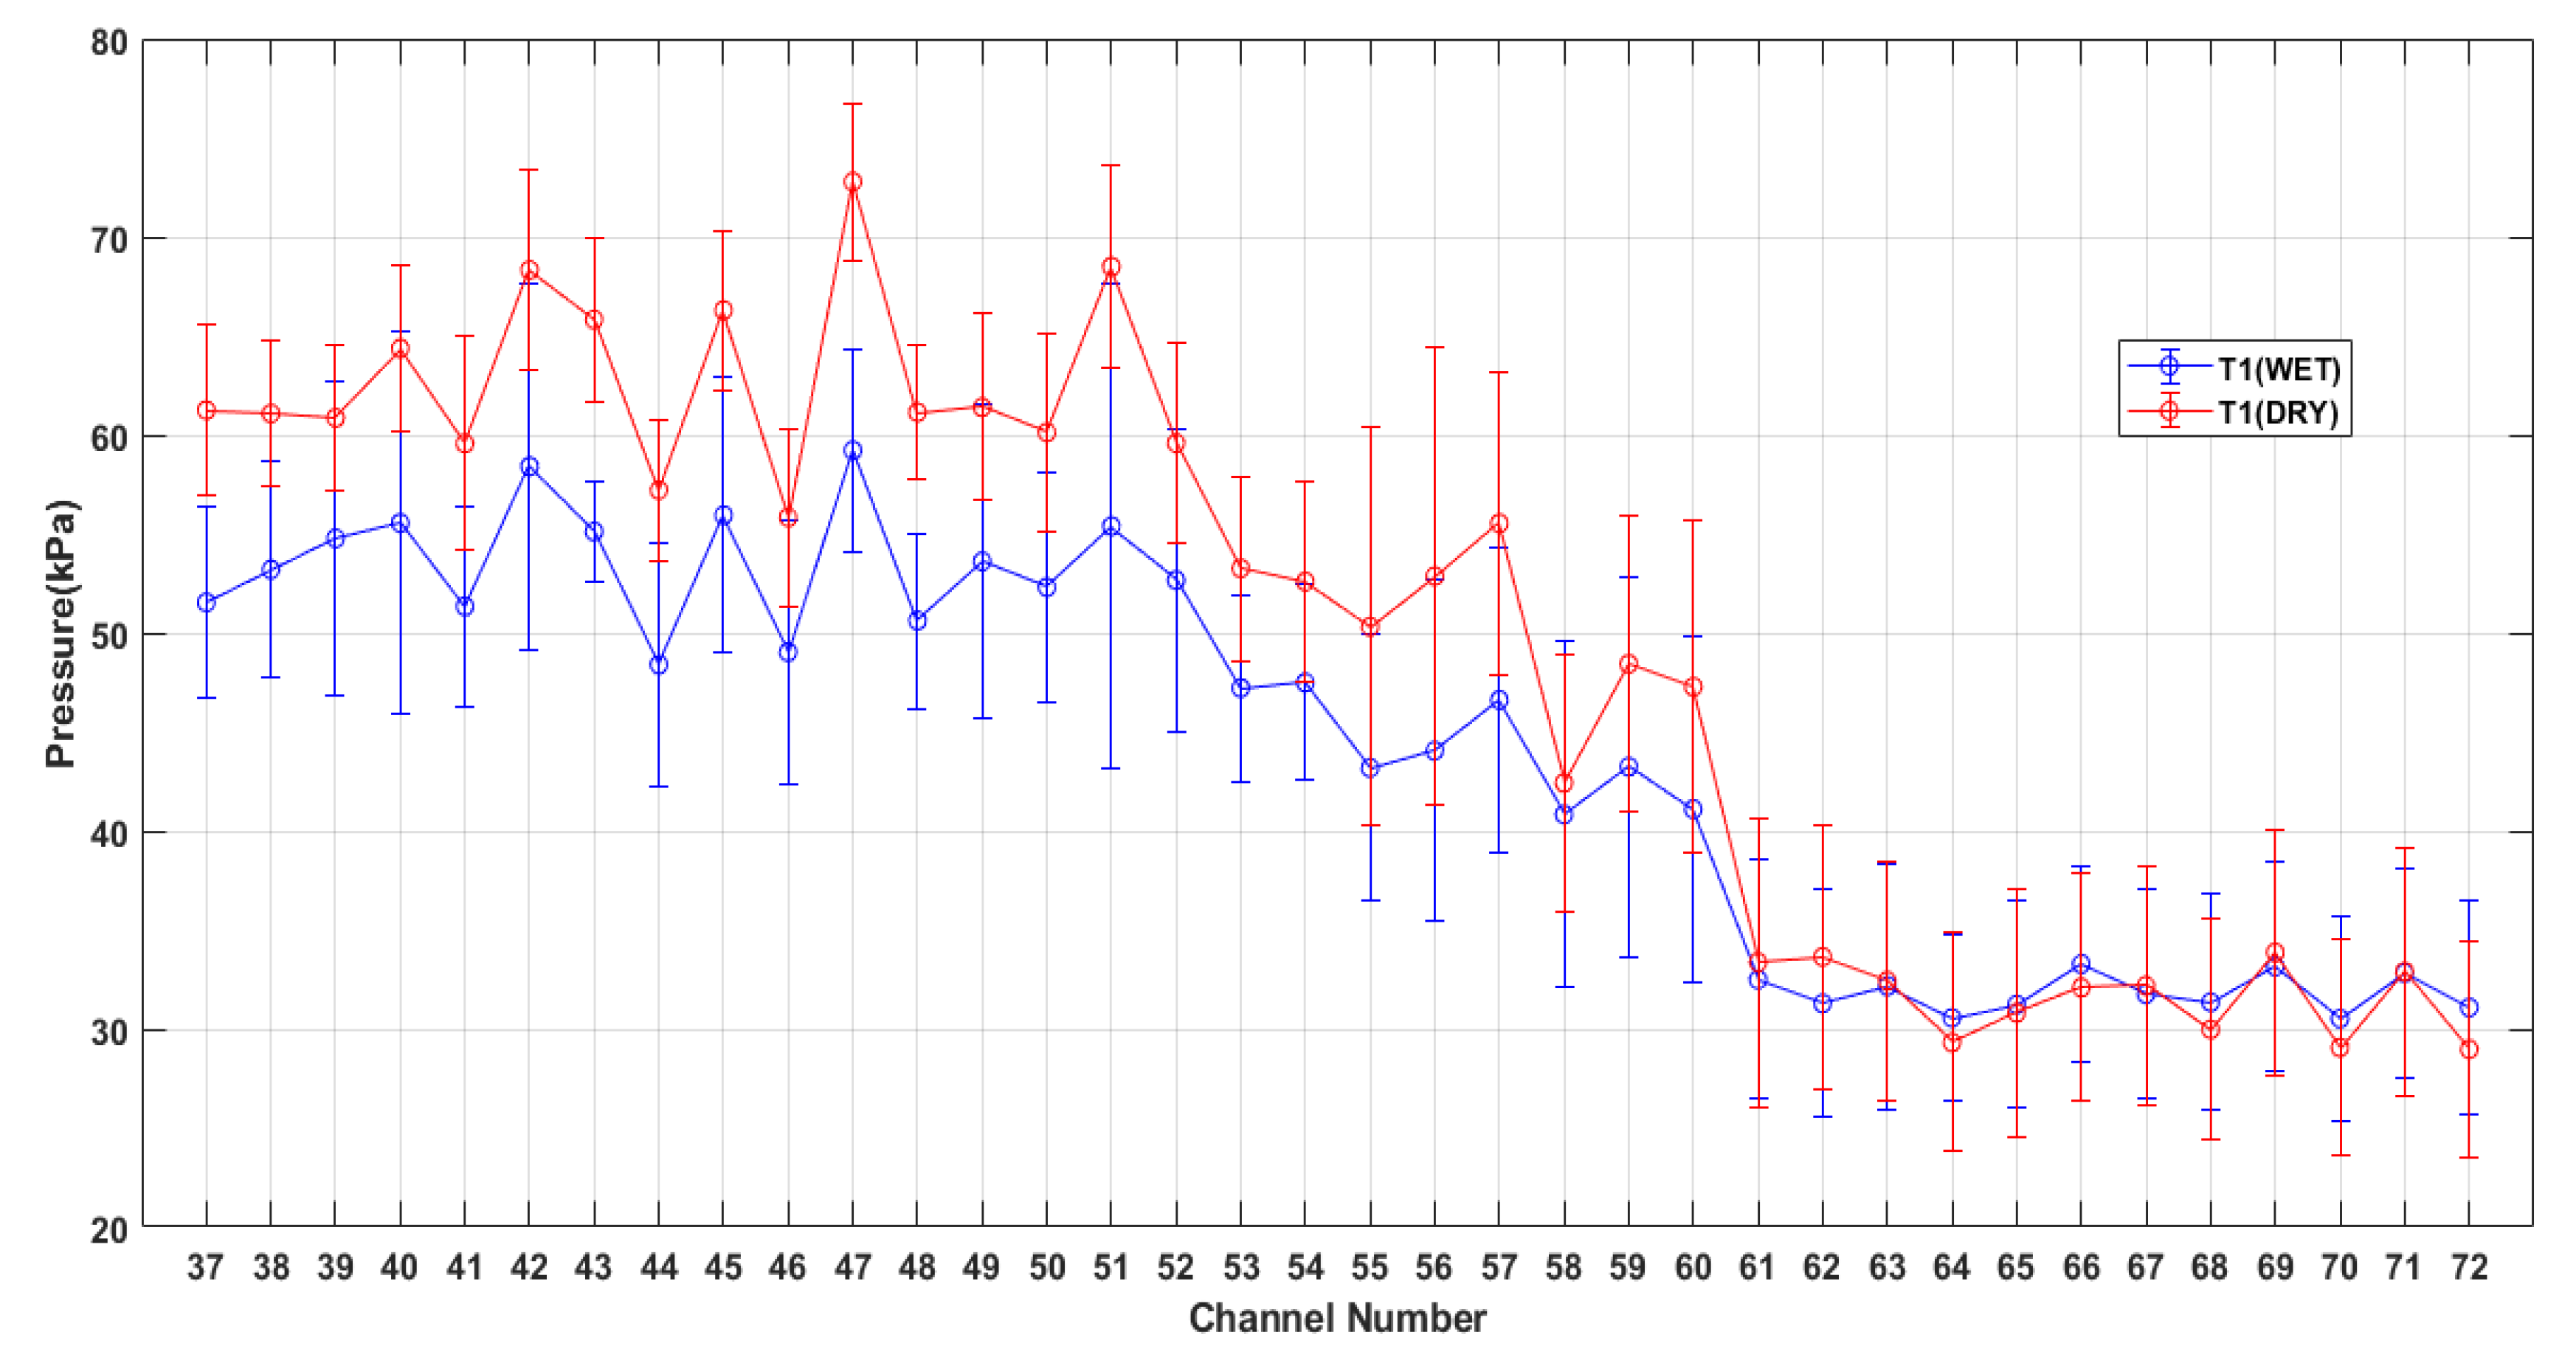
Figure 22.
Peak Pressure of Dry Condition & Wet Condition of SWAY (T1).
Figure 22.
Peak Pressure of Dry Condition & Wet Condition of SWAY (T1).
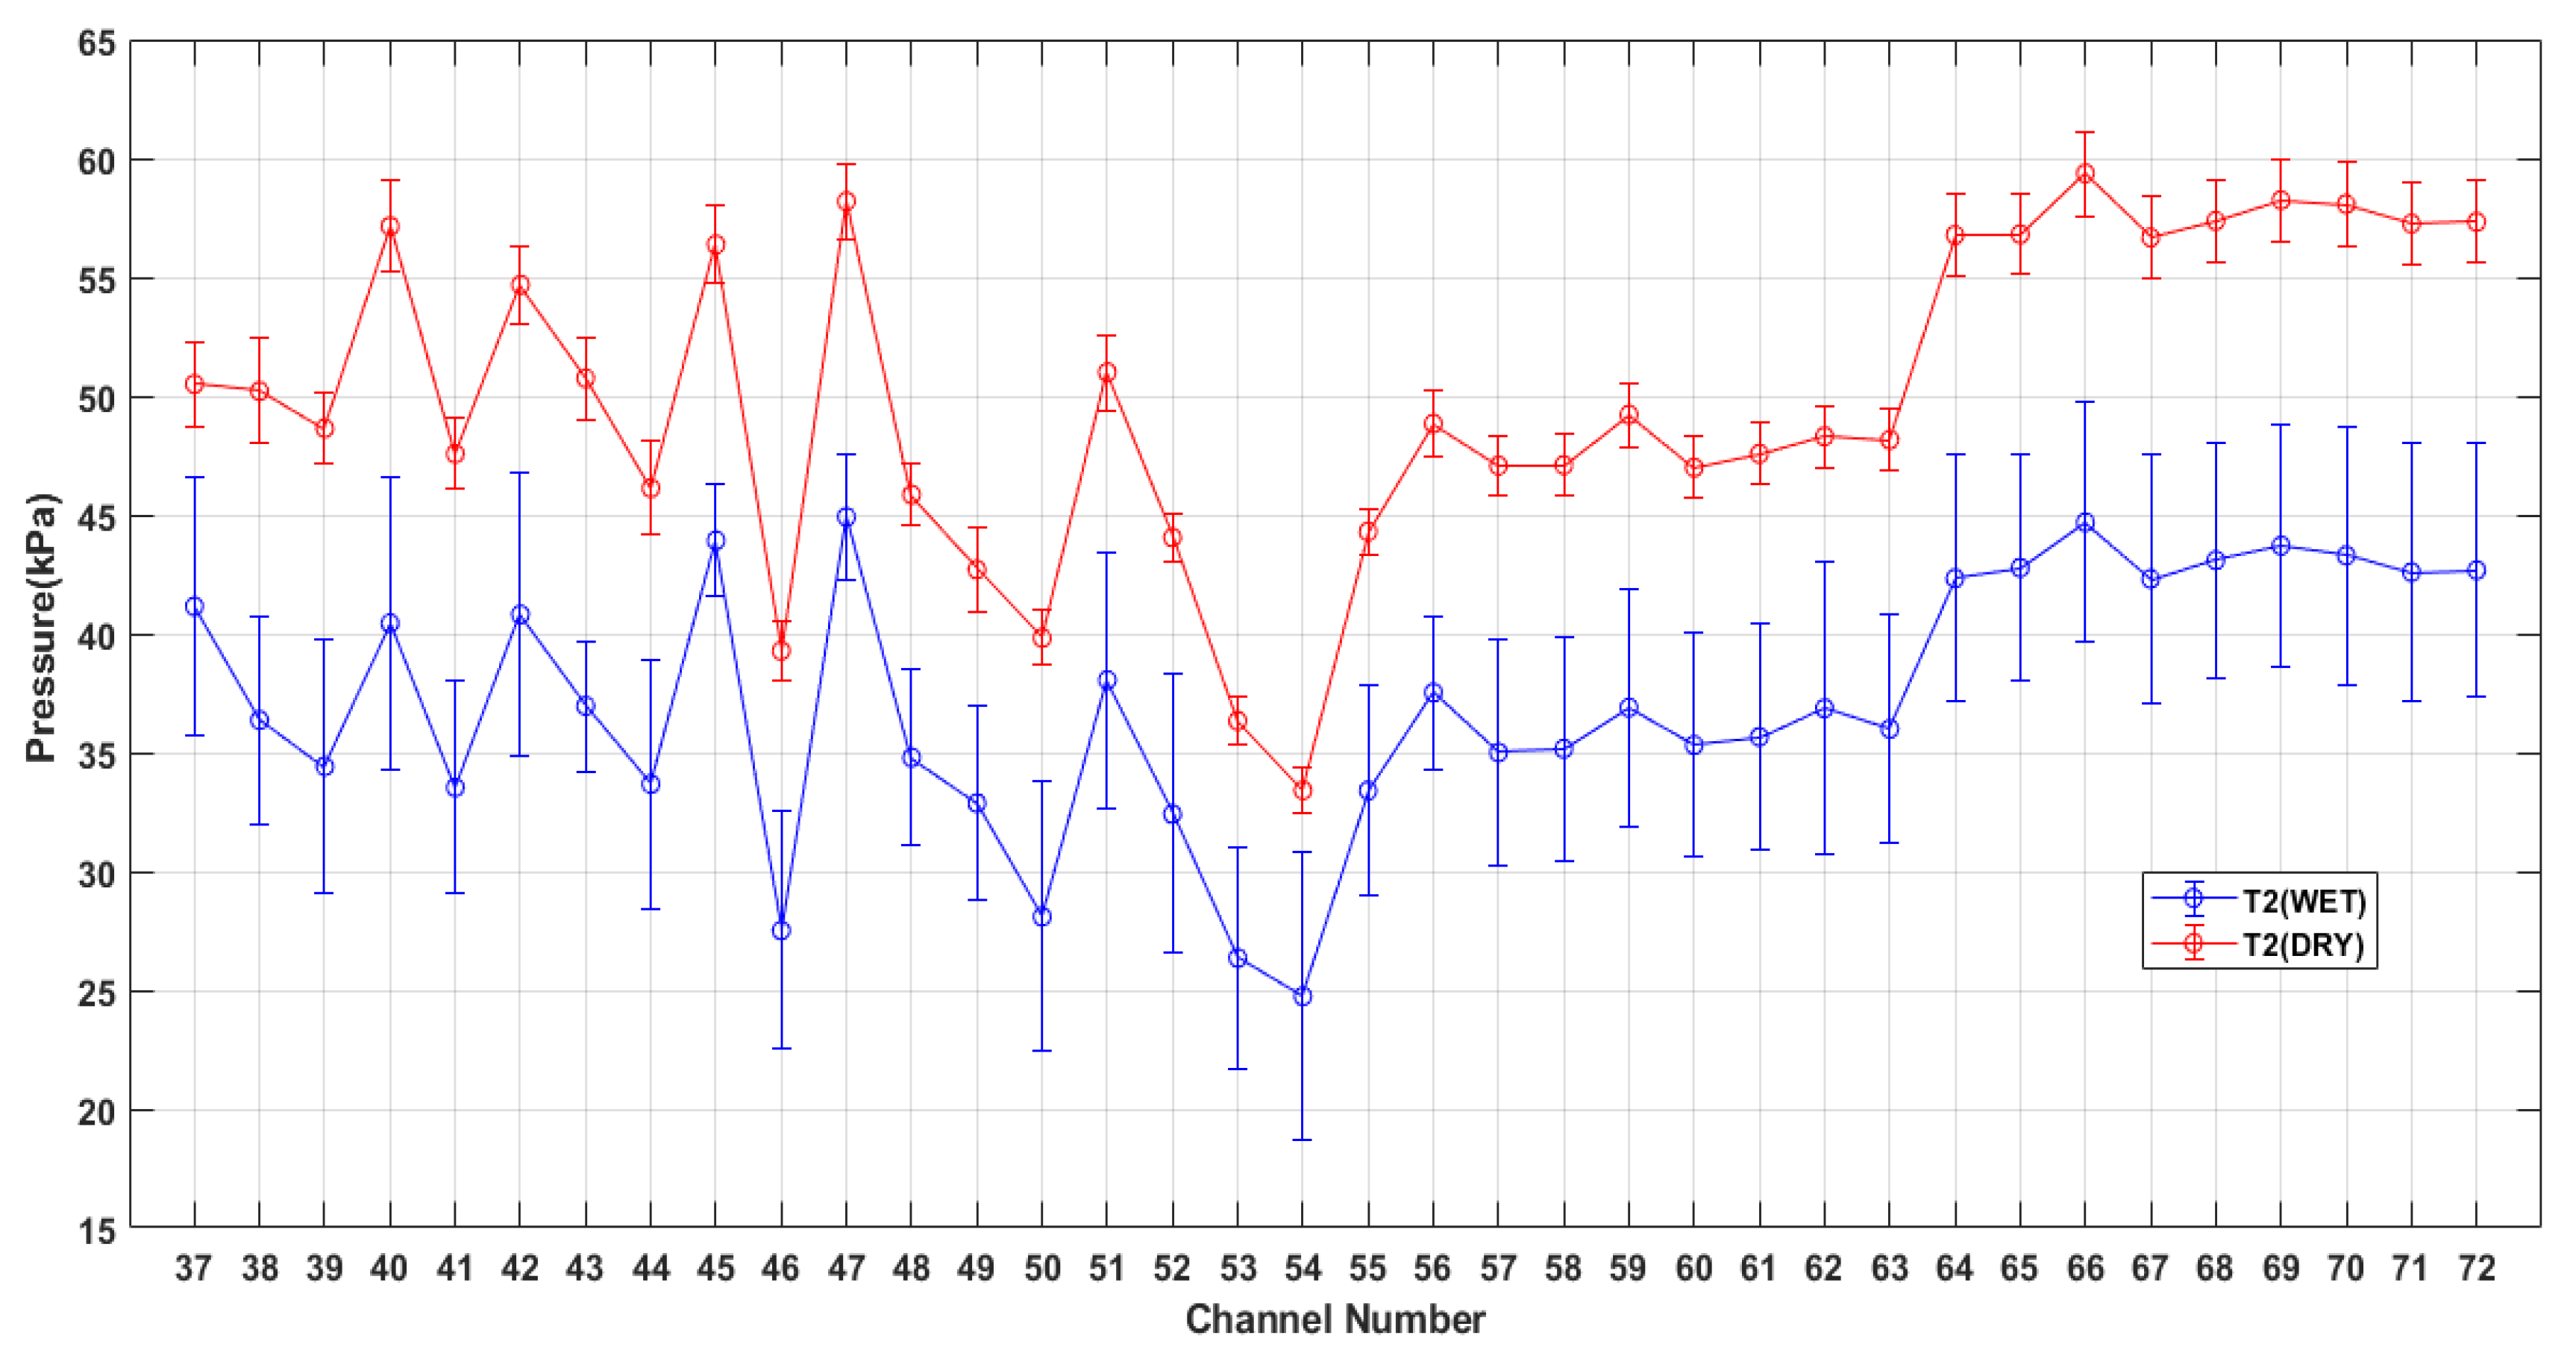
Figure 23.
Peak Pressure of Dry Condition & Wet Condition of ROLL (T2)
Figure 23.
Peak Pressure of Dry Condition & Wet Condition of ROLL (T2)
Figure 24.
Droplet Location of SWAY (the 2nd experiment).
Figure 24.
Droplet Location of SWAY (the 2nd experiment).
Figure 25.
Droplet Location of ROLL (the 10th experiment).
Figure 25.
Droplet Location of ROLL (the 10th experiment).
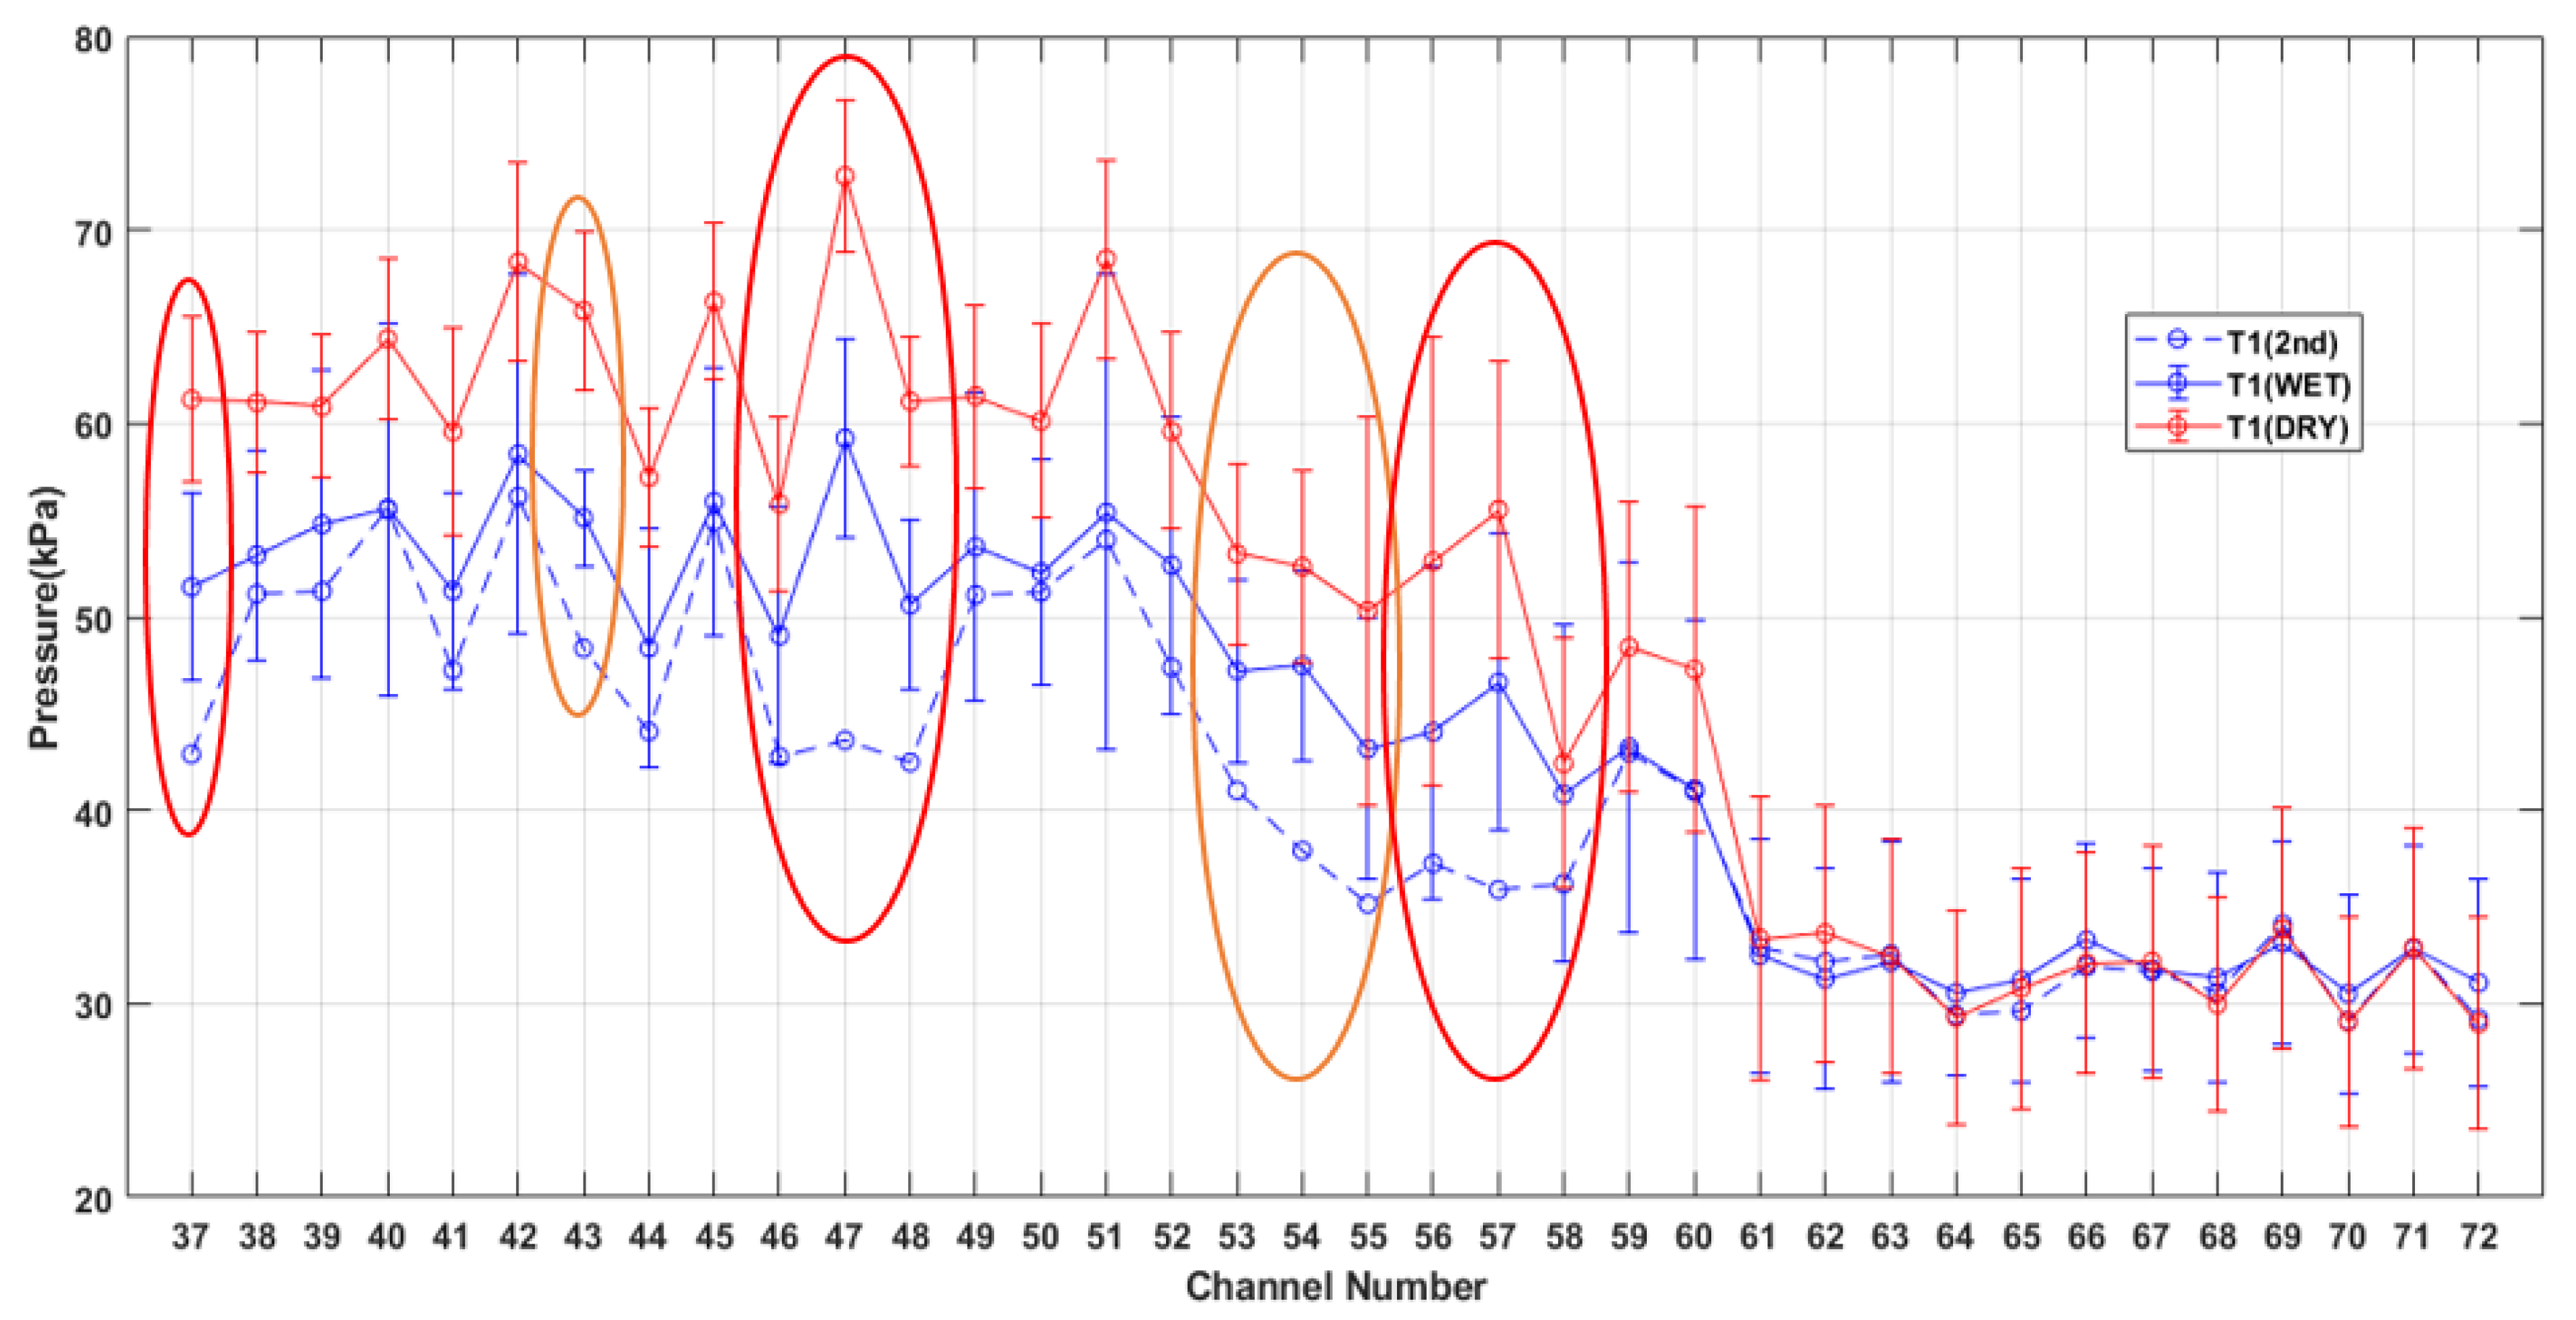
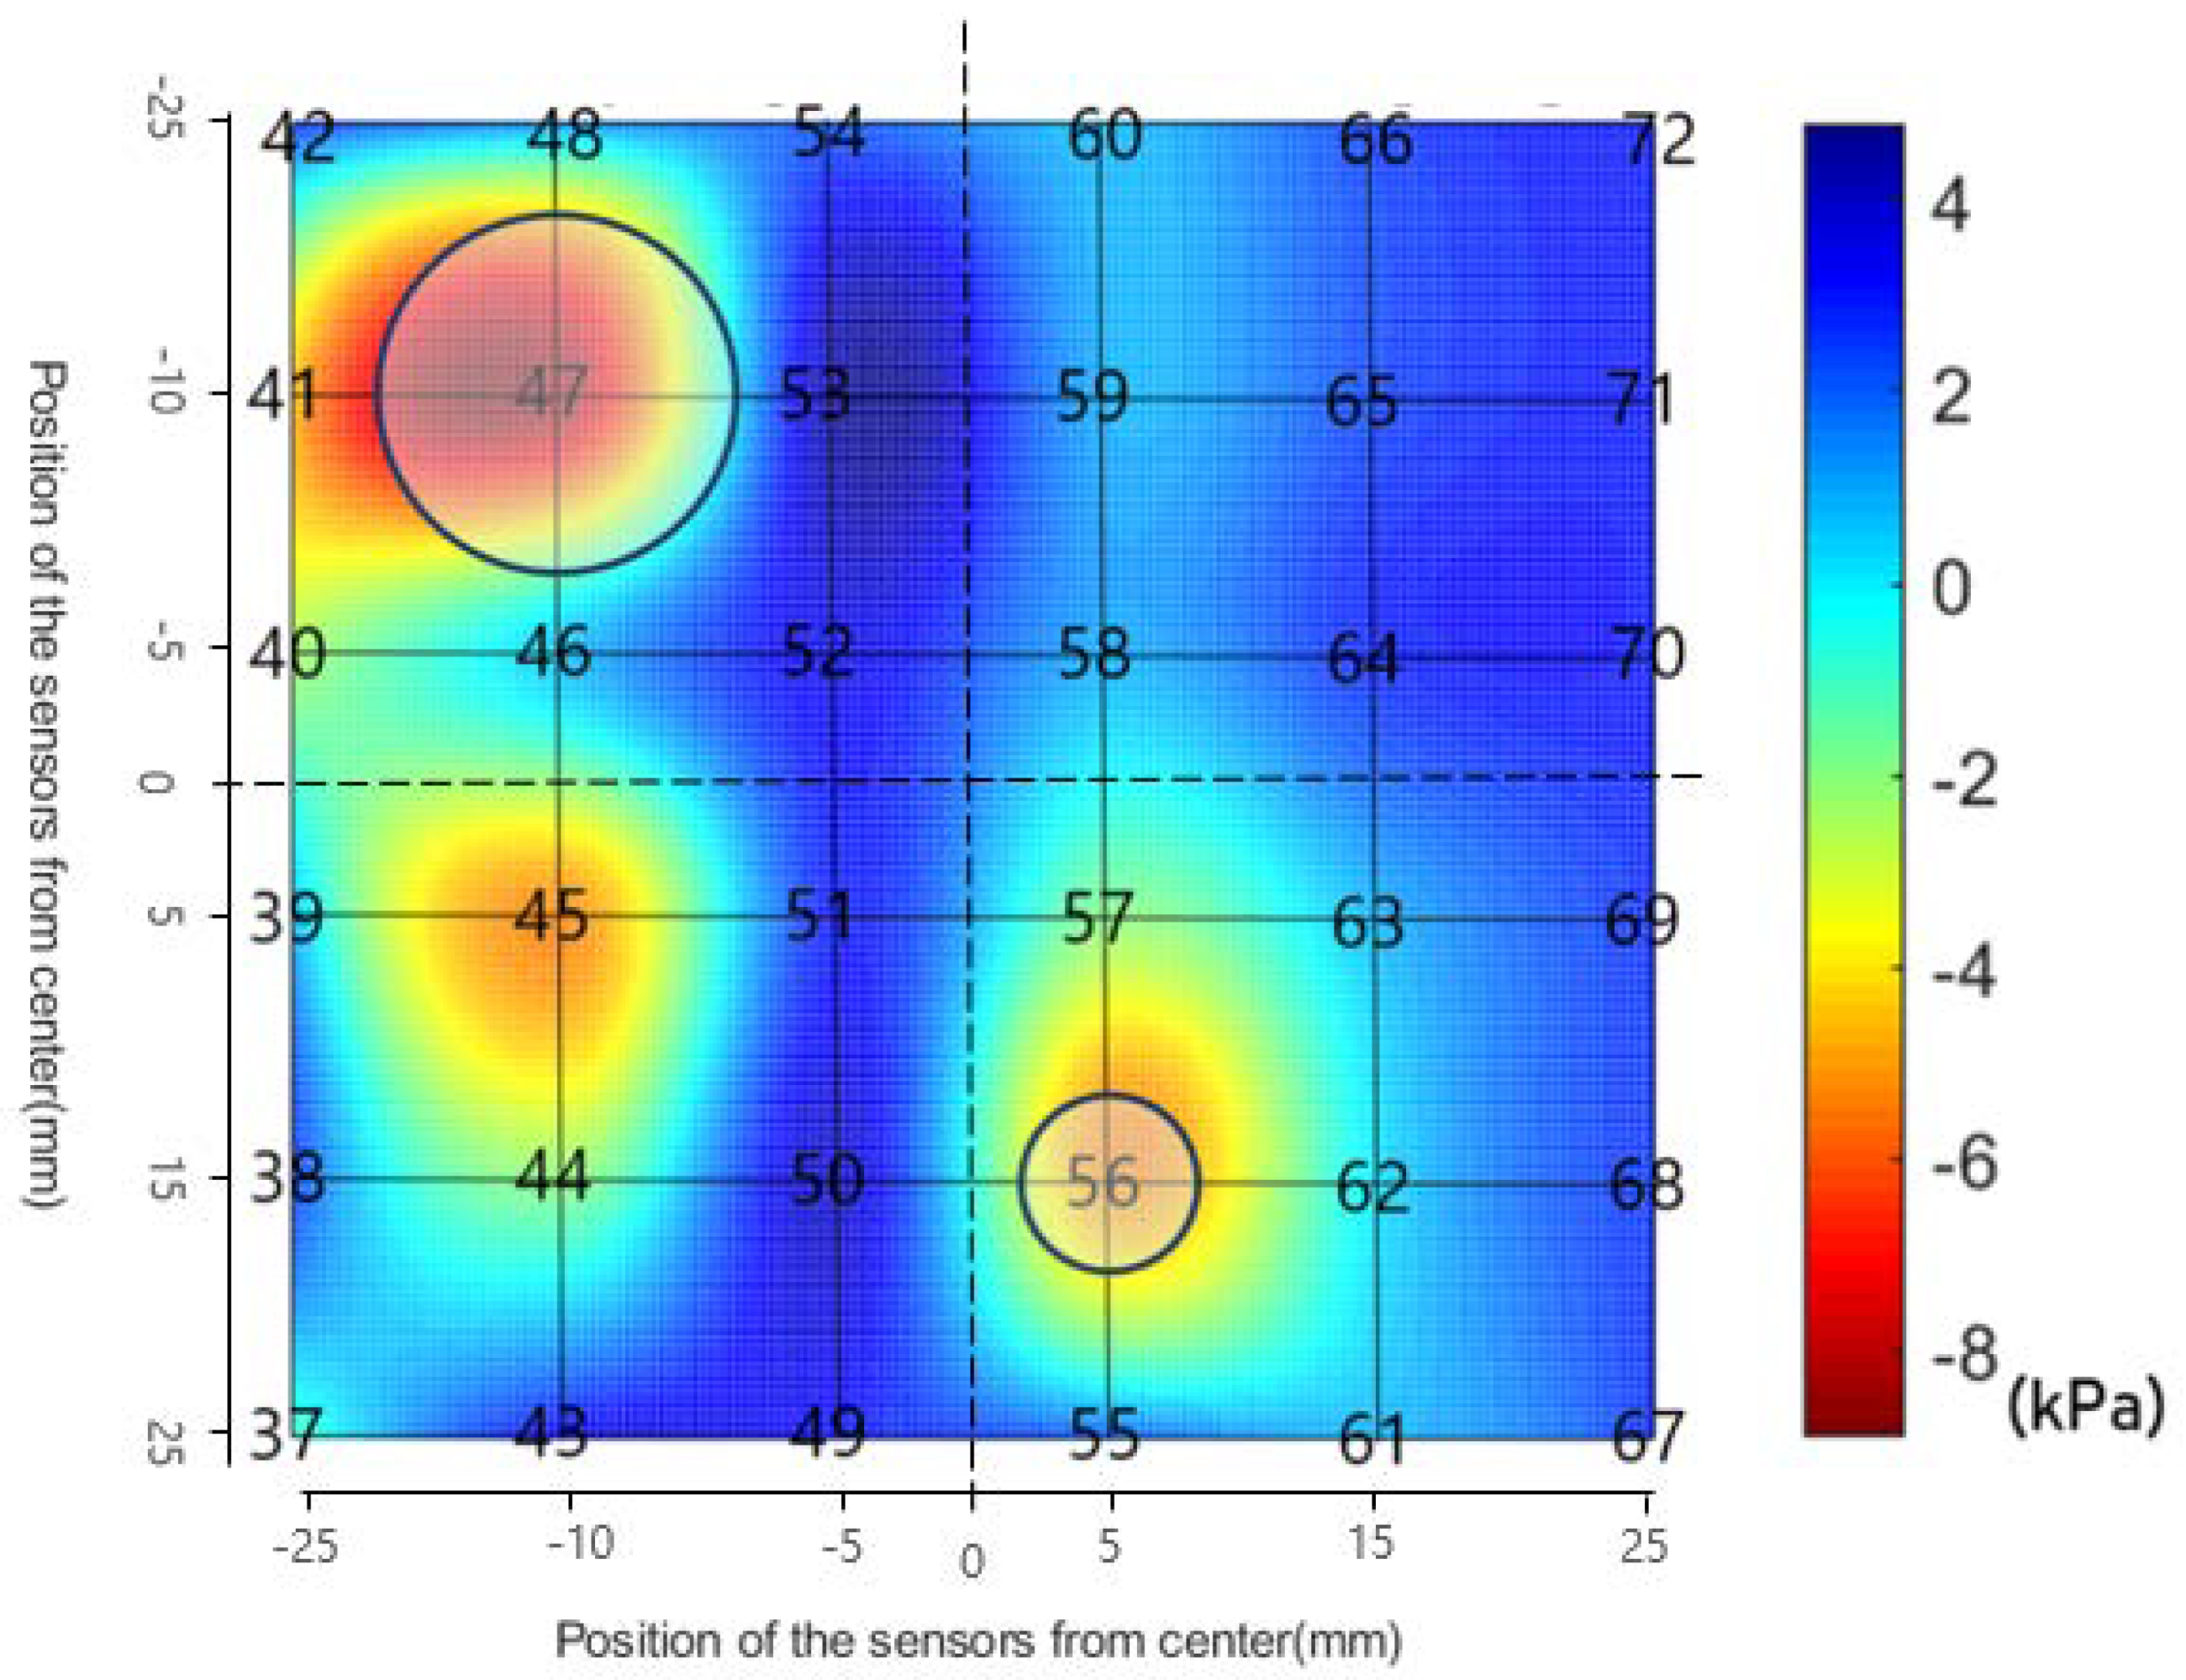
Figure 26.
Peak Pressure of Dry and Wet conditions and the 2nd Experiment in Wet Condition of SWAY (T1); Red circle - the location of the droplets, Orange circle - the vicinity of the droplets.
Figure 26.
Peak Pressure of Dry and Wet conditions and the 2nd Experiment in Wet Condition of SWAY (T1); Red circle - the location of the droplets, Orange circle - the vicinity of the droplets.
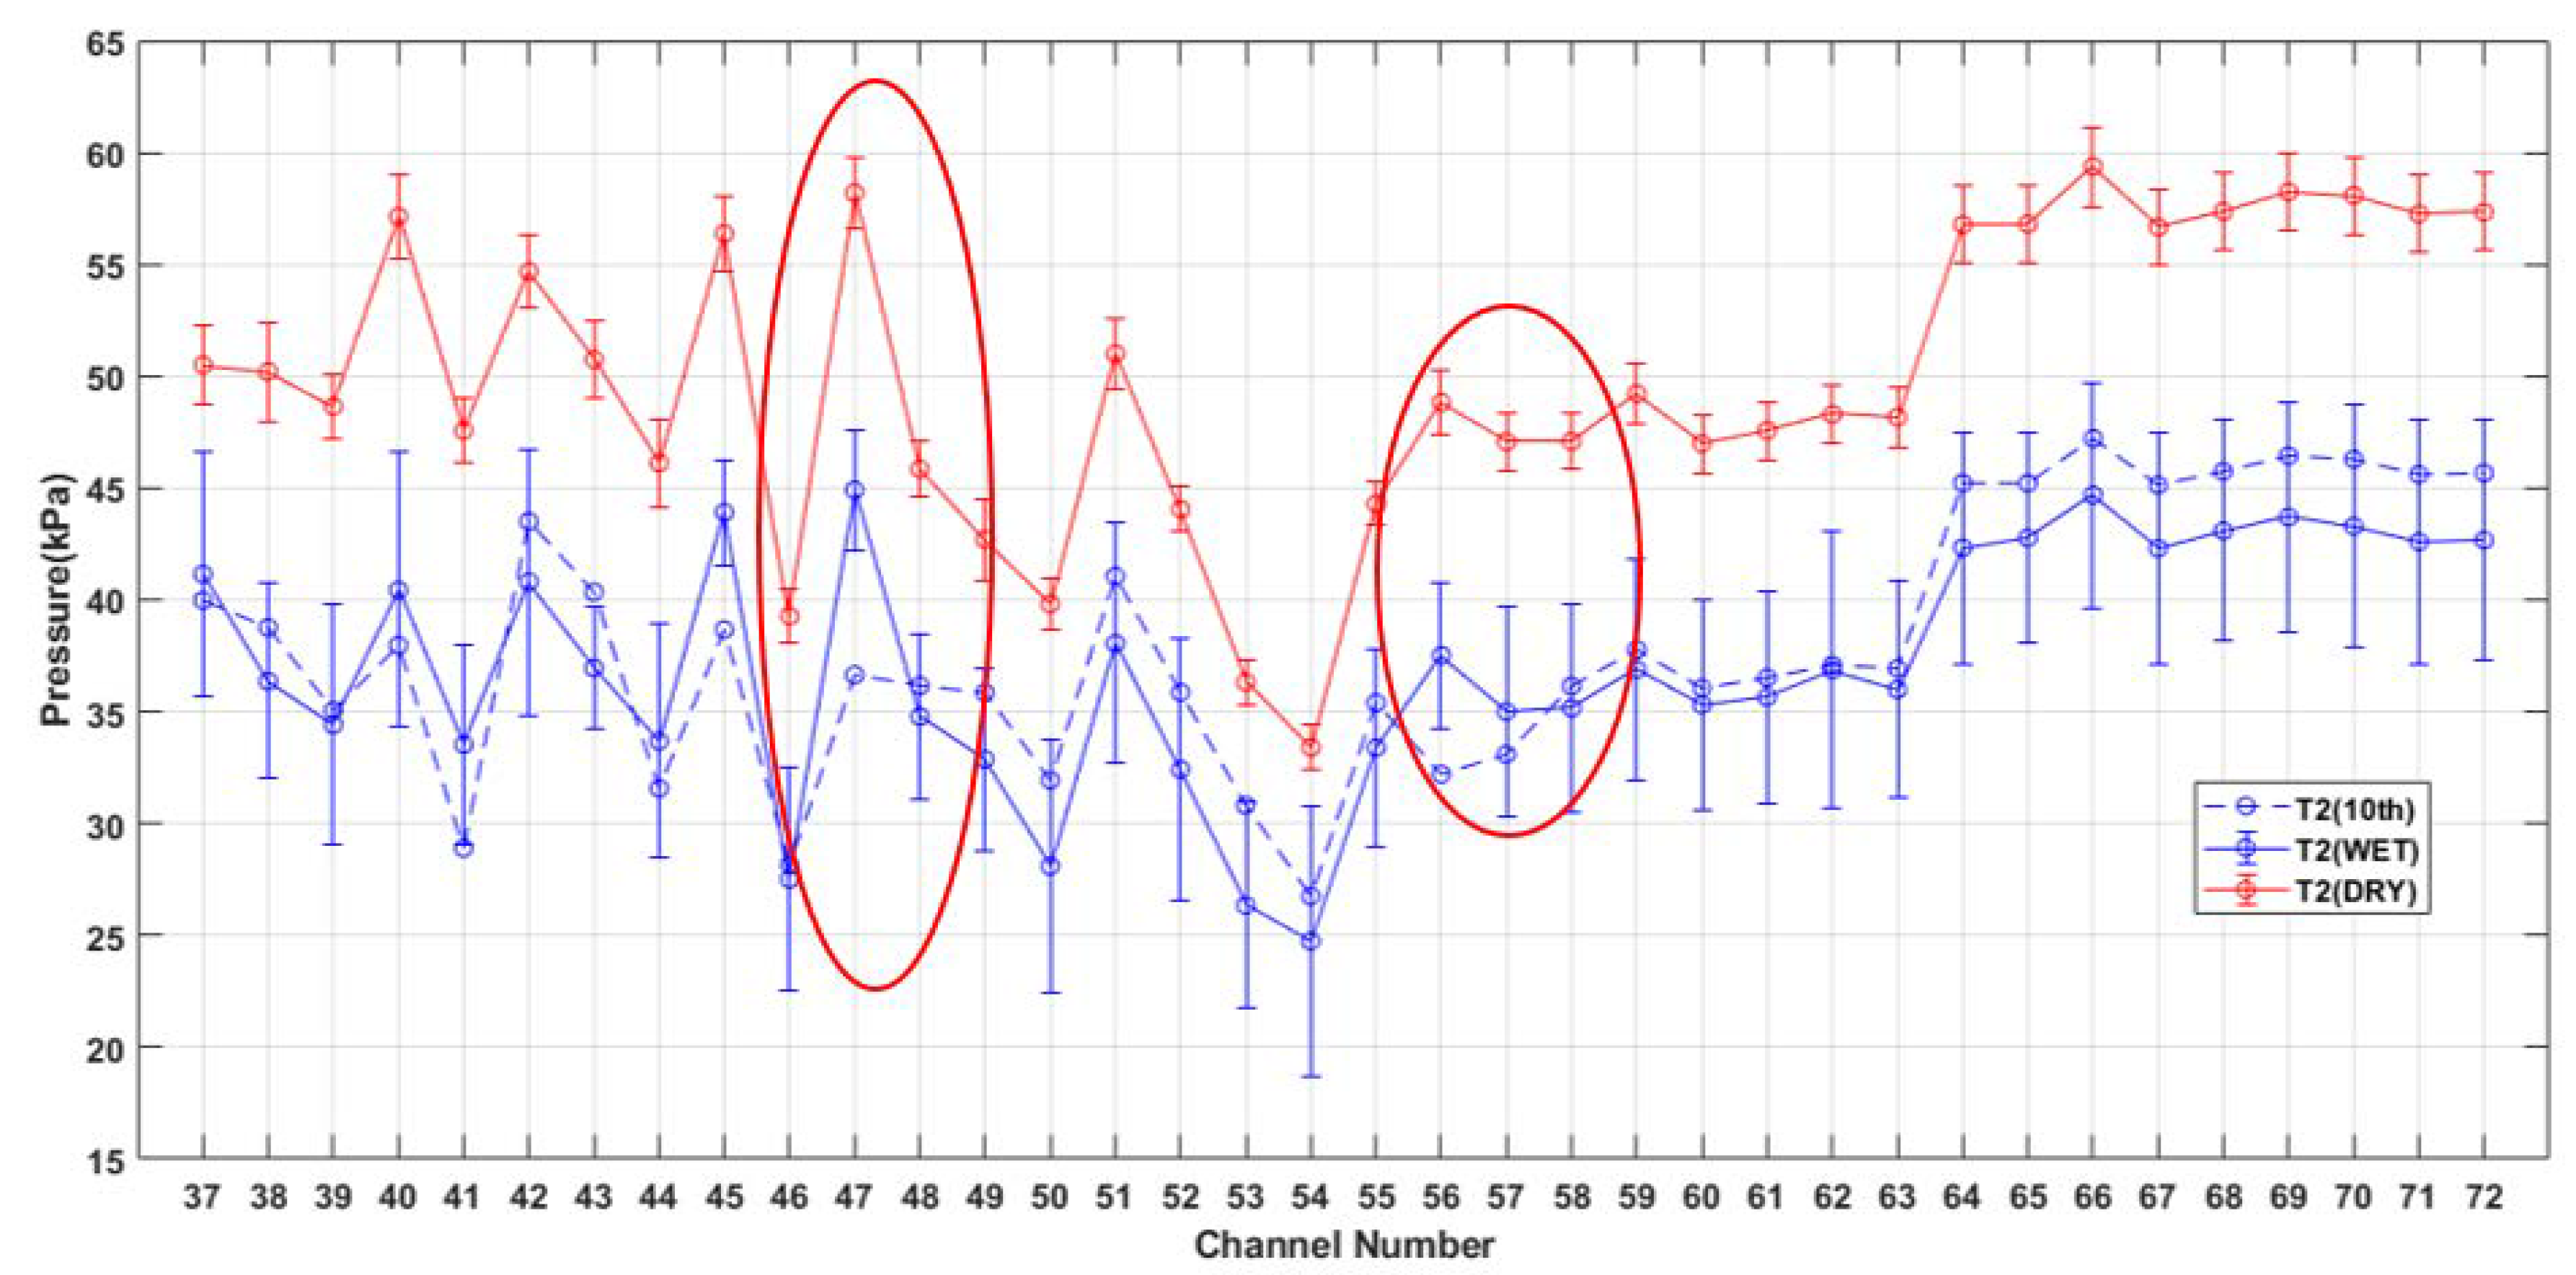
Figure 27.
Peak Pressure of Dry and Wet conditions and the 10th Experiment in Wet Condition of ROLL (T2); Red circle - the location of the droplets.
Figure 27.
Peak Pressure of Dry and Wet conditions and the 10th Experiment in Wet Condition of ROLL (T2); Red circle - the location of the droplets.
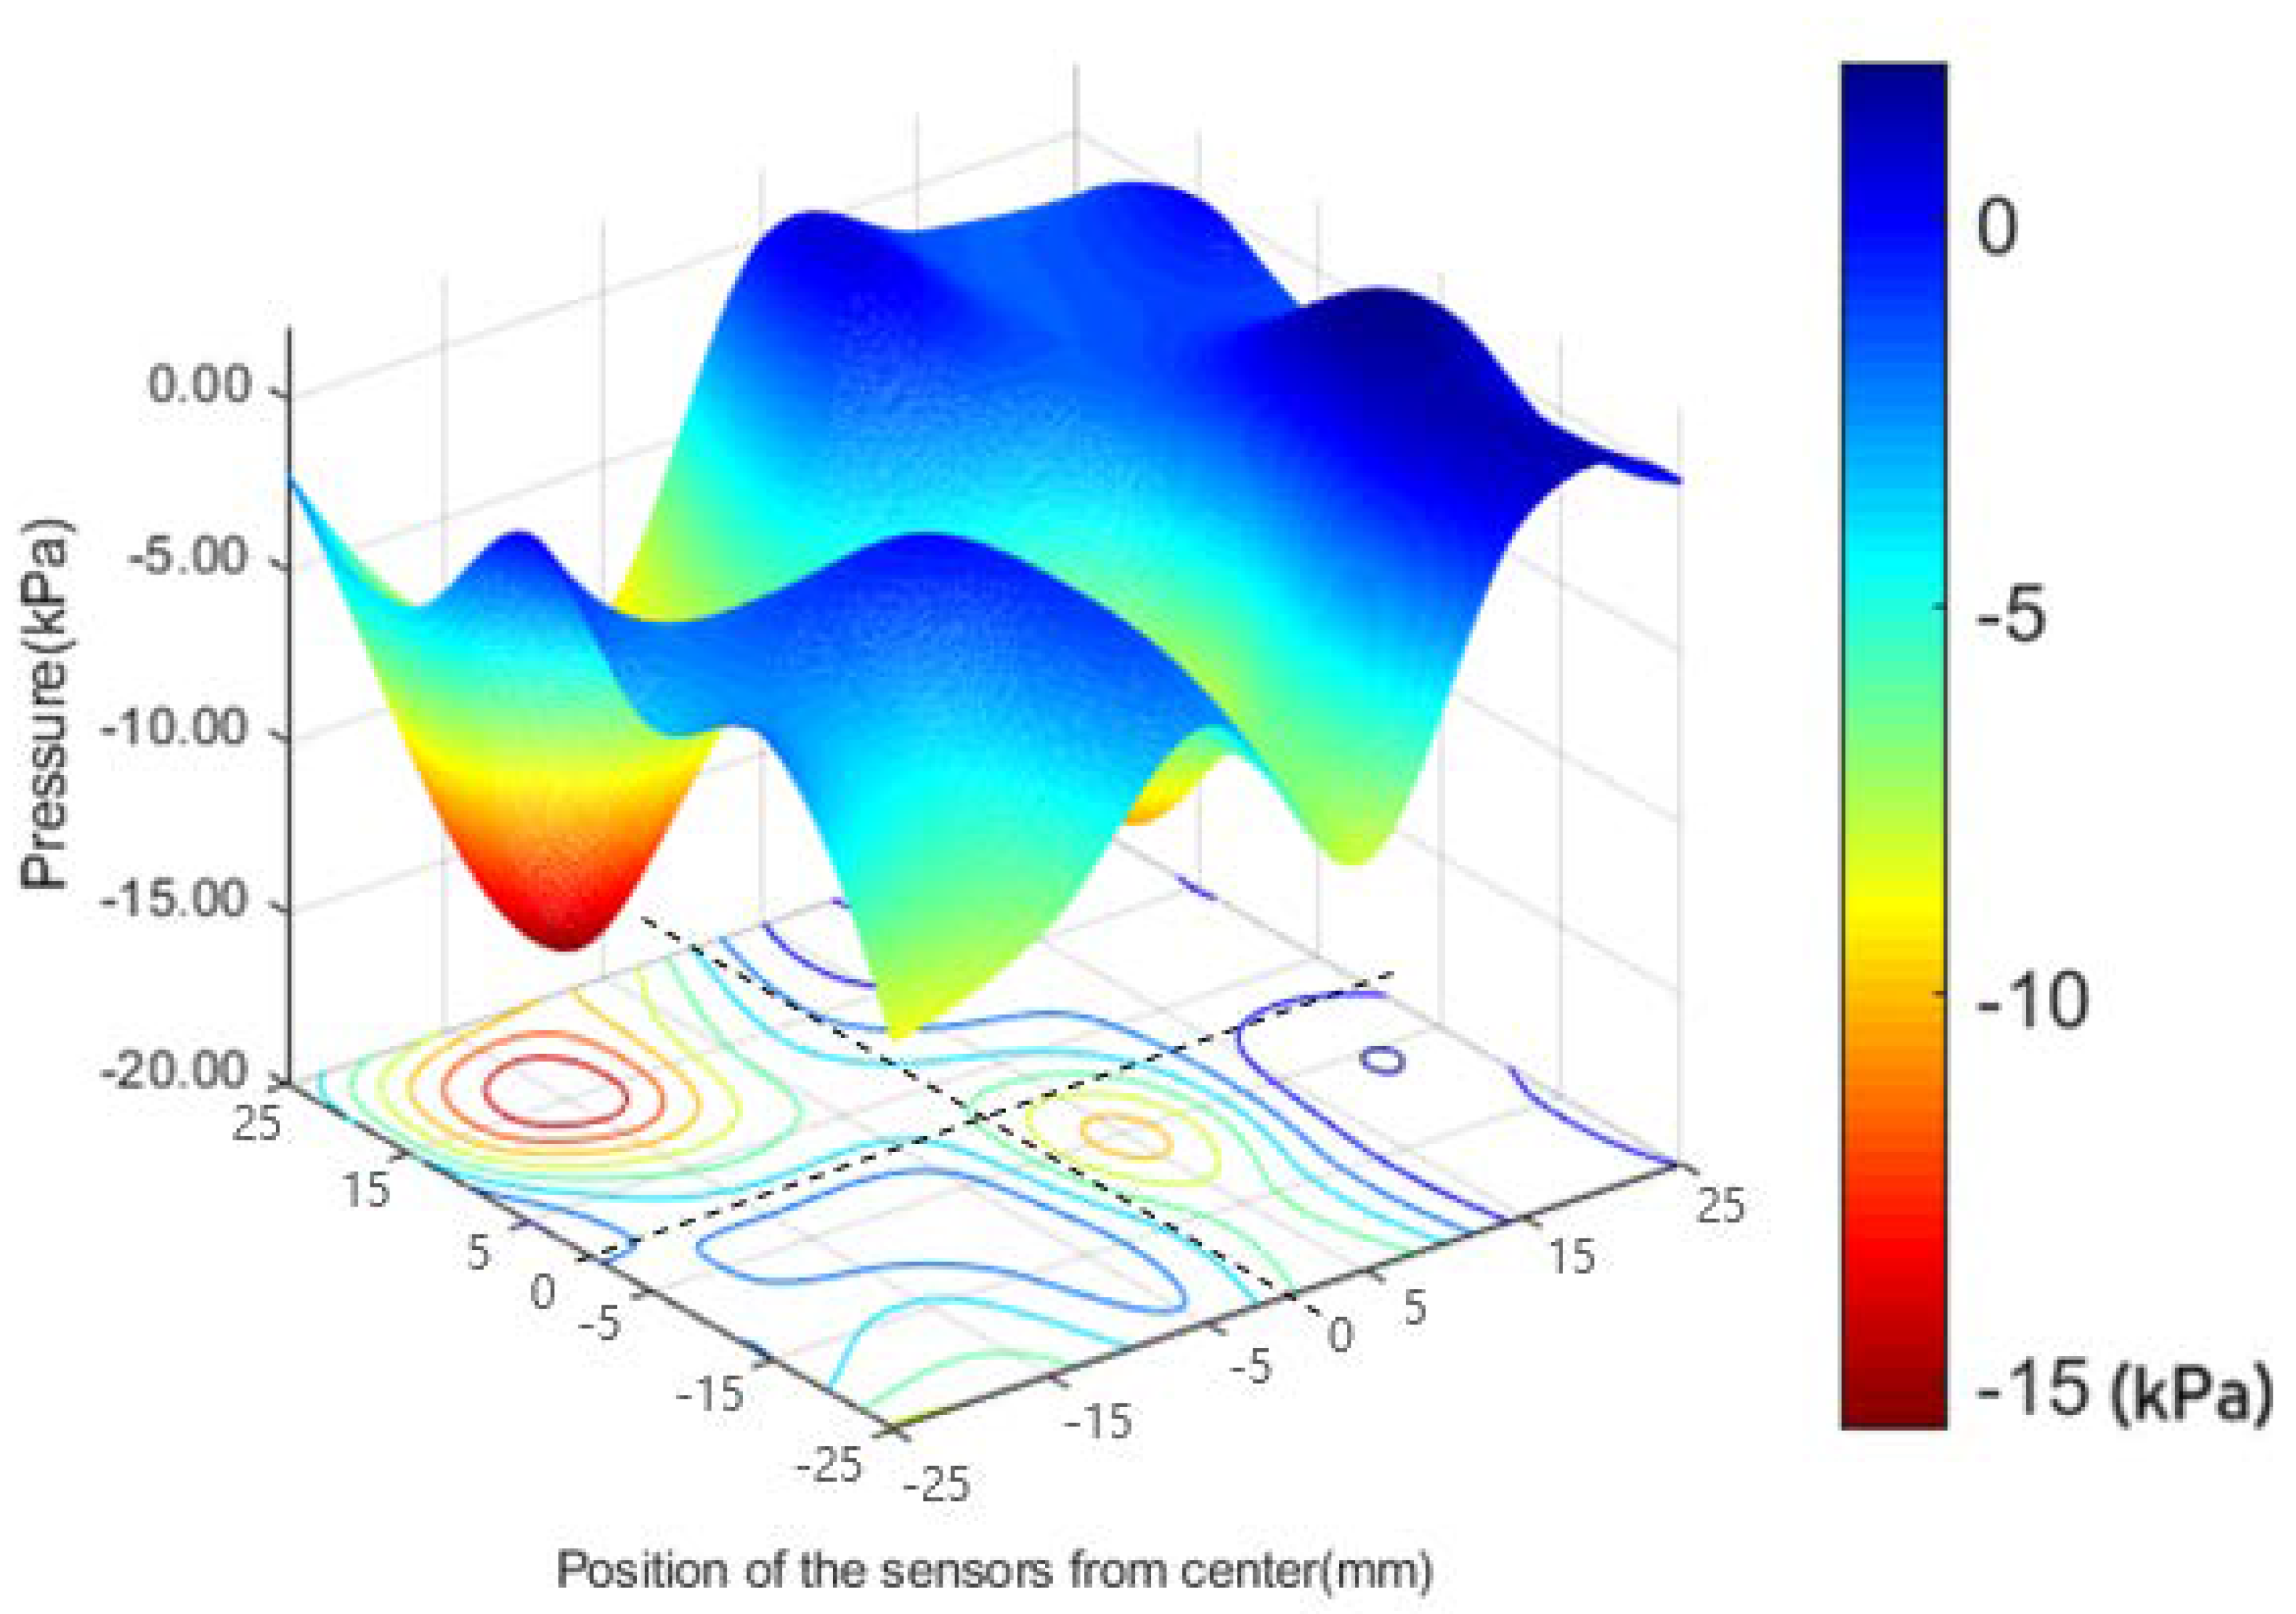
Figure 28.
3D Plot for Discrepancy in Peak Pressure (the 2nd Case Pressure - Wet Average, SWAY).
Figure 28.
3D Plot for Discrepancy in Peak Pressure (the 2nd Case Pressure - Wet Average, SWAY).
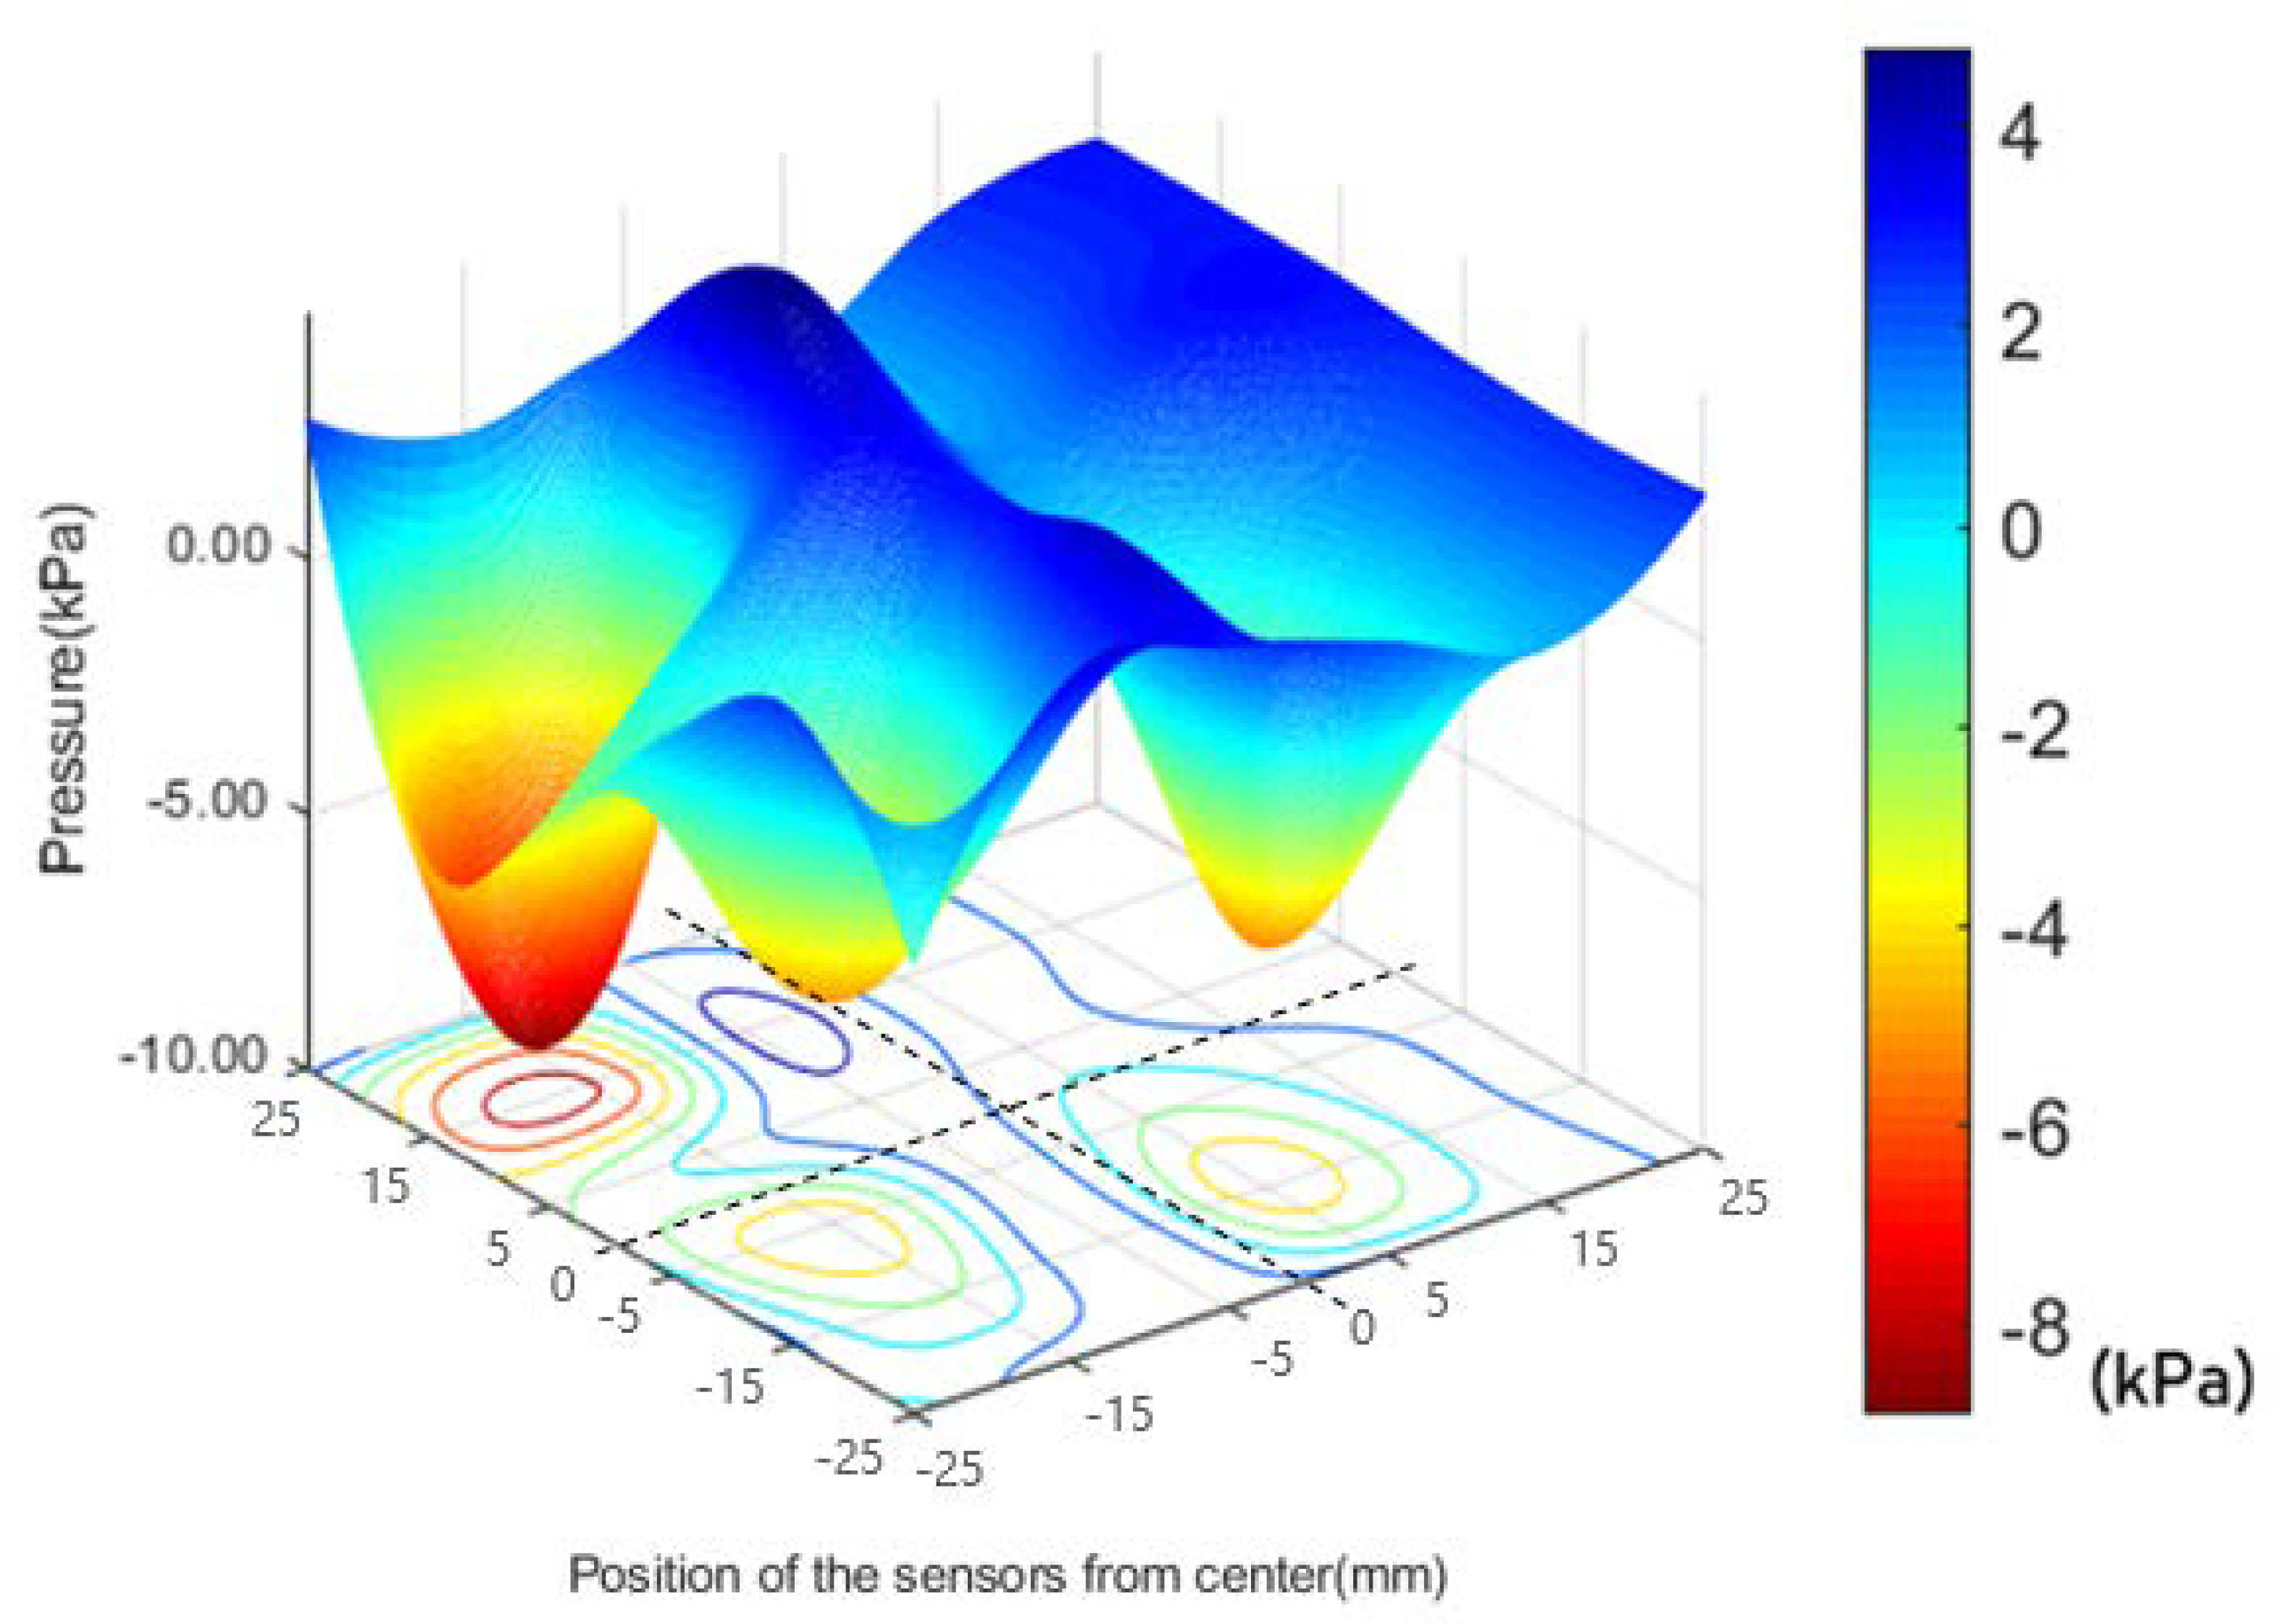
Figure 29.
3D Plot for Discrepancy in Peak Pressure (the 10th Case Pressure -Wet Average, ROLL).
Figure 29.
3D Plot for Discrepancy in Peak Pressure (the 10th Case Pressure -Wet Average, ROLL).
Figure 30.
Contour for Discrepancy in Peak Pressure (the 2nd Case Pressure -Wet Average, SWAY).
Figure 30.
Contour for Discrepancy in Peak Pressure (the 2nd Case Pressure -Wet Average, SWAY).
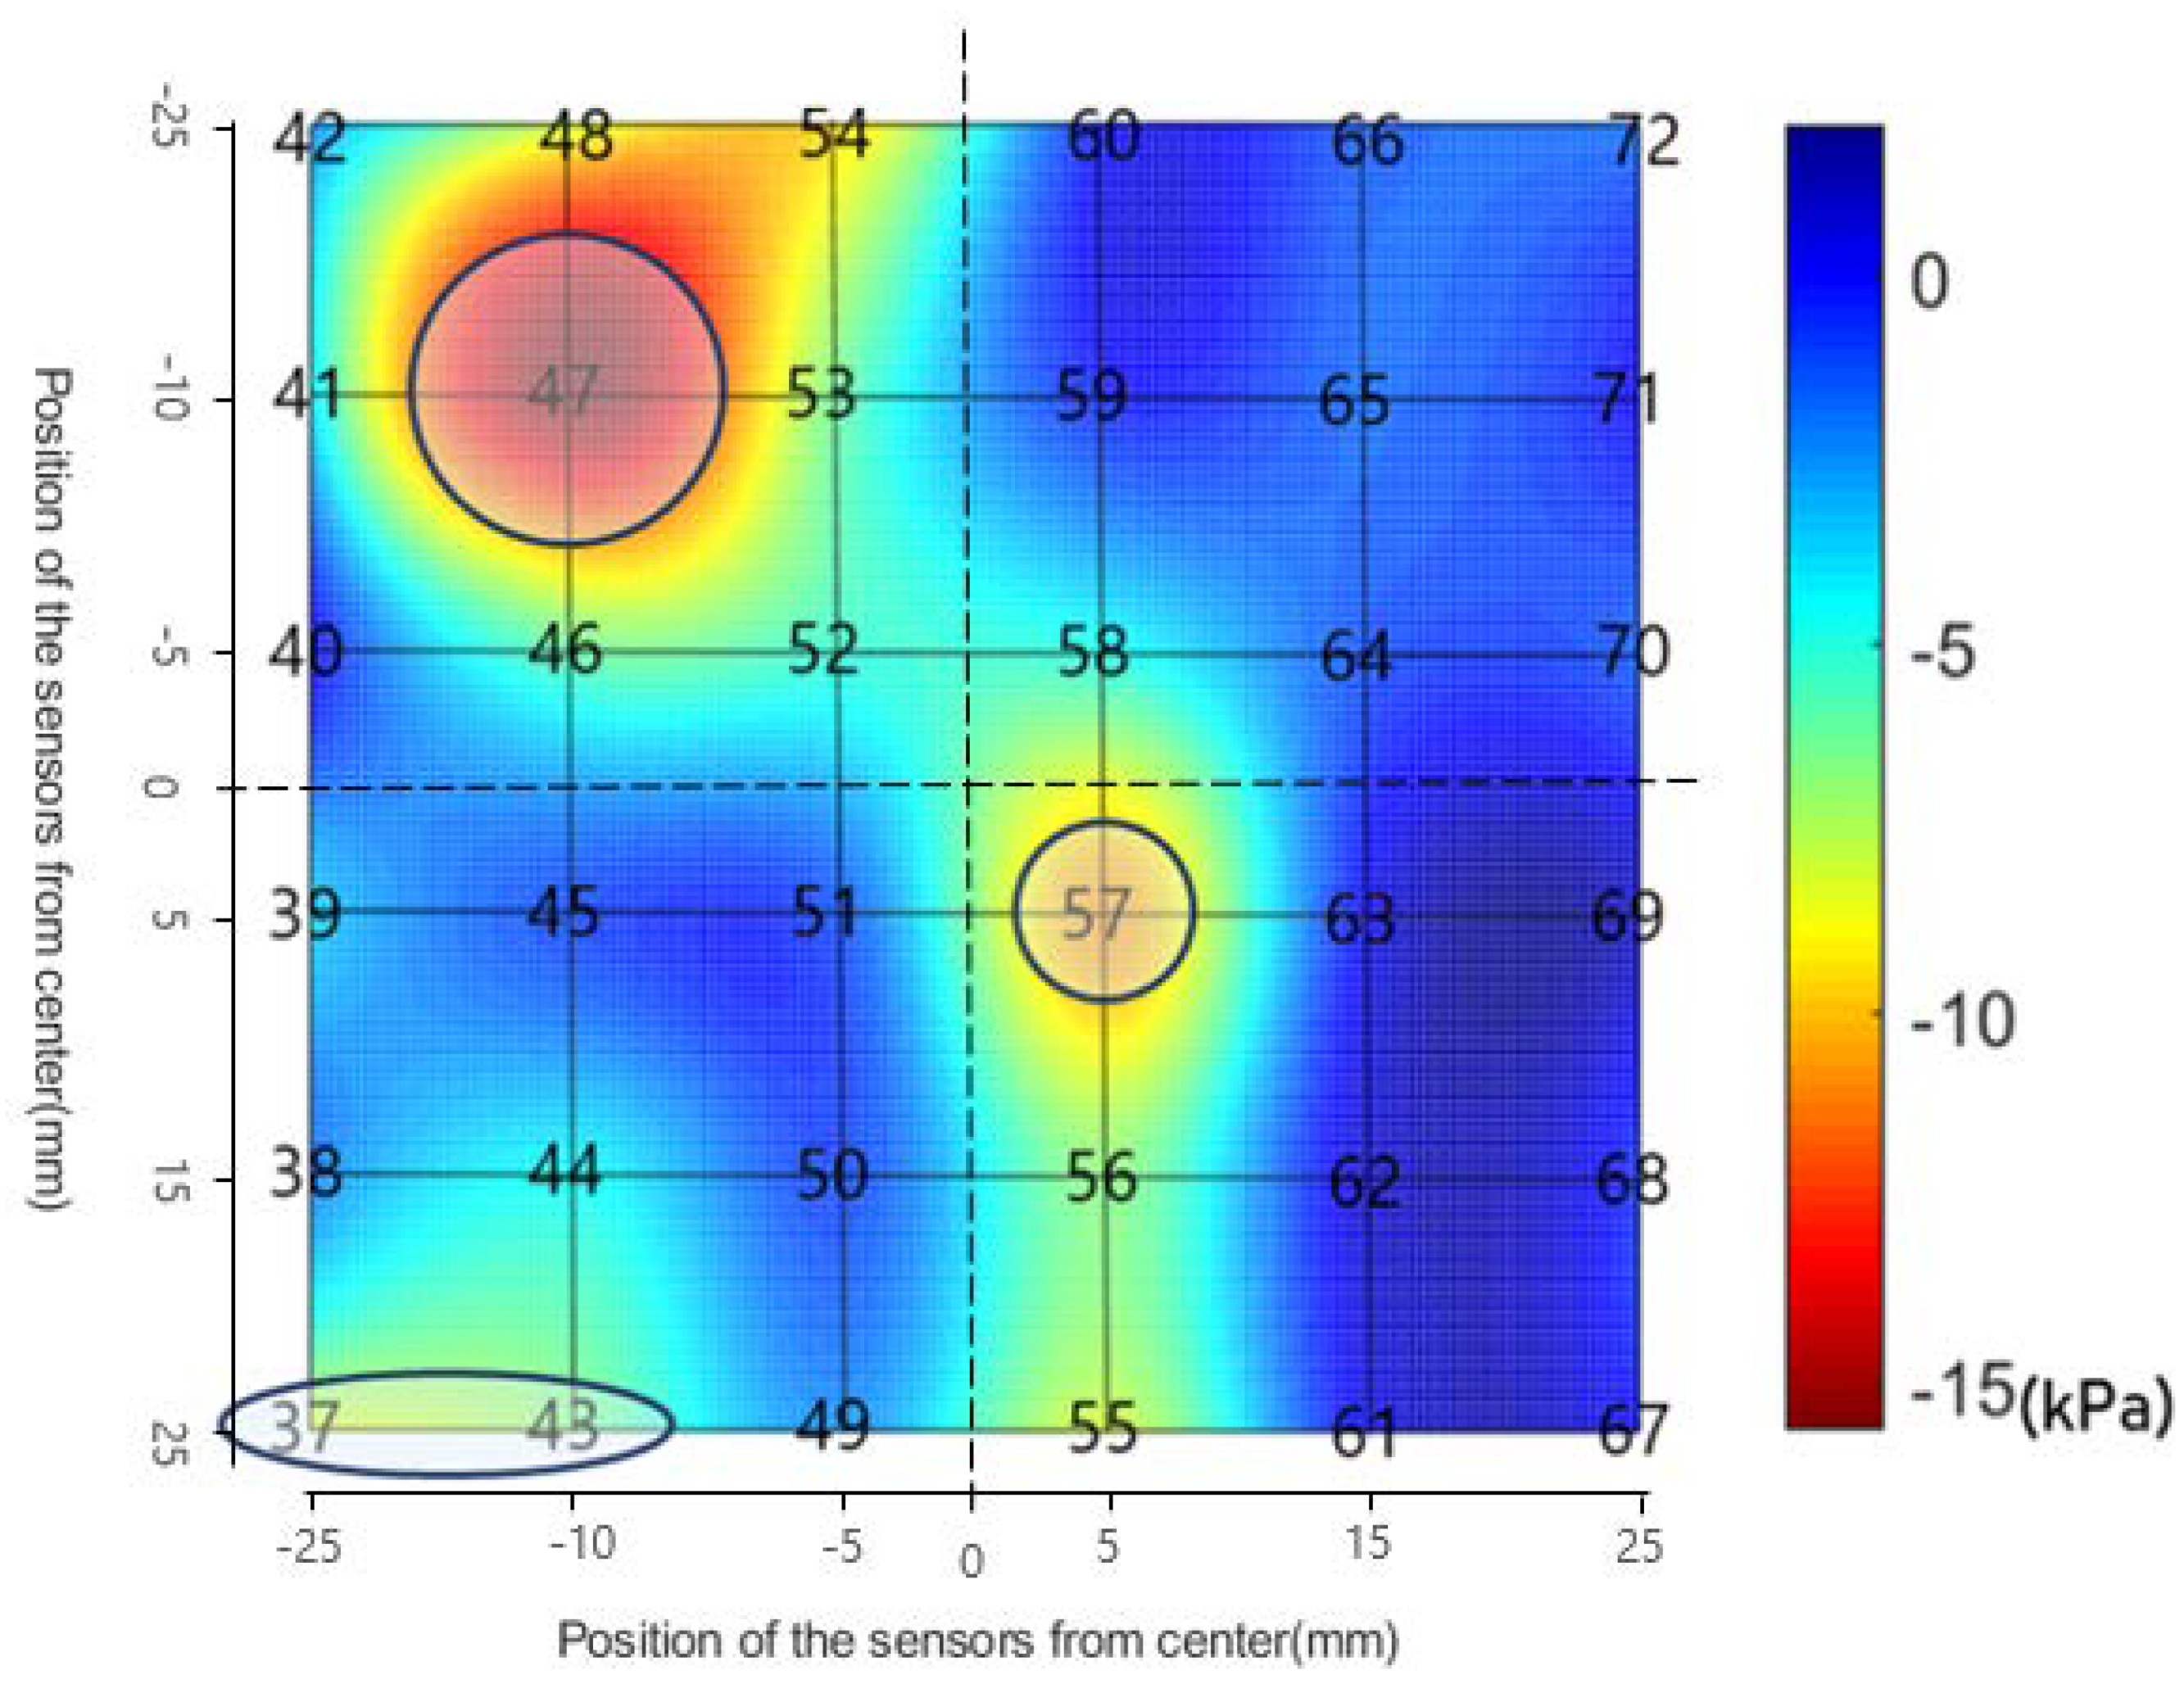
Figure 31.
Contour for Discrepancy in Peak Pressure (the 10th Case Pressure -Wet Average, ROLL).
Figure 31.
Contour for Discrepancy in Peak Pressure (the 10th Case Pressure -Wet Average, ROLL).
Table 1.
Specifications of Actuator.
Table 1.
Specifications of Actuator.
| Items | Specification |
|---|
| Servo Motor | P60B2215KBXS (SANYODENKI) |
| Servo Driver | PZA300 |
| Rating Power | 15 kW |
| Rating rpm | 1500 rpm |
| Maximum rpm | 2000 rpm |
| Rating Torque | 95.5 Nm |
| Maximum Torque | 240 Nm |
| Ball Screw Lead | 40 mm |
| Maximum Stroke | 1000 mm |
Table 2.
Range of Displacement and Velocity.
Table 2.
Range of Displacement and Velocity.
| Motion | Displacement | Velocity |
|---|
| Surge | −1060 mm~1030 mm | 200 cm/s (0.4 Hz) |
| Sway | −970 mm~970 mm | 190cm/s (0.4 Hz) |
| Heave | −540 mm~540 mm | 100cm/s (0.4 Hz) |
| Roll | −34.5°~34.5° | 83 deg/s (0.4 Hz) |
| Pitch | −36.5°~34.9° | 83 deg/s (0.4 Hz) |
| Surge | −1060 mm~1030 mm | 200 cm/s (0.4 Hz) |
Table 3.
Specifications of Pressure Sensor.
Table 3.
Specifications of Pressure Sensor.
| Items | Unit | Kistler 211B5 |
|---|
| Diameter | mm | 5.5 |
| Range | bar | 0~6.895 |
| Overload | bar | 34.474 |
| Sensitivity | - | 804.2 mV/bar ( |
| Natural Frequency | kHz | 300 |
| Linearity | %FSO | ≤±10 |
| Acceleration Sensitivity | bar/g | 0.0001379 ( |
| Operating Temperature Range | °C | −51~121 |
Table 4.
Specifications of Board and DAQ.
Table 4.
Specifications of Board and DAQ.
| Items | Specification |
|---|
| Analog inputs | 8 Channel |
| Resolution | 24 bits |
| Maximum Sampling Rate | 102.4 kS/s |
| Input Range | ±10V |
| AC Cutoff Frequency | 0.5 Hz |
Table 5.
Specification of the camera.
Table 5.
Specification of the camera.
| Items | Specification |
|---|
| Image resolution | 1280 × 1024 at 1000 fps |
| Internal memory | 4 GB |
| Recording rates | Selectable Up to 64,000 fps |
Table 6.
Test conditions.
Table 6.
Test conditions.
| Test Condition | Filling Level (%H) | Filling Level (mm) | Excitation Motion | Excitation Periods (s) | Excitation Amplitude (mm or ) | Test Duration |
|---|
| SWAY(T1) | 85 | 570 | Sway | 1.1 | 32 mm | 1 impact |
| ROLL(T2) | 85 | 570 | Roll | 1.207 | 4.5 | 1 impact |
Table 7.
Test temperatures.
Table 7.
Test temperatures.
| Set | SWAY (Wet) | SWAY (Dry) | ROLL (Wet) | ROLL (Dry) |
|---|
| Air (°C) | Water (°C) | Air (°C) | Water (°C) | Air (°C) | Water (°C) | Air (°C) | Water (°C) |
|---|
| 1 | 13.4 | 11.6 | 13.5 | 11.3 | 10.2 | 12.8 | 11.1 | 11.2 |
| 2 | 13.4 | 11.6 | 13.5 | 11.6 | 10.0 | 12.8 | 11.2 | 11.2 |
Table 8.
Peak Pressure of Dry condition, Wet condition, Droplet case.
Table 8.
Peak Pressure of Dry condition, Wet condition, Droplet case.
| Test Condition | Channel Number | | | | | |
|---|
| SWAY | 37 | 61.25 | 51.54 | 42.91 | −29.94 | −16.74 |
| 47 | 72.79 | 59.22 | 43.62 | −40.07 | −26.34 |
| 57 | 55.53 | 46.62 | 35.90 | −35.35 | −22.99 |
| ROLL | 47 | 58.20 | 44.91 | 36.65 | −37.03 | −18.39 |
| 56 | 48.84 | 37.52 | 32.21 | −34.05 | −14.15 |


